Bean Station, TN Map & Demographics
Bean Station Map
Bean Station Overview
$27,370
PER CAPITA INCOME
$73,445
AVG FAMILY INCOME
$51,458
AVG HOUSEHOLD INCOME
16.1%
WAGE / INCOME GAP [ % ]
83.9¢/ $1
WAGE / INCOME GAP [ $ ]
0.46
INEQUALITY / GINI INDEX
2,963
TOTAL POPULATION
1,564
MALE POPULATION
1,399
FEMALE POPULATION
111.79
MALES / 100 FEMALES
89.45
FEMALES / 100 MALES
45.8
MEDIAN AGE
3.1
AVG FAMILY SIZE
2.7
AVG HOUSEHOLD SIZE
1,397
LABOR FORCE [ PEOPLE ]
54.2%
PERCENT IN LABOR FORCE
3.3%
UNEMPLOYMENT RATE
Bean Station Zip Codes
Bean Station Area Codes
Income in Bean Station
Income Overview in Bean Station
Per Capita Income in Bean Station is $27,370, while median incomes of families and households are $73,445 and $51,458 respectively.
| Characteristic | Number | Measure |
| Per Capita Income | 2,963 | $27,370 |
| Median Family Income | 794 | $73,445 |
| Mean Family Income | 794 | $86,928 |
| Median Household Income | 1,116 | $51,458 |
| Mean Household Income | 1,116 | $70,260 |
| Income Deficit | 794 | $0 |
| Wage / Income Gap (%) | 2,963 | 16.05% |
| Wage / Income Gap ($) | 2,963 | 83.95¢ per $1 |
| Gini / Inequality Index | 2,963 | 0.46 |
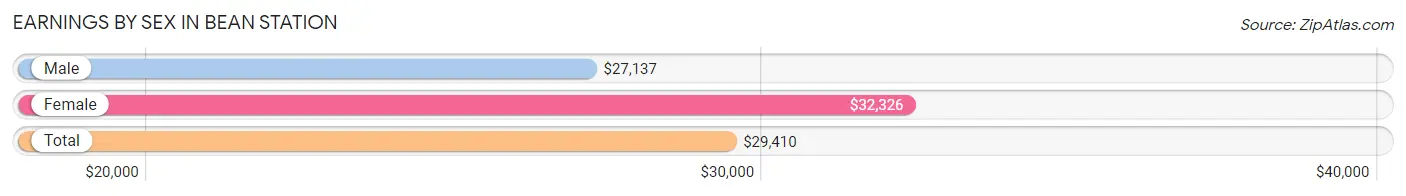
Earnings by Sex in Bean Station
Average Earnings in Bean Station are $29,410, $27,137 for men and $32,326 for women, a difference of 16.1%.
| Sex | Number | Average Earnings |
| Male | 813 (55.9%) | $27,137 |
| Female | 642 (44.1%) | $32,326 |
| Total | 1,455 (100.0%) | $29,410 |
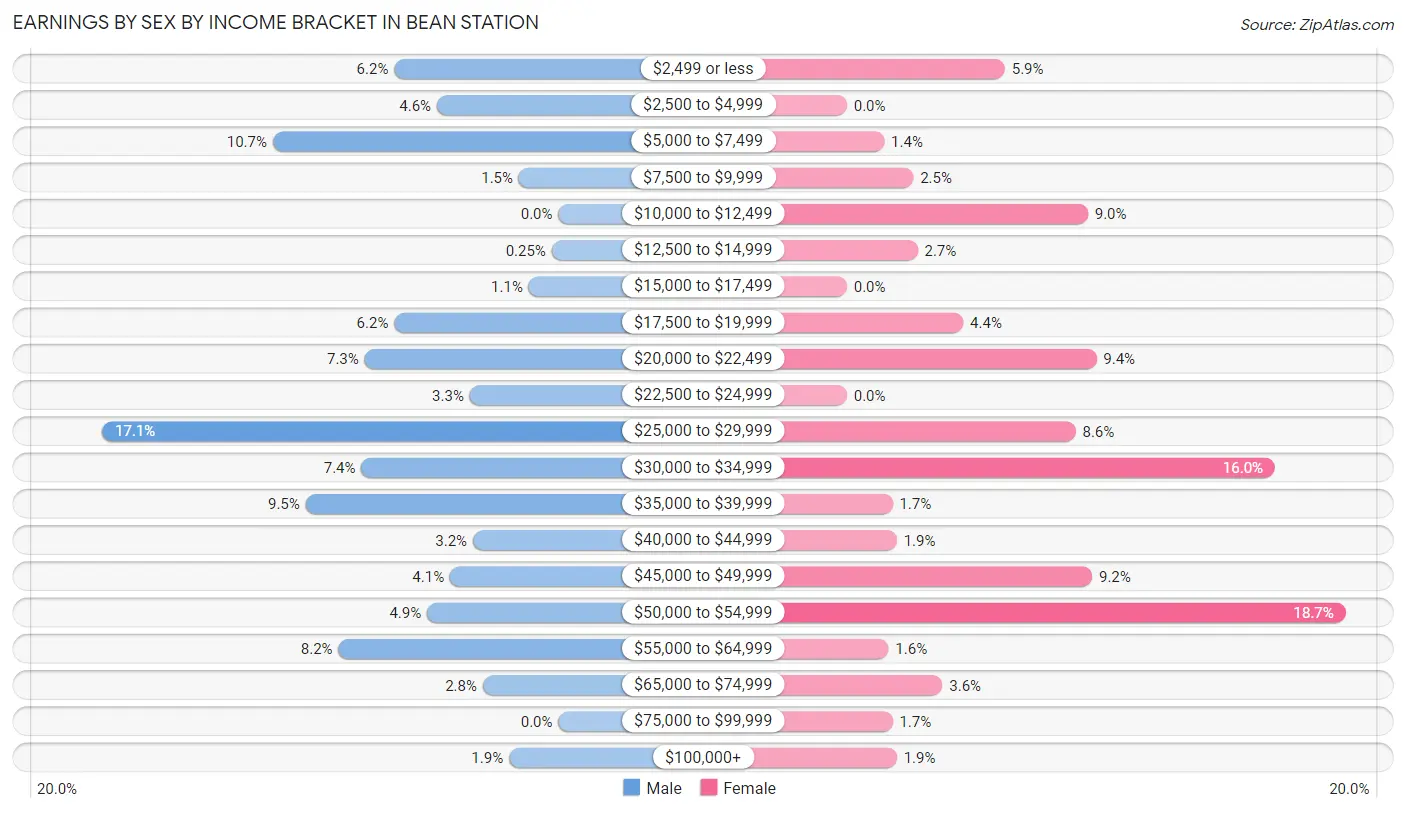
Earnings by Sex by Income Bracket in Bean Station
The most common earnings brackets in Bean Station are $25,000 to $29,999 for men (139 | 17.1%) and $50,000 to $54,999 for women (120 | 18.7%).
| Income | Male | Female |
| $2,499 or less | 50 (6.1%) | 38 (5.9%) |
| $2,500 to $4,999 | 37 (4.5%) | 0 (0.0%) |
| $5,000 to $7,499 | 87 (10.7%) | 9 (1.4%) |
| $7,500 to $9,999 | 12 (1.5%) | 16 (2.5%) |
| $10,000 to $12,499 | 0 (0.0%) | 58 (9.0%) |
| $12,500 to $14,999 | 2 (0.3%) | 17 (2.6%) |
| $15,000 to $17,499 | 9 (1.1%) | 0 (0.0%) |
| $17,500 to $19,999 | 50 (6.1%) | 28 (4.4%) |
| $20,000 to $22,499 | 59 (7.3%) | 60 (9.3%) |
| $22,500 to $24,999 | 27 (3.3%) | 0 (0.0%) |
| $25,000 to $29,999 | 139 (17.1%) | 55 (8.6%) |
| $30,000 to $34,999 | 60 (7.4%) | 103 (16.0%) |
| $35,000 to $39,999 | 77 (9.5%) | 11 (1.7%) |
| $40,000 to $44,999 | 26 (3.2%) | 12 (1.9%) |
| $45,000 to $49,999 | 33 (4.1%) | 59 (9.2%) |
| $50,000 to $54,999 | 40 (4.9%) | 120 (18.7%) |
| $55,000 to $64,999 | 67 (8.2%) | 10 (1.6%) |
| $65,000 to $74,999 | 23 (2.8%) | 23 (3.6%) |
| $75,000 to $99,999 | 0 (0.0%) | 11 (1.7%) |
| $100,000+ | 15 (1.8%) | 12 (1.9%) |
| Total | 813 (100.0%) | 642 (100.0%) |
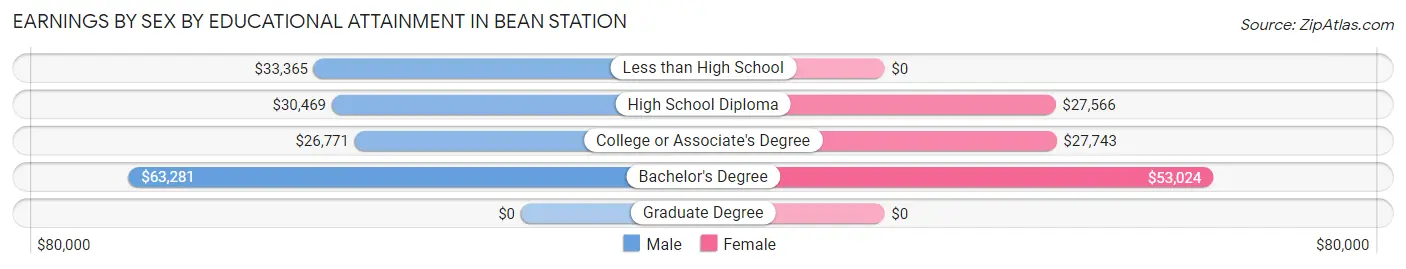
Earnings by Sex by Educational Attainment in Bean Station
Average earnings in Bean Station are $29,340 for men and $32,979 for women, a difference of 11.0%. Men with an educational attainment of bachelor's degree enjoy the highest average annual earnings of $63,281, while those with college or associate's degree education earn the least with $26,771. Women with an educational attainment of bachelor's degree earn the most with the average annual earnings of $53,024, while those with high school diploma education have the smallest earnings of $27,566.
| Educational Attainment | Male Income | Female Income |
| Less than High School | $33,365 | $0 |
| High School Diploma | $30,469 | $27,566 |
| College or Associate's Degree | $26,771 | $27,743 |
| Bachelor's Degree | $63,281 | $53,024 |
| Graduate Degree | - | - |
| Total | $29,340 | $32,979 |
Family Income in Bean Station
Family Income Brackets in Bean Station
According to the Bean Station family income data, there are 212 families falling into the $50,000 to $74,999 income range, which is the most common income bracket and makes up 26.7% of all families.
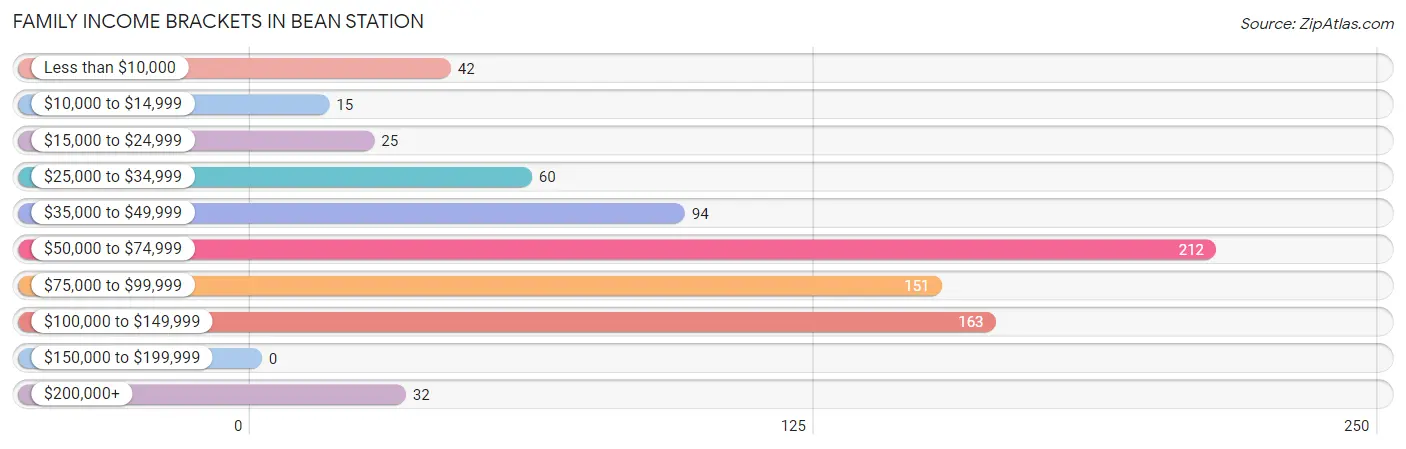
| Income Bracket | # Families | % Families |
| Less than $10,000 | 42 | 5.3% |
| $10,000 to $14,999 | 15 | 1.9% |
| $15,000 to $24,999 | 25 | 3.1% |
| $25,000 to $34,999 | 60 | 7.6% |
| $35,000 to $49,999 | 94 | 11.8% |
| $50,000 to $74,999 | 212 | 26.7% |
| $75,000 to $99,999 | 151 | 19.0% |
| $100,000 to $149,999 | 163 | 20.5% |
| $150,000 to $199,999 | 0 | 0.0% |
| $200,000+ | 32 | 4.0% |
Family Income by Famaliy Size in Bean Station
4-person families (214 | 27.0%) account for the highest median family income in Bean Station with $84,167 per family, while 3-person families (127 | 16.0%) have the highest median income of $27,654 per family member.
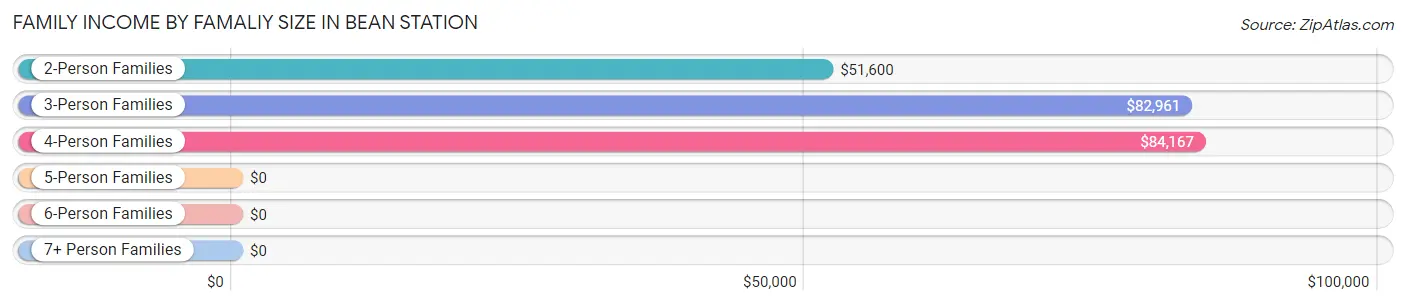
| Income Bracket | # Families | Median Income |
| 2-Person Families | 392 (49.4%) | $51,600 |
| 3-Person Families | 127 (16.0%) | $82,961 |
| 4-Person Families | 214 (27.0%) | $84,167 |
| 5-Person Families | 38 (4.8%) | $0 |
| 6-Person Families | 23 (2.9%) | $0 |
| 7+ Person Families | 0 (0.0%) | $0 |
| Total | 794 (100.0%) | $73,445 |
Family Income by Number of Earners in Bean Station
The median family income in Bean Station is $73,445, with families comprising 3+ earners (147) having the highest median family income of $103,693, while families with no earners (173) have the lowest median family income of $42,841, accounting for 18.5% and 21.8% of families, respectively.
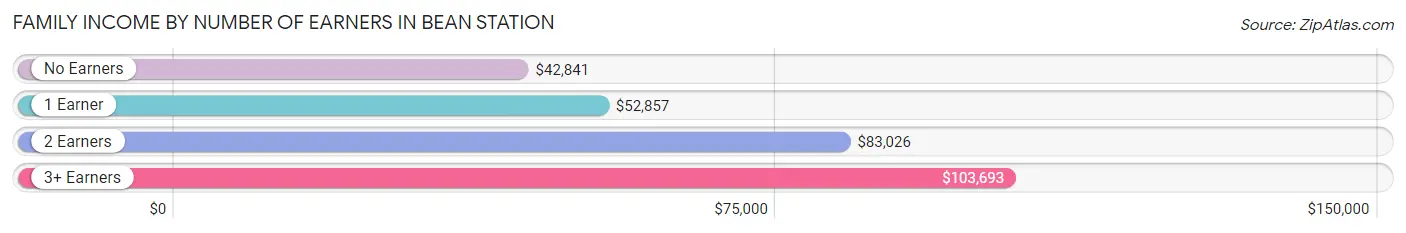
| Number of Earners | # Families | Median Income |
| No Earners | 173 (21.8%) | $42,841 |
| 1 Earner | 138 (17.4%) | $52,857 |
| 2 Earners | 336 (42.3%) | $83,026 |
| 3+ Earners | 147 (18.5%) | $103,693 |
| Total | 794 (100.0%) | $73,445 |
Household Income in Bean Station
Household Income Brackets in Bean Station
With 223 households falling in the category, the $50,000 to $74,999 income range is the most frequent in Bean Station, accounting for 20.0% of all households.
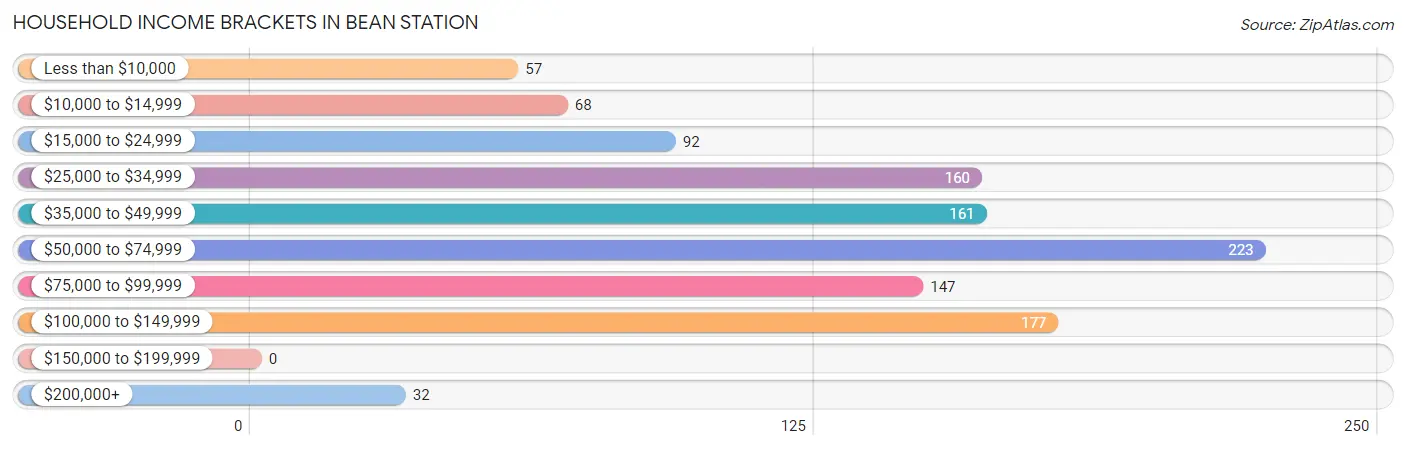
| Income Bracket | # Households | % Households |
| Less than $10,000 | 57 | 5.1% |
| $10,000 to $14,999 | 68 | 6.1% |
| $15,000 to $24,999 | 92 | 8.2% |
| $25,000 to $34,999 | 160 | 14.3% |
| $35,000 to $49,999 | 161 | 14.4% |
| $50,000 to $74,999 | 223 | 20.0% |
| $75,000 to $99,999 | 147 | 13.2% |
| $100,000 to $149,999 | 177 | 15.9% |
| $150,000 to $199,999 | 0 | 0.0% |
| $200,000+ | 32 | 2.9% |
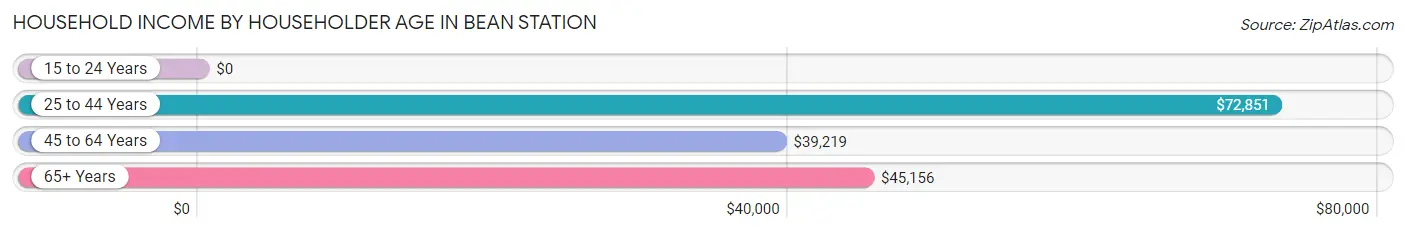
Household Income by Householder Age in Bean Station
The median household income in Bean Station is $51,458, with the highest median household income of $72,851 found in the 25 to 44 years age bracket for the primary householder. A total of 329 households (29.5%) fall into this category.
| Income Bracket | # Households | Median Income |
| 15 to 24 Years | 0 (0.0%) | $0 |
| 25 to 44 Years | 329 (29.5%) | $72,851 |
| 45 to 64 Years | 419 (37.5%) | $39,219 |
| 65+ Years | 368 (33.0%) | $45,156 |
| Total | 1,116 (100.0%) | $51,458 |
Poverty in Bean Station
Income Below Poverty by Sex and Age in Bean Station
With 9.7% poverty level for males and 17.6% for females among the residents of Bean Station, under 5 year old males and 5 year old females are the most vulnerable to poverty, with 18 males (31.0%) and 8 females (100.0%) in their respective age groups living below the poverty level.
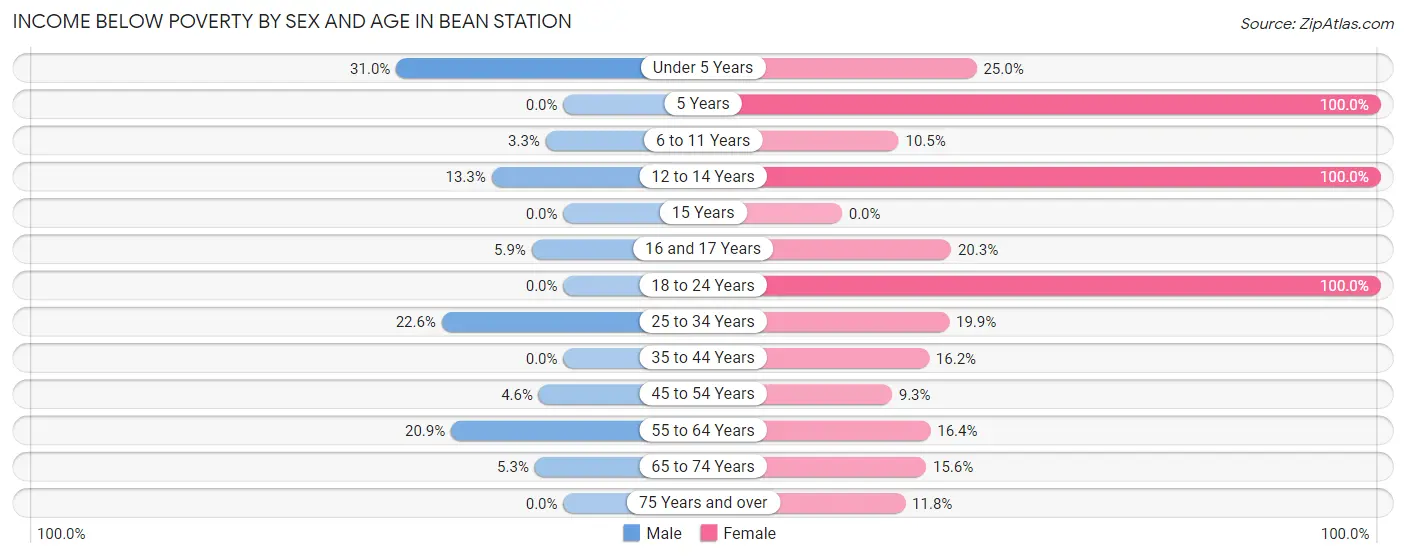
| Age Bracket | Male | Female |
| Under 5 Years | 18 (31.0%) | 15 (25.0%) |
| 5 Years | 0 (0.0%) | 8 (100.0%) |
| 6 to 11 Years | 2 (3.3%) | 12 (10.5%) |
| 12 to 14 Years | 10 (13.3%) | 10 (100.0%) |
| 15 Years | 0 (0.0%) | 0 (0.0%) |
| 16 and 17 Years | 5 (5.9%) | 15 (20.3%) |
| 18 to 24 Years | 0 (0.0%) | 14 (100.0%) |
| 25 to 34 Years | 49 (22.6%) | 45 (19.9%) |
| 35 to 44 Years | 0 (0.0%) | 27 (16.2%) |
| 45 to 54 Years | 11 (4.5%) | 18 (9.3%) |
| 55 to 64 Years | 44 (20.8%) | 44 (16.4%) |
| 65 to 74 Years | 12 (5.3%) | 28 (15.6%) |
| 75 Years and over | 0 (0.0%) | 10 (11.8%) |
| Total | 151 (9.7%) | 246 (17.6%) |
Income Above Poverty by Sex and Age in Bean Station
According to the poverty statistics in Bean Station, males aged 18 to 24 years and females aged 45 to 54 years are the age groups that are most secure financially, with 100.0% of males and 90.7% of females in these age groups living above the poverty line.
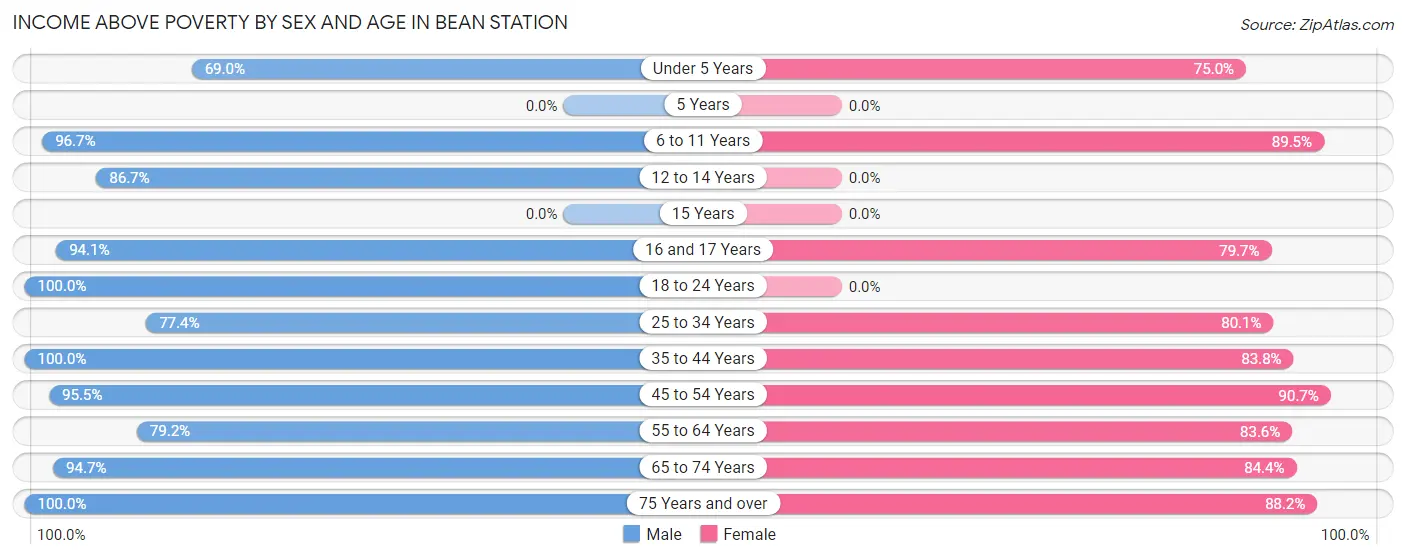
| Age Bracket | Male | Female |
| Under 5 Years | 40 (69.0%) | 45 (75.0%) |
| 5 Years | 0 (0.0%) | 0 (0.0%) |
| 6 to 11 Years | 59 (96.7%) | 102 (89.5%) |
| 12 to 14 Years | 65 (86.7%) | 0 (0.0%) |
| 15 Years | 0 (0.0%) | 0 (0.0%) |
| 16 and 17 Years | 80 (94.1%) | 59 (79.7%) |
| 18 to 24 Years | 109 (100.0%) | 0 (0.0%) |
| 25 to 34 Years | 168 (77.4%) | 181 (80.1%) |
| 35 to 44 Years | 176 (100.0%) | 140 (83.8%) |
| 45 to 54 Years | 231 (95.5%) | 176 (90.7%) |
| 55 to 64 Years | 167 (79.1%) | 224 (83.6%) |
| 65 to 74 Years | 214 (94.7%) | 151 (84.4%) |
| 75 Years and over | 104 (100.0%) | 75 (88.2%) |
| Total | 1,413 (90.3%) | 1,153 (82.4%) |
Income Below Poverty Among Married-Couple Families in Bean Station
The poverty statistics for married-couple families in Bean Station show that 11.4% or 76 of the total 666 families live below the poverty line. Families with 3 or 4 children have the highest poverty rate of 100.0%, comprising of 14 families. On the other hand, families with 1 or 2 children have the lowest poverty rate of 9.2%, which includes 21 families.
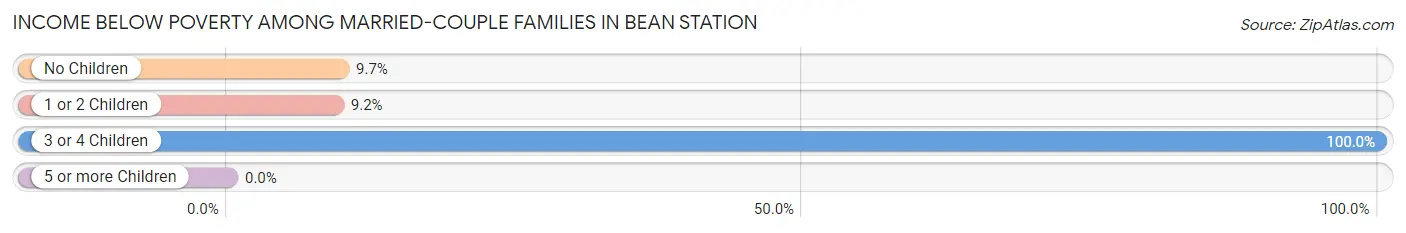
| Children | Above Poverty | Below Poverty |
| No Children | 383 (90.3%) | 41 (9.7%) |
| 1 or 2 Children | 207 (90.8%) | 21 (9.2%) |
| 3 or 4 Children | 0 (0.0%) | 14 (100.0%) |
| 5 or more Children | 0 (0.0%) | 0 (0.0%) |
| Total | 590 (88.6%) | 76 (11.4%) |
Income Below Poverty Among Single-Parent Households in Bean Station
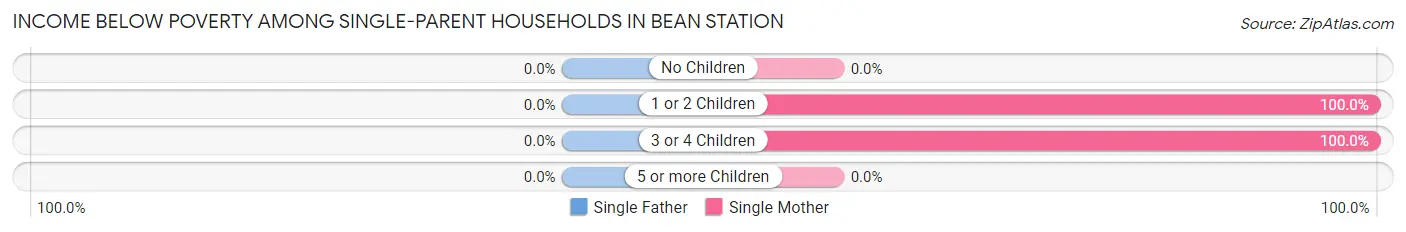
| Children | Single Father | Single Mother |
| No Children | 0 (0.0%) | 0 (0.0%) |
| 1 or 2 Children | 0 (0.0%) | 9 (100.0%) |
| 3 or 4 Children | 0 (0.0%) | 11 (100.0%) |
| 5 or more Children | 0 (0.0%) | 0 (0.0%) |
| Total | 0 (0.0%) | 20 (31.2%) |
Income Below Poverty Among Married-Couple vs Single-Parent Households in Bean Station
The poverty data for Bean Station shows that 76 of the married-couple family households (11.4%) and 20 of the single-parent households (15.6%) are living below the poverty level. Within the married-couple family households, those with 3 or 4 children have the highest poverty rate, with 14 households (100.0%) falling below the poverty line. Among the single-parent households, those with 3 or 4 children have the highest poverty rate, with 11 household (42.3%) living below poverty.
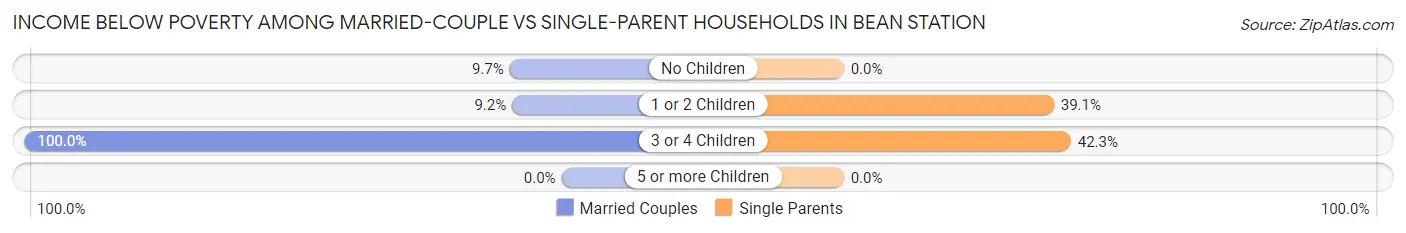
| Children | Married-Couple Families | Single-Parent Households |
| No Children | 41 (9.7%) | 0 (0.0%) |
| 1 or 2 Children | 21 (9.2%) | 9 (39.1%) |
| 3 or 4 Children | 14 (100.0%) | 11 (42.3%) |
| 5 or more Children | 0 (0.0%) | 0 (0.0%) |
| Total | 76 (11.4%) | 20 (15.6%) |
Race in Bean Station
The most populous races in Bean Station are White / Caucasian (2,916 | 98.4%), Two or more Races (47 | 1.6%), and Hispanic or Latino (33 | 1.1%).
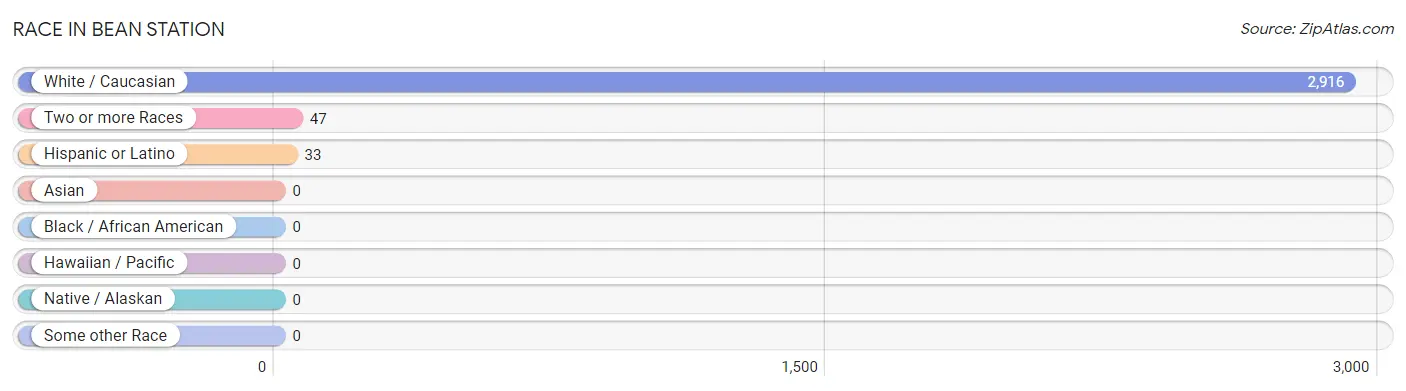
| Race | # Population | % Population |
| Asian | 0 | 0.0% |
| Black / African American | 0 | 0.0% |
| Hawaiian / Pacific | 0 | 0.0% |
| Hispanic or Latino | 33 | 1.1% |
| Native / Alaskan | 0 | 0.0% |
| White / Caucasian | 2,916 | 98.4% |
| Two or more Races | 47 | 1.6% |
| Some other Race | 0 | 0.0% |
| Total | 2,963 | 100.0% |
Ancestry in Bean Station
The most populous ancestries reported in Bean Station are American (721 | 24.3%), English (202 | 6.8%), Irish (148 | 5.0%), Dutch (75 | 2.5%), and German (70 | 2.4%), together accounting for 41.0% of all Bean Station residents.
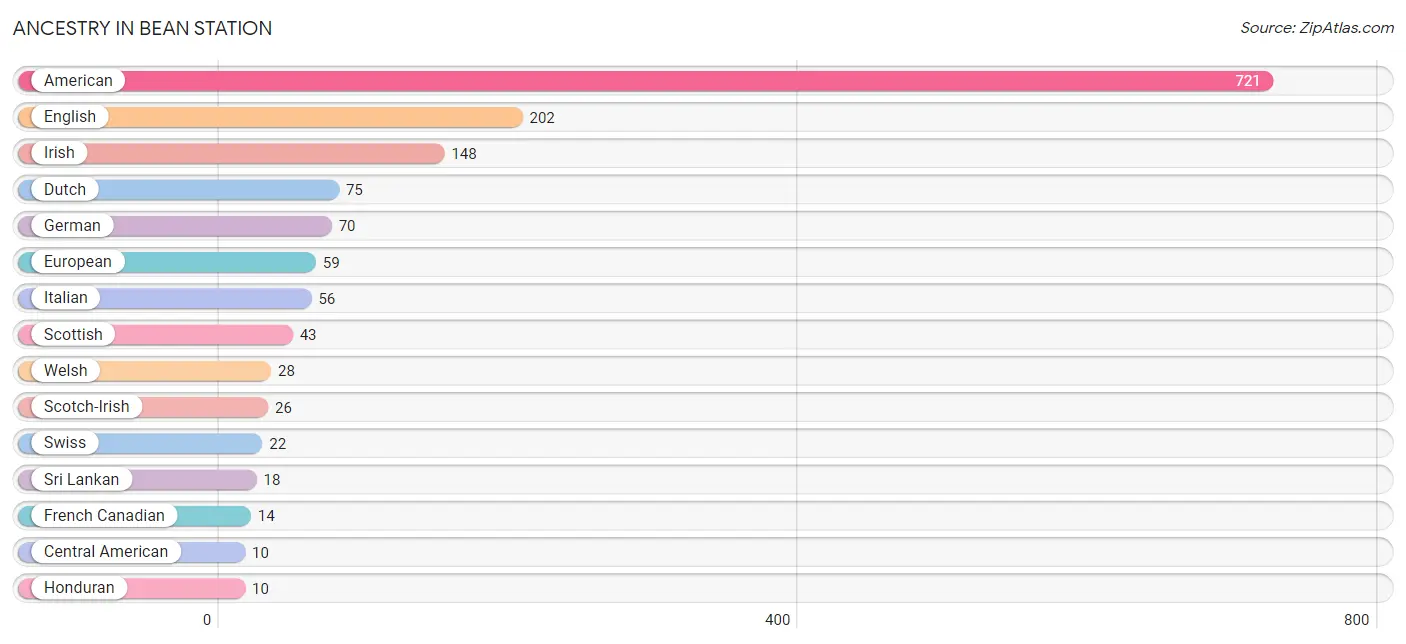
| Ancestry | # Population | % Population |
| American | 721 | 24.3% |
| Central American | 10 | 0.3% |
| Dutch | 75 | 2.5% |
| English | 202 | 6.8% |
| European | 59 | 2.0% |
| French Canadian | 14 | 0.5% |
| German | 70 | 2.4% |
| Honduran | 10 | 0.3% |
| Irish | 148 | 5.0% |
| Italian | 56 | 1.9% |
| Russian | 7 | 0.2% |
| Scotch-Irish | 26 | 0.9% |
| Scottish | 43 | 1.5% |
| Sri Lankan | 18 | 0.6% |
| Swiss | 22 | 0.7% |
| Welsh | 28 | 0.9% | View All 16 Rows |
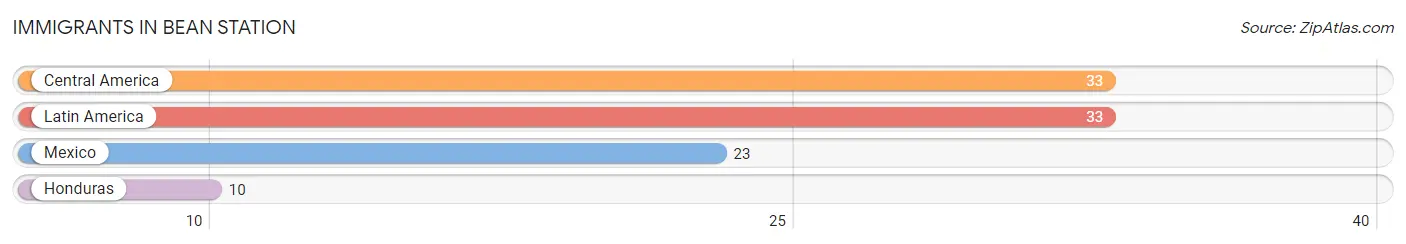
Immigrants in Bean Station
The most numerous immigrant groups reported in Bean Station came from Central America (33 | 1.1%), Latin America (33 | 1.1%), Mexico (23 | 0.8%), and Honduras (10 | 0.3%), together accounting for 3.3% of all Bean Station residents.
| Immigration Origin | # Population | % Population |
| Central America | 33 | 1.1% |
| Honduras | 10 | 0.3% |
| Latin America | 33 | 1.1% |
| Mexico | 23 | 0.8% | View All 4 Rows |
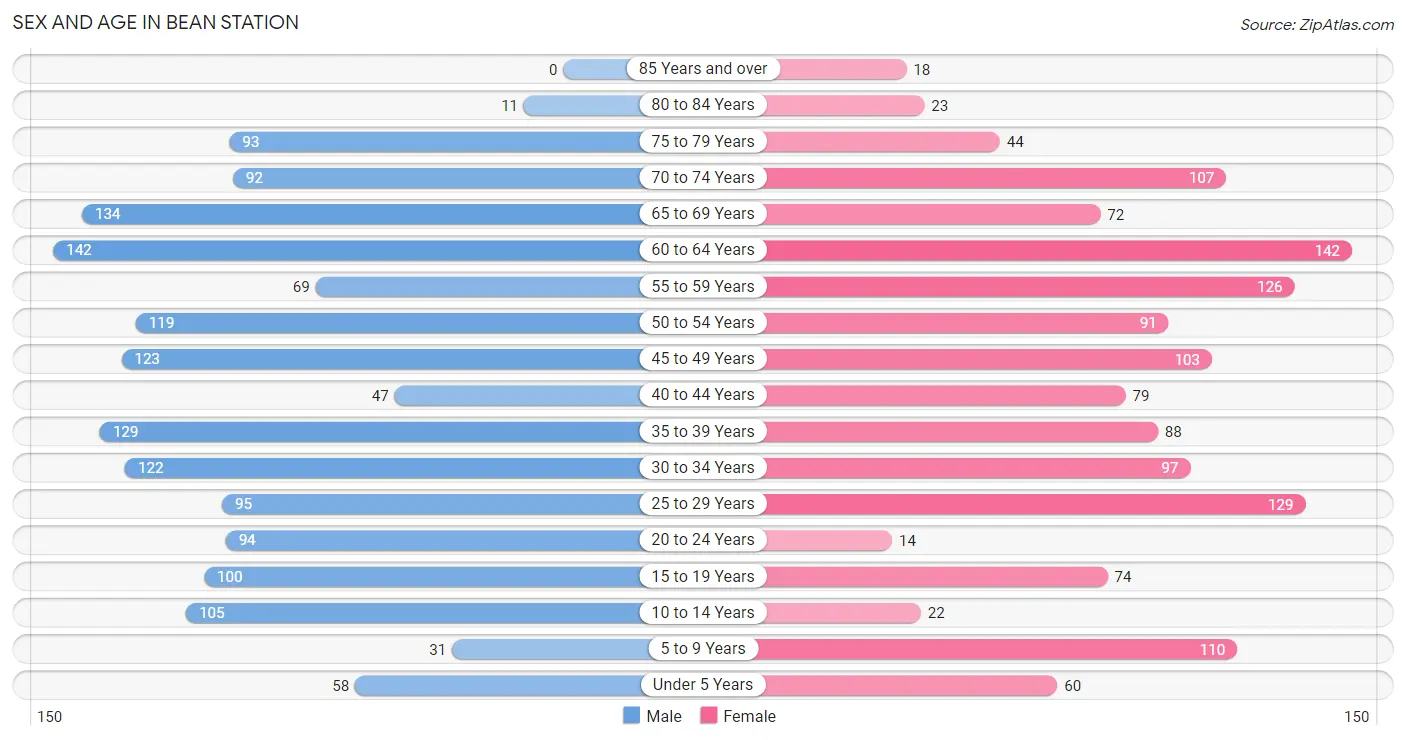
Sex and Age in Bean Station
Sex and Age in Bean Station
The most populous age groups in Bean Station are 60 to 64 Years (142 | 9.1%) for men and 60 to 64 Years (142 | 10.2%) for women.
| Age Bracket | Male | Female |
| Under 5 Years | 58 (3.7%) | 60 (4.3%) |
| 5 to 9 Years | 31 (2.0%) | 110 (7.9%) |
| 10 to 14 Years | 105 (6.7%) | 22 (1.6%) |
| 15 to 19 Years | 100 (6.4%) | 74 (5.3%) |
| 20 to 24 Years | 94 (6.0%) | 14 (1.0%) |
| 25 to 29 Years | 95 (6.1%) | 129 (9.2%) |
| 30 to 34 Years | 122 (7.8%) | 97 (6.9%) |
| 35 to 39 Years | 129 (8.3%) | 88 (6.3%) |
| 40 to 44 Years | 47 (3.0%) | 79 (5.7%) |
| 45 to 49 Years | 123 (7.9%) | 103 (7.4%) |
| 50 to 54 Years | 119 (7.6%) | 91 (6.5%) |
| 55 to 59 Years | 69 (4.4%) | 126 (9.0%) |
| 60 to 64 Years | 142 (9.1%) | 142 (10.2%) |
| 65 to 69 Years | 134 (8.6%) | 72 (5.1%) |
| 70 to 74 Years | 92 (5.9%) | 107 (7.6%) |
| 75 to 79 Years | 93 (5.9%) | 44 (3.2%) |
| 80 to 84 Years | 11 (0.7%) | 23 (1.6%) |
| 85 Years and over | 0 (0.0%) | 18 (1.3%) |
| Total | 1,564 (100.0%) | 1,399 (100.0%) |
Families and Households in Bean Station
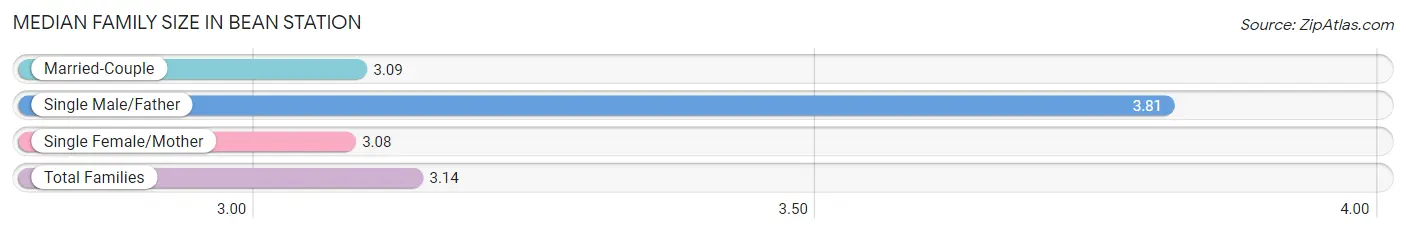
Median Family Size in Bean Station
The median family size in Bean Station is 3.14 persons per family, with single male/father families (64 | 8.1%) accounting for the largest median family size of 3.81 persons per family. On the other hand, single female/mother families (64 | 8.1%) represent the smallest median family size with 3.08 persons per family.
| Family Type | # Families | Family Size |
| Married-Couple | 666 (83.9%) | 3.09 |
| Single Male/Father | 64 (8.1%) | 3.81 |
| Single Female/Mother | 64 (8.1%) | 3.08 |
| Total Families | 794 (100.0%) | 3.14 |
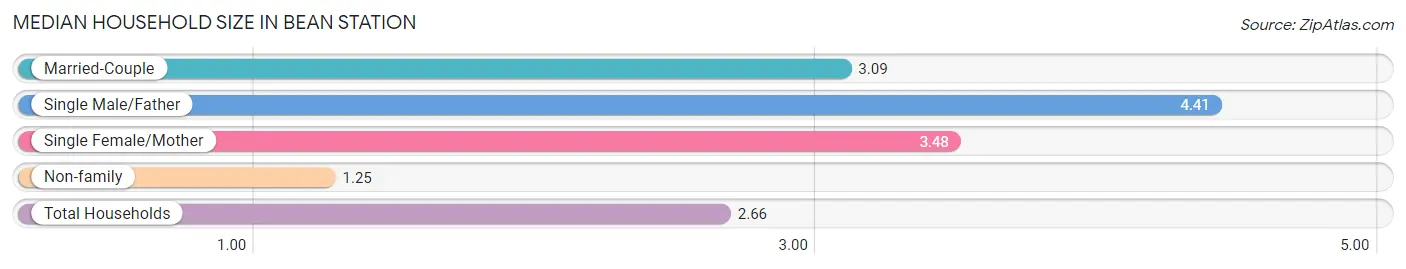
Median Household Size in Bean Station
The median household size in Bean Station is 2.66 persons per household, with single male/father households (64 | 5.7%) accounting for the largest median household size of 4.41 persons per household. non-family households (322 | 28.8%) represent the smallest median household size with 1.25 persons per household.
| Household Type | # Households | Household Size |
| Married-Couple | 666 (59.7%) | 3.09 |
| Single Male/Father | 64 (5.7%) | 4.41 |
| Single Female/Mother | 64 (5.7%) | 3.48 |
| Non-family | 322 (28.8%) | 1.25 |
| Total Households | 1,116 (100.0%) | 2.66 |
Household Size by Marriage Status in Bean Station
Out of a total of 1,116 households in Bean Station, 794 (71.2%) are family households, while 322 (28.8%) are nonfamily households. The most numerous type of family households are 2-person households, comprising 382, and the most common type of nonfamily households are 1-person households, comprising 295.
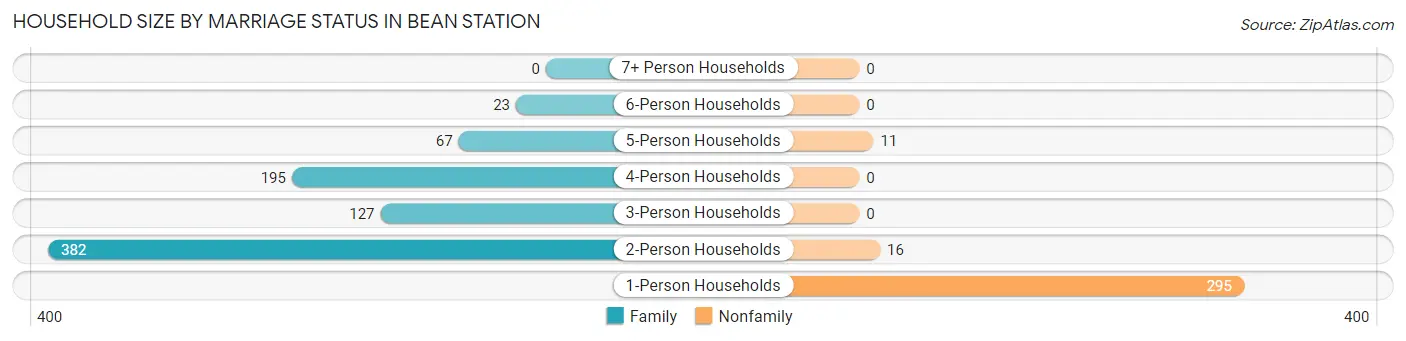
| Household Size | Family Households | Nonfamily Households |
| 1-Person Households | - | 295 (26.4%) |
| 2-Person Households | 382 (34.2%) | 16 (1.4%) |
| 3-Person Households | 127 (11.4%) | 0 (0.0%) |
| 4-Person Households | 195 (17.5%) | 0 (0.0%) |
| 5-Person Households | 67 (6.0%) | 11 (1.0%) |
| 6-Person Households | 23 (2.1%) | 0 (0.0%) |
| 7+ Person Households | 0 (0.0%) | 0 (0.0%) |
| Total | 794 (71.2%) | 322 (28.8%) |
Female Fertility in Bean Station
Fertility by Age in Bean Station
Average fertility rate in Bean Station is 22.0 births per 1,000 women. Women in the age bracket of 20 to 34 years have the highest fertility rate with 58.0 births per 1,000 women. Women in the age bracket of 20 to 34 years acount for 100.0% of all women with births.
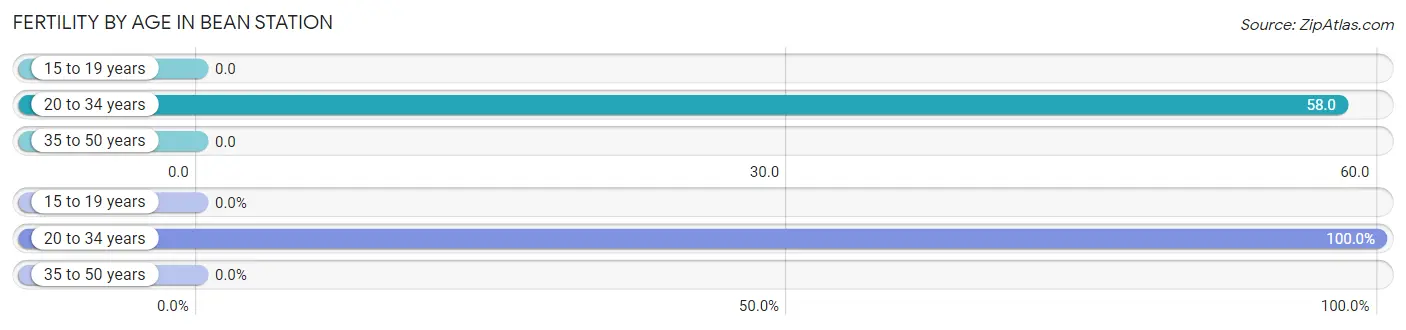
| Age Bracket | Women with Births | Births / 1,000 Women |
| 15 to 19 years | 0 (0.0%) | 0.0 |
| 20 to 34 years | 14 (100.0%) | 58.0 |
| 35 to 50 years | 0 (0.0%) | 0.0 |
| Total | 14 (100.0%) | 22.0 |
Fertility by Age by Marriage Status in Bean Station
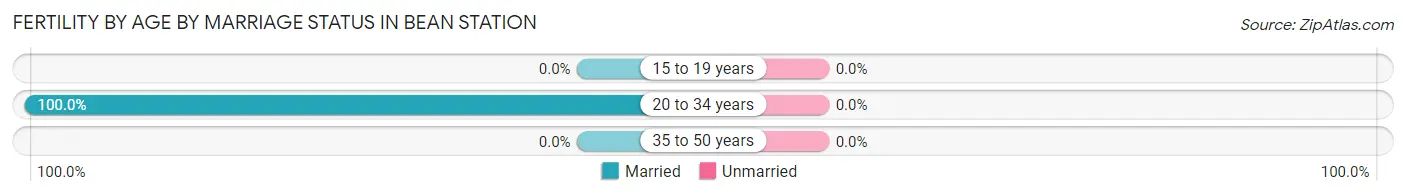
| Age Bracket | Married | Unmarried |
| 15 to 19 years | 0 (0.0%) | 0 (0.0%) |
| 20 to 34 years | 14 (100.0%) | 0 (0.0%) |
| 35 to 50 years | 0 (0.0%) | 0 (0.0%) |
| Total | 14 (100.0%) | 0 (0.0%) |
Fertility by Education in Bean Station
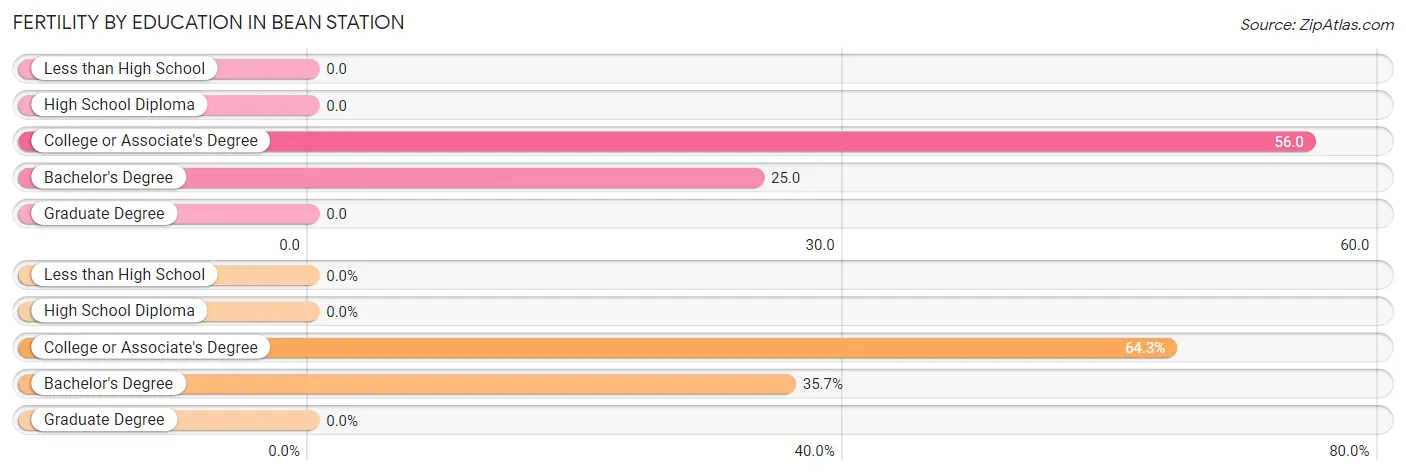
| Educational Attainment | Women with Births | Births / 1,000 Women |
| Less than High School | 0 (0.0%) | 0.0 |
| High School Diploma | 0 (0.0%) | 0.0 |
| College or Associate's Degree | 9 (64.3%) | 56.0 |
| Bachelor's Degree | 5 (35.7%) | 25.0 |
| Graduate Degree | 0 (0.0%) | 0.0 |
| Total | 14 (100.0%) | 22.0 |
Fertility by Education by Marriage Status in Bean Station
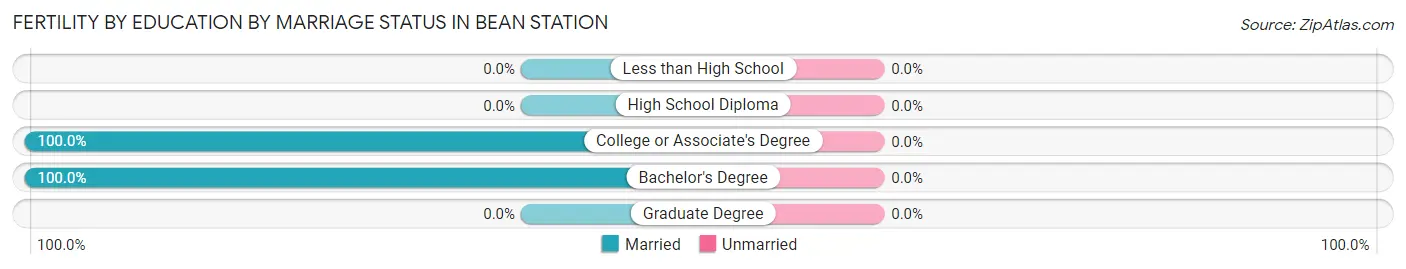
| Educational Attainment | Married | Unmarried |
| Less than High School | 0 (0.0%) | 0 (0.0%) |
| High School Diploma | 0 (0.0%) | 0 (0.0%) |
| College or Associate's Degree | 9 (100.0%) | 0 (0.0%) |
| Bachelor's Degree | 5 (100.0%) | 0 (0.0%) |
| Graduate Degree | 0 (0.0%) | 0 (0.0%) |
| Total | 14 (100.0%) | 0 (0.0%) |
Employment Characteristics in Bean Station
Employment by Class of Employer in Bean Station
Among the 1,212 employed individuals in Bean Station, private company employees (922 | 76.1%), self-employed (not incorporated) (97 | 8.0%), and local government employees (73 | 6.0%) make up the most common classes of employment.
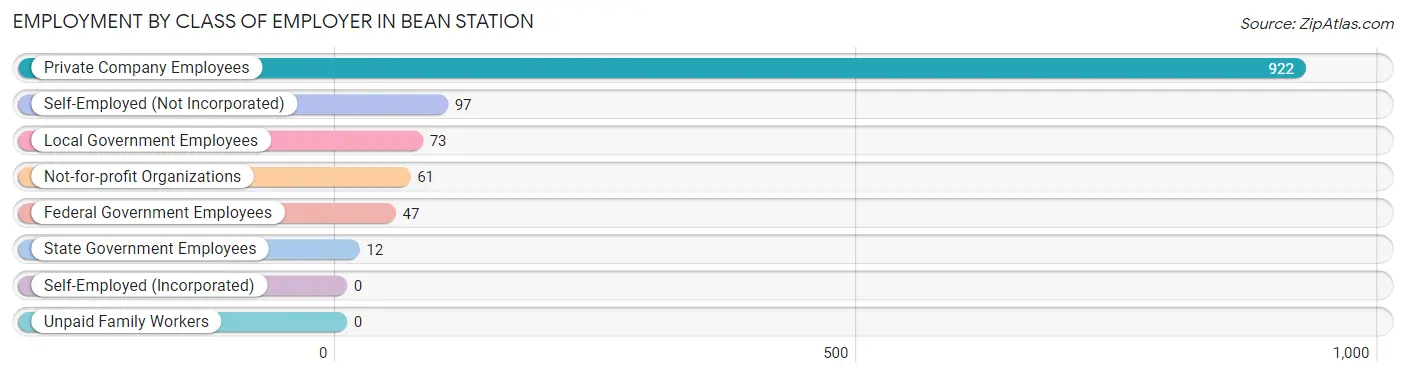
| Employer Class | # Employees | % Employees |
| Private Company Employees | 922 | 76.1% |
| Self-Employed (Incorporated) | 0 | 0.0% |
| Self-Employed (Not Incorporated) | 97 | 8.0% |
| Not-for-profit Organizations | 61 | 5.0% |
| Local Government Employees | 73 | 6.0% |
| State Government Employees | 12 | 1.0% |
| Federal Government Employees | 47 | 3.9% |
| Unpaid Family Workers | 0 | 0.0% |
| Total | 1,212 | 100.0% |
Employment Status by Age in Bean Station
According to the labor force statistics for Bean Station, out of the total population over 16 years of age (2,577), 54.2% or 1,397 individuals are in the labor force, with 3.3% or 46 of them unemployed. The age group with the highest labor force participation rate is 20 to 24 years, with 100.0% or 108 individuals in the labor force. Within the labor force, the 20 to 24 years age range has the highest percentage of unemployed individuals, with 13.0% or 14 of them being unemployed.
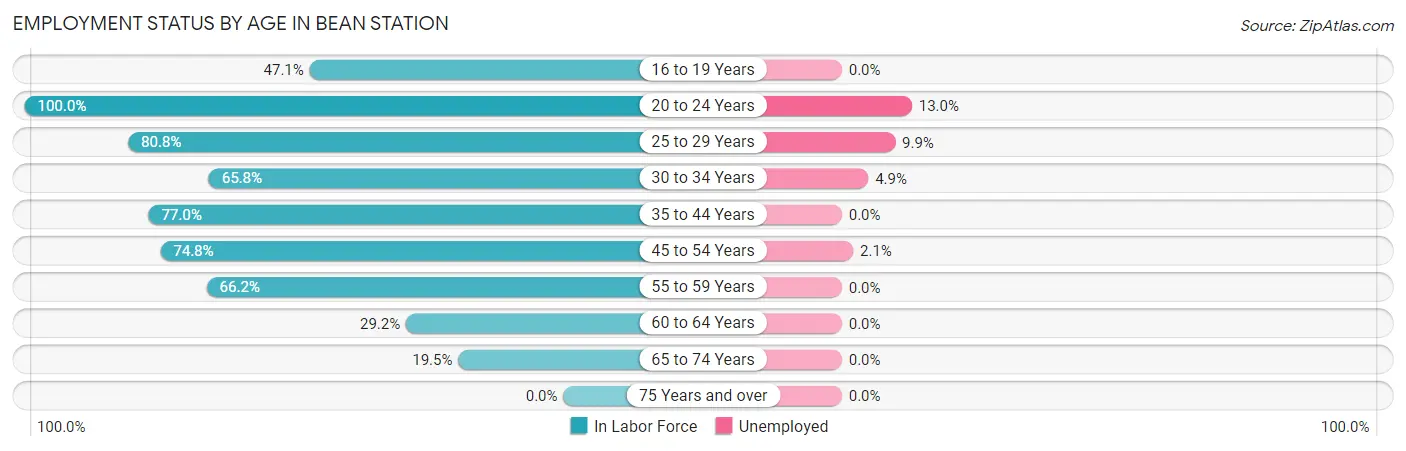
| Age Bracket | In Labor Force | Unemployed |
| 16 to 19 Years | 82 (47.1%) | 0 (0.0%) |
| 20 to 24 Years | 108 (100.0%) | 14 (13.0%) |
| 25 to 29 Years | 181 (80.8%) | 18 (9.9%) |
| 30 to 34 Years | 144 (65.8%) | 7 (4.9%) |
| 35 to 44 Years | 264 (77.0%) | 0 (0.0%) |
| 45 to 54 Years | 326 (74.8%) | 7 (2.1%) |
| 55 to 59 Years | 129 (66.2%) | 0 (0.0%) |
| 60 to 64 Years | 83 (29.2%) | 0 (0.0%) |
| 65 to 74 Years | 79 (19.5%) | 0 (0.0%) |
| 75 Years and over | 0 (0.0%) | 0 (0.0%) |
| Total | 1,397 (54.2%) | 46 (3.3%) |
Employment Status by Educational Attainment in Bean Station
According to labor force statistics for Bean Station, 66.3% of individuals (1,128) out of the total population between 25 and 64 years of age (1,701) are in the labor force, with 2.8% or 32 of them being unemployed. The group with the highest labor force participation rate are those with the educational attainment of college / associate degree, with 84.1% or 350 individuals in the labor force. Within the labor force, individuals with less than high school education have the highest percentage of unemployment, with 26.9% or 18 of them being unemployed.
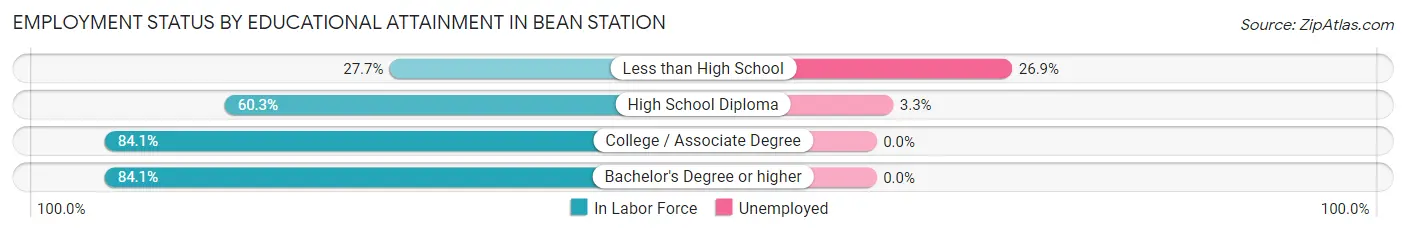
| Educational Attainment | In Labor Force | Unemployed |
| Less than High School | 67 (27.7%) | 65 (26.9%) |
| High School Diploma | 424 (60.3%) | 23 (3.3%) |
| College / Associate Degree | 350 (84.1%) | 0 (0.0%) |
| Bachelor's Degree or higher | 286 (84.1%) | 0 (0.0%) |
| Total | 1,128 (66.3%) | 48 (2.8%) |
Employment Occupations by Sex in Bean Station
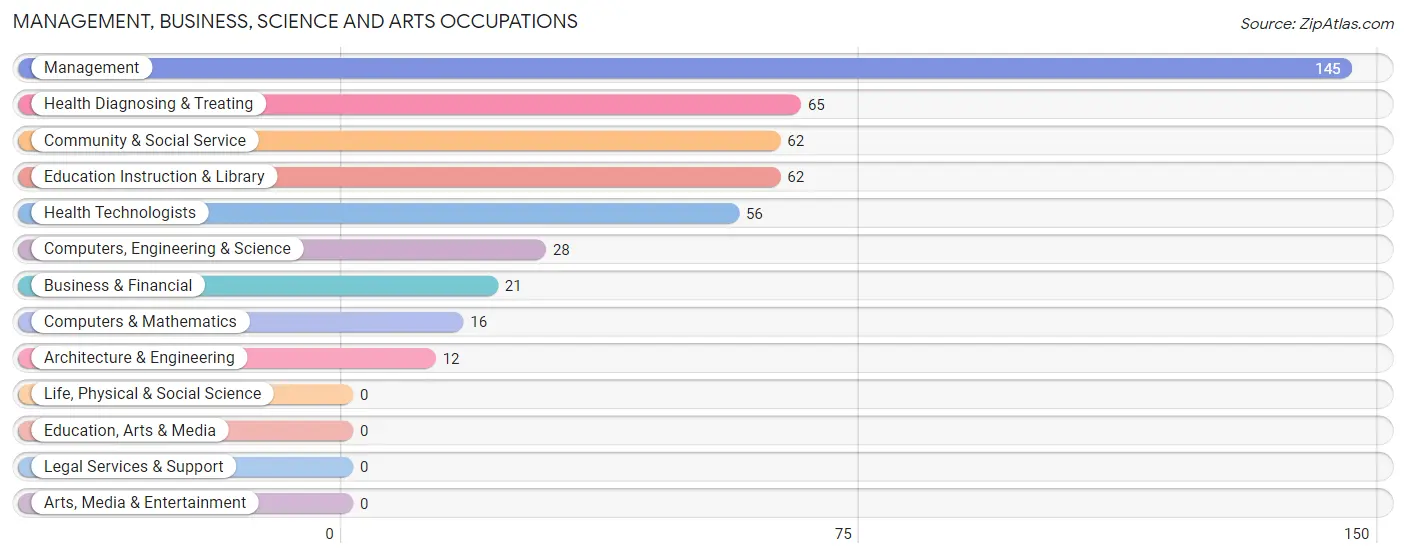
Management, Business, Science and Arts Occupations
The most common Management, Business, Science and Arts occupations in Bean Station are Management (145 | 10.7%), Health Diagnosing & Treating (65 | 4.8%), Community & Social Service (62 | 4.6%), Education Instruction & Library (62 | 4.6%), and Health Technologists (56 | 4.2%).
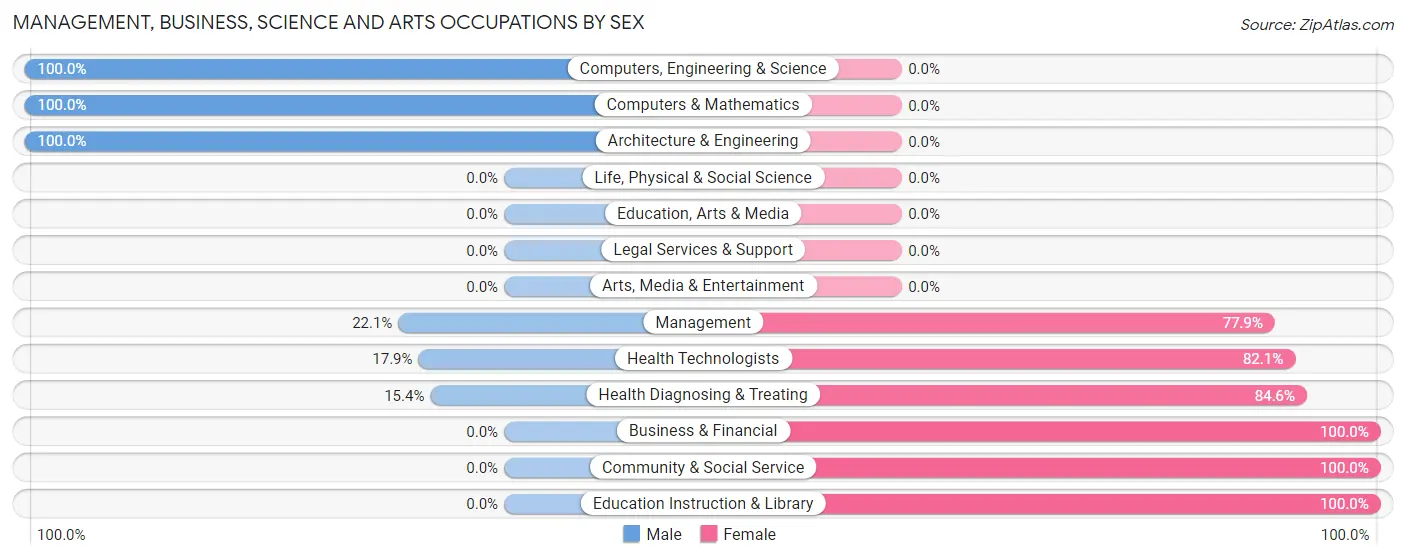
Management, Business, Science and Arts Occupations by Sex
Within the Management, Business, Science and Arts occupations in Bean Station, the most male-oriented occupations are Computers, Engineering & Science (100.0%), Computers & Mathematics (100.0%), and Architecture & Engineering (100.0%), while the most female-oriented occupations are Business & Financial (100.0%), Community & Social Service (100.0%), and Education Instruction & Library (100.0%).
| Occupation | Male | Female |
| Management | 32 (22.1%) | 113 (77.9%) |
| Business & Financial | 0 (0.0%) | 21 (100.0%) |
| Computers, Engineering & Science | 28 (100.0%) | 0 (0.0%) |
| Computers & Mathematics | 16 (100.0%) | 0 (0.0%) |
| Architecture & Engineering | 12 (100.0%) | 0 (0.0%) |
| Life, Physical & Social Science | 0 (0.0%) | 0 (0.0%) |
| Community & Social Service | 0 (0.0%) | 62 (100.0%) |
| Education, Arts & Media | 0 (0.0%) | 0 (0.0%) |
| Legal Services & Support | 0 (0.0%) | 0 (0.0%) |
| Education Instruction & Library | 0 (0.0%) | 62 (100.0%) |
| Arts, Media & Entertainment | 0 (0.0%) | 0 (0.0%) |
| Health Diagnosing & Treating | 10 (15.4%) | 55 (84.6%) |
| Health Technologists | 10 (17.9%) | 46 (82.1%) |
| Total (Category) | 70 (21.8%) | 251 (78.2%) |
| Total (Overall) | 764 (56.6%) | 586 (43.4%) |
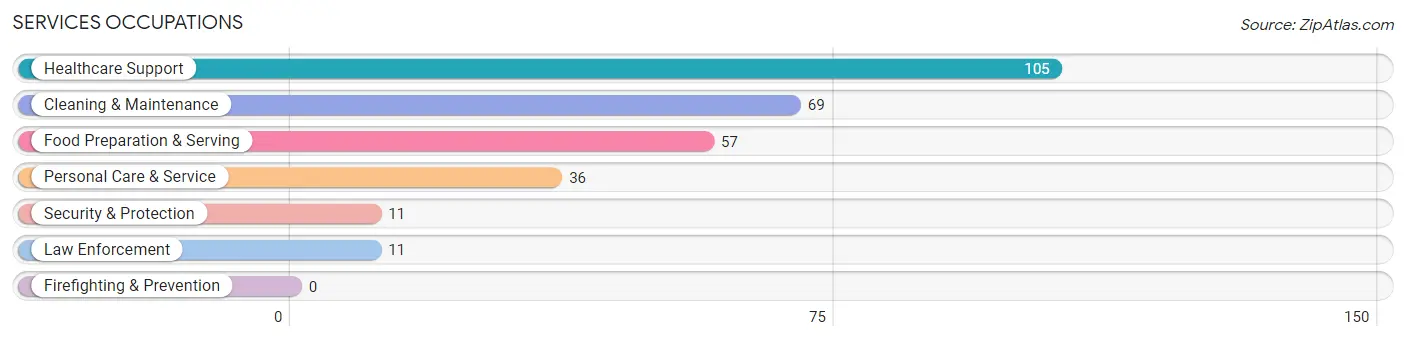
Services Occupations
The most common Services occupations in Bean Station are Healthcare Support (105 | 7.8%), Cleaning & Maintenance (69 | 5.1%), Food Preparation & Serving (57 | 4.2%), Personal Care & Service (36 | 2.7%), and Security & Protection (11 | 0.8%).
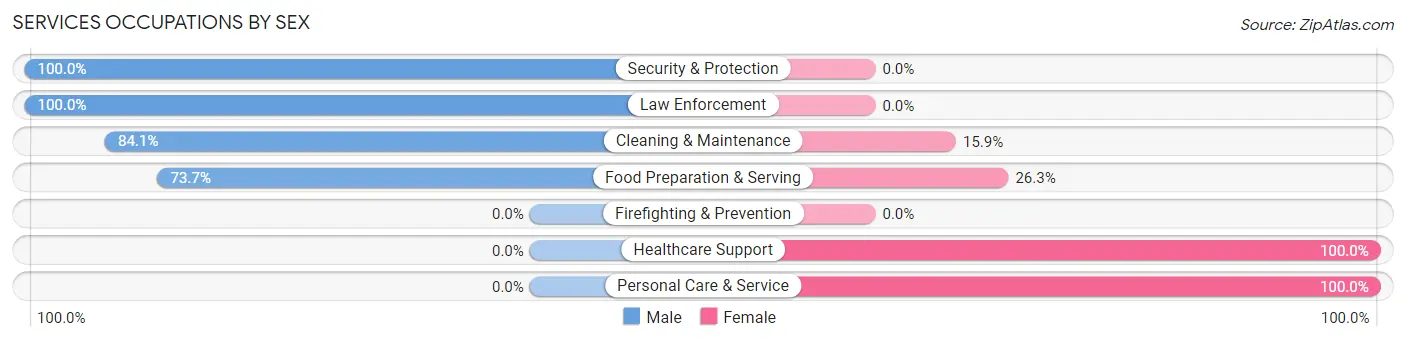
Services Occupations by Sex
Within the Services occupations in Bean Station, the most male-oriented occupations are Security & Protection (100.0%), Law Enforcement (100.0%), and Cleaning & Maintenance (84.1%), while the most female-oriented occupations are Healthcare Support (100.0%), Personal Care & Service (100.0%), and Food Preparation & Serving (26.3%).
| Occupation | Male | Female |
| Healthcare Support | 0 (0.0%) | 105 (100.0%) |
| Security & Protection | 11 (100.0%) | 0 (0.0%) |
| Firefighting & Prevention | 0 (0.0%) | 0 (0.0%) |
| Law Enforcement | 11 (100.0%) | 0 (0.0%) |
| Food Preparation & Serving | 42 (73.7%) | 15 (26.3%) |
| Cleaning & Maintenance | 58 (84.1%) | 11 (15.9%) |
| Personal Care & Service | 0 (0.0%) | 36 (100.0%) |
| Total (Category) | 111 (39.9%) | 167 (60.1%) |
| Total (Overall) | 764 (56.6%) | 586 (43.4%) |
Sales and Office Occupations
The most common Sales and Office occupations in Bean Station are Office & Administration (110 | 8.2%), and Sales & Related (81 | 6.0%).

Sales and Office Occupations by Sex

| Occupation | Male | Female |
| Sales & Related | 50 (61.7%) | 31 (38.3%) |
| Office & Administration | 30 (27.3%) | 80 (72.7%) |
| Total (Category) | 80 (41.9%) | 111 (58.1%) |
| Total (Overall) | 764 (56.6%) | 586 (43.4%) |
Natural Resources, Construction and Maintenance Occupations
The most common Natural Resources, Construction and Maintenance occupations in Bean Station are Construction & Extraction (89 | 6.6%), and Installation, Maintenance & Repair (51 | 3.8%).
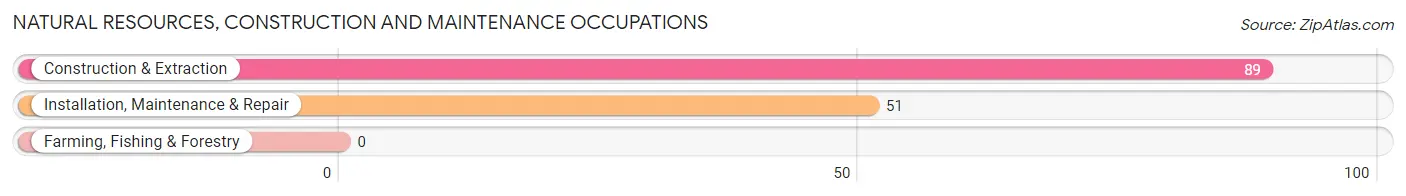
Natural Resources, Construction and Maintenance Occupations by Sex

| Occupation | Male | Female |
| Farming, Fishing & Forestry | 0 (0.0%) | 0 (0.0%) |
| Construction & Extraction | 89 (100.0%) | 0 (0.0%) |
| Installation, Maintenance & Repair | 51 (100.0%) | 0 (0.0%) |
| Total (Category) | 140 (100.0%) | 0 (0.0%) |
| Total (Overall) | 764 (56.6%) | 586 (43.4%) |
Production, Transportation and Moving Occupations
The most common Production, Transportation and Moving occupations in Bean Station are Production (244 | 18.1%), Material Moving (153 | 11.3%), and Transportation (23 | 1.7%).
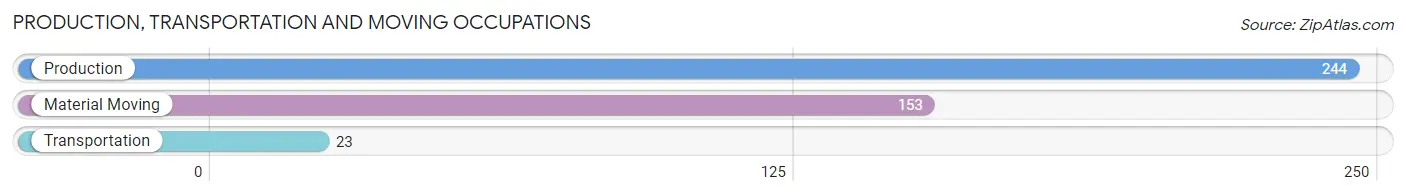
Production, Transportation and Moving Occupations by Sex
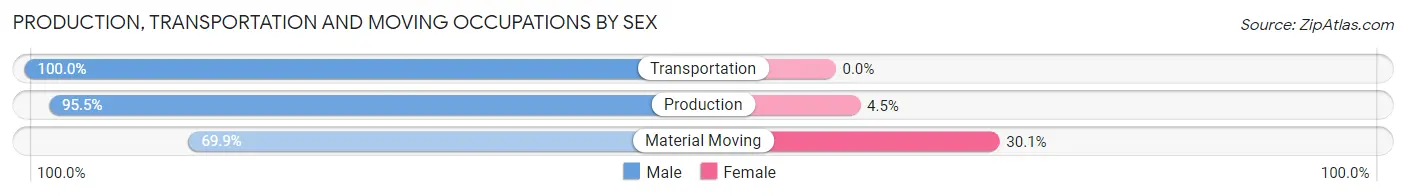
| Occupation | Male | Female |
| Production | 233 (95.5%) | 11 (4.5%) |
| Transportation | 23 (100.0%) | 0 (0.0%) |
| Material Moving | 107 (69.9%) | 46 (30.1%) |
| Total (Category) | 363 (86.4%) | 57 (13.6%) |
| Total (Overall) | 764 (56.6%) | 586 (43.4%) |
Employment Industries by Sex in Bean Station
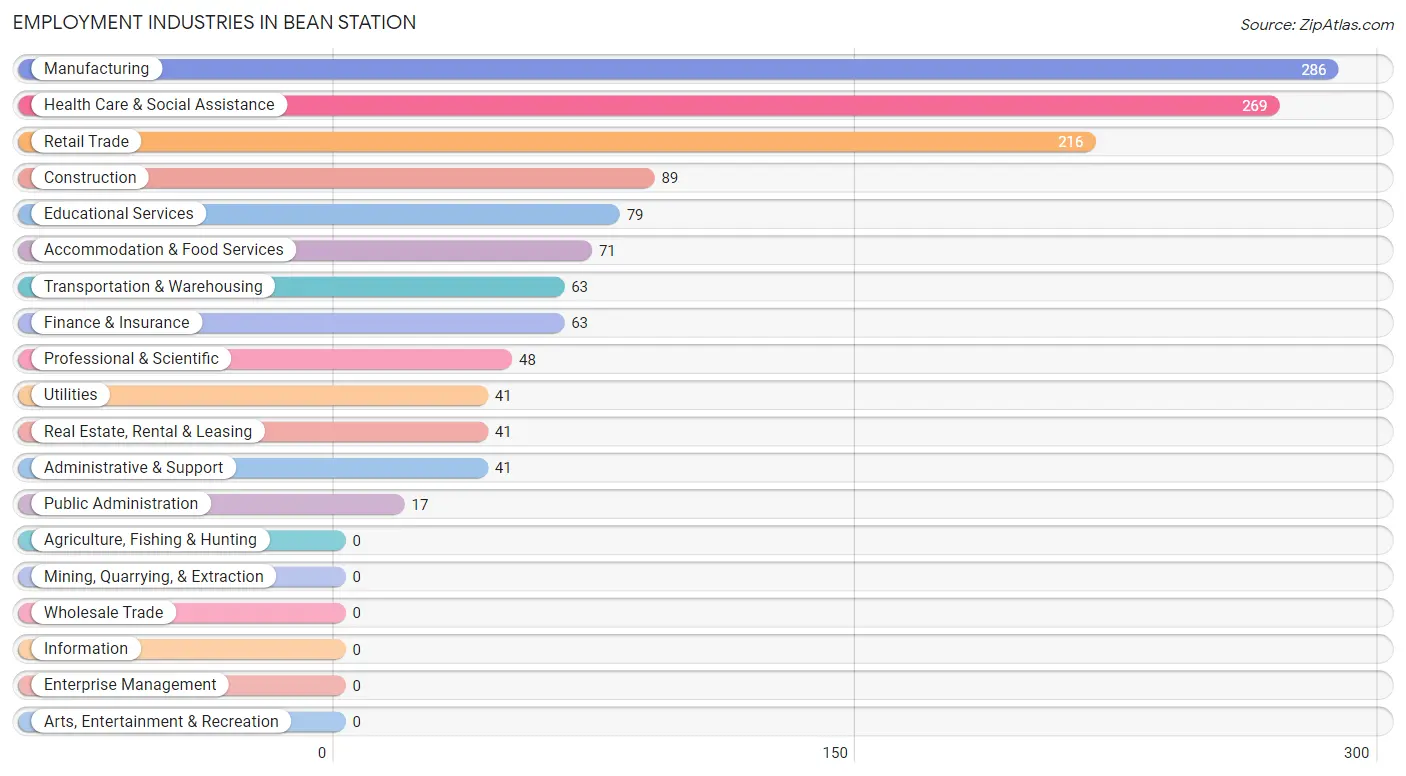
Employment Industries in Bean Station
The major employment industries in Bean Station include Manufacturing (286 | 21.2%), Health Care & Social Assistance (269 | 19.9%), Retail Trade (216 | 16.0%), Construction (89 | 6.6%), and Educational Services (79 | 5.9%).
Employment Industries by Sex in Bean Station
The Bean Station industries that see more men than women are Construction (100.0%), Transportation & Warehousing (100.0%), and Administrative & Support (100.0%), whereas the industries that tend to have a higher number of women are Finance & Insurance (100.0%), Real Estate, Rental & Leasing (100.0%), and Health Care & Social Assistance (96.3%).
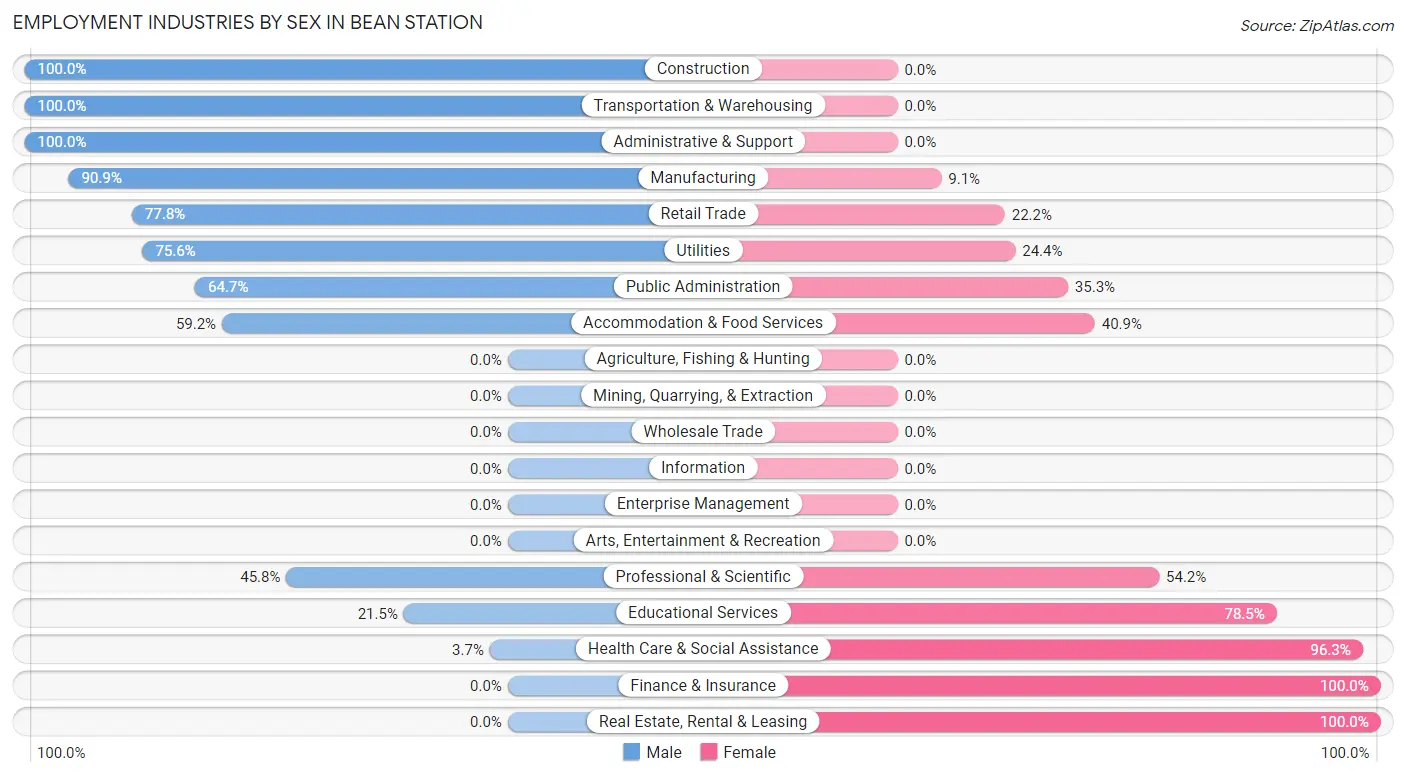
| Industry | Male | Female |
| Agriculture, Fishing & Hunting | 0 (0.0%) | 0 (0.0%) |
| Mining, Quarrying, & Extraction | 0 (0.0%) | 0 (0.0%) |
| Construction | 89 (100.0%) | 0 (0.0%) |
| Manufacturing | 260 (90.9%) | 26 (9.1%) |
| Wholesale Trade | 0 (0.0%) | 0 (0.0%) |
| Retail Trade | 168 (77.8%) | 48 (22.2%) |
| Transportation & Warehousing | 63 (100.0%) | 0 (0.0%) |
| Utilities | 31 (75.6%) | 10 (24.4%) |
| Information | 0 (0.0%) | 0 (0.0%) |
| Finance & Insurance | 0 (0.0%) | 63 (100.0%) |
| Real Estate, Rental & Leasing | 0 (0.0%) | 41 (100.0%) |
| Professional & Scientific | 22 (45.8%) | 26 (54.2%) |
| Enterprise Management | 0 (0.0%) | 0 (0.0%) |
| Administrative & Support | 41 (100.0%) | 0 (0.0%) |
| Educational Services | 17 (21.5%) | 62 (78.5%) |
| Health Care & Social Assistance | 10 (3.7%) | 259 (96.3%) |
| Arts, Entertainment & Recreation | 0 (0.0%) | 0 (0.0%) |
| Accommodation & Food Services | 42 (59.2%) | 29 (40.8%) |
| Public Administration | 11 (64.7%) | 6 (35.3%) |
| Total | 764 (56.6%) | 586 (43.4%) |
Education in Bean Station
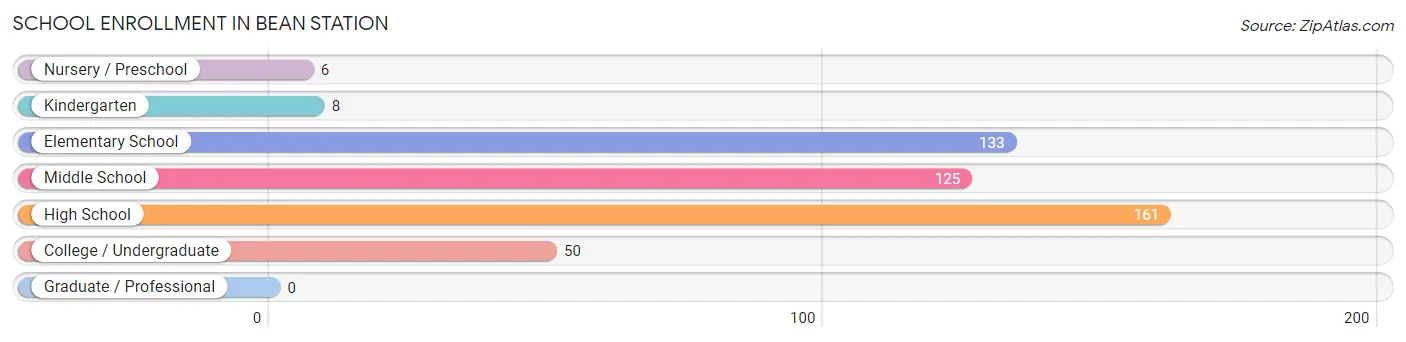
School Enrollment in Bean Station
The most common levels of schooling among the 483 students in Bean Station are high school (161 | 33.3%), elementary school (133 | 27.5%), and middle school (125 | 25.9%).
| School Level | # Students | % Students |
| Nursery / Preschool | 6 | 1.2% |
| Kindergarten | 8 | 1.7% |
| Elementary School | 133 | 27.5% |
| Middle School | 125 | 25.9% |
| High School | 161 | 33.3% |
| College / Undergraduate | 50 | 10.3% |
| Graduate / Professional | 0 | 0.0% |
| Total | 483 | 100.0% |
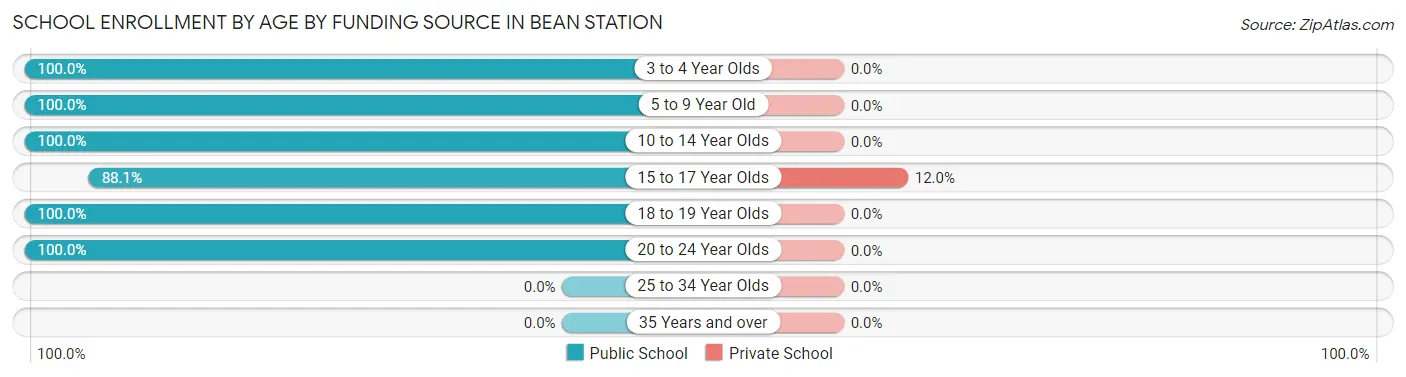
School Enrollment by Age by Funding Source in Bean Station
Out of a total of 483 students who are enrolled in schools in Bean Station, 19 (3.9%) attend a private institution, while the remaining 464 (96.1%) are enrolled in public schools. The age group of 15 to 17 year olds has the highest likelihood of being enrolled in private schools, with 19 (11.9% in the age bracket) enrolled. Conversely, the age group of 3 to 4 year olds has the lowest likelihood of being enrolled in a private school, with 6 (100.0% in the age bracket) attending a public institution.
| Age Bracket | Public School | Private School |
| 3 to 4 Year Olds | 6 (100.0%) | 0 (0.0%) |
| 5 to 9 Year Old | 141 (100.0%) | 0 (0.0%) |
| 10 to 14 Year Olds | 127 (100.0%) | 0 (0.0%) |
| 15 to 17 Year Olds | 140 (88.0%) | 19 (11.9%) |
| 18 to 19 Year Olds | 15 (100.0%) | 0 (0.0%) |
| 20 to 24 Year Olds | 35 (100.0%) | 0 (0.0%) |
| 25 to 34 Year Olds | 0 (0.0%) | 0 (0.0%) |
| 35 Years and over | 0 (0.0%) | 0 (0.0%) |
| Total | 464 (96.1%) | 19 (3.9%) |
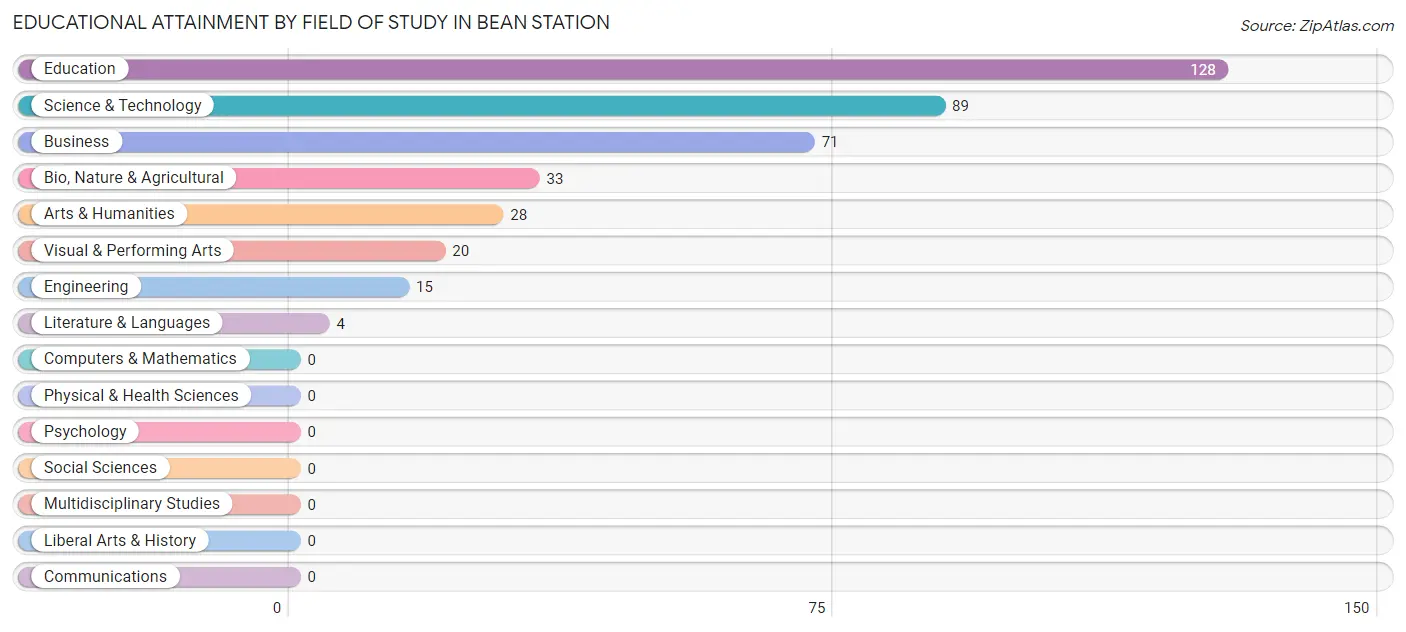
Educational Attainment by Field of Study in Bean Station
Education (128 | 33.0%), science & technology (89 | 22.9%), business (71 | 18.3%), bio, nature & agricultural (33 | 8.5%), and arts & humanities (28 | 7.2%) are the most common fields of study among 388 individuals in Bean Station who have obtained a bachelor's degree or higher.
| Field of Study | # Graduates | % Graduates |
| Computers & Mathematics | 0 | 0.0% |
| Bio, Nature & Agricultural | 33 | 8.5% |
| Physical & Health Sciences | 0 | 0.0% |
| Psychology | 0 | 0.0% |
| Social Sciences | 0 | 0.0% |
| Engineering | 15 | 3.9% |
| Multidisciplinary Studies | 0 | 0.0% |
| Science & Technology | 89 | 22.9% |
| Business | 71 | 18.3% |
| Education | 128 | 33.0% |
| Literature & Languages | 4 | 1.0% |
| Liberal Arts & History | 0 | 0.0% |
| Visual & Performing Arts | 20 | 5.1% |
| Communications | 0 | 0.0% |
| Arts & Humanities | 28 | 7.2% |
| Total | 388 | 100.0% |
Transportation & Commute in Bean Station
Vehicle Availability by Sex in Bean Station
The most prevalent vehicle ownership categories in Bean Station are males with 2 vehicles (288, accounting for 40.9%) and females with 2 vehicles (189, making up 56.7%).
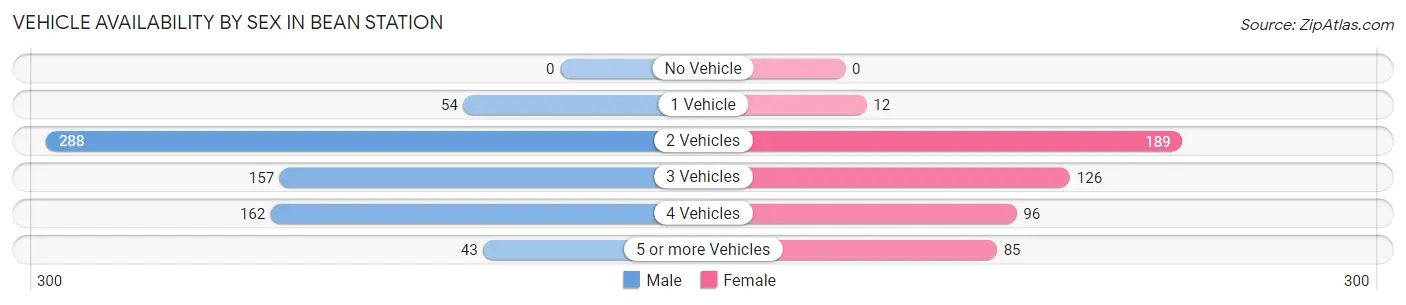
| Vehicles Available | Male | Female |
| No Vehicle | 0 (0.0%) | 0 (0.0%) |
| 1 Vehicle | 54 (7.7%) | 12 (2.4%) |
| 2 Vehicles | 288 (40.9%) | 189 (37.2%) |
| 3 Vehicles | 157 (22.3%) | 126 (24.8%) |
| 4 Vehicles | 162 (23.0%) | 96 (18.9%) |
| 5 or more Vehicles | 43 (6.1%) | 85 (16.7%) |
| Total | 704 (100.0%) | 508 (100.0%) |
Commute Time in Bean Station
The most frequently occuring commute durations in Bean Station are 30 to 34 minutes (214 commuters, 18.3%), 20 to 24 minutes (204 commuters, 17.4%), and 15 to 19 minutes (180 commuters, 15.4%).
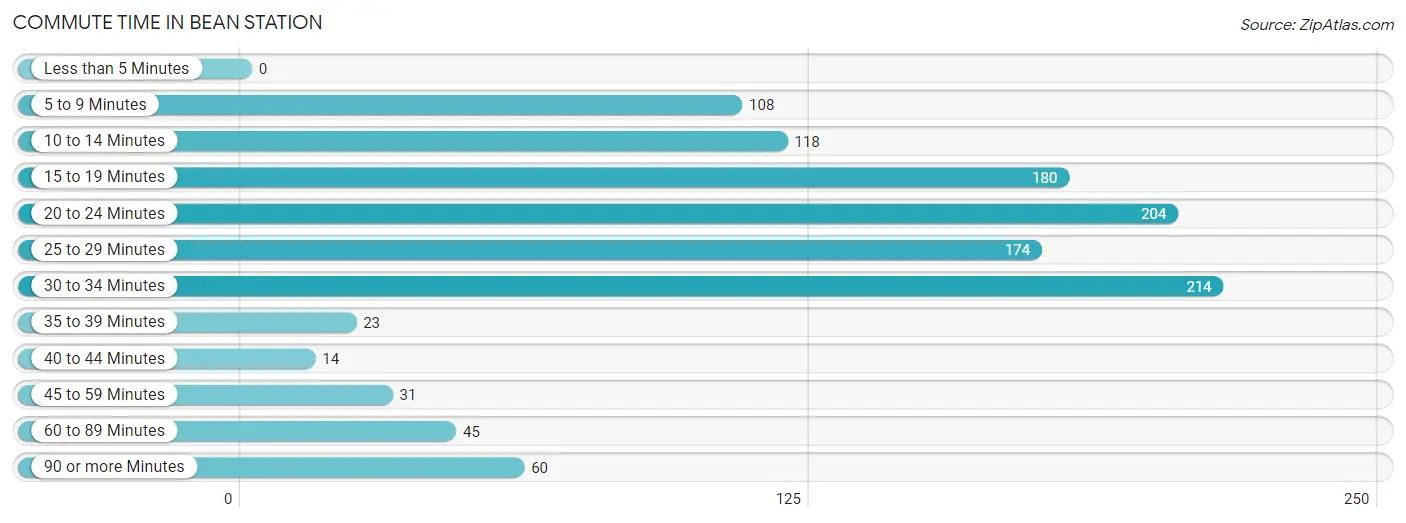
| Commute Time | # Commuters | % Commuters |
| Less than 5 Minutes | 0 | 0.0% |
| 5 to 9 Minutes | 108 | 9.2% |
| 10 to 14 Minutes | 118 | 10.1% |
| 15 to 19 Minutes | 180 | 15.4% |
| 20 to 24 Minutes | 204 | 17.4% |
| 25 to 29 Minutes | 174 | 14.9% |
| 30 to 34 Minutes | 214 | 18.3% |
| 35 to 39 Minutes | 23 | 2.0% |
| 40 to 44 Minutes | 14 | 1.2% |
| 45 to 59 Minutes | 31 | 2.6% |
| 60 to 89 Minutes | 45 | 3.8% |
| 90 or more Minutes | 60 | 5.1% |
Commute Time by Sex in Bean Station
The most common commute times in Bean Station are 20 to 24 minutes (130 commuters, 19.6%) for males and 25 to 29 minutes (114 commuters, 22.4%) for females.
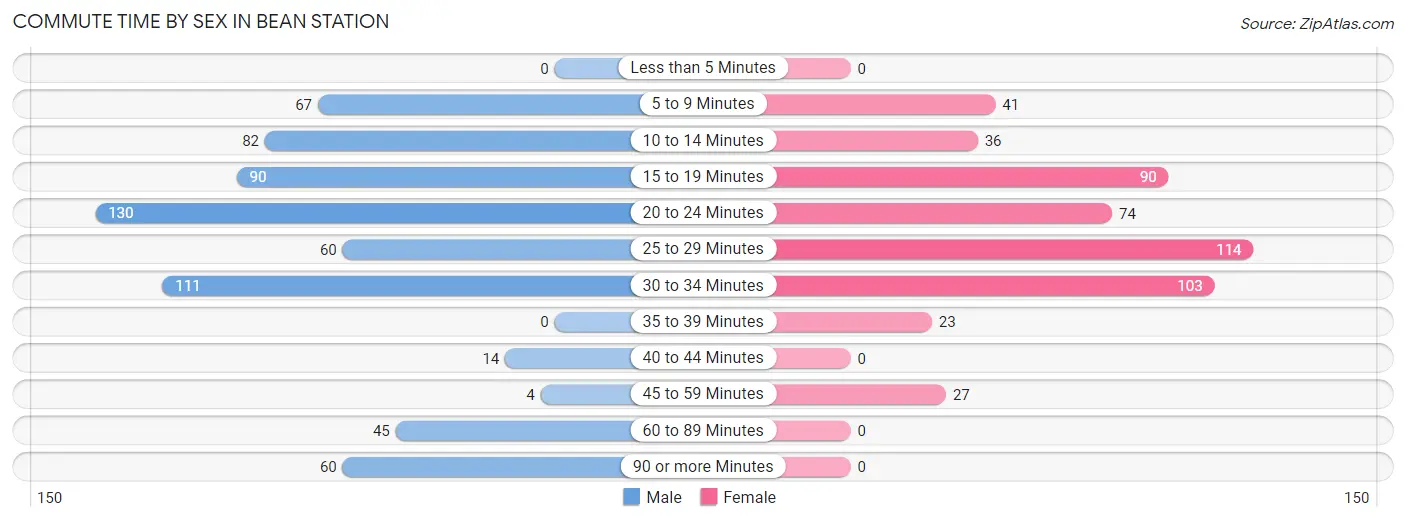
| Commute Time | Male | Female |
| Less than 5 Minutes | 0 (0.0%) | 0 (0.0%) |
| 5 to 9 Minutes | 67 (10.1%) | 41 (8.1%) |
| 10 to 14 Minutes | 82 (12.4%) | 36 (7.1%) |
| 15 to 19 Minutes | 90 (13.6%) | 90 (17.7%) |
| 20 to 24 Minutes | 130 (19.6%) | 74 (14.6%) |
| 25 to 29 Minutes | 60 (9.0%) | 114 (22.4%) |
| 30 to 34 Minutes | 111 (16.7%) | 103 (20.3%) |
| 35 to 39 Minutes | 0 (0.0%) | 23 (4.5%) |
| 40 to 44 Minutes | 14 (2.1%) | 0 (0.0%) |
| 45 to 59 Minutes | 4 (0.6%) | 27 (5.3%) |
| 60 to 89 Minutes | 45 (6.8%) | 0 (0.0%) |
| 90 or more Minutes | 60 (9.0%) | 0 (0.0%) |
Time of Departure to Work by Sex in Bean Station
The most frequent times of departure to work in Bean Station are 4:00 PM to 11:59 PM (163, 24.6%) for males and 7:30 AM to 7:59 AM (108, 21.3%) for females.
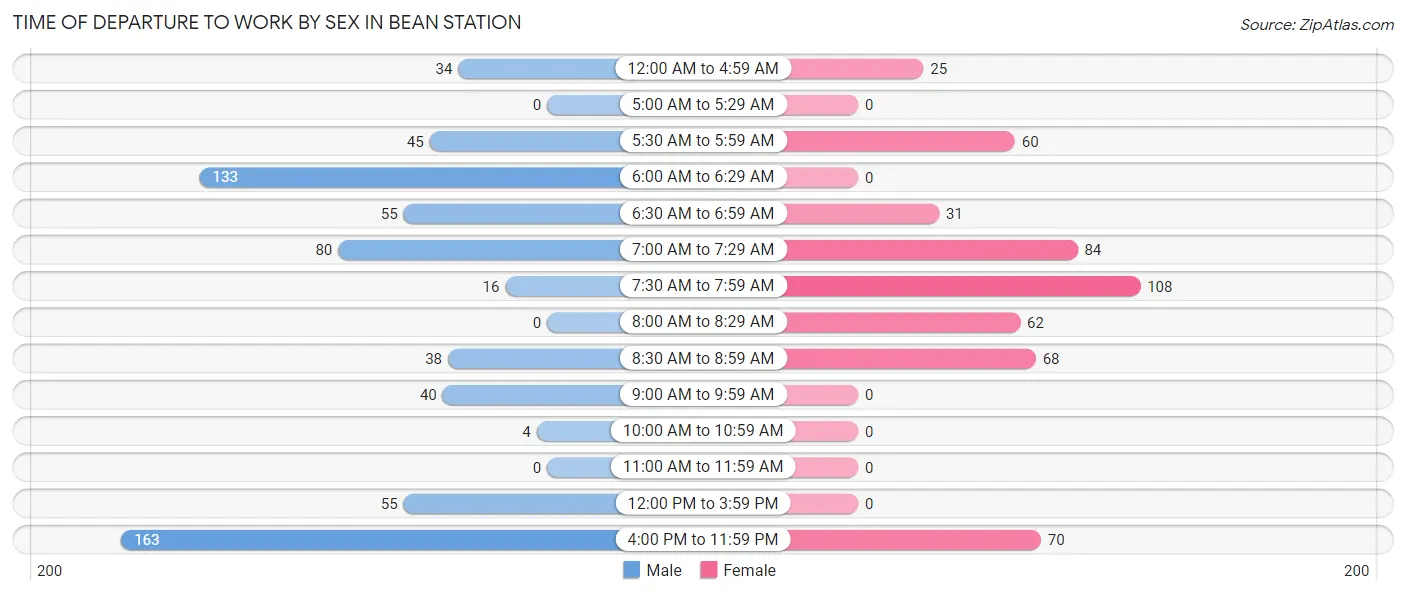
| Time of Departure | Male | Female |
| 12:00 AM to 4:59 AM | 34 (5.1%) | 25 (4.9%) |
| 5:00 AM to 5:29 AM | 0 (0.0%) | 0 (0.0%) |
| 5:30 AM to 5:59 AM | 45 (6.8%) | 60 (11.8%) |
| 6:00 AM to 6:29 AM | 133 (20.1%) | 0 (0.0%) |
| 6:30 AM to 6:59 AM | 55 (8.3%) | 31 (6.1%) |
| 7:00 AM to 7:29 AM | 80 (12.1%) | 84 (16.5%) |
| 7:30 AM to 7:59 AM | 16 (2.4%) | 108 (21.3%) |
| 8:00 AM to 8:29 AM | 0 (0.0%) | 62 (12.2%) |
| 8:30 AM to 8:59 AM | 38 (5.7%) | 68 (13.4%) |
| 9:00 AM to 9:59 AM | 40 (6.0%) | 0 (0.0%) |
| 10:00 AM to 10:59 AM | 4 (0.6%) | 0 (0.0%) |
| 11:00 AM to 11:59 AM | 0 (0.0%) | 0 (0.0%) |
| 12:00 PM to 3:59 PM | 55 (8.3%) | 0 (0.0%) |
| 4:00 PM to 11:59 PM | 163 (24.6%) | 70 (13.8%) |
| Total | 663 (100.0%) | 508 (100.0%) |
Housing Occupancy in Bean Station
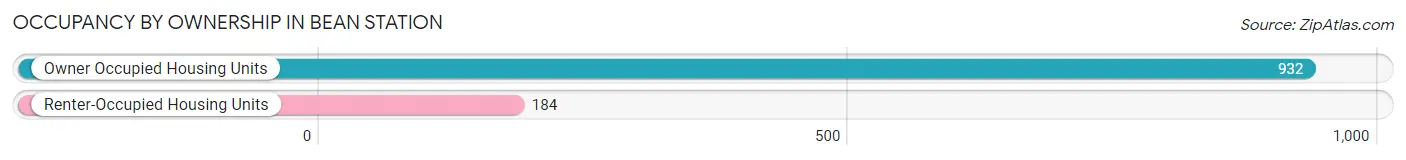
Occupancy by Ownership in Bean Station
Of the total 1,116 dwellings in Bean Station, owner-occupied units account for 932 (83.5%), while renter-occupied units make up 184 (16.5%).
| Occupancy | # Housing Units | % Housing Units |
| Owner Occupied Housing Units | 932 | 83.5% |
| Renter-Occupied Housing Units | 184 | 16.5% |
| Total Occupied Housing Units | 1,116 | 100.0% |
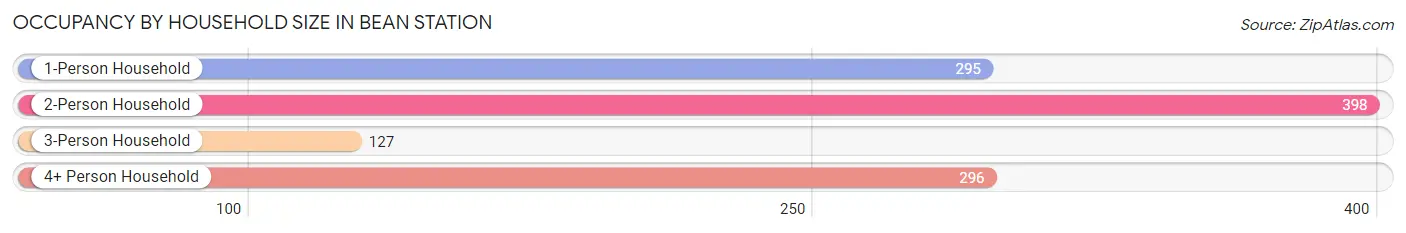
Occupancy by Household Size in Bean Station
| Household Size | # Housing Units | % Housing Units |
| 1-Person Household | 295 | 26.4% |
| 2-Person Household | 398 | 35.7% |
| 3-Person Household | 127 | 11.4% |
| 4+ Person Household | 296 | 26.5% |
| Total Housing Units | 1,116 | 100.0% |
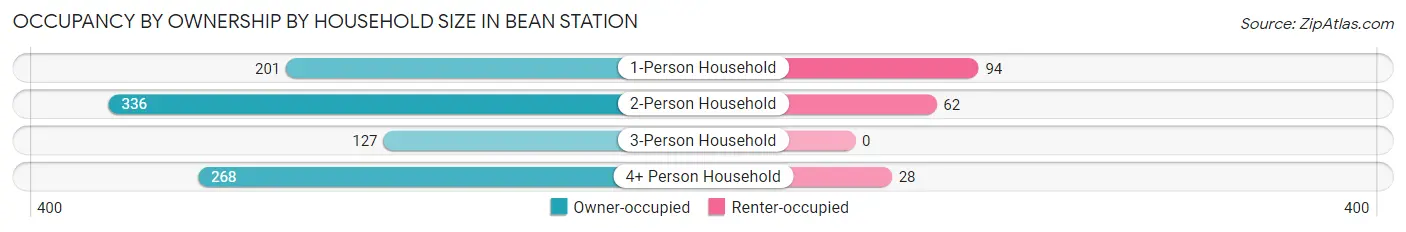
Occupancy by Ownership by Household Size in Bean Station
| Household Size | Owner-occupied | Renter-occupied |
| 1-Person Household | 201 (68.1%) | 94 (31.9%) |
| 2-Person Household | 336 (84.4%) | 62 (15.6%) |
| 3-Person Household | 127 (100.0%) | 0 (0.0%) |
| 4+ Person Household | 268 (90.5%) | 28 (9.5%) |
| Total Housing Units | 932 (83.5%) | 184 (16.5%) |
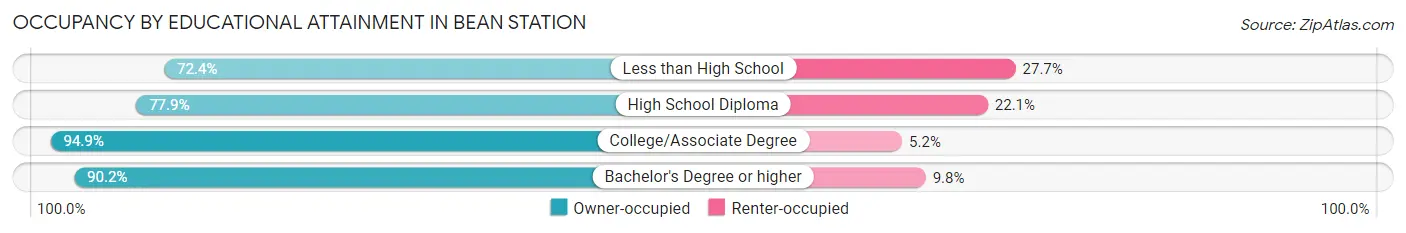
Occupancy by Educational Attainment in Bean Station
| Household Size | Owner-occupied | Renter-occupied |
| Less than High School | 157 (72.4%) | 60 (27.7%) |
| High School Diploma | 306 (77.9%) | 87 (22.1%) |
| College/Associate Degree | 258 (94.9%) | 14 (5.1%) |
| Bachelor's Degree or higher | 211 (90.2%) | 23 (9.8%) |
Occupancy by Age of Householder in Bean Station
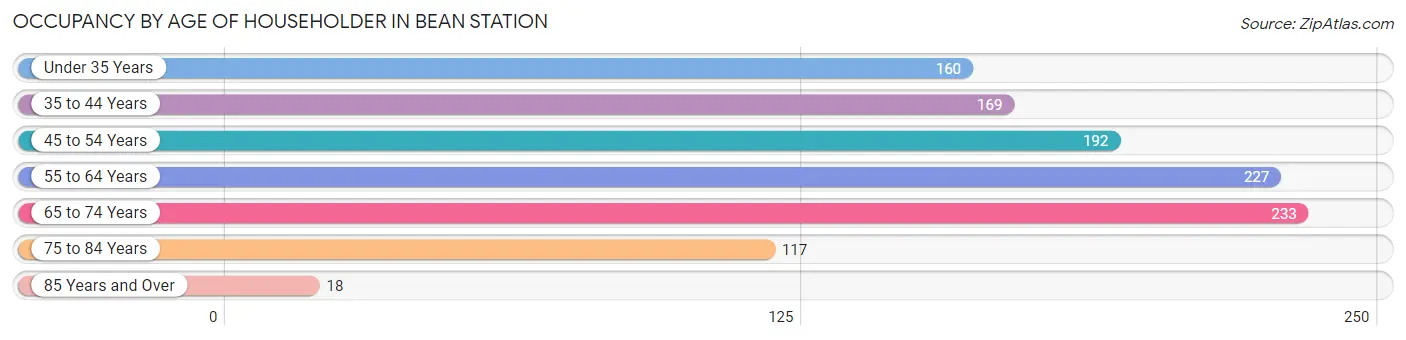
| Age Bracket | # Households | % Households |
| Under 35 Years | 160 | 14.3% |
| 35 to 44 Years | 169 | 15.1% |
| 45 to 54 Years | 192 | 17.2% |
| 55 to 64 Years | 227 | 20.3% |
| 65 to 74 Years | 233 | 20.9% |
| 75 to 84 Years | 117 | 10.5% |
| 85 Years and Over | 18 | 1.6% |
| Total | 1,116 | 100.0% |
Housing Finances in Bean Station
Median Income by Occupancy in Bean Station
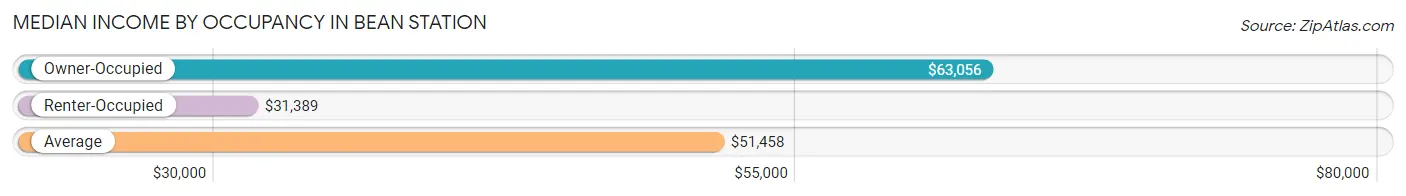
| Occupancy Type | # Households | Median Income |
| Owner-Occupied | 932 (83.5%) | $63,056 |
| Renter-Occupied | 184 (16.5%) | $31,389 |
| Average | 1,116 (100.0%) | $51,458 |
Occupancy by Householder Income Bracket in Bean Station
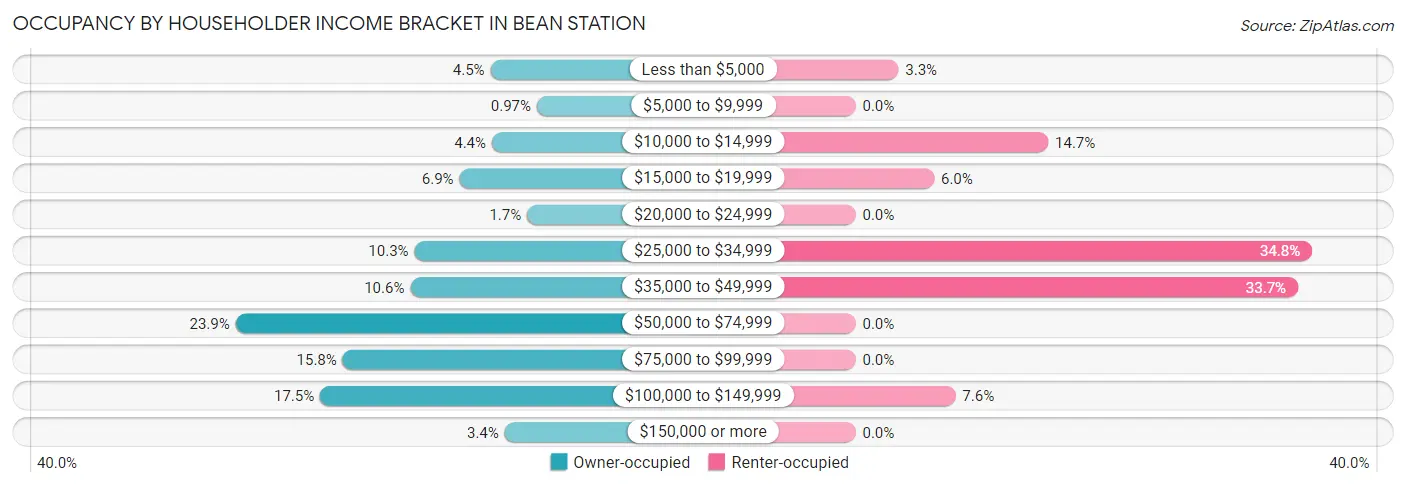
| Income Bracket | Owner-occupied | Renter-occupied |
| Less than $5,000 | 42 (4.5%) | 6 (3.3%) |
| $5,000 to $9,999 | 9 (1.0%) | 0 (0.0%) |
| $10,000 to $14,999 | 41 (4.4%) | 27 (14.7%) |
| $15,000 to $19,999 | 64 (6.9%) | 11 (6.0%) |
| $20,000 to $24,999 | 16 (1.7%) | 0 (0.0%) |
| $25,000 to $34,999 | 96 (10.3%) | 64 (34.8%) |
| $35,000 to $49,999 | 99 (10.6%) | 62 (33.7%) |
| $50,000 to $74,999 | 223 (23.9%) | 0 (0.0%) |
| $75,000 to $99,999 | 147 (15.8%) | 0 (0.0%) |
| $100,000 to $149,999 | 163 (17.5%) | 14 (7.6%) |
| $150,000 or more | 32 (3.4%) | 0 (0.0%) |
| Total | 932 (100.0%) | 184 (100.0%) |
Monthly Housing Cost Tiers in Bean Station
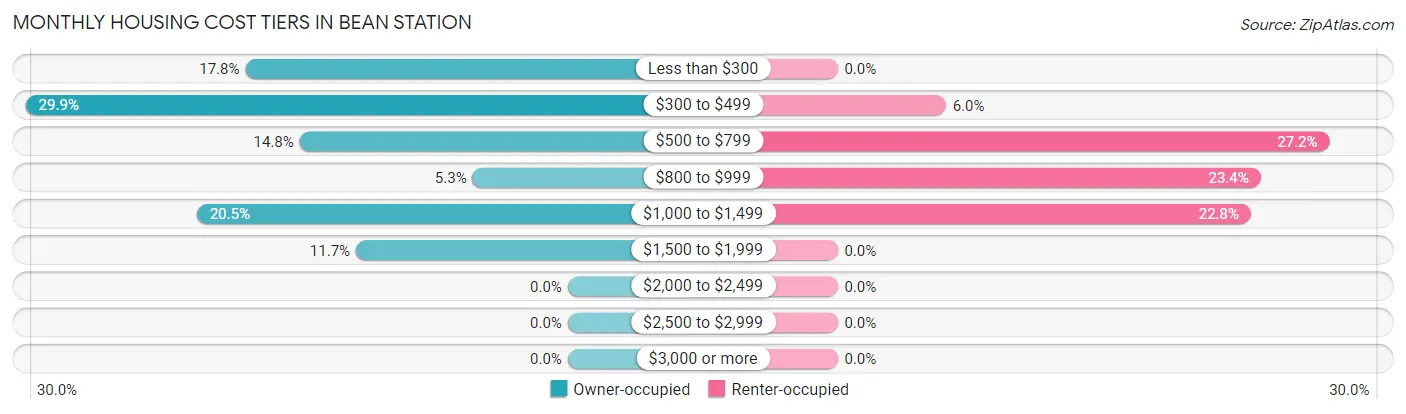
| Monthly Cost | Owner-occupied | Renter-occupied |
| Less than $300 | 166 (17.8%) | 0 (0.0%) |
| $300 to $499 | 279 (29.9%) | 11 (6.0%) |
| $500 to $799 | 138 (14.8%) | 50 (27.2%) |
| $800 to $999 | 49 (5.3%) | 43 (23.4%) |
| $1,000 to $1,499 | 191 (20.5%) | 42 (22.8%) |
| $1,500 to $1,999 | 109 (11.7%) | 0 (0.0%) |
| $2,000 to $2,499 | 0 (0.0%) | 0 (0.0%) |
| $2,500 to $2,999 | 0 (0.0%) | 0 (0.0%) |
| $3,000 or more | 0 (0.0%) | 0 (0.0%) |
| Total | 932 (100.0%) | 184 (100.0%) |
Physical Housing Characteristics in Bean Station
Housing Structures in Bean Station
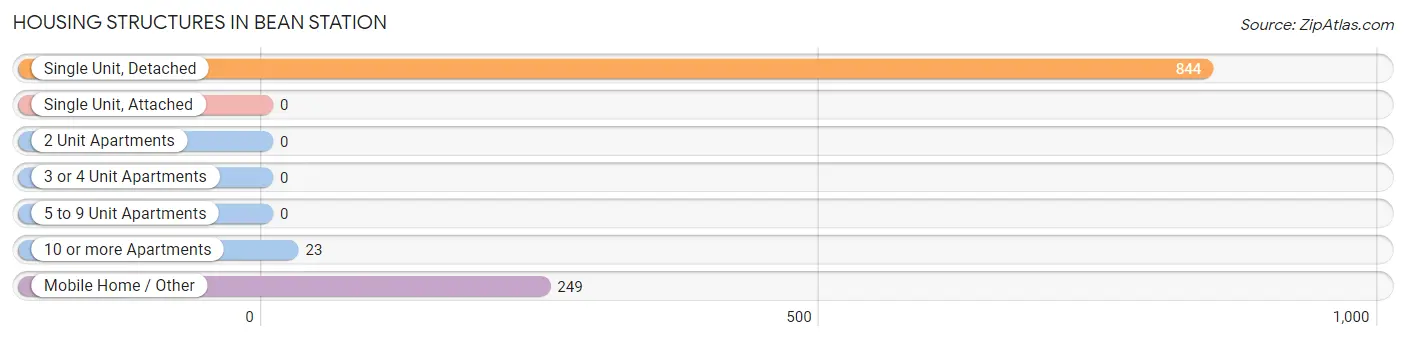
| Structure Type | # Housing Units | % Housing Units |
| Single Unit, Detached | 844 | 75.6% |
| Single Unit, Attached | 0 | 0.0% |
| 2 Unit Apartments | 0 | 0.0% |
| 3 or 4 Unit Apartments | 0 | 0.0% |
| 5 to 9 Unit Apartments | 0 | 0.0% |
| 10 or more Apartments | 23 | 2.1% |
| Mobile Home / Other | 249 | 22.3% |
| Total | 1,116 | 100.0% |
Housing Structures by Occupancy in Bean Station
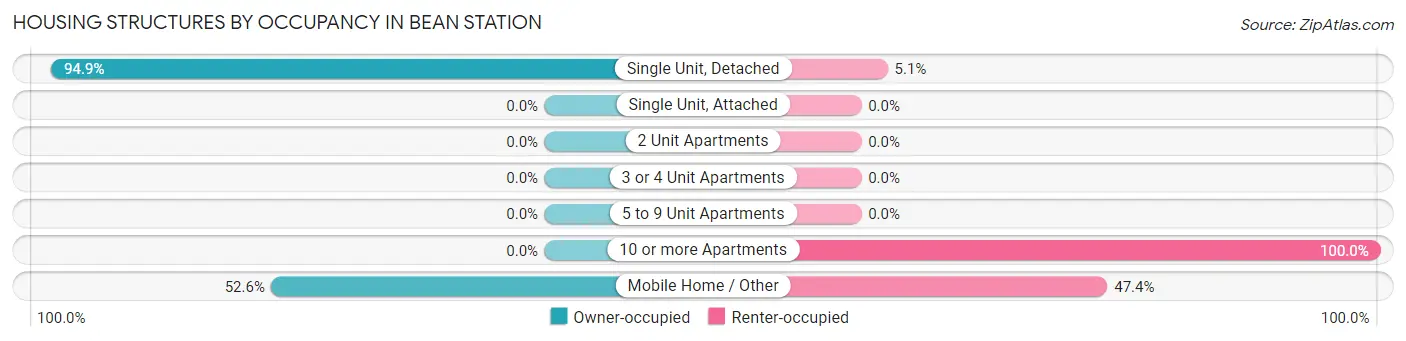
| Structure Type | Owner-occupied | Renter-occupied |
| Single Unit, Detached | 801 (94.9%) | 43 (5.1%) |
| Single Unit, Attached | 0 (0.0%) | 0 (0.0%) |
| 2 Unit Apartments | 0 (0.0%) | 0 (0.0%) |
| 3 or 4 Unit Apartments | 0 (0.0%) | 0 (0.0%) |
| 5 to 9 Unit Apartments | 0 (0.0%) | 0 (0.0%) |
| 10 or more Apartments | 0 (0.0%) | 23 (100.0%) |
| Mobile Home / Other | 131 (52.6%) | 118 (47.4%) |
| Total | 932 (83.5%) | 184 (16.5%) |
Housing Structures by Number of Rooms in Bean Station
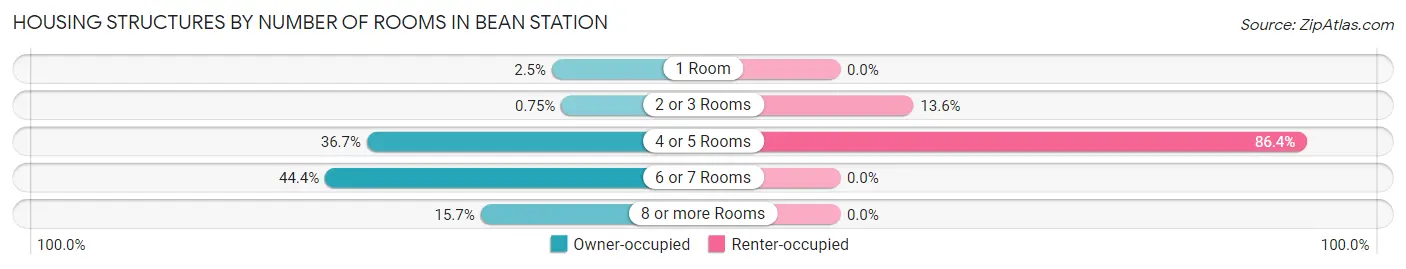
| Number of Rooms | Owner-occupied | Renter-occupied |
| 1 Room | 23 (2.5%) | 0 (0.0%) |
| 2 or 3 Rooms | 7 (0.7%) | 25 (13.6%) |
| 4 or 5 Rooms | 342 (36.7%) | 159 (86.4%) |
| 6 or 7 Rooms | 414 (44.4%) | 0 (0.0%) |
| 8 or more Rooms | 146 (15.7%) | 0 (0.0%) |
| Total | 932 (100.0%) | 184 (100.0%) |
Housing Structure by Heating Type in Bean Station
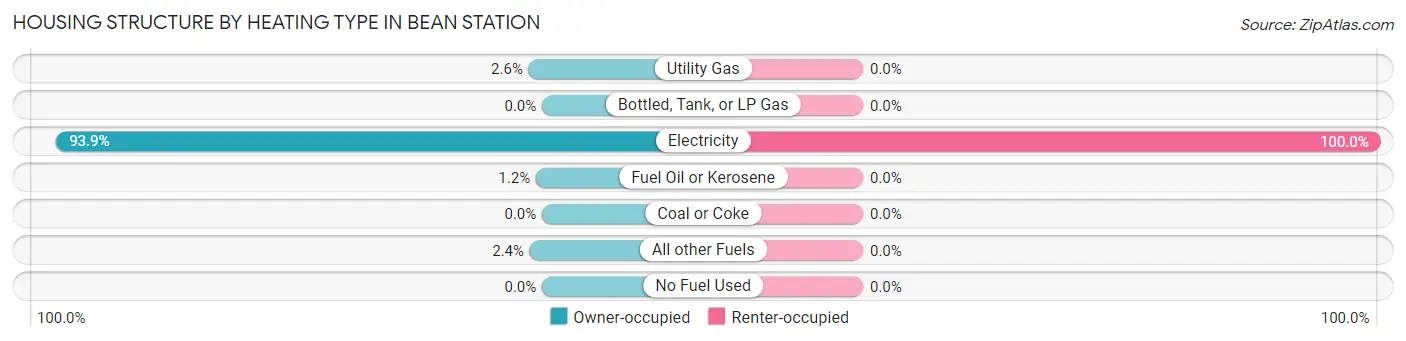
| Heating Type | Owner-occupied | Renter-occupied |
| Utility Gas | 24 (2.6%) | 0 (0.0%) |
| Bottled, Tank, or LP Gas | 0 (0.0%) | 0 (0.0%) |
| Electricity | 875 (93.9%) | 184 (100.0%) |
| Fuel Oil or Kerosene | 11 (1.2%) | 0 (0.0%) |
| Coal or Coke | 0 (0.0%) | 0 (0.0%) |
| All other Fuels | 22 (2.4%) | 0 (0.0%) |
| No Fuel Used | 0 (0.0%) | 0 (0.0%) |
| Total | 932 (100.0%) | 184 (100.0%) |
Household Vehicle Usage in Bean Station
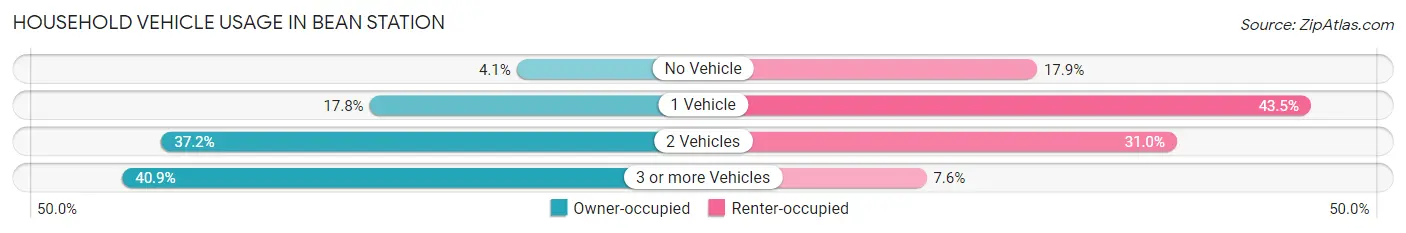
| Vehicles per Household | Owner-occupied | Renter-occupied |
| No Vehicle | 38 (4.1%) | 33 (17.9%) |
| 1 Vehicle | 166 (17.8%) | 80 (43.5%) |
| 2 Vehicles | 347 (37.2%) | 57 (31.0%) |
| 3 or more Vehicles | 381 (40.9%) | 14 (7.6%) |
| Total | 932 (100.0%) | 184 (100.0%) |
Real Estate & Mortgages in Bean Station
Real Estate and Mortgage Overview in Bean Station
| Characteristic | Without Mortgage | With Mortgage |
| Housing Units | 525 | 407 |
| Median Property Value | $121,500 | $170,700 |
| Median Household Income | $42,946 | $15 |
| Monthly Housing Costs | $340 | $0 |
| Real Estate Taxes | $677 | $26 |
Property Value by Mortgage Status in Bean Station
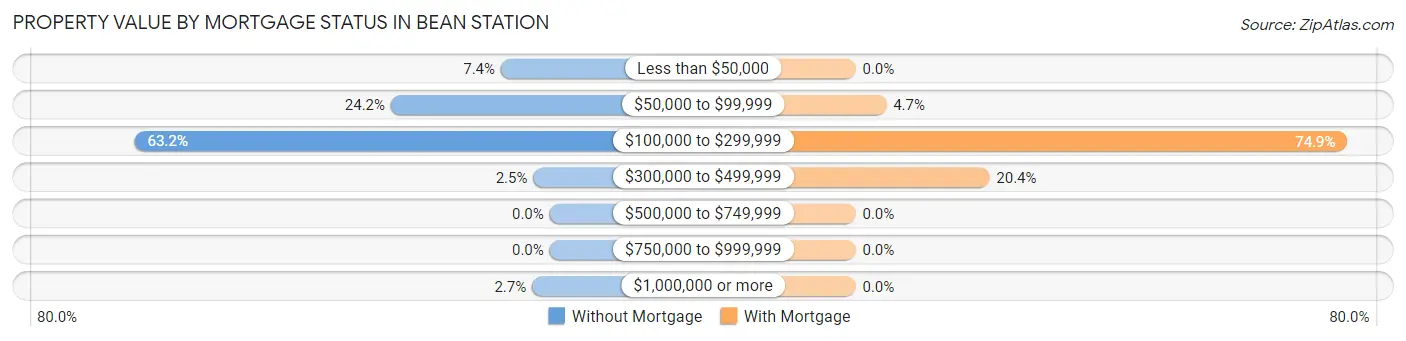
| Property Value | Without Mortgage | With Mortgage |
| Less than $50,000 | 39 (7.4%) | 0 (0.0%) |
| $50,000 to $99,999 | 127 (24.2%) | 19 (4.7%) |
| $100,000 to $299,999 | 332 (63.2%) | 305 (74.9%) |
| $300,000 to $499,999 | 13 (2.5%) | 83 (20.4%) |
| $500,000 to $749,999 | 0 (0.0%) | 0 (0.0%) |
| $750,000 to $999,999 | 0 (0.0%) | 0 (0.0%) |
| $1,000,000 or more | 14 (2.7%) | 0 (0.0%) |
| Total | 525 (100.0%) | 407 (100.0%) |
Household Income by Mortgage Status in Bean Station
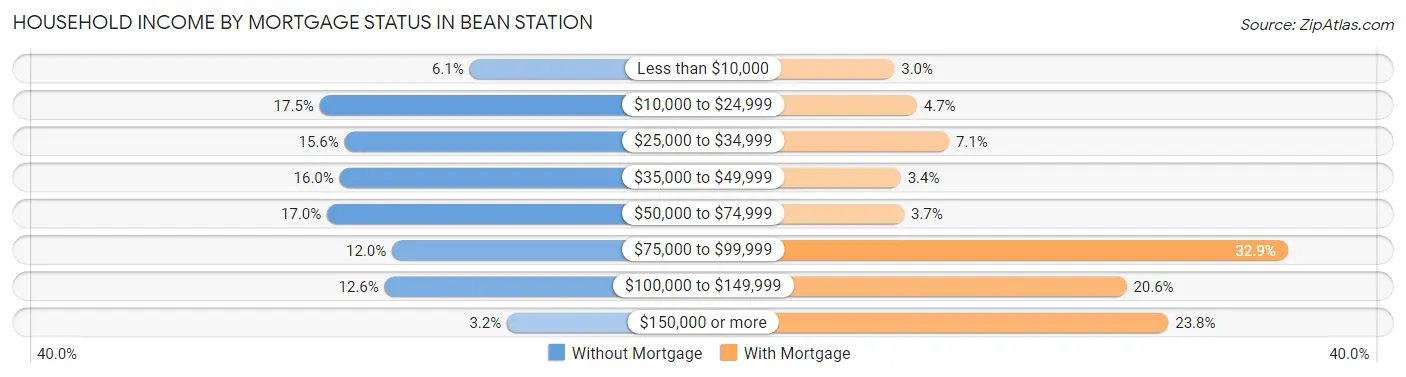
| Household Income | Without Mortgage | With Mortgage |
| Less than $10,000 | 32 (6.1%) | 12 (2.9%) |
| $10,000 to $24,999 | 92 (17.5%) | 19 (4.7%) |
| $25,000 to $34,999 | 82 (15.6%) | 29 (7.1%) |
| $35,000 to $49,999 | 84 (16.0%) | 14 (3.4%) |
| $50,000 to $74,999 | 89 (17.0%) | 15 (3.7%) |
| $75,000 to $99,999 | 63 (12.0%) | 134 (32.9%) |
| $100,000 to $149,999 | 66 (12.6%) | 84 (20.6%) |
| $150,000 or more | 17 (3.2%) | 97 (23.8%) |
| Total | 525 (100.0%) | 407 (100.0%) |
Property Value to Household Income Ratio in Bean Station
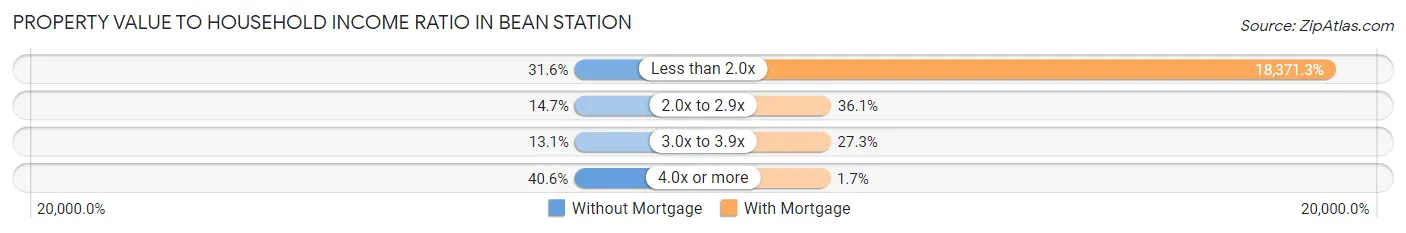
| Value-to-Income Ratio | Without Mortgage | With Mortgage |
| Less than 2.0x | 166 (31.6%) | 74,771 (18,371.3%) |
| 2.0x to 2.9x | 77 (14.7%) | 147 (36.1%) |
| 3.0x to 3.9x | 69 (13.1%) | 111 (27.3%) |
| 4.0x or more | 213 (40.6%) | 7 (1.7%) |
| Total | 525 (100.0%) | 407 (100.0%) |
Real Estate Taxes by Mortgage Status in Bean Station
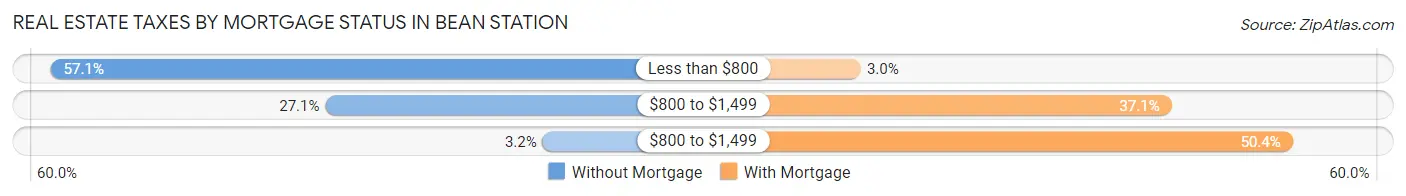
| Property Taxes | Without Mortgage | With Mortgage |
| Less than $800 | 300 (57.1%) | 12 (2.9%) |
| $800 to $1,499 | 142 (27.1%) | 151 (37.1%) |
| $800 to $1,499 | 17 (3.2%) | 205 (50.4%) |
| Total | 525 (100.0%) | 407 (100.0%) |
Health & Disability in Bean Station
Health Insurance Coverage by Age in Bean Station
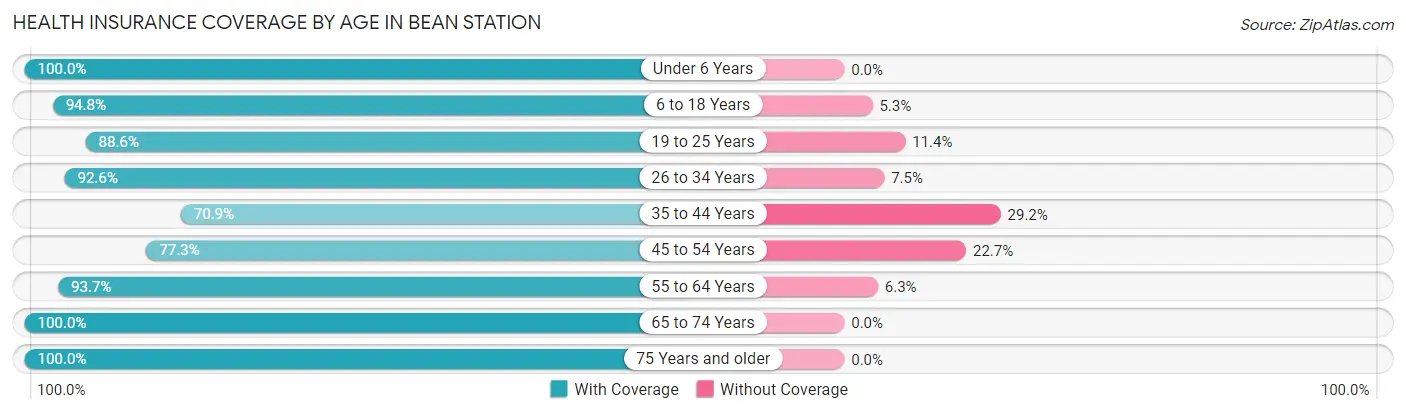
| Age Bracket | With Coverage | Without Coverage |
| Under 6 Years | 126 (100.0%) | 0 (0.0%) |
| 6 to 18 Years | 397 (94.8%) | 22 (5.2%) |
| 19 to 25 Years | 109 (88.6%) | 14 (11.4%) |
| 26 to 34 Years | 410 (92.5%) | 33 (7.4%) |
| 35 to 44 Years | 243 (70.9%) | 100 (29.1%) |
| 45 to 54 Years | 337 (77.3%) | 99 (22.7%) |
| 55 to 64 Years | 449 (93.7%) | 30 (6.3%) |
| 65 to 74 Years | 405 (100.0%) | 0 (0.0%) |
| 75 Years and older | 189 (100.0%) | 0 (0.0%) |
| Total | 2,665 (89.9%) | 298 (10.1%) |
Health Insurance Coverage by Citizenship Status in Bean Station
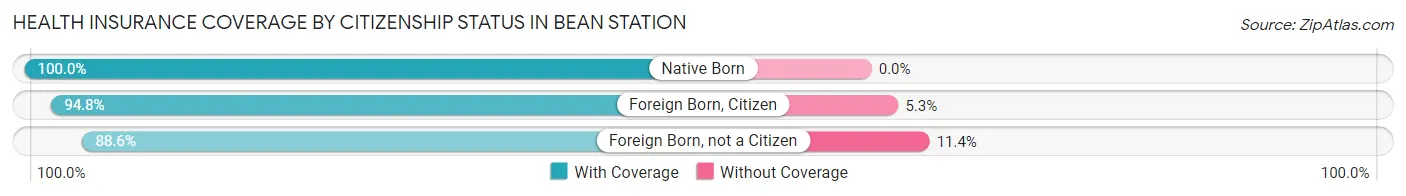
| Citizenship Status | With Coverage | Without Coverage |
| Native Born | 126 (100.0%) | 0 (0.0%) |
| Foreign Born, Citizen | 397 (94.8%) | 22 (5.2%) |
| Foreign Born, not a Citizen | 109 (88.6%) | 14 (11.4%) |
Health Insurance Coverage by Household Income in Bean Station
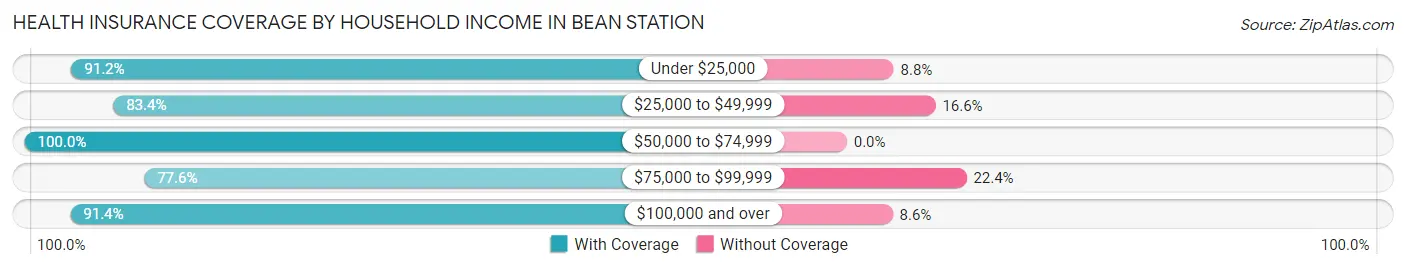
| Household Income | With Coverage | Without Coverage |
| Under $25,000 | 312 (91.2%) | 30 (8.8%) |
| $25,000 to $49,999 | 502 (83.4%) | 100 (16.6%) |
| $50,000 to $74,999 | 795 (100.0%) | 0 (0.0%) |
| $75,000 to $99,999 | 353 (77.6%) | 102 (22.4%) |
| $100,000 and over | 703 (91.4%) | 66 (8.6%) |
Public vs Private Health Insurance Coverage by Age in Bean Station
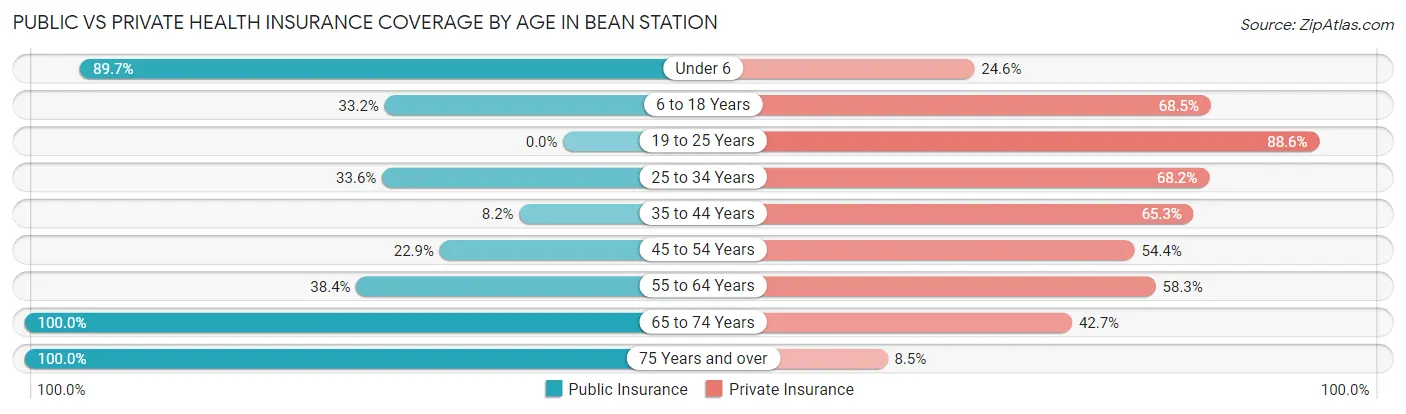
| Age Bracket | Public Insurance | Private Insurance |
| Under 6 | 113 (89.7%) | 31 (24.6%) |
| 6 to 18 Years | 139 (33.2%) | 287 (68.5%) |
| 19 to 25 Years | 0 (0.0%) | 109 (88.6%) |
| 25 to 34 Years | 149 (33.6%) | 302 (68.2%) |
| 35 to 44 Years | 28 (8.2%) | 224 (65.3%) |
| 45 to 54 Years | 100 (22.9%) | 237 (54.4%) |
| 55 to 64 Years | 184 (38.4%) | 279 (58.3%) |
| 65 to 74 Years | 405 (100.0%) | 173 (42.7%) |
| 75 Years and over | 189 (100.0%) | 16 (8.5%) |
| Total | 1,307 (44.1%) | 1,658 (56.0%) |
Disability Status by Sex by Age in Bean Station
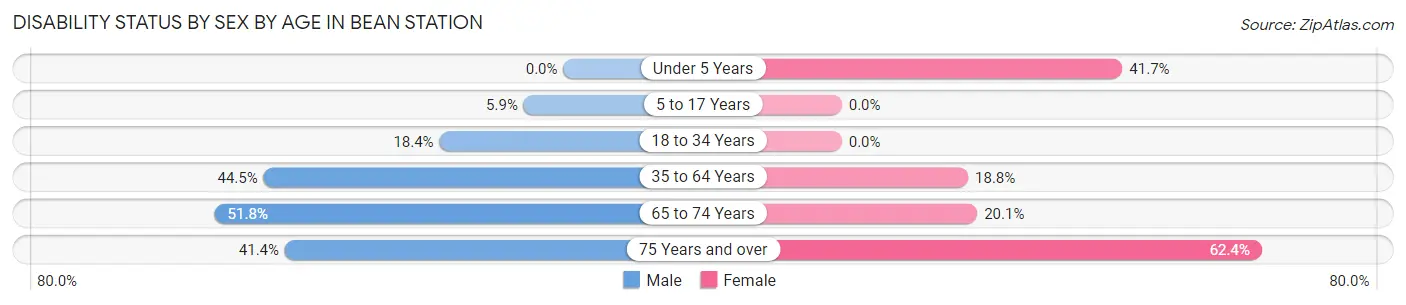
| Age Bracket | Male | Female |
| Under 5 Years | 0 (0.0%) | 25 (41.7%) |
| 5 to 17 Years | 13 (5.9%) | 0 (0.0%) |
| 18 to 34 Years | 60 (18.4%) | 0 (0.0%) |
| 35 to 64 Years | 280 (44.5%) | 118 (18.8%) |
| 65 to 74 Years | 117 (51.8%) | 36 (20.1%) |
| 75 Years and over | 43 (41.3%) | 53 (62.4%) |
Disability Class by Sex by Age in Bean Station
Disability Class: Hearing Difficulty
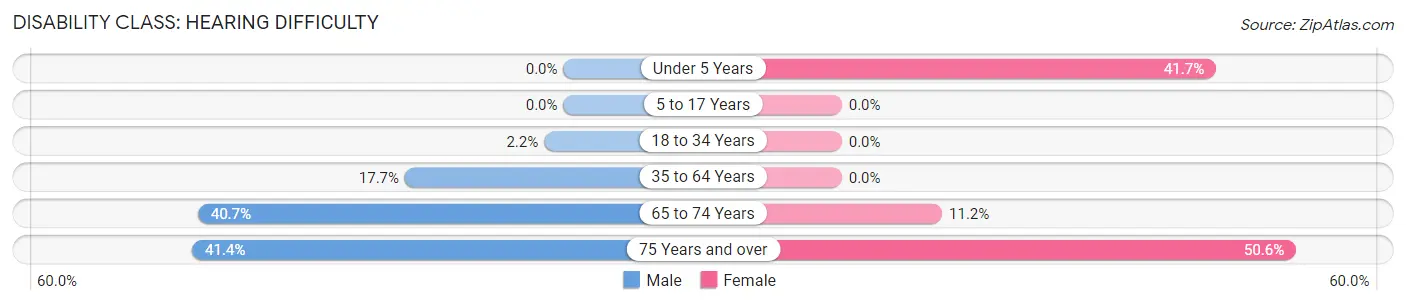
| Age Bracket | Male | Female |
| Under 5 Years | 0 (0.0%) | 25 (41.7%) |
| 5 to 17 Years | 0 (0.0%) | 0 (0.0%) |
| 18 to 34 Years | 7 (2.1%) | 0 (0.0%) |
| 35 to 64 Years | 111 (17.6%) | 0 (0.0%) |
| 65 to 74 Years | 92 (40.7%) | 20 (11.2%) |
| 75 Years and over | 43 (41.3%) | 43 (50.6%) |
Disability Class: Vision Difficulty
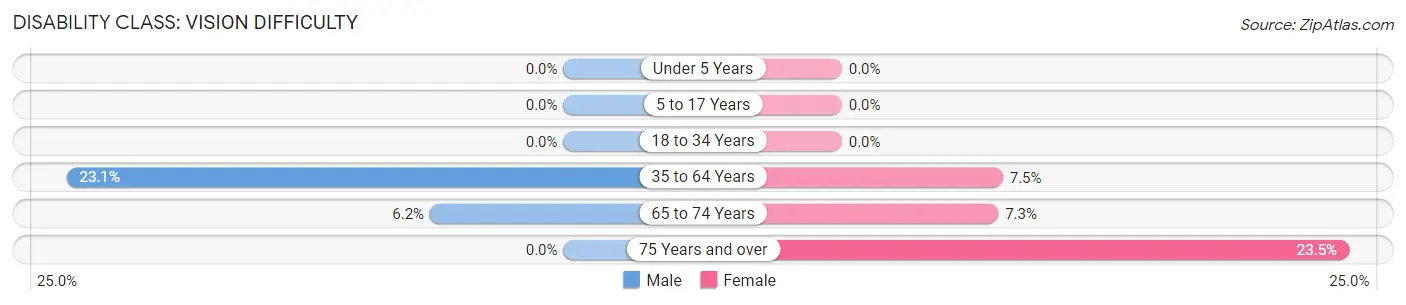
| Age Bracket | Male | Female |
| Under 5 Years | 0 (0.0%) | 0 (0.0%) |
| 5 to 17 Years | 0 (0.0%) | 0 (0.0%) |
| 18 to 34 Years | 0 (0.0%) | 0 (0.0%) |
| 35 to 64 Years | 145 (23.1%) | 47 (7.5%) |
| 65 to 74 Years | 14 (6.2%) | 13 (7.3%) |
| 75 Years and over | 0 (0.0%) | 20 (23.5%) |
Disability Class: Cognitive Difficulty
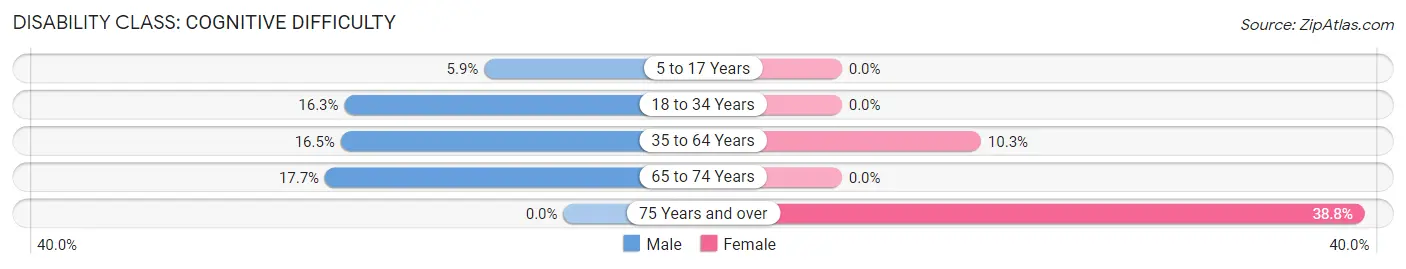
| Age Bracket | Male | Female |
| 5 to 17 Years | 13 (5.9%) | 0 (0.0%) |
| 18 to 34 Years | 53 (16.3%) | 0 (0.0%) |
| 35 to 64 Years | 104 (16.5%) | 65 (10.3%) |
| 65 to 74 Years | 40 (17.7%) | 0 (0.0%) |
| 75 Years and over | 0 (0.0%) | 33 (38.8%) |
Disability Class: Ambulatory Difficulty
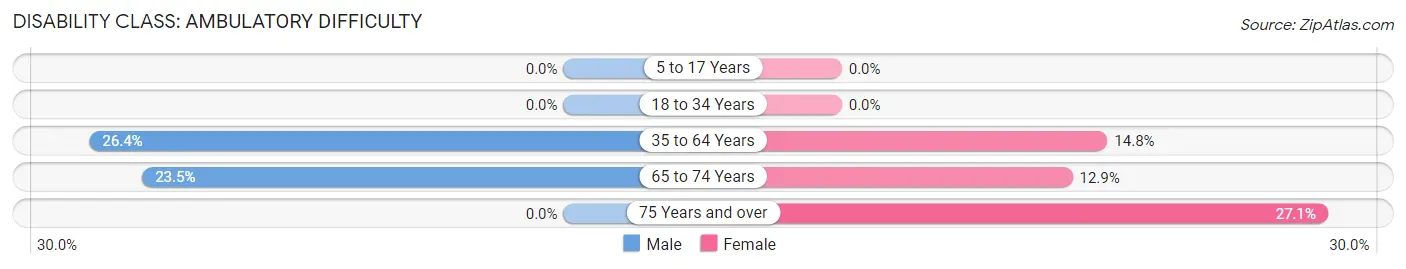
| Age Bracket | Male | Female |
| 5 to 17 Years | 0 (0.0%) | 0 (0.0%) |
| 18 to 34 Years | 0 (0.0%) | 0 (0.0%) |
| 35 to 64 Years | 166 (26.4%) | 93 (14.8%) |
| 65 to 74 Years | 53 (23.4%) | 23 (12.9%) |
| 75 Years and over | 0 (0.0%) | 23 (27.1%) |
Disability Class: Self-Care Difficulty
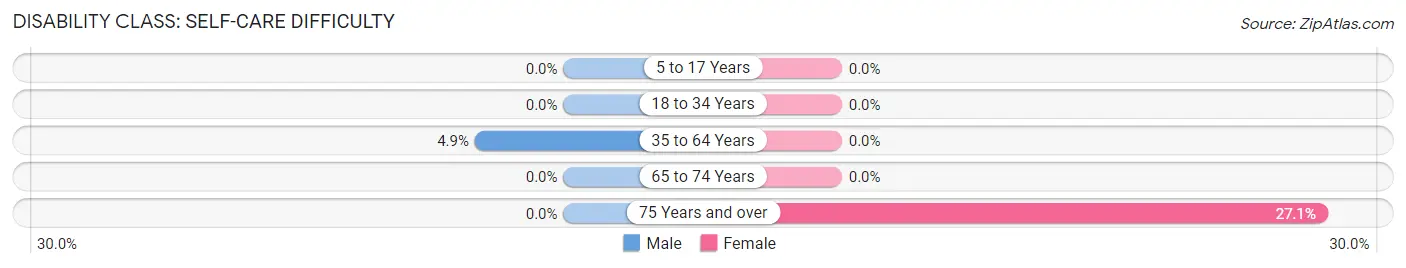
| Age Bracket | Male | Female |
| 5 to 17 Years | 0 (0.0%) | 0 (0.0%) |
| 18 to 34 Years | 0 (0.0%) | 0 (0.0%) |
| 35 to 64 Years | 31 (4.9%) | 0 (0.0%) |
| 65 to 74 Years | 0 (0.0%) | 0 (0.0%) |
| 75 Years and over | 0 (0.0%) | 23 (27.1%) |
Technology Access in Bean Station
Computing Device Access in Bean Station
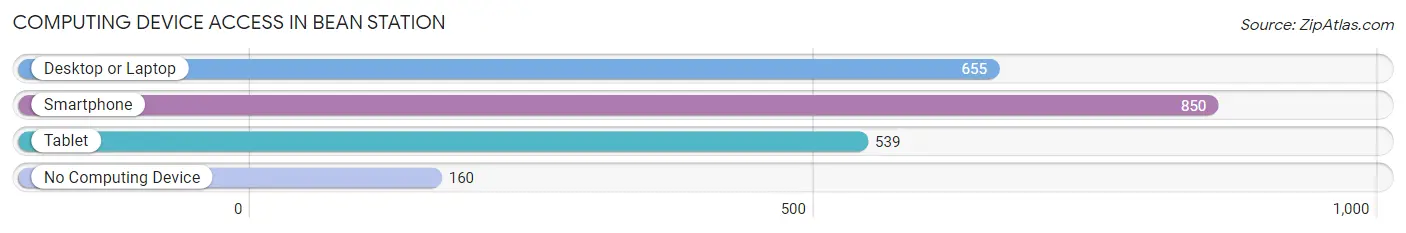
| Device Type | # Households | % Households |
| Desktop or Laptop | 655 | 58.7% |
| Smartphone | 850 | 76.2% |
| Tablet | 539 | 48.3% |
| No Computing Device | 160 | 14.3% |
| Total | 1,116 | 100.0% |
Internet Access in Bean Station
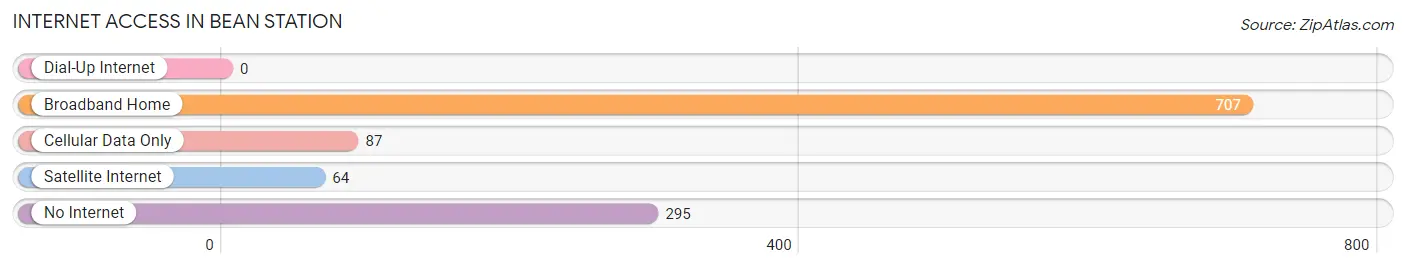
| Internet Type | # Households | % Households |
| Dial-Up Internet | 0 | 0.0% |
| Broadband Home | 707 | 63.3% |
| Cellular Data Only | 87 | 7.8% |
| Satellite Internet | 64 | 5.7% |
| No Internet | 295 | 26.4% |
| Total | 1,116 | 100.0% |
Bean Station Summary
Bean Station, Tennessee is a small town located in Grainger County, in the eastern part of the state. It is situated along the banks of Cherokee Lake, and is part of the Morristown, Tennessee Metropolitan Statistical Area. The town has a population of approximately 2,000 people, and is known for its rural charm and friendly atmosphere.
History
Bean Station was founded in 1786 by William Bean, who was the first settler in the area. He was a Revolutionary War veteran, and he named the town after himself. The town was originally known as Bean's Station, but the name was eventually shortened to Bean Station.
In the early 19th century, Bean Station was a thriving community, with a number of businesses and industries. The town was home to a cotton mill, a grist mill, a sawmill, and a tannery. The town also had a number of stores, including a general store, a drug store, and a hardware store.
In the late 19th century, Bean Station began to decline. The cotton mill closed in 1891, and the other businesses soon followed. The town was left with little industry, and the population began to decline.
Geography
Bean Station is located in eastern Tennessee, in Grainger County. It is situated along the banks of Cherokee Lake, which is a reservoir created by the Tennessee Valley Authority in the 1940s. The lake is a popular destination for fishing, boating, and other recreational activities.
The town is located in the foothills of the Great Smoky Mountains, and is surrounded by rolling hills and lush forests. The town is located near the junction of Interstate 81 and US Highway 11E, which makes it easily accessible from other parts of the state.
Economy
Bean Station is a small, rural town, and the economy is largely based on agriculture. The town is home to a number of farms, which produce a variety of crops, including corn, soybeans, and hay. The town also has a number of small businesses, including restaurants, convenience stores, and auto repair shops.
The town is also home to a number of manufacturing companies, including a furniture factory, a plastics factory, and a metal fabrication plant. These companies provide employment for many of the town's residents.
Demographics
As of the 2010 census, Bean Station had a population of 2,037 people. The racial makeup of the town was 97.3% White, 0.7% African American, 0.3% Native American, 0.2% Asian, 0.1% Pacific Islander, 0.3% from other races, and 1.2% from two or more races. Hispanic or Latino of any race were 1.2% of the population.
The median household income in Bean Station was $31,250, and the median family income was $37,500. The per capita income for the town was $17,845. About 17.2% of the population was below the poverty line.
Bean Station is a small, rural town with a friendly atmosphere and a strong sense of community. The town is home to a number of businesses and industries, and the economy is largely based on agriculture. The town is also home to a number of manufacturing companies, which provide employment for many of the town's residents.
Common Questions
What is Per Capita Income in Bean Station?
Per Capita income in Bean Station is $27,370.
What is the Median Family Income in Bean Station?
Median Family Income in Bean Station is $73,445.
What is the Median Household income in Bean Station?
Median Household Income in Bean Station is $51,458.
What is Income or Wage Gap in Bean Station?
Income or Wage Gap in Bean Station is 16.1%.
Women in Bean Station earn 83.9 cents for every dollar earned by a man.
What is Inequality or Gini Index in Bean Station?
Inequality or Gini Index in Bean Station is 0.46.
What is the Total Population of Bean Station?
Total Population of Bean Station is 2,963.
What is the Total Male Population of Bean Station?
Total Male Population of Bean Station is 1,564.
What is the Total Female Population of Bean Station?
Total Female Population of Bean Station is 1,399.
What is the Ratio of Males per 100 Females in Bean Station?
There are 111.79 Males per 100 Females in Bean Station.
What is the Ratio of Females per 100 Males in Bean Station?
There are 89.45 Females per 100 Males in Bean Station.
What is the Median Population Age in Bean Station?
Median Population Age in Bean Station is 45.8 Years.
What is the Average Family Size in Bean Station
Average Family Size in Bean Station is 3.1 People.
What is the Average Household Size in Bean Station
Average Household Size in Bean Station is 2.7 People.
How Large is the Labor Force in Bean Station?
There are 1,397 People in the Labor Forcein in Bean Station.
What is the Percentage of People in the Labor Force in Bean Station?
54.2% of People are in the Labor Force in Bean Station.
What is the Unemployment Rate in Bean Station?
Unemployment Rate in Bean Station is 3.3%.