Atwood, TN Map & Demographics
Atwood Map
Atwood Overview
$16,581
PER CAPITA INCOME
$46,875
AVG FAMILY INCOME
$34,926
AVG HOUSEHOLD INCOME
23.9%
WAGE / INCOME GAP [ % ]
76.1¢/ $1
WAGE / INCOME GAP [ $ ]
0.35
INEQUALITY / GINI INDEX
1,229
TOTAL POPULATION
572
MALE POPULATION
657
FEMALE POPULATION
87.06
MALES / 100 FEMALES
114.86
FEMALES / 100 MALES
30.1
MEDIAN AGE
3.2
AVG FAMILY SIZE
2.7
AVG HOUSEHOLD SIZE
527
LABOR FORCE [ PEOPLE ]
61.8%
PERCENT IN LABOR FORCE
12.7%
UNEMPLOYMENT RATE
Atwood Zip Codes
Atwood Area Codes
Income in Atwood
Income Overview in Atwood
Per Capita Income in Atwood is $16,581, while median incomes of families and households are $46,875 and $34,926 respectively.
| Characteristic | Number | Measure |
| Per Capita Income | 1,229 | $16,581 |
| Median Family Income | 331 | $46,875 |
| Mean Family Income | 331 | $49,942 |
| Median Household Income | 457 | $34,926 |
| Mean Household Income | 457 | $44,609 |
| Income Deficit | 331 | $0 |
| Wage / Income Gap (%) | 1,229 | 23.89% |
| Wage / Income Gap ($) | 1,229 | 76.11¢ per $1 |
| Gini / Inequality Index | 1,229 | 0.35 |
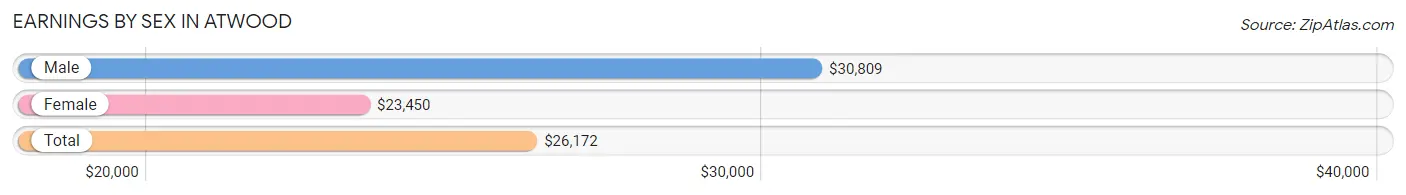
Earnings by Sex in Atwood
Average Earnings in Atwood are $26,172, $30,809 for men and $23,450 for women, a difference of 23.9%.
| Sex | Number | Average Earnings |
| Male | 235 (47.4%) | $30,809 |
| Female | 261 (52.6%) | $23,450 |
| Total | 496 (100.0%) | $26,172 |
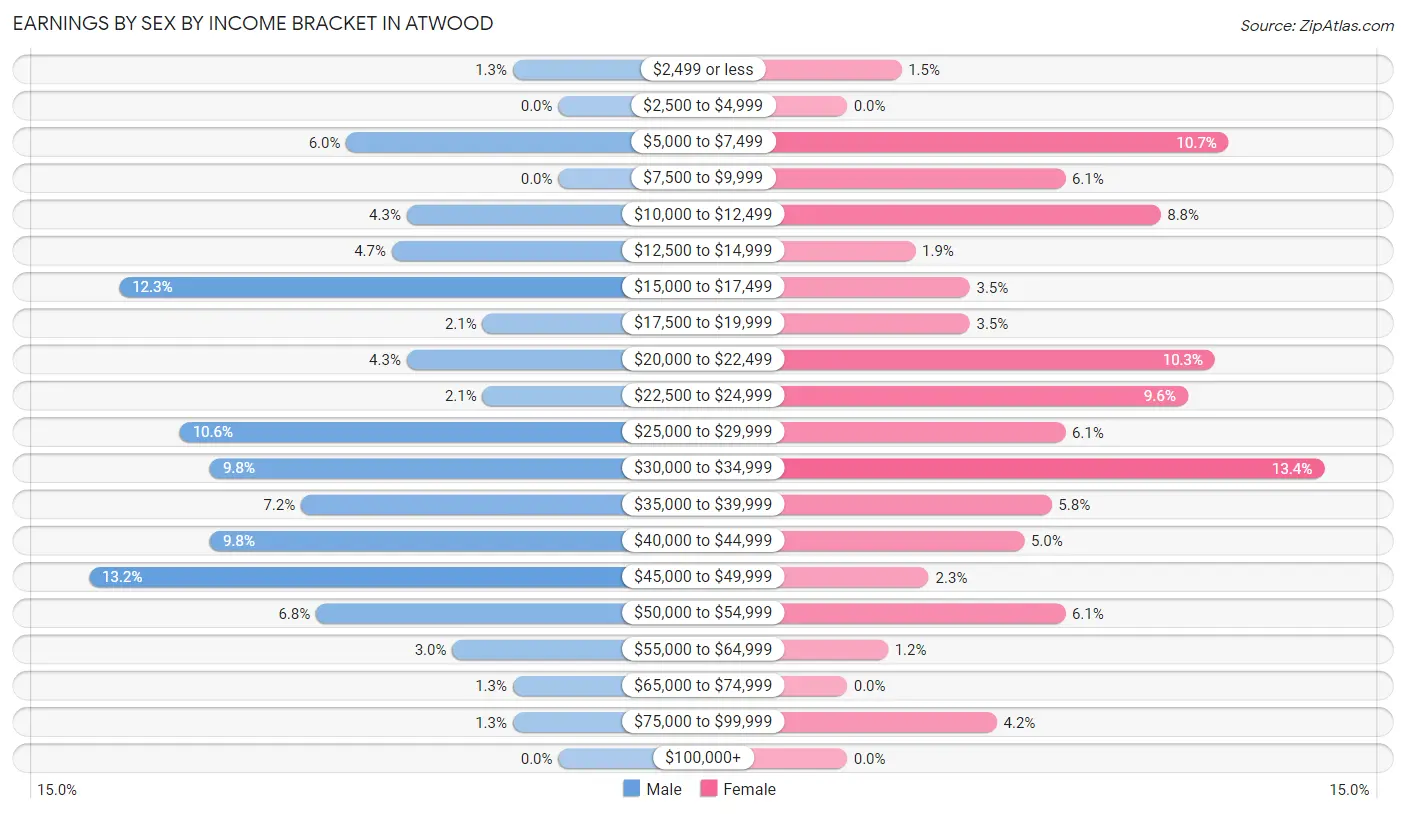
Earnings by Sex by Income Bracket in Atwood
The most common earnings brackets in Atwood are $45,000 to $49,999 for men (31 | 13.2%) and $30,000 to $34,999 for women (35 | 13.4%).
| Income | Male | Female |
| $2,499 or less | 3 (1.3%) | 4 (1.5%) |
| $2,500 to $4,999 | 0 (0.0%) | 0 (0.0%) |
| $5,000 to $7,499 | 14 (6.0%) | 28 (10.7%) |
| $7,500 to $9,999 | 0 (0.0%) | 16 (6.1%) |
| $10,000 to $12,499 | 10 (4.3%) | 23 (8.8%) |
| $12,500 to $14,999 | 11 (4.7%) | 5 (1.9%) |
| $15,000 to $17,499 | 29 (12.3%) | 9 (3.5%) |
| $17,500 to $19,999 | 5 (2.1%) | 9 (3.5%) |
| $20,000 to $22,499 | 10 (4.3%) | 27 (10.3%) |
| $22,500 to $24,999 | 5 (2.1%) | 25 (9.6%) |
| $25,000 to $29,999 | 25 (10.6%) | 16 (6.1%) |
| $30,000 to $34,999 | 23 (9.8%) | 35 (13.4%) |
| $35,000 to $39,999 | 17 (7.2%) | 15 (5.8%) |
| $40,000 to $44,999 | 23 (9.8%) | 13 (5.0%) |
| $45,000 to $49,999 | 31 (13.2%) | 6 (2.3%) |
| $50,000 to $54,999 | 16 (6.8%) | 16 (6.1%) |
| $55,000 to $64,999 | 7 (3.0%) | 3 (1.1%) |
| $65,000 to $74,999 | 3 (1.3%) | 0 (0.0%) |
| $75,000 to $99,999 | 3 (1.3%) | 11 (4.2%) |
| $100,000+ | 0 (0.0%) | 0 (0.0%) |
| Total | 235 (100.0%) | 261 (100.0%) |
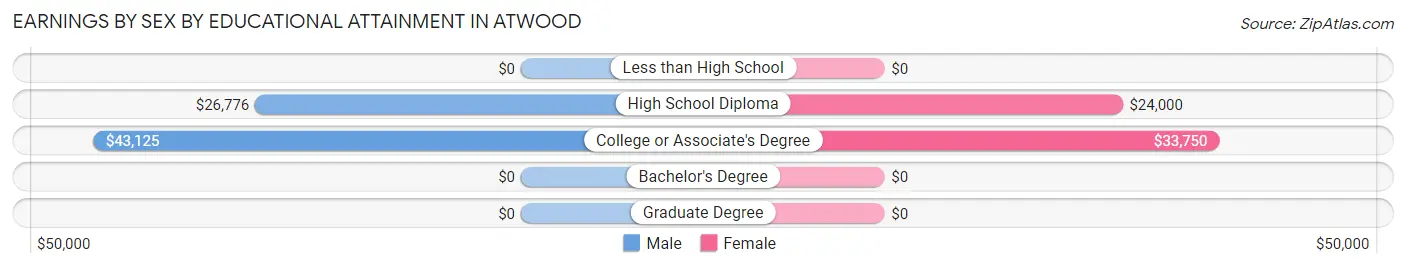
Earnings by Sex by Educational Attainment in Atwood
Average earnings in Atwood are $30,294 for men and $30,272 for women, a difference of 0.1%. Men with an educational attainment of college or associate's degree enjoy the highest average annual earnings of $43,125, while those with high school diploma education earn the least with $26,776. Women with an educational attainment of college or associate's degree earn the most with the average annual earnings of $33,750, while those with high school diploma education have the smallest earnings of $24,000.
| Educational Attainment | Male Income | Female Income |
| Less than High School | - | - |
| High School Diploma | $26,776 | $24,000 |
| College or Associate's Degree | $43,125 | $33,750 |
| Bachelor's Degree | - | - |
| Graduate Degree | - | - |
| Total | $30,294 | $30,272 |
Family Income in Atwood
Family Income Brackets in Atwood
According to the Atwood family income data, there are 78 families falling into the $50,000 to $74,999 income range, which is the most common income bracket and makes up 23.6% of all families.
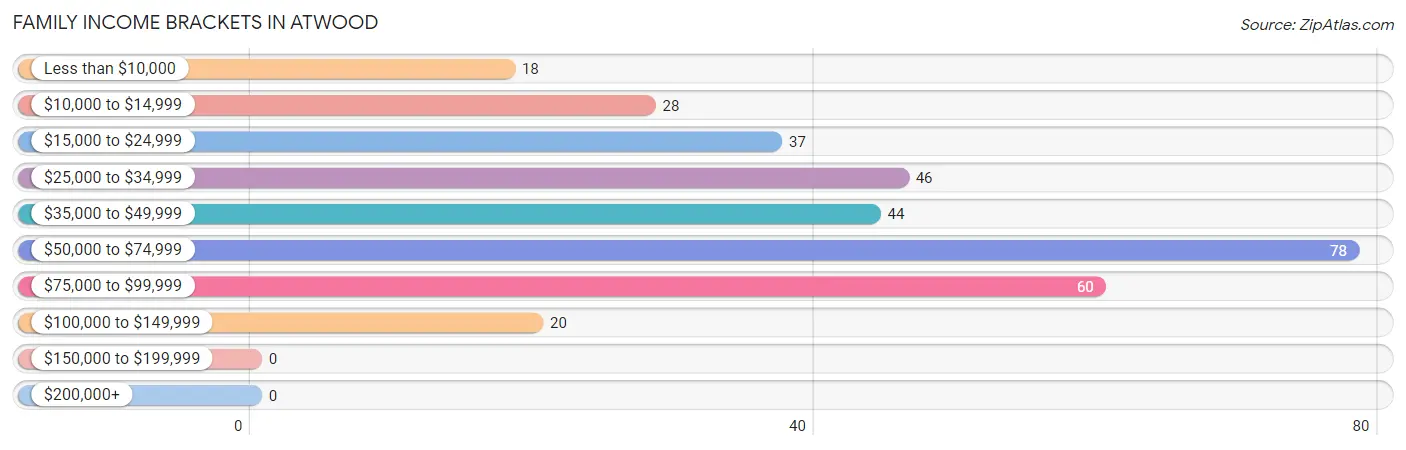
| Income Bracket | # Families | % Families |
| Less than $10,000 | 18 | 5.4% |
| $10,000 to $14,999 | 28 | 8.5% |
| $15,000 to $24,999 | 37 | 11.2% |
| $25,000 to $34,999 | 46 | 13.9% |
| $35,000 to $49,999 | 44 | 13.3% |
| $50,000 to $74,999 | 78 | 23.6% |
| $75,000 to $99,999 | 60 | 18.1% |
| $100,000 to $149,999 | 20 | 6.0% |
| $150,000 to $199,999 | 0 | 0.0% |
| $200,000+ | 0 | 0.0% |
Family Income by Famaliy Size in Atwood
4-person families (114 | 34.4%) account for the highest median family income in Atwood with $58,929 per family, while 2-person families (172 | 52.0%) have the highest median income of $22,590 per family member.
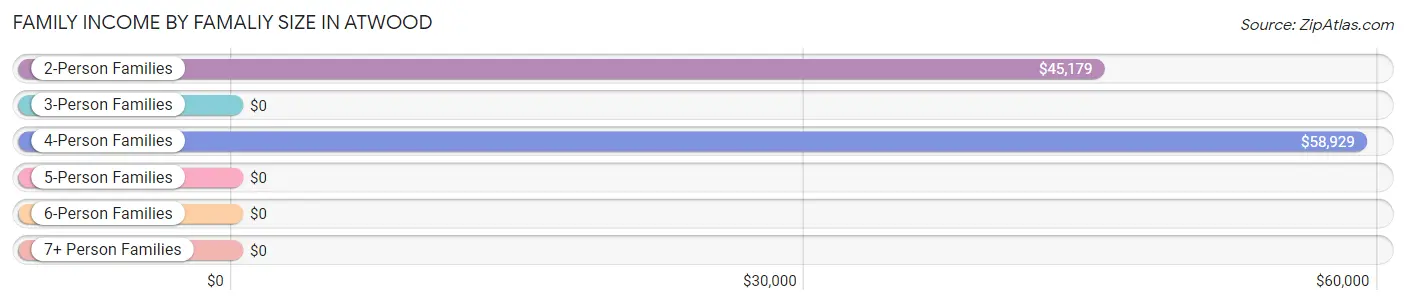
| Income Bracket | # Families | Median Income |
| 2-Person Families | 172 (52.0%) | $45,179 |
| 3-Person Families | 18 (5.4%) | $0 |
| 4-Person Families | 114 (34.4%) | $58,929 |
| 5-Person Families | 13 (3.9%) | $0 |
| 6-Person Families | 11 (3.3%) | $0 |
| 7+ Person Families | 3 (0.9%) | $0 |
| Total | 331 (100.0%) | $46,875 |
Family Income by Number of Earners in Atwood
The median family income in Atwood is $46,875, with families comprising 3+ earners (8) having the highest median family income of $110,500, while families with no earners (73) have the lowest median family income of $24,107, accounting for 2.4% and 22.1% of families, respectively.
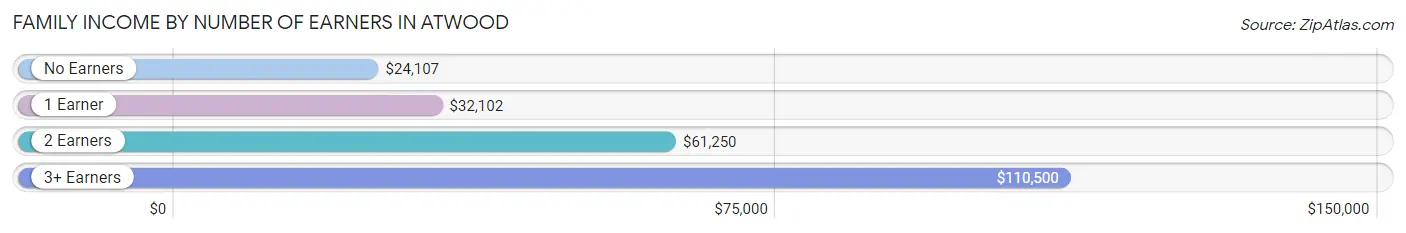
| Number of Earners | # Families | Median Income |
| No Earners | 73 (22.1%) | $24,107 |
| 1 Earner | 125 (37.8%) | $32,102 |
| 2 Earners | 125 (37.8%) | $61,250 |
| 3+ Earners | 8 (2.4%) | $110,500 |
| Total | 331 (100.0%) | $46,875 |
Household Income in Atwood
Household Income Brackets in Atwood
With 100 households falling in the category, the $25,000 to $34,999 income range is the most frequent in Atwood, accounting for 21.9% of all households.
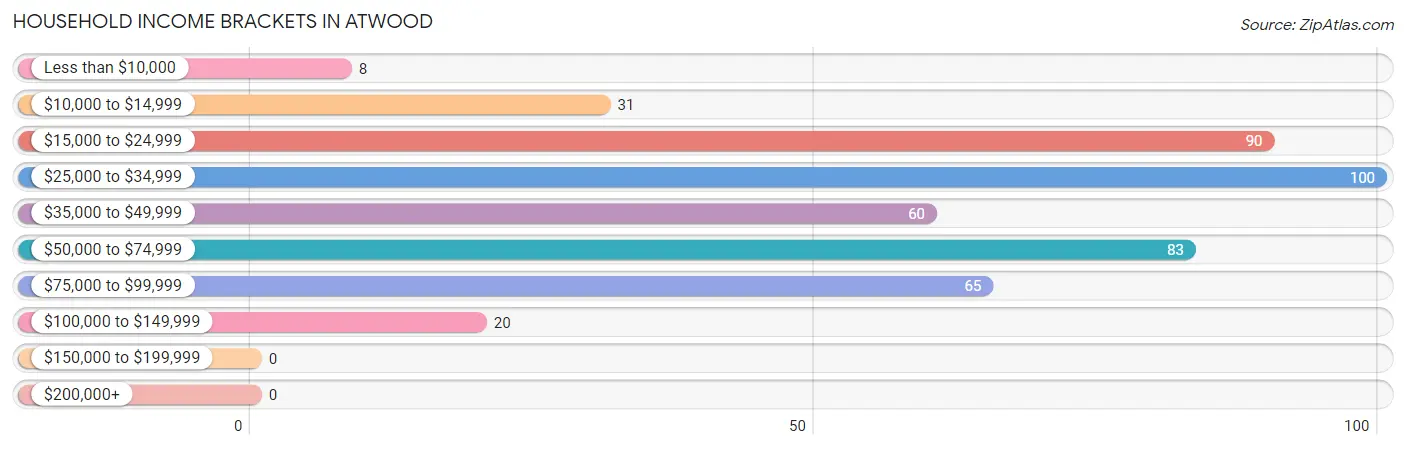
| Income Bracket | # Households | % Households |
| Less than $10,000 | 8 | 1.8% |
| $10,000 to $14,999 | 31 | 6.8% |
| $15,000 to $24,999 | 90 | 19.7% |
| $25,000 to $34,999 | 100 | 21.9% |
| $35,000 to $49,999 | 60 | 13.1% |
| $50,000 to $74,999 | 83 | 18.2% |
| $75,000 to $99,999 | 65 | 14.2% |
| $100,000 to $149,999 | 20 | 4.4% |
| $150,000 to $199,999 | 0 | 0.0% |
| $200,000+ | 0 | 0.0% |
Household Income by Householder Age in Atwood
The median household income in Atwood is $34,926, with the highest median household income of $58,839 found in the 15 to 24 years age bracket for the primary householder. A total of 31 households (6.8%) fall into this category. Meanwhile, the 45 to 64 years age bracket for the primary householder has the lowest median household income of $0, with 124 households (27.1%) in this group.
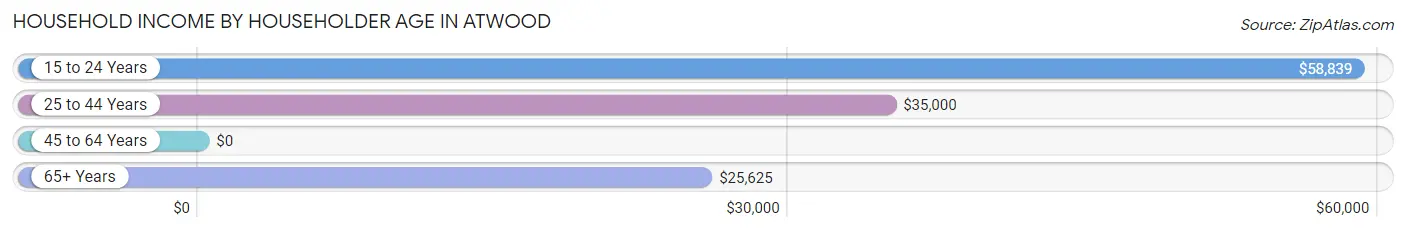
| Income Bracket | # Households | Median Income |
| 15 to 24 Years | 31 (6.8%) | $58,839 |
| 25 to 44 Years | 172 (37.6%) | $35,000 |
| 45 to 64 Years | 124 (27.1%) | $0 |
| 65+ Years | 130 (28.4%) | $25,625 |
| Total | 457 (100.0%) | $34,926 |
Poverty in Atwood
Income Below Poverty by Sex and Age in Atwood
With 14.9% poverty level for males and 27.3% for females among the residents of Atwood, 6 to 11 year old males and 15 year old females are the most vulnerable to poverty, with 29 males (52.7%) and 10 females (100.0%) in their respective age groups living below the poverty level.
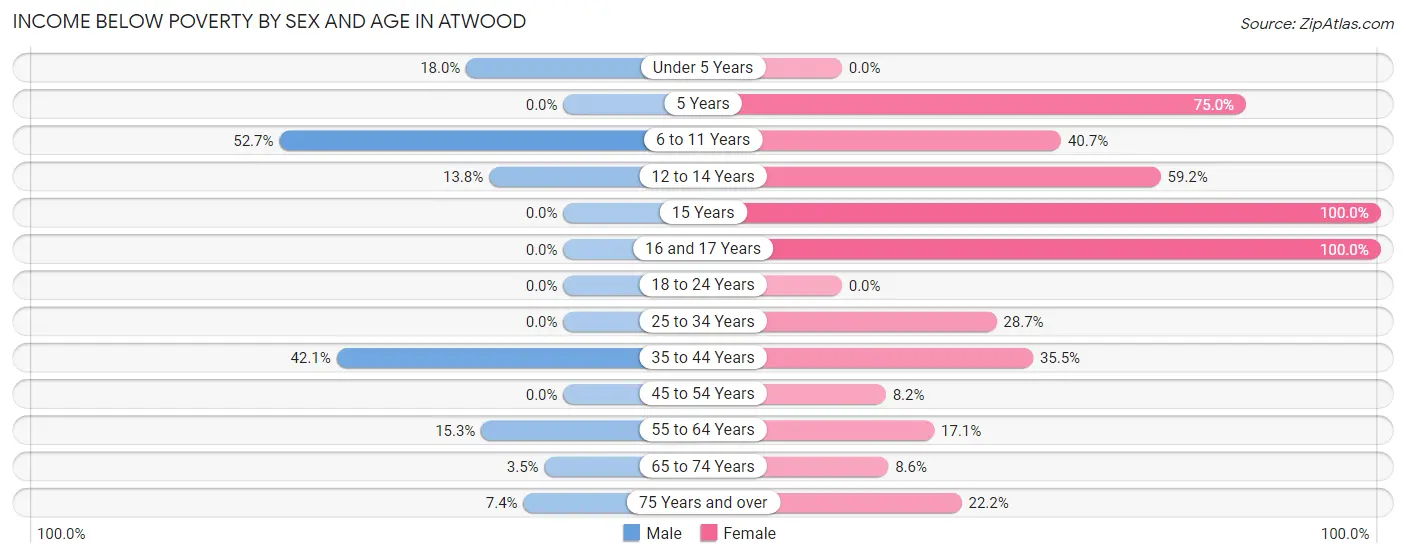
| Age Bracket | Male | Female |
| Under 5 Years | 11 (18.0%) | 0 (0.0%) |
| 5 Years | 0 (0.0%) | 24 (75.0%) |
| 6 to 11 Years | 29 (52.7%) | 24 (40.7%) |
| 12 to 14 Years | 8 (13.8%) | 29 (59.2%) |
| 15 Years | 0 (0.0%) | 10 (100.0%) |
| 16 and 17 Years | 0 (0.0%) | 19 (100.0%) |
| 18 to 24 Years | 0 (0.0%) | 0 (0.0%) |
| 25 to 34 Years | 0 (0.0%) | 31 (28.7%) |
| 35 to 44 Years | 24 (42.1%) | 11 (35.5%) |
| 45 to 54 Years | 0 (0.0%) | 4 (8.2%) |
| 55 to 64 Years | 9 (15.2%) | 12 (17.1%) |
| 65 to 74 Years | 2 (3.5%) | 5 (8.6%) |
| 75 Years and over | 2 (7.4%) | 10 (22.2%) |
| Total | 85 (14.9%) | 179 (27.3%) |
Income Above Poverty by Sex and Age in Atwood
According to the poverty statistics in Atwood, males aged 5 years and females aged under 5 years are the age groups that are most secure financially, with 100.0% of males and 100.0% of females in these age groups living above the poverty line.
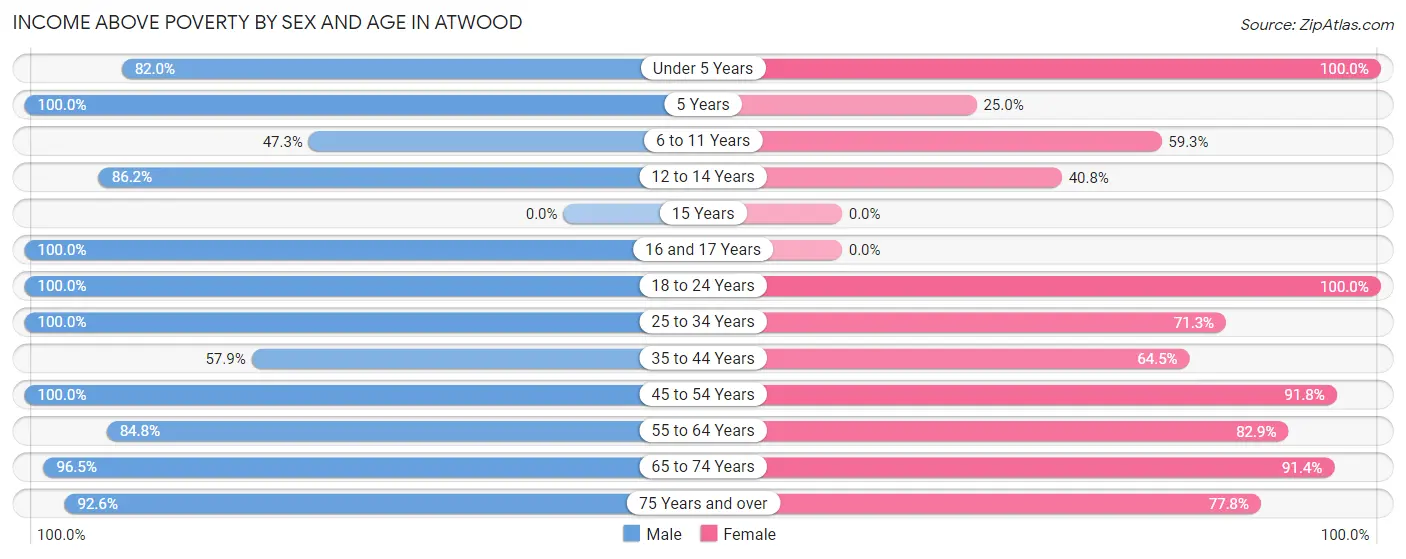
| Age Bracket | Male | Female |
| Under 5 Years | 50 (82.0%) | 46 (100.0%) |
| 5 Years | 6 (100.0%) | 8 (25.0%) |
| 6 to 11 Years | 26 (47.3%) | 35 (59.3%) |
| 12 to 14 Years | 50 (86.2%) | 20 (40.8%) |
| 15 Years | 0 (0.0%) | 0 (0.0%) |
| 16 and 17 Years | 5 (100.0%) | 0 (0.0%) |
| 18 to 24 Years | 82 (100.0%) | 81 (100.0%) |
| 25 to 34 Years | 65 (100.0%) | 77 (71.3%) |
| 35 to 44 Years | 33 (57.9%) | 20 (64.5%) |
| 45 to 54 Years | 40 (100.0%) | 45 (91.8%) |
| 55 to 64 Years | 50 (84.8%) | 58 (82.9%) |
| 65 to 74 Years | 55 (96.5%) | 53 (91.4%) |
| 75 Years and over | 25 (92.6%) | 35 (77.8%) |
| Total | 487 (85.1%) | 478 (72.8%) |
Income Below Poverty Among Married-Couple Families in Atwood
The poverty statistics for married-couple families in Atwood show that 10.4% or 24 of the total 230 families live below the poverty line. Families with 3 or 4 children have the highest poverty rate of 56.5%, comprising of 13 families. On the other hand, families with 1 or 2 children have the lowest poverty rate of 0.0%, which includes 0 families.
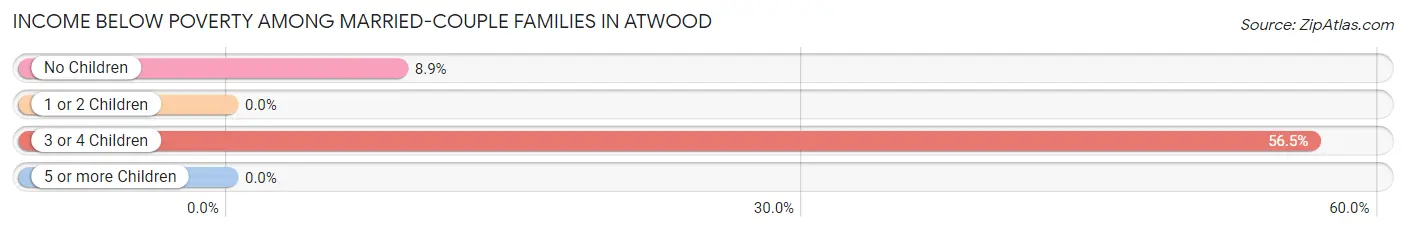
| Children | Above Poverty | Below Poverty |
| No Children | 113 (91.1%) | 11 (8.9%) |
| 1 or 2 Children | 83 (100.0%) | 0 (0.0%) |
| 3 or 4 Children | 10 (43.5%) | 13 (56.5%) |
| 5 or more Children | 0 (0.0%) | 0 (0.0%) |
| Total | 206 (89.6%) | 24 (10.4%) |
Income Below Poverty Among Single-Parent Households in Atwood
According to the poverty data in Atwood, 9.5% or 2 single-father households and 46.3% or 37 single-mother households are living below the poverty line. Among single-father households, those with 1 or 2 children have the highest poverty rate, with 2 households (18.2%) experiencing poverty. Likewise, among single-mother households, those with 5 or more children have the highest poverty rate, with 3 households (100.0%) falling below the poverty line.
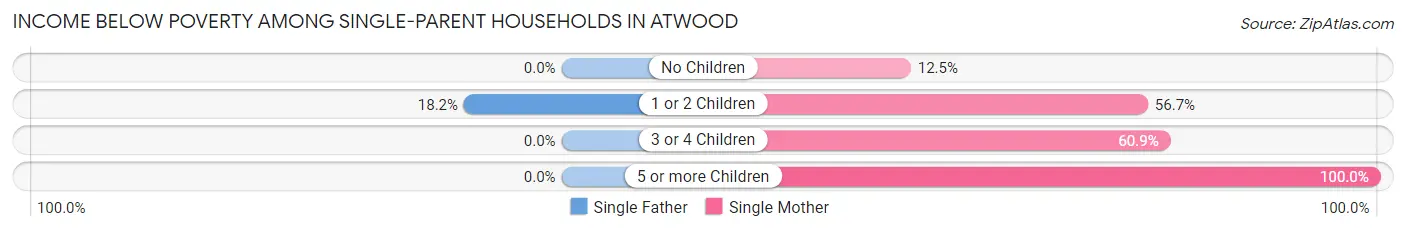
| Children | Single Father | Single Mother |
| No Children | 0 (0.0%) | 3 (12.5%) |
| 1 or 2 Children | 2 (18.2%) | 17 (56.7%) |
| 3 or 4 Children | 0 (0.0%) | 14 (60.9%) |
| 5 or more Children | 0 (0.0%) | 3 (100.0%) |
| Total | 2 (9.5%) | 37 (46.3%) |
Income Below Poverty Among Married-Couple vs Single-Parent Households in Atwood
The poverty data for Atwood shows that 24 of the married-couple family households (10.4%) and 39 of the single-parent households (38.6%) are living below the poverty level. Within the married-couple family households, those with 3 or 4 children have the highest poverty rate, with 13 households (56.5%) falling below the poverty line. Among the single-parent households, those with 5 or more children have the highest poverty rate, with 3 household (100.0%) living below poverty.
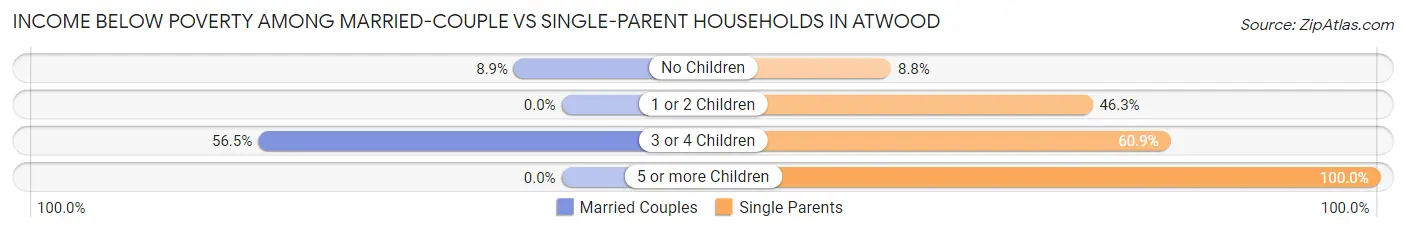
| Children | Married-Couple Families | Single-Parent Households |
| No Children | 11 (8.9%) | 3 (8.8%) |
| 1 or 2 Children | 0 (0.0%) | 19 (46.3%) |
| 3 or 4 Children | 13 (56.5%) | 14 (60.9%) |
| 5 or more Children | 0 (0.0%) | 3 (100.0%) |
| Total | 24 (10.4%) | 39 (38.6%) |
Race in Atwood
The most populous races in Atwood are White / Caucasian (1,008 | 82.0%), Two or more Races (133 | 10.8%), and Hispanic or Latino (99 | 8.1%).
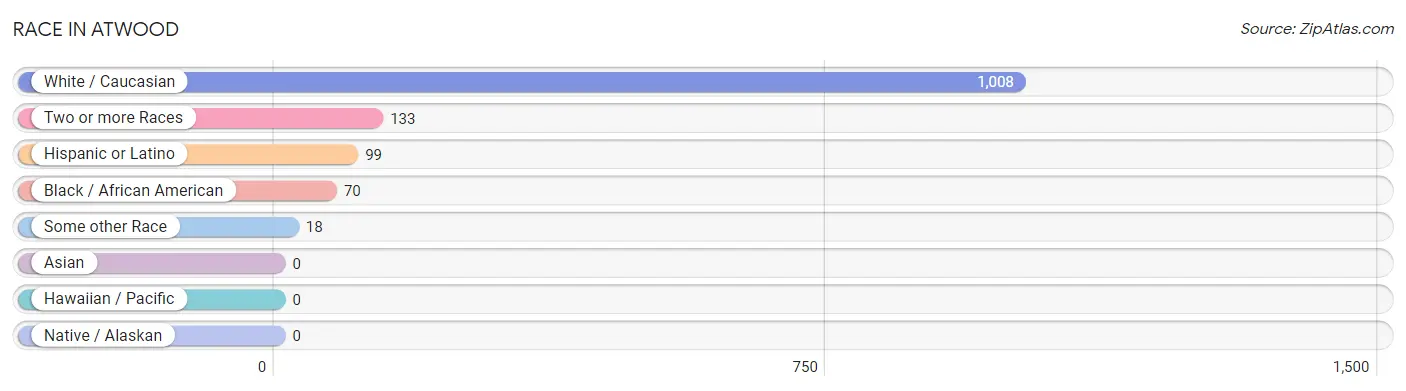
| Race | # Population | % Population |
| Asian | 0 | 0.0% |
| Black / African American | 70 | 5.7% |
| Hawaiian / Pacific | 0 | 0.0% |
| Hispanic or Latino | 99 | 8.1% |
| Native / Alaskan | 0 | 0.0% |
| White / Caucasian | 1,008 | 82.0% |
| Two or more Races | 133 | 10.8% |
| Some other Race | 18 | 1.5% |
| Total | 1,229 | 100.0% |
Ancestry in Atwood
The most populous ancestries reported in Atwood are American (467 | 38.0%), English (135 | 11.0%), Mexican (69 | 5.6%), German (61 | 5.0%), and Puerto Rican (30 | 2.4%), together accounting for 62.0% of all Atwood residents.
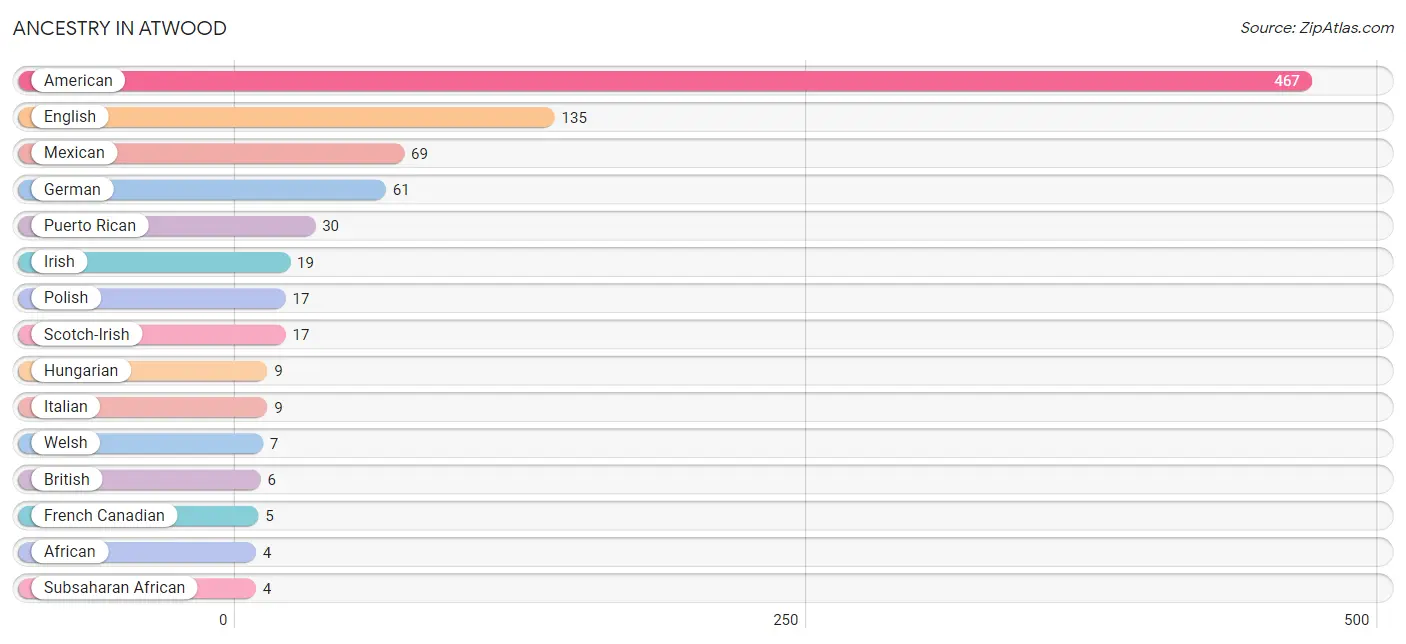
| Ancestry | # Population | % Population |
| African | 4 | 0.3% |
| American | 467 | 38.0% |
| British | 6 | 0.5% |
| Danish | 3 | 0.2% |
| English | 135 | 11.0% |
| French | 2 | 0.2% |
| French Canadian | 5 | 0.4% |
| German | 61 | 5.0% |
| Hungarian | 9 | 0.7% |
| Irish | 19 | 1.5% |
| Italian | 9 | 0.7% |
| Mexican | 69 | 5.6% |
| Polish | 17 | 1.4% |
| Puerto Rican | 30 | 2.4% |
| Scotch-Irish | 17 | 1.4% |
| Scottish | 2 | 0.2% |
| Subsaharan African | 4 | 0.3% |
| Welsh | 7 | 0.6% | View All 18 Rows |
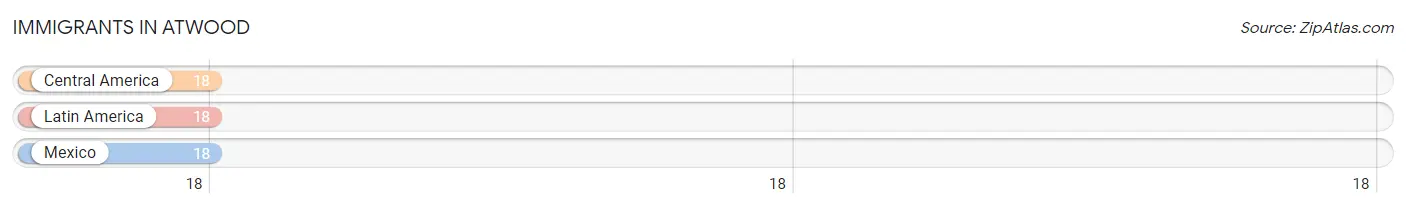
Immigrants in Atwood
The most numerous immigrant groups reported in Atwood came from Central America (18 | 1.5%), Latin America (18 | 1.5%), and Mexico (18 | 1.5%), together accounting for 4.4% of all Atwood residents.
| Immigration Origin | # Population | % Population |
| Central America | 18 | 1.5% |
| Latin America | 18 | 1.5% |
| Mexico | 18 | 1.5% | View All 3 Rows |
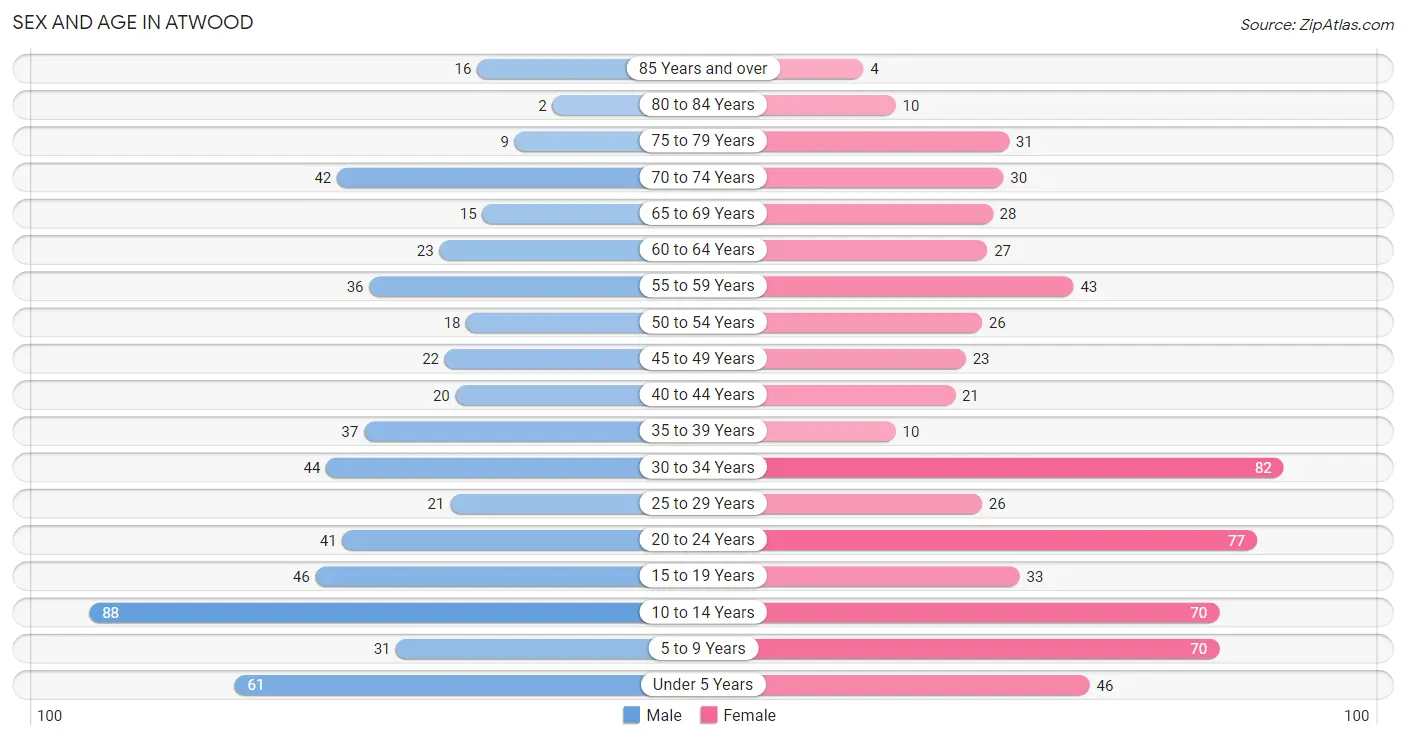
Sex and Age in Atwood
Sex and Age in Atwood
The most populous age groups in Atwood are 10 to 14 Years (88 | 15.4%) for men and 30 to 34 Years (82 | 12.5%) for women.
| Age Bracket | Male | Female |
| Under 5 Years | 61 (10.7%) | 46 (7.0%) |
| 5 to 9 Years | 31 (5.4%) | 70 (10.6%) |
| 10 to 14 Years | 88 (15.4%) | 70 (10.6%) |
| 15 to 19 Years | 46 (8.0%) | 33 (5.0%) |
| 20 to 24 Years | 41 (7.2%) | 77 (11.7%) |
| 25 to 29 Years | 21 (3.7%) | 26 (4.0%) |
| 30 to 34 Years | 44 (7.7%) | 82 (12.5%) |
| 35 to 39 Years | 37 (6.5%) | 10 (1.5%) |
| 40 to 44 Years | 20 (3.5%) | 21 (3.2%) |
| 45 to 49 Years | 22 (3.8%) | 23 (3.5%) |
| 50 to 54 Years | 18 (3.2%) | 26 (4.0%) |
| 55 to 59 Years | 36 (6.3%) | 43 (6.5%) |
| 60 to 64 Years | 23 (4.0%) | 27 (4.1%) |
| 65 to 69 Years | 15 (2.6%) | 28 (4.3%) |
| 70 to 74 Years | 42 (7.3%) | 30 (4.6%) |
| 75 to 79 Years | 9 (1.6%) | 31 (4.7%) |
| 80 to 84 Years | 2 (0.4%) | 10 (1.5%) |
| 85 Years and over | 16 (2.8%) | 4 (0.6%) |
| Total | 572 (100.0%) | 657 (100.0%) |
Families and Households in Atwood
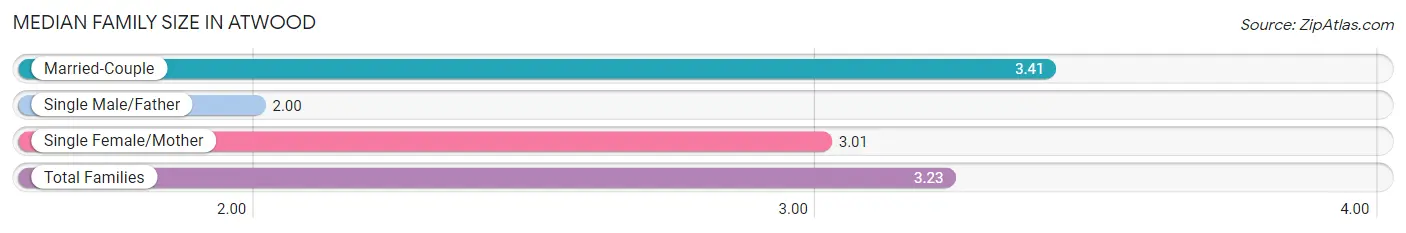
Median Family Size in Atwood
The median family size in Atwood is 3.23 persons per family, with married-couple families (230 | 69.5%) accounting for the largest median family size of 3.41 persons per family. On the other hand, single male/father families (21 | 6.3%) represent the smallest median family size with 2.00 persons per family.
| Family Type | # Families | Family Size |
| Married-Couple | 230 (69.5%) | 3.41 |
| Single Male/Father | 21 (6.3%) | 2.00 |
| Single Female/Mother | 80 (24.2%) | 3.01 |
| Total Families | 331 (100.0%) | 3.23 |
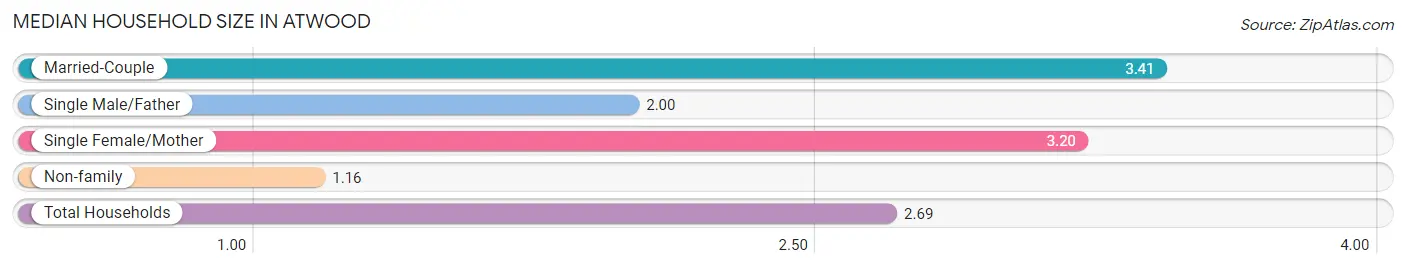
Median Household Size in Atwood
The median household size in Atwood is 2.69 persons per household, with married-couple households (230 | 50.3%) accounting for the largest median household size of 3.41 persons per household. non-family households (126 | 27.6%) represent the smallest median household size with 1.16 persons per household.
| Household Type | # Households | Household Size |
| Married-Couple | 230 (50.3%) | 3.41 |
| Single Male/Father | 21 (4.6%) | 2.00 |
| Single Female/Mother | 80 (17.5%) | 3.20 |
| Non-family | 126 (27.6%) | 1.16 |
| Total Households | 457 (100.0%) | 2.69 |
Household Size by Marriage Status in Atwood
Out of a total of 457 households in Atwood, 331 (72.4%) are family households, while 126 (27.6%) are nonfamily households. The most numerous type of family households are 2-person households, comprising 156, and the most common type of nonfamily households are 1-person households, comprising 117.
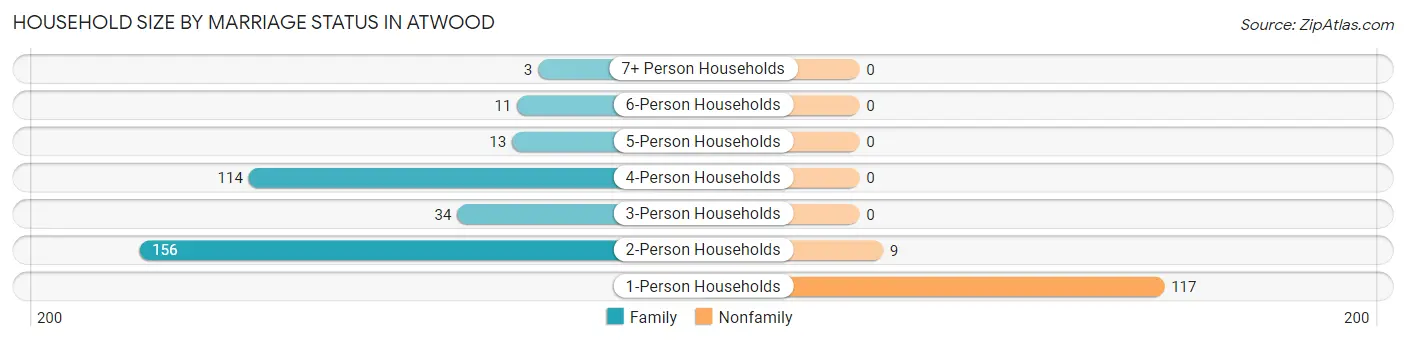
| Household Size | Family Households | Nonfamily Households |
| 1-Person Households | - | 117 (25.6%) |
| 2-Person Households | 156 (34.1%) | 9 (2.0%) |
| 3-Person Households | 34 (7.4%) | 0 (0.0%) |
| 4-Person Households | 114 (24.9%) | 0 (0.0%) |
| 5-Person Households | 13 (2.8%) | 0 (0.0%) |
| 6-Person Households | 11 (2.4%) | 0 (0.0%) |
| 7+ Person Households | 3 (0.7%) | 0 (0.0%) |
| Total | 331 (72.4%) | 126 (27.6%) |
Female Fertility in Atwood
Fertility by Age in Atwood
Average fertility rate in Atwood is 129.0 births per 1,000 women. Women in the age bracket of 20 to 34 years have the highest fertility rate with 200.0 births per 1,000 women. Women in the age bracket of 20 to 34 years acount for 100.0% of all women with births.
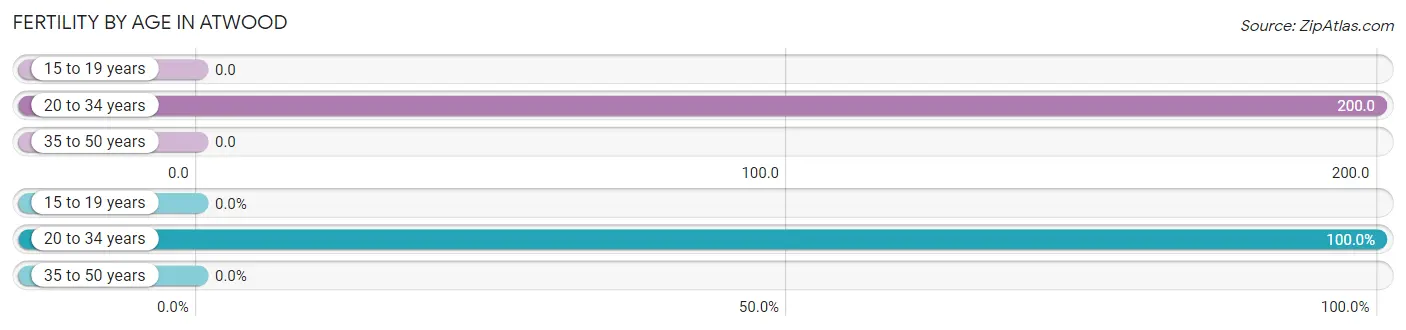
| Age Bracket | Women with Births | Births / 1,000 Women |
| 15 to 19 years | 0 (0.0%) | 0.0 |
| 20 to 34 years | 37 (100.0%) | 200.0 |
| 35 to 50 years | 0 (0.0%) | 0.0 |
| Total | 37 (100.0%) | 129.0 |
Fertility by Age by Marriage Status in Atwood
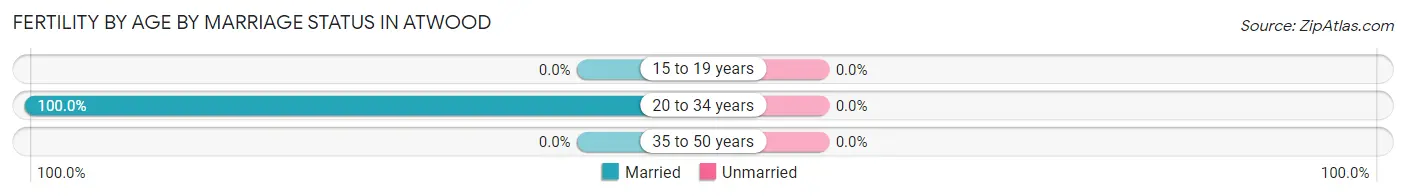
| Age Bracket | Married | Unmarried |
| 15 to 19 years | 0 (0.0%) | 0 (0.0%) |
| 20 to 34 years | 37 (100.0%) | 0 (0.0%) |
| 35 to 50 years | 0 (0.0%) | 0 (0.0%) |
| Total | 37 (100.0%) | 0 (0.0%) |
Fertility by Education in Atwood
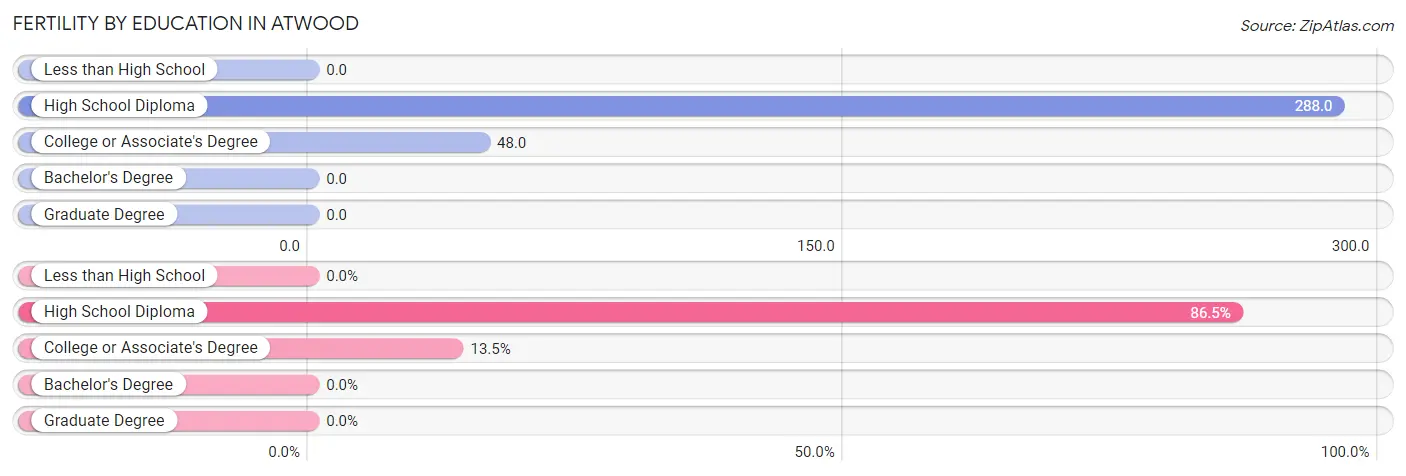
| Educational Attainment | Women with Births | Births / 1,000 Women |
| Less than High School | 0 (0.0%) | 0.0 |
| High School Diploma | 32 (86.5%) | 288.0 |
| College or Associate's Degree | 5 (13.5%) | 48.0 |
| Bachelor's Degree | 0 (0.0%) | 0.0 |
| Graduate Degree | 0 (0.0%) | 0.0 |
| Total | 37 (100.0%) | 129.0 |
Fertility by Education by Marriage Status in Atwood
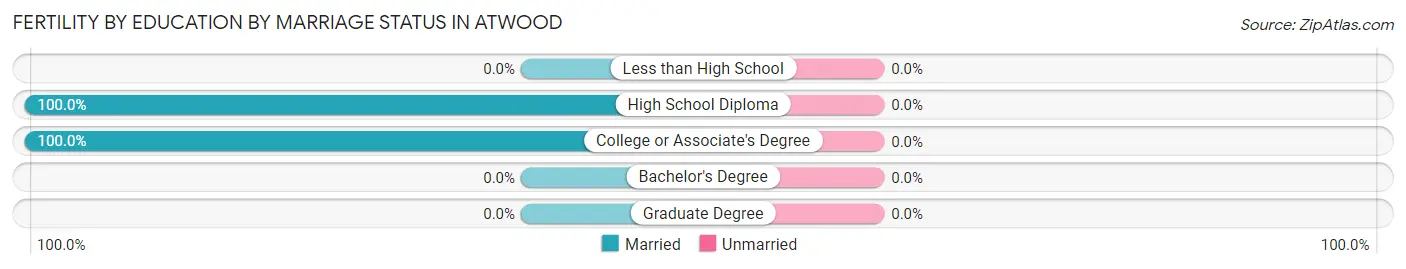
| Educational Attainment | Married | Unmarried |
| Less than High School | 0 (0.0%) | 0 (0.0%) |
| High School Diploma | 32 (100.0%) | 0 (0.0%) |
| College or Associate's Degree | 5 (100.0%) | 0 (0.0%) |
| Bachelor's Degree | 0 (0.0%) | 0 (0.0%) |
| Graduate Degree | 0 (0.0%) | 0 (0.0%) |
| Total | 37 (100.0%) | 0 (0.0%) |
Employment Characteristics in Atwood
Employment by Class of Employer in Atwood
Among the 455 employed individuals in Atwood, private company employees (362 | 79.6%), self-employed (not incorporated) (32 | 7.0%), and local government employees (27 | 5.9%) make up the most common classes of employment.
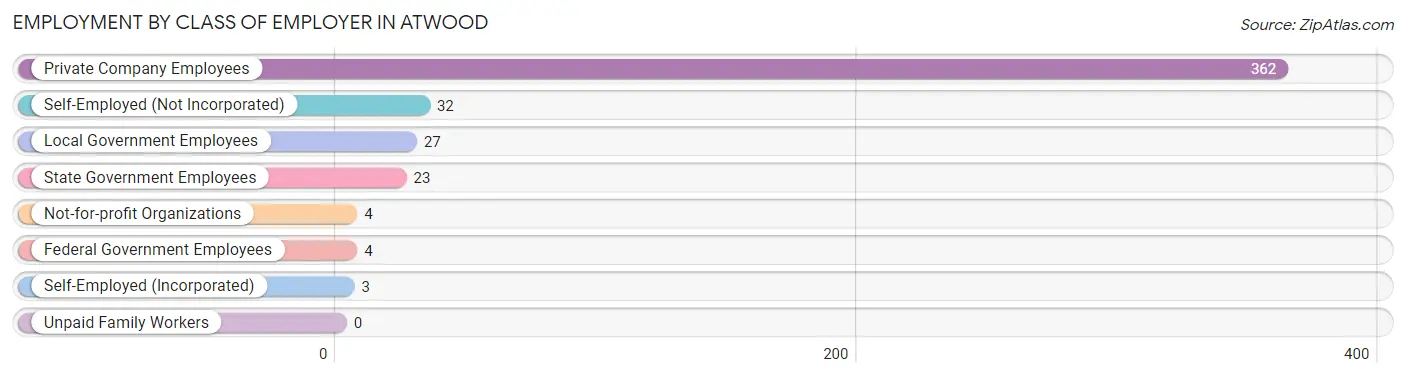
| Employer Class | # Employees | % Employees |
| Private Company Employees | 362 | 79.6% |
| Self-Employed (Incorporated) | 3 | 0.7% |
| Self-Employed (Not Incorporated) | 32 | 7.0% |
| Not-for-profit Organizations | 4 | 0.9% |
| Local Government Employees | 27 | 5.9% |
| State Government Employees | 23 | 5.1% |
| Federal Government Employees | 4 | 0.9% |
| Unpaid Family Workers | 0 | 0.0% |
| Total | 455 | 100.0% |
Employment Status by Age in Atwood
According to the labor force statistics for Atwood, out of the total population over 16 years of age (853), 61.8% or 527 individuals are in the labor force, with 12.7% or 67 of them unemployed. The age group with the highest labor force participation rate is 25 to 29 years, with 93.6% or 44 individuals in the labor force. Within the labor force, the 16 to 19 years age range has the highest percentage of unemployed individuals, with 100.0% or 33 of them being unemployed.
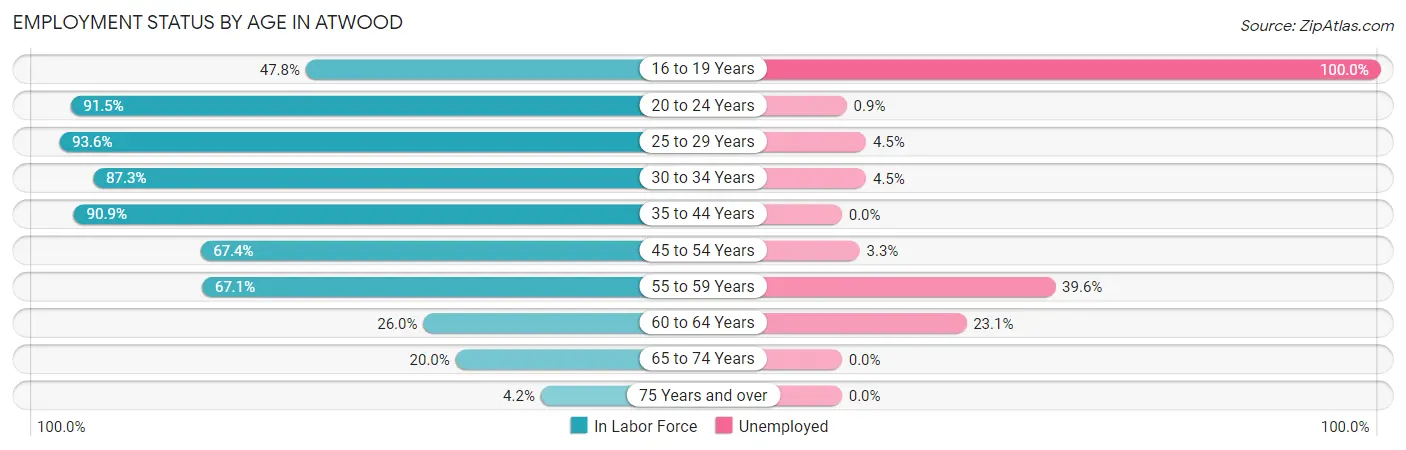
| Age Bracket | In Labor Force | Unemployed |
| 16 to 19 Years | 33 (47.8%) | 33 (100.0%) |
| 20 to 24 Years | 108 (91.5%) | 1 (0.9%) |
| 25 to 29 Years | 44 (93.6%) | 2 (4.5%) |
| 30 to 34 Years | 110 (87.3%) | 5 (4.5%) |
| 35 to 44 Years | 80 (90.9%) | 0 (0.0%) |
| 45 to 54 Years | 60 (67.4%) | 2 (3.3%) |
| 55 to 59 Years | 53 (67.1%) | 21 (39.6%) |
| 60 to 64 Years | 13 (26.0%) | 3 (23.1%) |
| 65 to 74 Years | 23 (20.0%) | 0 (0.0%) |
| 75 Years and over | 3 (4.2%) | 0 (0.0%) |
| Total | 527 (61.8%) | 67 (12.7%) |
Employment Status by Educational Attainment in Atwood
According to labor force statistics for Atwood, 75.2% of individuals (360) out of the total population between 25 and 64 years of age (479) are in the labor force, with 9.2% or 33 of them being unemployed. The group with the highest labor force participation rate are those with the educational attainment of bachelor's degree or higher, with 93.6% or 44 individuals in the labor force. Within the labor force, individuals with bachelor's degree or higher education have the highest percentage of unemployment, with 27.3% or 12 of them being unemployed.
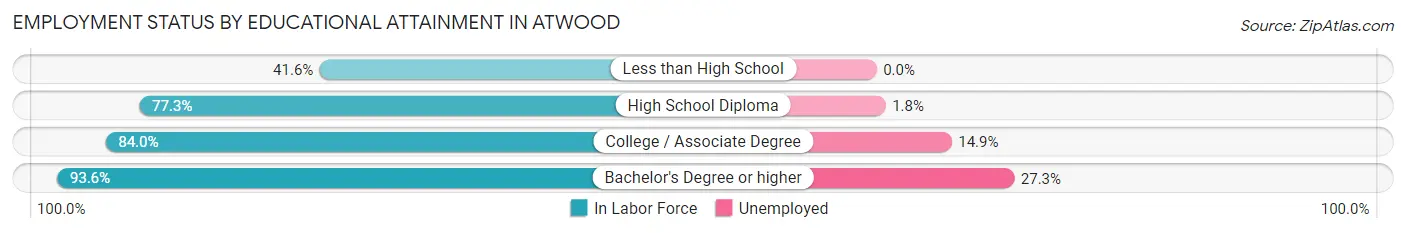
| Educational Attainment | In Labor Force | Unemployed |
| Less than High School | 32 (41.6%) | 0 (0.0%) |
| High School Diploma | 163 (77.3%) | 4 (1.8%) |
| College / Associate Degree | 121 (84.0%) | 21 (14.9%) |
| Bachelor's Degree or higher | 44 (93.6%) | 13 (27.3%) |
| Total | 360 (75.2%) | 44 (9.2%) |
Employment Occupations by Sex in Atwood
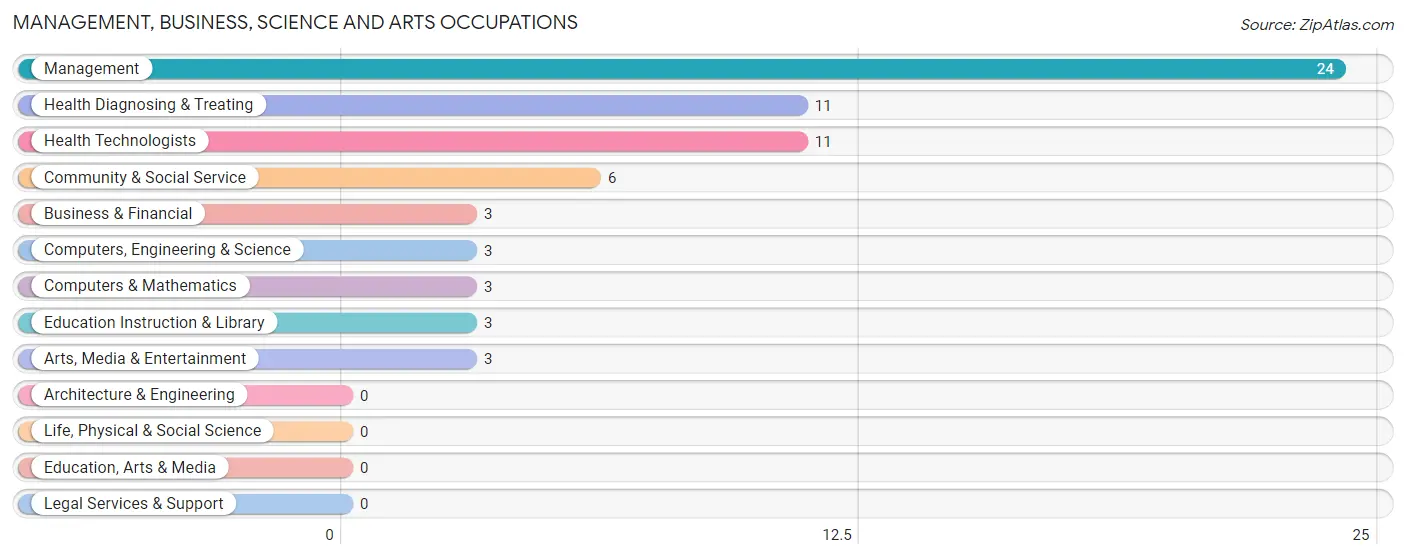
Management, Business, Science and Arts Occupations
The most common Management, Business, Science and Arts occupations in Atwood are Management (24 | 5.2%), Health Diagnosing & Treating (11 | 2.4%), Health Technologists (11 | 2.4%), Community & Social Service (6 | 1.3%), and Business & Financial (3 | 0.6%).
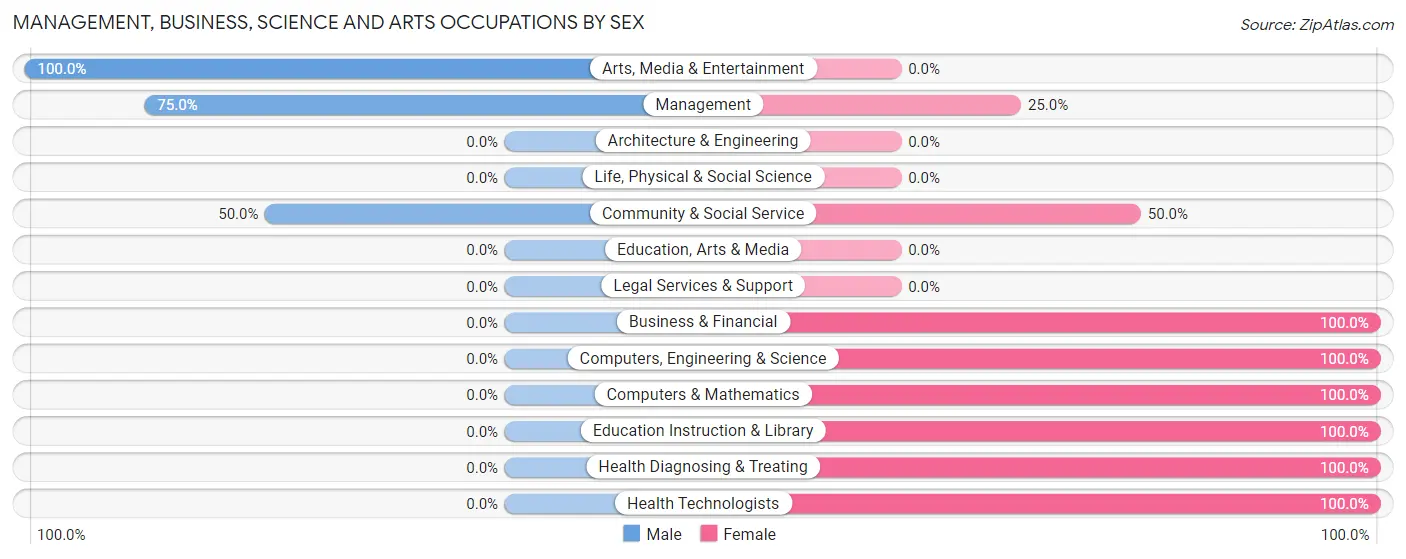
Management, Business, Science and Arts Occupations by Sex
Within the Management, Business, Science and Arts occupations in Atwood, the most male-oriented occupations are Arts, Media & Entertainment (100.0%), Management (75.0%), and Community & Social Service (50.0%), while the most female-oriented occupations are Business & Financial (100.0%), Computers, Engineering & Science (100.0%), and Computers & Mathematics (100.0%).
| Occupation | Male | Female |
| Management | 18 (75.0%) | 6 (25.0%) |
| Business & Financial | 0 (0.0%) | 3 (100.0%) |
| Computers, Engineering & Science | 0 (0.0%) | 3 (100.0%) |
| Computers & Mathematics | 0 (0.0%) | 3 (100.0%) |
| Architecture & Engineering | 0 (0.0%) | 0 (0.0%) |
| Life, Physical & Social Science | 0 (0.0%) | 0 (0.0%) |
| Community & Social Service | 3 (50.0%) | 3 (50.0%) |
| Education, Arts & Media | 0 (0.0%) | 0 (0.0%) |
| Legal Services & Support | 0 (0.0%) | 0 (0.0%) |
| Education Instruction & Library | 0 (0.0%) | 3 (100.0%) |
| Arts, Media & Entertainment | 3 (100.0%) | 0 (0.0%) |
| Health Diagnosing & Treating | 0 (0.0%) | 11 (100.0%) |
| Health Technologists | 0 (0.0%) | 11 (100.0%) |
| Total (Category) | 21 (44.7%) | 26 (55.3%) |
| Total (Overall) | 234 (50.9%) | 226 (49.1%) |
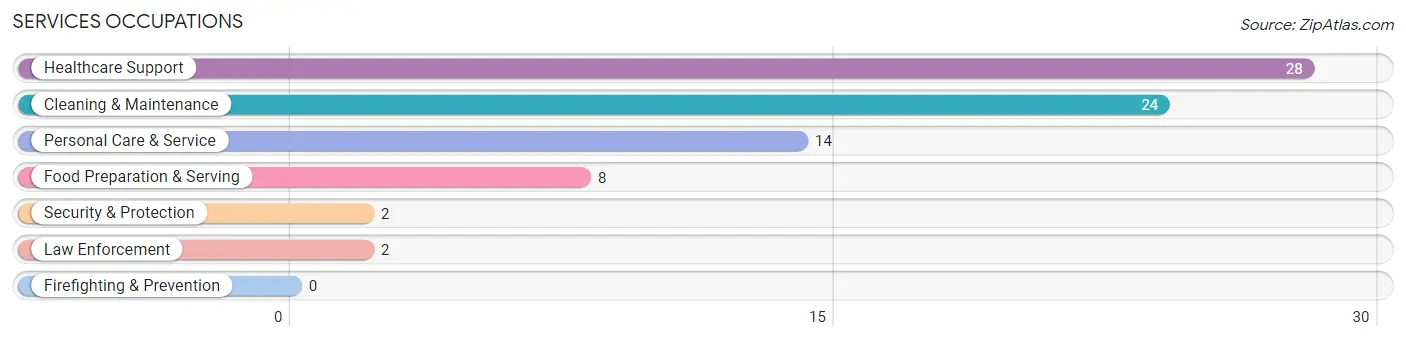
Services Occupations
The most common Services occupations in Atwood are Healthcare Support (28 | 6.1%), Cleaning & Maintenance (24 | 5.2%), Personal Care & Service (14 | 3.0%), Food Preparation & Serving (8 | 1.7%), and Security & Protection (2 | 0.4%).
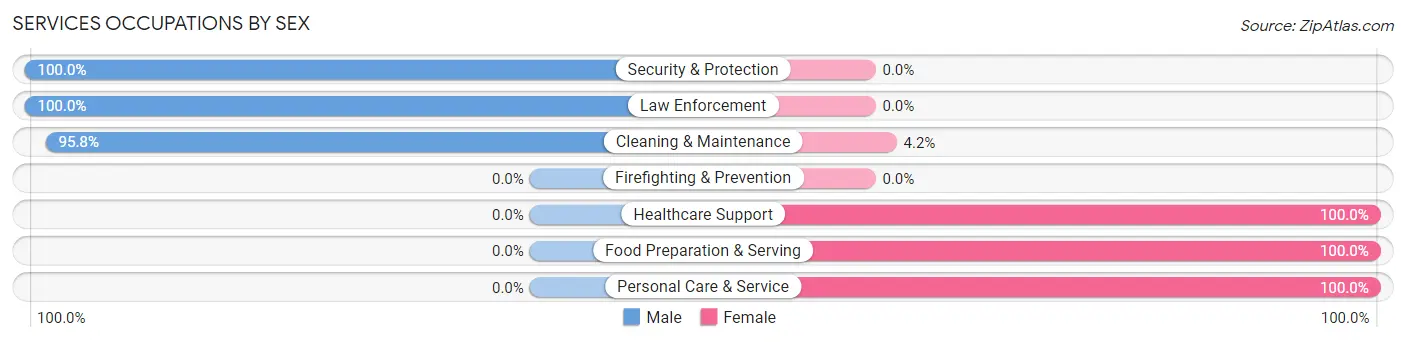
Services Occupations by Sex
Within the Services occupations in Atwood, the most male-oriented occupations are Security & Protection (100.0%), Law Enforcement (100.0%), and Cleaning & Maintenance (95.8%), while the most female-oriented occupations are Healthcare Support (100.0%), Food Preparation & Serving (100.0%), and Personal Care & Service (100.0%).
| Occupation | Male | Female |
| Healthcare Support | 0 (0.0%) | 28 (100.0%) |
| Security & Protection | 2 (100.0%) | 0 (0.0%) |
| Firefighting & Prevention | 0 (0.0%) | 0 (0.0%) |
| Law Enforcement | 2 (100.0%) | 0 (0.0%) |
| Food Preparation & Serving | 0 (0.0%) | 8 (100.0%) |
| Cleaning & Maintenance | 23 (95.8%) | 1 (4.2%) |
| Personal Care & Service | 0 (0.0%) | 14 (100.0%) |
| Total (Category) | 25 (32.9%) | 51 (67.1%) |
| Total (Overall) | 234 (50.9%) | 226 (49.1%) |
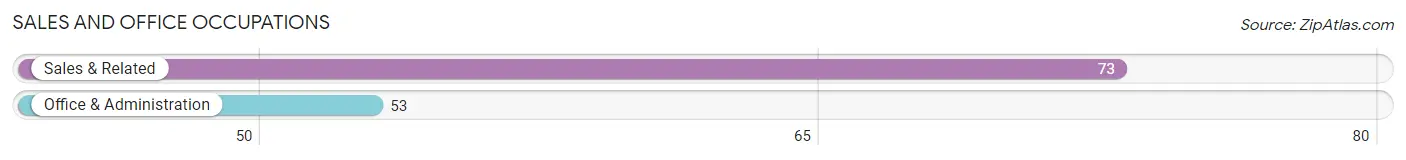
Sales and Office Occupations
The most common Sales and Office occupations in Atwood are Sales & Related (73 | 15.9%), and Office & Administration (53 | 11.5%).
Sales and Office Occupations by Sex
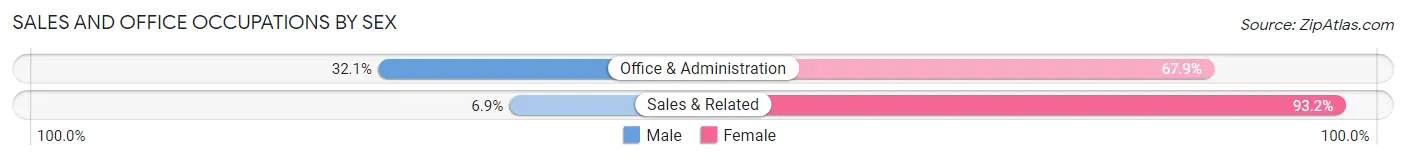
| Occupation | Male | Female |
| Sales & Related | 5 (6.9%) | 68 (93.1%) |
| Office & Administration | 17 (32.1%) | 36 (67.9%) |
| Total (Category) | 22 (17.5%) | 104 (82.5%) |
| Total (Overall) | 234 (50.9%) | 226 (49.1%) |
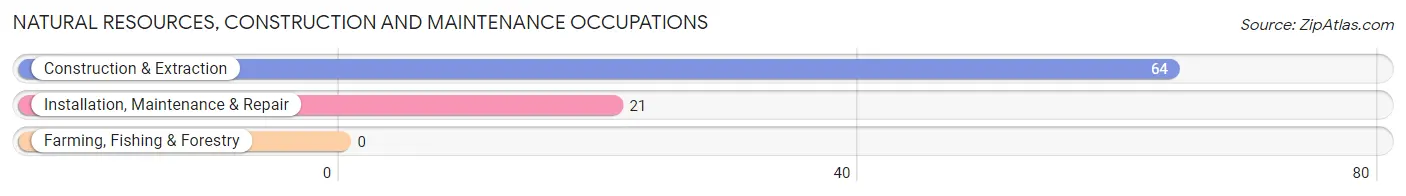
Natural Resources, Construction and Maintenance Occupations
The most common Natural Resources, Construction and Maintenance occupations in Atwood are Construction & Extraction (64 | 13.9%), and Installation, Maintenance & Repair (21 | 4.6%).
Natural Resources, Construction and Maintenance Occupations by Sex
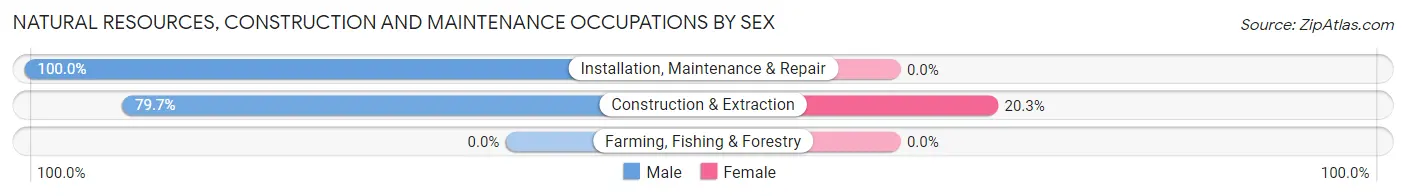
| Occupation | Male | Female |
| Farming, Fishing & Forestry | 0 (0.0%) | 0 (0.0%) |
| Construction & Extraction | 51 (79.7%) | 13 (20.3%) |
| Installation, Maintenance & Repair | 21 (100.0%) | 0 (0.0%) |
| Total (Category) | 72 (84.7%) | 13 (15.3%) |
| Total (Overall) | 234 (50.9%) | 226 (49.1%) |
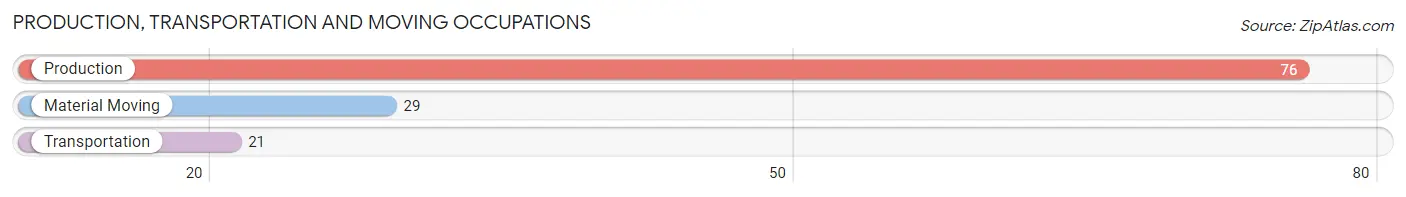
Production, Transportation and Moving Occupations
The most common Production, Transportation and Moving occupations in Atwood are Production (76 | 16.5%), Material Moving (29 | 6.3%), and Transportation (21 | 4.6%).
Production, Transportation and Moving Occupations by Sex
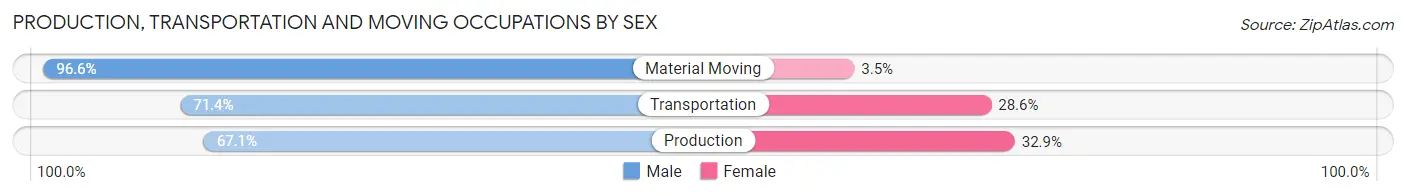
| Occupation | Male | Female |
| Production | 51 (67.1%) | 25 (32.9%) |
| Transportation | 15 (71.4%) | 6 (28.6%) |
| Material Moving | 28 (96.6%) | 1 (3.5%) |
| Total (Category) | 94 (74.6%) | 32 (25.4%) |
| Total (Overall) | 234 (50.9%) | 226 (49.1%) |
Employment Industries by Sex in Atwood
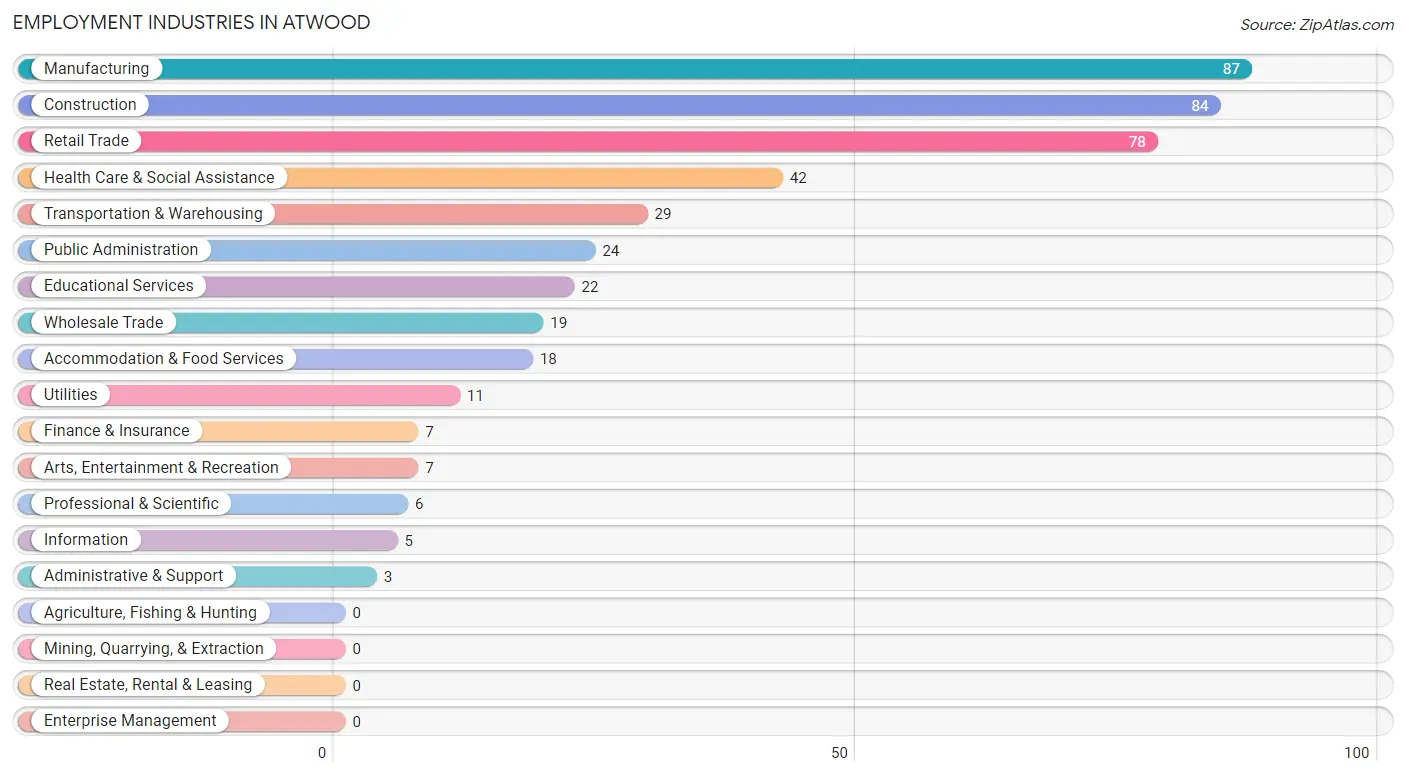
Employment Industries in Atwood
The major employment industries in Atwood include Manufacturing (87 | 18.9%), Construction (84 | 18.3%), Retail Trade (78 | 17.0%), Health Care & Social Assistance (42 | 9.1%), and Transportation & Warehousing (29 | 6.3%).
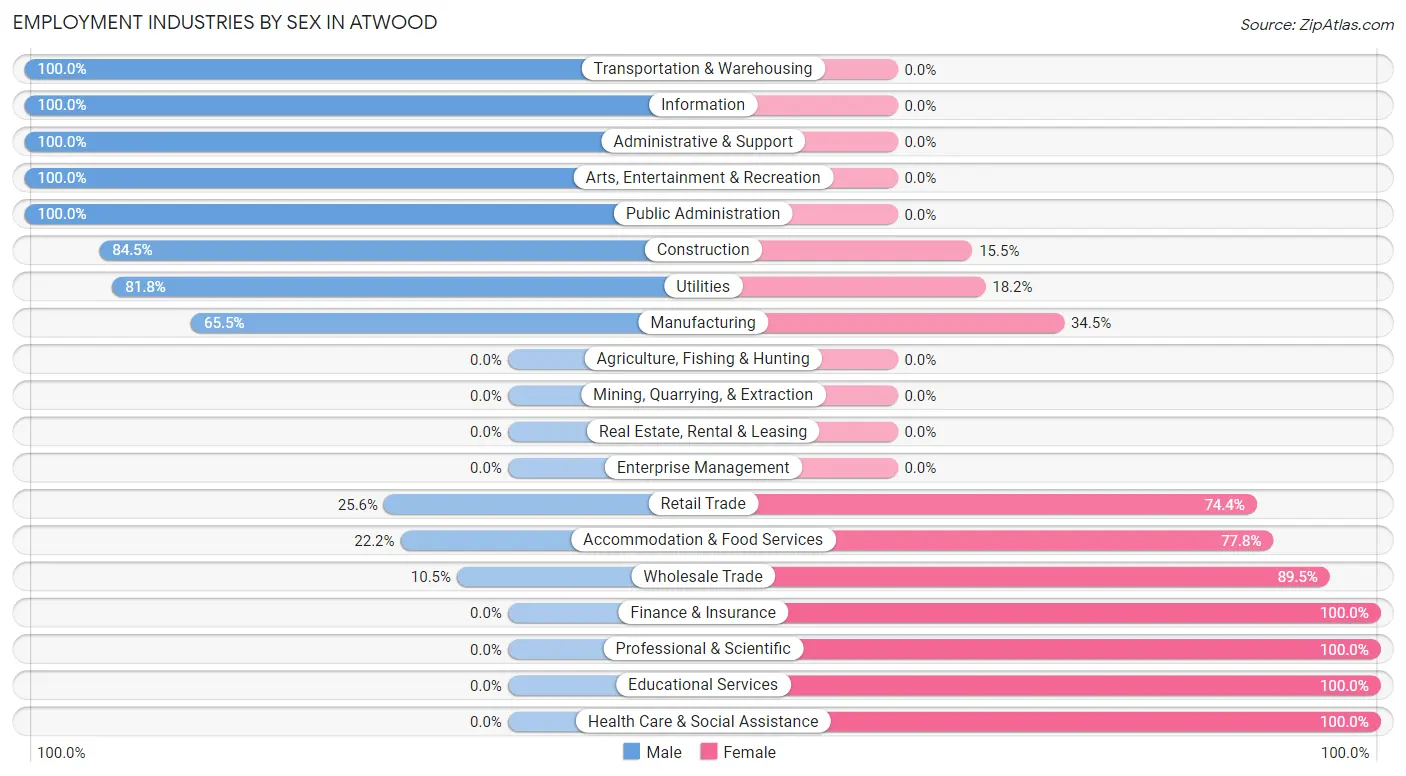
Employment Industries by Sex in Atwood
The Atwood industries that see more men than women are Transportation & Warehousing (100.0%), Information (100.0%), and Administrative & Support (100.0%), whereas the industries that tend to have a higher number of women are Finance & Insurance (100.0%), Professional & Scientific (100.0%), and Educational Services (100.0%).
| Industry | Male | Female |
| Agriculture, Fishing & Hunting | 0 (0.0%) | 0 (0.0%) |
| Mining, Quarrying, & Extraction | 0 (0.0%) | 0 (0.0%) |
| Construction | 71 (84.5%) | 13 (15.5%) |
| Manufacturing | 57 (65.5%) | 30 (34.5%) |
| Wholesale Trade | 2 (10.5%) | 17 (89.5%) |
| Retail Trade | 20 (25.6%) | 58 (74.4%) |
| Transportation & Warehousing | 29 (100.0%) | 0 (0.0%) |
| Utilities | 9 (81.8%) | 2 (18.2%) |
| Information | 5 (100.0%) | 0 (0.0%) |
| Finance & Insurance | 0 (0.0%) | 7 (100.0%) |
| Real Estate, Rental & Leasing | 0 (0.0%) | 0 (0.0%) |
| Professional & Scientific | 0 (0.0%) | 6 (100.0%) |
| Enterprise Management | 0 (0.0%) | 0 (0.0%) |
| Administrative & Support | 3 (100.0%) | 0 (0.0%) |
| Educational Services | 0 (0.0%) | 22 (100.0%) |
| Health Care & Social Assistance | 0 (0.0%) | 42 (100.0%) |
| Arts, Entertainment & Recreation | 7 (100.0%) | 0 (0.0%) |
| Accommodation & Food Services | 4 (22.2%) | 14 (77.8%) |
| Public Administration | 24 (100.0%) | 0 (0.0%) |
| Total | 234 (50.9%) | 226 (49.1%) |
Education in Atwood
School Enrollment in Atwood
The most common levels of schooling among the 319 students in Atwood are middle school (101 | 31.7%), high school (94 | 29.5%), and elementary school (55 | 17.2%).
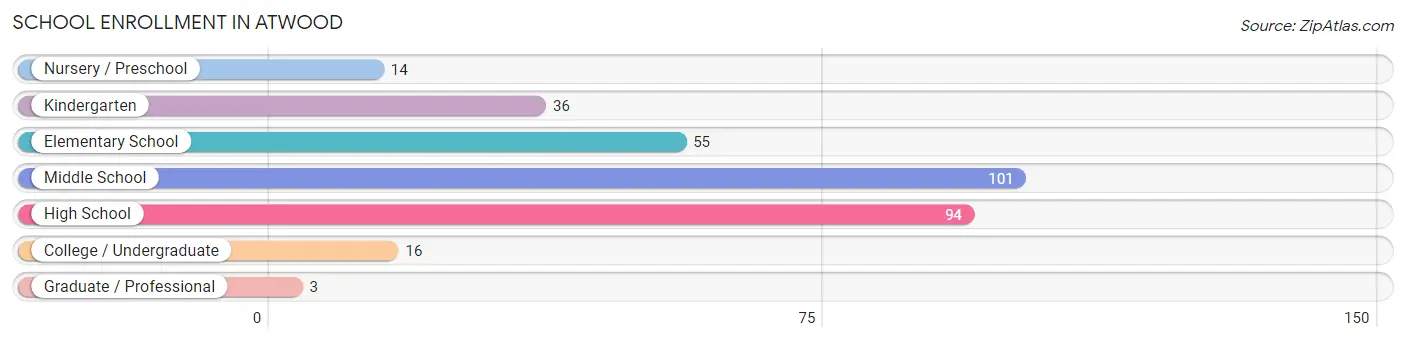
| School Level | # Students | % Students |
| Nursery / Preschool | 14 | 4.4% |
| Kindergarten | 36 | 11.3% |
| Elementary School | 55 | 17.2% |
| Middle School | 101 | 31.7% |
| High School | 94 | 29.5% |
| College / Undergraduate | 16 | 5.0% |
| Graduate / Professional | 3 | 0.9% |
| Total | 319 | 100.0% |
School Enrollment by Age by Funding Source in Atwood
Out of a total of 319 students who are enrolled in schools in Atwood, 8 (2.5%) attend a private institution, while the remaining 311 (97.5%) are enrolled in public schools. The age group of 25 to 34 year olds has the highest likelihood of being enrolled in private schools, with 2 (15.4% in the age bracket) enrolled. Conversely, the age group of 3 to 4 year olds has the lowest likelihood of being enrolled in a private school, with 4 (100.0% in the age bracket) attending a public institution.
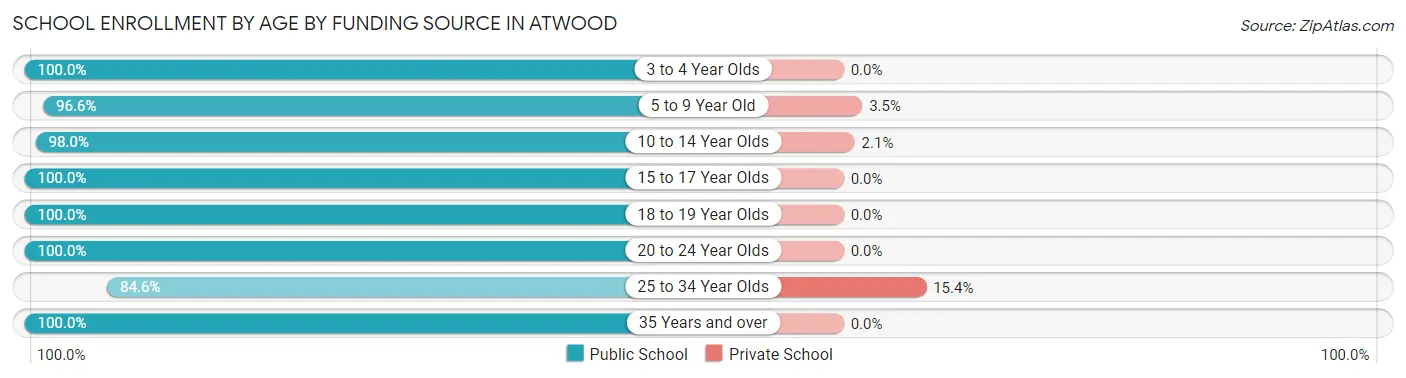
| Age Bracket | Public School | Private School |
| 3 to 4 Year Olds | 4 (100.0%) | 0 (0.0%) |
| 5 to 9 Year Old | 84 (96.6%) | 3 (3.5%) |
| 10 to 14 Year Olds | 143 (98.0%) | 3 (2.1%) |
| 15 to 17 Year Olds | 34 (100.0%) | 0 (0.0%) |
| 18 to 19 Year Olds | 29 (100.0%) | 0 (0.0%) |
| 20 to 24 Year Olds | 5 (100.0%) | 0 (0.0%) |
| 25 to 34 Year Olds | 11 (84.6%) | 2 (15.4%) |
| 35 Years and over | 1 (100.0%) | 0 (0.0%) |
| Total | 311 (97.5%) | 8 (2.5%) |
Educational Attainment by Field of Study in Atwood
Business (23 | 34.8%), science & technology (19 | 28.8%), social sciences (13 | 19.7%), education (7 | 10.6%), and multidisciplinary studies (3 | 4.5%) are the most common fields of study among 66 individuals in Atwood who have obtained a bachelor's degree or higher.
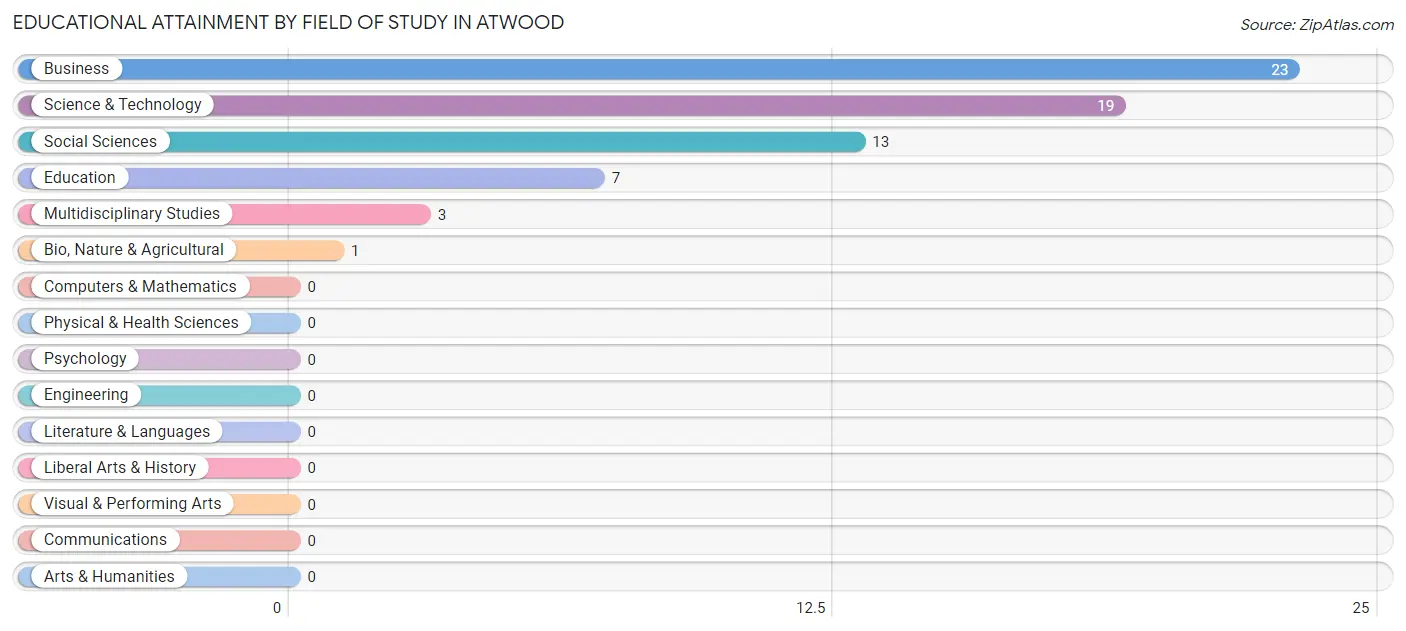
| Field of Study | # Graduates | % Graduates |
| Computers & Mathematics | 0 | 0.0% |
| Bio, Nature & Agricultural | 1 | 1.5% |
| Physical & Health Sciences | 0 | 0.0% |
| Psychology | 0 | 0.0% |
| Social Sciences | 13 | 19.7% |
| Engineering | 0 | 0.0% |
| Multidisciplinary Studies | 3 | 4.5% |
| Science & Technology | 19 | 28.8% |
| Business | 23 | 34.8% |
| Education | 7 | 10.6% |
| Literature & Languages | 0 | 0.0% |
| Liberal Arts & History | 0 | 0.0% |
| Visual & Performing Arts | 0 | 0.0% |
| Communications | 0 | 0.0% |
| Arts & Humanities | 0 | 0.0% |
| Total | 66 | 100.0% |
Transportation & Commute in Atwood
Vehicle Availability by Sex in Atwood
The most prevalent vehicle ownership categories in Atwood are males with 2 vehicles (127, accounting for 55.5%) and females with 2 vehicles (88, making up 56.2%).
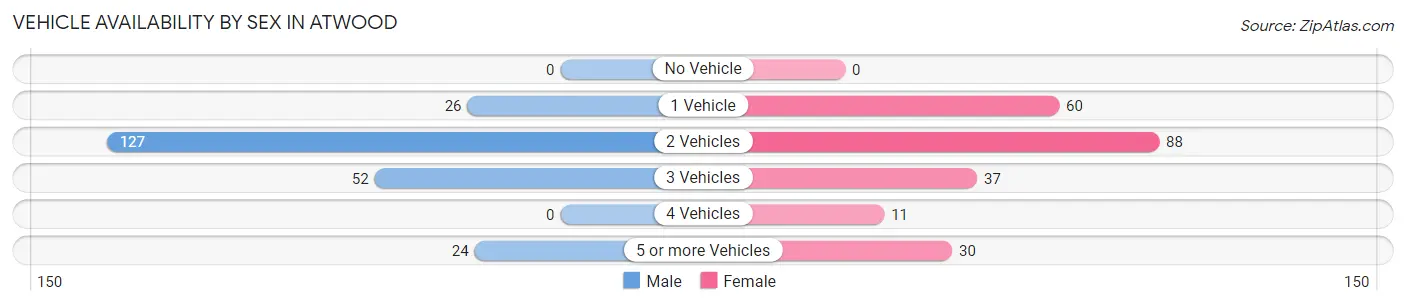
| Vehicles Available | Male | Female |
| No Vehicle | 0 (0.0%) | 0 (0.0%) |
| 1 Vehicle | 26 (11.4%) | 60 (26.6%) |
| 2 Vehicles | 127 (55.5%) | 88 (38.9%) |
| 3 Vehicles | 52 (22.7%) | 37 (16.4%) |
| 4 Vehicles | 0 (0.0%) | 11 (4.9%) |
| 5 or more Vehicles | 24 (10.5%) | 30 (13.3%) |
| Total | 229 (100.0%) | 226 (100.0%) |
Commute Time in Atwood
The most frequently occuring commute durations in Atwood are 45 to 59 minutes (89 commuters, 20.3%), 15 to 19 minutes (85 commuters, 19.4%), and 40 to 44 minutes (63 commuters, 14.4%).
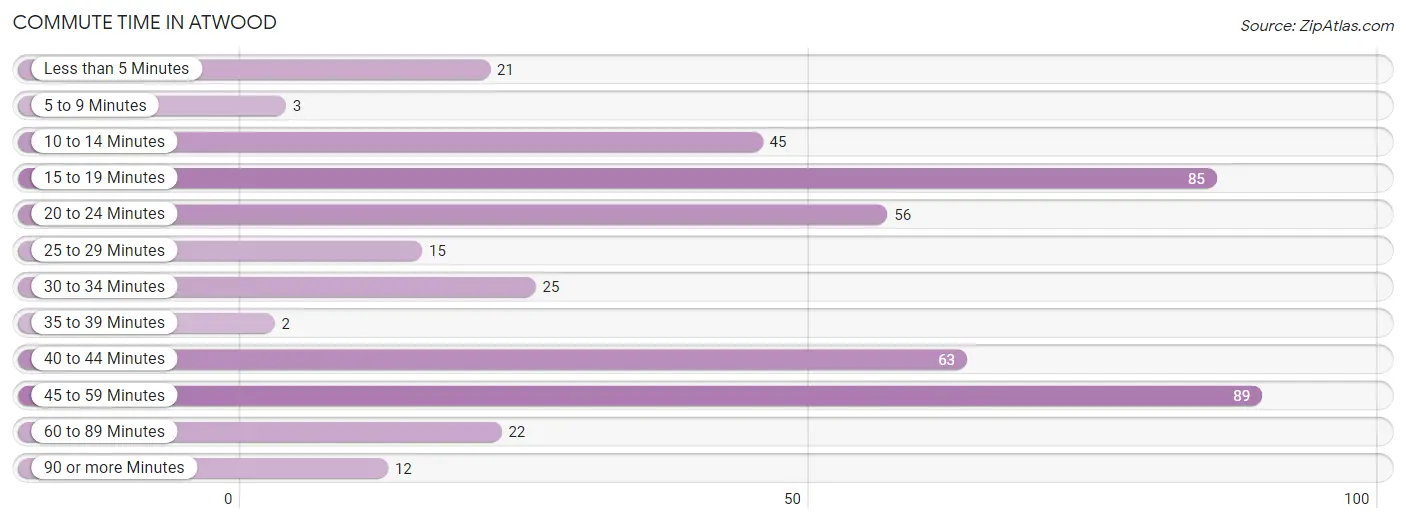
| Commute Time | # Commuters | % Commuters |
| Less than 5 Minutes | 21 | 4.8% |
| 5 to 9 Minutes | 3 | 0.7% |
| 10 to 14 Minutes | 45 | 10.3% |
| 15 to 19 Minutes | 85 | 19.4% |
| 20 to 24 Minutes | 56 | 12.8% |
| 25 to 29 Minutes | 15 | 3.4% |
| 30 to 34 Minutes | 25 | 5.7% |
| 35 to 39 Minutes | 2 | 0.5% |
| 40 to 44 Minutes | 63 | 14.4% |
| 45 to 59 Minutes | 89 | 20.3% |
| 60 to 89 Minutes | 22 | 5.0% |
| 90 or more Minutes | 12 | 2.7% |
Commute Time by Sex in Atwood
The most common commute times in Atwood are 45 to 59 minutes (60 commuters, 26.6%) for males and 40 to 44 minutes (50 commuters, 23.6%) for females.
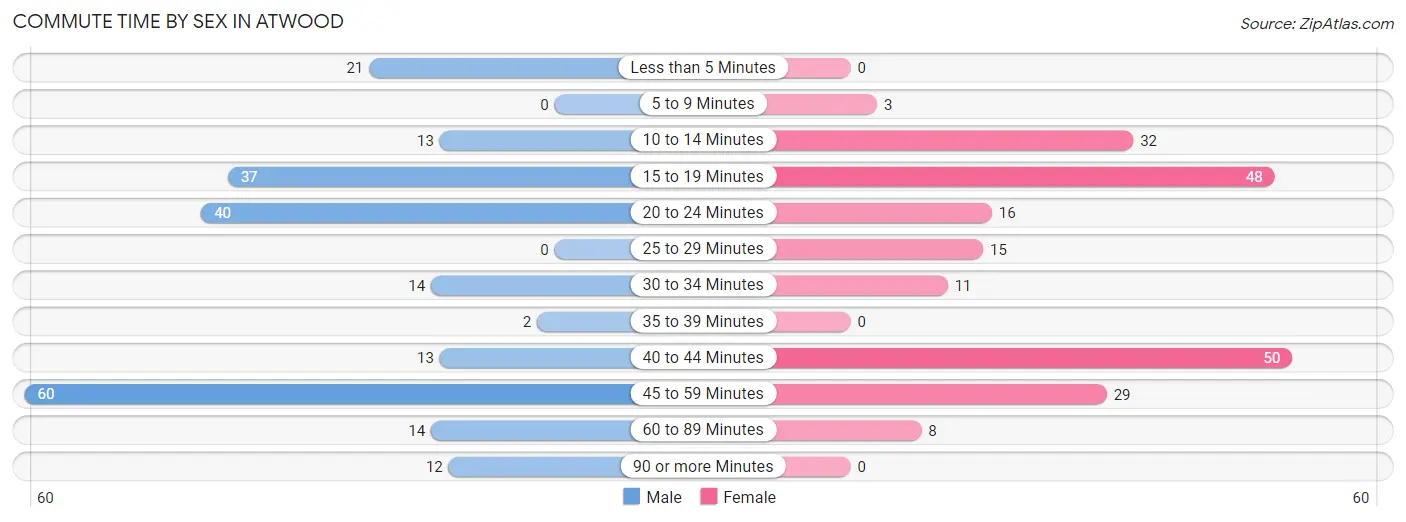
| Commute Time | Male | Female |
| Less than 5 Minutes | 21 (9.3%) | 0 (0.0%) |
| 5 to 9 Minutes | 0 (0.0%) | 3 (1.4%) |
| 10 to 14 Minutes | 13 (5.8%) | 32 (15.1%) |
| 15 to 19 Minutes | 37 (16.4%) | 48 (22.6%) |
| 20 to 24 Minutes | 40 (17.7%) | 16 (7.5%) |
| 25 to 29 Minutes | 0 (0.0%) | 15 (7.1%) |
| 30 to 34 Minutes | 14 (6.2%) | 11 (5.2%) |
| 35 to 39 Minutes | 2 (0.9%) | 0 (0.0%) |
| 40 to 44 Minutes | 13 (5.8%) | 50 (23.6%) |
| 45 to 59 Minutes | 60 (26.6%) | 29 (13.7%) |
| 60 to 89 Minutes | 14 (6.2%) | 8 (3.8%) |
| 90 or more Minutes | 12 (5.3%) | 0 (0.0%) |
Time of Departure to Work by Sex in Atwood
The most frequent times of departure to work in Atwood are 7:00 AM to 7:29 AM (38, 16.8%) for males and 7:00 AM to 7:29 AM (89, 42.0%) for females.
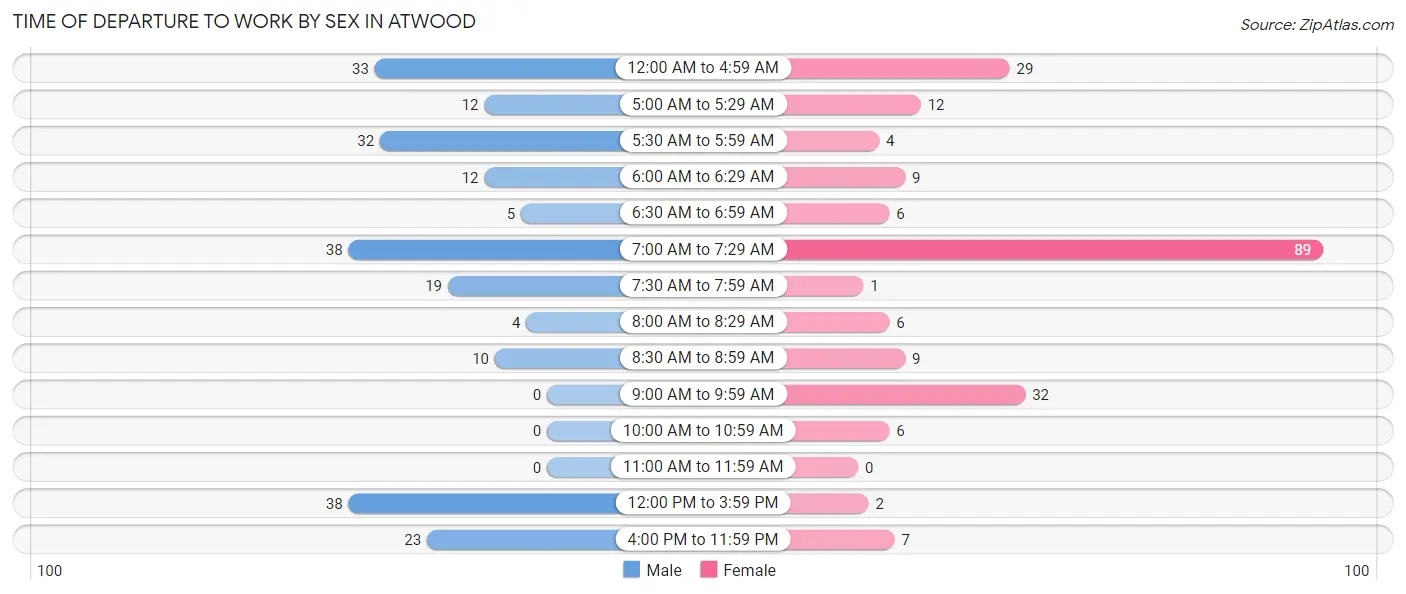
| Time of Departure | Male | Female |
| 12:00 AM to 4:59 AM | 33 (14.6%) | 29 (13.7%) |
| 5:00 AM to 5:29 AM | 12 (5.3%) | 12 (5.7%) |
| 5:30 AM to 5:59 AM | 32 (14.2%) | 4 (1.9%) |
| 6:00 AM to 6:29 AM | 12 (5.3%) | 9 (4.3%) |
| 6:30 AM to 6:59 AM | 5 (2.2%) | 6 (2.8%) |
| 7:00 AM to 7:29 AM | 38 (16.8%) | 89 (42.0%) |
| 7:30 AM to 7:59 AM | 19 (8.4%) | 1 (0.5%) |
| 8:00 AM to 8:29 AM | 4 (1.8%) | 6 (2.8%) |
| 8:30 AM to 8:59 AM | 10 (4.4%) | 9 (4.3%) |
| 9:00 AM to 9:59 AM | 0 (0.0%) | 32 (15.1%) |
| 10:00 AM to 10:59 AM | 0 (0.0%) | 6 (2.8%) |
| 11:00 AM to 11:59 AM | 0 (0.0%) | 0 (0.0%) |
| 12:00 PM to 3:59 PM | 38 (16.8%) | 2 (0.9%) |
| 4:00 PM to 11:59 PM | 23 (10.2%) | 7 (3.3%) |
| Total | 226 (100.0%) | 212 (100.0%) |
Housing Occupancy in Atwood
Occupancy by Ownership in Atwood
Of the total 457 dwellings in Atwood, owner-occupied units account for 372 (81.4%), while renter-occupied units make up 85 (18.6%).
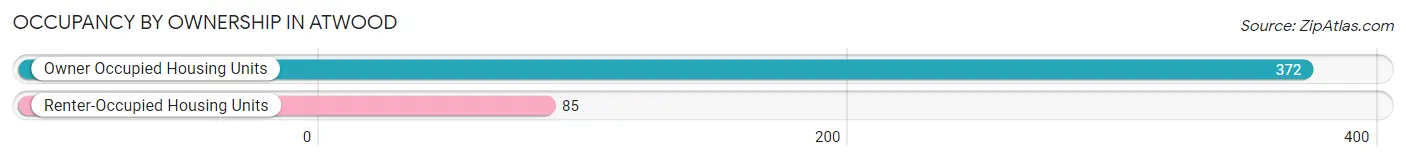
| Occupancy | # Housing Units | % Housing Units |
| Owner Occupied Housing Units | 372 | 81.4% |
| Renter-Occupied Housing Units | 85 | 18.6% |
| Total Occupied Housing Units | 457 | 100.0% |
Occupancy by Household Size in Atwood
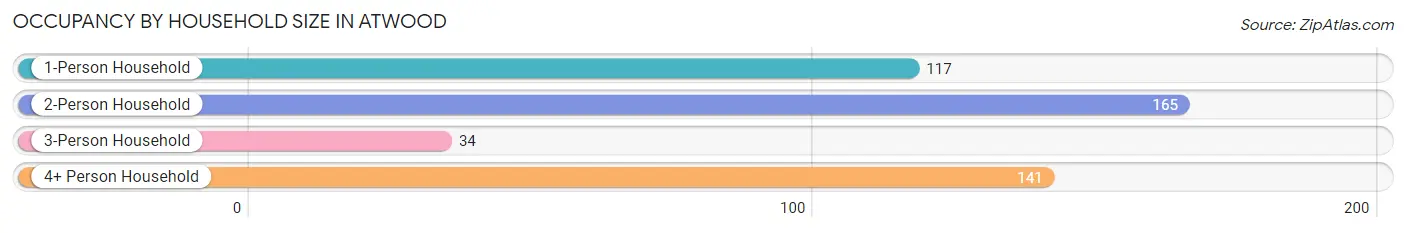
| Household Size | # Housing Units | % Housing Units |
| 1-Person Household | 117 | 25.6% |
| 2-Person Household | 165 | 36.1% |
| 3-Person Household | 34 | 7.4% |
| 4+ Person Household | 141 | 30.8% |
| Total Housing Units | 457 | 100.0% |
Occupancy by Ownership by Household Size in Atwood
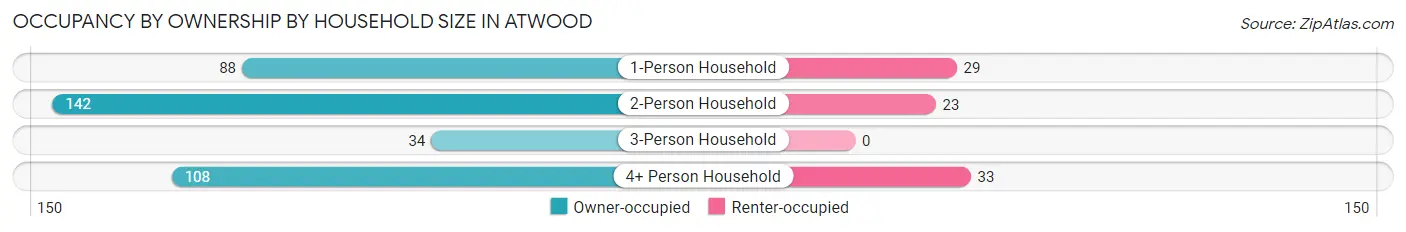
| Household Size | Owner-occupied | Renter-occupied |
| 1-Person Household | 88 (75.2%) | 29 (24.8%) |
| 2-Person Household | 142 (86.1%) | 23 (13.9%) |
| 3-Person Household | 34 (100.0%) | 0 (0.0%) |
| 4+ Person Household | 108 (76.6%) | 33 (23.4%) |
| Total Housing Units | 372 (81.4%) | 85 (18.6%) |
Occupancy by Educational Attainment in Atwood
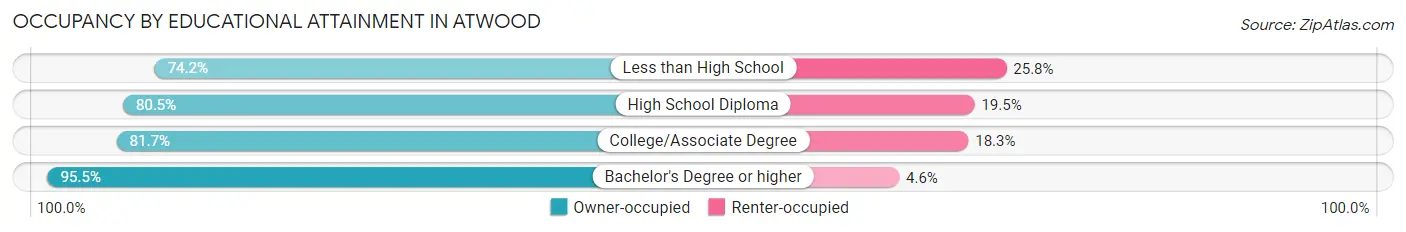
| Household Size | Owner-occupied | Renter-occupied |
| Less than High School | 46 (74.2%) | 16 (25.8%) |
| High School Diploma | 190 (80.5%) | 46 (19.5%) |
| College/Associate Degree | 94 (81.7%) | 21 (18.3%) |
| Bachelor's Degree or higher | 42 (95.5%) | 2 (4.5%) |
Occupancy by Age of Householder in Atwood
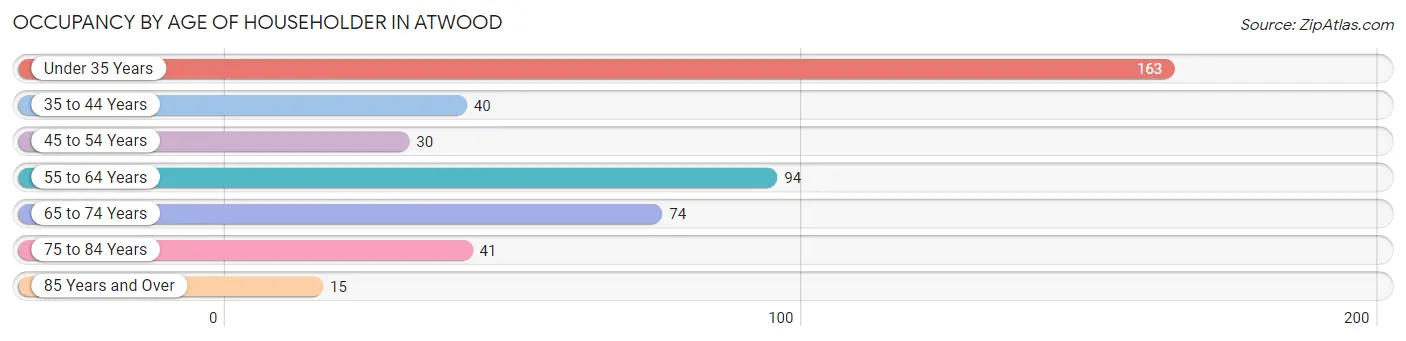
| Age Bracket | # Households | % Households |
| Under 35 Years | 163 | 35.7% |
| 35 to 44 Years | 40 | 8.7% |
| 45 to 54 Years | 30 | 6.6% |
| 55 to 64 Years | 94 | 20.6% |
| 65 to 74 Years | 74 | 16.2% |
| 75 to 84 Years | 41 | 9.0% |
| 85 Years and Over | 15 | 3.3% |
| Total | 457 | 100.0% |
Housing Finances in Atwood
Median Income by Occupancy in Atwood
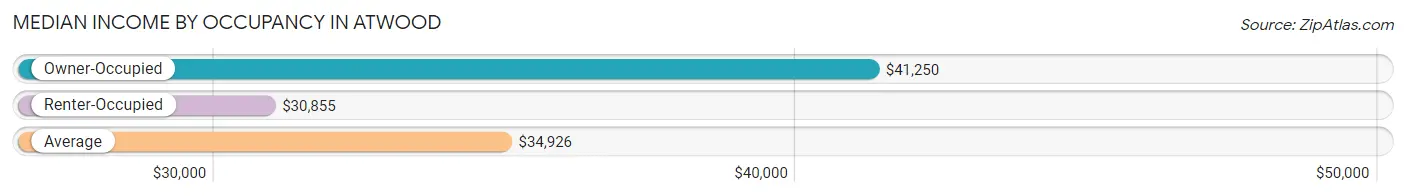
| Occupancy Type | # Households | Median Income |
| Owner-Occupied | 372 (81.4%) | $41,250 |
| Renter-Occupied | 85 (18.6%) | $30,855 |
| Average | 457 (100.0%) | $34,926 |
Occupancy by Householder Income Bracket in Atwood
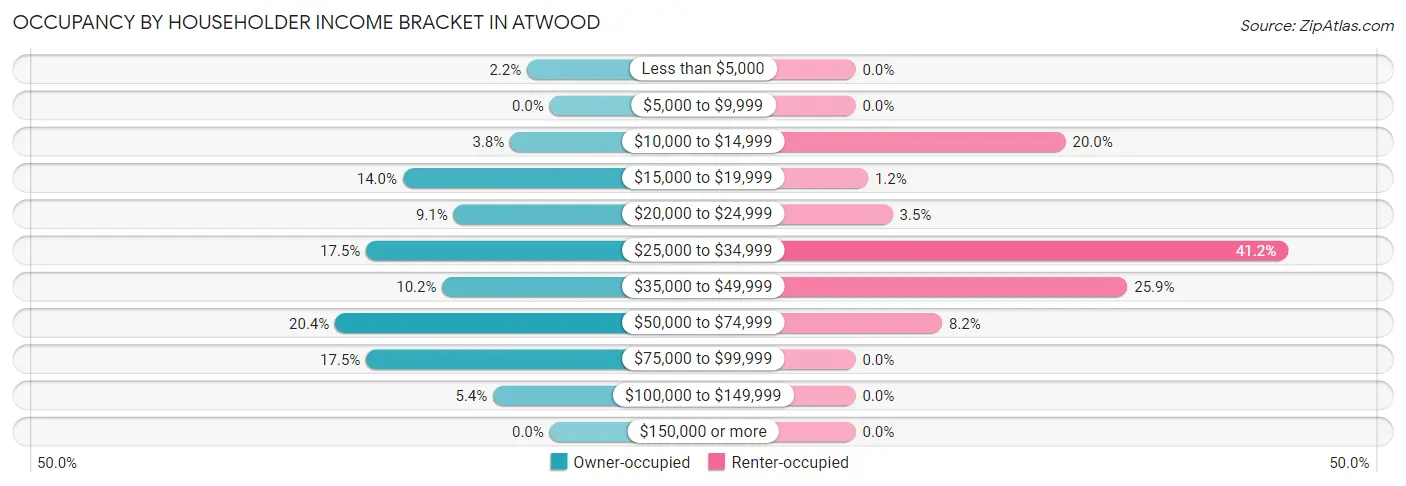
| Income Bracket | Owner-occupied | Renter-occupied |
| Less than $5,000 | 8 (2.1%) | 0 (0.0%) |
| $5,000 to $9,999 | 0 (0.0%) | 0 (0.0%) |
| $10,000 to $14,999 | 14 (3.8%) | 17 (20.0%) |
| $15,000 to $19,999 | 52 (14.0%) | 1 (1.2%) |
| $20,000 to $24,999 | 34 (9.1%) | 3 (3.5%) |
| $25,000 to $34,999 | 65 (17.5%) | 35 (41.2%) |
| $35,000 to $49,999 | 38 (10.2%) | 22 (25.9%) |
| $50,000 to $74,999 | 76 (20.4%) | 7 (8.2%) |
| $75,000 to $99,999 | 65 (17.5%) | 0 (0.0%) |
| $100,000 to $149,999 | 20 (5.4%) | 0 (0.0%) |
| $150,000 or more | 0 (0.0%) | 0 (0.0%) |
| Total | 372 (100.0%) | 85 (100.0%) |
Monthly Housing Cost Tiers in Atwood
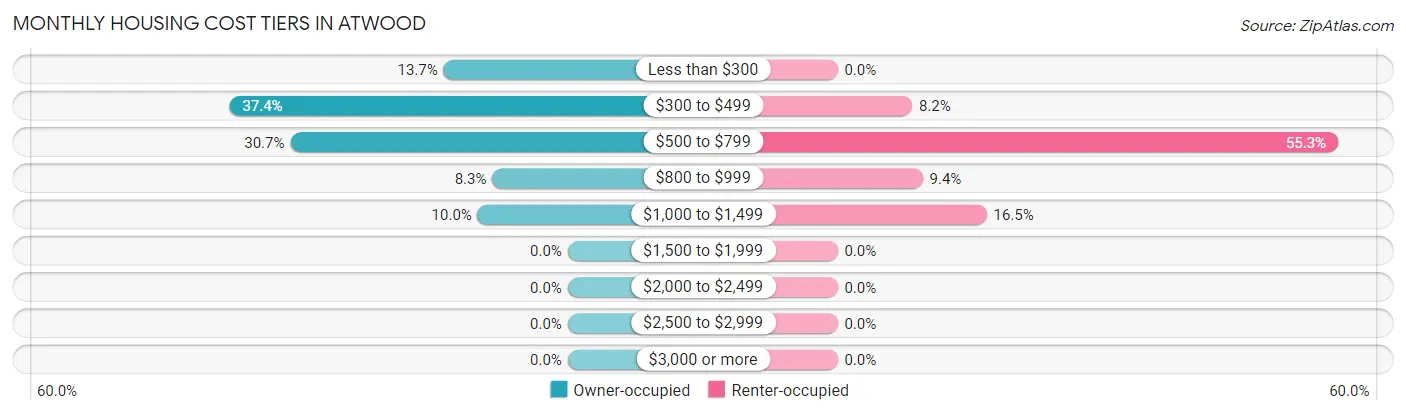
| Monthly Cost | Owner-occupied | Renter-occupied |
| Less than $300 | 51 (13.7%) | 0 (0.0%) |
| $300 to $499 | 139 (37.4%) | 7 (8.2%) |
| $500 to $799 | 114 (30.6%) | 47 (55.3%) |
| $800 to $999 | 31 (8.3%) | 8 (9.4%) |
| $1,000 to $1,499 | 37 (10.0%) | 14 (16.5%) |
| $1,500 to $1,999 | 0 (0.0%) | 0 (0.0%) |
| $2,000 to $2,499 | 0 (0.0%) | 0 (0.0%) |
| $2,500 to $2,999 | 0 (0.0%) | 0 (0.0%) |
| $3,000 or more | 0 (0.0%) | 0 (0.0%) |
| Total | 372 (100.0%) | 85 (100.0%) |
Physical Housing Characteristics in Atwood
Housing Structures in Atwood
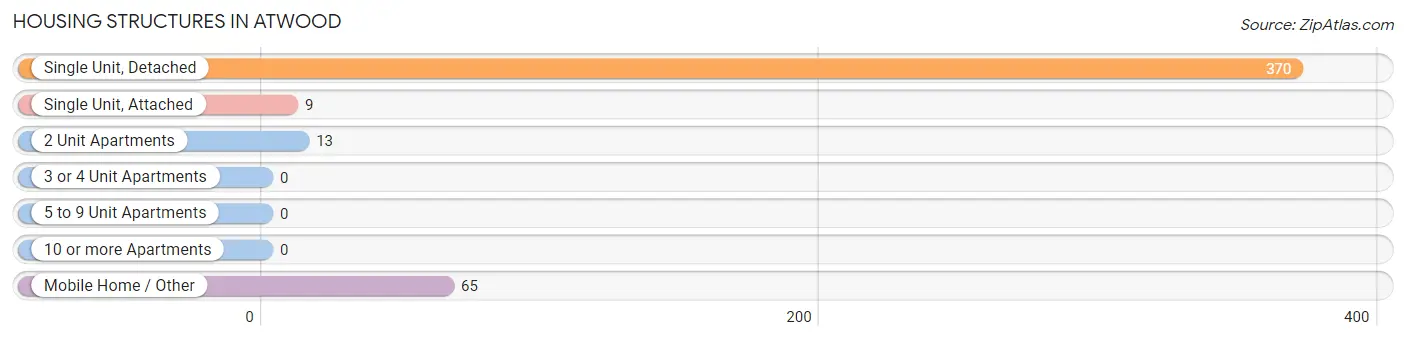
| Structure Type | # Housing Units | % Housing Units |
| Single Unit, Detached | 370 | 81.0% |
| Single Unit, Attached | 9 | 2.0% |
| 2 Unit Apartments | 13 | 2.8% |
| 3 or 4 Unit Apartments | 0 | 0.0% |
| 5 to 9 Unit Apartments | 0 | 0.0% |
| 10 or more Apartments | 0 | 0.0% |
| Mobile Home / Other | 65 | 14.2% |
| Total | 457 | 100.0% |
Housing Structures by Occupancy in Atwood
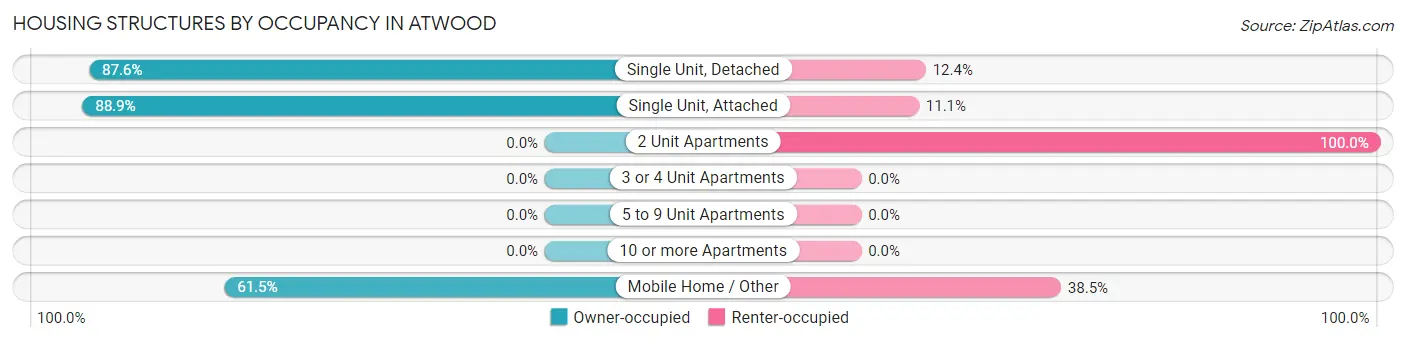
| Structure Type | Owner-occupied | Renter-occupied |
| Single Unit, Detached | 324 (87.6%) | 46 (12.4%) |
| Single Unit, Attached | 8 (88.9%) | 1 (11.1%) |
| 2 Unit Apartments | 0 (0.0%) | 13 (100.0%) |
| 3 or 4 Unit Apartments | 0 (0.0%) | 0 (0.0%) |
| 5 to 9 Unit Apartments | 0 (0.0%) | 0 (0.0%) |
| 10 or more Apartments | 0 (0.0%) | 0 (0.0%) |
| Mobile Home / Other | 40 (61.5%) | 25 (38.5%) |
| Total | 372 (81.4%) | 85 (18.6%) |
Housing Structures by Number of Rooms in Atwood
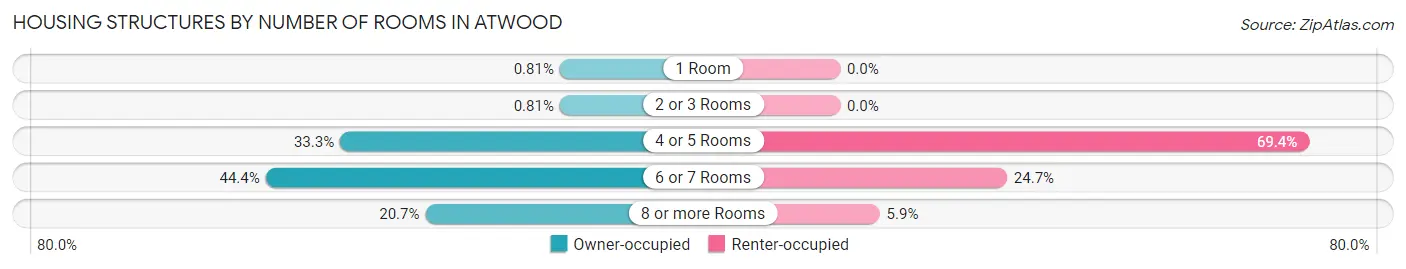
| Number of Rooms | Owner-occupied | Renter-occupied |
| 1 Room | 3 (0.8%) | 0 (0.0%) |
| 2 or 3 Rooms | 3 (0.8%) | 0 (0.0%) |
| 4 or 5 Rooms | 124 (33.3%) | 59 (69.4%) |
| 6 or 7 Rooms | 165 (44.4%) | 21 (24.7%) |
| 8 or more Rooms | 77 (20.7%) | 5 (5.9%) |
| Total | 372 (100.0%) | 85 (100.0%) |
Housing Structure by Heating Type in Atwood
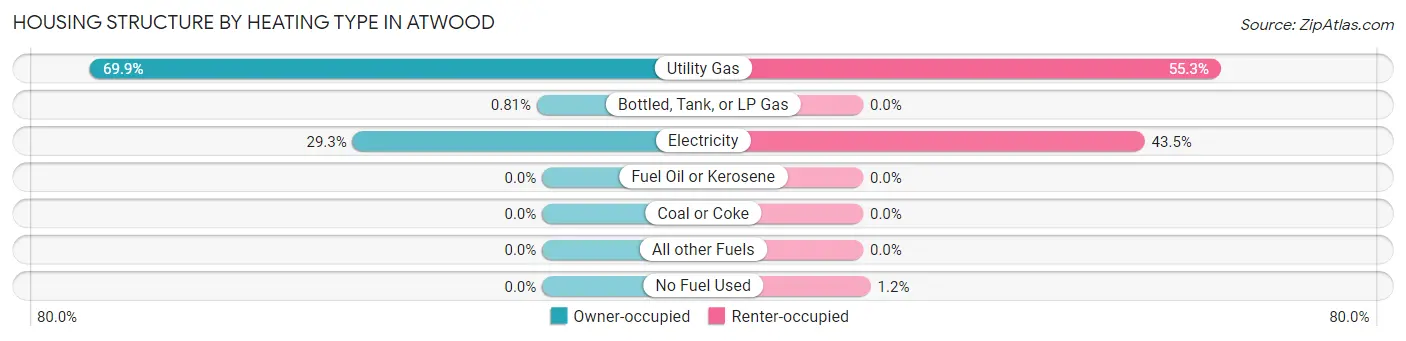
| Heating Type | Owner-occupied | Renter-occupied |
| Utility Gas | 260 (69.9%) | 47 (55.3%) |
| Bottled, Tank, or LP Gas | 3 (0.8%) | 0 (0.0%) |
| Electricity | 109 (29.3%) | 37 (43.5%) |
| Fuel Oil or Kerosene | 0 (0.0%) | 0 (0.0%) |
| Coal or Coke | 0 (0.0%) | 0 (0.0%) |
| All other Fuels | 0 (0.0%) | 0 (0.0%) |
| No Fuel Used | 0 (0.0%) | 1 (1.2%) |
| Total | 372 (100.0%) | 85 (100.0%) |
Household Vehicle Usage in Atwood
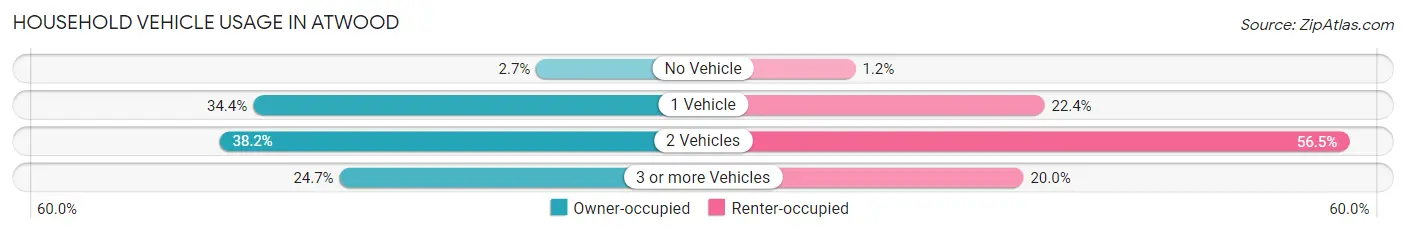
| Vehicles per Household | Owner-occupied | Renter-occupied |
| No Vehicle | 10 (2.7%) | 1 (1.2%) |
| 1 Vehicle | 128 (34.4%) | 19 (22.4%) |
| 2 Vehicles | 142 (38.2%) | 48 (56.5%) |
| 3 or more Vehicles | 92 (24.7%) | 17 (20.0%) |
| Total | 372 (100.0%) | 85 (100.0%) |
Real Estate & Mortgages in Atwood
Real Estate and Mortgage Overview in Atwood
| Characteristic | Without Mortgage | With Mortgage |
| Housing Units | 196 | 176 |
| Median Property Value | $64,800 | $85,100 |
| Median Household Income | $32,083 | $0 |
| Monthly Housing Costs | $345 | $0 |
| Real Estate Taxes | $443 | $48 |
Property Value by Mortgage Status in Atwood
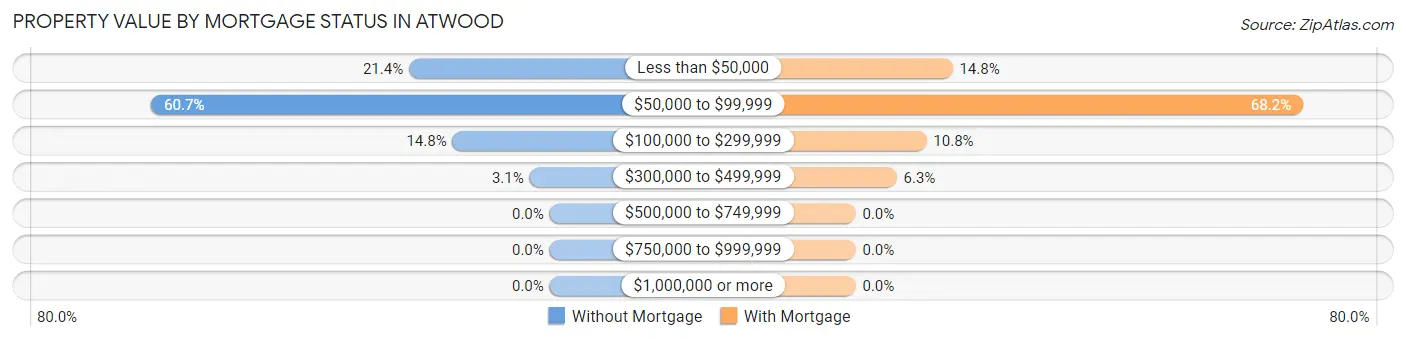
| Property Value | Without Mortgage | With Mortgage |
| Less than $50,000 | 42 (21.4%) | 26 (14.8%) |
| $50,000 to $99,999 | 119 (60.7%) | 120 (68.2%) |
| $100,000 to $299,999 | 29 (14.8%) | 19 (10.8%) |
| $300,000 to $499,999 | 6 (3.1%) | 11 (6.2%) |
| $500,000 to $749,999 | 0 (0.0%) | 0 (0.0%) |
| $750,000 to $999,999 | 0 (0.0%) | 0 (0.0%) |
| $1,000,000 or more | 0 (0.0%) | 0 (0.0%) |
| Total | 196 (100.0%) | 176 (100.0%) |
Household Income by Mortgage Status in Atwood
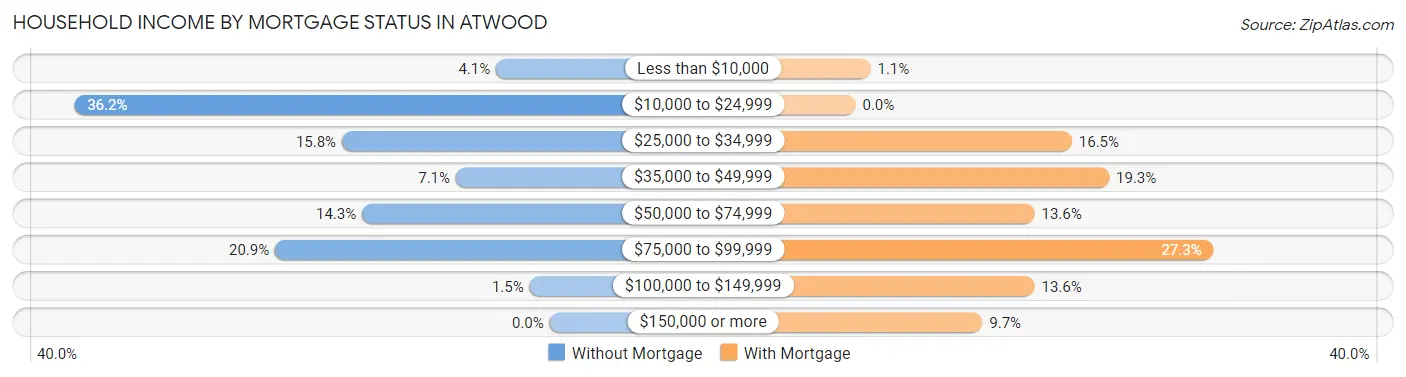
| Household Income | Without Mortgage | With Mortgage |
| Less than $10,000 | 8 (4.1%) | 2 (1.1%) |
| $10,000 to $24,999 | 71 (36.2%) | 0 (0.0%) |
| $25,000 to $34,999 | 31 (15.8%) | 29 (16.5%) |
| $35,000 to $49,999 | 14 (7.1%) | 34 (19.3%) |
| $50,000 to $74,999 | 28 (14.3%) | 24 (13.6%) |
| $75,000 to $99,999 | 41 (20.9%) | 48 (27.3%) |
| $100,000 to $149,999 | 3 (1.5%) | 24 (13.6%) |
| $150,000 or more | 0 (0.0%) | 17 (9.7%) |
| Total | 196 (100.0%) | 176 (100.0%) |
Property Value to Household Income Ratio in Atwood
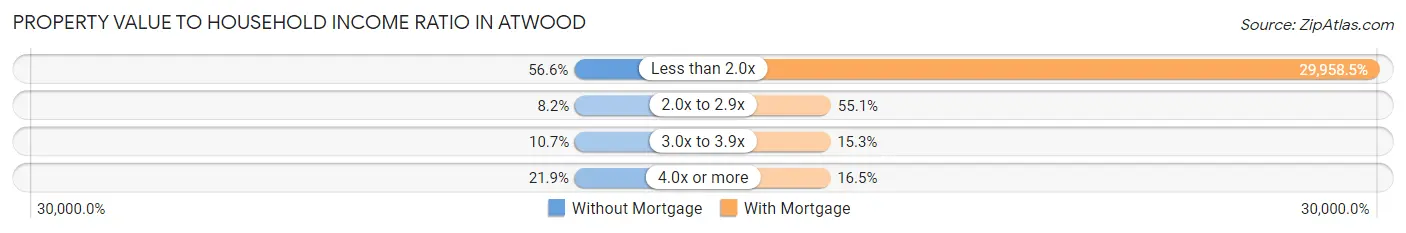
| Value-to-Income Ratio | Without Mortgage | With Mortgage |
| Less than 2.0x | 111 (56.6%) | 52,727 (29,958.5%) |
| 2.0x to 2.9x | 16 (8.2%) | 97 (55.1%) |
| 3.0x to 3.9x | 21 (10.7%) | 27 (15.3%) |
| 4.0x or more | 43 (21.9%) | 29 (16.5%) |
| Total | 196 (100.0%) | 176 (100.0%) |
Real Estate Taxes by Mortgage Status in Atwood
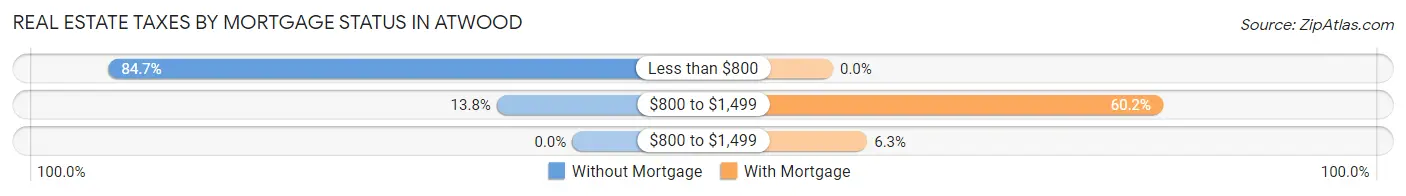
| Property Taxes | Without Mortgage | With Mortgage |
| Less than $800 | 166 (84.7%) | 0 (0.0%) |
| $800 to $1,499 | 27 (13.8%) | 106 (60.2%) |
| $800 to $1,499 | 0 (0.0%) | 11 (6.2%) |
| Total | 196 (100.0%) | 176 (100.0%) |
Health & Disability in Atwood
Health Insurance Coverage by Age in Atwood
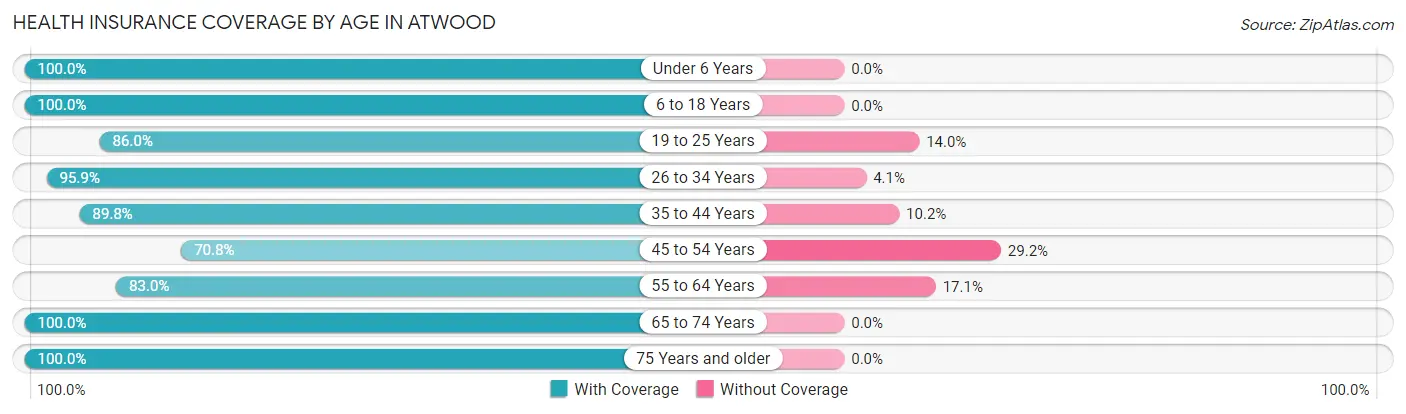
| Age Bracket | With Coverage | Without Coverage |
| Under 6 Years | 145 (100.0%) | 0 (0.0%) |
| 6 to 18 Years | 284 (100.0%) | 0 (0.0%) |
| 19 to 25 Years | 117 (86.0%) | 19 (14.0%) |
| 26 to 34 Years | 164 (95.9%) | 7 (4.1%) |
| 35 to 44 Years | 79 (89.8%) | 9 (10.2%) |
| 45 to 54 Years | 63 (70.8%) | 26 (29.2%) |
| 55 to 64 Years | 107 (83.0%) | 22 (17.1%) |
| 65 to 74 Years | 115 (100.0%) | 0 (0.0%) |
| 75 Years and older | 72 (100.0%) | 0 (0.0%) |
| Total | 1,146 (93.2%) | 83 (6.8%) |
Health Insurance Coverage by Citizenship Status in Atwood
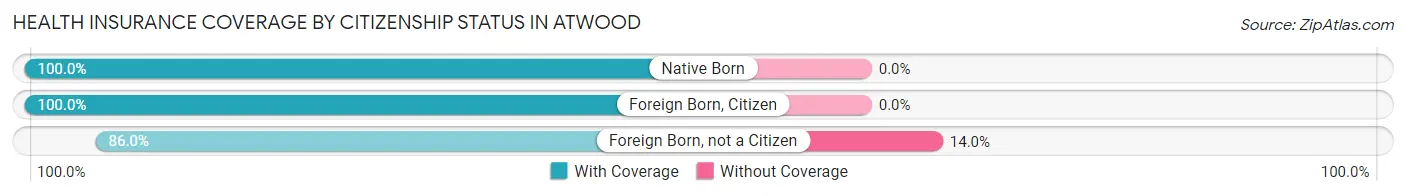
| Citizenship Status | With Coverage | Without Coverage |
| Native Born | 145 (100.0%) | 0 (0.0%) |
| Foreign Born, Citizen | 284 (100.0%) | 0 (0.0%) |
| Foreign Born, not a Citizen | 117 (86.0%) | 19 (14.0%) |
Health Insurance Coverage by Household Income in Atwood
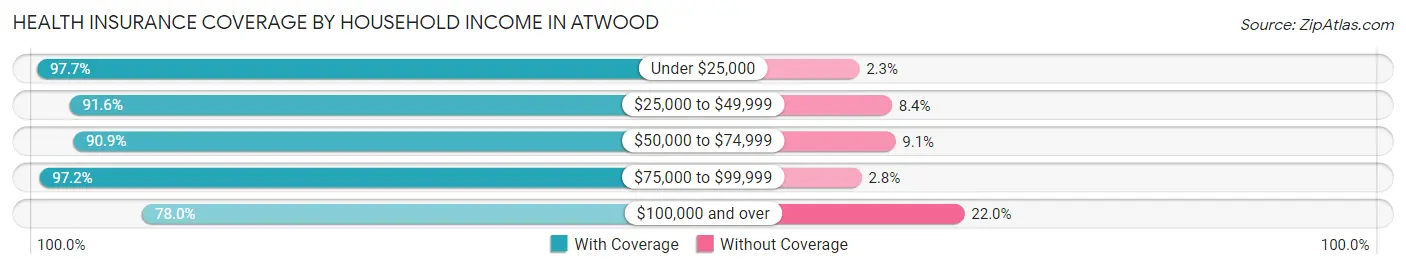
| Household Income | With Coverage | Without Coverage |
| Under $25,000 | 294 (97.7%) | 7 (2.3%) |
| $25,000 to $49,999 | 315 (91.6%) | 29 (8.4%) |
| $50,000 to $74,999 | 280 (90.9%) | 28 (9.1%) |
| $75,000 to $99,999 | 211 (97.2%) | 6 (2.8%) |
| $100,000 and over | 46 (78.0%) | 13 (22.0%) |
Public vs Private Health Insurance Coverage by Age in Atwood
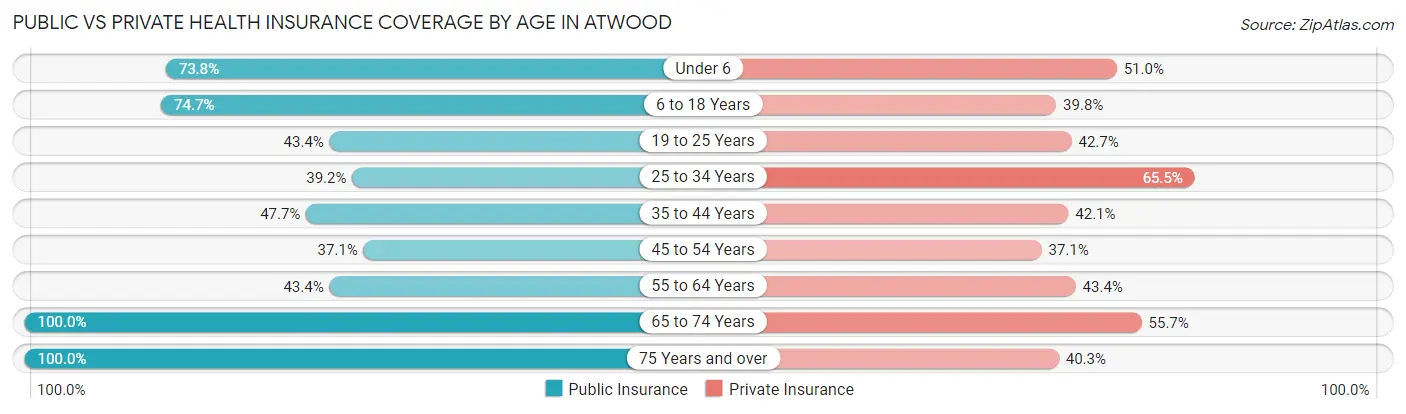
| Age Bracket | Public Insurance | Private Insurance |
| Under 6 | 107 (73.8%) | 74 (51.0%) |
| 6 to 18 Years | 212 (74.7%) | 113 (39.8%) |
| 19 to 25 Years | 59 (43.4%) | 58 (42.6%) |
| 25 to 34 Years | 67 (39.2%) | 112 (65.5%) |
| 35 to 44 Years | 42 (47.7%) | 37 (42.0%) |
| 45 to 54 Years | 33 (37.1%) | 33 (37.1%) |
| 55 to 64 Years | 56 (43.4%) | 56 (43.4%) |
| 65 to 74 Years | 115 (100.0%) | 64 (55.6%) |
| 75 Years and over | 72 (100.0%) | 29 (40.3%) |
| Total | 763 (62.1%) | 576 (46.9%) |
Disability Status by Sex by Age in Atwood
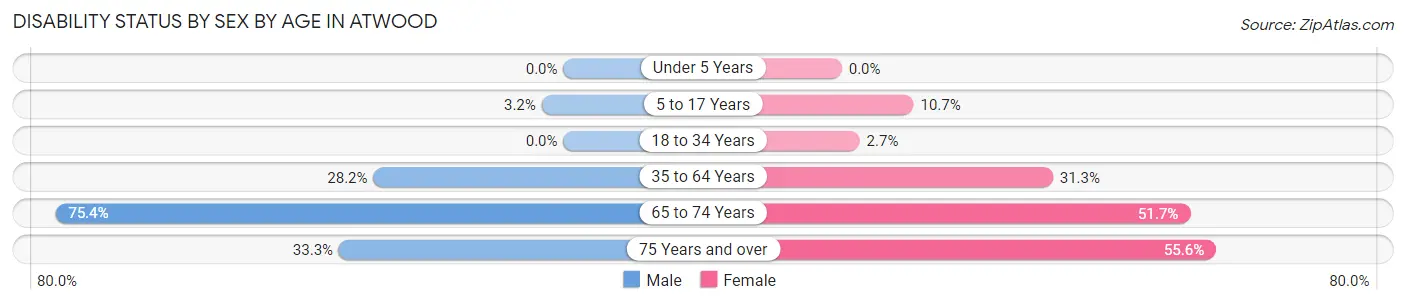
| Age Bracket | Male | Female |
| Under 5 Years | 0 (0.0%) | 0 (0.0%) |
| 5 to 17 Years | 4 (3.2%) | 18 (10.6%) |
| 18 to 34 Years | 0 (0.0%) | 5 (2.6%) |
| 35 to 64 Years | 44 (28.2%) | 47 (31.3%) |
| 65 to 74 Years | 43 (75.4%) | 30 (51.7%) |
| 75 Years and over | 9 (33.3%) | 25 (55.6%) |
Disability Class by Sex by Age in Atwood
Disability Class: Hearing Difficulty
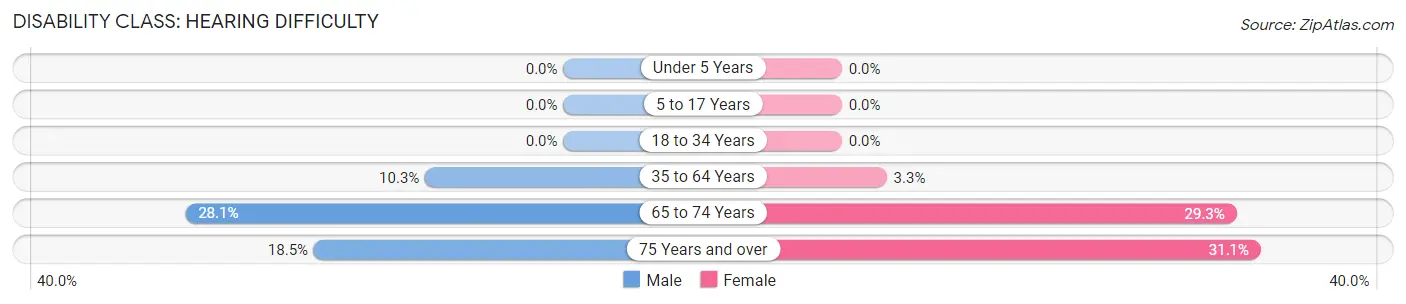
| Age Bracket | Male | Female |
| Under 5 Years | 0 (0.0%) | 0 (0.0%) |
| 5 to 17 Years | 0 (0.0%) | 0 (0.0%) |
| 18 to 34 Years | 0 (0.0%) | 0 (0.0%) |
| 35 to 64 Years | 16 (10.3%) | 5 (3.3%) |
| 65 to 74 Years | 16 (28.1%) | 17 (29.3%) |
| 75 Years and over | 5 (18.5%) | 14 (31.1%) |
Disability Class: Vision Difficulty
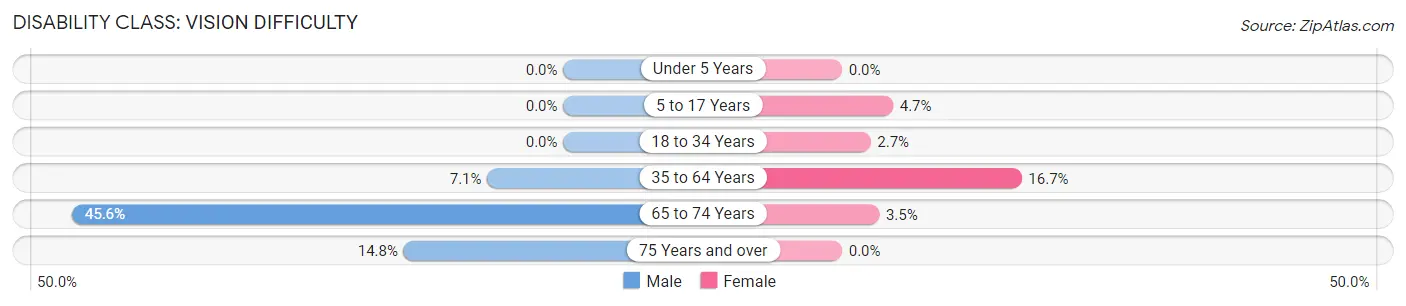
| Age Bracket | Male | Female |
| Under 5 Years | 0 (0.0%) | 0 (0.0%) |
| 5 to 17 Years | 0 (0.0%) | 8 (4.7%) |
| 18 to 34 Years | 0 (0.0%) | 5 (2.6%) |
| 35 to 64 Years | 11 (7.0%) | 25 (16.7%) |
| 65 to 74 Years | 26 (45.6%) | 2 (3.5%) |
| 75 Years and over | 4 (14.8%) | 0 (0.0%) |
Disability Class: Cognitive Difficulty
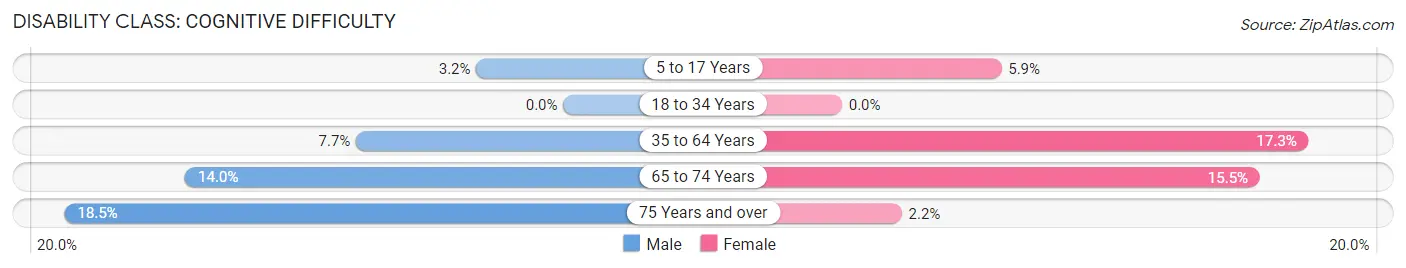
| Age Bracket | Male | Female |
| 5 to 17 Years | 4 (3.2%) | 10 (5.9%) |
| 18 to 34 Years | 0 (0.0%) | 0 (0.0%) |
| 35 to 64 Years | 12 (7.7%) | 26 (17.3%) |
| 65 to 74 Years | 8 (14.0%) | 9 (15.5%) |
| 75 Years and over | 5 (18.5%) | 1 (2.2%) |
Disability Class: Ambulatory Difficulty
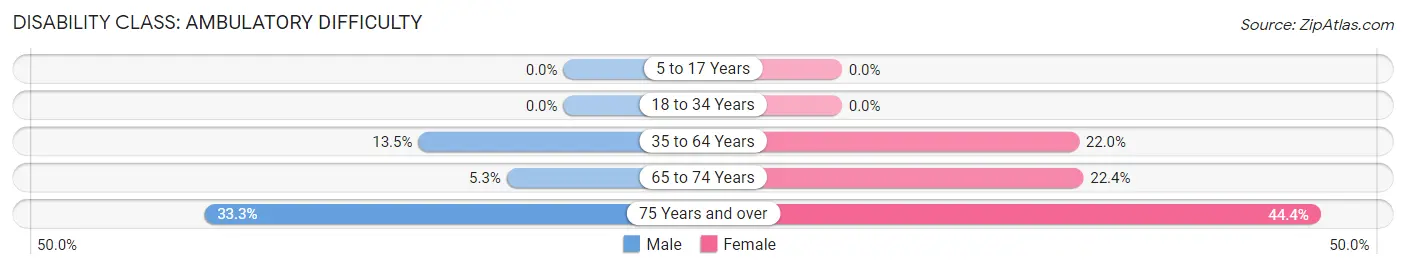
| Age Bracket | Male | Female |
| 5 to 17 Years | 0 (0.0%) | 0 (0.0%) |
| 18 to 34 Years | 0 (0.0%) | 0 (0.0%) |
| 35 to 64 Years | 21 (13.5%) | 33 (22.0%) |
| 65 to 74 Years | 3 (5.3%) | 13 (22.4%) |
| 75 Years and over | 9 (33.3%) | 20 (44.4%) |
Disability Class: Self-Care Difficulty
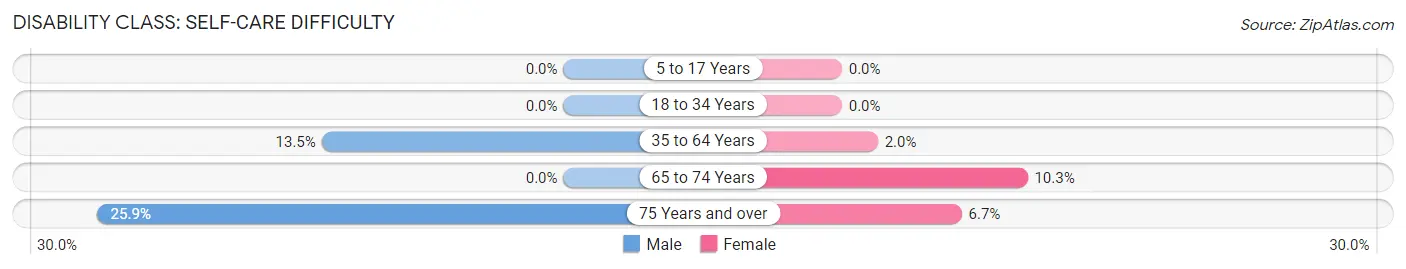
| Age Bracket | Male | Female |
| 5 to 17 Years | 0 (0.0%) | 0 (0.0%) |
| 18 to 34 Years | 0 (0.0%) | 0 (0.0%) |
| 35 to 64 Years | 21 (13.5%) | 3 (2.0%) |
| 65 to 74 Years | 0 (0.0%) | 6 (10.3%) |
| 75 Years and over | 7 (25.9%) | 3 (6.7%) |
Technology Access in Atwood
Computing Device Access in Atwood
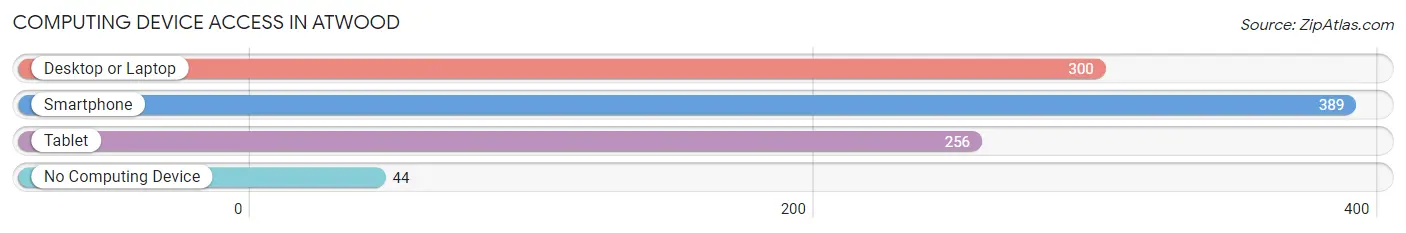
| Device Type | # Households | % Households |
| Desktop or Laptop | 300 | 65.6% |
| Smartphone | 389 | 85.1% |
| Tablet | 256 | 56.0% |
| No Computing Device | 44 | 9.6% |
| Total | 457 | 100.0% |
Internet Access in Atwood
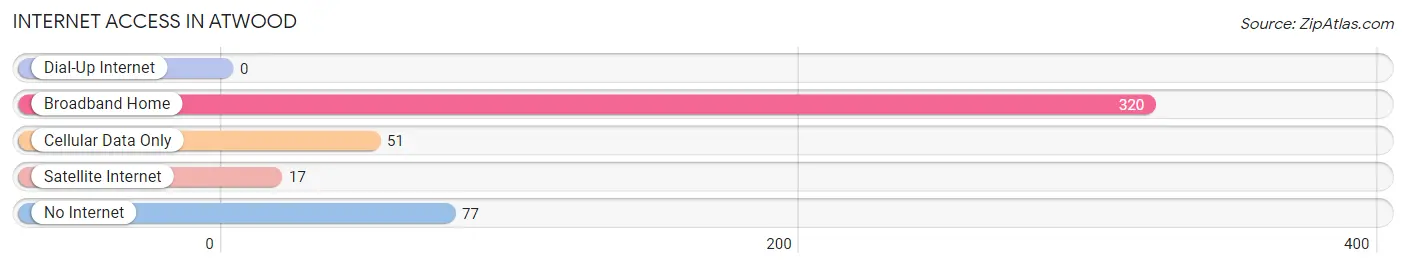
| Internet Type | # Households | % Households |
| Dial-Up Internet | 0 | 0.0% |
| Broadband Home | 320 | 70.0% |
| Cellular Data Only | 51 | 11.2% |
| Satellite Internet | 17 | 3.7% |
| No Internet | 77 | 16.9% |
| Total | 457 | 100.0% |
Atwood Summary
Atwood is a small town located in Carroll County, Tennessee. It is situated in the western part of the state, approximately 50 miles east of Memphis. The town has a population of approximately 1,000 people and is part of the larger Jackson metropolitan area.
History
Atwood was founded in 1887 by a group of settlers from the nearby town of Huntingdon. The town was named after the Atwood family, who were among the first settlers. The town was originally a farming community, but in the early 1900s, the town began to grow and develop. The first post office was established in 1906, and the town was incorporated in 1909.
Atwood experienced a period of growth in the 1920s and 1930s, when the town was home to several businesses, including a bank, a hotel, a movie theater, and a variety of stores. The town also had a thriving agricultural industry, with cotton, corn, and soybeans being the main crops.
In the 1950s, Atwood began to decline as the population began to move away from the area. The town experienced a period of stagnation until the late 1980s, when the town began to experience a resurgence. The town has since become a popular tourist destination, with many visitors coming to enjoy the town's small-town charm and its proximity to the nearby city of Jackson.
Geography
Atwood is located in western Tennessee, approximately 50 miles east of Memphis. The town is situated in the foothills of the Appalachian Mountains, and is surrounded by rolling hills and forests. The town is located near the Tennessee River, and is home to several small lakes and streams.
The climate in Atwood is humid subtropical, with hot summers and mild winters. The average annual temperature is around 70 degrees Fahrenheit, and the average annual precipitation is around 45 inches.
Economy
Atwood's economy is largely based on tourism and agriculture. The town is home to several small businesses, including restaurants, shops, and a variety of services. The town is also home to several farms, which produce a variety of crops, including cotton, corn, and soybeans.
The town is also home to several manufacturing companies, including a furniture factory and a plastics factory. The town is also home to a number of small businesses, including a variety of shops and restaurants.
Demographics
Atwood has a population of approximately 1,000 people. The town is predominantly white, with a small African American population. The median household income is around $35,000, and the median home value is around $100,000. The town has a low unemployment rate, and the poverty rate is below the national average.
Common Questions
What is Per Capita Income in Atwood?
Per Capita income in Atwood is $16,581.
What is the Median Family Income in Atwood?
Median Family Income in Atwood is $46,875.
What is the Median Household income in Atwood?
Median Household Income in Atwood is $34,926.
What is Income or Wage Gap in Atwood?
Income or Wage Gap in Atwood is 23.9%.
Women in Atwood earn 76.1 cents for every dollar earned by a man.
What is Inequality or Gini Index in Atwood?
Inequality or Gini Index in Atwood is 0.35.
What is the Total Population of Atwood?
Total Population of Atwood is 1,229.
What is the Total Male Population of Atwood?
Total Male Population of Atwood is 572.
What is the Total Female Population of Atwood?
Total Female Population of Atwood is 657.
What is the Ratio of Males per 100 Females in Atwood?
There are 87.06 Males per 100 Females in Atwood.
What is the Ratio of Females per 100 Males in Atwood?
There are 114.86 Females per 100 Males in Atwood.
What is the Median Population Age in Atwood?
Median Population Age in Atwood is 30.1 Years.
What is the Average Family Size in Atwood
Average Family Size in Atwood is 3.2 People.
What is the Average Household Size in Atwood
Average Household Size in Atwood is 2.7 People.
How Large is the Labor Force in Atwood?
There are 527 People in the Labor Forcein in Atwood.
What is the Percentage of People in the Labor Force in Atwood?
61.8% of People are in the Labor Force in Atwood.
What is the Unemployment Rate in Atwood?
Unemployment Rate in Atwood is 12.7%.