Zip Codes with the Highest Percentage of Population Employed in Architecture & Engineering in Rapid City, SD
RELATED REPORTS & OPTIONS
Architecture & Engineering
Rapid City
Compare Zip Codes
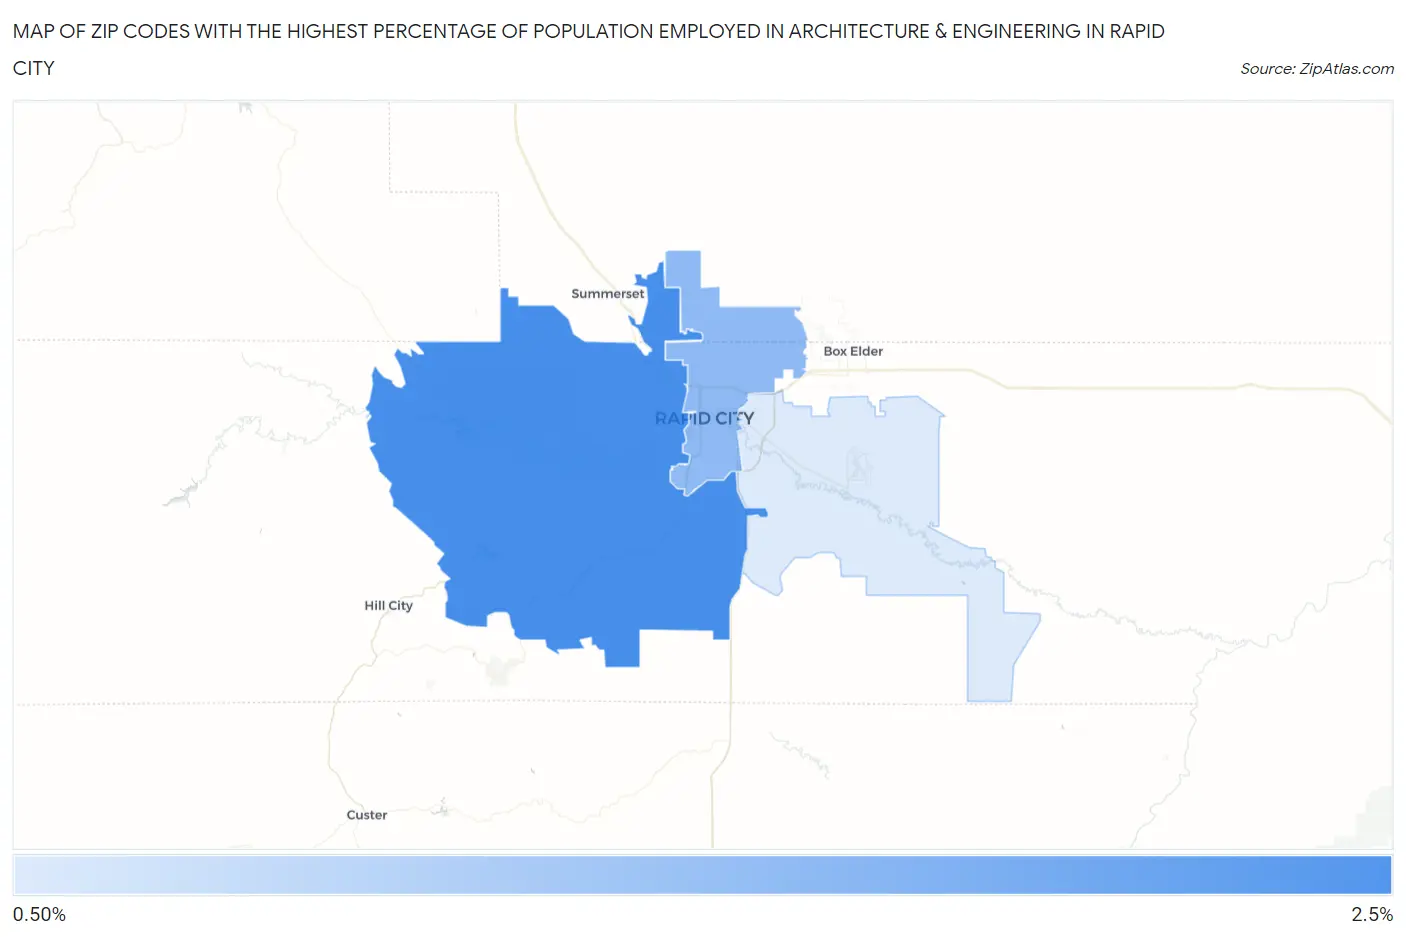
Map of Zip Codes with the Highest Percentage of Population Employed in Architecture & Engineering in Rapid City
1.0%
2.1%
Zip Codes with the Highest Percentage of Population Employed in Architecture & Engineering in Rapid City, SD
| Zip Code | % Employed | vs State | vs National | |
| 1. | 57702 | 2.1% | 1.6%(+0.462)#57 | 2.1%(-0.097)#9,311 |
| 2. | 57701 | 1.6% | 1.6%(-0.031)#80 | 2.1%(-0.590)#12,445 |
| 3. | 57703 | 1.0% | 1.6%(-0.560)#111 | 2.1%(-1.12)#16,389 |
1
Common Questions
What are the Top Zip Codes with the Highest Percentage of Population Employed in Architecture & Engineering in Rapid City, SD?
Top Zip Codes with the Highest Percentage of Population Employed in Architecture & Engineering in Rapid City, SD are:
What zip code has the Highest Percentage of Population Employed in Architecture & Engineering in Rapid City, SD?
57702 has the Highest Percentage of Population Employed in Architecture & Engineering in Rapid City, SD with 2.1%.
What is the Percentage of Population Employed in Architecture & Engineering in Rapid City, SD?
Percentage of Population Employed in Architecture & Engineering in Rapid City is 1.7%.
What is the Percentage of Population Employed in Architecture & Engineering in South Dakota?
Percentage of Population Employed in Architecture & Engineering in South Dakota is 1.6%.
What is the Percentage of Population Employed in Architecture & Engineering in the United States?
Percentage of Population Employed in Architecture & Engineering in the United States is 2.1%.