Williams, OR Map & Demographics
Williams Map
Williams Overview
$32,512
PER CAPITA INCOME
$86,493
AVG FAMILY INCOME
$81,310
AVG HOUSEHOLD INCOME
32.3%
WAGE / INCOME GAP [ % ]
67.7¢/ $1
WAGE / INCOME GAP [ $ ]
0.30
INEQUALITY / GINI INDEX
1,173
TOTAL POPULATION
622
MALE POPULATION
551
FEMALE POPULATION
112.89
MALES / 100 FEMALES
88.59
FEMALES / 100 MALES
43.2
MEDIAN AGE
3.0
AVG FAMILY SIZE
2.4
AVG HOUSEHOLD SIZE
531
LABOR FORCE [ PEOPLE ]
59.5%
PERCENT IN LABOR FORCE
Williams Zip Codes
Williams Area Codes
Income in Williams
Income Overview in Williams
Per Capita Income in Williams is $32,512, while median incomes of families and households are $86,493 and $81,310 respectively.
| Characteristic | Number | Measure |
| Per Capita Income | 1,173 | $32,512 |
| Median Family Income | 275 | $86,493 |
| Mean Family Income | 275 | $83,247 |
| Median Household Income | 494 | $81,310 |
| Mean Household Income | 494 | $77,551 |
| Income Deficit | 275 | $0 |
| Wage / Income Gap (%) | 1,173 | 32.35% |
| Wage / Income Gap ($) | 1,173 | 67.65¢ per $1 |
| Gini / Inequality Index | 1,173 | 0.30 |
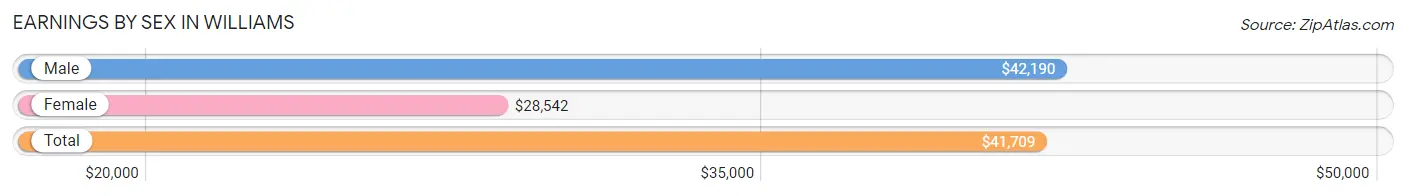
Earnings by Sex in Williams
Average Earnings in Williams are $41,709, $42,190 for men and $28,542 for women, a difference of 32.4%.
| Sex | Number | Average Earnings |
| Male | 311 (58.6%) | $42,190 |
| Female | 220 (41.4%) | $28,542 |
| Total | 531 (100.0%) | $41,709 |
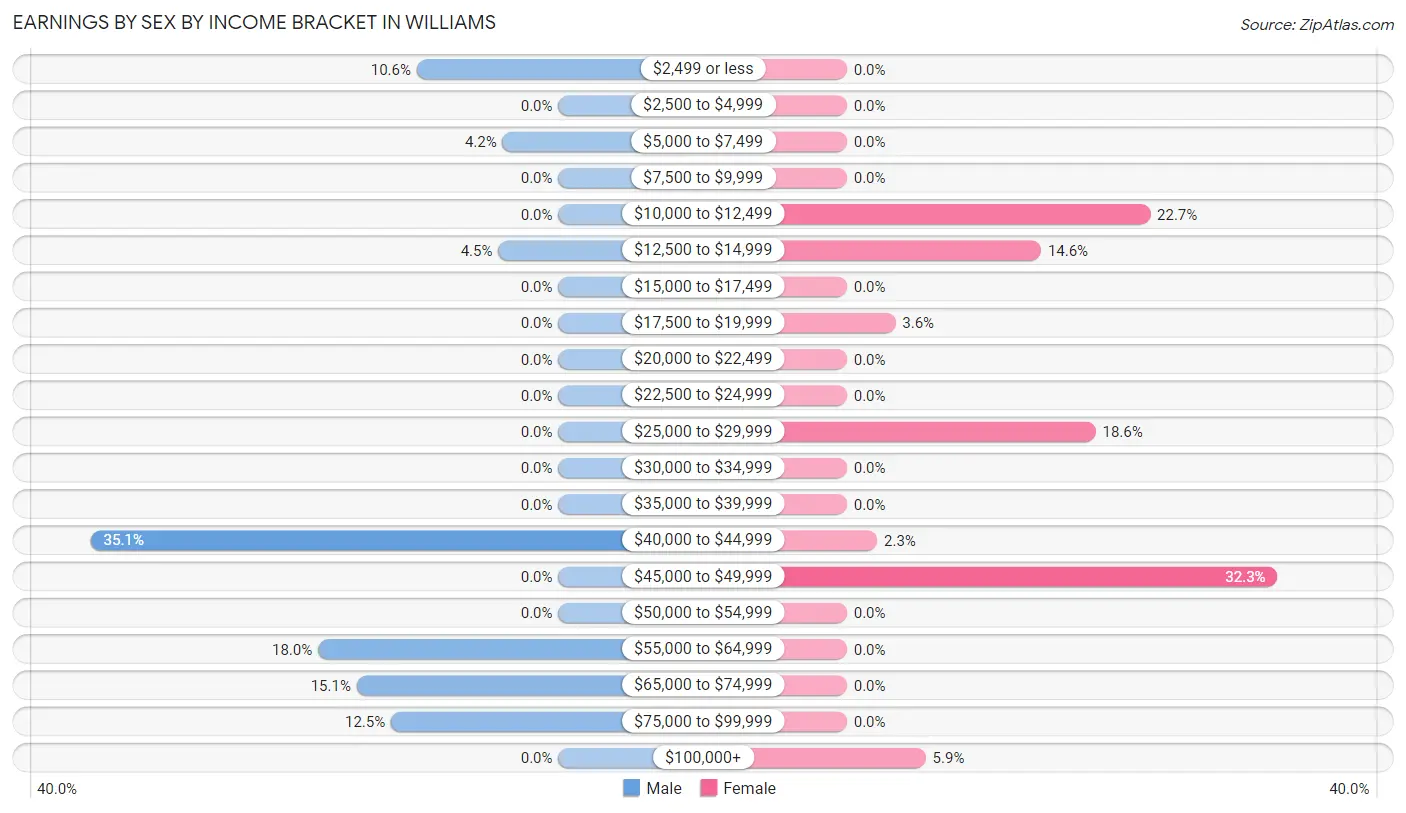
Earnings by Sex by Income Bracket in Williams
The most common earnings brackets in Williams are $40,000 to $44,999 for men (109 | 35.0%) and $45,000 to $49,999 for women (71 | 32.3%).
| Income | Male | Female |
| $2,499 or less | 33 (10.6%) | 0 (0.0%) |
| $2,500 to $4,999 | 0 (0.0%) | 0 (0.0%) |
| $5,000 to $7,499 | 13 (4.2%) | 0 (0.0%) |
| $7,500 to $9,999 | 0 (0.0%) | 0 (0.0%) |
| $10,000 to $12,499 | 0 (0.0%) | 50 (22.7%) |
| $12,500 to $14,999 | 14 (4.5%) | 32 (14.5%) |
| $15,000 to $17,499 | 0 (0.0%) | 0 (0.0%) |
| $17,500 to $19,999 | 0 (0.0%) | 8 (3.6%) |
| $20,000 to $22,499 | 0 (0.0%) | 0 (0.0%) |
| $22,500 to $24,999 | 0 (0.0%) | 0 (0.0%) |
| $25,000 to $29,999 | 0 (0.0%) | 41 (18.6%) |
| $30,000 to $34,999 | 0 (0.0%) | 0 (0.0%) |
| $35,000 to $39,999 | 0 (0.0%) | 0 (0.0%) |
| $40,000 to $44,999 | 109 (35.0%) | 5 (2.3%) |
| $45,000 to $49,999 | 0 (0.0%) | 71 (32.3%) |
| $50,000 to $54,999 | 0 (0.0%) | 0 (0.0%) |
| $55,000 to $64,999 | 56 (18.0%) | 0 (0.0%) |
| $65,000 to $74,999 | 47 (15.1%) | 0 (0.0%) |
| $75,000 to $99,999 | 39 (12.5%) | 0 (0.0%) |
| $100,000+ | 0 (0.0%) | 13 (5.9%) |
| Total | 311 (100.0%) | 220 (100.0%) |
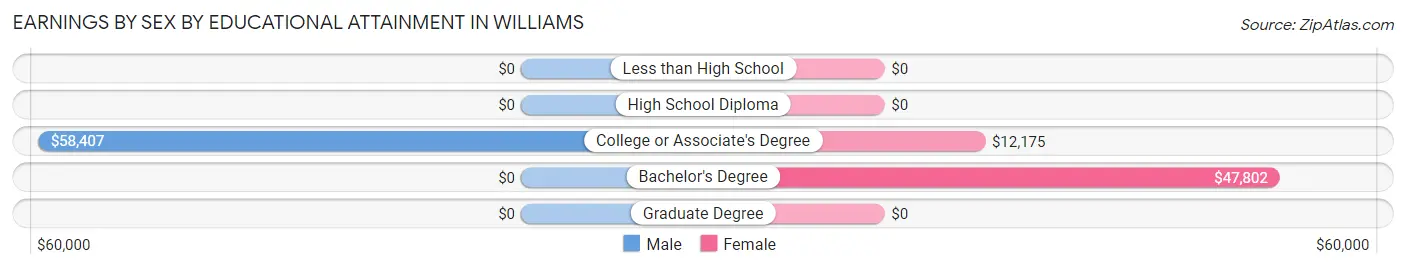
Earnings by Sex by Educational Attainment in Williams
Average earnings in Williams are $42,190 for men and $28,542 for women, a difference of 32.4%. Men with an educational attainment of college or associate's degree enjoy the highest average annual earnings of $58,407, while those with college or associate's degree education earn the least with $58,407. Women with an educational attainment of bachelor's degree earn the most with the average annual earnings of $47,802, while those with college or associate's degree education have the smallest earnings of $12,175.
| Educational Attainment | Male Income | Female Income |
| Less than High School | - | - |
| High School Diploma | - | - |
| College or Associate's Degree | $58,407 | $12,175 |
| Bachelor's Degree | - | - |
| Graduate Degree | - | - |
| Total | $42,190 | $28,542 |
Family Income in Williams
Family Income Brackets in Williams
According to the Williams family income data, there are 84 families falling into the $100,000 to $149,999 income range, which is the most common income bracket and makes up 30.5% of all families.
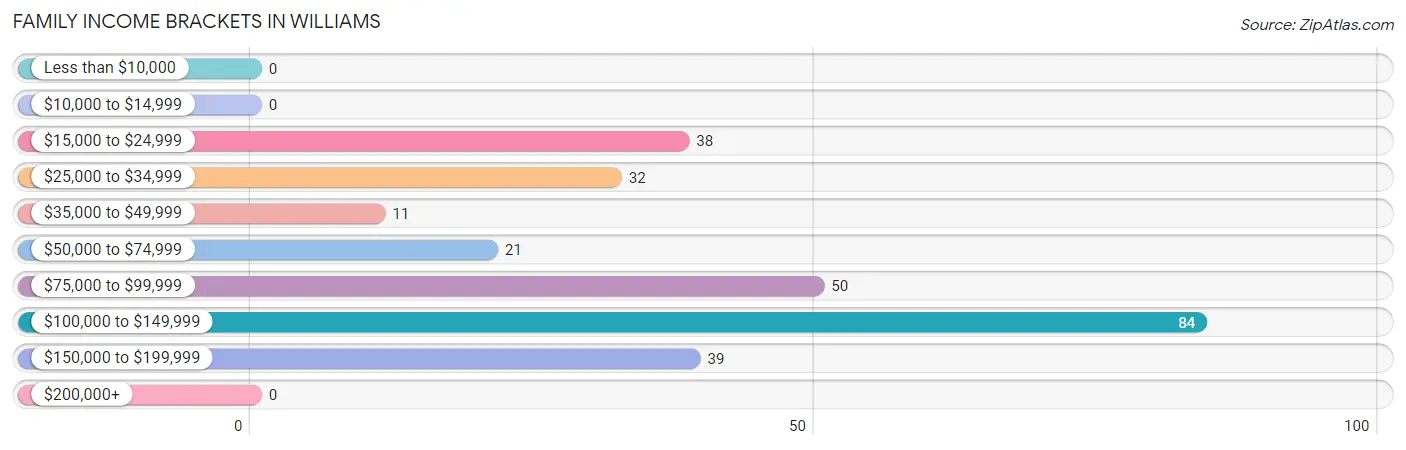
| Income Bracket | # Families | % Families |
| Less than $10,000 | 0 | 0.0% |
| $10,000 to $14,999 | 0 | 0.0% |
| $15,000 to $24,999 | 38 | 13.8% |
| $25,000 to $34,999 | 32 | 11.6% |
| $35,000 to $49,999 | 11 | 4.0% |
| $50,000 to $74,999 | 21 | 7.6% |
| $75,000 to $99,999 | 50 | 18.2% |
| $100,000 to $149,999 | 84 | 30.5% |
| $150,000 to $199,999 | 39 | 14.2% |
| $200,000+ | 0 | 0.0% |
Family Income by Famaliy Size in Williams
2-person families (150 | 54.5%) account for the highest median family income in Williams with $85,903 per family, while 2-person families (150 | 54.5%) have the highest median income of $42,952 per family member.
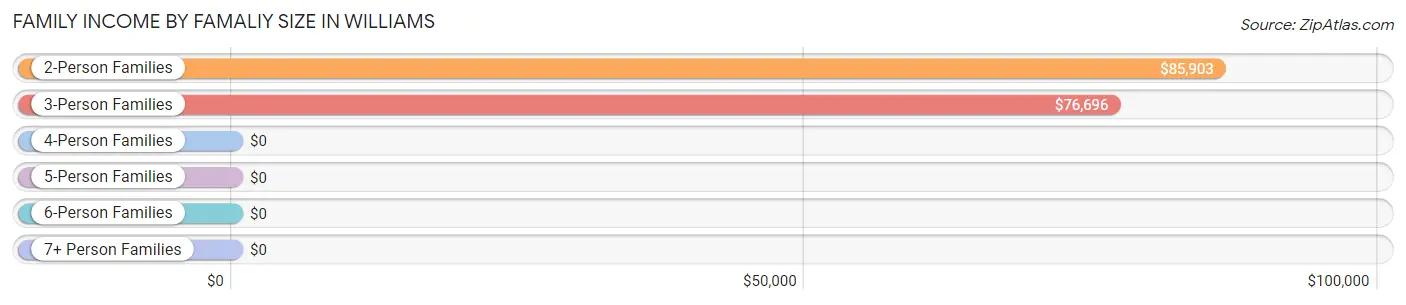
| Income Bracket | # Families | Median Income |
| 2-Person Families | 150 (54.5%) | $85,903 |
| 3-Person Families | 35 (12.7%) | $76,696 |
| 4-Person Families | 32 (11.6%) | $0 |
| 5-Person Families | 58 (21.1%) | $0 |
| 6-Person Families | 0 (0.0%) | $0 |
| 7+ Person Families | 0 (0.0%) | $0 |
| Total | 275 (100.0%) | $86,493 |
Family Income by Number of Earners in Williams
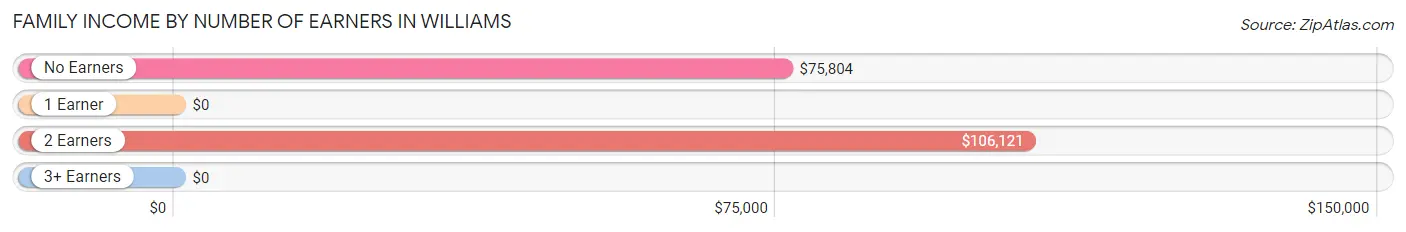
| Number of Earners | # Families | Median Income |
| No Earners | 107 (38.9%) | $75,804 |
| 1 Earner | 0 (0.0%) | $0 |
| 2 Earners | 168 (61.1%) | $106,121 |
| 3+ Earners | 0 (0.0%) | $0 |
| Total | 275 (100.0%) | $86,493 |
Household Income in Williams
Household Income Brackets in Williams
With 142 households falling in the category, the $100,000 to $149,999 income range is the most frequent in Williams, accounting for 28.7% of all households.
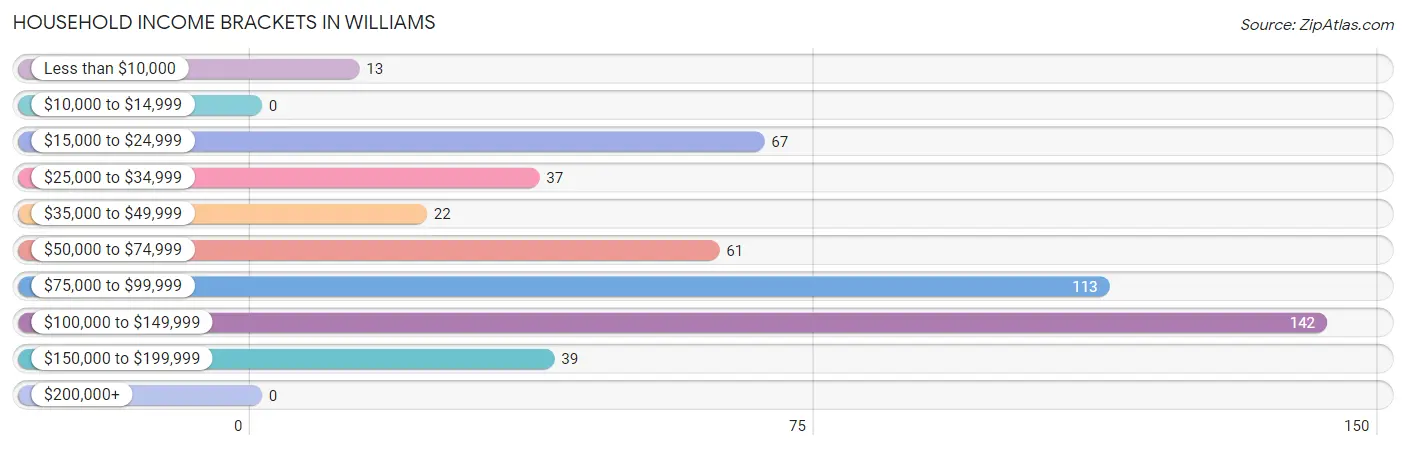
| Income Bracket | # Households | % Households |
| Less than $10,000 | 13 | 2.6% |
| $10,000 to $14,999 | 0 | 0.0% |
| $15,000 to $24,999 | 67 | 13.6% |
| $25,000 to $34,999 | 37 | 7.5% |
| $35,000 to $49,999 | 22 | 4.5% |
| $50,000 to $74,999 | 61 | 12.3% |
| $75,000 to $99,999 | 113 | 22.9% |
| $100,000 to $149,999 | 142 | 28.7% |
| $150,000 to $199,999 | 39 | 7.9% |
| $200,000+ | 0 | 0.0% |
Household Income by Householder Age in Williams
The median household income in Williams is $81,310, with the highest median household income of $103,059 found in the 25 to 44 years age bracket for the primary householder. A total of 189 households (38.3%) fall into this category.
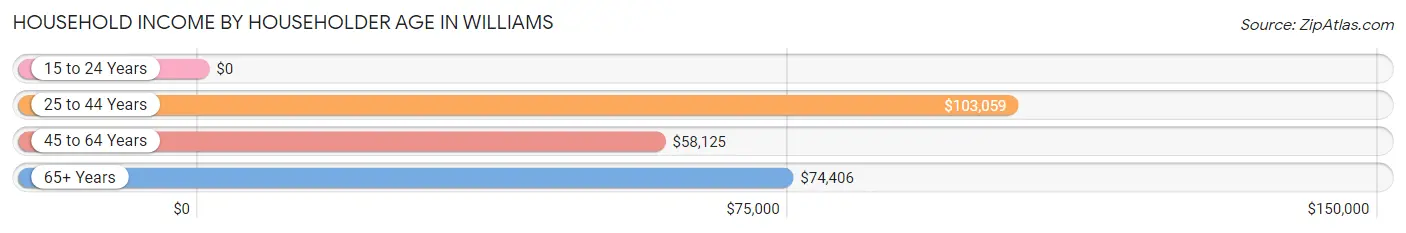
| Income Bracket | # Households | Median Income |
| 15 to 24 Years | 0 (0.0%) | $0 |
| 25 to 44 Years | 189 (38.3%) | $103,059 |
| 45 to 64 Years | 70 (14.2%) | $58,125 |
| 65+ Years | 235 (47.6%) | $74,406 |
| Total | 494 (100.0%) | $81,310 |
Poverty in Williams
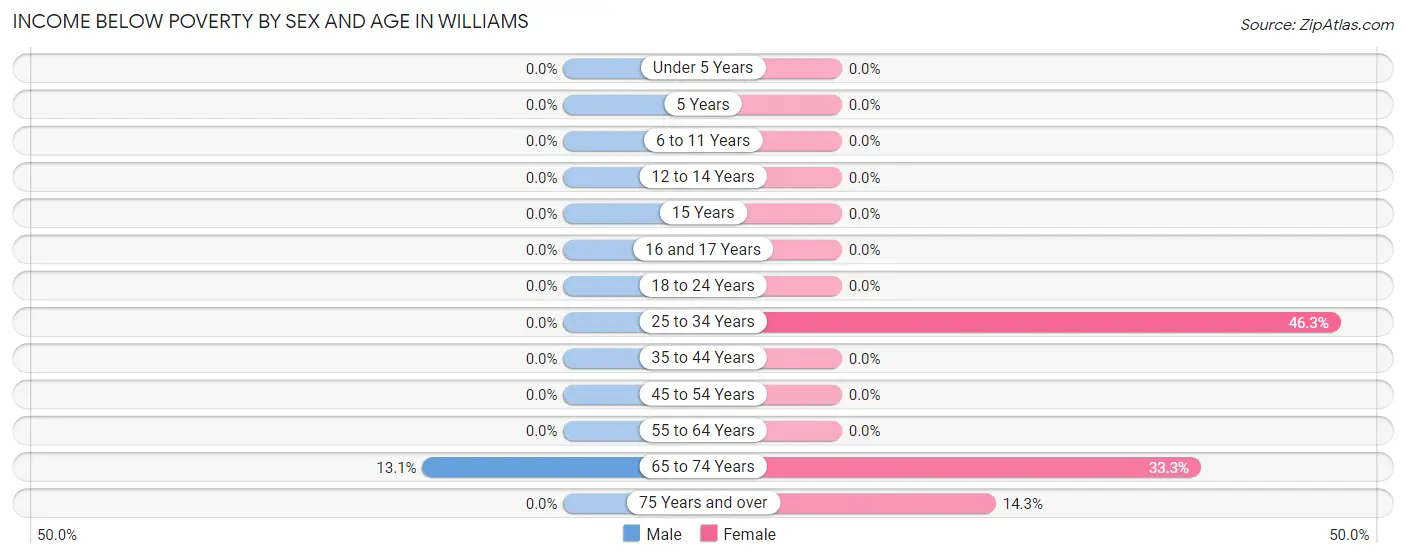
Income Below Poverty by Sex and Age in Williams
With 2.3% poverty level for males and 14.1% for females among the residents of Williams, 65 to 74 year old males and 25 to 34 year old females are the most vulnerable to poverty, with 14 males (13.1%) and 50 females (46.3%) in their respective age groups living below the poverty level.
| Age Bracket | Male | Female |
| Under 5 Years | 0 (0.0%) | 0 (0.0%) |
| 5 Years | 0 (0.0%) | 0 (0.0%) |
| 6 to 11 Years | 0 (0.0%) | 0 (0.0%) |
| 12 to 14 Years | 0 (0.0%) | 0 (0.0%) |
| 15 Years | 0 (0.0%) | 0 (0.0%) |
| 16 and 17 Years | 0 (0.0%) | 0 (0.0%) |
| 18 to 24 Years | 0 (0.0%) | 0 (0.0%) |
| 25 to 34 Years | 0 (0.0%) | 50 (46.3%) |
| 35 to 44 Years | 0 (0.0%) | 0 (0.0%) |
| 45 to 54 Years | 0 (0.0%) | 0 (0.0%) |
| 55 to 64 Years | 0 (0.0%) | 0 (0.0%) |
| 65 to 74 Years | 14 (13.1%) | 14 (33.3%) |
| 75 Years and over | 0 (0.0%) | 13 (14.3%) |
| Total | 14 (2.3%) | 77 (14.1%) |
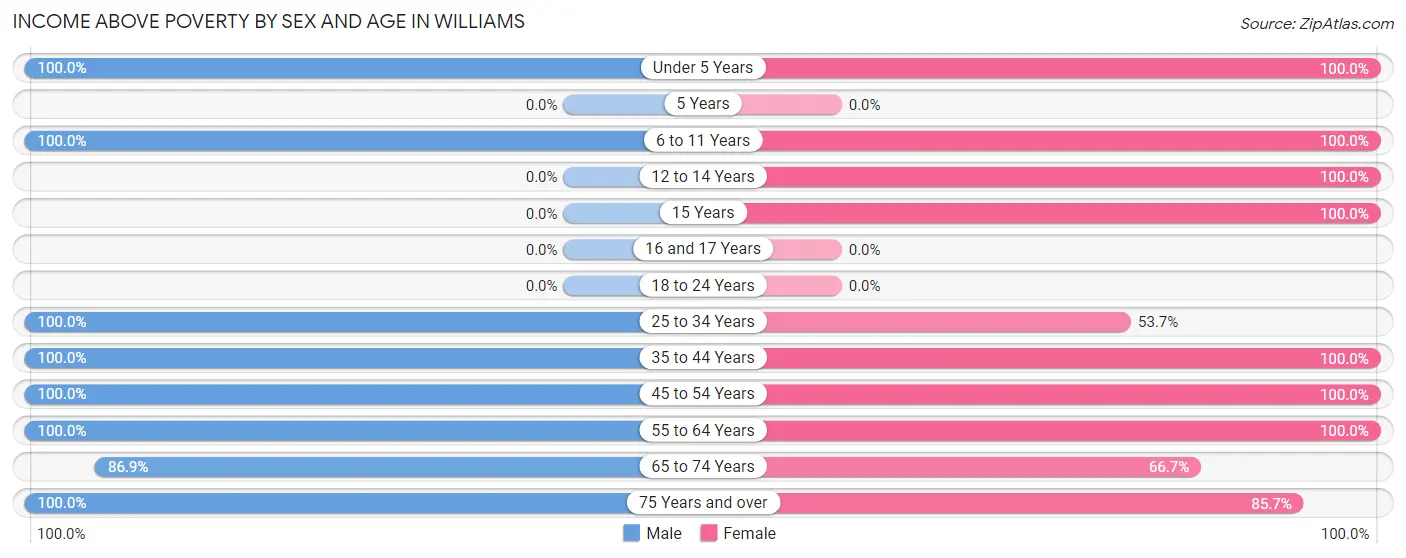
Income Above Poverty by Sex and Age in Williams
According to the poverty statistics in Williams, males aged under 5 years and females aged under 5 years are the age groups that are most secure financially, with 100.0% of males and 100.0% of females in these age groups living above the poverty line.
| Age Bracket | Male | Female |
| Under 5 Years | 56 (100.0%) | 59 (100.0%) |
| 5 Years | 0 (0.0%) | 0 (0.0%) |
| 6 to 11 Years | 49 (100.0%) | 66 (100.0%) |
| 12 to 14 Years | 0 (0.0%) | 7 (100.0%) |
| 15 Years | 0 (0.0%) | 30 (100.0%) |
| 16 and 17 Years | 0 (0.0%) | 0 (0.0%) |
| 18 to 24 Years | 0 (0.0%) | 0 (0.0%) |
| 25 to 34 Years | 47 (100.0%) | 58 (53.7%) |
| 35 to 44 Years | 150 (100.0%) | 37 (100.0%) |
| 45 to 54 Years | 33 (100.0%) | 58 (100.0%) |
| 55 to 64 Years | 73 (100.0%) | 46 (100.0%) |
| 65 to 74 Years | 93 (86.9%) | 28 (66.7%) |
| 75 Years and over | 101 (100.0%) | 78 (85.7%) |
| Total | 602 (97.7%) | 467 (85.9%) |
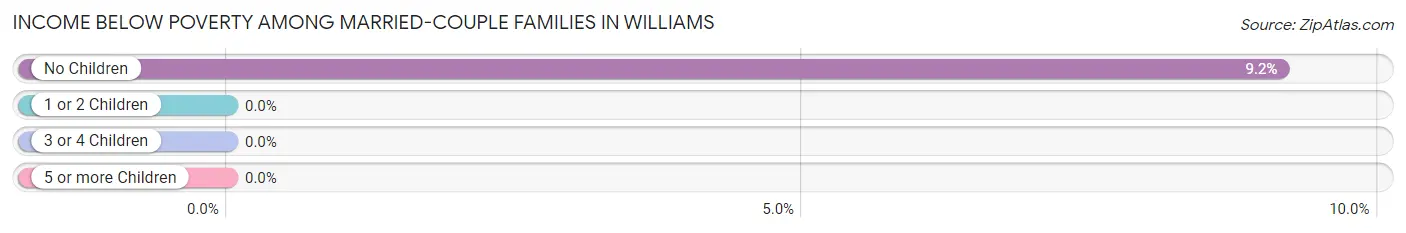
Income Below Poverty Among Married-Couple Families in Williams
The poverty statistics for married-couple families in Williams show that 6.0% or 14 of the total 232 families live below the poverty line. Families with no children have the highest poverty rate of 9.1%, comprising of 14 families. On the other hand, families with 1 or 2 children have the lowest poverty rate of 0.0%, which includes 0 families.
| Children | Above Poverty | Below Poverty |
| No Children | 139 (90.8%) | 14 (9.1%) |
| 1 or 2 Children | 21 (100.0%) | 0 (0.0%) |
| 3 or 4 Children | 58 (100.0%) | 0 (0.0%) |
| 5 or more Children | 0 (0.0%) | 0 (0.0%) |
| Total | 218 (94.0%) | 14 (6.0%) |
Income Below Poverty Among Single-Parent Households in Williams
| Children | Single Father | Single Mother |
| No Children | 0 (0.0%) | 0 (0.0%) |
| 1 or 2 Children | 0 (0.0%) | 0 (0.0%) |
| 3 or 4 Children | 0 (0.0%) | 0 (0.0%) |
| 5 or more Children | 0 (0.0%) | 0 (0.0%) |
| Total | 0 (0.0%) | 0 (0.0%) |
Income Below Poverty Among Married-Couple vs Single-Parent Households in Williams
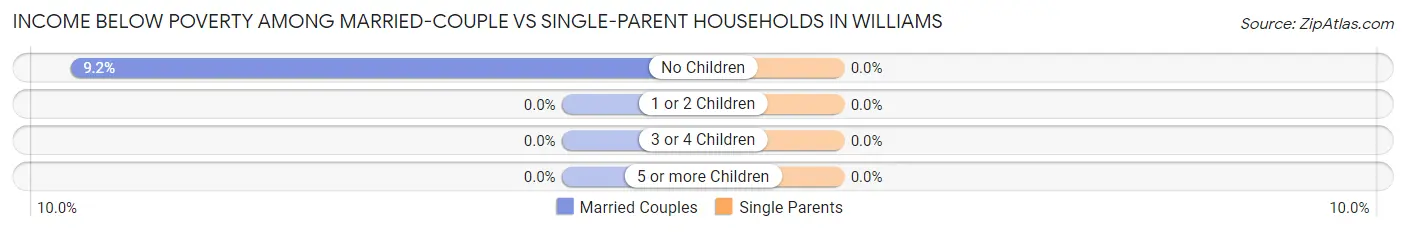
| Children | Married-Couple Families | Single-Parent Households |
| No Children | 14 (9.1%) | 0 (0.0%) |
| 1 or 2 Children | 0 (0.0%) | 0 (0.0%) |
| 3 or 4 Children | 0 (0.0%) | 0 (0.0%) |
| 5 or more Children | 0 (0.0%) | 0 (0.0%) |
| Total | 14 (6.0%) | 0 (0.0%) |
Race in Williams
The most populous races in Williams are White / Caucasian (1,149 | 98.0%), and Two or more Races (24 | 2.1%).
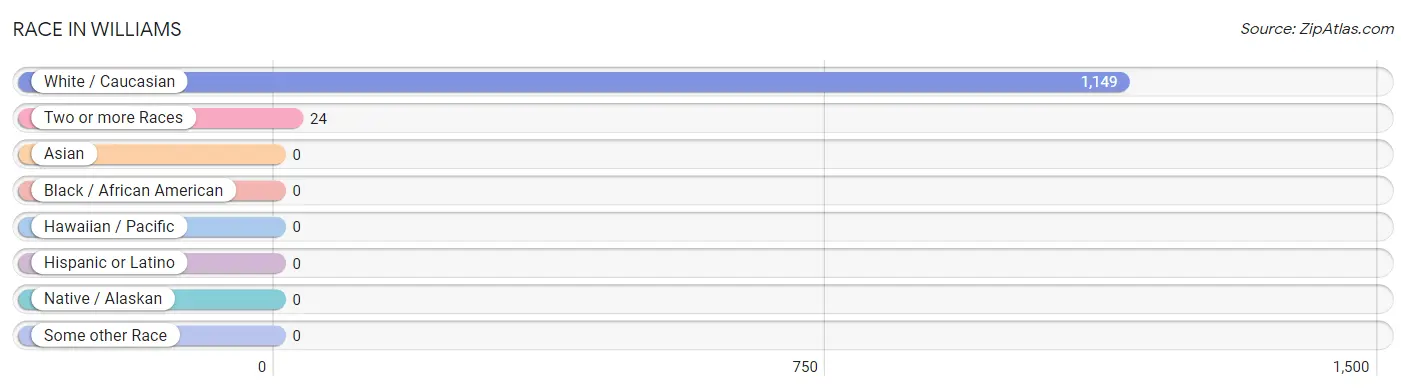
| Race | # Population | % Population |
| Asian | 0 | 0.0% |
| Black / African American | 0 | 0.0% |
| Hawaiian / Pacific | 0 | 0.0% |
| Hispanic or Latino | 0 | 0.0% |
| Native / Alaskan | 0 | 0.0% |
| White / Caucasian | 1,149 | 98.0% |
| Two or more Races | 24 | 2.1% |
| Some other Race | 0 | 0.0% |
| Total | 1,173 | 100.0% |
Ancestry in Williams
The most populous ancestries reported in Williams are American (287 | 24.5%), German (270 | 23.0%), Italian (148 | 12.6%), Irish (118 | 10.1%), and English (107 | 9.1%), together accounting for 79.3% of all Williams residents.
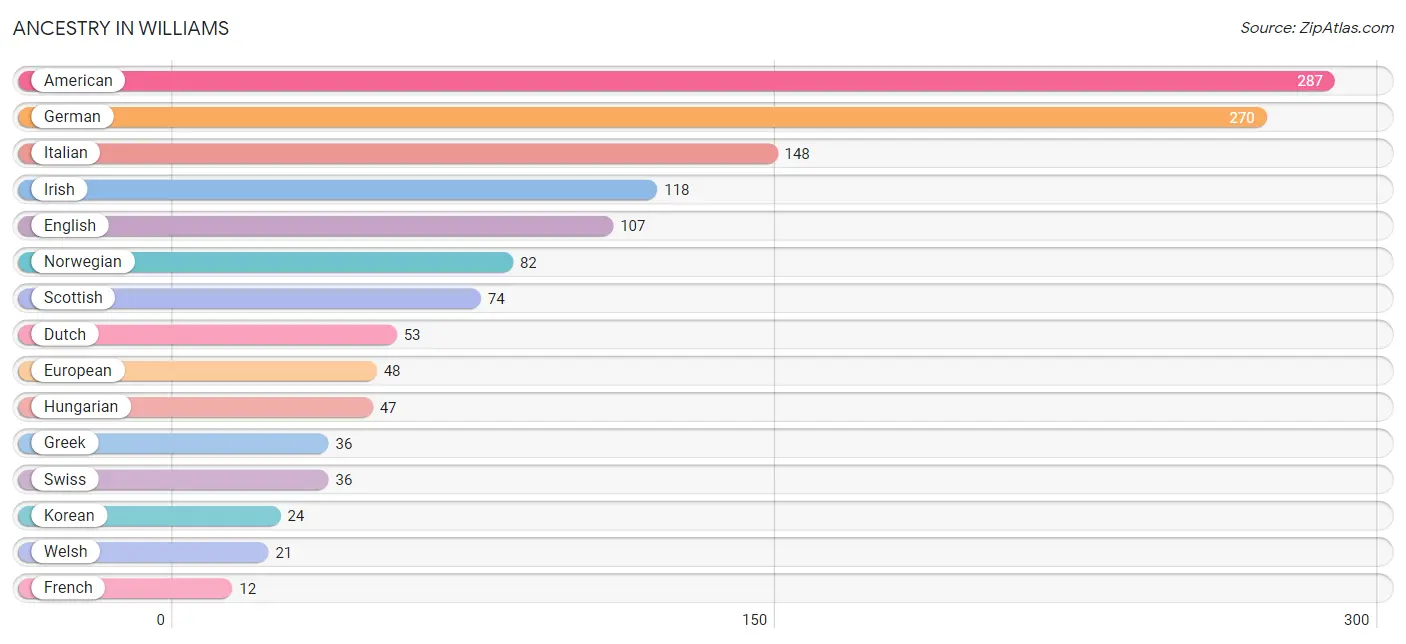
| Ancestry | # Population | % Population |
| American | 287 | 24.5% |
| Czech | 11 | 0.9% |
| Dutch | 53 | 4.5% |
| English | 107 | 9.1% |
| European | 48 | 4.1% |
| French | 12 | 1.0% |
| German | 270 | 23.0% |
| Greek | 36 | 3.1% |
| Hungarian | 47 | 4.0% |
| Irish | 118 | 10.1% |
| Italian | 148 | 12.6% |
| Korean | 24 | 2.1% |
| Norwegian | 82 | 7.0% |
| Scotch-Irish | 5 | 0.4% |
| Scottish | 74 | 6.3% |
| Swiss | 36 | 3.1% |
| Welsh | 21 | 1.8% | View All 17 Rows |
Immigrants in Williams

| Immigration Origin | # Population | % Population | View All 0 Rows |
Sex and Age in Williams
Sex and Age in Williams
The most populous age groups in Williams are 40 to 44 Years (150 | 24.1%) for men and 5 to 9 Years (66 | 12.0%) for women.
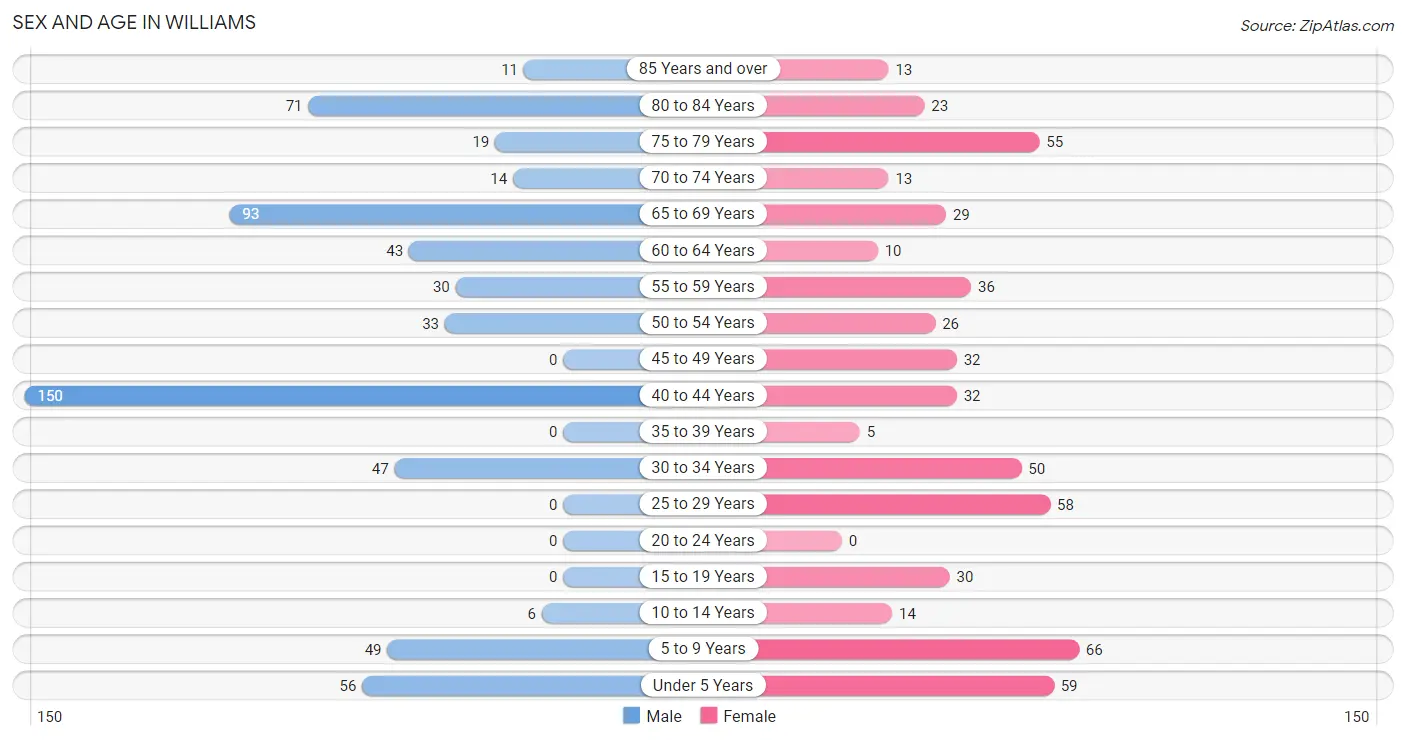
| Age Bracket | Male | Female |
| Under 5 Years | 56 (9.0%) | 59 (10.7%) |
| 5 to 9 Years | 49 (7.9%) | 66 (12.0%) |
| 10 to 14 Years | 6 (1.0%) | 14 (2.5%) |
| 15 to 19 Years | 0 (0.0%) | 30 (5.4%) |
| 20 to 24 Years | 0 (0.0%) | 0 (0.0%) |
| 25 to 29 Years | 0 (0.0%) | 58 (10.5%) |
| 30 to 34 Years | 47 (7.6%) | 50 (9.1%) |
| 35 to 39 Years | 0 (0.0%) | 5 (0.9%) |
| 40 to 44 Years | 150 (24.1%) | 32 (5.8%) |
| 45 to 49 Years | 0 (0.0%) | 32 (5.8%) |
| 50 to 54 Years | 33 (5.3%) | 26 (4.7%) |
| 55 to 59 Years | 30 (4.8%) | 36 (6.5%) |
| 60 to 64 Years | 43 (6.9%) | 10 (1.8%) |
| 65 to 69 Years | 93 (14.9%) | 29 (5.3%) |
| 70 to 74 Years | 14 (2.2%) | 13 (2.4%) |
| 75 to 79 Years | 19 (3.0%) | 55 (10.0%) |
| 80 to 84 Years | 71 (11.4%) | 23 (4.2%) |
| 85 Years and over | 11 (1.8%) | 13 (2.4%) |
| Total | 622 (100.0%) | 551 (100.0%) |
Families and Households in Williams
Median Family Size in Williams
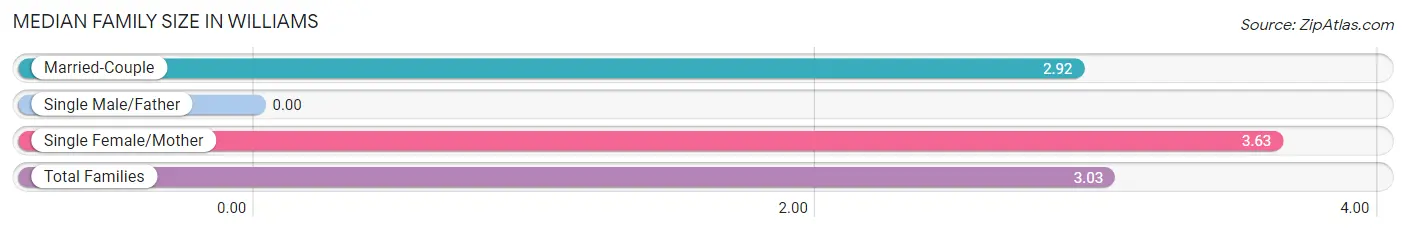
| Family Type | # Families | Family Size |
| Married-Couple | 232 (84.4%) | 2.92 |
| Single Male/Father | 0 (0.0%) | - |
| Single Female/Mother | 43 (15.6%) | 3.63 |
| Total Families | 275 (100.0%) | 3.03 |
Median Household Size in Williams
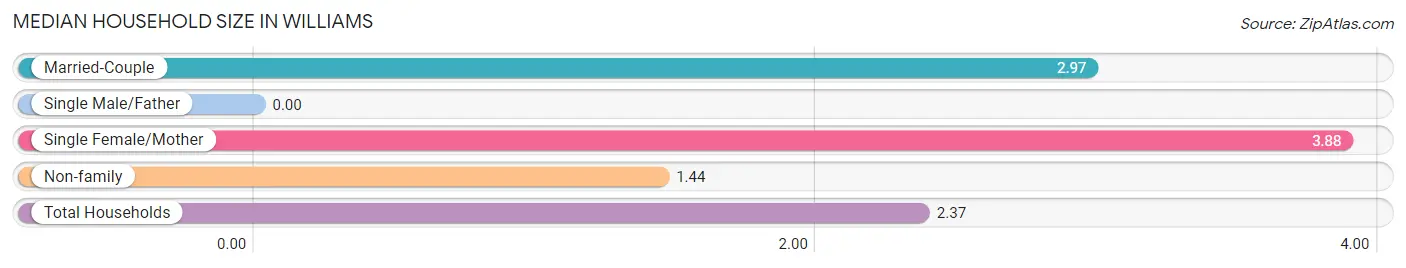
| Household Type | # Households | Household Size |
| Married-Couple | 232 (47.0%) | 2.97 |
| Single Male/Father | 0 (0.0%) | - |
| Single Female/Mother | 43 (8.7%) | 3.88 |
| Non-family | 219 (44.3%) | 1.44 |
| Total Households | 494 (100.0%) | 2.37 |
Household Size by Marriage Status in Williams
Out of a total of 494 households in Williams, 275 (55.7%) are family households, while 219 (44.3%) are nonfamily households. The most numerous type of family households are 2-person households, comprising 139, and the most common type of nonfamily households are 1-person households, comprising 125.
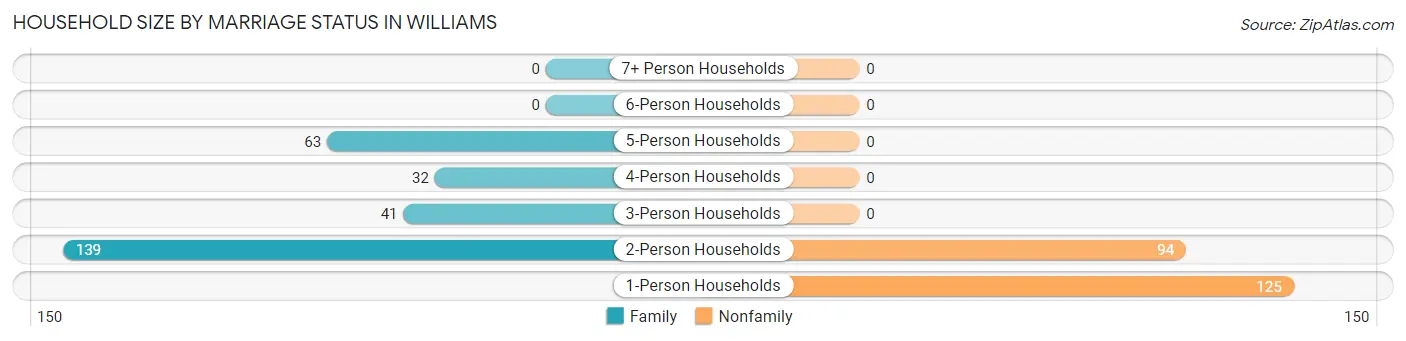
| Household Size | Family Households | Nonfamily Households |
| 1-Person Households | - | 125 (25.3%) |
| 2-Person Households | 139 (28.1%) | 94 (19.0%) |
| 3-Person Households | 41 (8.3%) | 0 (0.0%) |
| 4-Person Households | 32 (6.5%) | 0 (0.0%) |
| 5-Person Households | 63 (12.8%) | 0 (0.0%) |
| 6-Person Households | 0 (0.0%) | 0 (0.0%) |
| 7+ Person Households | 0 (0.0%) | 0 (0.0%) |
| Total | 275 (55.7%) | 219 (44.3%) |
Female Fertility in Williams
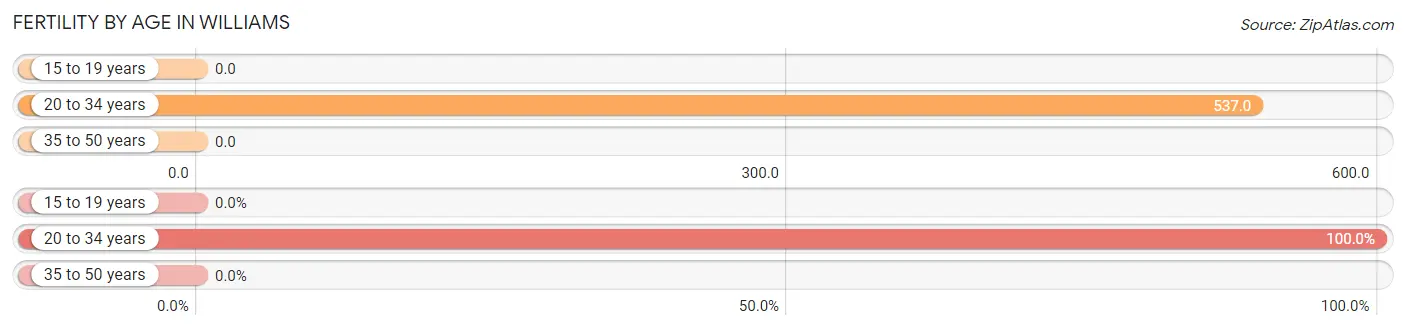
Fertility by Age in Williams
Average fertility rate in Williams is 264.0 births per 1,000 women. Women in the age bracket of 20 to 34 years have the highest fertility rate with 537.0 births per 1,000 women. Women in the age bracket of 20 to 34 years acount for 100.0% of all women with births.
| Age Bracket | Women with Births | Births / 1,000 Women |
| 15 to 19 years | 0 (0.0%) | 0.0 |
| 20 to 34 years | 58 (100.0%) | 537.0 |
| 35 to 50 years | 0 (0.0%) | 0.0 |
| Total | 58 (100.0%) | 264.0 |
Fertility by Age by Marriage Status in Williams
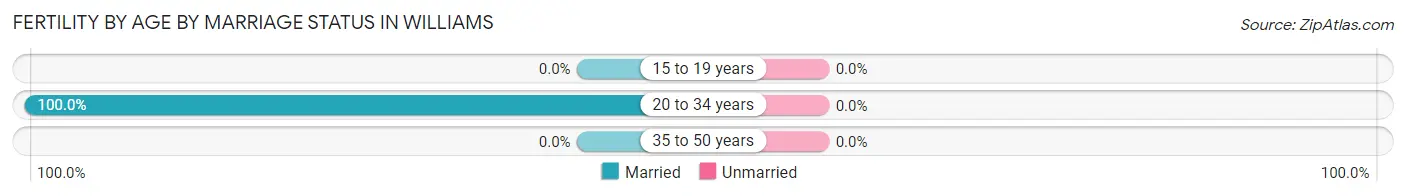
| Age Bracket | Married | Unmarried |
| 15 to 19 years | 0 (0.0%) | 0 (0.0%) |
| 20 to 34 years | 58 (100.0%) | 0 (0.0%) |
| 35 to 50 years | 0 (0.0%) | 0 (0.0%) |
| Total | 58 (100.0%) | 0 (0.0%) |
Fertility by Education in Williams
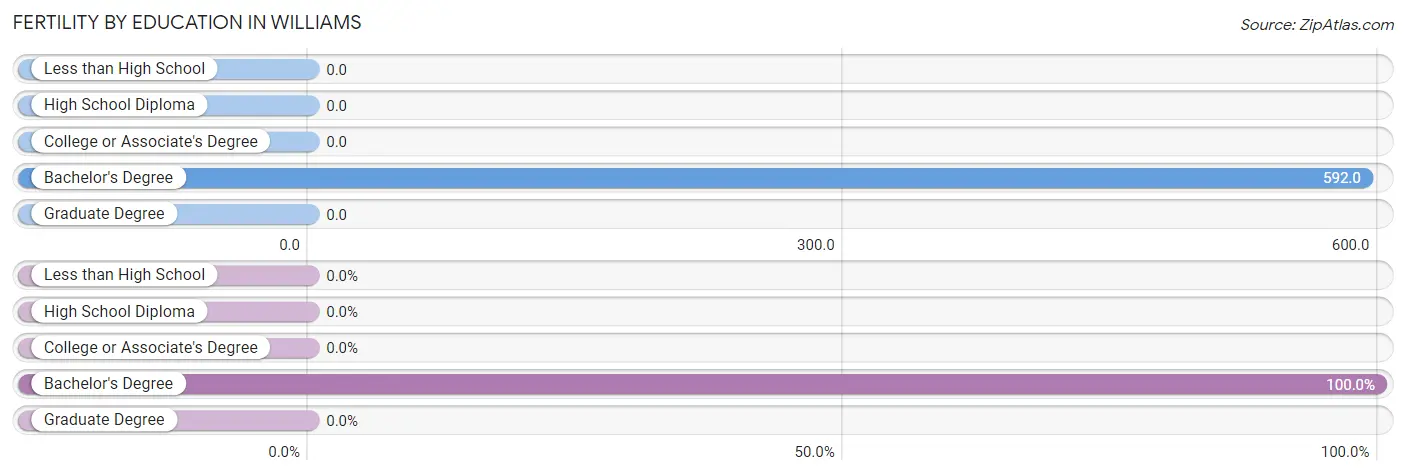
| Educational Attainment | Women with Births | Births / 1,000 Women |
| Less than High School | 0 (0.0%) | 0.0 |
| High School Diploma | 0 (0.0%) | 0.0 |
| College or Associate's Degree | 0 (0.0%) | 0.0 |
| Bachelor's Degree | 58 (100.0%) | 592.0 |
| Graduate Degree | 0 (0.0%) | 0.0 |
| Total | 58 (100.0%) | 264.0 |
Fertility by Education by Marriage Status in Williams
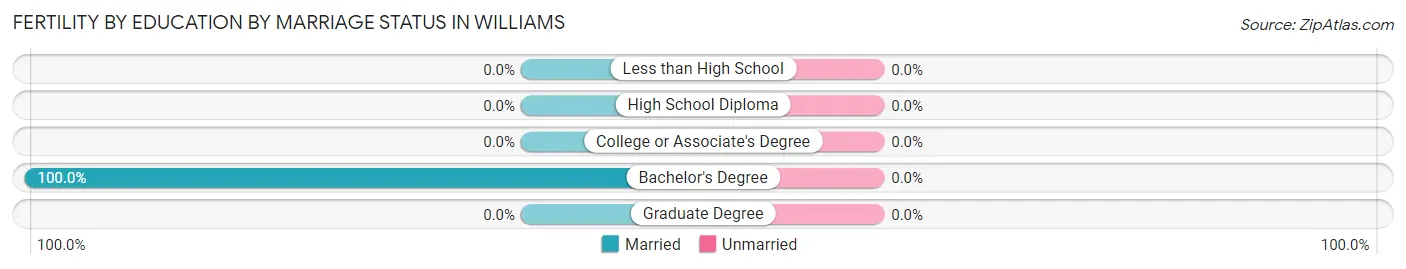
| Educational Attainment | Married | Unmarried |
| Less than High School | 0 (0.0%) | 0 (0.0%) |
| High School Diploma | 0 (0.0%) | 0 (0.0%) |
| College or Associate's Degree | 0 (0.0%) | 0 (0.0%) |
| Bachelor's Degree | 58 (100.0%) | 0 (0.0%) |
| Graduate Degree | 0 (0.0%) | 0 (0.0%) |
| Total | 58 (100.0%) | 0 (0.0%) |
Employment Characteristics in Williams
Employment by Class of Employer in Williams
Among the 531 employed individuals in Williams, self-employed (not incorporated) (307 | 57.8%), private company employees (196 | 36.9%), and local government employees (23 | 4.3%) make up the most common classes of employment.
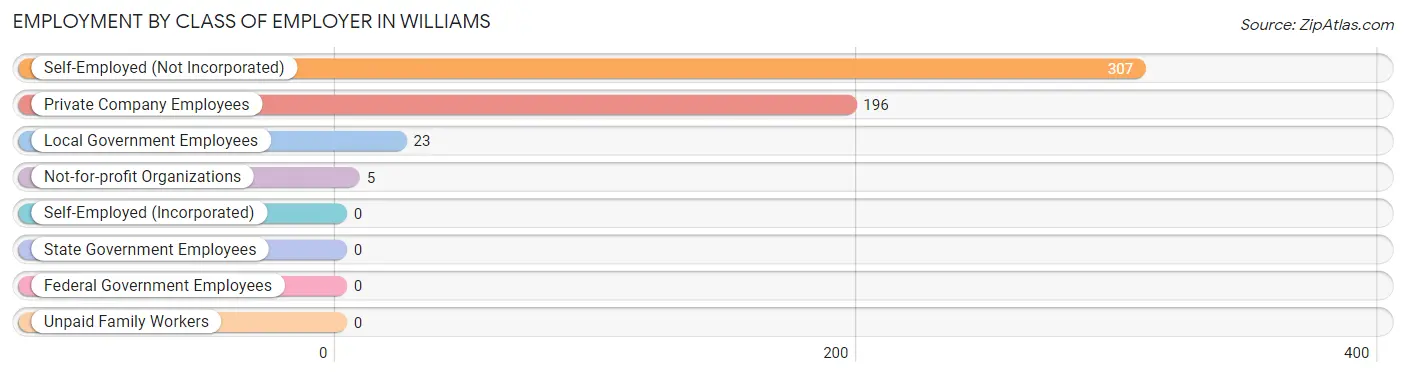
| Employer Class | # Employees | % Employees |
| Private Company Employees | 196 | 36.9% |
| Self-Employed (Incorporated) | 0 | 0.0% |
| Self-Employed (Not Incorporated) | 307 | 57.8% |
| Not-for-profit Organizations | 5 | 0.9% |
| Local Government Employees | 23 | 4.3% |
| State Government Employees | 0 | 0.0% |
| Federal Government Employees | 0 | 0.0% |
| Unpaid Family Workers | 0 | 0.0% |
| Total | 531 | 100.0% |
Employment Status by Age in Williams
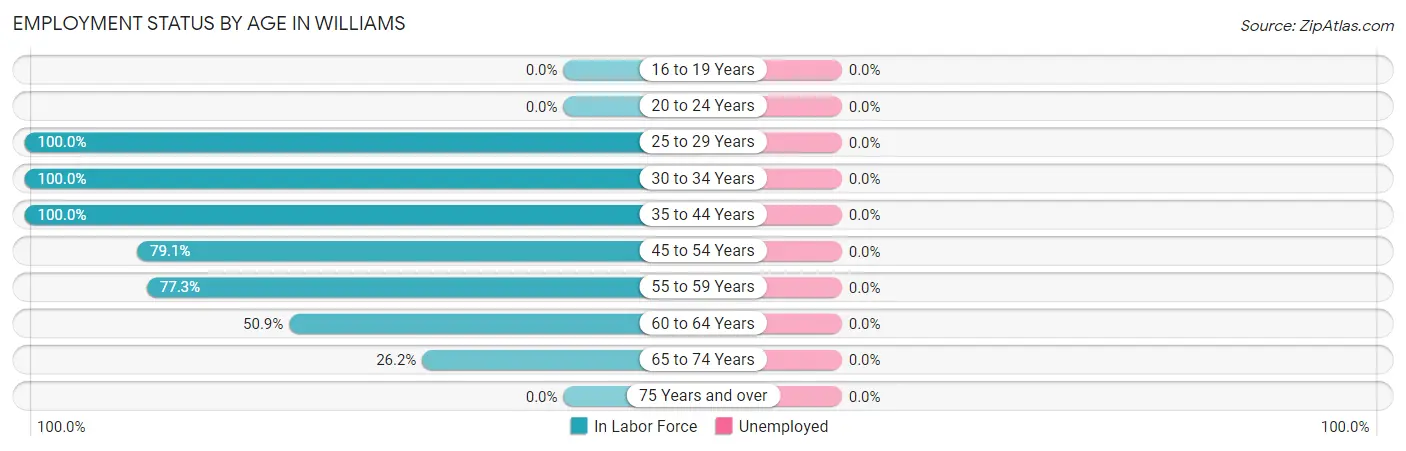
| Age Bracket | In Labor Force | Unemployed |
| 16 to 19 Years | 0 (0.0%) | 0 (0.0%) |
| 20 to 24 Years | 0 (0.0%) | 0 (0.0%) |
| 25 to 29 Years | 58 (100.0%) | 0 (0.0%) |
| 30 to 34 Years | 97 (100.0%) | 0 (0.0%) |
| 35 to 44 Years | 187 (100.0%) | 0 (0.0%) |
| 45 to 54 Years | 72 (79.1%) | 0 (0.0%) |
| 55 to 59 Years | 51 (77.3%) | 0 (0.0%) |
| 60 to 64 Years | 27 (50.9%) | 0 (0.0%) |
| 65 to 74 Years | 39 (26.2%) | 0 (0.0%) |
| 75 Years and over | 0 (0.0%) | 0 (0.0%) |
| Total | 531 (59.5%) | 0 (0.0%) |
Employment Status by Educational Attainment in Williams
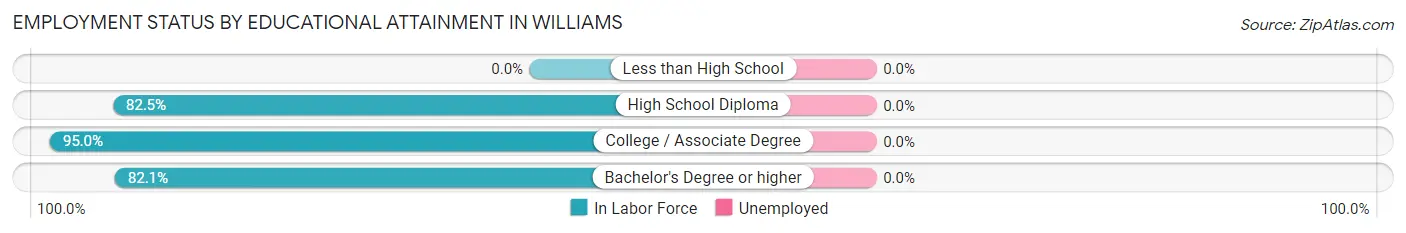
| Educational Attainment | In Labor Force | Unemployed |
| Less than High School | 0 (0.0%) | 0 (0.0%) |
| High School Diploma | 47 (82.5%) | 0 (0.0%) |
| College / Associate Degree | 285 (95.0%) | 0 (0.0%) |
| Bachelor's Degree or higher | 160 (82.1%) | 0 (0.0%) |
| Total | 492 (89.1%) | 0 (0.0%) |
Employment Occupations by Sex in Williams
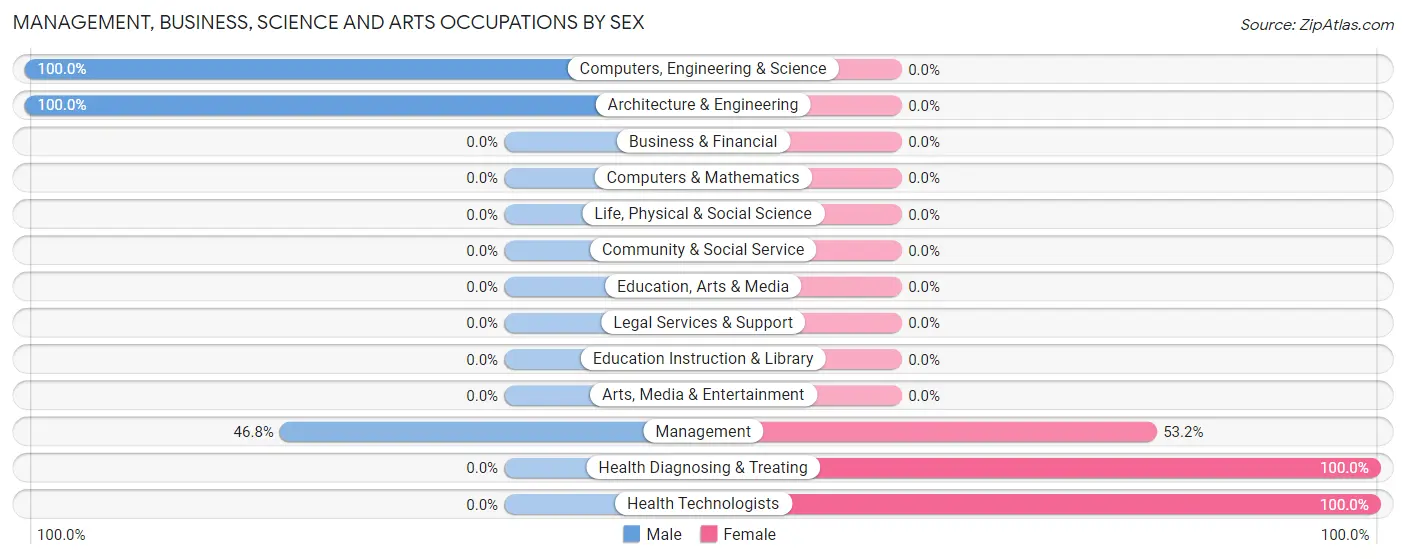
Management, Business, Science and Arts Occupations
The most common Management, Business, Science and Arts occupations in Williams are Management (109 | 20.5%), Computers, Engineering & Science (94 | 17.7%), Architecture & Engineering (94 | 17.7%), Health Diagnosing & Treating (5 | 0.9%), and Health Technologists (5 | 0.9%).
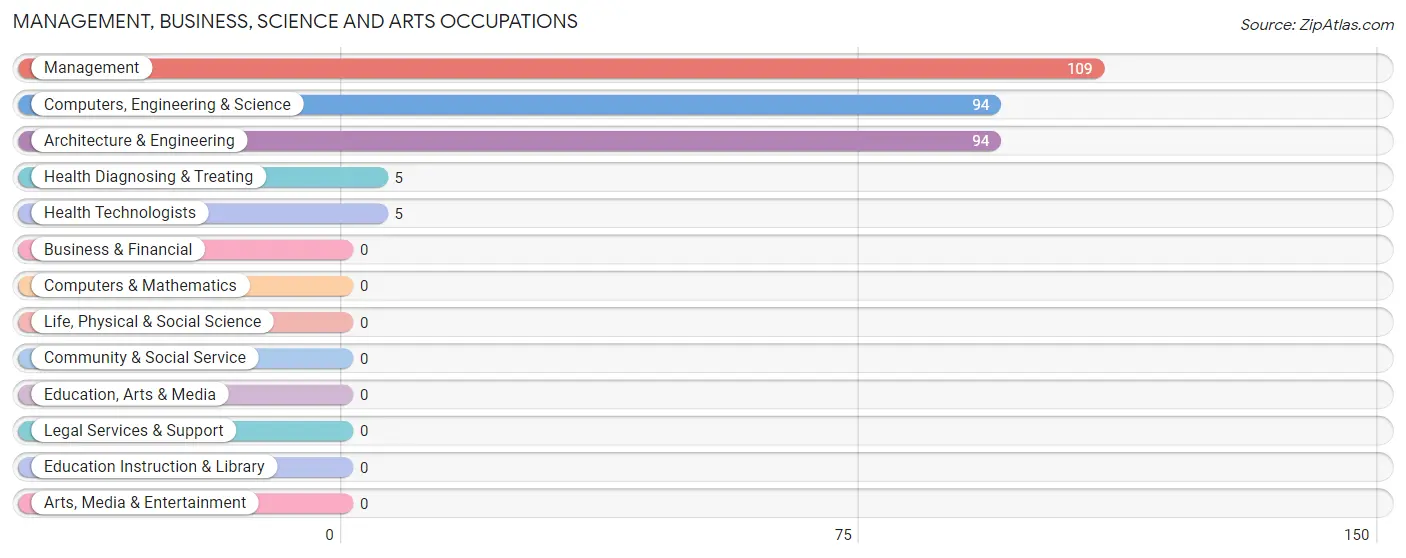
Management, Business, Science and Arts Occupations by Sex
Within the Management, Business, Science and Arts occupations in Williams, the most male-oriented occupations are Computers, Engineering & Science (100.0%), Architecture & Engineering (100.0%), and Management (46.8%), while the most female-oriented occupations are Health Diagnosing & Treating (100.0%), Health Technologists (100.0%), and Management (53.2%).
| Occupation | Male | Female |
| Management | 51 (46.8%) | 58 (53.2%) |
| Business & Financial | 0 (0.0%) | 0 (0.0%) |
| Computers, Engineering & Science | 94 (100.0%) | 0 (0.0%) |
| Computers & Mathematics | 0 (0.0%) | 0 (0.0%) |
| Architecture & Engineering | 94 (100.0%) | 0 (0.0%) |
| Life, Physical & Social Science | 0 (0.0%) | 0 (0.0%) |
| Community & Social Service | 0 (0.0%) | 0 (0.0%) |
| Education, Arts & Media | 0 (0.0%) | 0 (0.0%) |
| Legal Services & Support | 0 (0.0%) | 0 (0.0%) |
| Education Instruction & Library | 0 (0.0%) | 0 (0.0%) |
| Arts, Media & Entertainment | 0 (0.0%) | 0 (0.0%) |
| Health Diagnosing & Treating | 0 (0.0%) | 5 (100.0%) |
| Health Technologists | 0 (0.0%) | 5 (100.0%) |
| Total (Category) | 145 (69.7%) | 63 (30.3%) |
| Total (Overall) | 311 (58.6%) | 220 (41.4%) |
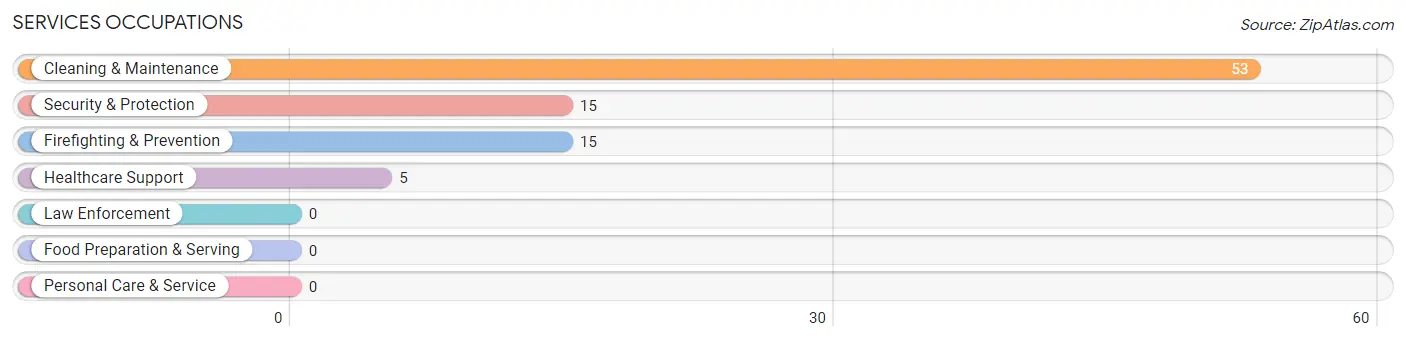
Services Occupations
The most common Services occupations in Williams are Cleaning & Maintenance (53 | 10.0%), Security & Protection (15 | 2.8%), Firefighting & Prevention (15 | 2.8%), and Healthcare Support (5 | 0.9%).
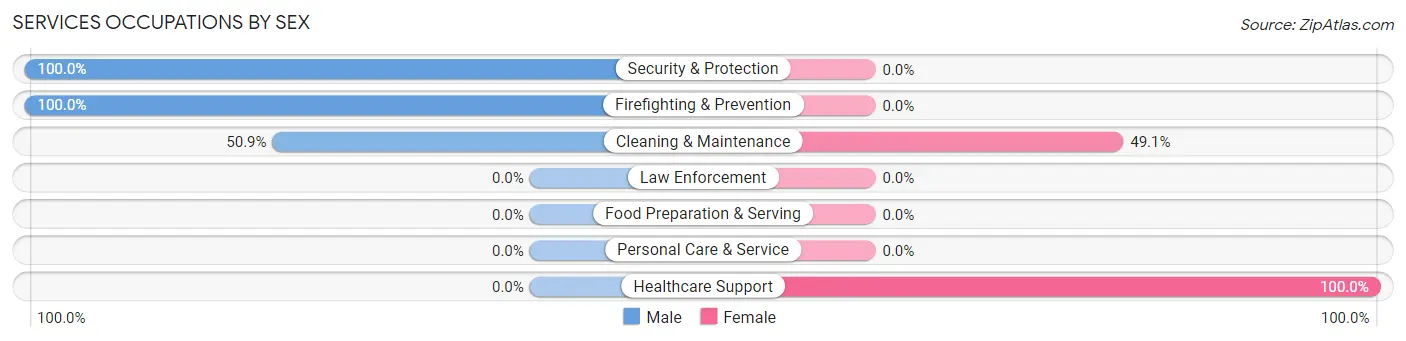
Services Occupations by Sex
Within the Services occupations in Williams, the most male-oriented occupations are Security & Protection (100.0%), Firefighting & Prevention (100.0%), and Cleaning & Maintenance (50.9%), while the most female-oriented occupations are Healthcare Support (100.0%), and Cleaning & Maintenance (49.1%).
| Occupation | Male | Female |
| Healthcare Support | 0 (0.0%) | 5 (100.0%) |
| Security & Protection | 15 (100.0%) | 0 (0.0%) |
| Firefighting & Prevention | 15 (100.0%) | 0 (0.0%) |
| Law Enforcement | 0 (0.0%) | 0 (0.0%) |
| Food Preparation & Serving | 0 (0.0%) | 0 (0.0%) |
| Cleaning & Maintenance | 27 (50.9%) | 26 (49.1%) |
| Personal Care & Service | 0 (0.0%) | 0 (0.0%) |
| Total (Category) | 42 (57.5%) | 31 (42.5%) |
| Total (Overall) | 311 (58.6%) | 220 (41.4%) |
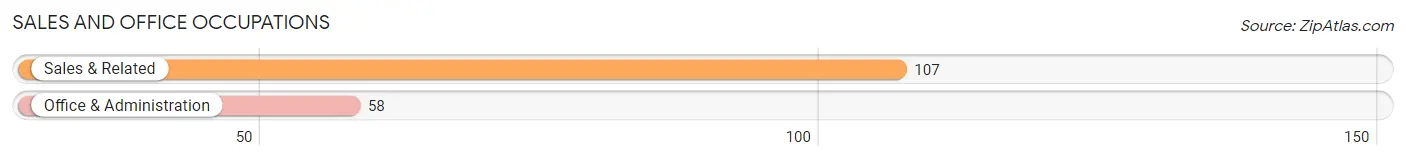
Sales and Office Occupations
The most common Sales and Office occupations in Williams are Sales & Related (107 | 20.2%), and Office & Administration (58 | 10.9%).
Sales and Office Occupations by Sex
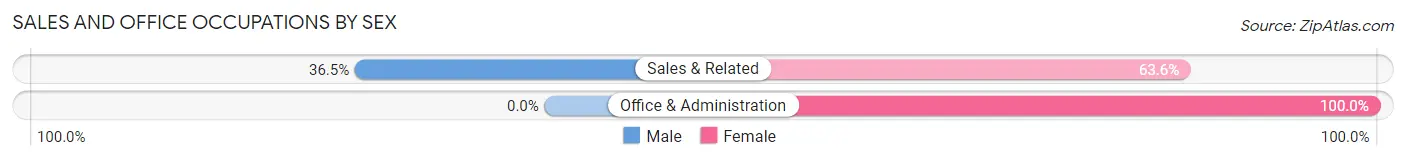
| Occupation | Male | Female |
| Sales & Related | 39 (36.4%) | 68 (63.5%) |
| Office & Administration | 0 (0.0%) | 58 (100.0%) |
| Total (Category) | 39 (23.6%) | 126 (76.4%) |
| Total (Overall) | 311 (58.6%) | 220 (41.4%) |
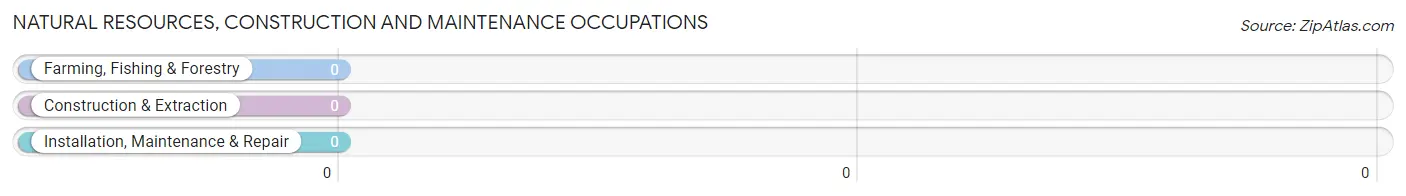
Natural Resources, Construction and Maintenance Occupations
Natural Resources, Construction and Maintenance Occupations by Sex
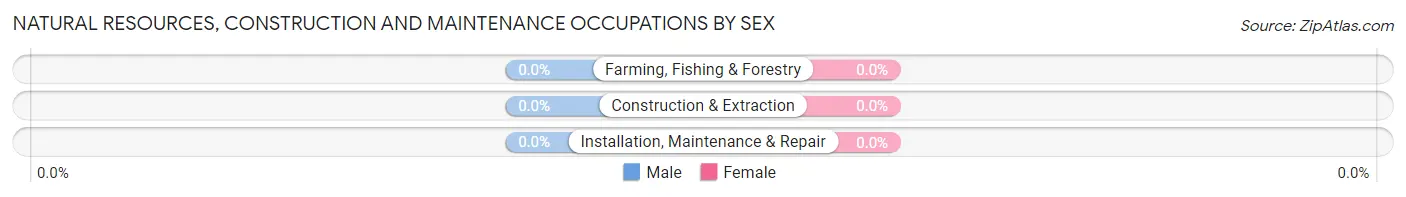
| Occupation | Male | Female |
| Farming, Fishing & Forestry | 0 (0.0%) | 0 (0.0%) |
| Construction & Extraction | 0 (0.0%) | 0 (0.0%) |
| Installation, Maintenance & Repair | 0 (0.0%) | 0 (0.0%) |
| Total (Category) | 0 (0.0%) | 0 (0.0%) |
| Total (Overall) | 311 (58.6%) | 220 (41.4%) |
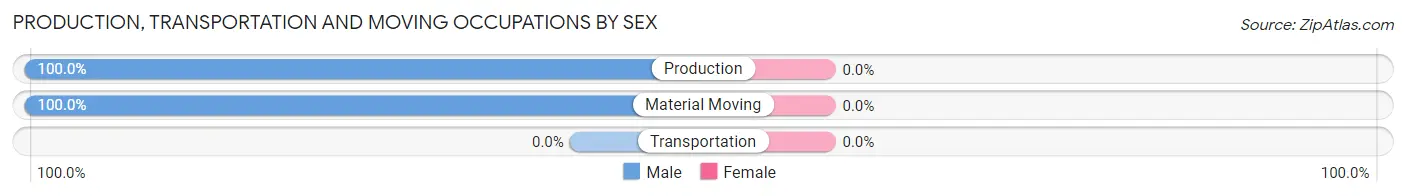
Production, Transportation and Moving Occupations
The most common Production, Transportation and Moving occupations in Williams are Production (52 | 9.8%), and Material Moving (33 | 6.2%).
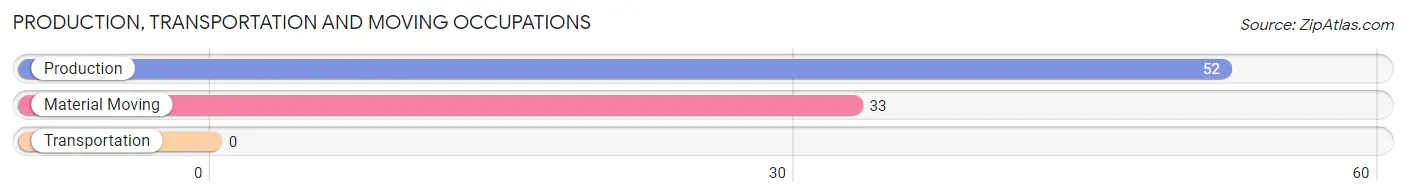
Production, Transportation and Moving Occupations by Sex
| Occupation | Male | Female |
| Production | 52 (100.0%) | 0 (0.0%) |
| Transportation | 0 (0.0%) | 0 (0.0%) |
| Material Moving | 33 (100.0%) | 0 (0.0%) |
| Total (Category) | 85 (100.0%) | 0 (0.0%) |
| Total (Overall) | 311 (58.6%) | 220 (41.4%) |
Employment Industries by Sex in Williams
Employment Industries in Williams
The major employment industries in Williams include Retail Trade (140 | 26.4%), Agriculture, Fishing & Hunting (109 | 20.5%), Manufacturing (102 | 19.2%), Information (94 | 17.7%), and Administrative & Support (53 | 10.0%).
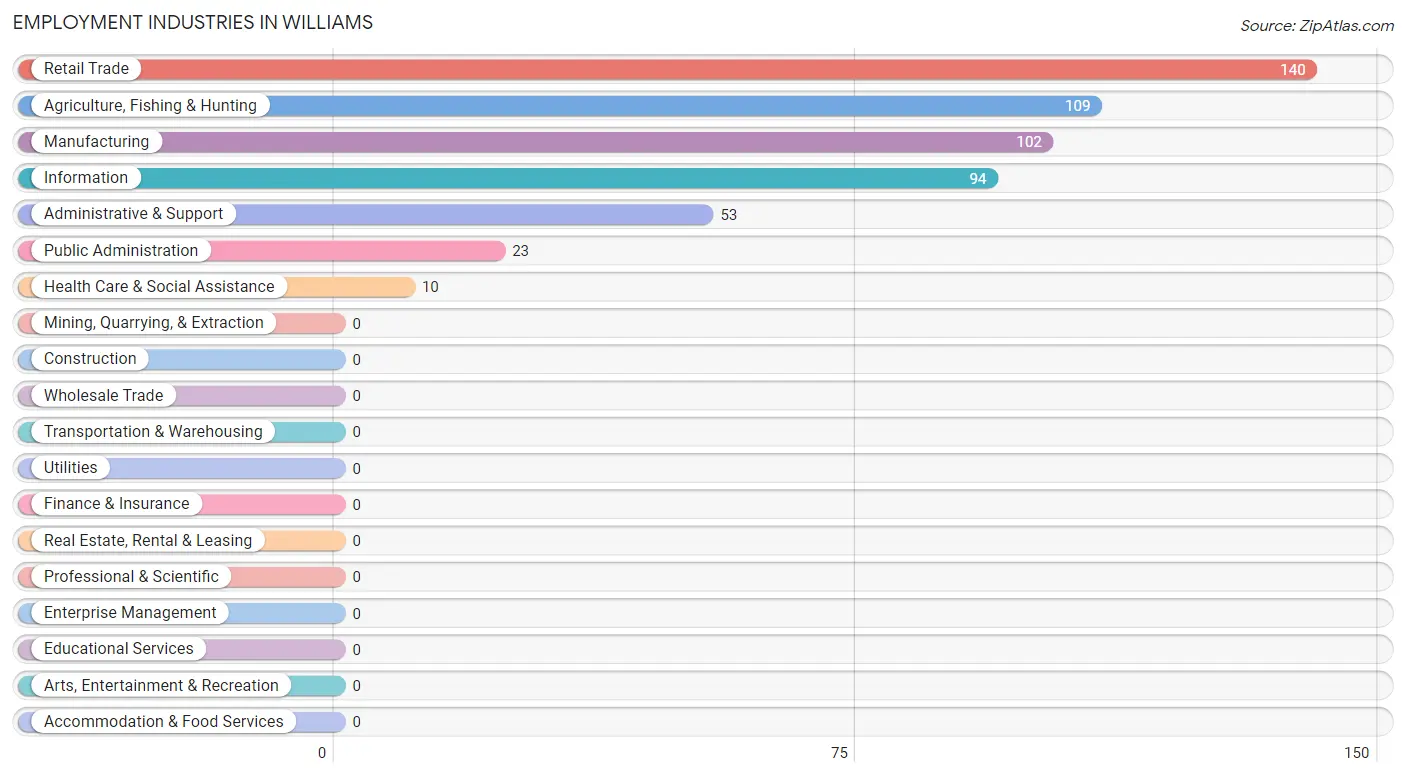
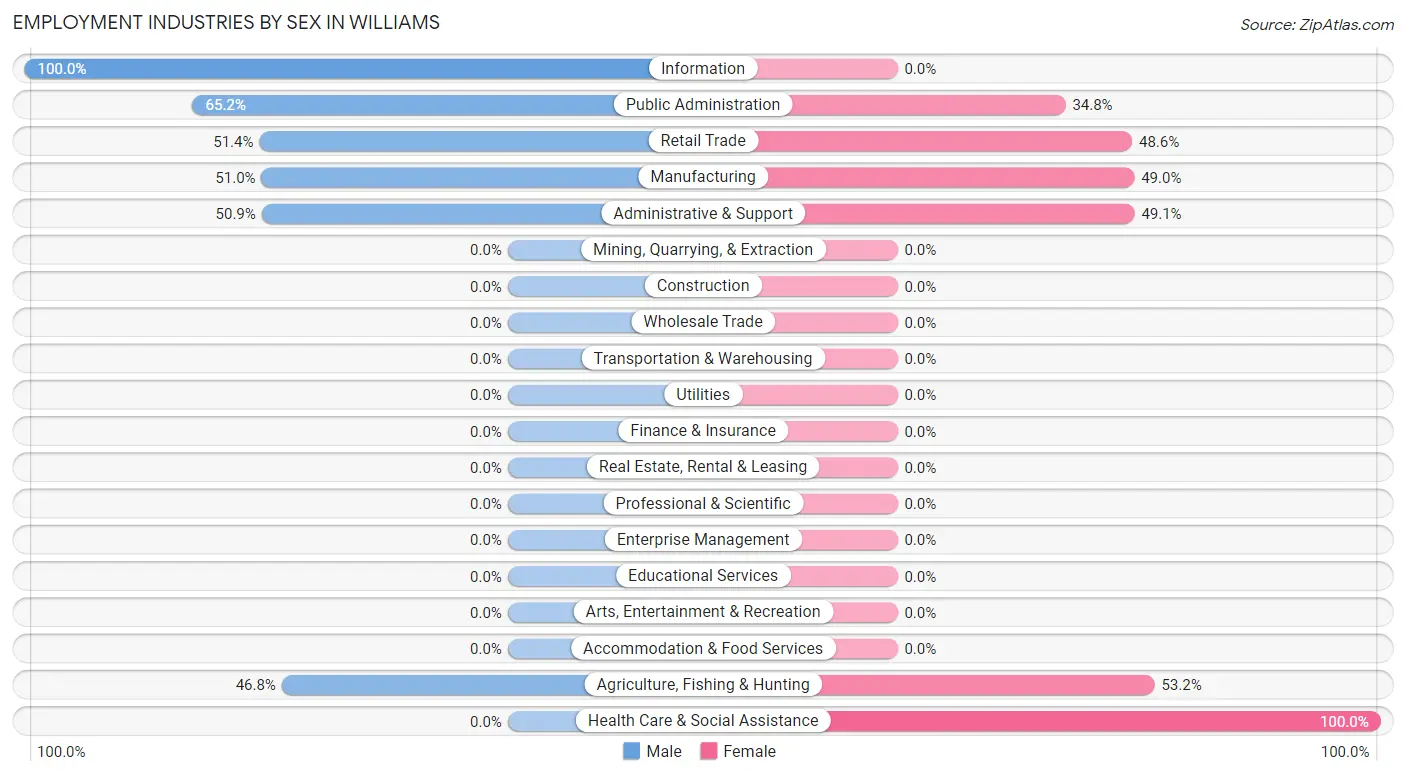
Employment Industries by Sex in Williams
The Williams industries that see more men than women are Information (100.0%), Public Administration (65.2%), and Retail Trade (51.4%), whereas the industries that tend to have a higher number of women are Health Care & Social Assistance (100.0%), Agriculture, Fishing & Hunting (53.2%), and Administrative & Support (49.1%).
| Industry | Male | Female |
| Agriculture, Fishing & Hunting | 51 (46.8%) | 58 (53.2%) |
| Mining, Quarrying, & Extraction | 0 (0.0%) | 0 (0.0%) |
| Construction | 0 (0.0%) | 0 (0.0%) |
| Manufacturing | 52 (51.0%) | 50 (49.0%) |
| Wholesale Trade | 0 (0.0%) | 0 (0.0%) |
| Retail Trade | 72 (51.4%) | 68 (48.6%) |
| Transportation & Warehousing | 0 (0.0%) | 0 (0.0%) |
| Utilities | 0 (0.0%) | 0 (0.0%) |
| Information | 94 (100.0%) | 0 (0.0%) |
| Finance & Insurance | 0 (0.0%) | 0 (0.0%) |
| Real Estate, Rental & Leasing | 0 (0.0%) | 0 (0.0%) |
| Professional & Scientific | 0 (0.0%) | 0 (0.0%) |
| Enterprise Management | 0 (0.0%) | 0 (0.0%) |
| Administrative & Support | 27 (50.9%) | 26 (49.1%) |
| Educational Services | 0 (0.0%) | 0 (0.0%) |
| Health Care & Social Assistance | 0 (0.0%) | 10 (100.0%) |
| Arts, Entertainment & Recreation | 0 (0.0%) | 0 (0.0%) |
| Accommodation & Food Services | 0 (0.0%) | 0 (0.0%) |
| Public Administration | 15 (65.2%) | 8 (34.8%) |
| Total | 311 (58.6%) | 220 (41.4%) |
Education in Williams
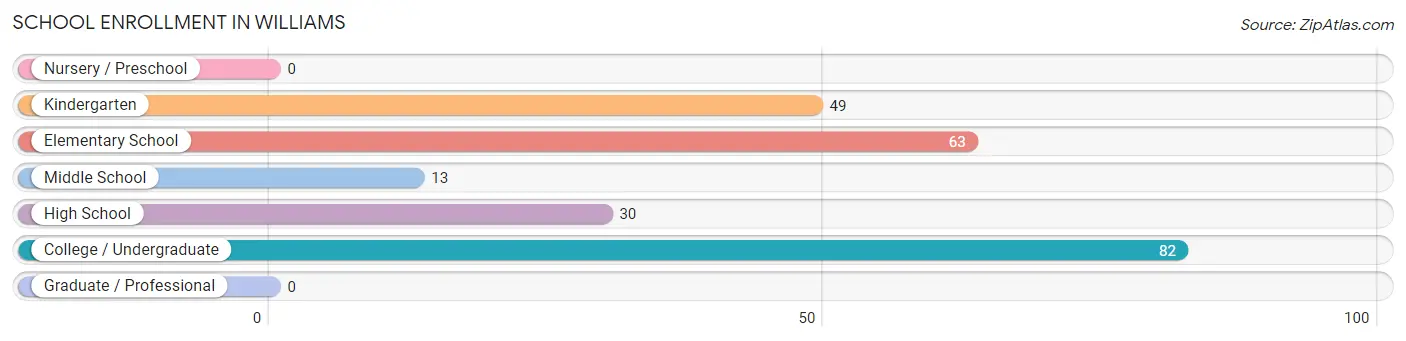
School Enrollment in Williams
The most common levels of schooling among the 237 students in Williams are college / undergraduate (82 | 34.6%), elementary school (63 | 26.6%), and kindergarten (49 | 20.7%).
| School Level | # Students | % Students |
| Nursery / Preschool | 0 | 0.0% |
| Kindergarten | 49 | 20.7% |
| Elementary School | 63 | 26.6% |
| Middle School | 13 | 5.5% |
| High School | 30 | 12.7% |
| College / Undergraduate | 82 | 34.6% |
| Graduate / Professional | 0 | 0.0% |
| Total | 237 | 100.0% |
School Enrollment by Age by Funding Source in Williams
Out of a total of 237 students who are enrolled in schools in Williams, 81 (34.2%) attend a private institution, while the remaining 156 (65.8%) are enrolled in public schools. The age group of 35 years and over has the highest likelihood of being enrolled in private schools, with 32 (100.0% in the age bracket) enrolled. Conversely, the age group of 10 to 14 year olds has the lowest likelihood of being enrolled in a private school, with 20 (100.0% in the age bracket) attending a public institution.
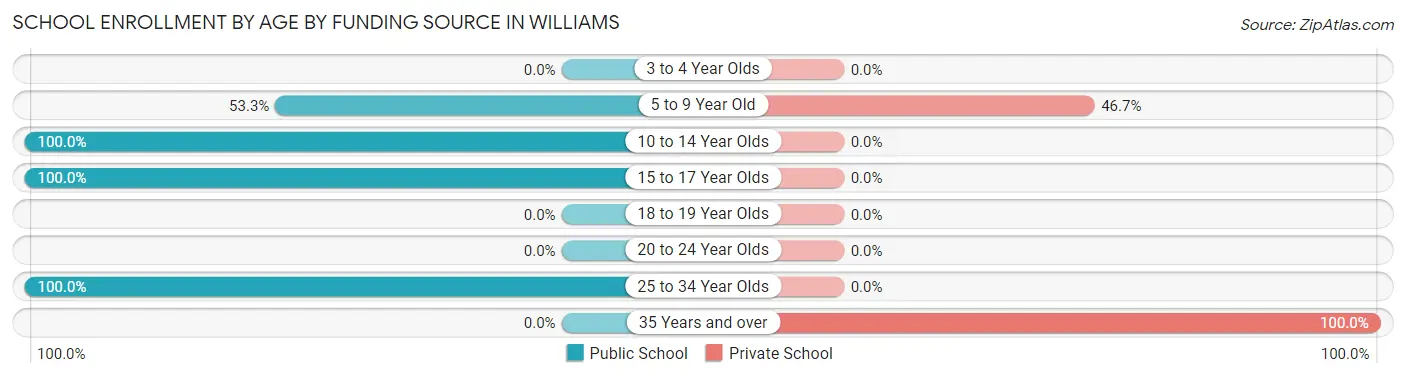
| Age Bracket | Public School | Private School |
| 3 to 4 Year Olds | 0 (0.0%) | 0 (0.0%) |
| 5 to 9 Year Old | 56 (53.3%) | 49 (46.7%) |
| 10 to 14 Year Olds | 20 (100.0%) | 0 (0.0%) |
| 15 to 17 Year Olds | 30 (100.0%) | 0 (0.0%) |
| 18 to 19 Year Olds | 0 (0.0%) | 0 (0.0%) |
| 20 to 24 Year Olds | 0 (0.0%) | 0 (0.0%) |
| 25 to 34 Year Olds | 50 (100.0%) | 0 (0.0%) |
| 35 Years and over | 0 (0.0%) | 32 (100.0%) |
| Total | 156 (65.8%) | 81 (34.2%) |
Educational Attainment by Field of Study in Williams
Bio, nature & agricultural (110 | 33.7%), business (84 | 25.8%), science & technology (53 | 16.3%), visual & performing arts (45 | 13.8%), and engineering (13 | 4.0%) are the most common fields of study among 326 individuals in Williams who have obtained a bachelor's degree or higher.
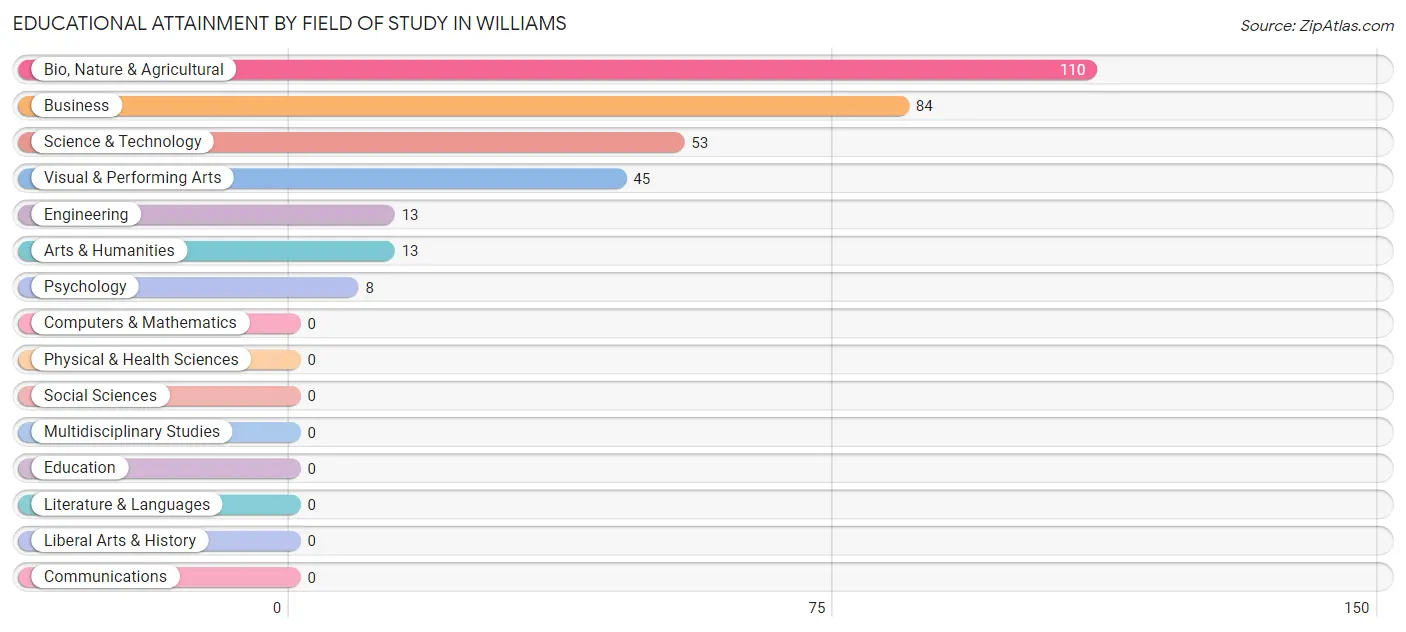
| Field of Study | # Graduates | % Graduates |
| Computers & Mathematics | 0 | 0.0% |
| Bio, Nature & Agricultural | 110 | 33.7% |
| Physical & Health Sciences | 0 | 0.0% |
| Psychology | 8 | 2.5% |
| Social Sciences | 0 | 0.0% |
| Engineering | 13 | 4.0% |
| Multidisciplinary Studies | 0 | 0.0% |
| Science & Technology | 53 | 16.3% |
| Business | 84 | 25.8% |
| Education | 0 | 0.0% |
| Literature & Languages | 0 | 0.0% |
| Liberal Arts & History | 0 | 0.0% |
| Visual & Performing Arts | 45 | 13.8% |
| Communications | 0 | 0.0% |
| Arts & Humanities | 13 | 4.0% |
| Total | 326 | 100.0% |
Transportation & Commute in Williams
Vehicle Availability by Sex in Williams
The most prevalent vehicle ownership categories in Williams are males with 3 vehicles (180, accounting for 57.9%) and females with 3 vehicles (86, making up 81.8%).
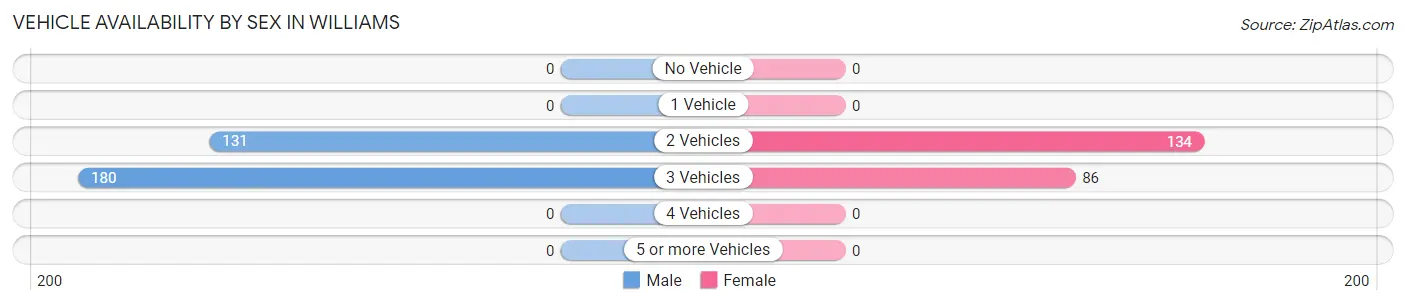
| Vehicles Available | Male | Female |
| No Vehicle | 0 (0.0%) | 0 (0.0%) |
| 1 Vehicle | 0 (0.0%) | 0 (0.0%) |
| 2 Vehicles | 131 (42.1%) | 134 (60.9%) |
| 3 Vehicles | 180 (57.9%) | 86 (39.1%) |
| 4 Vehicles | 0 (0.0%) | 0 (0.0%) |
| 5 or more Vehicles | 0 (0.0%) | 0 (0.0%) |
| Total | 311 (100.0%) | 220 (100.0%) |
Commute Time in Williams
The most frequently occuring commute durations in Williams are less than 5 minutes (132 commuters, 35.5%), 20 to 24 minutes (103 commuters, 27.7%), and 15 to 19 minutes (52 commuters, 14.0%).
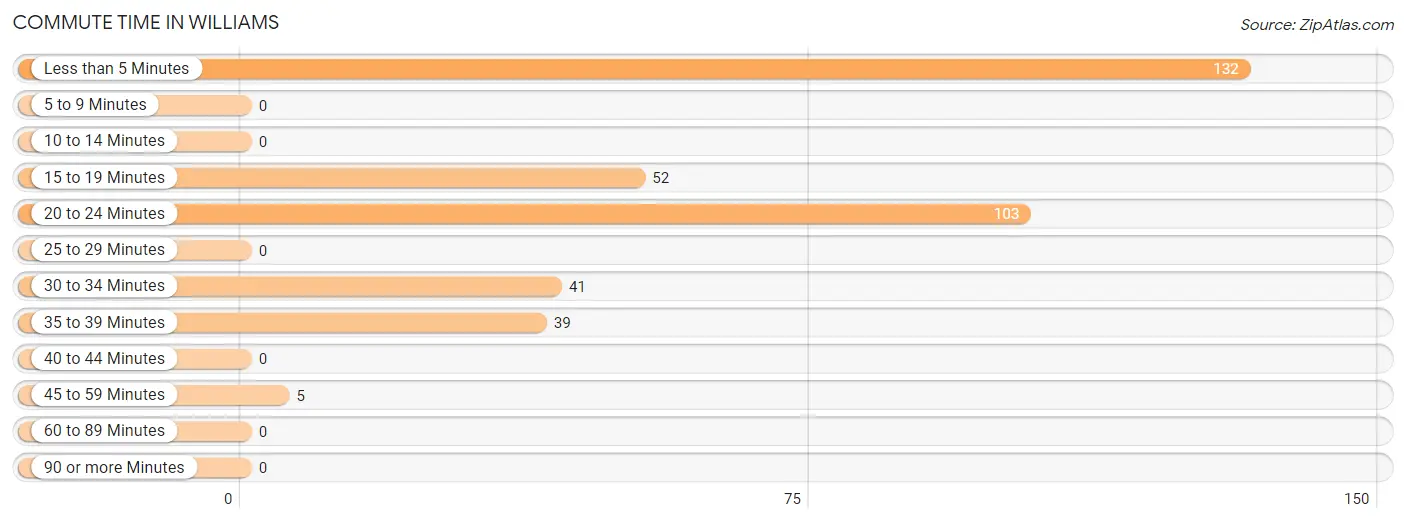
| Commute Time | # Commuters | % Commuters |
| Less than 5 Minutes | 132 | 35.5% |
| 5 to 9 Minutes | 0 | 0.0% |
| 10 to 14 Minutes | 0 | 0.0% |
| 15 to 19 Minutes | 52 | 14.0% |
| 20 to 24 Minutes | 103 | 27.7% |
| 25 to 29 Minutes | 0 | 0.0% |
| 30 to 34 Minutes | 41 | 11.0% |
| 35 to 39 Minutes | 39 | 10.5% |
| 40 to 44 Minutes | 0 | 0.0% |
| 45 to 59 Minutes | 5 | 1.3% |
| 60 to 89 Minutes | 0 | 0.0% |
| 90 or more Minutes | 0 | 0.0% |
Commute Time by Sex in Williams
The most common commute times in Williams are less than 5 minutes (66 commuters, 35.9%) for males and 20 to 24 minutes (76 commuters, 40.4%) for females.
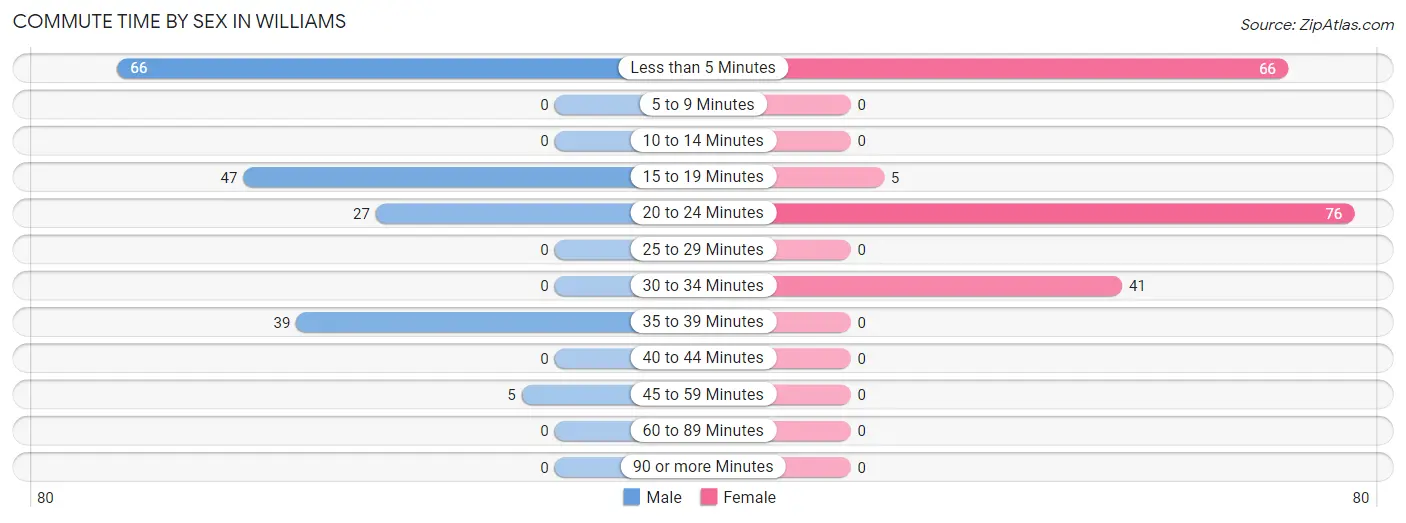
| Commute Time | Male | Female |
| Less than 5 Minutes | 66 (35.9%) | 66 (35.1%) |
| 5 to 9 Minutes | 0 (0.0%) | 0 (0.0%) |
| 10 to 14 Minutes | 0 (0.0%) | 0 (0.0%) |
| 15 to 19 Minutes | 47 (25.5%) | 5 (2.7%) |
| 20 to 24 Minutes | 27 (14.7%) | 76 (40.4%) |
| 25 to 29 Minutes | 0 (0.0%) | 0 (0.0%) |
| 30 to 34 Minutes | 0 (0.0%) | 41 (21.8%) |
| 35 to 39 Minutes | 39 (21.2%) | 0 (0.0%) |
| 40 to 44 Minutes | 0 (0.0%) | 0 (0.0%) |
| 45 to 59 Minutes | 5 (2.7%) | 0 (0.0%) |
| 60 to 89 Minutes | 0 (0.0%) | 0 (0.0%) |
| 90 or more Minutes | 0 (0.0%) | 0 (0.0%) |
Time of Departure to Work by Sex in Williams
The most frequent times of departure to work in Williams are 7:30 AM to 7:59 AM (61, 33.2%) for males and 8:00 AM to 8:29 AM (94, 50.0%) for females.
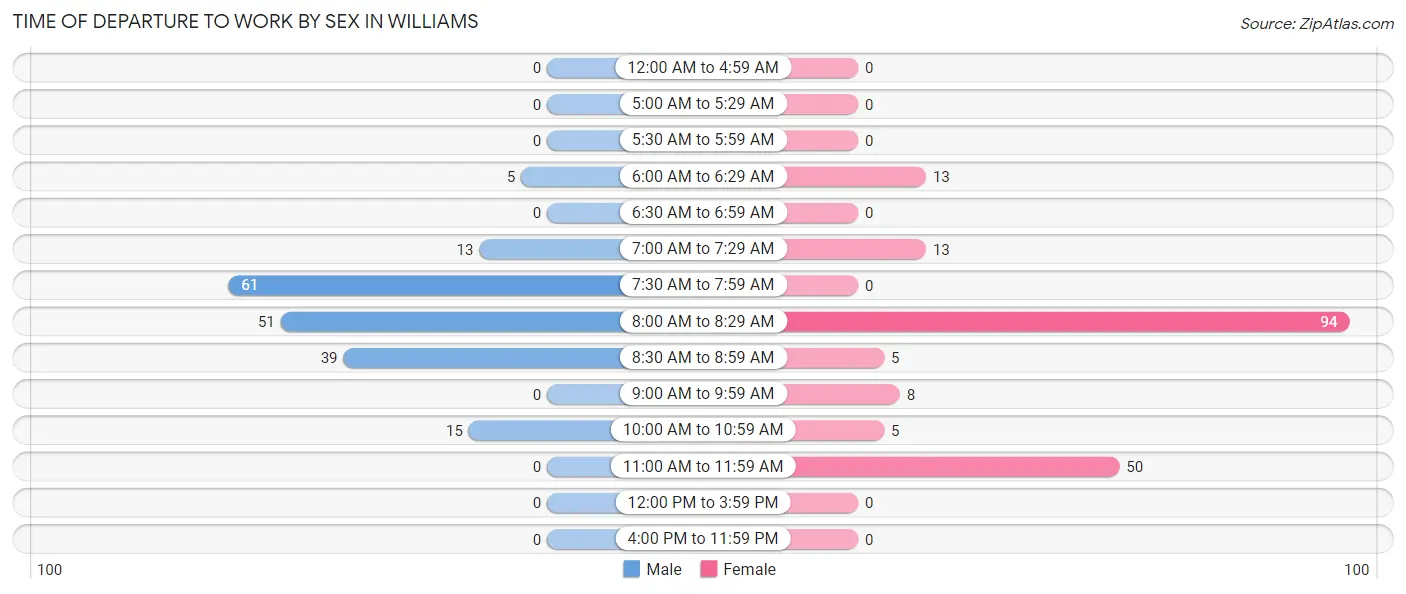
| Time of Departure | Male | Female |
| 12:00 AM to 4:59 AM | 0 (0.0%) | 0 (0.0%) |
| 5:00 AM to 5:29 AM | 0 (0.0%) | 0 (0.0%) |
| 5:30 AM to 5:59 AM | 0 (0.0%) | 0 (0.0%) |
| 6:00 AM to 6:29 AM | 5 (2.7%) | 13 (6.9%) |
| 6:30 AM to 6:59 AM | 0 (0.0%) | 0 (0.0%) |
| 7:00 AM to 7:29 AM | 13 (7.1%) | 13 (6.9%) |
| 7:30 AM to 7:59 AM | 61 (33.2%) | 0 (0.0%) |
| 8:00 AM to 8:29 AM | 51 (27.7%) | 94 (50.0%) |
| 8:30 AM to 8:59 AM | 39 (21.2%) | 5 (2.7%) |
| 9:00 AM to 9:59 AM | 0 (0.0%) | 8 (4.3%) |
| 10:00 AM to 10:59 AM | 15 (8.2%) | 5 (2.7%) |
| 11:00 AM to 11:59 AM | 0 (0.0%) | 50 (26.6%) |
| 12:00 PM to 3:59 PM | 0 (0.0%) | 0 (0.0%) |
| 4:00 PM to 11:59 PM | 0 (0.0%) | 0 (0.0%) |
| Total | 184 (100.0%) | 188 (100.0%) |
Housing Occupancy in Williams
Occupancy by Ownership in Williams
Of the total 494 dwellings in Williams, owner-occupied units account for 376 (76.1%), while renter-occupied units make up 118 (23.9%).
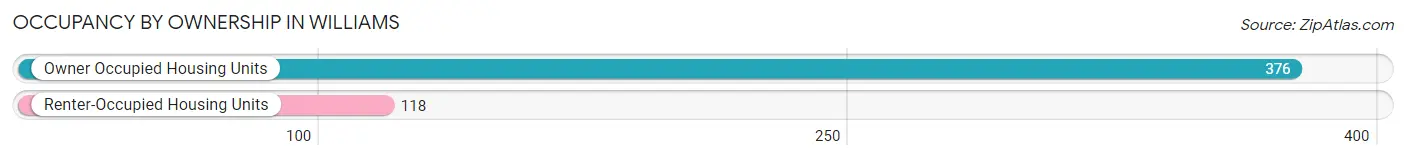
| Occupancy | # Housing Units | % Housing Units |
| Owner Occupied Housing Units | 376 | 76.1% |
| Renter-Occupied Housing Units | 118 | 23.9% |
| Total Occupied Housing Units | 494 | 100.0% |
Occupancy by Household Size in Williams
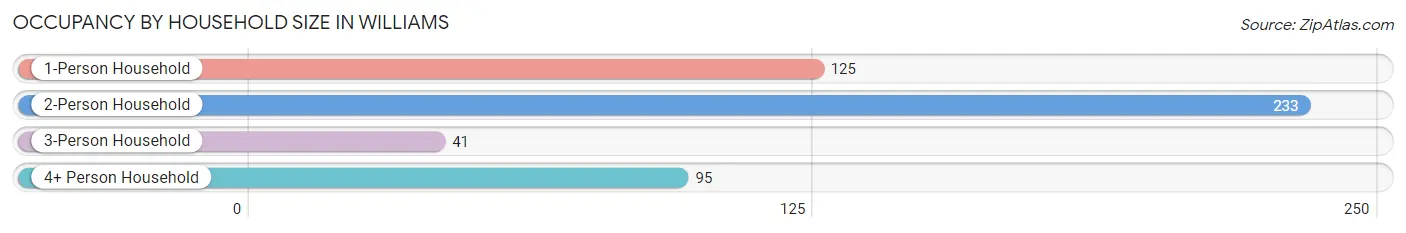
| Household Size | # Housing Units | % Housing Units |
| 1-Person Household | 125 | 25.3% |
| 2-Person Household | 233 | 47.2% |
| 3-Person Household | 41 | 8.3% |
| 4+ Person Household | 95 | 19.2% |
| Total Housing Units | 494 | 100.0% |
Occupancy by Ownership by Household Size in Williams
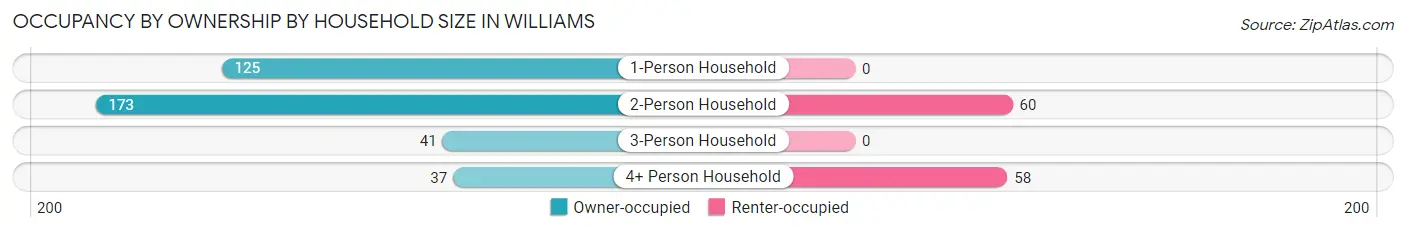
| Household Size | Owner-occupied | Renter-occupied |
| 1-Person Household | 125 (100.0%) | 0 (0.0%) |
| 2-Person Household | 173 (74.3%) | 60 (25.8%) |
| 3-Person Household | 41 (100.0%) | 0 (0.0%) |
| 4+ Person Household | 37 (39.0%) | 58 (61.1%) |
| Total Housing Units | 376 (76.1%) | 118 (23.9%) |
Occupancy by Educational Attainment in Williams
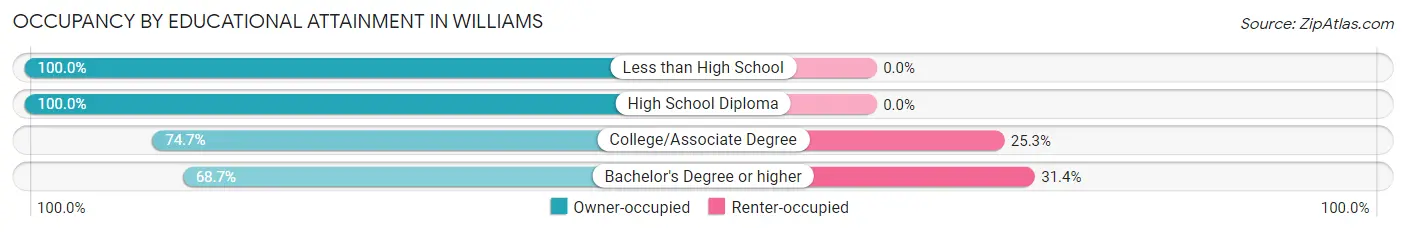
| Household Size | Owner-occupied | Renter-occupied |
| Less than High School | 24 (100.0%) | 0 (0.0%) |
| High School Diploma | 48 (100.0%) | 0 (0.0%) |
| College/Associate Degree | 177 (74.7%) | 60 (25.3%) |
| Bachelor's Degree or higher | 127 (68.6%) | 58 (31.4%) |
Occupancy by Age of Householder in Williams
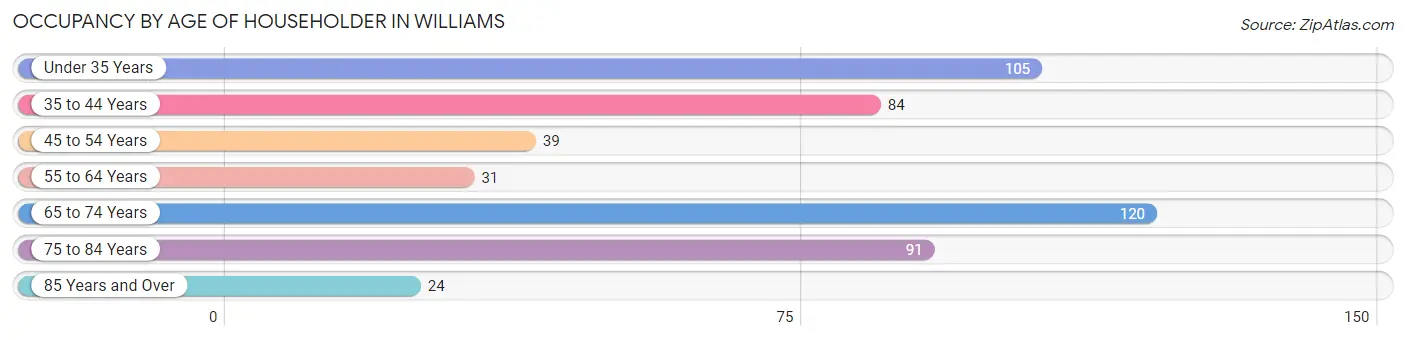
| Age Bracket | # Households | % Households |
| Under 35 Years | 105 | 21.3% |
| 35 to 44 Years | 84 | 17.0% |
| 45 to 54 Years | 39 | 7.9% |
| 55 to 64 Years | 31 | 6.3% |
| 65 to 74 Years | 120 | 24.3% |
| 75 to 84 Years | 91 | 18.4% |
| 85 Years and Over | 24 | 4.9% |
| Total | 494 | 100.0% |
Housing Finances in Williams
Median Income by Occupancy in Williams
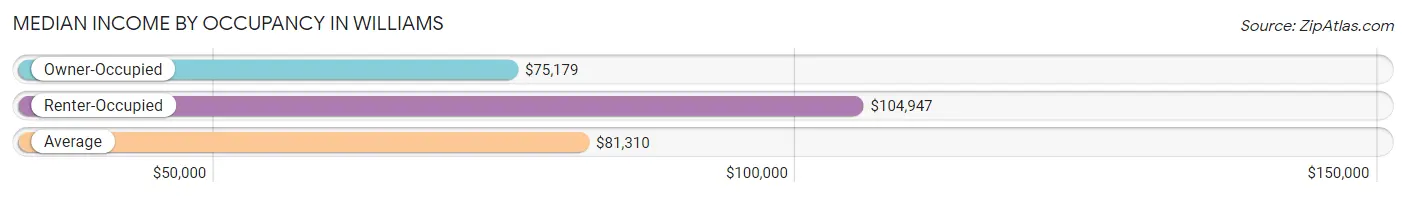
| Occupancy Type | # Households | Median Income |
| Owner-Occupied | 376 (76.1%) | $75,179 |
| Renter-Occupied | 118 (23.9%) | $104,947 |
| Average | 494 (100.0%) | $81,310 |
Occupancy by Householder Income Bracket in Williams
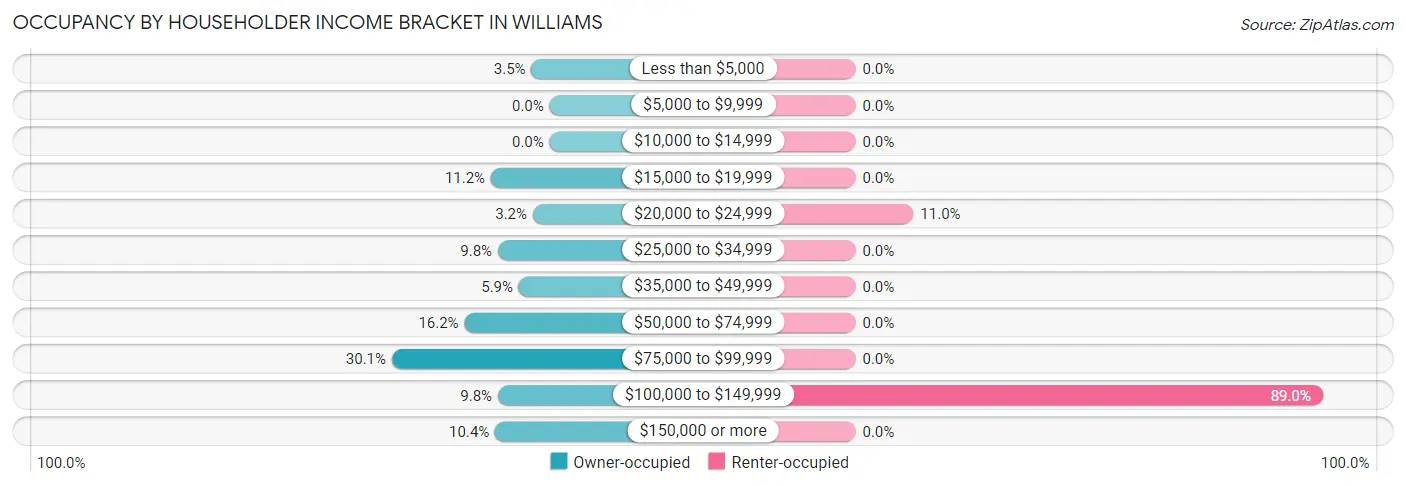
| Income Bracket | Owner-occupied | Renter-occupied |
| Less than $5,000 | 13 (3.5%) | 0 (0.0%) |
| $5,000 to $9,999 | 0 (0.0%) | 0 (0.0%) |
| $10,000 to $14,999 | 0 (0.0%) | 0 (0.0%) |
| $15,000 to $19,999 | 42 (11.2%) | 0 (0.0%) |
| $20,000 to $24,999 | 12 (3.2%) | 13 (11.0%) |
| $25,000 to $34,999 | 37 (9.8%) | 0 (0.0%) |
| $35,000 to $49,999 | 22 (5.9%) | 0 (0.0%) |
| $50,000 to $74,999 | 61 (16.2%) | 0 (0.0%) |
| $75,000 to $99,999 | 113 (30.0%) | 0 (0.0%) |
| $100,000 to $149,999 | 37 (9.8%) | 105 (89.0%) |
| $150,000 or more | 39 (10.4%) | 0 (0.0%) |
| Total | 376 (100.0%) | 118 (100.0%) |
Monthly Housing Cost Tiers in Williams
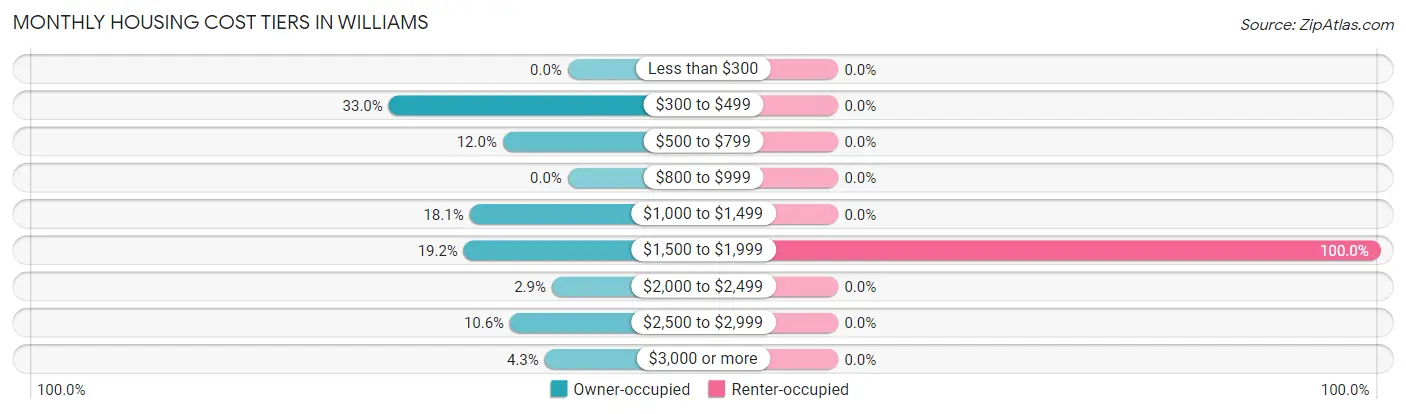
| Monthly Cost | Owner-occupied | Renter-occupied |
| Less than $300 | 0 (0.0%) | 0 (0.0%) |
| $300 to $499 | 124 (33.0%) | 0 (0.0%) |
| $500 to $799 | 45 (12.0%) | 0 (0.0%) |
| $800 to $999 | 0 (0.0%) | 0 (0.0%) |
| $1,000 to $1,499 | 68 (18.1%) | 0 (0.0%) |
| $1,500 to $1,999 | 72 (19.2%) | 118 (100.0%) |
| $2,000 to $2,499 | 11 (2.9%) | 0 (0.0%) |
| $2,500 to $2,999 | 40 (10.6%) | 0 (0.0%) |
| $3,000 or more | 16 (4.3%) | 0 (0.0%) |
| Total | 376 (100.0%) | 118 (100.0%) |
Physical Housing Characteristics in Williams
Housing Structures in Williams
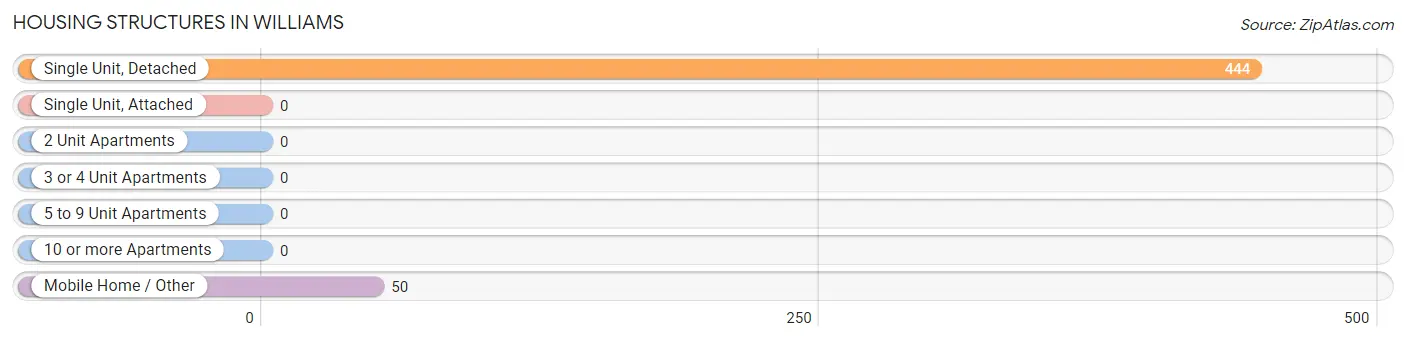
| Structure Type | # Housing Units | % Housing Units |
| Single Unit, Detached | 444 | 89.9% |
| Single Unit, Attached | 0 | 0.0% |
| 2 Unit Apartments | 0 | 0.0% |
| 3 or 4 Unit Apartments | 0 | 0.0% |
| 5 to 9 Unit Apartments | 0 | 0.0% |
| 10 or more Apartments | 0 | 0.0% |
| Mobile Home / Other | 50 | 10.1% |
| Total | 494 | 100.0% |
Housing Structures by Occupancy in Williams
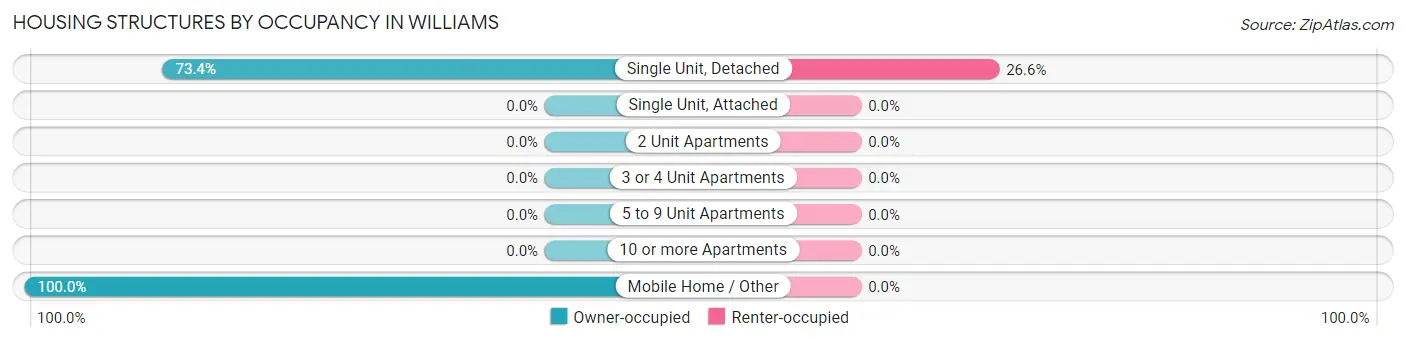
| Structure Type | Owner-occupied | Renter-occupied |
| Single Unit, Detached | 326 (73.4%) | 118 (26.6%) |
| Single Unit, Attached | 0 (0.0%) | 0 (0.0%) |
| 2 Unit Apartments | 0 (0.0%) | 0 (0.0%) |
| 3 or 4 Unit Apartments | 0 (0.0%) | 0 (0.0%) |
| 5 to 9 Unit Apartments | 0 (0.0%) | 0 (0.0%) |
| 10 or more Apartments | 0 (0.0%) | 0 (0.0%) |
| Mobile Home / Other | 50 (100.0%) | 0 (0.0%) |
| Total | 376 (76.1%) | 118 (23.9%) |
Housing Structures by Number of Rooms in Williams
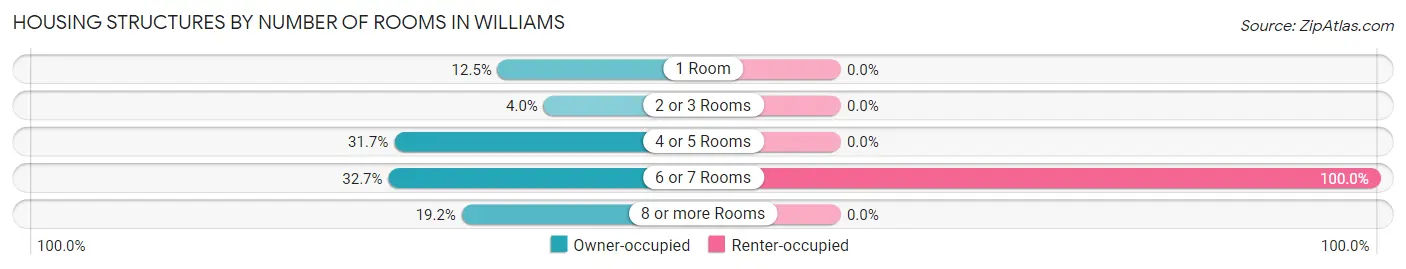
| Number of Rooms | Owner-occupied | Renter-occupied |
| 1 Room | 47 (12.5%) | 0 (0.0%) |
| 2 or 3 Rooms | 15 (4.0%) | 0 (0.0%) |
| 4 or 5 Rooms | 119 (31.7%) | 0 (0.0%) |
| 6 or 7 Rooms | 123 (32.7%) | 118 (100.0%) |
| 8 or more Rooms | 72 (19.2%) | 0 (0.0%) |
| Total | 376 (100.0%) | 118 (100.0%) |
Housing Structure by Heating Type in Williams
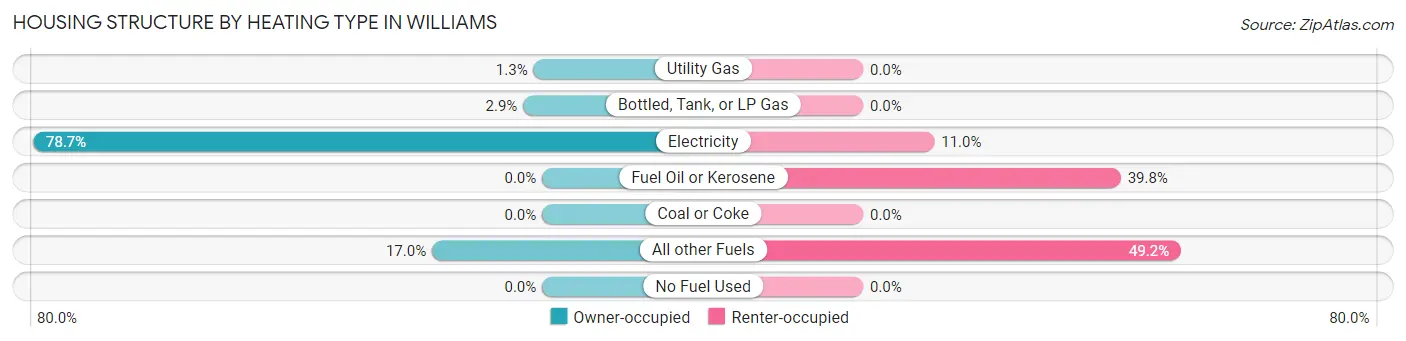
| Heating Type | Owner-occupied | Renter-occupied |
| Utility Gas | 5 (1.3%) | 0 (0.0%) |
| Bottled, Tank, or LP Gas | 11 (2.9%) | 0 (0.0%) |
| Electricity | 296 (78.7%) | 13 (11.0%) |
| Fuel Oil or Kerosene | 0 (0.0%) | 47 (39.8%) |
| Coal or Coke | 0 (0.0%) | 0 (0.0%) |
| All other Fuels | 64 (17.0%) | 58 (49.1%) |
| No Fuel Used | 0 (0.0%) | 0 (0.0%) |
| Total | 376 (100.0%) | 118 (100.0%) |
Household Vehicle Usage in Williams
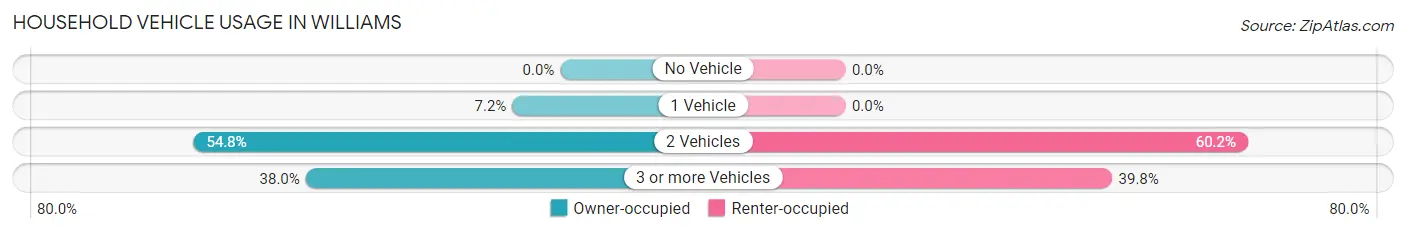
| Vehicles per Household | Owner-occupied | Renter-occupied |
| No Vehicle | 0 (0.0%) | 0 (0.0%) |
| 1 Vehicle | 27 (7.2%) | 0 (0.0%) |
| 2 Vehicles | 206 (54.8%) | 71 (60.2%) |
| 3 or more Vehicles | 143 (38.0%) | 47 (39.8%) |
| Total | 376 (100.0%) | 118 (100.0%) |
Real Estate & Mortgages in Williams
Real Estate and Mortgage Overview in Williams
| Characteristic | Without Mortgage | With Mortgage |
| Housing Units | 169 | 207 |
| Median Property Value | $342,400 | $433,000 |
| Median Household Income | $81,090 | $0 |
| Monthly Housing Costs | $438 | $16 |
| Real Estate Taxes | $1,867 | $0 |
Property Value by Mortgage Status in Williams
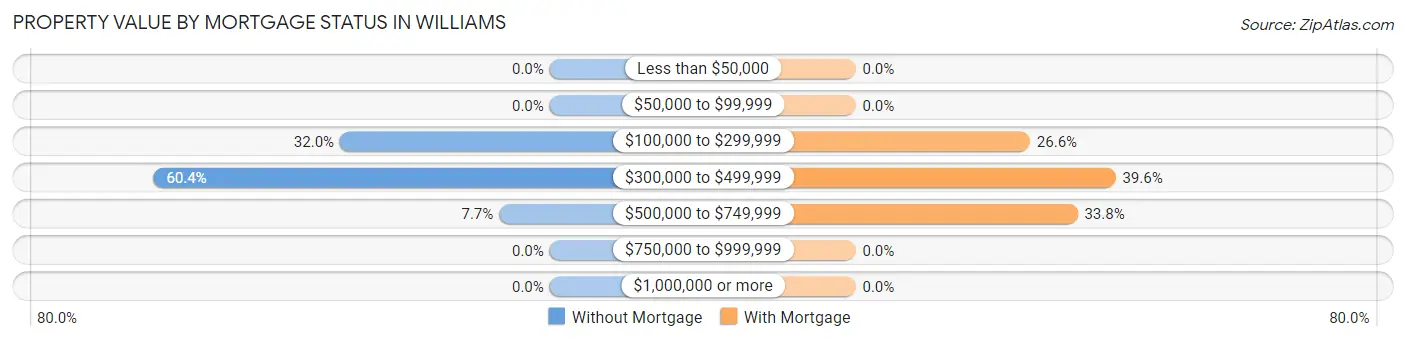
| Property Value | Without Mortgage | With Mortgage |
| Less than $50,000 | 0 (0.0%) | 0 (0.0%) |
| $50,000 to $99,999 | 0 (0.0%) | 0 (0.0%) |
| $100,000 to $299,999 | 54 (32.0%) | 55 (26.6%) |
| $300,000 to $499,999 | 102 (60.4%) | 82 (39.6%) |
| $500,000 to $749,999 | 13 (7.7%) | 70 (33.8%) |
| $750,000 to $999,999 | 0 (0.0%) | 0 (0.0%) |
| $1,000,000 or more | 0 (0.0%) | 0 (0.0%) |
| Total | 169 (100.0%) | 207 (100.0%) |
Household Income by Mortgage Status in Williams
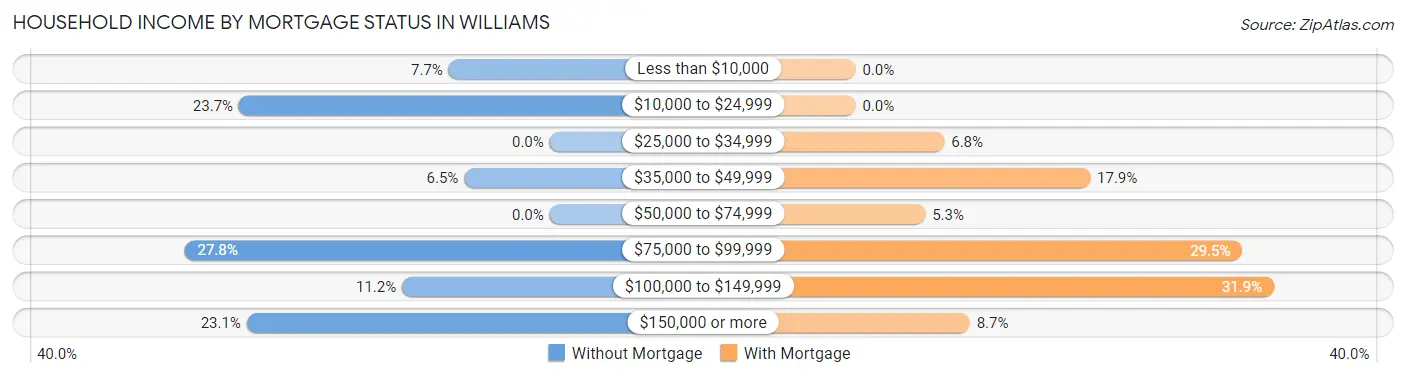
| Household Income | Without Mortgage | With Mortgage |
| Less than $10,000 | 13 (7.7%) | 0 (0.0%) |
| $10,000 to $24,999 | 40 (23.7%) | 0 (0.0%) |
| $25,000 to $34,999 | 0 (0.0%) | 14 (6.8%) |
| $35,000 to $49,999 | 11 (6.5%) | 37 (17.9%) |
| $50,000 to $74,999 | 0 (0.0%) | 11 (5.3%) |
| $75,000 to $99,999 | 47 (27.8%) | 61 (29.5%) |
| $100,000 to $149,999 | 19 (11.2%) | 66 (31.9%) |
| $150,000 or more | 39 (23.1%) | 18 (8.7%) |
| Total | 169 (100.0%) | 207 (100.0%) |
Property Value to Household Income Ratio in Williams
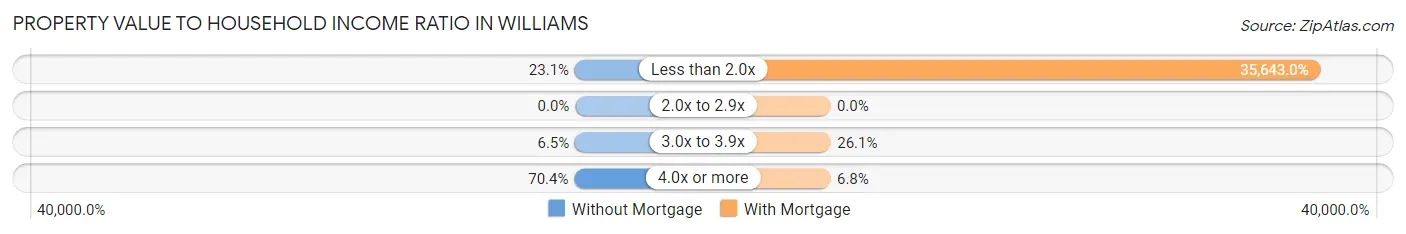
| Value-to-Income Ratio | Without Mortgage | With Mortgage |
| Less than 2.0x | 39 (23.1%) | 73,781 (35,643.0%) |
| 2.0x to 2.9x | 0 (0.0%) | 0 (0.0%) |
| 3.0x to 3.9x | 11 (6.5%) | 54 (26.1%) |
| 4.0x or more | 119 (70.4%) | 14 (6.8%) |
| Total | 169 (100.0%) | 207 (100.0%) |
Real Estate Taxes by Mortgage Status in Williams
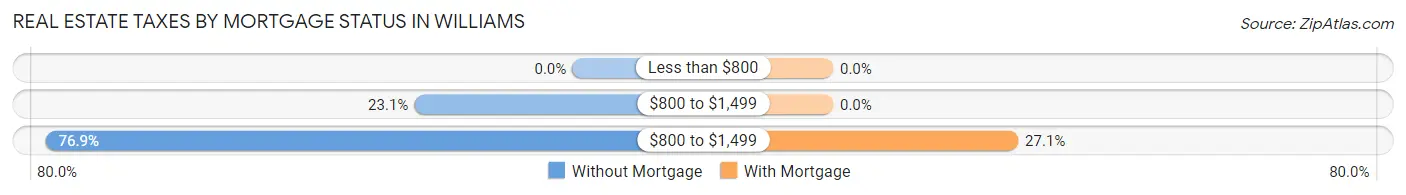
| Property Taxes | Without Mortgage | With Mortgage |
| Less than $800 | 0 (0.0%) | 0 (0.0%) |
| $800 to $1,499 | 39 (23.1%) | 0 (0.0%) |
| $800 to $1,499 | 130 (76.9%) | 56 (27.1%) |
| Total | 169 (100.0%) | 207 (100.0%) |
Health & Disability in Williams
Health Insurance Coverage by Age in Williams
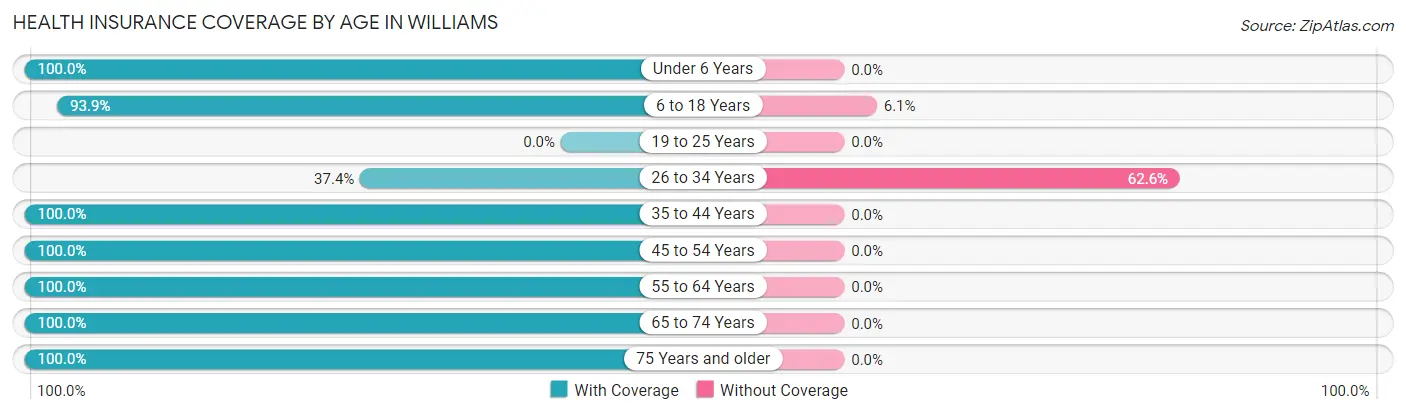
| Age Bracket | With Coverage | Without Coverage |
| Under 6 Years | 115 (100.0%) | 0 (0.0%) |
| 6 to 18 Years | 155 (93.9%) | 10 (6.1%) |
| 19 to 25 Years | 0 (0.0%) | 0 (0.0%) |
| 26 to 34 Years | 58 (37.4%) | 97 (62.6%) |
| 35 to 44 Years | 187 (100.0%) | 0 (0.0%) |
| 45 to 54 Years | 91 (100.0%) | 0 (0.0%) |
| 55 to 64 Years | 119 (100.0%) | 0 (0.0%) |
| 65 to 74 Years | 149 (100.0%) | 0 (0.0%) |
| 75 Years and older | 192 (100.0%) | 0 (0.0%) |
| Total | 1,066 (90.9%) | 107 (9.1%) |
Health Insurance Coverage by Citizenship Status in Williams
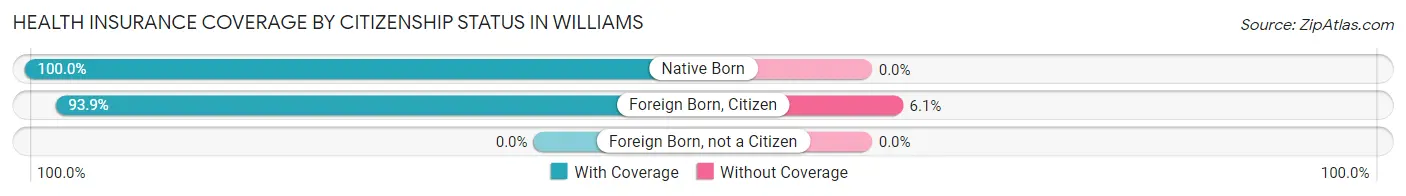
| Citizenship Status | With Coverage | Without Coverage |
| Native Born | 115 (100.0%) | 0 (0.0%) |
| Foreign Born, Citizen | 155 (93.9%) | 10 (6.1%) |
| Foreign Born, not a Citizen | 0 (0.0%) | 0 (0.0%) |
Health Insurance Coverage by Household Income in Williams
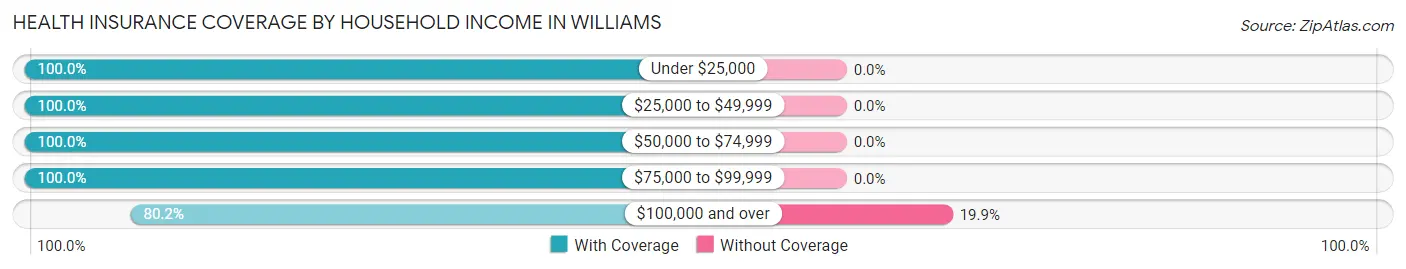
| Household Income | With Coverage | Without Coverage |
| Under $25,000 | 105 (100.0%) | 0 (0.0%) |
| $25,000 to $49,999 | 195 (100.0%) | 0 (0.0%) |
| $50,000 to $74,999 | 105 (100.0%) | 0 (0.0%) |
| $75,000 to $99,999 | 229 (100.0%) | 0 (0.0%) |
| $100,000 and over | 432 (80.1%) | 107 (19.9%) |
Public vs Private Health Insurance Coverage by Age in Williams
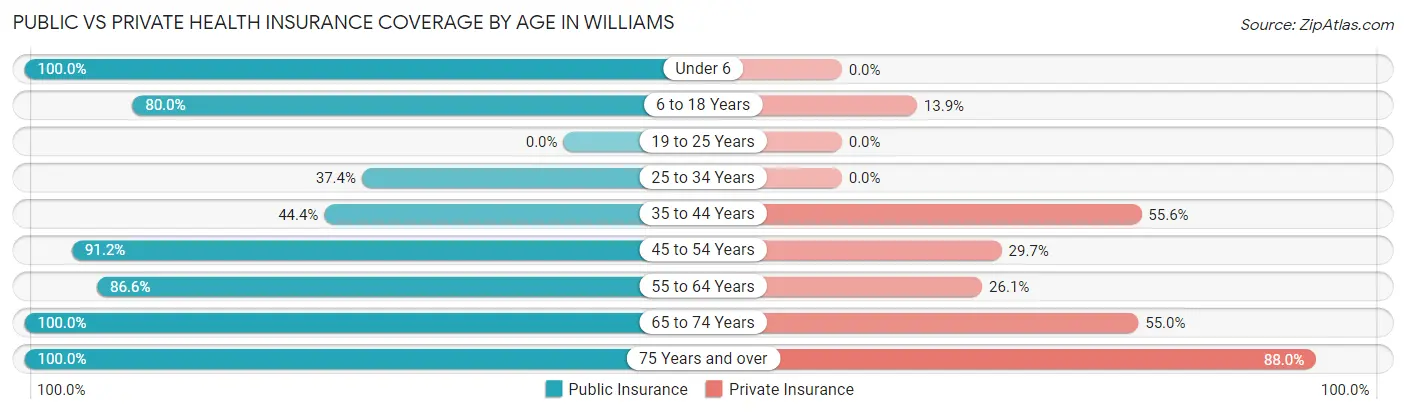
| Age Bracket | Public Insurance | Private Insurance |
| Under 6 | 115 (100.0%) | 0 (0.0%) |
| 6 to 18 Years | 132 (80.0%) | 23 (13.9%) |
| 19 to 25 Years | 0 (0.0%) | 0 (0.0%) |
| 25 to 34 Years | 58 (37.4%) | 0 (0.0%) |
| 35 to 44 Years | 83 (44.4%) | 104 (55.6%) |
| 45 to 54 Years | 83 (91.2%) | 27 (29.7%) |
| 55 to 64 Years | 103 (86.6%) | 31 (26.1%) |
| 65 to 74 Years | 149 (100.0%) | 82 (55.0%) |
| 75 Years and over | 192 (100.0%) | 169 (88.0%) |
| Total | 915 (78.0%) | 436 (37.2%) |
Disability Status by Sex by Age in Williams
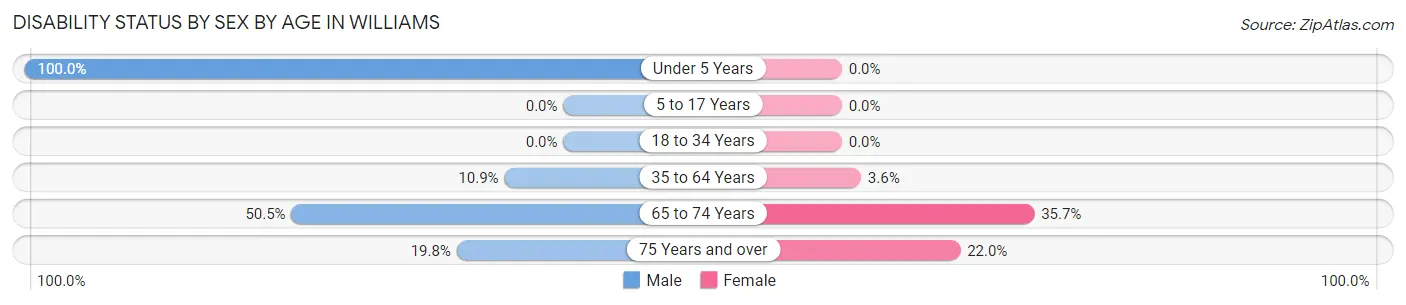
| Age Bracket | Male | Female |
| Under 5 Years | 56 (100.0%) | 0 (0.0%) |
| 5 to 17 Years | 0 (0.0%) | 0 (0.0%) |
| 18 to 34 Years | 0 (0.0%) | 0 (0.0%) |
| 35 to 64 Years | 28 (10.9%) | 5 (3.5%) |
| 65 to 74 Years | 54 (50.5%) | 15 (35.7%) |
| 75 Years and over | 20 (19.8%) | 20 (22.0%) |
Disability Class by Sex by Age in Williams
Disability Class: Hearing Difficulty
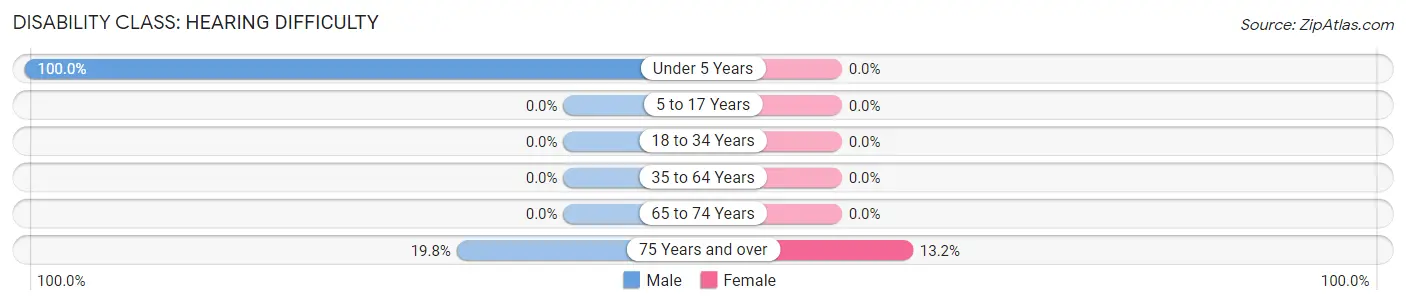
| Age Bracket | Male | Female |
| Under 5 Years | 56 (100.0%) | 0 (0.0%) |
| 5 to 17 Years | 0 (0.0%) | 0 (0.0%) |
| 18 to 34 Years | 0 (0.0%) | 0 (0.0%) |
| 35 to 64 Years | 0 (0.0%) | 0 (0.0%) |
| 65 to 74 Years | 0 (0.0%) | 0 (0.0%) |
| 75 Years and over | 20 (19.8%) | 12 (13.2%) |
Disability Class: Vision Difficulty
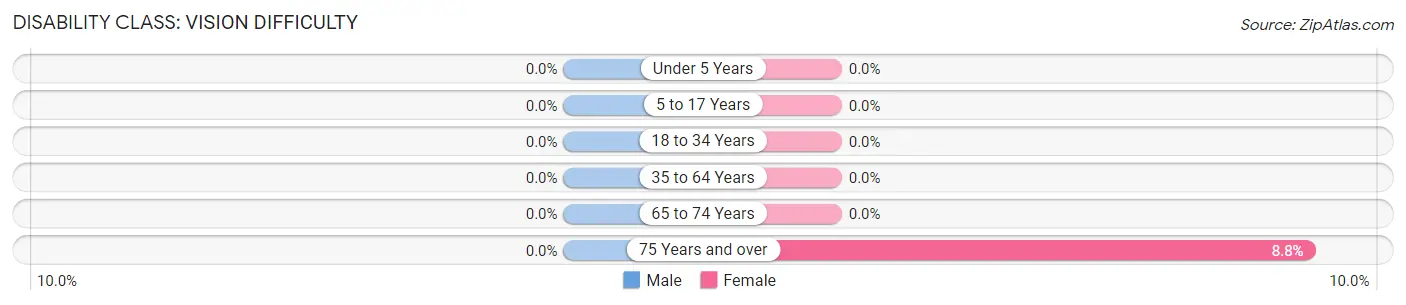
| Age Bracket | Male | Female |
| Under 5 Years | 0 (0.0%) | 0 (0.0%) |
| 5 to 17 Years | 0 (0.0%) | 0 (0.0%) |
| 18 to 34 Years | 0 (0.0%) | 0 (0.0%) |
| 35 to 64 Years | 0 (0.0%) | 0 (0.0%) |
| 65 to 74 Years | 0 (0.0%) | 0 (0.0%) |
| 75 Years and over | 0 (0.0%) | 8 (8.8%) |
Disability Class: Cognitive Difficulty
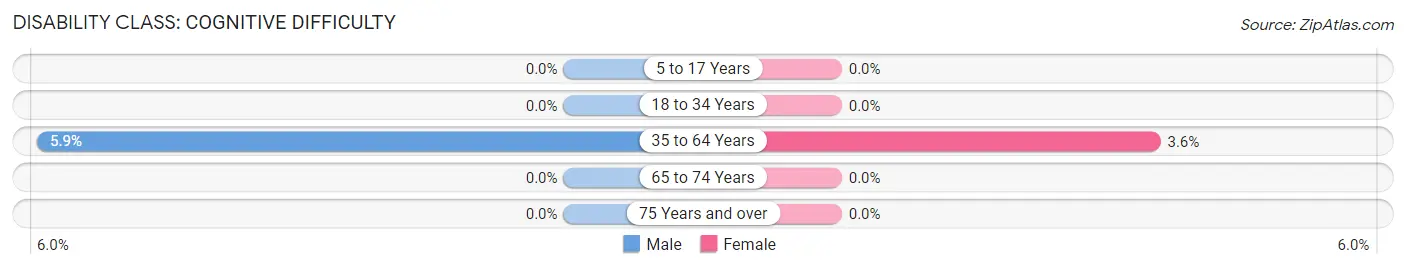
| Age Bracket | Male | Female |
| 5 to 17 Years | 0 (0.0%) | 0 (0.0%) |
| 18 to 34 Years | 0 (0.0%) | 0 (0.0%) |
| 35 to 64 Years | 15 (5.9%) | 5 (3.5%) |
| 65 to 74 Years | 0 (0.0%) | 0 (0.0%) |
| 75 Years and over | 0 (0.0%) | 0 (0.0%) |
Disability Class: Ambulatory Difficulty
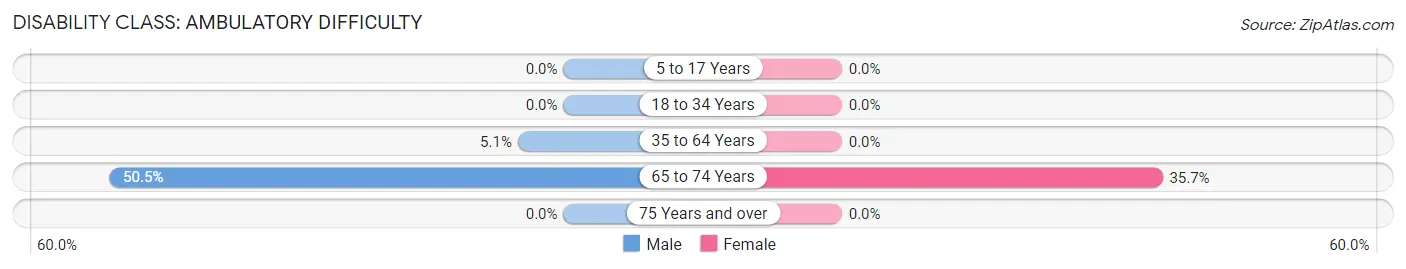
| Age Bracket | Male | Female |
| 5 to 17 Years | 0 (0.0%) | 0 (0.0%) |
| 18 to 34 Years | 0 (0.0%) | 0 (0.0%) |
| 35 to 64 Years | 13 (5.1%) | 0 (0.0%) |
| 65 to 74 Years | 54 (50.5%) | 15 (35.7%) |
| 75 Years and over | 0 (0.0%) | 0 (0.0%) |
Disability Class: Self-Care Difficulty
| Age Bracket | Male | Female |
| 5 to 17 Years | 0 (0.0%) | 0 (0.0%) |
| 18 to 34 Years | 0 (0.0%) | 0 (0.0%) |
| 35 to 64 Years | 0 (0.0%) | 0 (0.0%) |
| 65 to 74 Years | 0 (0.0%) | 0 (0.0%) |
| 75 Years and over | 0 (0.0%) | 0 (0.0%) |
Technology Access in Williams
Computing Device Access in Williams
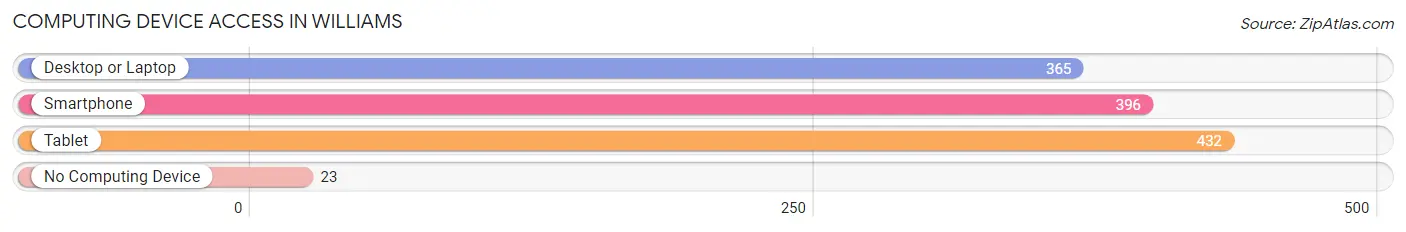
| Device Type | # Households | % Households |
| Desktop or Laptop | 365 | 73.9% |
| Smartphone | 396 | 80.2% |
| Tablet | 432 | 87.5% |
| No Computing Device | 23 | 4.7% |
| Total | 494 | 100.0% |
Internet Access in Williams
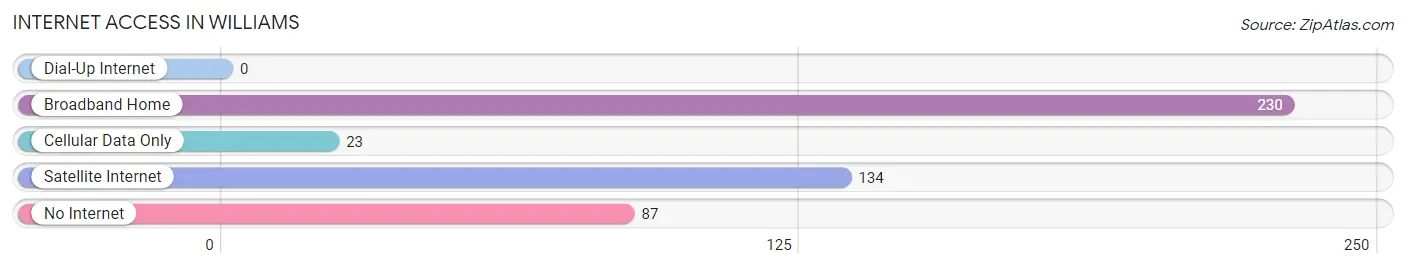
| Internet Type | # Households | % Households |
| Dial-Up Internet | 0 | 0.0% |
| Broadband Home | 230 | 46.6% |
| Cellular Data Only | 23 | 4.7% |
| Satellite Internet | 134 | 27.1% |
| No Internet | 87 | 17.6% |
| Total | 494 | 100.0% |
Williams Summary
Williams, Oregon is a small city located in the heart of the Willamette Valley in the northwestern part of the state. The city is situated on the banks of the Willamette River, and is surrounded by lush forests and rolling hills. Williams is home to a population of approximately 4,000 people, and is the county seat of Lane County.
History
The area that is now Williams was first inhabited by the Kalapuya Native American tribe. The tribe lived in the area for thousands of years before the arrival of European settlers in the early 1800s. The first settlers to the area were fur trappers and traders, who established a trading post near the present-day city of Williams.
In 1846, the Oregon Trail was established, and the area around Williams became a popular stop for travelers. In 1853, the first post office was established in the area, and the town was officially named Williams in 1854.
In the late 1800s, the area around Williams began to develop into a farming community. The town was incorporated in 1891, and the first school was built in 1895. The town continued to grow throughout the early 1900s, and by the 1950s, Williams had become a thriving small city.
Geography
Williams is located in the Willamette Valley, in the northwestern part of Oregon. The city is situated on the banks of the Willamette River, and is surrounded by lush forests and rolling hills. The city is located approximately 25 miles south of Eugene, and is about an hour’s drive from the Oregon Coast.
The climate in Williams is mild and temperate, with warm summers and cool winters. The average annual temperature is around 50 degrees Fahrenheit, and the average annual precipitation is around 40 inches.
Economy
The economy of Williams is largely based on agriculture and tourism. The city is home to several farms and ranches, and is a popular destination for outdoor recreation. The city is also home to several small businesses, including restaurants, shops, and galleries.
Demographics
As of the 2010 census, the population of Williams was 4,000. The racial makeup of the city was 91.3% White, 1.2% African American, 0.7% Native American, 0.7% Asian, 0.2% Pacific Islander, and 4.9% from other races. The median household income was $41,000, and the median family income was $50,000. The per capita income was $20,000.
Williams is a small city with a rich history and a vibrant economy. The city is home to a diverse population, and is a popular destination for outdoor recreation. With its beautiful scenery and friendly atmosphere, Williams is a great place to live and visit.
Common Questions
What is Per Capita Income in Williams?
Per Capita income in Williams is $32,512.
What is the Median Family Income in Williams?
Median Family Income in Williams is $86,493.
What is the Median Household income in Williams?
Median Household Income in Williams is $81,310.
What is Income or Wage Gap in Williams?
Income or Wage Gap in Williams is 32.3%.
Women in Williams earn 67.7 cents for every dollar earned by a man.
What is Inequality or Gini Index in Williams?
Inequality or Gini Index in Williams is 0.30.
What is the Total Population of Williams?
Total Population of Williams is 1,173.
What is the Total Male Population of Williams?
Total Male Population of Williams is 622.
What is the Total Female Population of Williams?
Total Female Population of Williams is 551.
What is the Ratio of Males per 100 Females in Williams?
There are 112.89 Males per 100 Females in Williams.
What is the Ratio of Females per 100 Males in Williams?
There are 88.59 Females per 100 Males in Williams.
What is the Median Population Age in Williams?
Median Population Age in Williams is 43.2 Years.
What is the Average Family Size in Williams
Average Family Size in Williams is 3.0 People.
What is the Average Household Size in Williams
Average Household Size in Williams is 2.4 People.
How Large is the Labor Force in Williams?
There are 531 People in the Labor Forcein in Williams.
What is the Percentage of People in the Labor Force in Williams?
59.5% of People are in the Labor Force in Williams.