Willamina, OR Map & Demographics
Willamina Map
Willamina Overview
$24,502
PER CAPITA INCOME
$61,071
AVG FAMILY INCOME
$54,310
AVG HOUSEHOLD INCOME
21.2%
WAGE / INCOME GAP [ % ]
78.8¢/ $1
WAGE / INCOME GAP [ $ ]
0.38
INEQUALITY / GINI INDEX
2,287
TOTAL POPULATION
1,143
MALE POPULATION
1,144
FEMALE POPULATION
99.91
MALES / 100 FEMALES
100.09
FEMALES / 100 MALES
36.8
MEDIAN AGE
3.5
AVG FAMILY SIZE
2.9
AVG HOUSEHOLD SIZE
1,137
LABOR FORCE [ PEOPLE ]
63.4%
PERCENT IN LABOR FORCE
6.4%
UNEMPLOYMENT RATE
Willamina Zip Codes
Income in Willamina
Income Overview in Willamina
Per Capita Income in Willamina is $24,502, while median incomes of families and households are $61,071 and $54,310 respectively.
| Characteristic | Number | Measure |
| Per Capita Income | 2,287 | $24,502 |
| Median Family Income | 538 | $61,071 |
| Mean Family Income | 538 | $71,561 |
| Median Household Income | 792 | $54,310 |
| Mean Household Income | 792 | $63,760 |
| Income Deficit | 538 | $0 |
| Wage / Income Gap (%) | 2,287 | 21.18% |
| Wage / Income Gap ($) | 2,287 | 78.82¢ per $1 |
| Gini / Inequality Index | 2,287 | 0.38 |
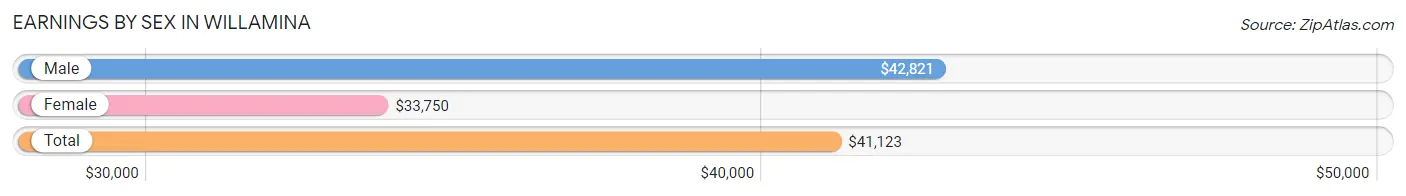
Earnings by Sex in Willamina
Average Earnings in Willamina are $41,123, $42,821 for men and $33,750 for women, a difference of 21.2%.
| Sex | Number | Average Earnings |
| Male | 600 (54.0%) | $42,821 |
| Female | 512 (46.0%) | $33,750 |
| Total | 1,112 (100.0%) | $41,123 |
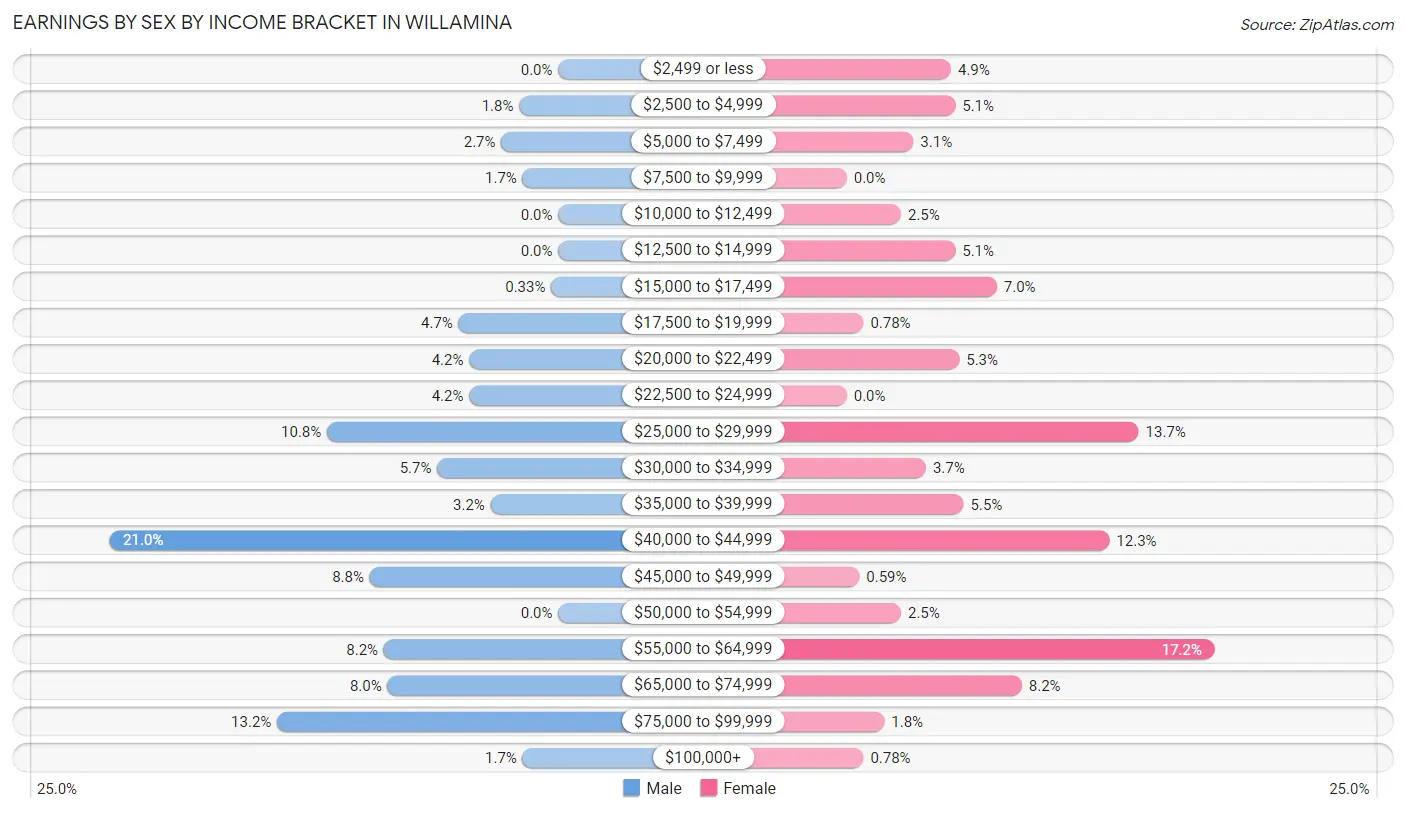
Earnings by Sex by Income Bracket in Willamina
The most common earnings brackets in Willamina are $40,000 to $44,999 for men (126 | 21.0%) and $55,000 to $64,999 for women (88 | 17.2%).
| Income | Male | Female |
| $2,499 or less | 0 (0.0%) | 25 (4.9%) |
| $2,500 to $4,999 | 11 (1.8%) | 26 (5.1%) |
| $5,000 to $7,499 | 16 (2.7%) | 16 (3.1%) |
| $7,500 to $9,999 | 10 (1.7%) | 0 (0.0%) |
| $10,000 to $12,499 | 0 (0.0%) | 13 (2.5%) |
| $12,500 to $14,999 | 0 (0.0%) | 26 (5.1%) |
| $15,000 to $17,499 | 2 (0.3%) | 36 (7.0%) |
| $17,500 to $19,999 | 28 (4.7%) | 4 (0.8%) |
| $20,000 to $22,499 | 25 (4.2%) | 27 (5.3%) |
| $22,500 to $24,999 | 25 (4.2%) | 0 (0.0%) |
| $25,000 to $29,999 | 65 (10.8%) | 70 (13.7%) |
| $30,000 to $34,999 | 34 (5.7%) | 19 (3.7%) |
| $35,000 to $39,999 | 19 (3.2%) | 28 (5.5%) |
| $40,000 to $44,999 | 126 (21.0%) | 63 (12.3%) |
| $45,000 to $49,999 | 53 (8.8%) | 3 (0.6%) |
| $50,000 to $54,999 | 0 (0.0%) | 13 (2.5%) |
| $55,000 to $64,999 | 49 (8.2%) | 88 (17.2%) |
| $65,000 to $74,999 | 48 (8.0%) | 42 (8.2%) |
| $75,000 to $99,999 | 79 (13.2%) | 9 (1.8%) |
| $100,000+ | 10 (1.7%) | 4 (0.8%) |
| Total | 600 (100.0%) | 512 (100.0%) |
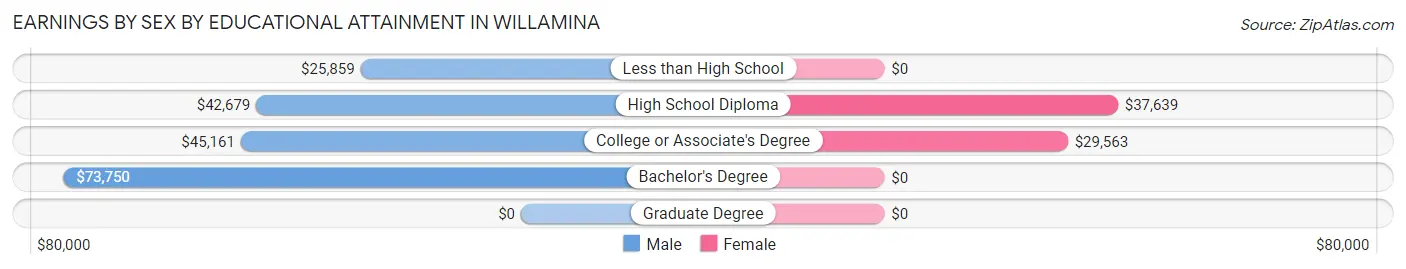
Earnings by Sex by Educational Attainment in Willamina
Average earnings in Willamina are $43,714 for men and $30,179 for women, a difference of 31.0%. Men with an educational attainment of bachelor's degree enjoy the highest average annual earnings of $73,750, while those with less than high school education earn the least with $25,859. Women with an educational attainment of high school diploma earn the most with the average annual earnings of $37,639, while those with college or associate's degree education have the smallest earnings of $29,563.
| Educational Attainment | Male Income | Female Income |
| Less than High School | $25,859 | $0 |
| High School Diploma | $42,679 | $37,639 |
| College or Associate's Degree | $45,161 | $29,563 |
| Bachelor's Degree | $73,750 | $0 |
| Graduate Degree | - | - |
| Total | $43,714 | $30,179 |
Family Income in Willamina
Family Income Brackets in Willamina
According to the Willamina family income data, there are 174 families falling into the $50,000 to $74,999 income range, which is the most common income bracket and makes up 32.3% of all families.
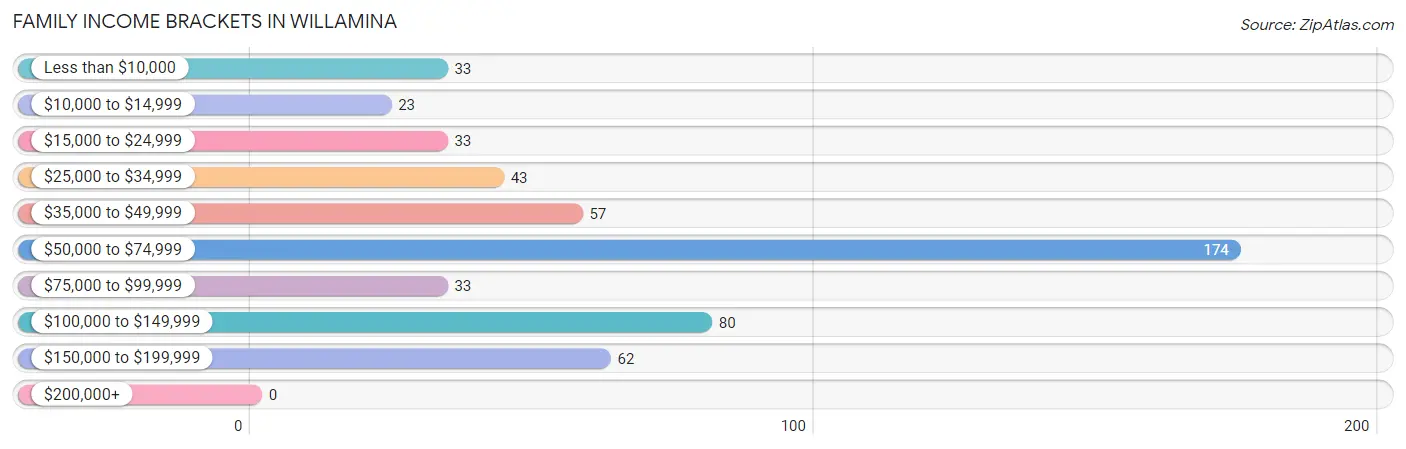
| Income Bracket | # Families | % Families |
| Less than $10,000 | 33 | 6.1% |
| $10,000 to $14,999 | 23 | 4.3% |
| $15,000 to $24,999 | 33 | 6.1% |
| $25,000 to $34,999 | 43 | 8.0% |
| $35,000 to $49,999 | 57 | 10.6% |
| $50,000 to $74,999 | 174 | 32.3% |
| $75,000 to $99,999 | 33 | 6.1% |
| $100,000 to $149,999 | 80 | 14.9% |
| $150,000 to $199,999 | 62 | 11.5% |
| $200,000+ | 0 | 0.0% |
Family Income by Famaliy Size in Willamina
4-person families (106 | 19.7%) account for the highest median family income in Willamina with $72,500 per family, while 2-person families (223 | 41.4%) have the highest median income of $21,168 per family member.
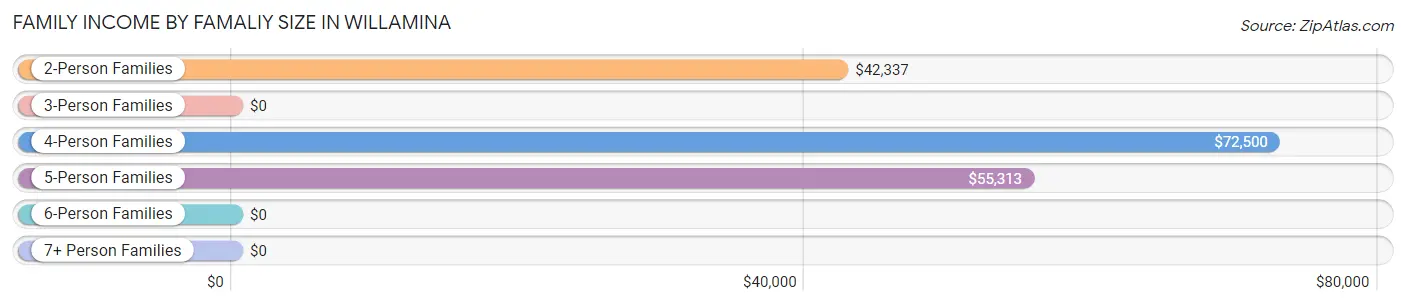
| Income Bracket | # Families | Median Income |
| 2-Person Families | 223 (41.4%) | $42,337 |
| 3-Person Families | 133 (24.7%) | $0 |
| 4-Person Families | 106 (19.7%) | $72,500 |
| 5-Person Families | 49 (9.1%) | $55,313 |
| 6-Person Families | 16 (3.0%) | $0 |
| 7+ Person Families | 11 (2.0%) | $0 |
| Total | 538 (100.0%) | $61,071 |
Family Income by Number of Earners in Willamina
The median family income in Willamina is $61,071, with families comprising 3+ earners (77) having the highest median family income of $134,803, while families with no earners (107) have the lowest median family income of $24,107, accounting for 14.3% and 19.9% of families, respectively.
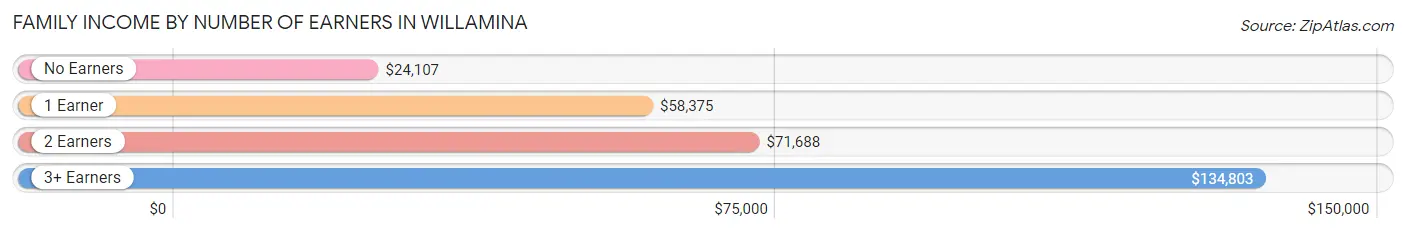
| Number of Earners | # Families | Median Income |
| No Earners | 107 (19.9%) | $24,107 |
| 1 Earner | 171 (31.8%) | $58,375 |
| 2 Earners | 183 (34.0%) | $71,688 |
| 3+ Earners | 77 (14.3%) | $134,803 |
| Total | 538 (100.0%) | $61,071 |
Household Income in Willamina
Household Income Brackets in Willamina
With 225 households falling in the category, the $50,000 to $74,999 income range is the most frequent in Willamina, accounting for 28.4% of all households.
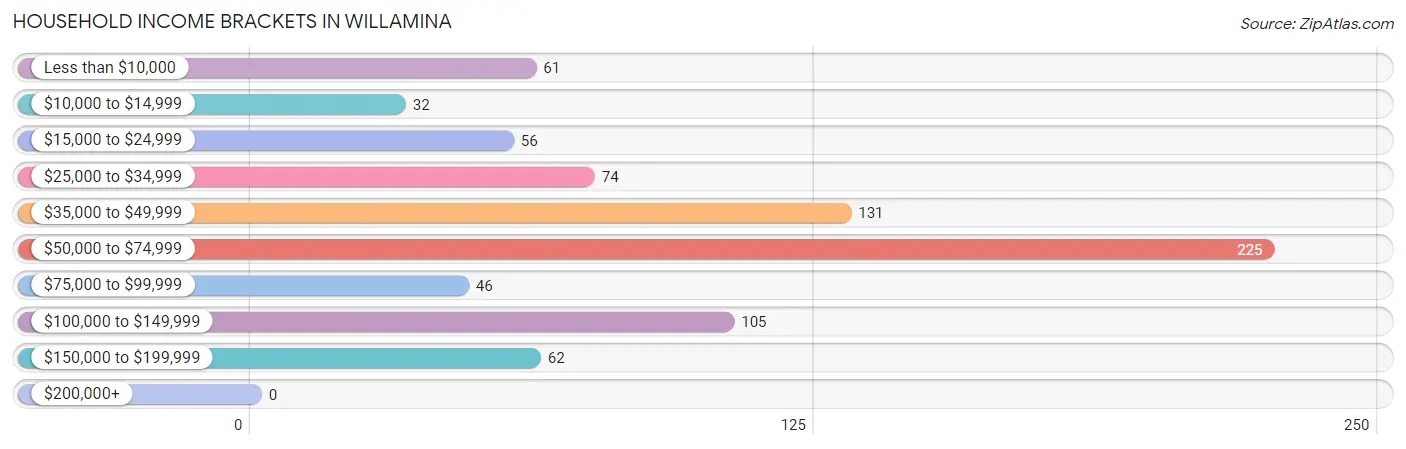
| Income Bracket | # Households | % Households |
| Less than $10,000 | 61 | 7.7% |
| $10,000 to $14,999 | 32 | 4.0% |
| $15,000 to $24,999 | 56 | 7.1% |
| $25,000 to $34,999 | 74 | 9.3% |
| $35,000 to $49,999 | 131 | 16.5% |
| $50,000 to $74,999 | 225 | 28.4% |
| $75,000 to $99,999 | 46 | 5.8% |
| $100,000 to $149,999 | 105 | 13.3% |
| $150,000 to $199,999 | 62 | 7.8% |
| $200,000+ | 0 | 0.0% |
Household Income by Householder Age in Willamina
The median household income in Willamina is $54,310, with the highest median household income of $63,750 found in the 45 to 64 years age bracket for the primary householder. A total of 333 households (42.0%) fall into this category. Meanwhile, the 15 to 24 years age bracket for the primary householder has the lowest median household income of $0, with 35 households (4.4%) in this group.
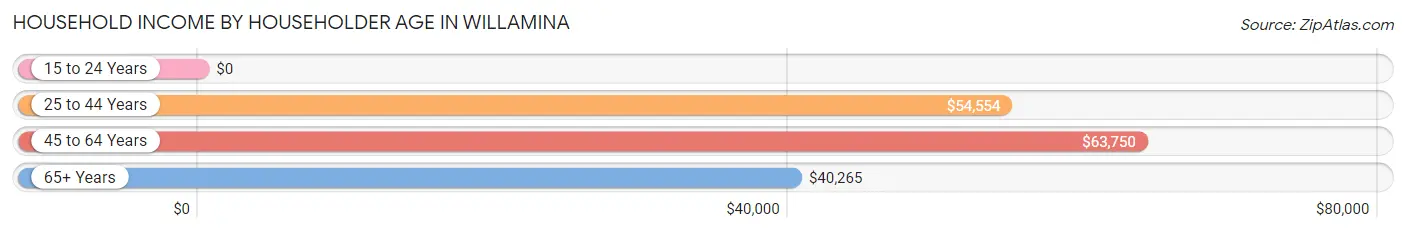
| Income Bracket | # Households | Median Income |
| 15 to 24 Years | 35 (4.4%) | $0 |
| 25 to 44 Years | 265 (33.5%) | $54,554 |
| 45 to 64 Years | 333 (42.0%) | $63,750 |
| 65+ Years | 159 (20.1%) | $40,265 |
| Total | 792 (100.0%) | $54,310 |
Poverty in Willamina
Income Below Poverty by Sex and Age in Willamina
With 13.5% poverty level for males and 12.2% for females among the residents of Willamina, 15 year old males and 5 year old females are the most vulnerable to poverty, with 15 males (62.5%) and 8 females (61.5%) in their respective age groups living below the poverty level.
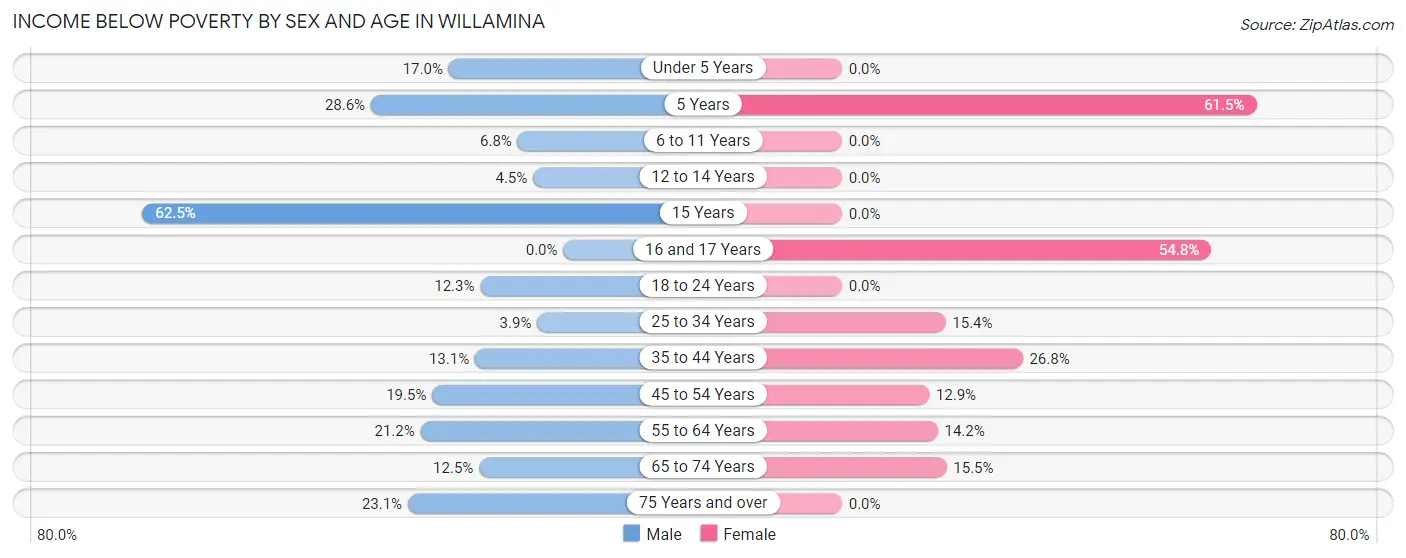
| Age Bracket | Male | Female |
| Under 5 Years | 8 (17.0%) | 0 (0.0%) |
| 5 Years | 6 (28.6%) | 8 (61.5%) |
| 6 to 11 Years | 4 (6.8%) | 0 (0.0%) |
| 12 to 14 Years | 4 (4.5%) | 0 (0.0%) |
| 15 Years | 15 (62.5%) | 0 (0.0%) |
| 16 and 17 Years | 0 (0.0%) | 17 (54.8%) |
| 18 to 24 Years | 9 (12.3%) | 0 (0.0%) |
| 25 to 34 Years | 10 (3.9%) | 14 (15.4%) |
| 35 to 44 Years | 21 (13.1%) | 33 (26.8%) |
| 45 to 54 Years | 22 (19.5%) | 22 (12.9%) |
| 55 to 64 Years | 28 (21.2%) | 30 (14.2%) |
| 65 to 74 Years | 9 (12.5%) | 16 (15.5%) |
| 75 Years and over | 15 (23.1%) | 0 (0.0%) |
| Total | 151 (13.5%) | 140 (12.2%) |
Income Above Poverty by Sex and Age in Willamina
According to the poverty statistics in Willamina, males aged 16 and 17 years and females aged under 5 years are the age groups that are most secure financially, with 100.0% of males and 100.0% of females in these age groups living above the poverty line.
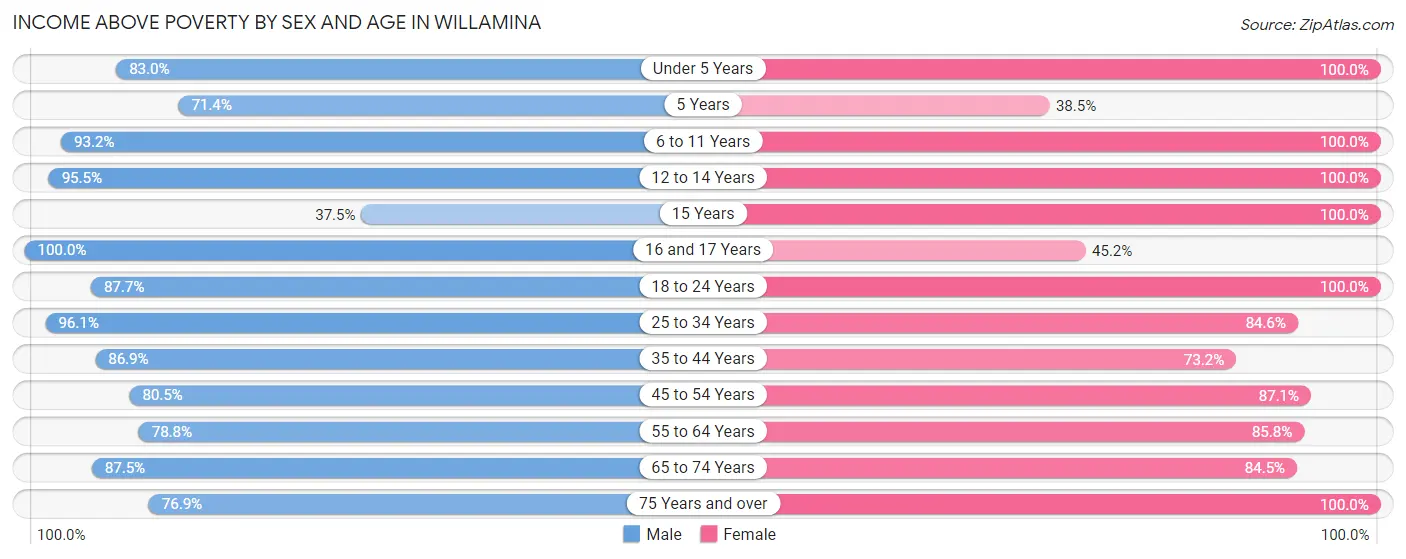
| Age Bracket | Male | Female |
| Under 5 Years | 39 (83.0%) | 60 (100.0%) |
| 5 Years | 15 (71.4%) | 5 (38.5%) |
| 6 to 11 Years | 55 (93.2%) | 67 (100.0%) |
| 12 to 14 Years | 85 (95.5%) | 90 (100.0%) |
| 15 Years | 9 (37.5%) | 3 (100.0%) |
| 16 and 17 Years | 9 (100.0%) | 14 (45.2%) |
| 18 to 24 Years | 64 (87.7%) | 114 (100.0%) |
| 25 to 34 Years | 248 (96.1%) | 77 (84.6%) |
| 35 to 44 Years | 139 (86.9%) | 90 (73.2%) |
| 45 to 54 Years | 91 (80.5%) | 148 (87.1%) |
| 55 to 64 Years | 104 (78.8%) | 181 (85.8%) |
| 65 to 74 Years | 63 (87.5%) | 87 (84.5%) |
| 75 Years and over | 50 (76.9%) | 68 (100.0%) |
| Total | 971 (86.5%) | 1,004 (87.8%) |
Income Below Poverty Among Married-Couple Families in Willamina
The poverty statistics for married-couple families in Willamina show that 6.3% or 23 of the total 363 families live below the poverty line. Families with 1 or 2 children have the highest poverty rate of 8.8%, comprising of 12 families. On the other hand, families with 3 or 4 children have the lowest poverty rate of 0.0%, which includes 0 families.
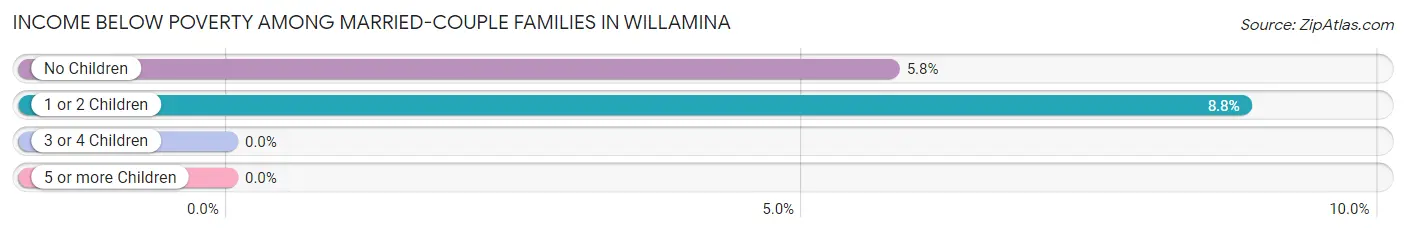
| Children | Above Poverty | Below Poverty |
| No Children | 180 (94.2%) | 11 (5.8%) |
| 1 or 2 Children | 124 (91.2%) | 12 (8.8%) |
| 3 or 4 Children | 31 (100.0%) | 0 (0.0%) |
| 5 or more Children | 5 (100.0%) | 0 (0.0%) |
| Total | 340 (93.7%) | 23 (6.3%) |
Income Below Poverty Among Single-Parent Households in Willamina
According to the poverty data in Willamina, 41.3% or 19 single-father households and 17.8% or 23 single-mother households are living below the poverty line. Among single-father households, those with 1 or 2 children have the highest poverty rate, with 9 households (42.9%) experiencing poverty. Likewise, among single-mother households, those with 1 or 2 children have the highest poverty rate, with 18 households (43.9%) falling below the poverty line.
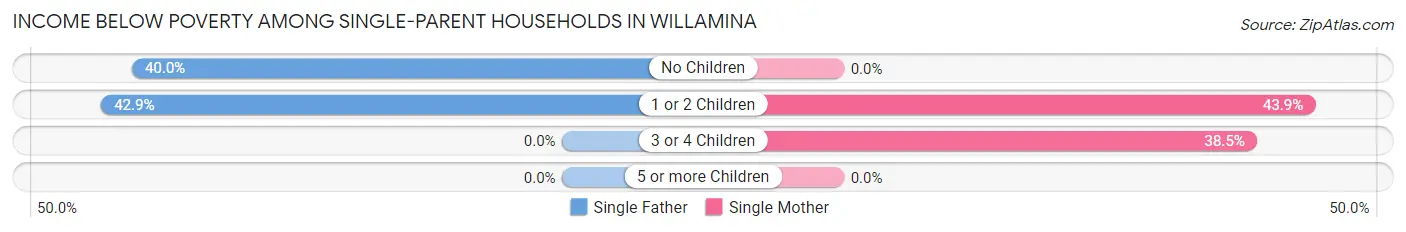
| Children | Single Father | Single Mother |
| No Children | 10 (40.0%) | 0 (0.0%) |
| 1 or 2 Children | 9 (42.9%) | 18 (43.9%) |
| 3 or 4 Children | 0 (0.0%) | 5 (38.5%) |
| 5 or more Children | 0 (0.0%) | 0 (0.0%) |
| Total | 19 (41.3%) | 23 (17.8%) |
Income Below Poverty Among Married-Couple vs Single-Parent Households in Willamina
The poverty data for Willamina shows that 23 of the married-couple family households (6.3%) and 42 of the single-parent households (24.0%) are living below the poverty level. Within the married-couple family households, those with 1 or 2 children have the highest poverty rate, with 12 households (8.8%) falling below the poverty line. Among the single-parent households, those with 1 or 2 children have the highest poverty rate, with 27 household (43.5%) living below poverty.
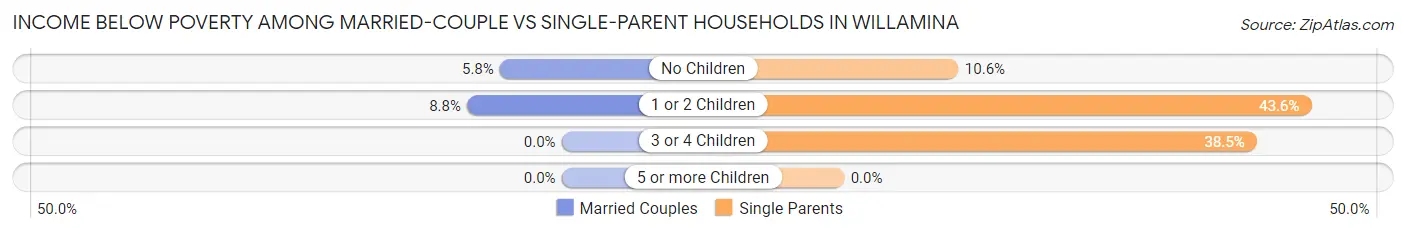
| Children | Married-Couple Families | Single-Parent Households |
| No Children | 11 (5.8%) | 10 (10.6%) |
| 1 or 2 Children | 12 (8.8%) | 27 (43.5%) |
| 3 or 4 Children | 0 (0.0%) | 5 (38.5%) |
| 5 or more Children | 0 (0.0%) | 0 (0.0%) |
| Total | 23 (6.3%) | 42 (24.0%) |
Race in Willamina
The most populous races in Willamina are White / Caucasian (1,915 | 83.7%), Hispanic or Latino (291 | 12.7%), and Two or more Races (205 | 9.0%).
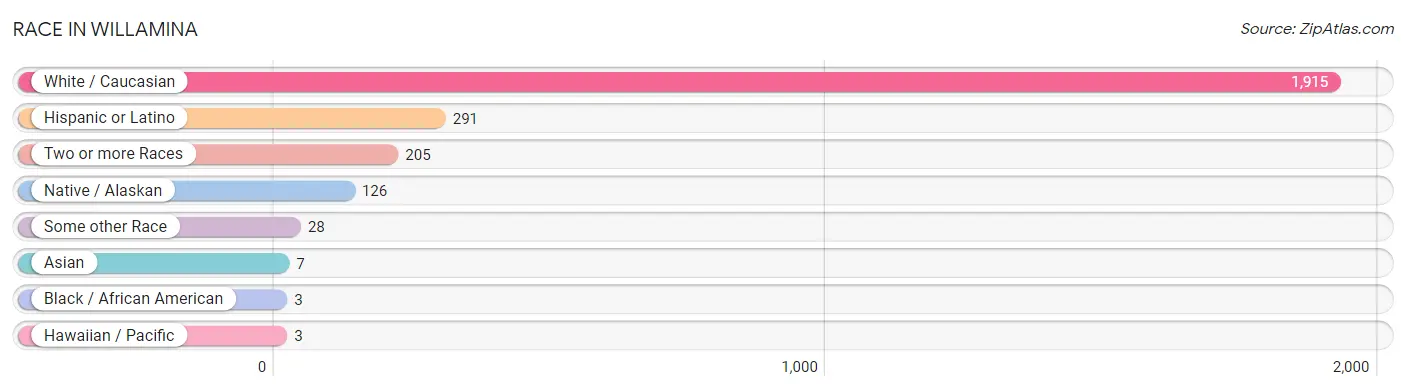
| Race | # Population | % Population |
| Asian | 7 | 0.3% |
| Black / African American | 3 | 0.1% |
| Hawaiian / Pacific | 3 | 0.1% |
| Hispanic or Latino | 291 | 12.7% |
| Native / Alaskan | 126 | 5.5% |
| White / Caucasian | 1,915 | 83.7% |
| Two or more Races | 205 | 9.0% |
| Some other Race | 28 | 1.2% |
| Total | 2,287 | 100.0% |
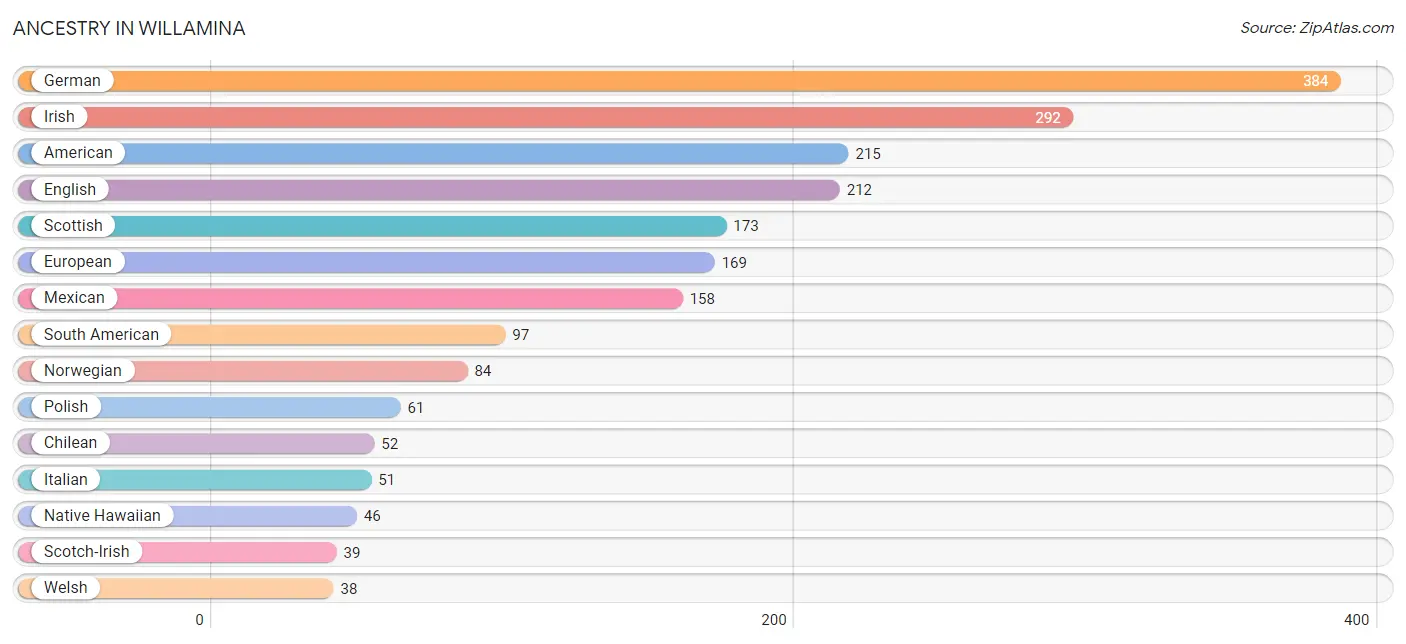
Ancestry in Willamina
The most populous ancestries reported in Willamina are German (384 | 16.8%), Irish (292 | 12.8%), American (215 | 9.4%), English (212 | 9.3%), and Scottish (173 | 7.6%), together accounting for 55.8% of all Willamina residents.
| Ancestry | # Population | % Population |
| American | 215 | 9.4% |
| Arab | 7 | 0.3% |
| Blackfeet | 7 | 0.3% |
| Canadian | 7 | 0.3% |
| Chilean | 52 | 2.3% |
| Choctaw | 11 | 0.5% |
| Czech | 7 | 0.3% |
| Danish | 34 | 1.5% |
| Dutch | 30 | 1.3% |
| Ecuadorian | 21 | 0.9% |
| English | 212 | 9.3% |
| European | 169 | 7.4% |
| French | 22 | 1.0% |
| French American Indian | 8 | 0.4% |
| French Canadian | 30 | 1.3% |
| German | 384 | 16.8% |
| Indian (Asian) | 17 | 0.7% |
| Irish | 292 | 12.8% |
| Italian | 51 | 2.2% |
| Korean | 20 | 0.9% |
| Lebanese | 7 | 0.3% |
| Lithuanian | 3 | 0.1% |
| Malaysian | 4 | 0.2% |
| Mexican | 158 | 6.9% |
| Native Hawaiian | 46 | 2.0% |
| Northern European | 7 | 0.3% |
| Norwegian | 84 | 3.7% |
| Ottawa | 8 | 0.4% |
| Pennsylvania German | 7 | 0.3% |
| Peruvian | 24 | 1.1% |
| Polish | 61 | 2.7% |
| Puerto Rican | 14 | 0.6% |
| Russian | 12 | 0.5% |
| Scandinavian | 20 | 0.9% |
| Scotch-Irish | 39 | 1.7% |
| Scottish | 173 | 7.6% |
| Slovak | 3 | 0.1% |
| South American | 97 | 4.2% |
| Spanish | 17 | 0.7% |
| Swedish | 23 | 1.0% |
| Swiss | 25 | 1.1% |
| Ukrainian | 11 | 0.5% |
| Welsh | 38 | 1.7% |
| Yup'ik | 9 | 0.4% | View All 44 Rows |
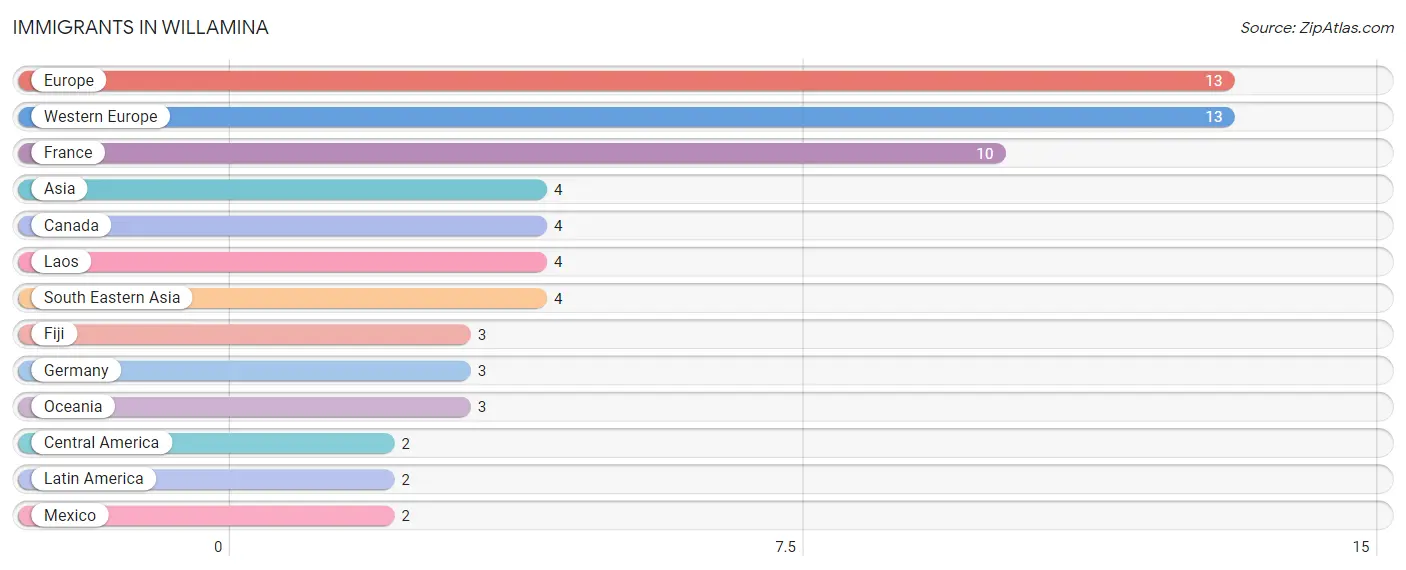
Immigrants in Willamina
The most numerous immigrant groups reported in Willamina came from Europe (13 | 0.6%), Western Europe (13 | 0.6%), France (10 | 0.4%), Asia (4 | 0.2%), and Canada (4 | 0.2%), together accounting for 1.9% of all Willamina residents.
| Immigration Origin | # Population | % Population |
| Asia | 4 | 0.2% |
| Canada | 4 | 0.2% |
| Central America | 2 | 0.1% |
| Europe | 13 | 0.6% |
| Fiji | 3 | 0.1% |
| France | 10 | 0.4% |
| Germany | 3 | 0.1% |
| Laos | 4 | 0.2% |
| Latin America | 2 | 0.1% |
| Mexico | 2 | 0.1% |
| Oceania | 3 | 0.1% |
| South Eastern Asia | 4 | 0.2% |
| Western Europe | 13 | 0.6% | View All 13 Rows |
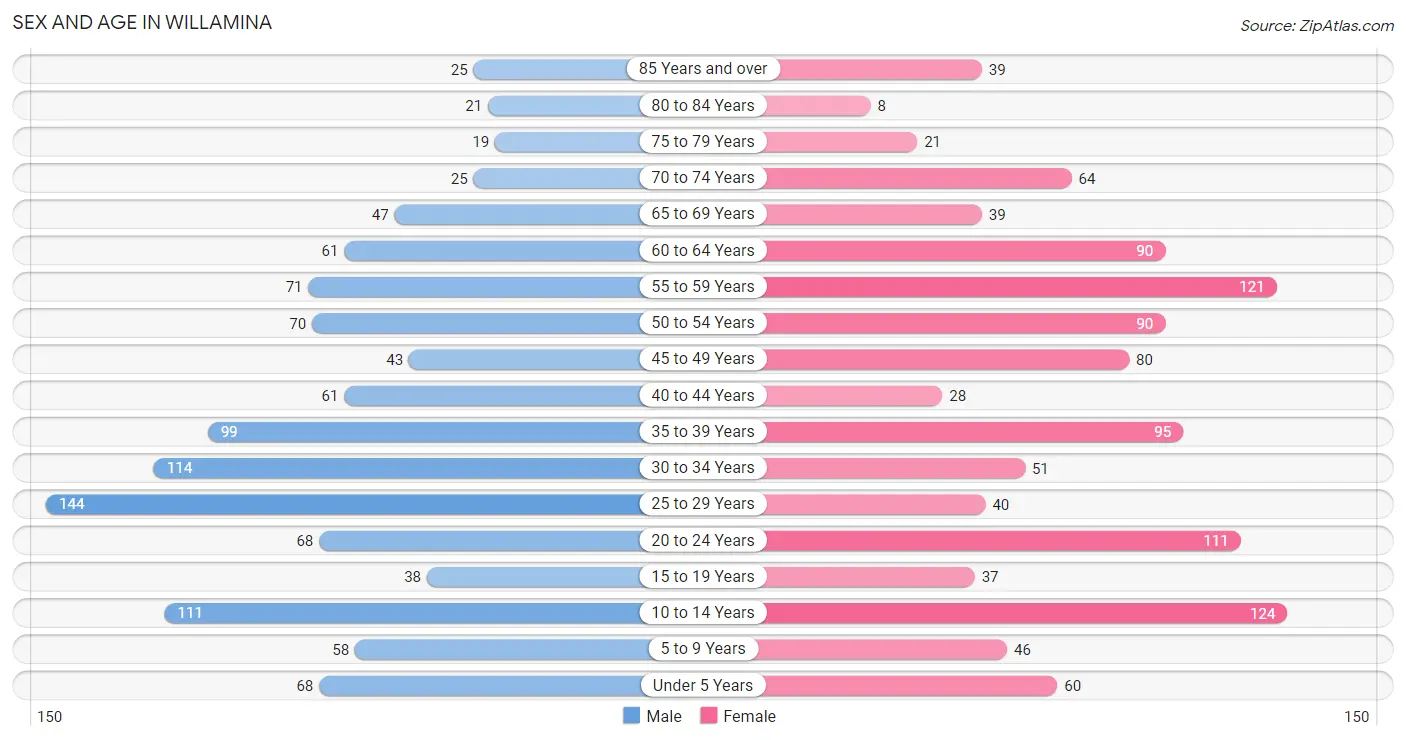
Sex and Age in Willamina
Sex and Age in Willamina
The most populous age groups in Willamina are 25 to 29 Years (144 | 12.6%) for men and 10 to 14 Years (124 | 10.8%) for women.
| Age Bracket | Male | Female |
| Under 5 Years | 68 (5.9%) | 60 (5.2%) |
| 5 to 9 Years | 58 (5.1%) | 46 (4.0%) |
| 10 to 14 Years | 111 (9.7%) | 124 (10.8%) |
| 15 to 19 Years | 38 (3.3%) | 37 (3.2%) |
| 20 to 24 Years | 68 (5.9%) | 111 (9.7%) |
| 25 to 29 Years | 144 (12.6%) | 40 (3.5%) |
| 30 to 34 Years | 114 (10.0%) | 51 (4.5%) |
| 35 to 39 Years | 99 (8.7%) | 95 (8.3%) |
| 40 to 44 Years | 61 (5.3%) | 28 (2.5%) |
| 45 to 49 Years | 43 (3.8%) | 80 (7.0%) |
| 50 to 54 Years | 70 (6.1%) | 90 (7.9%) |
| 55 to 59 Years | 71 (6.2%) | 121 (10.6%) |
| 60 to 64 Years | 61 (5.3%) | 90 (7.9%) |
| 65 to 69 Years | 47 (4.1%) | 39 (3.4%) |
| 70 to 74 Years | 25 (2.2%) | 64 (5.6%) |
| 75 to 79 Years | 19 (1.7%) | 21 (1.8%) |
| 80 to 84 Years | 21 (1.8%) | 8 (0.7%) |
| 85 Years and over | 25 (2.2%) | 39 (3.4%) |
| Total | 1,143 (100.0%) | 1,144 (100.0%) |
Families and Households in Willamina
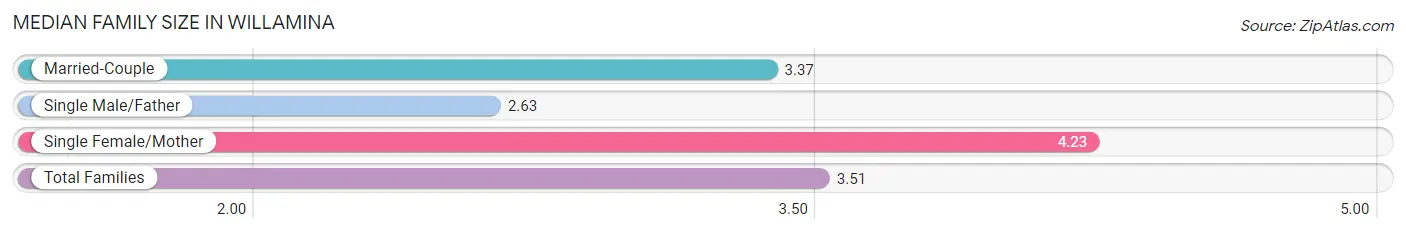
Median Family Size in Willamina
The median family size in Willamina is 3.51 persons per family, with single female/mother families (129 | 24.0%) accounting for the largest median family size of 4.23 persons per family. On the other hand, single male/father families (46 | 8.6%) represent the smallest median family size with 2.63 persons per family.
| Family Type | # Families | Family Size |
| Married-Couple | 363 (67.5%) | 3.37 |
| Single Male/Father | 46 (8.6%) | 2.63 |
| Single Female/Mother | 129 (24.0%) | 4.23 |
| Total Families | 538 (100.0%) | 3.51 |
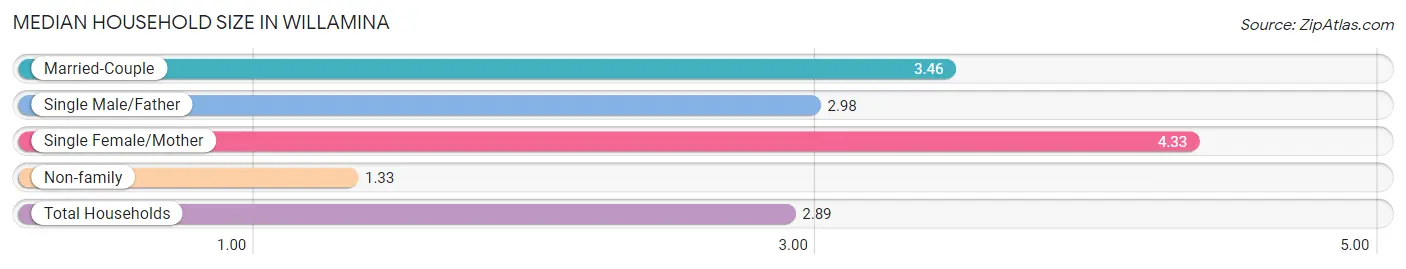
Median Household Size in Willamina
The median household size in Willamina is 2.89 persons per household, with single female/mother households (129 | 16.3%) accounting for the largest median household size of 4.33 persons per household. non-family households (254 | 32.1%) represent the smallest median household size with 1.33 persons per household.
| Household Type | # Households | Household Size |
| Married-Couple | 363 (45.8%) | 3.46 |
| Single Male/Father | 46 (5.8%) | 2.98 |
| Single Female/Mother | 129 (16.3%) | 4.33 |
| Non-family | 254 (32.1%) | 1.33 |
| Total Households | 792 (100.0%) | 2.89 |
Household Size by Marriage Status in Willamina
Out of a total of 792 households in Willamina, 538 (67.9%) are family households, while 254 (32.1%) are nonfamily households. The most numerous type of family households are 2-person households, comprising 206, and the most common type of nonfamily households are 1-person households, comprising 200.
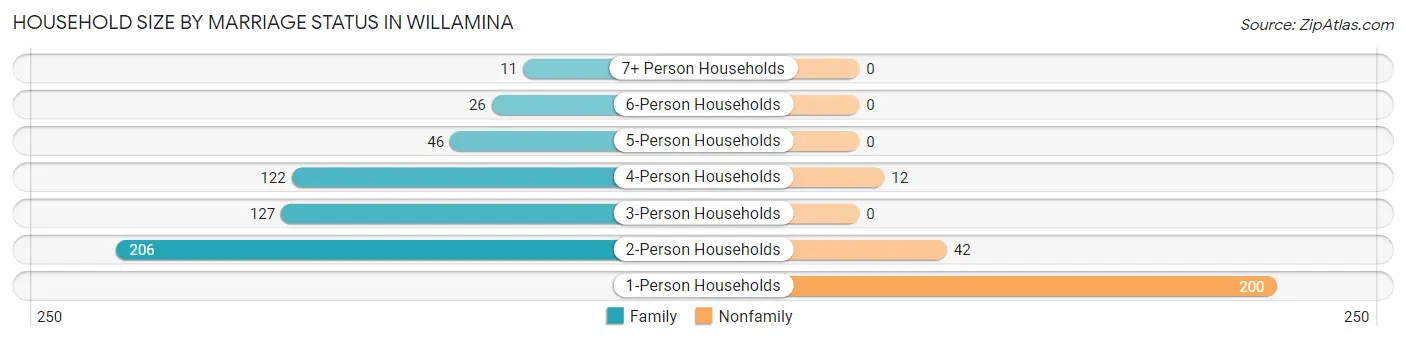
| Household Size | Family Households | Nonfamily Households |
| 1-Person Households | - | 200 (25.3%) |
| 2-Person Households | 206 (26.0%) | 42 (5.3%) |
| 3-Person Households | 127 (16.0%) | 0 (0.0%) |
| 4-Person Households | 122 (15.4%) | 12 (1.5%) |
| 5-Person Households | 46 (5.8%) | 0 (0.0%) |
| 6-Person Households | 26 (3.3%) | 0 (0.0%) |
| 7+ Person Households | 11 (1.4%) | 0 (0.0%) |
| Total | 538 (67.9%) | 254 (32.1%) |
Female Fertility in Willamina
Fertility by Age in Willamina
Average fertility rate in Willamina is 50.0 births per 1,000 women. Women in the age bracket of 20 to 34 years have the highest fertility rate with 54.0 births per 1,000 women. Women in the age bracket of 35 to 50 years acount for 52.2% of all women with births.
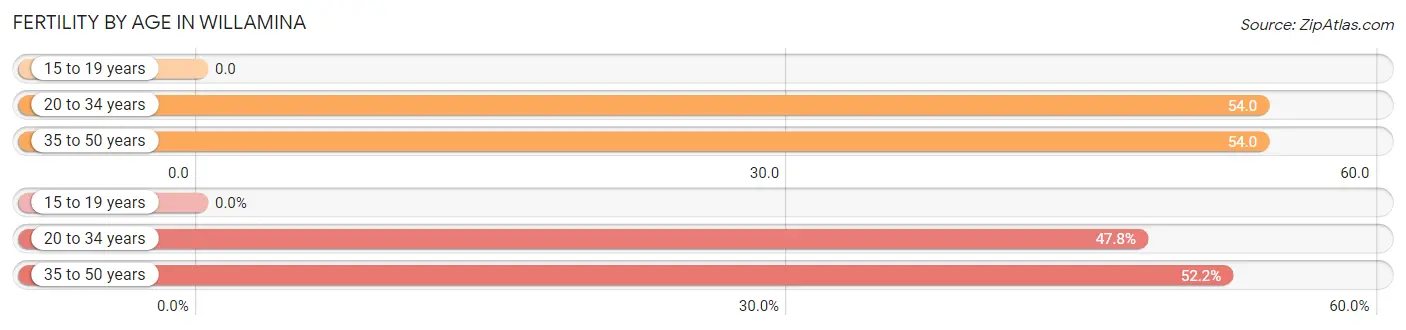
| Age Bracket | Women with Births | Births / 1,000 Women |
| 15 to 19 years | 0 (0.0%) | 0.0 |
| 20 to 34 years | 11 (47.8%) | 54.0 |
| 35 to 50 years | 12 (52.2%) | 54.0 |
| Total | 23 (100.0%) | 50.0 |
Fertility by Age by Marriage Status in Willamina
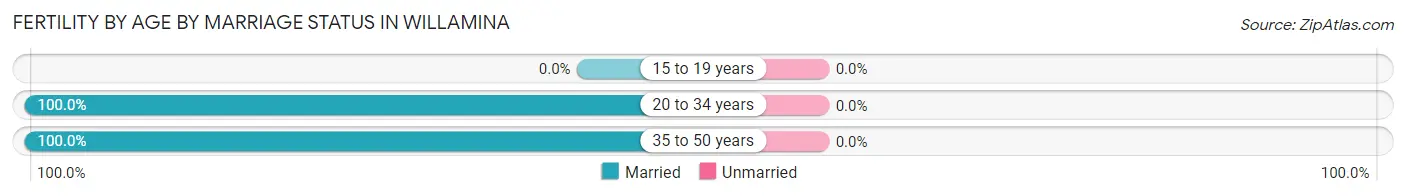
| Age Bracket | Married | Unmarried |
| 15 to 19 years | 0 (0.0%) | 0 (0.0%) |
| 20 to 34 years | 11 (100.0%) | 0 (0.0%) |
| 35 to 50 years | 12 (100.0%) | 0 (0.0%) |
| Total | 23 (100.0%) | 0 (0.0%) |
Fertility by Education in Willamina
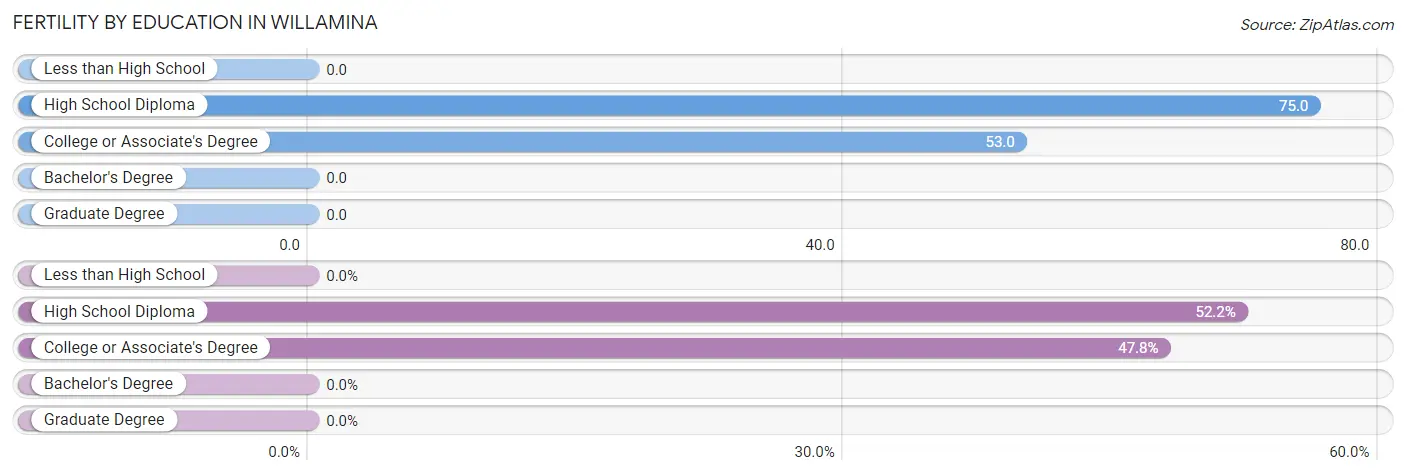
| Educational Attainment | Women with Births | Births / 1,000 Women |
| Less than High School | 0 (0.0%) | 0.0 |
| High School Diploma | 12 (52.2%) | 75.0 |
| College or Associate's Degree | 11 (47.8%) | 53.0 |
| Bachelor's Degree | 0 (0.0%) | 0.0 |
| Graduate Degree | 0 (0.0%) | 0.0 |
| Total | 23 (100.0%) | 50.0 |
Fertility by Education by Marriage Status in Willamina
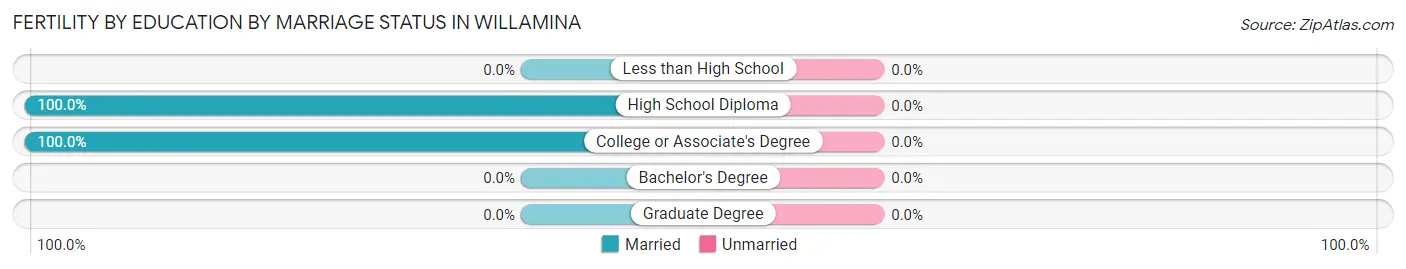
| Educational Attainment | Married | Unmarried |
| Less than High School | 0 (0.0%) | 0 (0.0%) |
| High School Diploma | 12 (100.0%) | 0 (0.0%) |
| College or Associate's Degree | 11 (100.0%) | 0 (0.0%) |
| Bachelor's Degree | 0 (0.0%) | 0 (0.0%) |
| Graduate Degree | 0 (0.0%) | 0 (0.0%) |
| Total | 23 (100.0%) | 0 (0.0%) |
Employment Characteristics in Willamina
Employment by Class of Employer in Willamina
Among the 986 employed individuals in Willamina, private company employees (763 | 77.4%), state government employees (52 | 5.3%), and federal government employees (52 | 5.3%) make up the most common classes of employment.
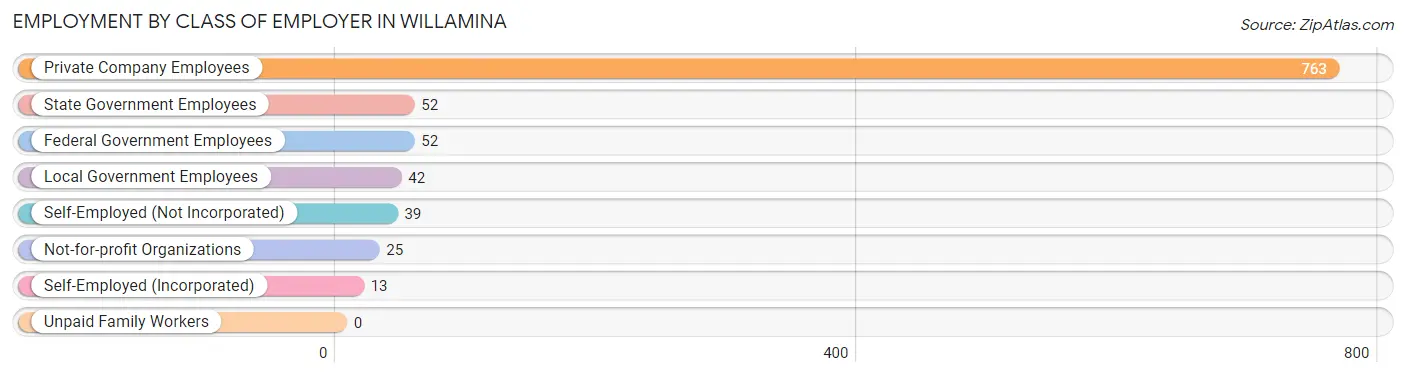
| Employer Class | # Employees | % Employees |
| Private Company Employees | 763 | 77.4% |
| Self-Employed (Incorporated) | 13 | 1.3% |
| Self-Employed (Not Incorporated) | 39 | 4.0% |
| Not-for-profit Organizations | 25 | 2.5% |
| Local Government Employees | 42 | 4.3% |
| State Government Employees | 52 | 5.3% |
| Federal Government Employees | 52 | 5.3% |
| Unpaid Family Workers | 0 | 0.0% |
| Total | 986 | 100.0% |
Employment Status by Age in Willamina
According to the labor force statistics for Willamina, out of the total population over 16 years of age (1,793), 63.4% or 1,137 individuals are in the labor force, with 6.4% or 73 of them unemployed. The age group with the highest labor force participation rate is 30 to 34 years, with 89.1% or 147 individuals in the labor force. Within the labor force, the 20 to 24 years age range has the highest percentage of unemployed individuals, with 20.4% or 30 of them being unemployed.
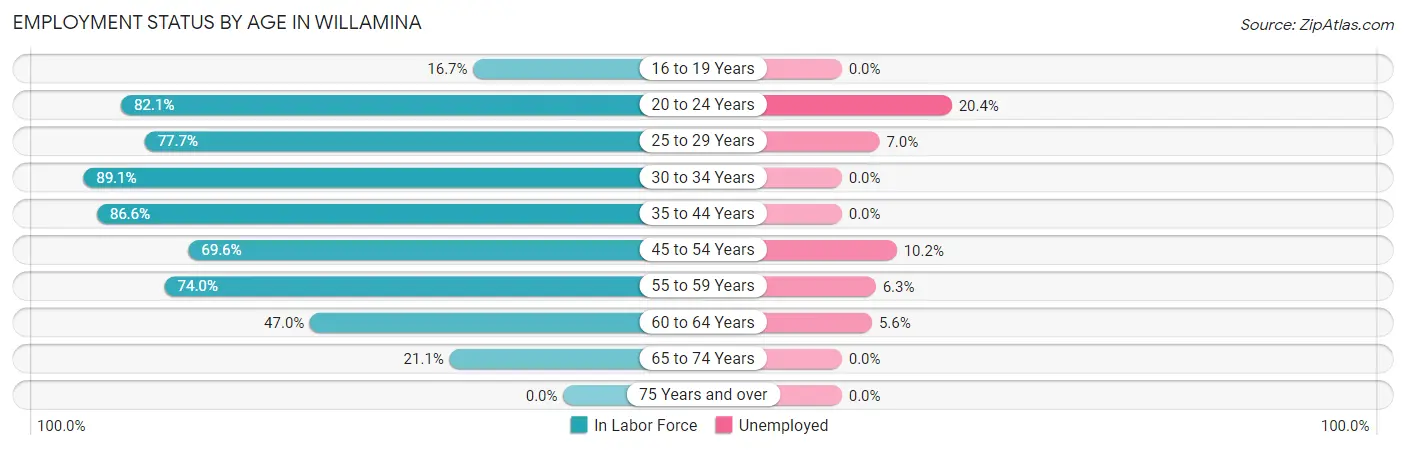
| Age Bracket | In Labor Force | Unemployed |
| 16 to 19 Years | 8 (16.7%) | 0 (0.0%) |
| 20 to 24 Years | 147 (82.1%) | 30 (20.4%) |
| 25 to 29 Years | 143 (77.7%) | 10 (7.0%) |
| 30 to 34 Years | 147 (89.1%) | 0 (0.0%) |
| 35 to 44 Years | 245 (86.6%) | 0 (0.0%) |
| 45 to 54 Years | 197 (69.6%) | 20 (10.2%) |
| 55 to 59 Years | 142 (74.0%) | 9 (6.3%) |
| 60 to 64 Years | 71 (47.0%) | 4 (5.6%) |
| 65 to 74 Years | 37 (21.1%) | 0 (0.0%) |
| 75 Years and over | 0 (0.0%) | 0 (0.0%) |
| Total | 1,137 (63.4%) | 73 (6.4%) |
Employment Status by Educational Attainment in Willamina
According to labor force statistics for Willamina, 75.1% of individuals (945) out of the total population between 25 and 64 years of age (1,258) are in the labor force, with 4.6% or 43 of them being unemployed. The group with the highest labor force participation rate are those with the educational attainment of college / associate degree, with 81.4% or 508 individuals in the labor force. Within the labor force, individuals with bachelor's degree or higher education have the highest percentage of unemployment, with 8.0% or 4 of them being unemployed.
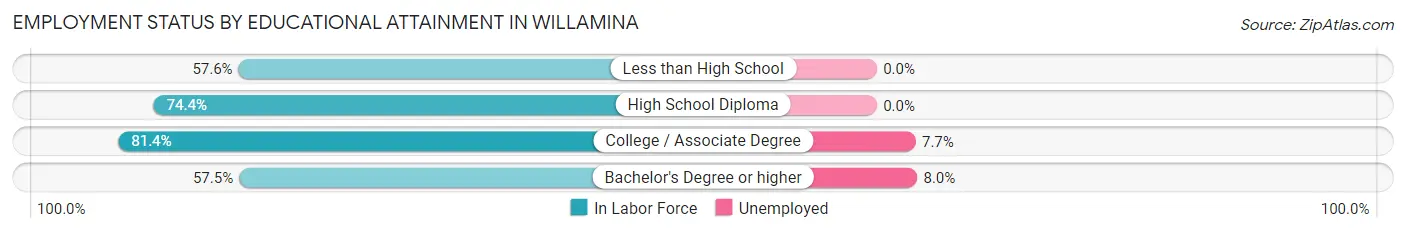
| Educational Attainment | In Labor Force | Unemployed |
| Less than High School | 68 (57.6%) | 0 (0.0%) |
| High School Diploma | 319 (74.4%) | 0 (0.0%) |
| College / Associate Degree | 508 (81.4%) | 48 (7.7%) |
| Bachelor's Degree or higher | 50 (57.5%) | 7 (8.0%) |
| Total | 945 (75.1%) | 58 (4.6%) |
Employment Occupations by Sex in Willamina
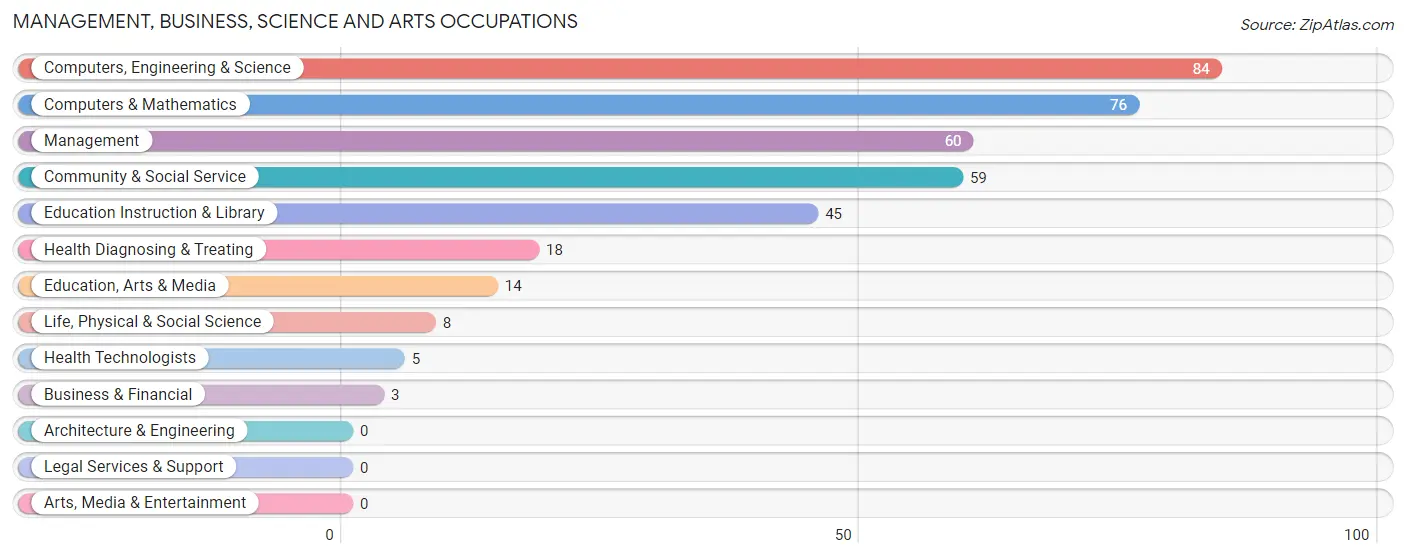
Management, Business, Science and Arts Occupations
The most common Management, Business, Science and Arts occupations in Willamina are Computers, Engineering & Science (84 | 7.9%), Computers & Mathematics (76 | 7.1%), Management (60 | 5.6%), Community & Social Service (59 | 5.6%), and Education Instruction & Library (45 | 4.2%).
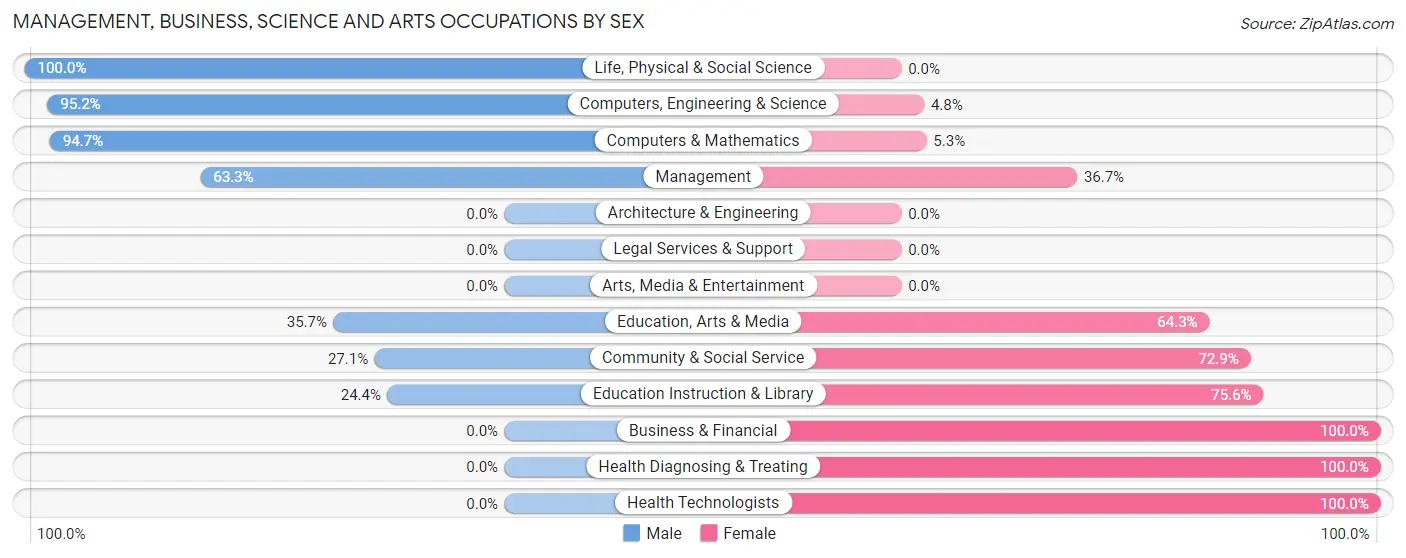
Management, Business, Science and Arts Occupations by Sex
Within the Management, Business, Science and Arts occupations in Willamina, the most male-oriented occupations are Life, Physical & Social Science (100.0%), Computers, Engineering & Science (95.2%), and Computers & Mathematics (94.7%), while the most female-oriented occupations are Business & Financial (100.0%), Health Diagnosing & Treating (100.0%), and Health Technologists (100.0%).
| Occupation | Male | Female |
| Management | 38 (63.3%) | 22 (36.7%) |
| Business & Financial | 0 (0.0%) | 3 (100.0%) |
| Computers, Engineering & Science | 80 (95.2%) | 4 (4.8%) |
| Computers & Mathematics | 72 (94.7%) | 4 (5.3%) |
| Architecture & Engineering | 0 (0.0%) | 0 (0.0%) |
| Life, Physical & Social Science | 8 (100.0%) | 0 (0.0%) |
| Community & Social Service | 16 (27.1%) | 43 (72.9%) |
| Education, Arts & Media | 5 (35.7%) | 9 (64.3%) |
| Legal Services & Support | 0 (0.0%) | 0 (0.0%) |
| Education Instruction & Library | 11 (24.4%) | 34 (75.6%) |
| Arts, Media & Entertainment | 0 (0.0%) | 0 (0.0%) |
| Health Diagnosing & Treating | 0 (0.0%) | 18 (100.0%) |
| Health Technologists | 0 (0.0%) | 5 (100.0%) |
| Total (Category) | 134 (59.8%) | 90 (40.2%) |
| Total (Overall) | 586 (55.1%) | 478 (44.9%) |
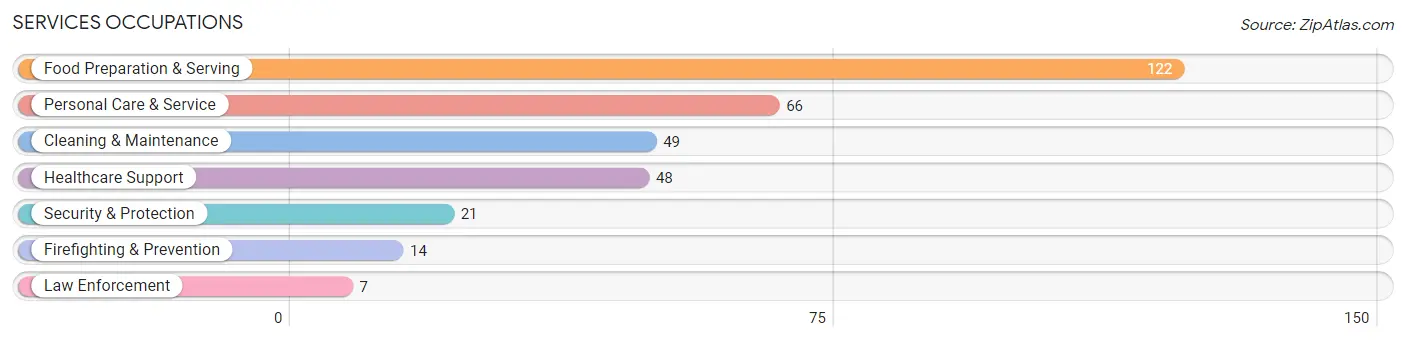
Services Occupations
The most common Services occupations in Willamina are Food Preparation & Serving (122 | 11.5%), Personal Care & Service (66 | 6.2%), Cleaning & Maintenance (49 | 4.6%), Healthcare Support (48 | 4.5%), and Security & Protection (21 | 2.0%).
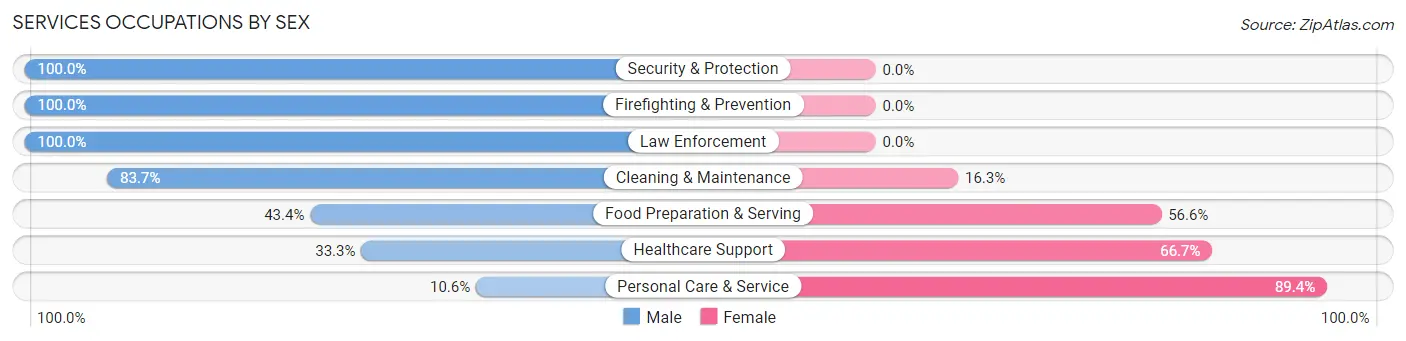
Services Occupations by Sex
Within the Services occupations in Willamina, the most male-oriented occupations are Security & Protection (100.0%), Firefighting & Prevention (100.0%), and Law Enforcement (100.0%), while the most female-oriented occupations are Personal Care & Service (89.4%), Healthcare Support (66.7%), and Food Preparation & Serving (56.6%).
| Occupation | Male | Female |
| Healthcare Support | 16 (33.3%) | 32 (66.7%) |
| Security & Protection | 21 (100.0%) | 0 (0.0%) |
| Firefighting & Prevention | 14 (100.0%) | 0 (0.0%) |
| Law Enforcement | 7 (100.0%) | 0 (0.0%) |
| Food Preparation & Serving | 53 (43.4%) | 69 (56.6%) |
| Cleaning & Maintenance | 41 (83.7%) | 8 (16.3%) |
| Personal Care & Service | 7 (10.6%) | 59 (89.4%) |
| Total (Category) | 138 (45.1%) | 168 (54.9%) |
| Total (Overall) | 586 (55.1%) | 478 (44.9%) |
Sales and Office Occupations
The most common Sales and Office occupations in Willamina are Sales & Related (168 | 15.8%), and Office & Administration (77 | 7.2%).
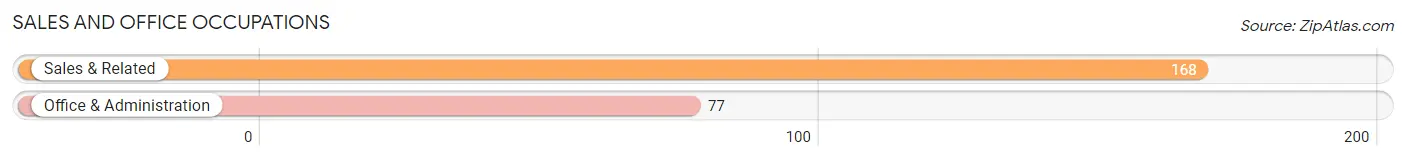
Sales and Office Occupations by Sex
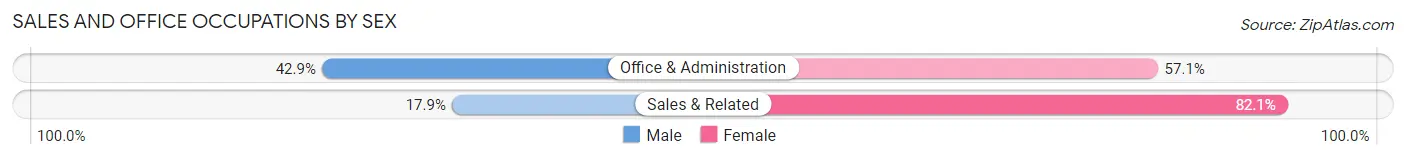
| Occupation | Male | Female |
| Sales & Related | 30 (17.9%) | 138 (82.1%) |
| Office & Administration | 33 (42.9%) | 44 (57.1%) |
| Total (Category) | 63 (25.7%) | 182 (74.3%) |
| Total (Overall) | 586 (55.1%) | 478 (44.9%) |
Natural Resources, Construction and Maintenance Occupations
The most common Natural Resources, Construction and Maintenance occupations in Willamina are Installation, Maintenance & Repair (58 | 5.4%), Construction & Extraction (51 | 4.8%), and Farming, Fishing & Forestry (29 | 2.7%).
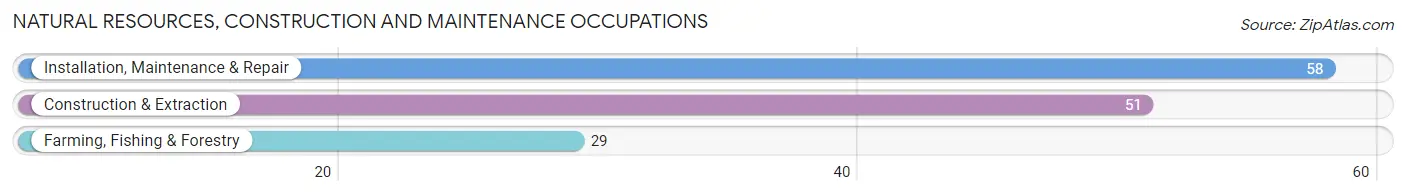
Natural Resources, Construction and Maintenance Occupations by Sex
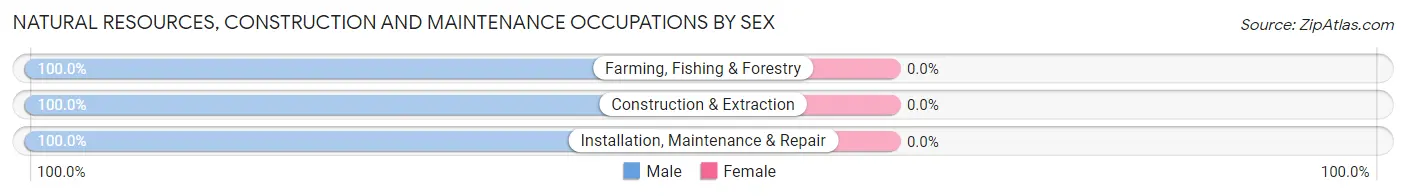
| Occupation | Male | Female |
| Farming, Fishing & Forestry | 29 (100.0%) | 0 (0.0%) |
| Construction & Extraction | 51 (100.0%) | 0 (0.0%) |
| Installation, Maintenance & Repair | 58 (100.0%) | 0 (0.0%) |
| Total (Category) | 138 (100.0%) | 0 (0.0%) |
| Total (Overall) | 586 (55.1%) | 478 (44.9%) |
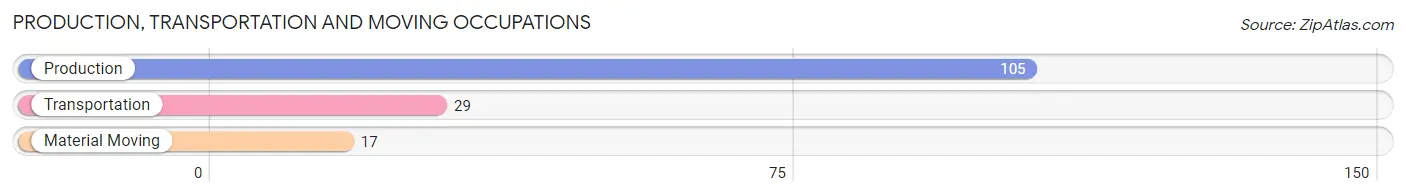
Production, Transportation and Moving Occupations
The most common Production, Transportation and Moving occupations in Willamina are Production (105 | 9.9%), Transportation (29 | 2.7%), and Material Moving (17 | 1.6%).
Production, Transportation and Moving Occupations by Sex
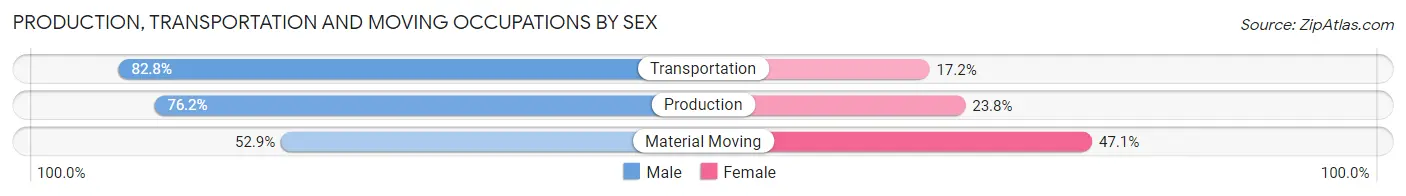
| Occupation | Male | Female |
| Production | 80 (76.2%) | 25 (23.8%) |
| Transportation | 24 (82.8%) | 5 (17.2%) |
| Material Moving | 9 (52.9%) | 8 (47.1%) |
| Total (Category) | 113 (74.8%) | 38 (25.2%) |
| Total (Overall) | 586 (55.1%) | 478 (44.9%) |
Employment Industries by Sex in Willamina
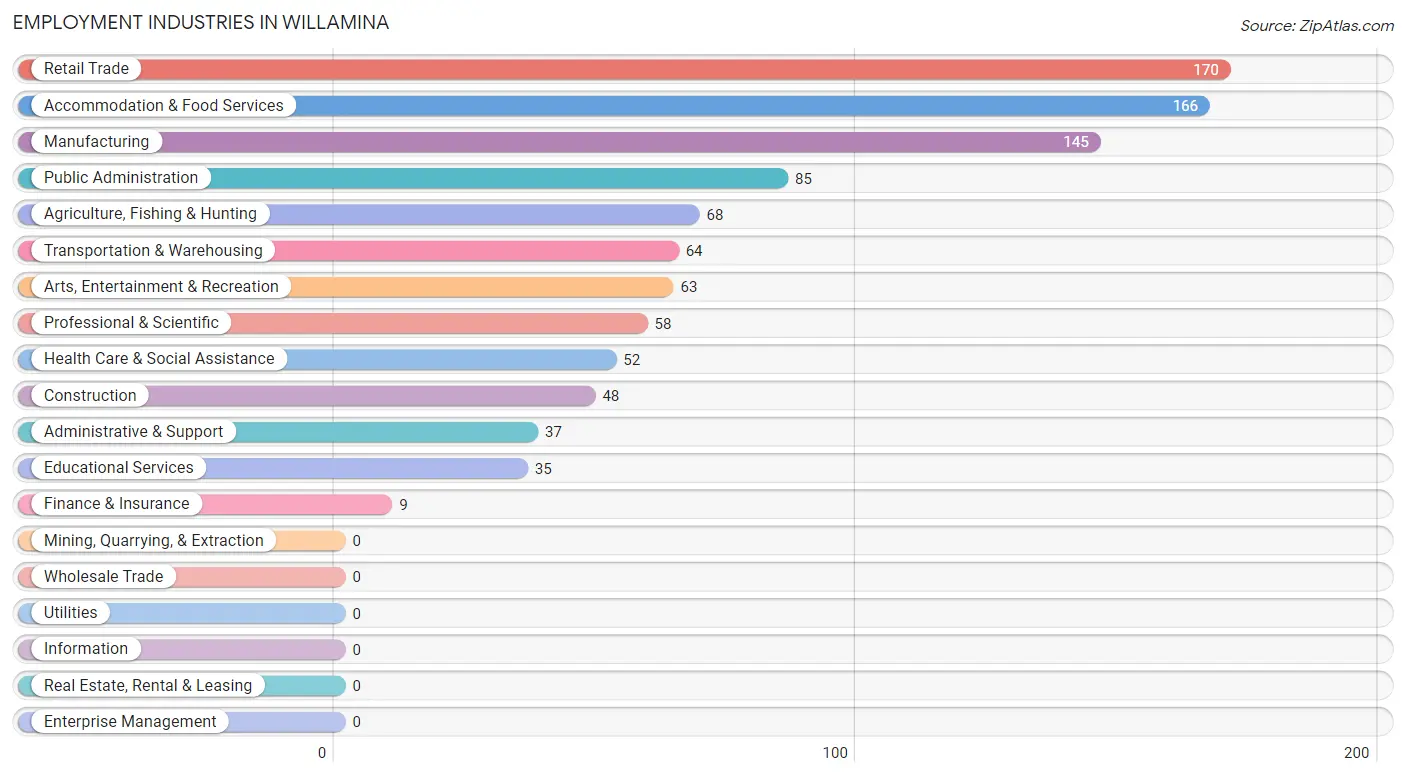
Employment Industries in Willamina
The major employment industries in Willamina include Retail Trade (170 | 16.0%), Accommodation & Food Services (166 | 15.6%), Manufacturing (145 | 13.6%), Public Administration (85 | 8.0%), and Agriculture, Fishing & Hunting (68 | 6.4%).
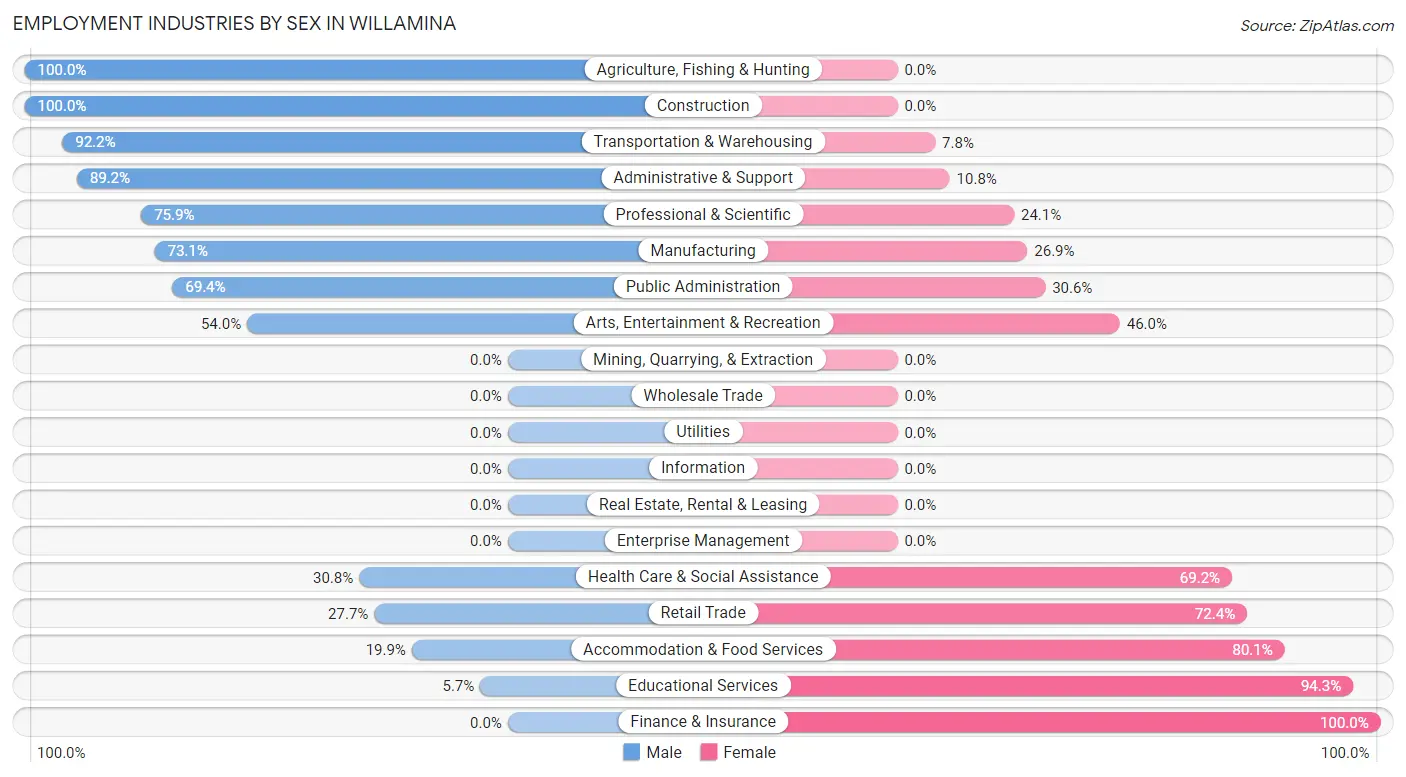
Employment Industries by Sex in Willamina
The Willamina industries that see more men than women are Agriculture, Fishing & Hunting (100.0%), Construction (100.0%), and Transportation & Warehousing (92.2%), whereas the industries that tend to have a higher number of women are Finance & Insurance (100.0%), Educational Services (94.3%), and Accommodation & Food Services (80.1%).
| Industry | Male | Female |
| Agriculture, Fishing & Hunting | 68 (100.0%) | 0 (0.0%) |
| Mining, Quarrying, & Extraction | 0 (0.0%) | 0 (0.0%) |
| Construction | 48 (100.0%) | 0 (0.0%) |
| Manufacturing | 106 (73.1%) | 39 (26.9%) |
| Wholesale Trade | 0 (0.0%) | 0 (0.0%) |
| Retail Trade | 47 (27.7%) | 123 (72.4%) |
| Transportation & Warehousing | 59 (92.2%) | 5 (7.8%) |
| Utilities | 0 (0.0%) | 0 (0.0%) |
| Information | 0 (0.0%) | 0 (0.0%) |
| Finance & Insurance | 0 (0.0%) | 9 (100.0%) |
| Real Estate, Rental & Leasing | 0 (0.0%) | 0 (0.0%) |
| Professional & Scientific | 44 (75.9%) | 14 (24.1%) |
| Enterprise Management | 0 (0.0%) | 0 (0.0%) |
| Administrative & Support | 33 (89.2%) | 4 (10.8%) |
| Educational Services | 2 (5.7%) | 33 (94.3%) |
| Health Care & Social Assistance | 16 (30.8%) | 36 (69.2%) |
| Arts, Entertainment & Recreation | 34 (54.0%) | 29 (46.0%) |
| Accommodation & Food Services | 33 (19.9%) | 133 (80.1%) |
| Public Administration | 59 (69.4%) | 26 (30.6%) |
| Total | 586 (55.1%) | 478 (44.9%) |
Education in Willamina
School Enrollment in Willamina
The most common levels of schooling among the 465 students in Willamina are middle school (174 | 37.4%), high school (106 | 22.8%), and elementary school (67 | 14.4%).
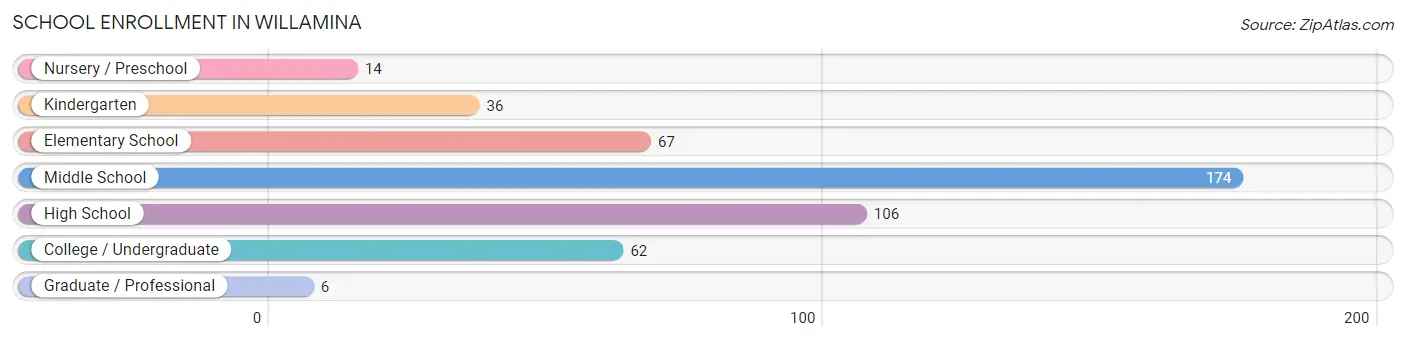
| School Level | # Students | % Students |
| Nursery / Preschool | 14 | 3.0% |
| Kindergarten | 36 | 7.7% |
| Elementary School | 67 | 14.4% |
| Middle School | 174 | 37.4% |
| High School | 106 | 22.8% |
| College / Undergraduate | 62 | 13.3% |
| Graduate / Professional | 6 | 1.3% |
| Total | 465 | 100.0% |
School Enrollment by Age by Funding Source in Willamina
Out of a total of 465 students who are enrolled in schools in Willamina, 49 (10.5%) attend a private institution, while the remaining 416 (89.5%) are enrolled in public schools. The age group of 18 to 19 year olds has the highest likelihood of being enrolled in private schools, with 3 (100.0% in the age bracket) enrolled. Conversely, the age group of 35 years and over has the lowest likelihood of being enrolled in a private school, with 22 (100.0% in the age bracket) attending a public institution.
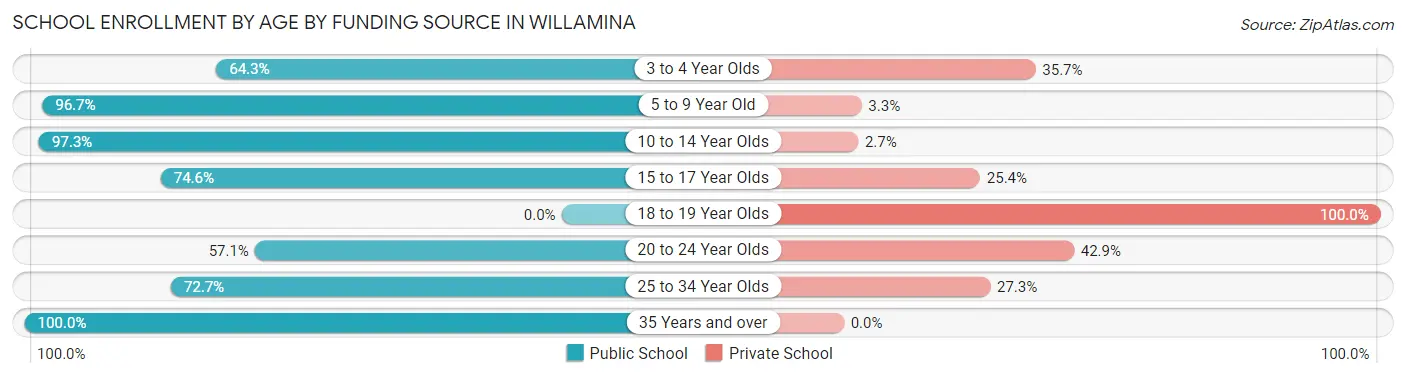
| Age Bracket | Public School | Private School |
| 3 to 4 Year Olds | 9 (64.3%) | 5 (35.7%) |
| 5 to 9 Year Old | 88 (96.7%) | 3 (3.3%) |
| 10 to 14 Year Olds | 219 (97.3%) | 6 (2.7%) |
| 15 to 17 Year Olds | 50 (74.6%) | 17 (25.4%) |
| 18 to 19 Year Olds | 0 (0.0%) | 3 (100.0%) |
| 20 to 24 Year Olds | 12 (57.1%) | 9 (42.9%) |
| 25 to 34 Year Olds | 16 (72.7%) | 6 (27.3%) |
| 35 Years and over | 22 (100.0%) | 0 (0.0%) |
| Total | 416 (89.5%) | 49 (10.5%) |
Educational Attainment by Field of Study in Willamina
Education (32 | 21.9%), business (26 | 17.8%), social sciences (18 | 12.3%), science & technology (17 | 11.6%), and physical & health sciences (12 | 8.2%) are the most common fields of study among 146 individuals in Willamina who have obtained a bachelor's degree or higher.
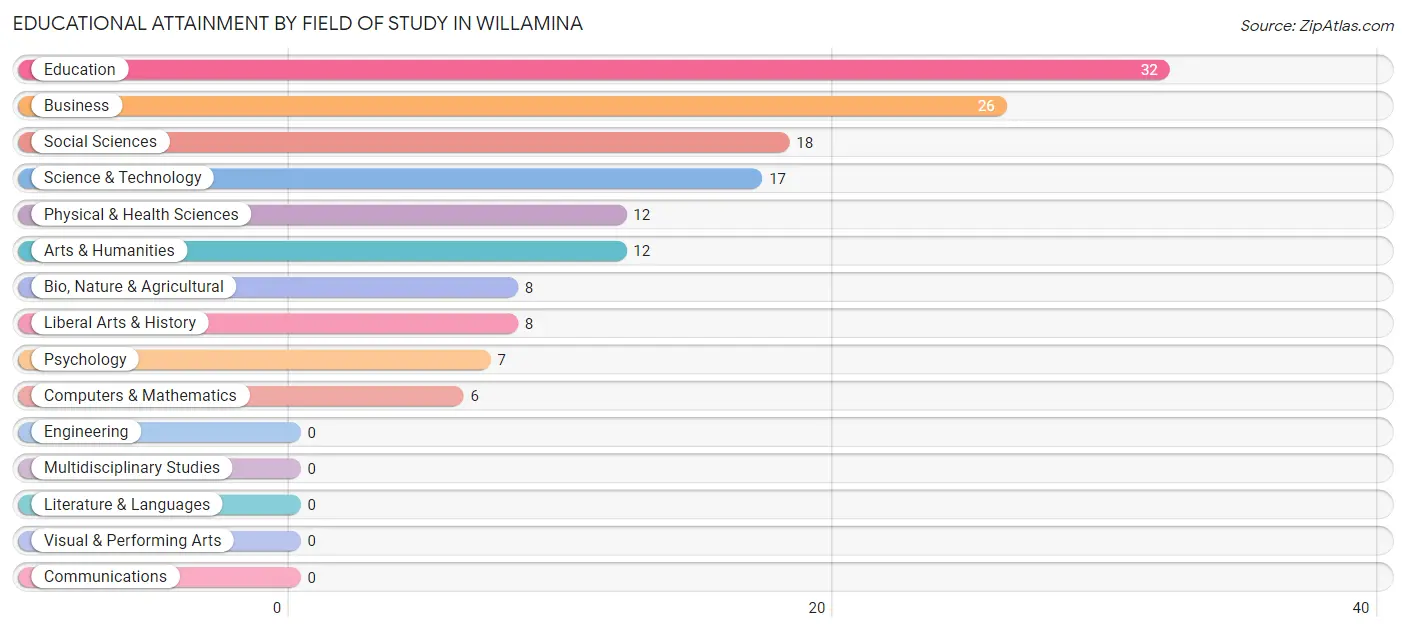
| Field of Study | # Graduates | % Graduates |
| Computers & Mathematics | 6 | 4.1% |
| Bio, Nature & Agricultural | 8 | 5.5% |
| Physical & Health Sciences | 12 | 8.2% |
| Psychology | 7 | 4.8% |
| Social Sciences | 18 | 12.3% |
| Engineering | 0 | 0.0% |
| Multidisciplinary Studies | 0 | 0.0% |
| Science & Technology | 17 | 11.6% |
| Business | 26 | 17.8% |
| Education | 32 | 21.9% |
| Literature & Languages | 0 | 0.0% |
| Liberal Arts & History | 8 | 5.5% |
| Visual & Performing Arts | 0 | 0.0% |
| Communications | 0 | 0.0% |
| Arts & Humanities | 12 | 8.2% |
| Total | 146 | 100.0% |
Transportation & Commute in Willamina
Vehicle Availability by Sex in Willamina
The most prevalent vehicle ownership categories in Willamina are males with 2 vehicles (219, accounting for 38.4%) and females with 2 vehicles (135, making up 52.8%).
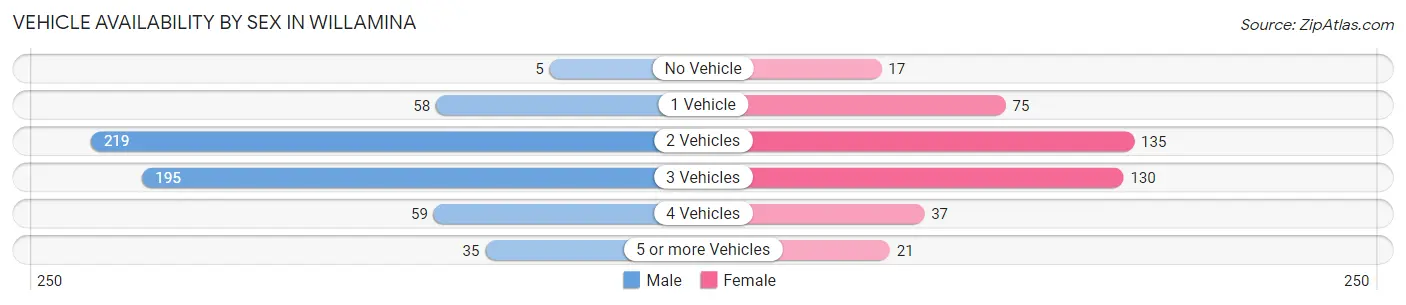
| Vehicles Available | Male | Female |
| No Vehicle | 5 (0.9%) | 17 (4.1%) |
| 1 Vehicle | 58 (10.2%) | 75 (18.1%) |
| 2 Vehicles | 219 (38.4%) | 135 (32.5%) |
| 3 Vehicles | 195 (34.2%) | 130 (31.3%) |
| 4 Vehicles | 59 (10.3%) | 37 (8.9%) |
| 5 or more Vehicles | 35 (6.1%) | 21 (5.1%) |
| Total | 571 (100.0%) | 415 (100.0%) |
Commute Time in Willamina
The most frequently occuring commute durations in Willamina are 30 to 34 minutes (180 commuters, 19.2%), 15 to 19 minutes (118 commuters, 12.6%), and 40 to 44 minutes (94 commuters, 10.0%).
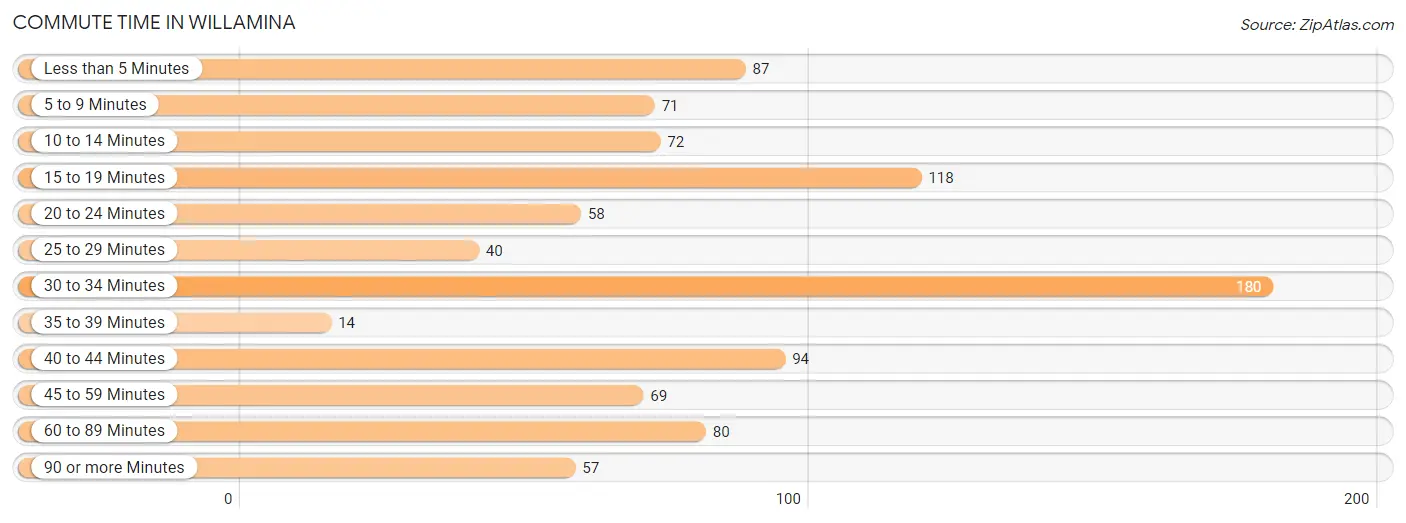
| Commute Time | # Commuters | % Commuters |
| Less than 5 Minutes | 87 | 9.3% |
| 5 to 9 Minutes | 71 | 7.5% |
| 10 to 14 Minutes | 72 | 7.7% |
| 15 to 19 Minutes | 118 | 12.6% |
| 20 to 24 Minutes | 58 | 6.2% |
| 25 to 29 Minutes | 40 | 4.3% |
| 30 to 34 Minutes | 180 | 19.2% |
| 35 to 39 Minutes | 14 | 1.5% |
| 40 to 44 Minutes | 94 | 10.0% |
| 45 to 59 Minutes | 69 | 7.3% |
| 60 to 89 Minutes | 80 | 8.5% |
| 90 or more Minutes | 57 | 6.1% |
Commute Time by Sex in Willamina
The most common commute times in Willamina are 30 to 34 minutes (136 commuters, 24.8%) for males and 40 to 44 minutes (94 commuters, 24.0%) for females.
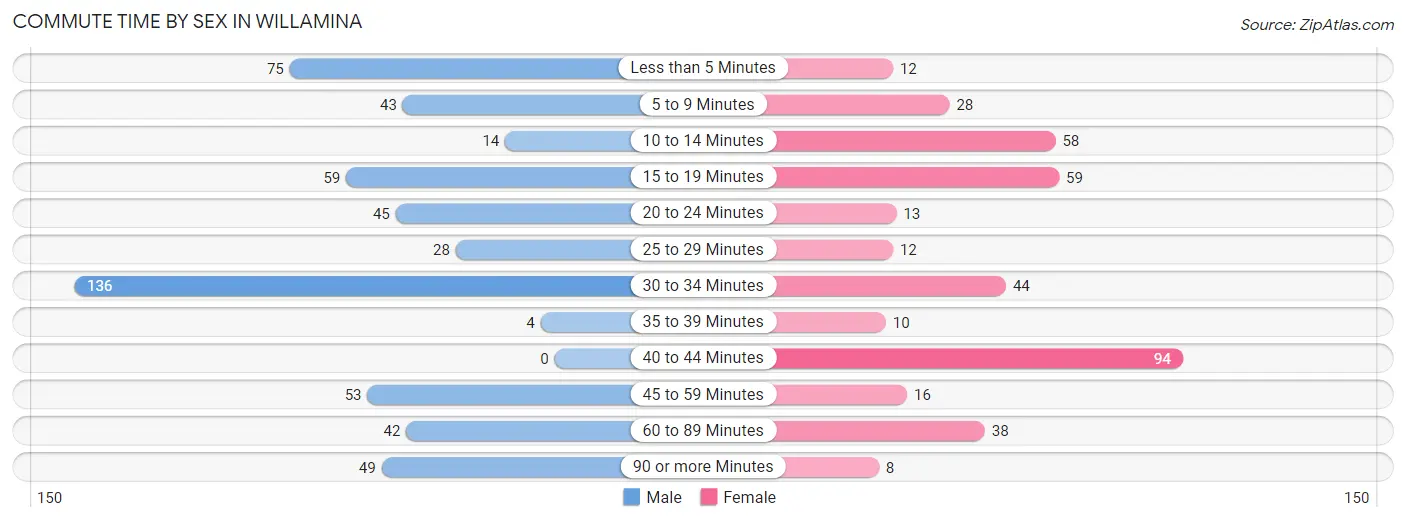
| Commute Time | Male | Female |
| Less than 5 Minutes | 75 (13.7%) | 12 (3.1%) |
| 5 to 9 Minutes | 43 (7.9%) | 28 (7.1%) |
| 10 to 14 Minutes | 14 (2.5%) | 58 (14.8%) |
| 15 to 19 Minutes | 59 (10.8%) | 59 (15.0%) |
| 20 to 24 Minutes | 45 (8.2%) | 13 (3.3%) |
| 25 to 29 Minutes | 28 (5.1%) | 12 (3.1%) |
| 30 to 34 Minutes | 136 (24.8%) | 44 (11.2%) |
| 35 to 39 Minutes | 4 (0.7%) | 10 (2.5%) |
| 40 to 44 Minutes | 0 (0.0%) | 94 (24.0%) |
| 45 to 59 Minutes | 53 (9.7%) | 16 (4.1%) |
| 60 to 89 Minutes | 42 (7.7%) | 38 (9.7%) |
| 90 or more Minutes | 49 (8.9%) | 8 (2.0%) |
Time of Departure to Work by Sex in Willamina
The most frequent times of departure to work in Willamina are 6:00 AM to 6:29 AM (114, 20.8%) for males and 7:30 AM to 7:59 AM (109, 27.8%) for females.
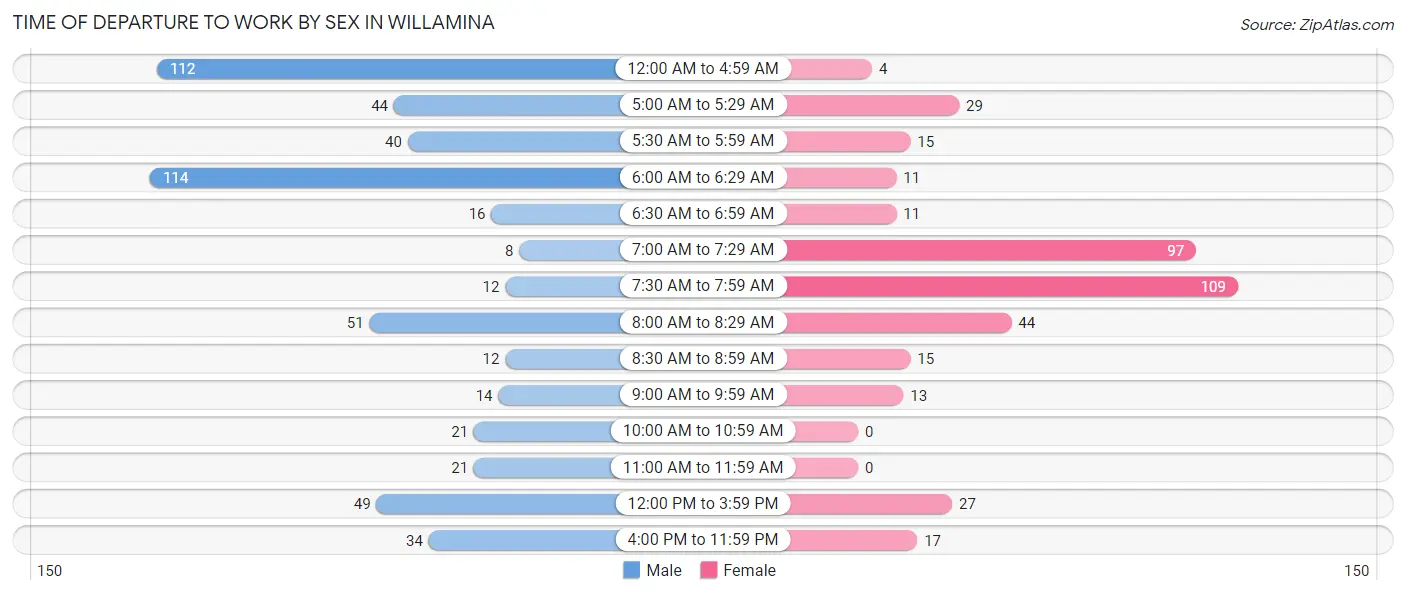
| Time of Departure | Male | Female |
| 12:00 AM to 4:59 AM | 112 (20.4%) | 4 (1.0%) |
| 5:00 AM to 5:29 AM | 44 (8.0%) | 29 (7.4%) |
| 5:30 AM to 5:59 AM | 40 (7.3%) | 15 (3.8%) |
| 6:00 AM to 6:29 AM | 114 (20.8%) | 11 (2.8%) |
| 6:30 AM to 6:59 AM | 16 (2.9%) | 11 (2.8%) |
| 7:00 AM to 7:29 AM | 8 (1.5%) | 97 (24.7%) |
| 7:30 AM to 7:59 AM | 12 (2.2%) | 109 (27.8%) |
| 8:00 AM to 8:29 AM | 51 (9.3%) | 44 (11.2%) |
| 8:30 AM to 8:59 AM | 12 (2.2%) | 15 (3.8%) |
| 9:00 AM to 9:59 AM | 14 (2.5%) | 13 (3.3%) |
| 10:00 AM to 10:59 AM | 21 (3.8%) | 0 (0.0%) |
| 11:00 AM to 11:59 AM | 21 (3.8%) | 0 (0.0%) |
| 12:00 PM to 3:59 PM | 49 (8.9%) | 27 (6.9%) |
| 4:00 PM to 11:59 PM | 34 (6.2%) | 17 (4.3%) |
| Total | 548 (100.0%) | 392 (100.0%) |
Housing Occupancy in Willamina
Occupancy by Ownership in Willamina
Of the total 792 dwellings in Willamina, owner-occupied units account for 428 (54.0%), while renter-occupied units make up 364 (46.0%).
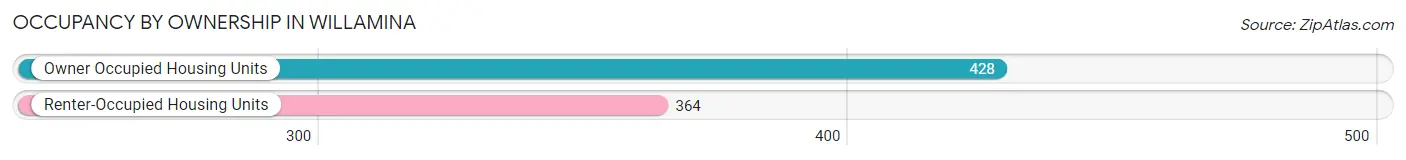
| Occupancy | # Housing Units | % Housing Units |
| Owner Occupied Housing Units | 428 | 54.0% |
| Renter-Occupied Housing Units | 364 | 46.0% |
| Total Occupied Housing Units | 792 | 100.0% |
Occupancy by Household Size in Willamina
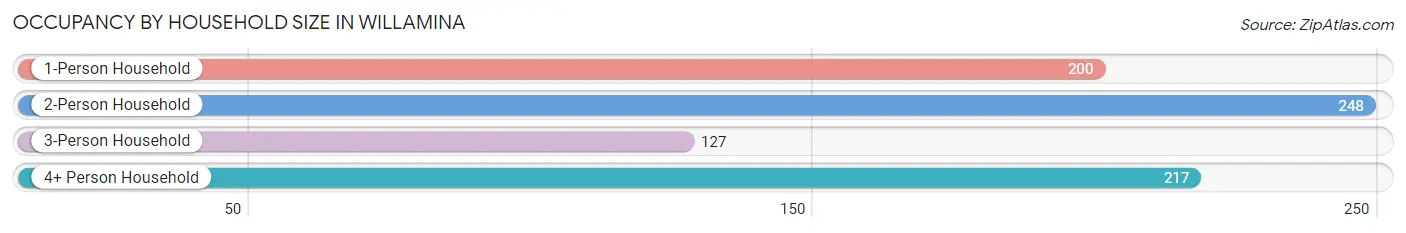
| Household Size | # Housing Units | % Housing Units |
| 1-Person Household | 200 | 25.3% |
| 2-Person Household | 248 | 31.3% |
| 3-Person Household | 127 | 16.0% |
| 4+ Person Household | 217 | 27.4% |
| Total Housing Units | 792 | 100.0% |
Occupancy by Ownership by Household Size in Willamina
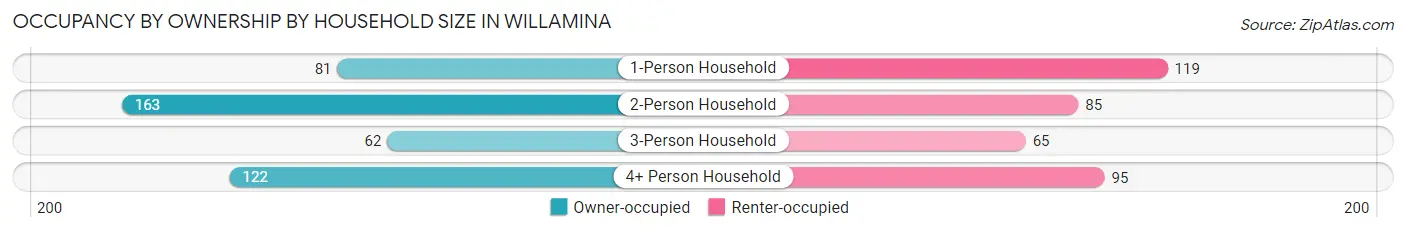
| Household Size | Owner-occupied | Renter-occupied |
| 1-Person Household | 81 (40.5%) | 119 (59.5%) |
| 2-Person Household | 163 (65.7%) | 85 (34.3%) |
| 3-Person Household | 62 (48.8%) | 65 (51.2%) |
| 4+ Person Household | 122 (56.2%) | 95 (43.8%) |
| Total Housing Units | 428 (54.0%) | 364 (46.0%) |
Occupancy by Educational Attainment in Willamina
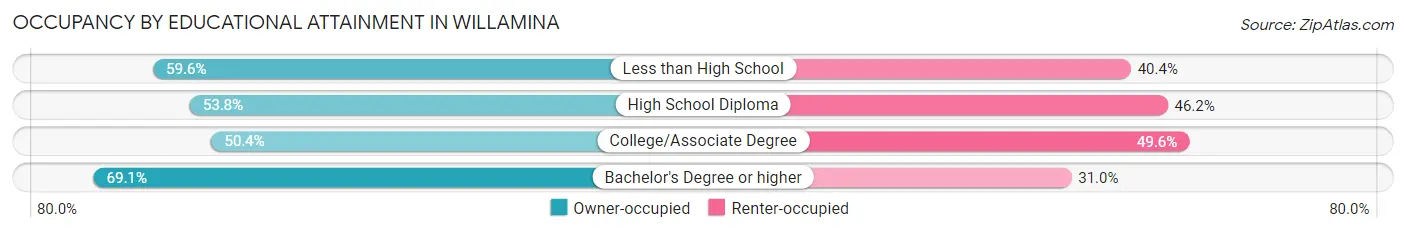
| Household Size | Owner-occupied | Renter-occupied |
| Less than High School | 31 (59.6%) | 21 (40.4%) |
| High School Diploma | 135 (53.8%) | 116 (46.2%) |
| College/Associate Degree | 204 (50.4%) | 201 (49.6%) |
| Bachelor's Degree or higher | 58 (69.1%) | 26 (30.9%) |
Occupancy by Age of Householder in Willamina
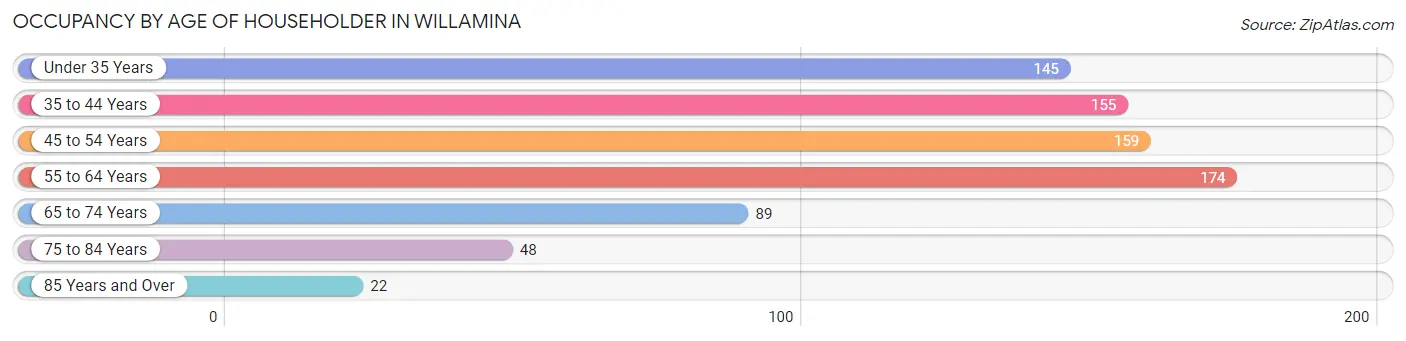
| Age Bracket | # Households | % Households |
| Under 35 Years | 145 | 18.3% |
| 35 to 44 Years | 155 | 19.6% |
| 45 to 54 Years | 159 | 20.1% |
| 55 to 64 Years | 174 | 22.0% |
| 65 to 74 Years | 89 | 11.2% |
| 75 to 84 Years | 48 | 6.1% |
| 85 Years and Over | 22 | 2.8% |
| Total | 792 | 100.0% |
Housing Finances in Willamina
Median Income by Occupancy in Willamina
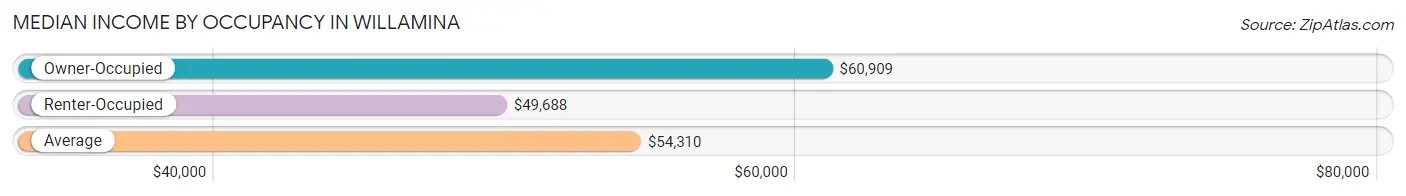
| Occupancy Type | # Households | Median Income |
| Owner-Occupied | 428 (54.0%) | $60,909 |
| Renter-Occupied | 364 (46.0%) | $49,688 |
| Average | 792 (100.0%) | $54,310 |
Occupancy by Householder Income Bracket in Willamina
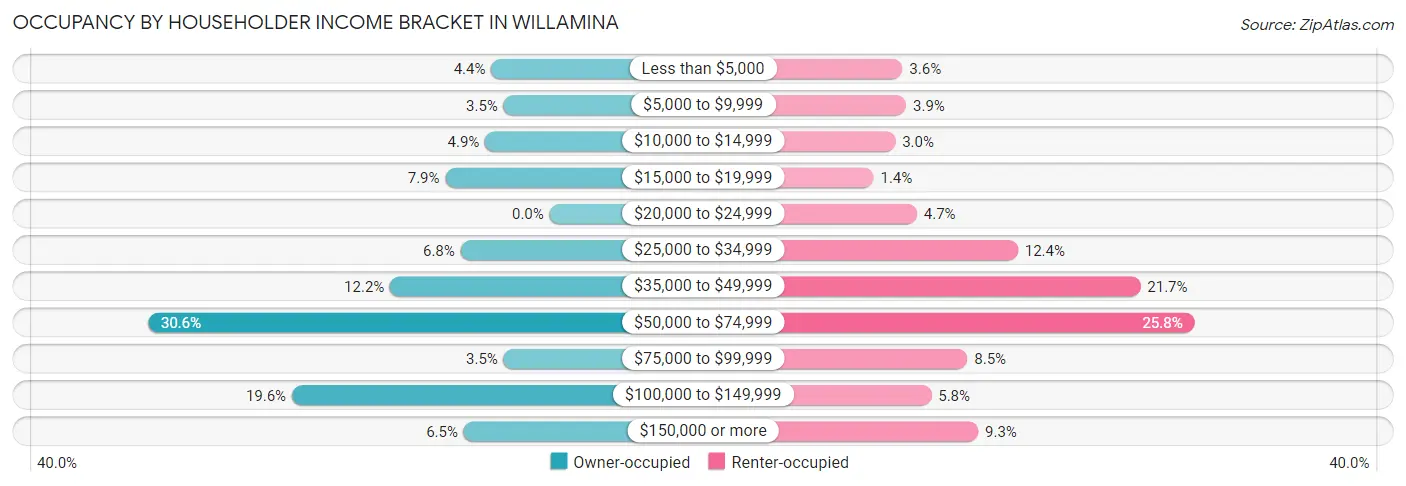
| Income Bracket | Owner-occupied | Renter-occupied |
| Less than $5,000 | 19 (4.4%) | 13 (3.6%) |
| $5,000 to $9,999 | 15 (3.5%) | 14 (3.8%) |
| $10,000 to $14,999 | 21 (4.9%) | 11 (3.0%) |
| $15,000 to $19,999 | 34 (7.9%) | 5 (1.4%) |
| $20,000 to $24,999 | 0 (0.0%) | 17 (4.7%) |
| $25,000 to $34,999 | 29 (6.8%) | 45 (12.4%) |
| $35,000 to $49,999 | 52 (12.1%) | 79 (21.7%) |
| $50,000 to $74,999 | 131 (30.6%) | 94 (25.8%) |
| $75,000 to $99,999 | 15 (3.5%) | 31 (8.5%) |
| $100,000 to $149,999 | 84 (19.6%) | 21 (5.8%) |
| $150,000 or more | 28 (6.5%) | 34 (9.3%) |
| Total | 428 (100.0%) | 364 (100.0%) |
Monthly Housing Cost Tiers in Willamina
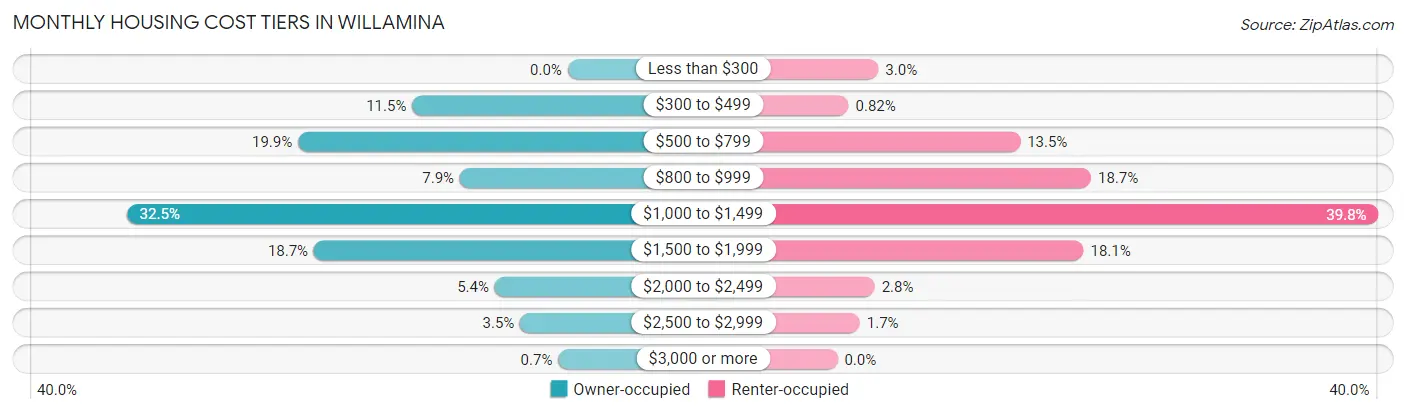
| Monthly Cost | Owner-occupied | Renter-occupied |
| Less than $300 | 0 (0.0%) | 11 (3.0%) |
| $300 to $499 | 49 (11.5%) | 3 (0.8%) |
| $500 to $799 | 85 (19.9%) | 49 (13.5%) |
| $800 to $999 | 34 (7.9%) | 68 (18.7%) |
| $1,000 to $1,499 | 139 (32.5%) | 145 (39.8%) |
| $1,500 to $1,999 | 80 (18.7%) | 66 (18.1%) |
| $2,000 to $2,499 | 23 (5.4%) | 10 (2.8%) |
| $2,500 to $2,999 | 15 (3.5%) | 6 (1.7%) |
| $3,000 or more | 3 (0.7%) | 0 (0.0%) |
| Total | 428 (100.0%) | 364 (100.0%) |
Physical Housing Characteristics in Willamina
Housing Structures in Willamina
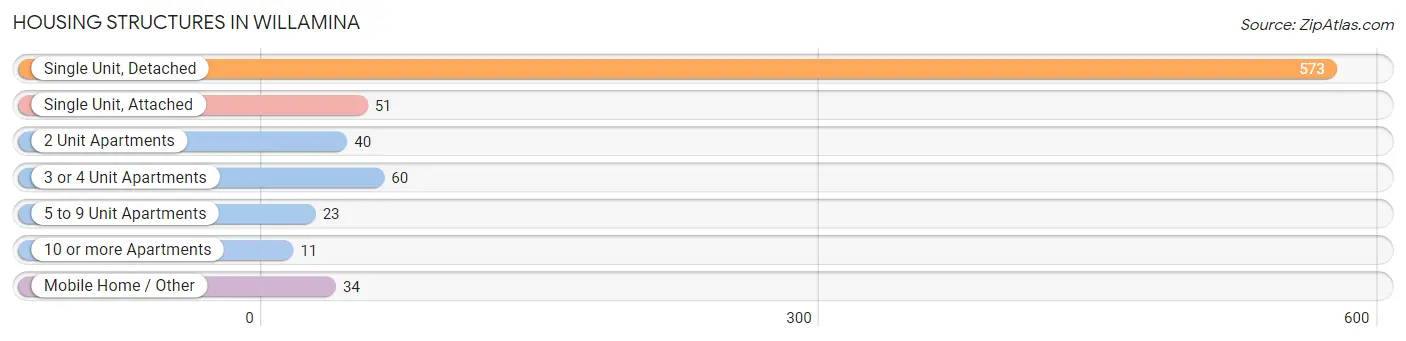
| Structure Type | # Housing Units | % Housing Units |
| Single Unit, Detached | 573 | 72.4% |
| Single Unit, Attached | 51 | 6.4% |
| 2 Unit Apartments | 40 | 5.1% |
| 3 or 4 Unit Apartments | 60 | 7.6% |
| 5 to 9 Unit Apartments | 23 | 2.9% |
| 10 or more Apartments | 11 | 1.4% |
| Mobile Home / Other | 34 | 4.3% |
| Total | 792 | 100.0% |
Housing Structures by Occupancy in Willamina
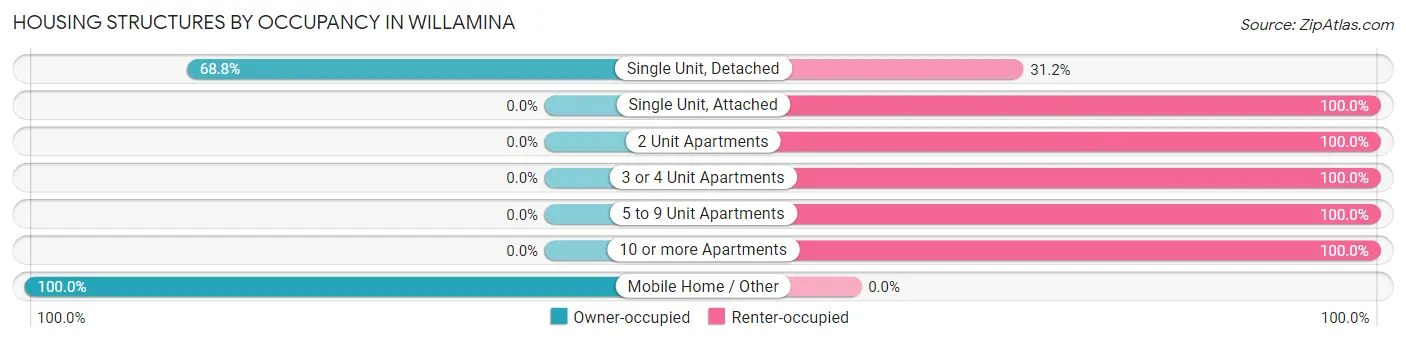
| Structure Type | Owner-occupied | Renter-occupied |
| Single Unit, Detached | 394 (68.8%) | 179 (31.2%) |
| Single Unit, Attached | 0 (0.0%) | 51 (100.0%) |
| 2 Unit Apartments | 0 (0.0%) | 40 (100.0%) |
| 3 or 4 Unit Apartments | 0 (0.0%) | 60 (100.0%) |
| 5 to 9 Unit Apartments | 0 (0.0%) | 23 (100.0%) |
| 10 or more Apartments | 0 (0.0%) | 11 (100.0%) |
| Mobile Home / Other | 34 (100.0%) | 0 (0.0%) |
| Total | 428 (54.0%) | 364 (46.0%) |
Housing Structures by Number of Rooms in Willamina
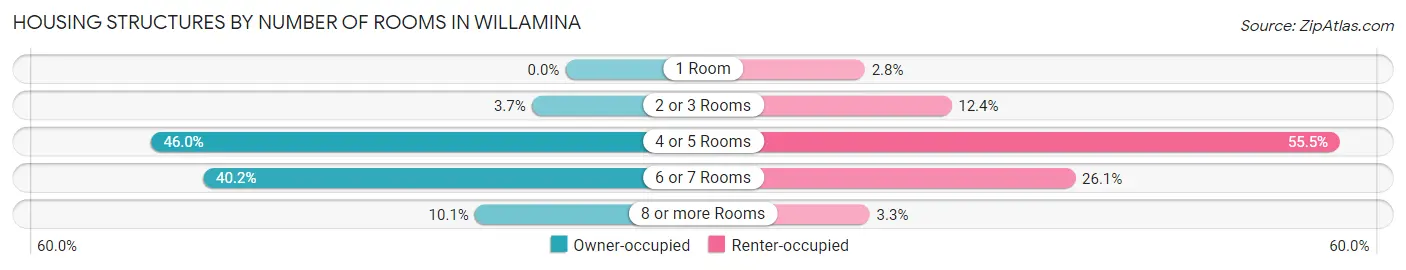
| Number of Rooms | Owner-occupied | Renter-occupied |
| 1 Room | 0 (0.0%) | 10 (2.8%) |
| 2 or 3 Rooms | 16 (3.7%) | 45 (12.4%) |
| 4 or 5 Rooms | 197 (46.0%) | 202 (55.5%) |
| 6 or 7 Rooms | 172 (40.2%) | 95 (26.1%) |
| 8 or more Rooms | 43 (10.1%) | 12 (3.3%) |
| Total | 428 (100.0%) | 364 (100.0%) |
Housing Structure by Heating Type in Willamina
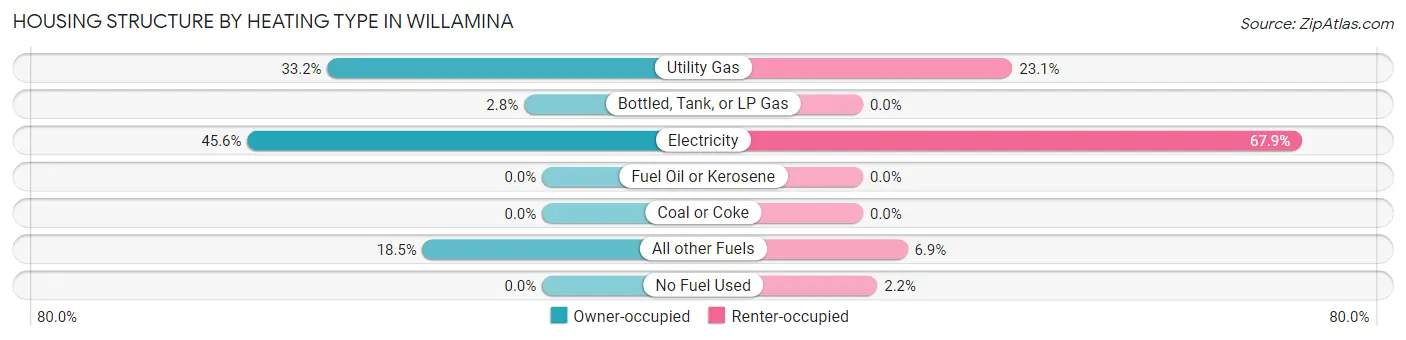
| Heating Type | Owner-occupied | Renter-occupied |
| Utility Gas | 142 (33.2%) | 84 (23.1%) |
| Bottled, Tank, or LP Gas | 12 (2.8%) | 0 (0.0%) |
| Electricity | 195 (45.6%) | 247 (67.9%) |
| Fuel Oil or Kerosene | 0 (0.0%) | 0 (0.0%) |
| Coal or Coke | 0 (0.0%) | 0 (0.0%) |
| All other Fuels | 79 (18.5%) | 25 (6.9%) |
| No Fuel Used | 0 (0.0%) | 8 (2.2%) |
| Total | 428 (100.0%) | 364 (100.0%) |
Household Vehicle Usage in Willamina
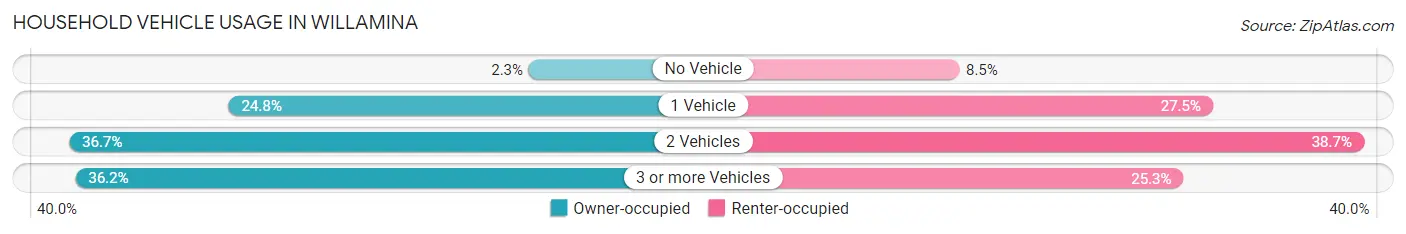
| Vehicles per Household | Owner-occupied | Renter-occupied |
| No Vehicle | 10 (2.3%) | 31 (8.5%) |
| 1 Vehicle | 106 (24.8%) | 100 (27.5%) |
| 2 Vehicles | 157 (36.7%) | 141 (38.7%) |
| 3 or more Vehicles | 155 (36.2%) | 92 (25.3%) |
| Total | 428 (100.0%) | 364 (100.0%) |
Real Estate & Mortgages in Willamina
Real Estate and Mortgage Overview in Willamina
| Characteristic | Without Mortgage | With Mortgage |
| Housing Units | 142 | 286 |
| Median Property Value | $215,100 | $226,300 |
| Median Household Income | $34,375 | $24 |
| Monthly Housing Costs | $541 | $3 |
| Real Estate Taxes | $1,971 | $0 |
Property Value by Mortgage Status in Willamina
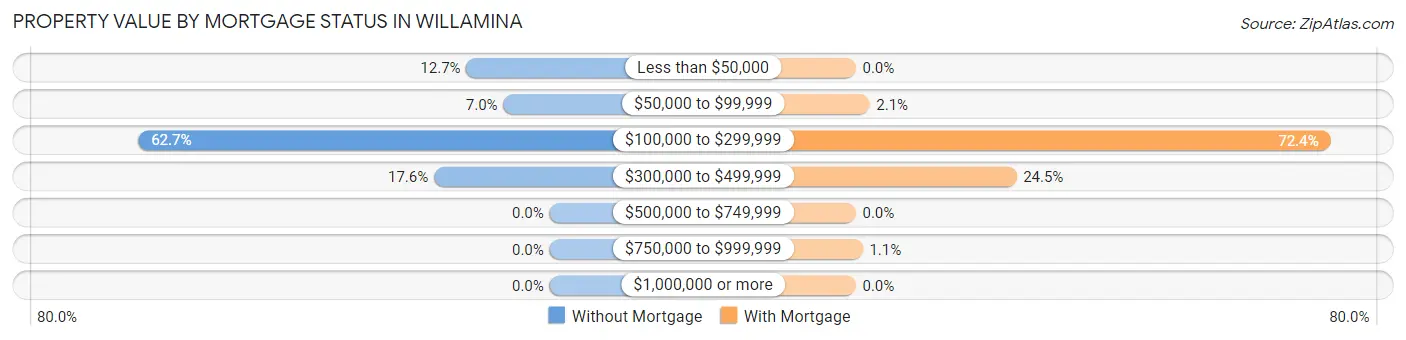
| Property Value | Without Mortgage | With Mortgage |
| Less than $50,000 | 18 (12.7%) | 0 (0.0%) |
| $50,000 to $99,999 | 10 (7.0%) | 6 (2.1%) |
| $100,000 to $299,999 | 89 (62.7%) | 207 (72.4%) |
| $300,000 to $499,999 | 25 (17.6%) | 70 (24.5%) |
| $500,000 to $749,999 | 0 (0.0%) | 0 (0.0%) |
| $750,000 to $999,999 | 0 (0.0%) | 3 (1.1%) |
| $1,000,000 or more | 0 (0.0%) | 0 (0.0%) |
| Total | 142 (100.0%) | 286 (100.0%) |
Household Income by Mortgage Status in Willamina
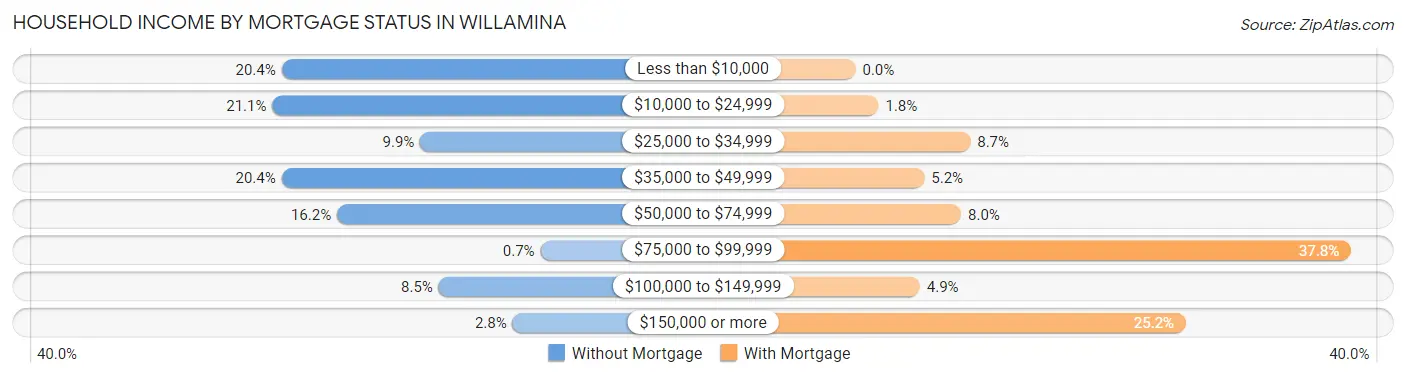
| Household Income | Without Mortgage | With Mortgage |
| Less than $10,000 | 29 (20.4%) | 0 (0.0%) |
| $10,000 to $24,999 | 30 (21.1%) | 5 (1.8%) |
| $25,000 to $34,999 | 14 (9.9%) | 25 (8.7%) |
| $35,000 to $49,999 | 29 (20.4%) | 15 (5.2%) |
| $50,000 to $74,999 | 23 (16.2%) | 23 (8.0%) |
| $75,000 to $99,999 | 1 (0.7%) | 108 (37.8%) |
| $100,000 to $149,999 | 12 (8.5%) | 14 (4.9%) |
| $150,000 or more | 4 (2.8%) | 72 (25.2%) |
| Total | 142 (100.0%) | 286 (100.0%) |
Property Value to Household Income Ratio in Willamina
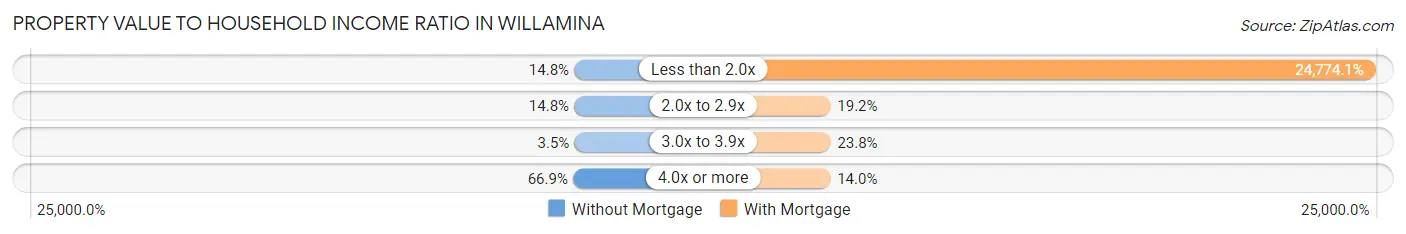
| Value-to-Income Ratio | Without Mortgage | With Mortgage |
| Less than 2.0x | 21 (14.8%) | 70,854 (24,774.1%) |
| 2.0x to 2.9x | 21 (14.8%) | 55 (19.2%) |
| 3.0x to 3.9x | 5 (3.5%) | 68 (23.8%) |
| 4.0x or more | 95 (66.9%) | 40 (14.0%) |
| Total | 142 (100.0%) | 286 (100.0%) |
Real Estate Taxes by Mortgage Status in Willamina
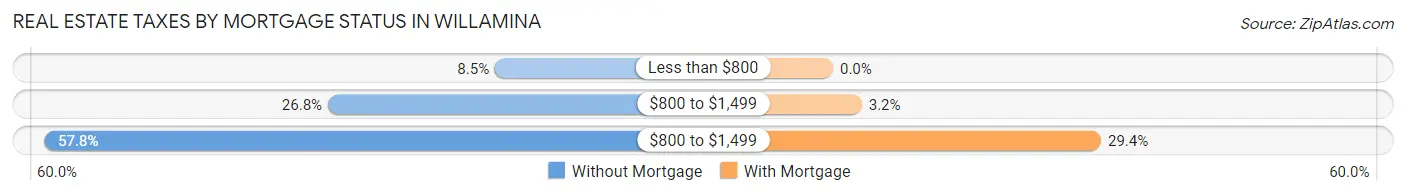
| Property Taxes | Without Mortgage | With Mortgage |
| Less than $800 | 12 (8.5%) | 0 (0.0%) |
| $800 to $1,499 | 38 (26.8%) | 9 (3.2%) |
| $800 to $1,499 | 82 (57.8%) | 84 (29.4%) |
| Total | 142 (100.0%) | 286 (100.0%) |
Health & Disability in Willamina
Health Insurance Coverage by Age in Willamina
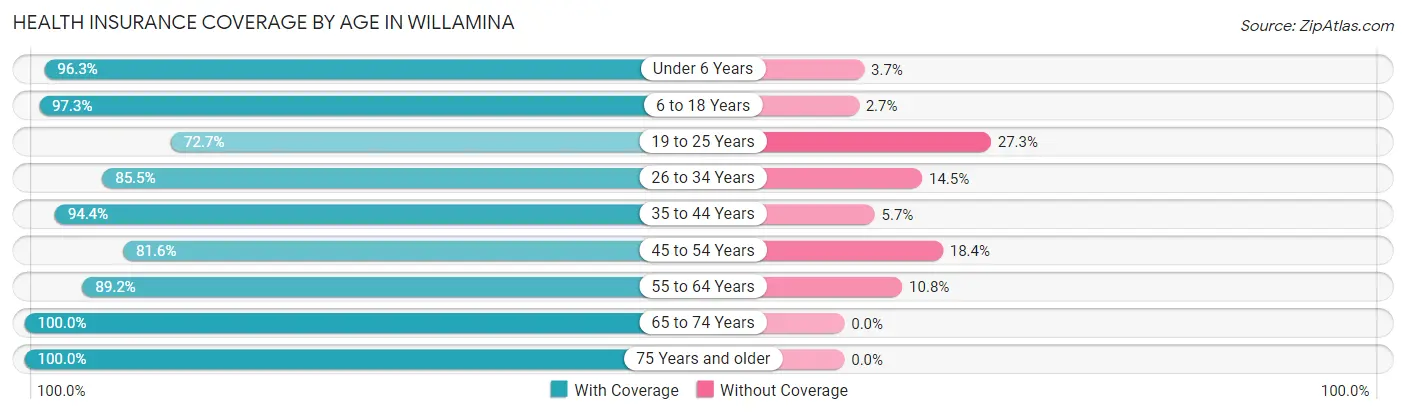
| Age Bracket | With Coverage | Without Coverage |
| Under 6 Years | 156 (96.3%) | 6 (3.7%) |
| 6 to 18 Years | 362 (97.3%) | 10 (2.7%) |
| 19 to 25 Years | 149 (72.7%) | 56 (27.3%) |
| 26 to 34 Years | 283 (85.5%) | 48 (14.5%) |
| 35 to 44 Years | 267 (94.4%) | 16 (5.7%) |
| 45 to 54 Years | 231 (81.6%) | 52 (18.4%) |
| 55 to 64 Years | 306 (89.2%) | 37 (10.8%) |
| 65 to 74 Years | 175 (100.0%) | 0 (0.0%) |
| 75 Years and older | 133 (100.0%) | 0 (0.0%) |
| Total | 2,062 (90.2%) | 225 (9.8%) |
Health Insurance Coverage by Citizenship Status in Willamina
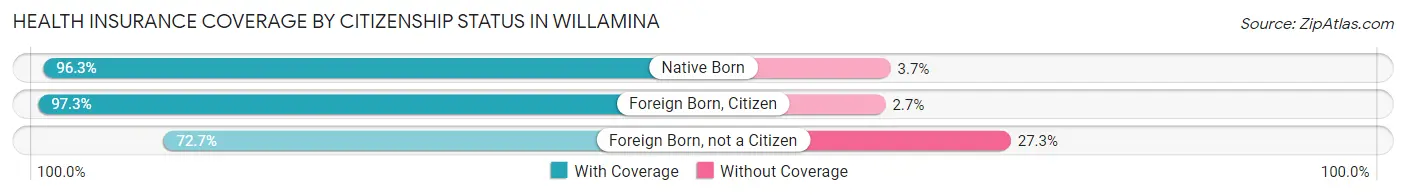
| Citizenship Status | With Coverage | Without Coverage |
| Native Born | 156 (96.3%) | 6 (3.7%) |
| Foreign Born, Citizen | 362 (97.3%) | 10 (2.7%) |
| Foreign Born, not a Citizen | 149 (72.7%) | 56 (27.3%) |
Health Insurance Coverage by Household Income in Willamina
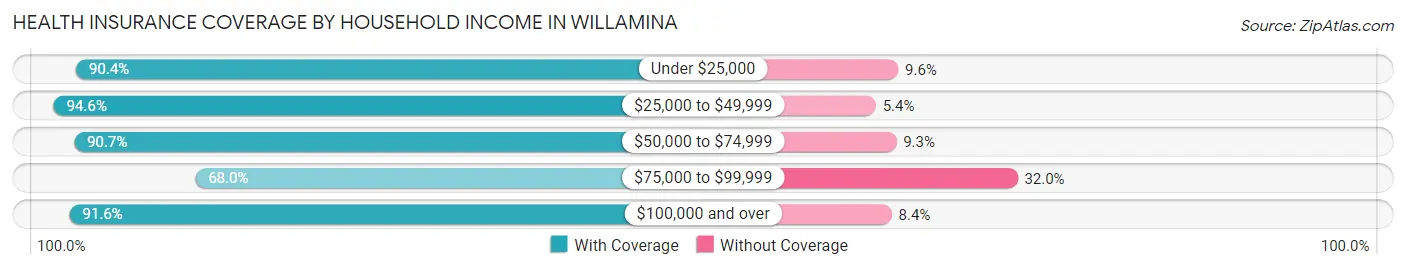
| Household Income | With Coverage | Without Coverage |
| Under $25,000 | 263 (90.4%) | 28 (9.6%) |
| $25,000 to $49,999 | 384 (94.6%) | 22 (5.4%) |
| $50,000 to $74,999 | 715 (90.7%) | 73 (9.3%) |
| $75,000 to $99,999 | 100 (68.0%) | 47 (32.0%) |
| $100,000 and over | 600 (91.6%) | 55 (8.4%) |
Public vs Private Health Insurance Coverage by Age in Willamina
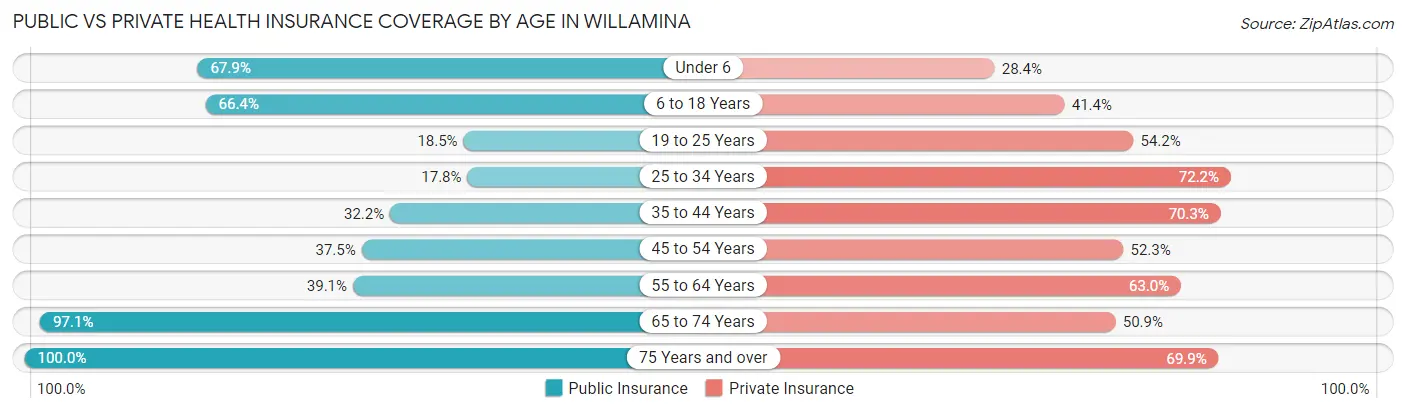
| Age Bracket | Public Insurance | Private Insurance |
| Under 6 | 110 (67.9%) | 46 (28.4%) |
| 6 to 18 Years | 247 (66.4%) | 154 (41.4%) |
| 19 to 25 Years | 38 (18.5%) | 111 (54.1%) |
| 25 to 34 Years | 59 (17.8%) | 239 (72.2%) |
| 35 to 44 Years | 91 (32.2%) | 199 (70.3%) |
| 45 to 54 Years | 106 (37.5%) | 148 (52.3%) |
| 55 to 64 Years | 134 (39.1%) | 216 (63.0%) |
| 65 to 74 Years | 170 (97.1%) | 89 (50.9%) |
| 75 Years and over | 133 (100.0%) | 93 (69.9%) |
| Total | 1,088 (47.6%) | 1,295 (56.6%) |
Disability Status by Sex by Age in Willamina
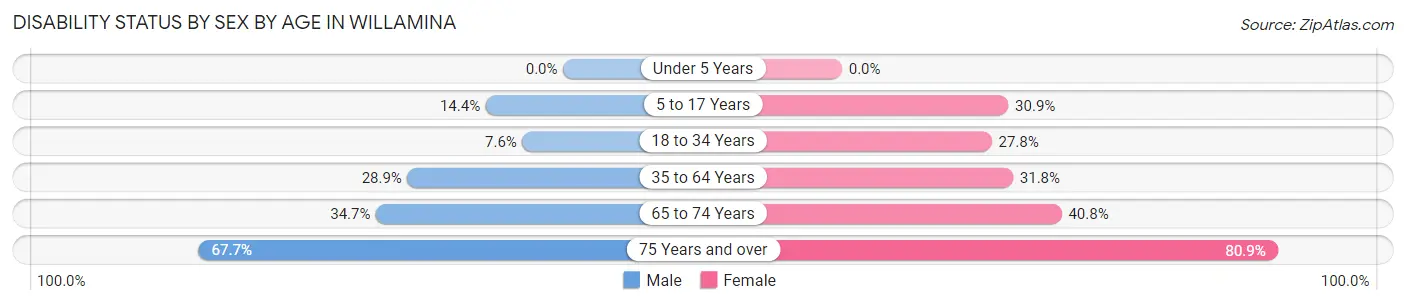
| Age Bracket | Male | Female |
| Under 5 Years | 0 (0.0%) | 0 (0.0%) |
| 5 to 17 Years | 29 (14.4%) | 63 (30.9%) |
| 18 to 34 Years | 25 (7.5%) | 57 (27.8%) |
| 35 to 64 Years | 117 (28.9%) | 160 (31.8%) |
| 65 to 74 Years | 25 (34.7%) | 42 (40.8%) |
| 75 Years and over | 44 (67.7%) | 55 (80.9%) |
Disability Class by Sex by Age in Willamina
Disability Class: Hearing Difficulty
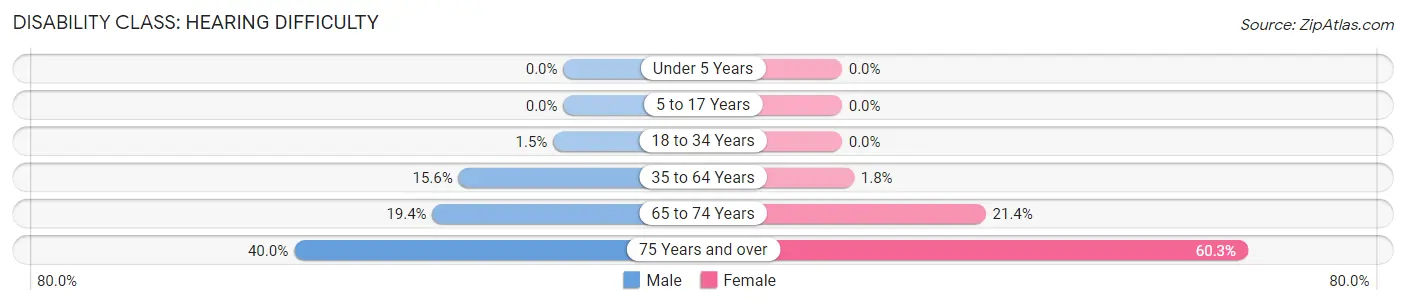
| Age Bracket | Male | Female |
| Under 5 Years | 0 (0.0%) | 0 (0.0%) |
| 5 to 17 Years | 0 (0.0%) | 0 (0.0%) |
| 18 to 34 Years | 5 (1.5%) | 0 (0.0%) |
| 35 to 64 Years | 63 (15.6%) | 9 (1.8%) |
| 65 to 74 Years | 14 (19.4%) | 22 (21.4%) |
| 75 Years and over | 26 (40.0%) | 41 (60.3%) |
Disability Class: Vision Difficulty
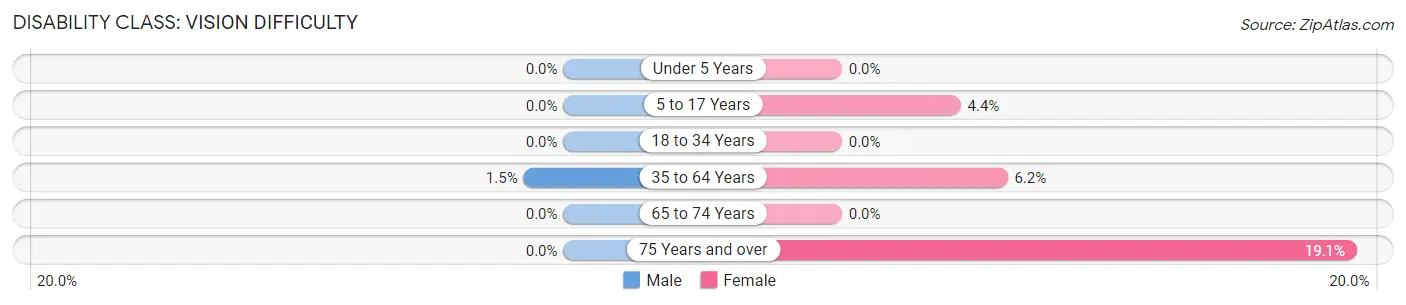
| Age Bracket | Male | Female |
| Under 5 Years | 0 (0.0%) | 0 (0.0%) |
| 5 to 17 Years | 0 (0.0%) | 9 (4.4%) |
| 18 to 34 Years | 0 (0.0%) | 0 (0.0%) |
| 35 to 64 Years | 6 (1.5%) | 31 (6.1%) |
| 65 to 74 Years | 0 (0.0%) | 0 (0.0%) |
| 75 Years and over | 0 (0.0%) | 13 (19.1%) |
Disability Class: Cognitive Difficulty
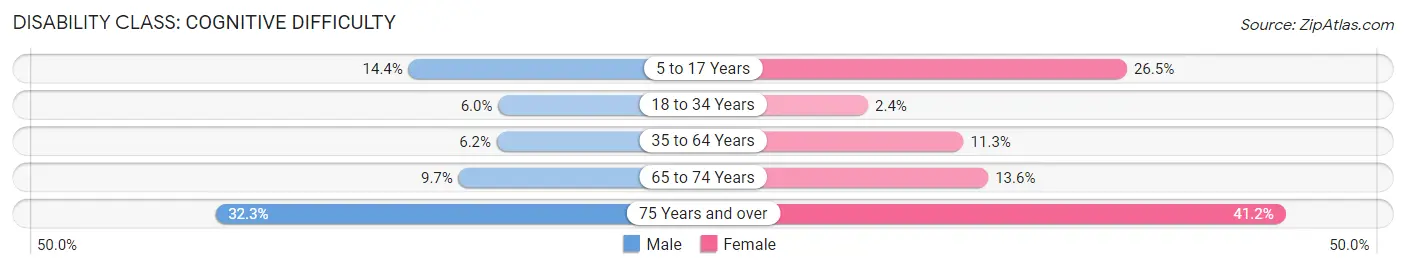
| Age Bracket | Male | Female |
| 5 to 17 Years | 29 (14.4%) | 54 (26.5%) |
| 18 to 34 Years | 20 (6.0%) | 5 (2.4%) |
| 35 to 64 Years | 25 (6.2%) | 57 (11.3%) |
| 65 to 74 Years | 7 (9.7%) | 14 (13.6%) |
| 75 Years and over | 21 (32.3%) | 28 (41.2%) |
Disability Class: Ambulatory Difficulty
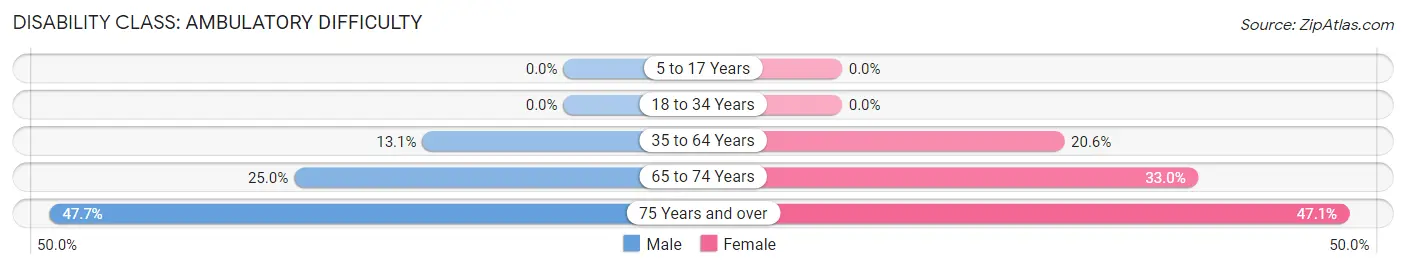
| Age Bracket | Male | Female |
| 5 to 17 Years | 0 (0.0%) | 0 (0.0%) |
| 18 to 34 Years | 0 (0.0%) | 0 (0.0%) |
| 35 to 64 Years | 53 (13.1%) | 104 (20.6%) |
| 65 to 74 Years | 18 (25.0%) | 34 (33.0%) |
| 75 Years and over | 31 (47.7%) | 32 (47.1%) |
Disability Class: Self-Care Difficulty
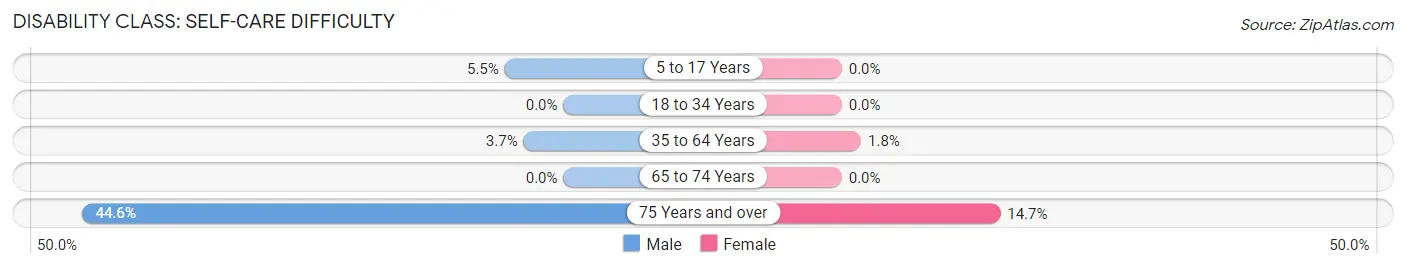
| Age Bracket | Male | Female |
| 5 to 17 Years | 11 (5.4%) | 0 (0.0%) |
| 18 to 34 Years | 0 (0.0%) | 0 (0.0%) |
| 35 to 64 Years | 15 (3.7%) | 9 (1.8%) |
| 65 to 74 Years | 0 (0.0%) | 0 (0.0%) |
| 75 Years and over | 29 (44.6%) | 10 (14.7%) |
Technology Access in Willamina
Computing Device Access in Willamina
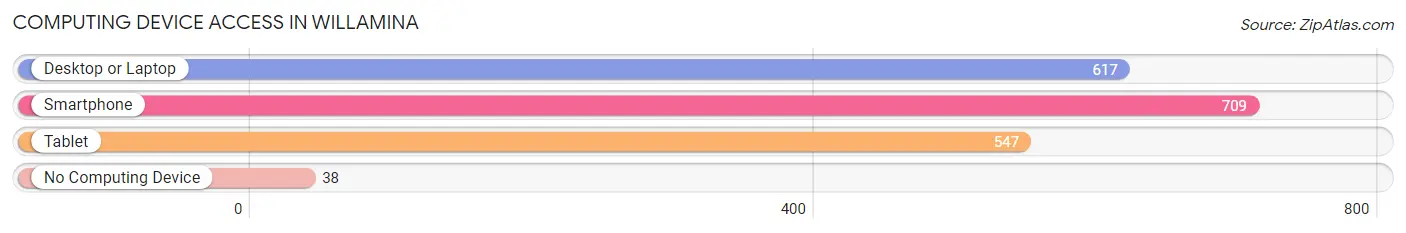
| Device Type | # Households | % Households |
| Desktop or Laptop | 617 | 77.9% |
| Smartphone | 709 | 89.5% |
| Tablet | 547 | 69.1% |
| No Computing Device | 38 | 4.8% |
| Total | 792 | 100.0% |
Internet Access in Willamina
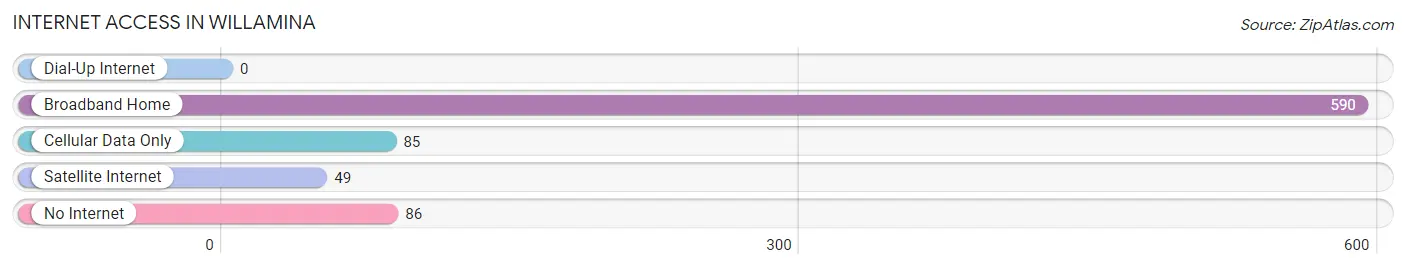
| Internet Type | # Households | % Households |
| Dial-Up Internet | 0 | 0.0% |
| Broadband Home | 590 | 74.5% |
| Cellular Data Only | 85 | 10.7% |
| Satellite Internet | 49 | 6.2% |
| No Internet | 86 | 10.9% |
| Total | 792 | 100.0% |
Willamina Summary
Willamina is a small city located in Yamhill County, Oregon, United States. It is situated in the foothills of the Coast Range, approximately 25 miles west of the city of Salem. The population of Willamina was 2,068 at the 2010 census.
History
The area that is now Willamina was originally inhabited by the Kalapuya Native American tribe. The first white settlers arrived in the area in the 1850s, and the town was officially founded in 1876. The town was named after Willamina, the daughter of one of the first settlers.
In the early 1900s, Willamina was a thriving logging and farming community. The town was home to several sawmills, a flour mill, and a creamery. The town also had a railroad station, which connected it to the larger cities of Portland and Salem.
In the 1950s, Willamina began to experience a decline in population as many of its residents moved away in search of better economic opportunities. The town was further impacted by the closure of the railroad station in the 1970s.
Geography
Willamina is located in the foothills of the Coast Range, approximately 25 miles west of the city of Salem. The city is situated at an elevation of 545 feet above sea level. The city covers an area of 1.3 square miles, all of which is land.
The city is located in the Willamette Valley, which is known for its fertile soil and mild climate. The city is surrounded by forests and is home to several creeks and rivers, including the Yamhill River.
Economy
Willamina’s economy is largely based on agriculture and forestry. The city is home to several farms, which produce a variety of crops, including hay, wheat, and vegetables. The city is also home to several sawmills and lumber yards, which produce lumber for the construction industry.
The city is also home to several small businesses, including restaurants, retail stores, and service providers. The city is also home to a casino, which is a major source of employment and revenue for the city.
Demographics
As of the 2010 census, the population of Willamina was 2,068. The racial makeup of the city was 91.2% White, 0.7% African American, 0.7% Native American, 0.7% Asian, 0.2% Pacific Islander, 4.2% from other races, and 2.2% from two or more races. Hispanic or Latino of any race were 8.2% of the population.
The median household income in Willamina was $37,917, and the median family income was $45,938. The per capita income for the city was $17,945. About 16.2% of families and 19.2% of the population were below the poverty line, including 28.2% of those under age 18 and 8.2% of those age 65 or over.
Common Questions
What is Per Capita Income in Willamina?
Per Capita income in Willamina is $24,502.
What is the Median Family Income in Willamina?
Median Family Income in Willamina is $61,071.
What is the Median Household income in Willamina?
Median Household Income in Willamina is $54,310.
What is Income or Wage Gap in Willamina?
Income or Wage Gap in Willamina is 21.2%.
Women in Willamina earn 78.8 cents for every dollar earned by a man.
What is Inequality or Gini Index in Willamina?
Inequality or Gini Index in Willamina is 0.38.
What is the Total Population of Willamina?
Total Population of Willamina is 2,287.
What is the Total Male Population of Willamina?
Total Male Population of Willamina is 1,143.
What is the Total Female Population of Willamina?
Total Female Population of Willamina is 1,144.
What is the Ratio of Males per 100 Females in Willamina?
There are 99.91 Males per 100 Females in Willamina.
What is the Ratio of Females per 100 Males in Willamina?
There are 100.09 Females per 100 Males in Willamina.
What is the Median Population Age in Willamina?
Median Population Age in Willamina is 36.8 Years.
What is the Average Family Size in Willamina
Average Family Size in Willamina is 3.5 People.
What is the Average Household Size in Willamina
Average Household Size in Willamina is 2.9 People.
How Large is the Labor Force in Willamina?
There are 1,137 People in the Labor Forcein in Willamina.
What is the Percentage of People in the Labor Force in Willamina?
63.4% of People are in the Labor Force in Willamina.
What is the Unemployment Rate in Willamina?
Unemployment Rate in Willamina is 6.4%.