Warren, OR Map & Demographics
Warren Map
Warren Overview
$51,482
PER CAPITA INCOME
$110,417
AVG FAMILY INCOME
$95,708
AVG HOUSEHOLD INCOME
21.0%
WAGE / INCOME GAP [ % ]
79.0¢/ $1
WAGE / INCOME GAP [ $ ]
0.32
INEQUALITY / GINI INDEX
1,608
TOTAL POPULATION
986
MALE POPULATION
622
FEMALE POPULATION
158.52
MALES / 100 FEMALES
63.08
FEMALES / 100 MALES
59.8
MEDIAN AGE
2.3
AVG FAMILY SIZE
2.0
AVG HOUSEHOLD SIZE
614
LABOR FORCE [ PEOPLE ]
42.6%
PERCENT IN LABOR FORCE
3.3%
UNEMPLOYMENT RATE
Warren Zip Codes
Warren Area Codes
Income in Warren
Income Overview in Warren
Per Capita Income in Warren is $51,482, while median incomes of families and households are $110,417 and $95,708 respectively.
| Characteristic | Number | Measure |
| Per Capita Income | 1,608 | $51,482 |
| Median Family Income | 603 | $110,417 |
| Mean Family Income | 603 | $118,334 |
| Median Household Income | 791 | $95,708 |
| Mean Household Income | 791 | $102,189 |
| Income Deficit | 603 | $0 |
| Wage / Income Gap (%) | 1,608 | 20.96% |
| Wage / Income Gap ($) | 1,608 | 79.04¢ per $1 |
| Gini / Inequality Index | 1,608 | 0.32 |
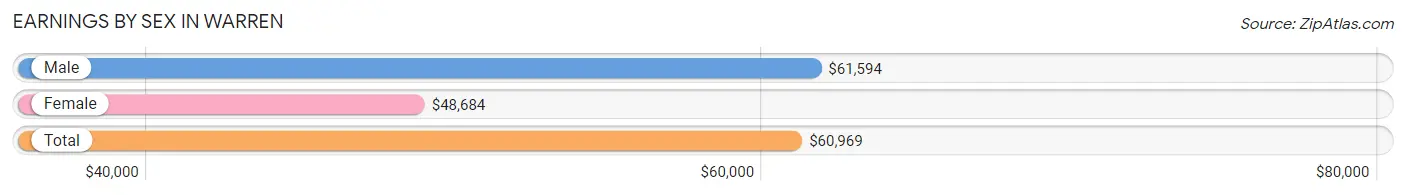
Earnings by Sex in Warren
Average Earnings in Warren are $60,969, $61,594 for men and $48,684 for women, a difference of 21.0%.
| Sex | Number | Average Earnings |
| Male | 395 (62.4%) | $61,594 |
| Female | 238 (37.6%) | $48,684 |
| Total | 633 (100.0%) | $60,969 |
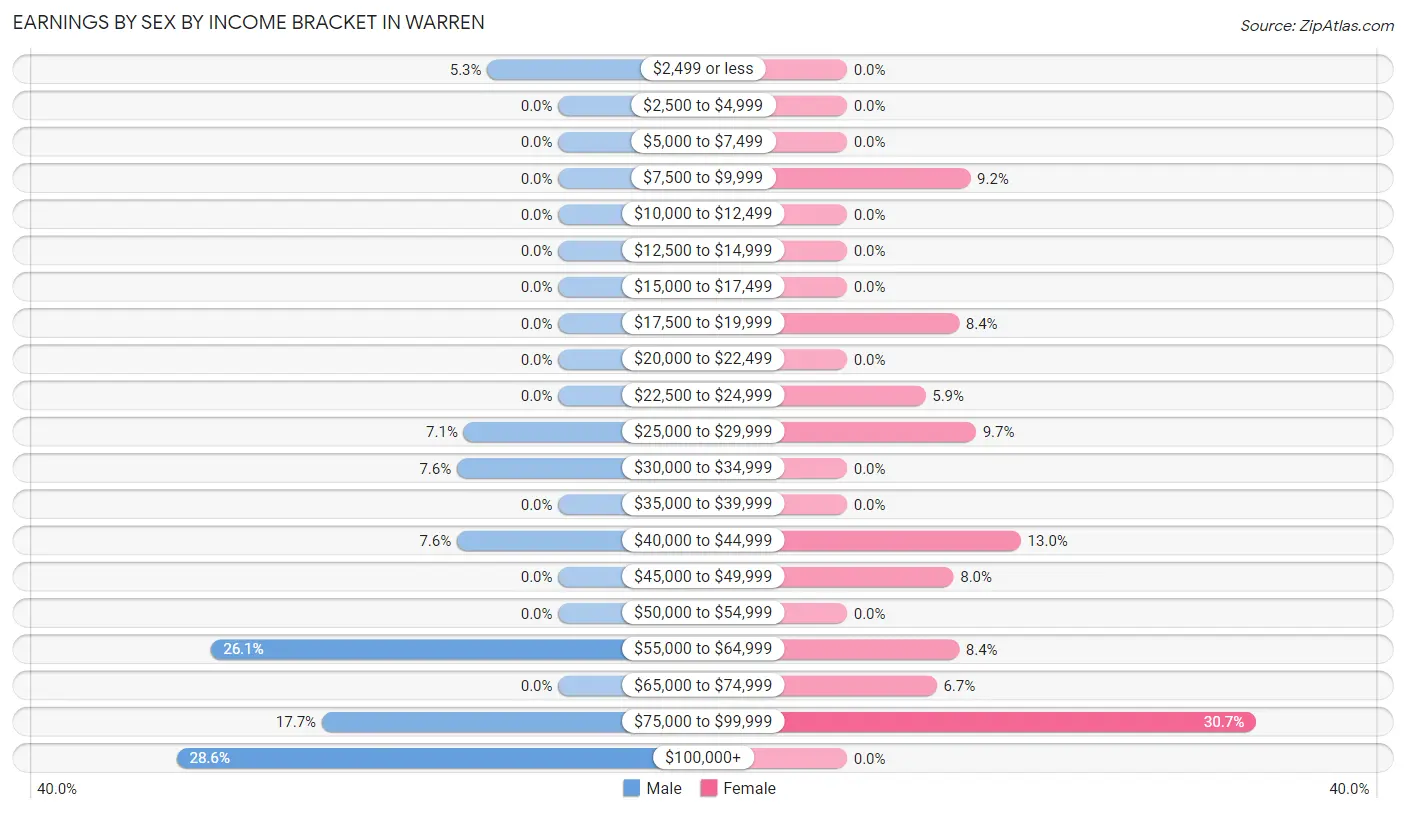
Earnings by Sex by Income Bracket in Warren
The most common earnings brackets in Warren are $100,000+ for men (113 | 28.6%) and $75,000 to $99,999 for women (73 | 30.7%).
| Income | Male | Female |
| $2,499 or less | 21 (5.3%) | 0 (0.0%) |
| $2,500 to $4,999 | 0 (0.0%) | 0 (0.0%) |
| $5,000 to $7,499 | 0 (0.0%) | 0 (0.0%) |
| $7,500 to $9,999 | 0 (0.0%) | 22 (9.2%) |
| $10,000 to $12,499 | 0 (0.0%) | 0 (0.0%) |
| $12,500 to $14,999 | 0 (0.0%) | 0 (0.0%) |
| $15,000 to $17,499 | 0 (0.0%) | 0 (0.0%) |
| $17,500 to $19,999 | 0 (0.0%) | 20 (8.4%) |
| $20,000 to $22,499 | 0 (0.0%) | 0 (0.0%) |
| $22,500 to $24,999 | 0 (0.0%) | 14 (5.9%) |
| $25,000 to $29,999 | 28 (7.1%) | 23 (9.7%) |
| $30,000 to $34,999 | 30 (7.6%) | 0 (0.0%) |
| $35,000 to $39,999 | 0 (0.0%) | 0 (0.0%) |
| $40,000 to $44,999 | 30 (7.6%) | 31 (13.0%) |
| $45,000 to $49,999 | 0 (0.0%) | 19 (8.0%) |
| $50,000 to $54,999 | 0 (0.0%) | 0 (0.0%) |
| $55,000 to $64,999 | 103 (26.1%) | 20 (8.4%) |
| $65,000 to $74,999 | 0 (0.0%) | 16 (6.7%) |
| $75,000 to $99,999 | 70 (17.7%) | 73 (30.7%) |
| $100,000+ | 113 (28.6%) | 0 (0.0%) |
| Total | 395 (100.0%) | 238 (100.0%) |
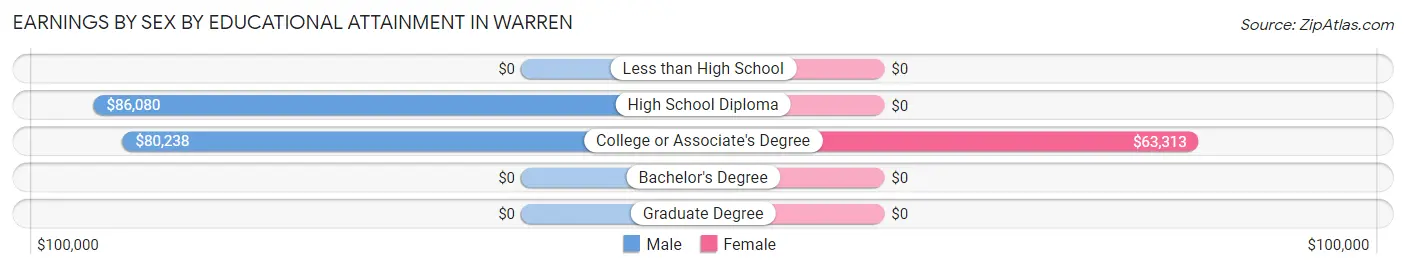
Earnings by Sex by Educational Attainment in Warren
Average earnings in Warren are $80,536 for men and $48,684 for women, a difference of 39.6%. Men with an educational attainment of high school diploma enjoy the highest average annual earnings of $86,080, while those with college or associate's degree education earn the least with $80,238. Women with an educational attainment of college or associate's degree earn the most with the average annual earnings of $63,313, while those with college or associate's degree education have the smallest earnings of $63,313.
| Educational Attainment | Male Income | Female Income |
| Less than High School | - | - |
| High School Diploma | $86,080 | $0 |
| College or Associate's Degree | $80,238 | $63,313 |
| Bachelor's Degree | - | - |
| Graduate Degree | - | - |
| Total | $80,536 | $48,684 |
Family Income in Warren
Family Income Brackets in Warren
According to the Warren family income data, there are 196 families falling into the $150,000 to $199,999 income range, which is the most common income bracket and makes up 32.5% of all families.
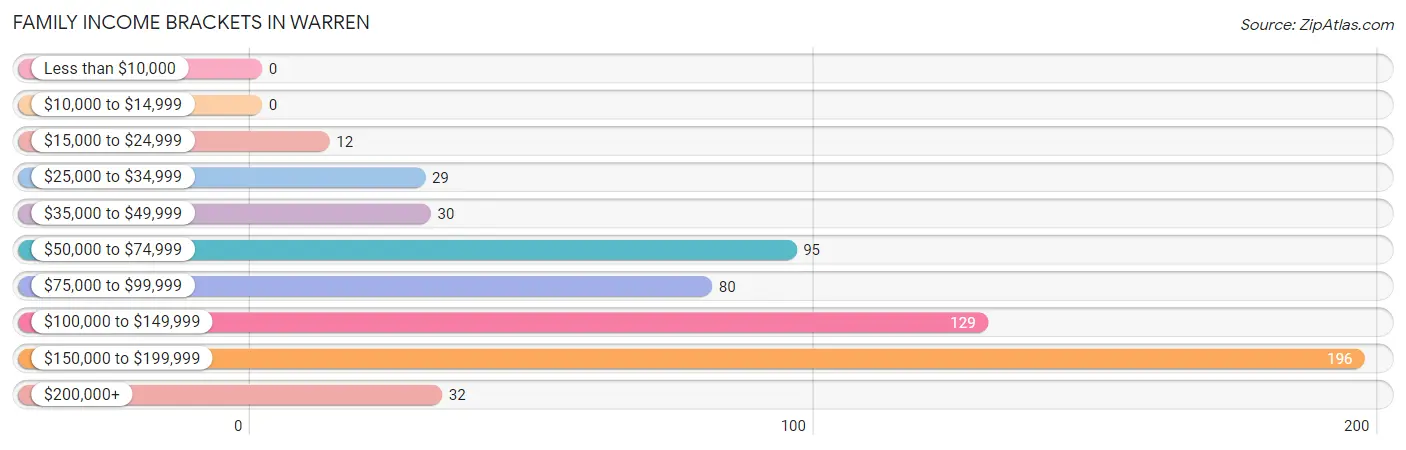
| Income Bracket | # Families | % Families |
| Less than $10,000 | 0 | 0.0% |
| $10,000 to $14,999 | 0 | 0.0% |
| $15,000 to $24,999 | 12 | 2.0% |
| $25,000 to $34,999 | 29 | 4.8% |
| $35,000 to $49,999 | 30 | 5.0% |
| $50,000 to $74,999 | 95 | 15.8% |
| $75,000 to $99,999 | 80 | 13.3% |
| $100,000 to $149,999 | 129 | 21.4% |
| $150,000 to $199,999 | 196 | 32.5% |
| $200,000+ | 32 | 5.3% |
Family Income by Famaliy Size in Warren
3-person families (35 | 5.8%) account for the highest median family income in Warren with $137,404 per family, while 2-person families (457 | 75.8%) have the highest median income of $50,483 per family member.
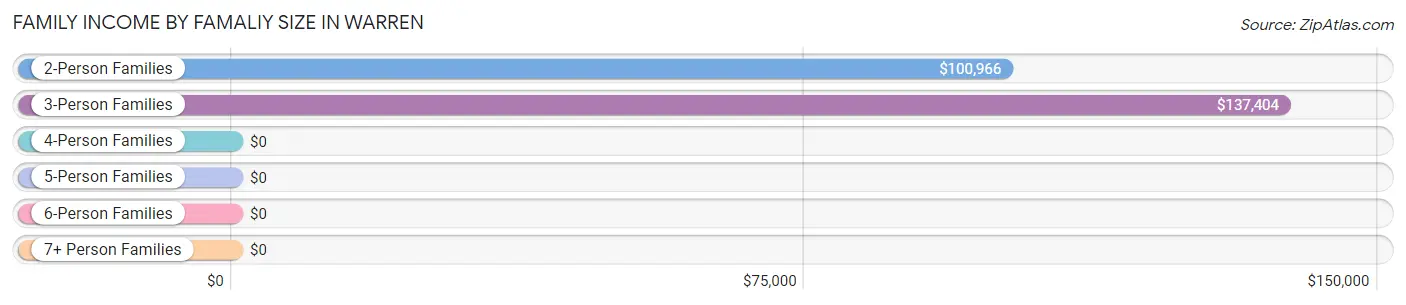
| Income Bracket | # Families | Median Income |
| 2-Person Families | 457 (75.8%) | $100,966 |
| 3-Person Families | 35 (5.8%) | $137,404 |
| 4-Person Families | 111 (18.4%) | $0 |
| 5-Person Families | 0 (0.0%) | $0 |
| 6-Person Families | 0 (0.0%) | $0 |
| 7+ Person Families | 0 (0.0%) | $0 |
| Total | 603 (100.0%) | $110,417 |
Family Income by Number of Earners in Warren
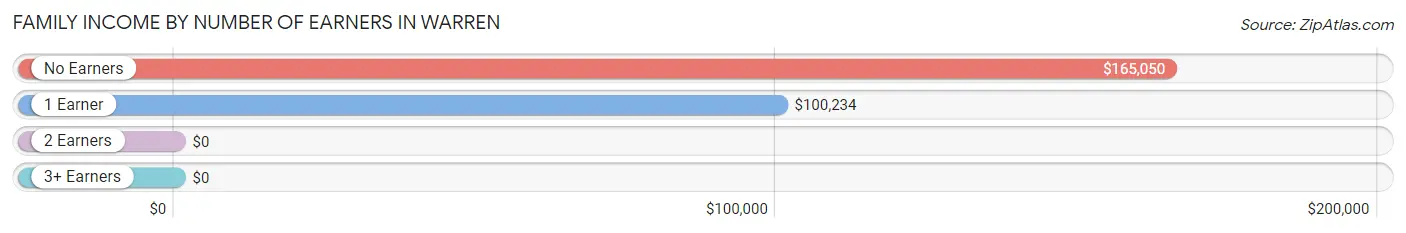
| Number of Earners | # Families | Median Income |
| No Earners | 271 (44.9%) | $165,050 |
| 1 Earner | 134 (22.2%) | $100,234 |
| 2 Earners | 179 (29.7%) | $0 |
| 3+ Earners | 19 (3.2%) | $0 |
| Total | 603 (100.0%) | $110,417 |
Household Income in Warren
Household Income Brackets in Warren
With 196 households falling in the category, the $150,000 to $199,999 income range is the most frequent in Warren, accounting for 24.8% of all households.
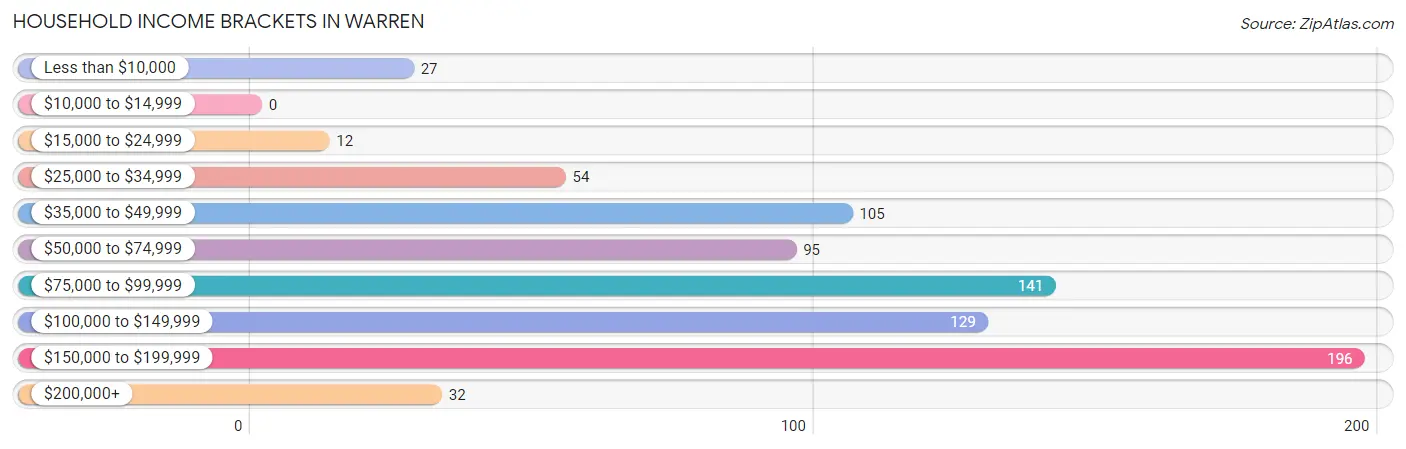
| Income Bracket | # Households | % Households |
| Less than $10,000 | 27 | 3.4% |
| $10,000 to $14,999 | 0 | 0.0% |
| $15,000 to $24,999 | 12 | 1.5% |
| $25,000 to $34,999 | 54 | 6.8% |
| $35,000 to $49,999 | 105 | 13.3% |
| $50,000 to $74,999 | 95 | 12.0% |
| $75,000 to $99,999 | 141 | 17.8% |
| $100,000 to $149,999 | 129 | 16.3% |
| $150,000 to $199,999 | 196 | 24.8% |
| $200,000+ | 32 | 4.0% |
Household Income by Householder Age in Warren
The median household income in Warren is $95,708, with the highest median household income of $100,742 found in the 25 to 44 years age bracket for the primary householder. A total of 113 households (14.3%) fall into this category.
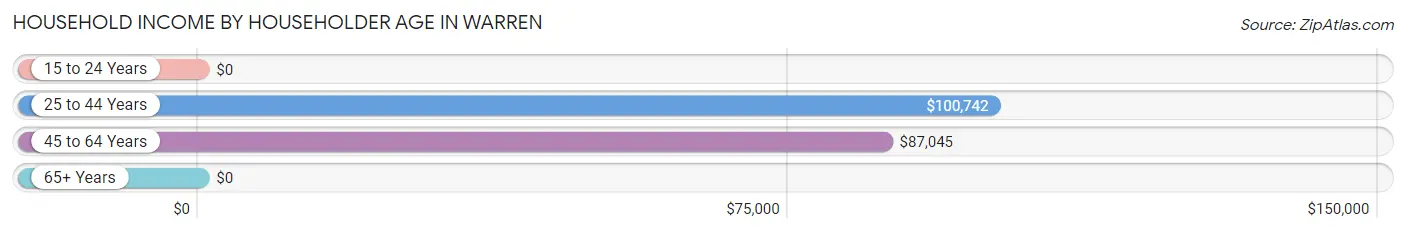
| Income Bracket | # Households | Median Income |
| 15 to 24 Years | 0 (0.0%) | $0 |
| 25 to 44 Years | 113 (14.3%) | $100,742 |
| 45 to 64 Years | 300 (37.9%) | $87,045 |
| 65+ Years | 378 (47.8%) | $0 |
| Total | 791 (100.0%) | $95,708 |
Poverty in Warren
Income Below Poverty by Sex and Age in Warren
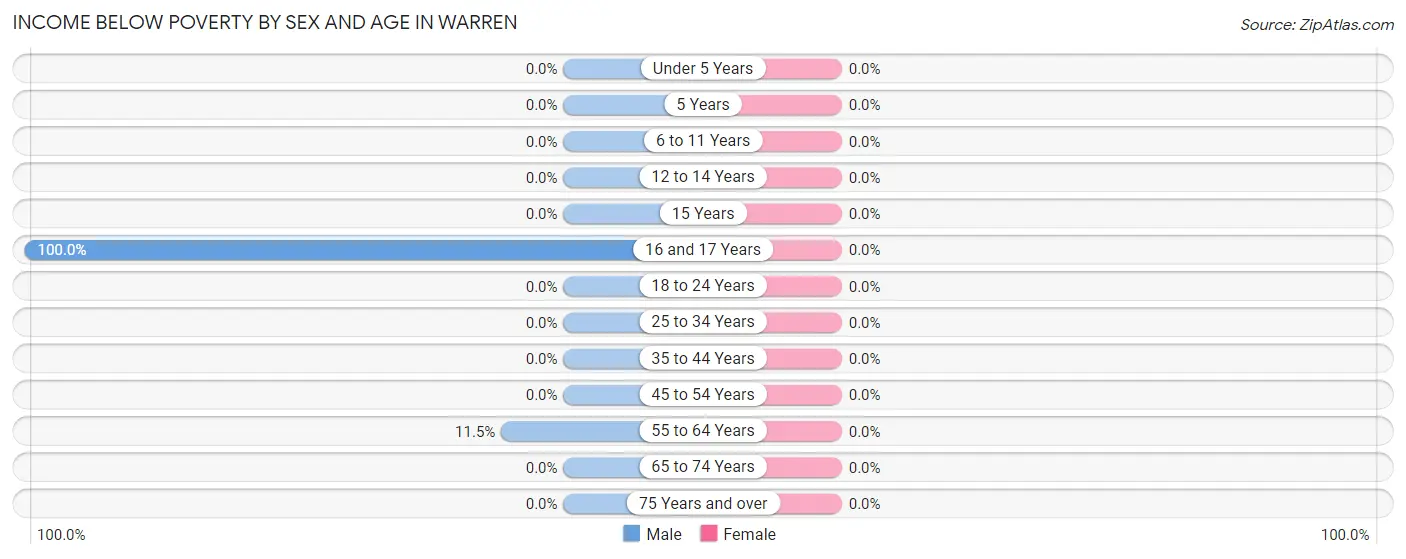
| Age Bracket | Male | Female |
| Under 5 Years | 0 (0.0%) | 0 (0.0%) |
| 5 Years | 0 (0.0%) | 0 (0.0%) |
| 6 to 11 Years | 0 (0.0%) | 0 (0.0%) |
| 12 to 14 Years | 0 (0.0%) | 0 (0.0%) |
| 15 Years | 0 (0.0%) | 0 (0.0%) |
| 16 and 17 Years | 20 (100.0%) | 0 (0.0%) |
| 18 to 24 Years | 0 (0.0%) | 0 (0.0%) |
| 25 to 34 Years | 0 (0.0%) | 0 (0.0%) |
| 35 to 44 Years | 0 (0.0%) | 0 (0.0%) |
| 45 to 54 Years | 0 (0.0%) | 0 (0.0%) |
| 55 to 64 Years | 27 (11.5%) | 0 (0.0%) |
| 65 to 74 Years | 0 (0.0%) | 0 (0.0%) |
| 75 Years and over | 0 (0.0%) | 0 (0.0%) |
| Total | 47 (4.8%) | 0 (0.0%) |
Income Above Poverty by Sex and Age in Warren
According to the poverty statistics in Warren, males aged under 5 years and females aged under 5 years are the age groups that are most secure financially, with 100.0% of males and 100.0% of females in these age groups living above the poverty line.
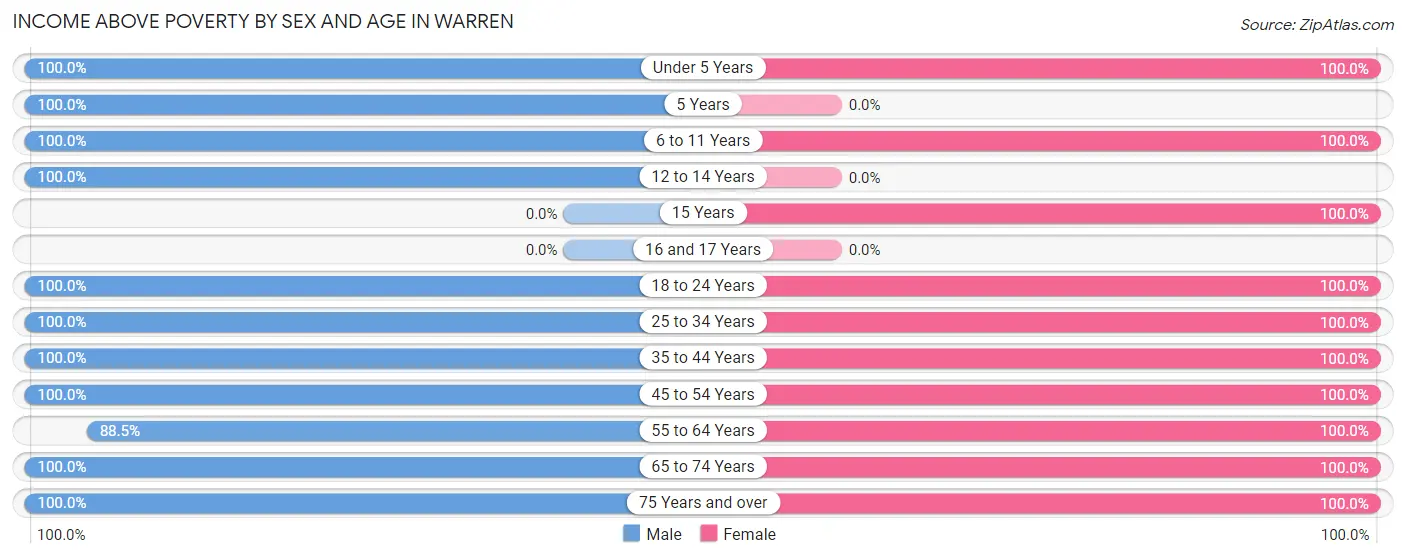
| Age Bracket | Male | Female |
| Under 5 Years | 19 (100.0%) | 13 (100.0%) |
| 5 Years | 25 (100.0%) | 0 (0.0%) |
| 6 to 11 Years | 44 (100.0%) | 17 (100.0%) |
| 12 to 14 Years | 37 (100.0%) | 0 (0.0%) |
| 15 Years | 0 (0.0%) | 12 (100.0%) |
| 16 and 17 Years | 0 (0.0%) | 0 (0.0%) |
| 18 to 24 Years | 38 (100.0%) | 16 (100.0%) |
| 25 to 34 Years | 102 (100.0%) | 44 (100.0%) |
| 35 to 44 Years | 34 (100.0%) | 62 (100.0%) |
| 45 to 54 Years | 49 (100.0%) | 114 (100.0%) |
| 55 to 64 Years | 207 (88.5%) | 166 (100.0%) |
| 65 to 74 Years | 208 (100.0%) | 137 (100.0%) |
| 75 Years and over | 176 (100.0%) | 41 (100.0%) |
| Total | 939 (95.2%) | 622 (100.0%) |
Income Below Poverty Among Married-Couple Families in Warren
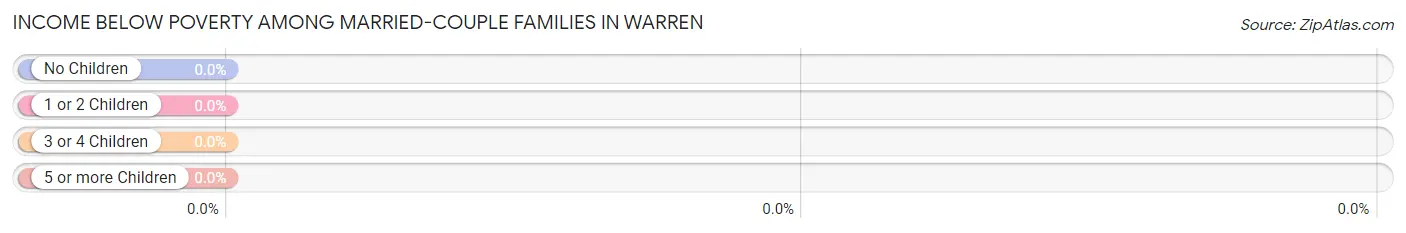
| Children | Above Poverty | Below Poverty |
| No Children | 511 (100.0%) | 0 (0.0%) |
| 1 or 2 Children | 92 (100.0%) | 0 (0.0%) |
| 3 or 4 Children | 0 (0.0%) | 0 (0.0%) |
| 5 or more Children | 0 (0.0%) | 0 (0.0%) |
| Total | 603 (100.0%) | 0 (0.0%) |
Income Below Poverty Among Single-Parent Households in Warren
| Children | Single Father | Single Mother |
| No Children | 0 (0.0%) | 0 (0.0%) |
| 1 or 2 Children | 0 (0.0%) | 0 (0.0%) |
| 3 or 4 Children | 0 (0.0%) | 0 (0.0%) |
| 5 or more Children | 0 (0.0%) | 0 (0.0%) |
| Total | 0 (0.0%) | 0 (0.0%) |
Income Below Poverty Among Married-Couple vs Single-Parent Households in Warren
| Children | Married-Couple Families | Single-Parent Households |
| No Children | 0 (0.0%) | 0 (0.0%) |
| 1 or 2 Children | 0 (0.0%) | 0 (0.0%) |
| 3 or 4 Children | 0 (0.0%) | 0 (0.0%) |
| 5 or more Children | 0 (0.0%) | 0 (0.0%) |
| Total | 0 (0.0%) | 0 (0.0%) |
Race in Warren
The most populous races in Warren are White / Caucasian (1,468 | 91.3%), Hispanic or Latino (163 | 10.1%), and Two or more Races (140 | 8.7%).
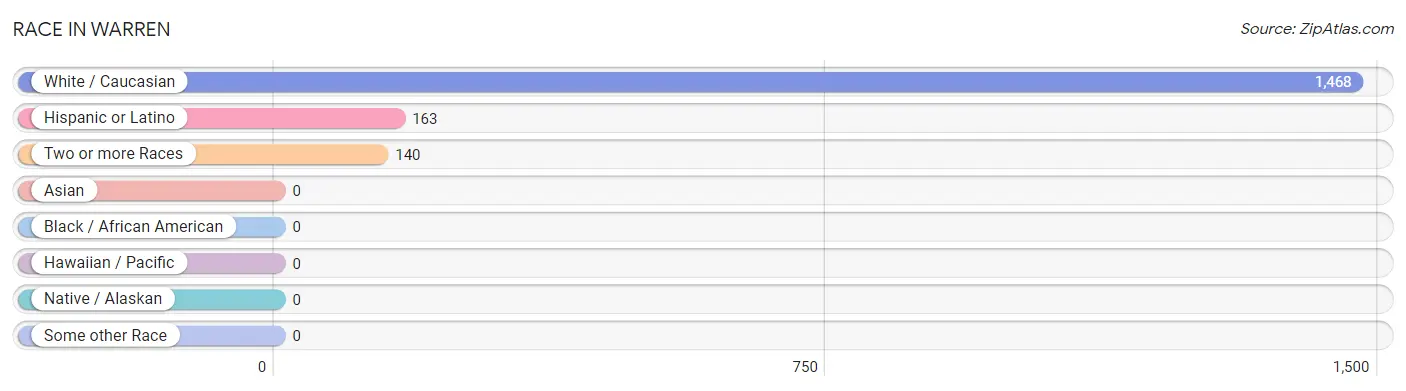
| Race | # Population | % Population |
| Asian | 0 | 0.0% |
| Black / African American | 0 | 0.0% |
| Hawaiian / Pacific | 0 | 0.0% |
| Hispanic or Latino | 163 | 10.1% |
| Native / Alaskan | 0 | 0.0% |
| White / Caucasian | 1,468 | 91.3% |
| Two or more Races | 140 | 8.7% |
| Some other Race | 0 | 0.0% |
| Total | 1,608 | 100.0% |
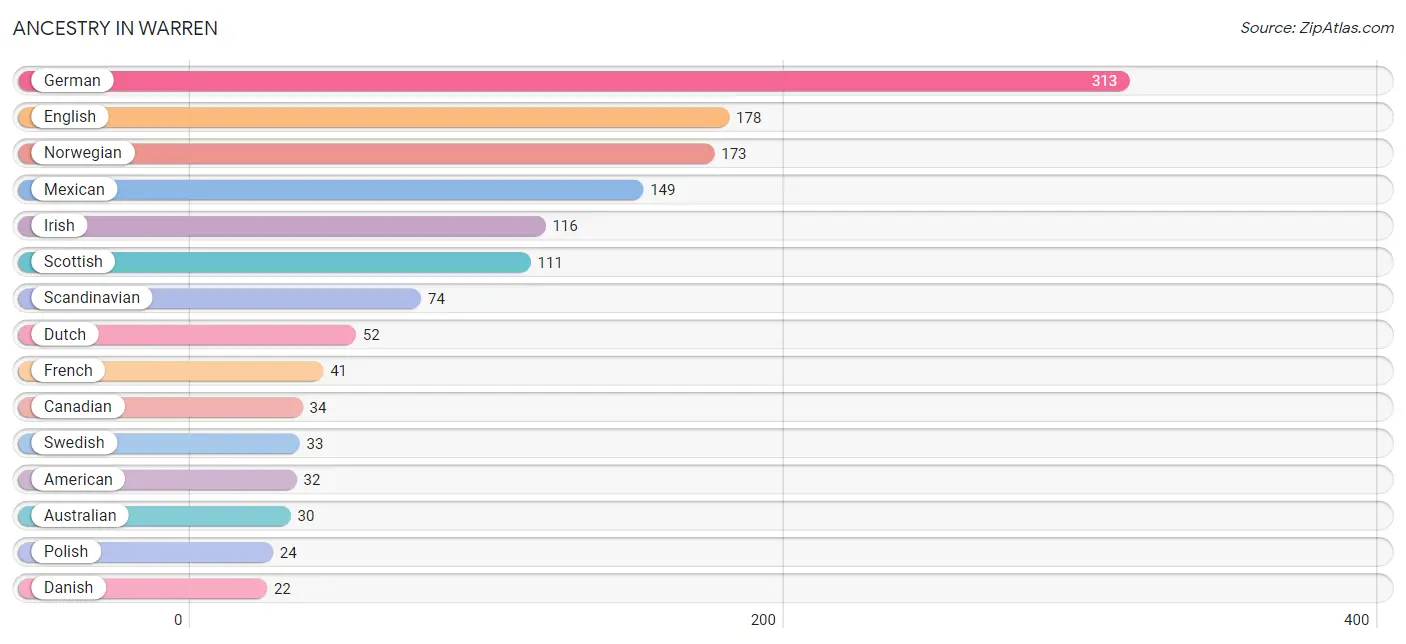
Ancestry in Warren
The most populous ancestries reported in Warren are German (313 | 19.5%), English (178 | 11.1%), Norwegian (173 | 10.8%), Mexican (149 | 9.3%), and Irish (116 | 7.2%), together accounting for 57.8% of all Warren residents.
| Ancestry | # Population | % Population |
| American | 32 | 2.0% |
| Australian | 30 | 1.9% |
| Canadian | 34 | 2.1% |
| Danish | 22 | 1.4% |
| Dutch | 52 | 3.2% |
| English | 178 | 11.1% |
| Finnish | 19 | 1.2% |
| French | 41 | 2.5% |
| French Canadian | 11 | 0.7% |
| German | 313 | 19.5% |
| Greek | 13 | 0.8% |
| Irish | 116 | 7.2% |
| Mexican | 149 | 9.3% |
| Norwegian | 173 | 10.8% |
| Polish | 24 | 1.5% |
| Scandinavian | 74 | 4.6% |
| Scottish | 111 | 6.9% |
| Spanish | 14 | 0.9% |
| Swedish | 33 | 2.1% |
| Welsh | 11 | 0.7% |
| Yugoslavian | 10 | 0.6% | View All 21 Rows |
Immigrants in Warren
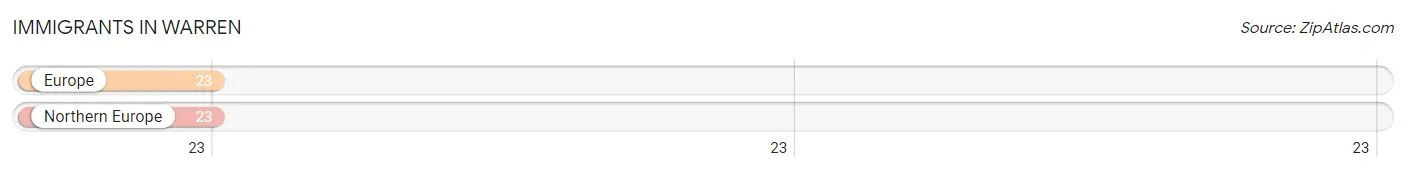
The most numerous immigrant groups reported in Warren came from Europe (23 | 1.4%), and Northern Europe (23 | 1.4%), together accounting for 2.9% of all Warren residents.
| Immigration Origin | # Population | % Population |
| Europe | 23 | 1.4% |
| Northern Europe | 23 | 1.4% | View All 2 Rows |
Sex and Age in Warren
Sex and Age in Warren
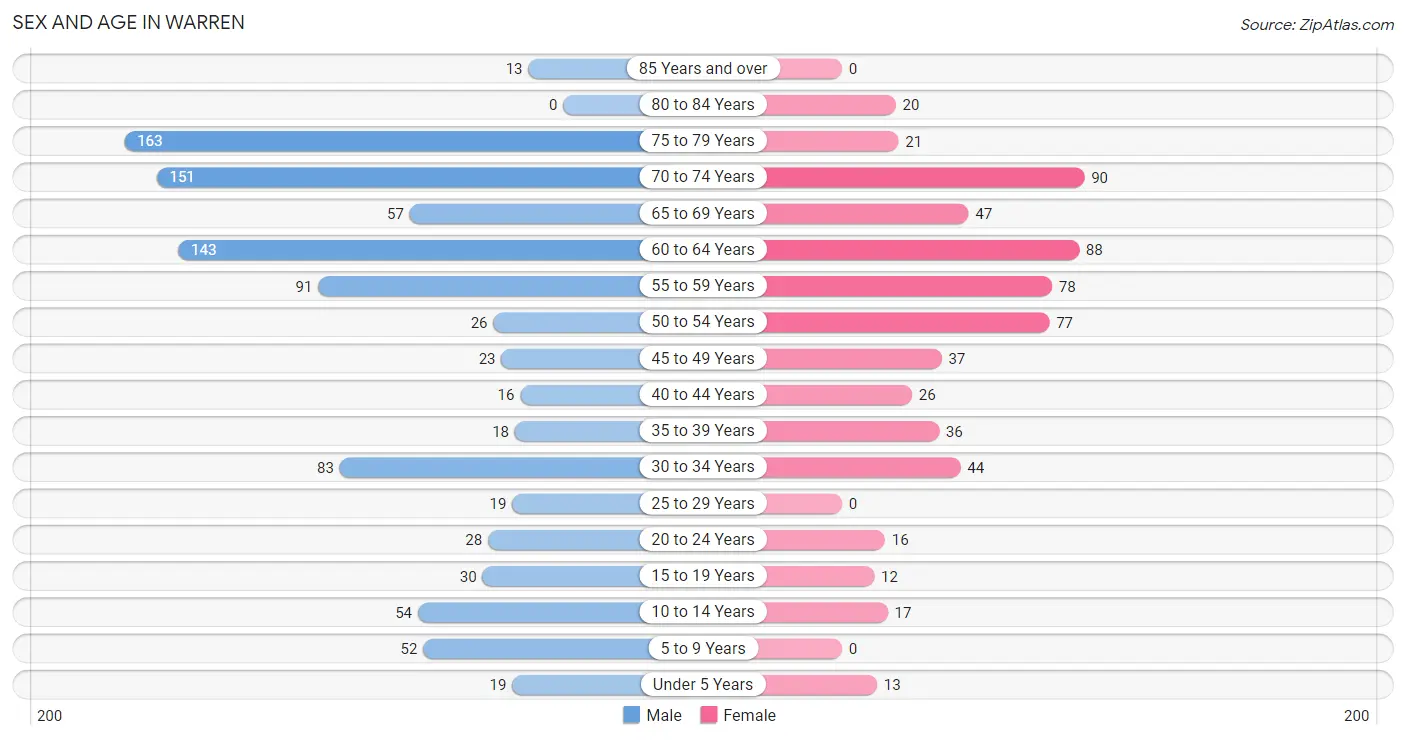
The most populous age groups in Warren are 75 to 79 Years (163 | 16.5%) for men and 70 to 74 Years (90 | 14.5%) for women.
| Age Bracket | Male | Female |
| Under 5 Years | 19 (1.9%) | 13 (2.1%) |
| 5 to 9 Years | 52 (5.3%) | 0 (0.0%) |
| 10 to 14 Years | 54 (5.5%) | 17 (2.7%) |
| 15 to 19 Years | 30 (3.0%) | 12 (1.9%) |
| 20 to 24 Years | 28 (2.8%) | 16 (2.6%) |
| 25 to 29 Years | 19 (1.9%) | 0 (0.0%) |
| 30 to 34 Years | 83 (8.4%) | 44 (7.1%) |
| 35 to 39 Years | 18 (1.8%) | 36 (5.8%) |
| 40 to 44 Years | 16 (1.6%) | 26 (4.2%) |
| 45 to 49 Years | 23 (2.3%) | 37 (5.9%) |
| 50 to 54 Years | 26 (2.6%) | 77 (12.4%) |
| 55 to 59 Years | 91 (9.2%) | 78 (12.5%) |
| 60 to 64 Years | 143 (14.5%) | 88 (14.1%) |
| 65 to 69 Years | 57 (5.8%) | 47 (7.6%) |
| 70 to 74 Years | 151 (15.3%) | 90 (14.5%) |
| 75 to 79 Years | 163 (16.5%) | 21 (3.4%) |
| 80 to 84 Years | 0 (0.0%) | 20 (3.2%) |
| 85 Years and over | 13 (1.3%) | 0 (0.0%) |
| Total | 986 (100.0%) | 622 (100.0%) |
Families and Households in Warren
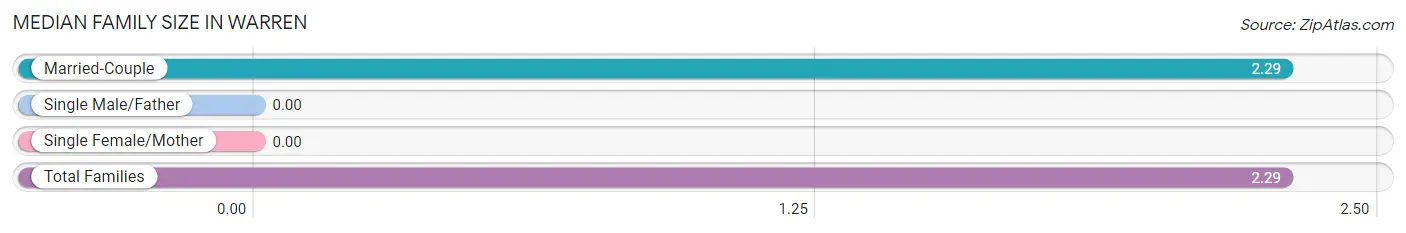
Median Family Size in Warren
| Family Type | # Families | Family Size |
| Married-Couple | 603 (100.0%) | 2.29 |
| Single Male/Father | 0 (0.0%) | - |
| Single Female/Mother | 0 (0.0%) | - |
| Total Families | 603 (100.0%) | 2.29 |
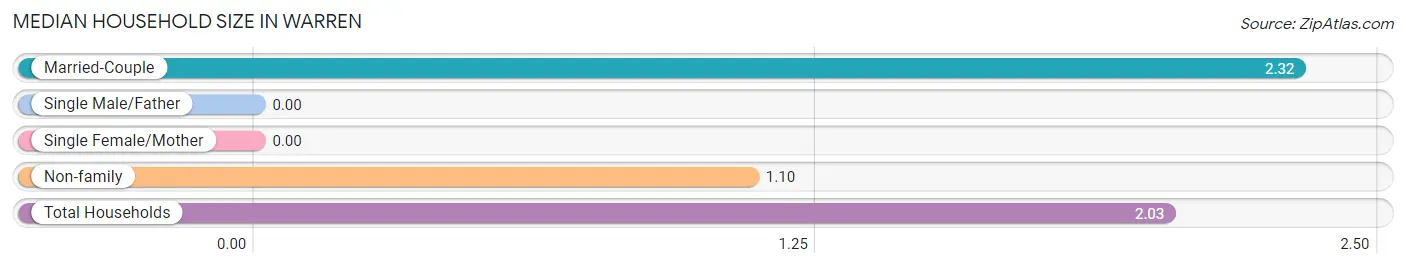
Median Household Size in Warren
| Household Type | # Households | Household Size |
| Married-Couple | 603 (76.2%) | 2.32 |
| Single Male/Father | 0 (0.0%) | - |
| Single Female/Mother | 0 (0.0%) | - |
| Non-family | 188 (23.8%) | 1.10 |
| Total Households | 791 (100.0%) | 2.03 |
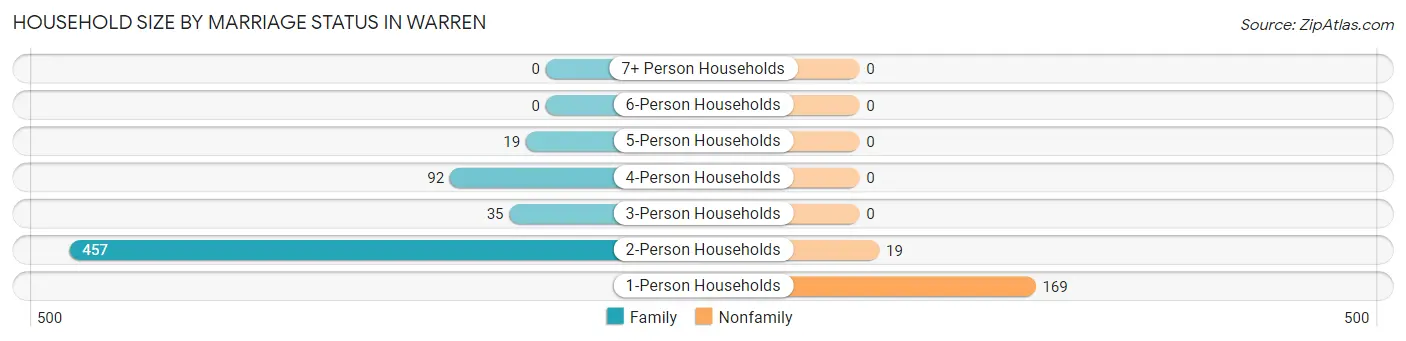
Household Size by Marriage Status in Warren
Out of a total of 791 households in Warren, 603 (76.2%) are family households, while 188 (23.8%) are nonfamily households. The most numerous type of family households are 2-person households, comprising 457, and the most common type of nonfamily households are 1-person households, comprising 169.
| Household Size | Family Households | Nonfamily Households |
| 1-Person Households | - | 169 (21.4%) |
| 2-Person Households | 457 (57.8%) | 19 (2.4%) |
| 3-Person Households | 35 (4.4%) | 0 (0.0%) |
| 4-Person Households | 92 (11.6%) | 0 (0.0%) |
| 5-Person Households | 19 (2.4%) | 0 (0.0%) |
| 6-Person Households | 0 (0.0%) | 0 (0.0%) |
| 7+ Person Households | 0 (0.0%) | 0 (0.0%) |
| Total | 603 (76.2%) | 188 (23.8%) |
Female Fertility in Warren
Fertility by Age in Warren
| Age Bracket | Women with Births | Births / 1,000 Women |
| 15 to 19 years | 0 (0.0%) | 0.0 |
| 20 to 34 years | 0 (0.0%) | 0.0 |
| 35 to 50 years | 0 (0.0%) | 0.0 |
| Total | 0 (0.0%) | 0.0 |
Fertility by Age by Marriage Status in Warren
| Age Bracket | Married | Unmarried |
| 15 to 19 years | 0 (0.0%) | 0 (0.0%) |
| 20 to 34 years | 0 (0.0%) | 0 (0.0%) |
| 35 to 50 years | 0 (0.0%) | 0 (0.0%) |
| Total | 0 (0.0%) | 0 (0.0%) |
Fertility by Education in Warren
| Educational Attainment | Women with Births | Births / 1,000 Women |
| Less than High School | 0 (0.0%) | 0.0 |
| High School Diploma | 0 (0.0%) | 0.0 |
| College or Associate's Degree | 0 (0.0%) | 0.0 |
| Bachelor's Degree | 0 (0.0%) | 0.0 |
| Graduate Degree | 0 (0.0%) | 0.0 |
| Total | 0 (0.0%) | 0.0 |
Fertility by Education by Marriage Status in Warren
| Educational Attainment | Married | Unmarried |
| Less than High School | 0 (0.0%) | 0 (0.0%) |
| High School Diploma | 0 (0.0%) | 0 (0.0%) |
| College or Associate's Degree | 0 (0.0%) | 0 (0.0%) |
| Bachelor's Degree | 0 (0.0%) | 0 (0.0%) |
| Graduate Degree | 0 (0.0%) | 0 (0.0%) |
| Total | 0 (0.0%) | 0 (0.0%) |
Employment Characteristics in Warren
Employment by Class of Employer in Warren
Among the 594 employed individuals in Warren, private company employees (422 | 71.0%), local government employees (89 | 15.0%), and self-employed (incorporated) (41 | 6.9%) make up the most common classes of employment.
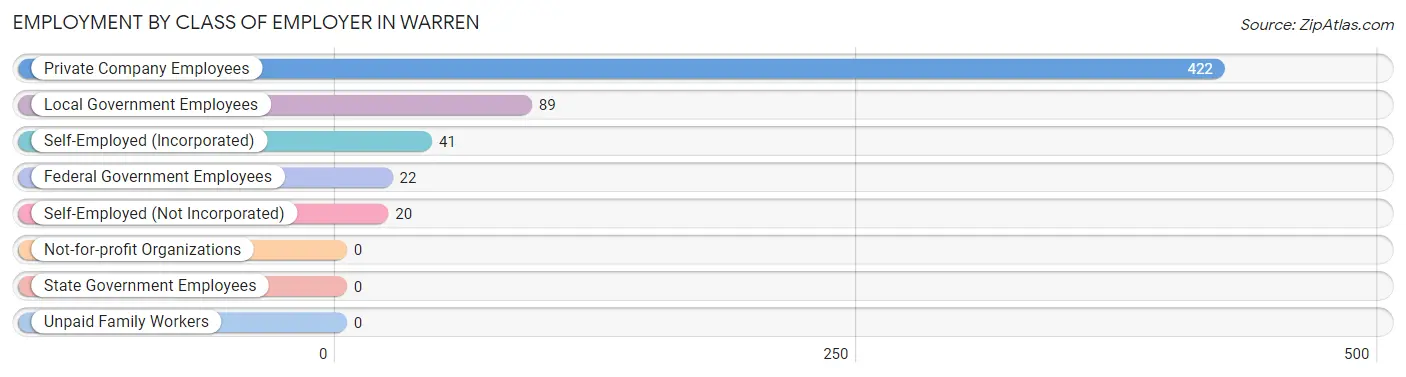
| Employer Class | # Employees | % Employees |
| Private Company Employees | 422 | 71.0% |
| Self-Employed (Incorporated) | 41 | 6.9% |
| Self-Employed (Not Incorporated) | 20 | 3.4% |
| Not-for-profit Organizations | 0 | 0.0% |
| Local Government Employees | 89 | 15.0% |
| State Government Employees | 0 | 0.0% |
| Federal Government Employees | 22 | 3.7% |
| Unpaid Family Workers | 0 | 0.0% |
| Total | 594 | 100.0% |
Employment Status by Age in Warren
According to the labor force statistics for Warren, out of the total population over 16 years of age (1,441), 42.6% or 614 individuals are in the labor force, with 3.3% or 20 of them unemployed. The age group with the highest labor force participation rate is 35 to 44 years, with 89.6% or 86 individuals in the labor force. Within the labor force, the 45 to 54 years age range has the highest percentage of unemployed individuals, with 14.0% or 20 of them being unemployed.
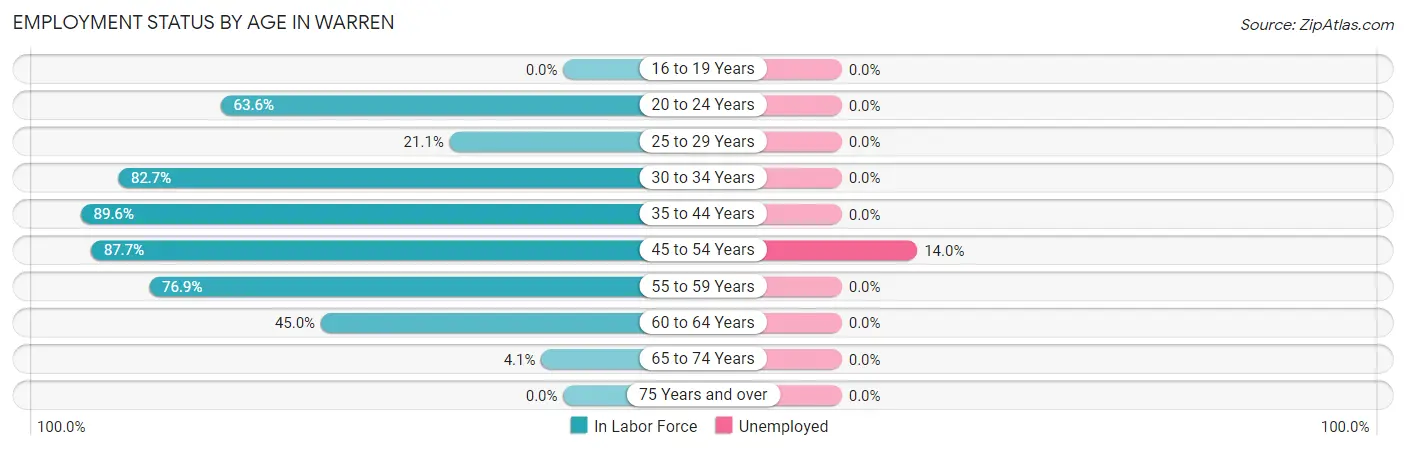
| Age Bracket | In Labor Force | Unemployed |
| 16 to 19 Years | 0 (0.0%) | 0 (0.0%) |
| 20 to 24 Years | 28 (63.6%) | 0 (0.0%) |
| 25 to 29 Years | 4 (21.1%) | 0 (0.0%) |
| 30 to 34 Years | 105 (82.7%) | 0 (0.0%) |
| 35 to 44 Years | 86 (89.6%) | 0 (0.0%) |
| 45 to 54 Years | 143 (87.7%) | 20 (14.0%) |
| 55 to 59 Years | 130 (76.9%) | 0 (0.0%) |
| 60 to 64 Years | 104 (45.0%) | 0 (0.0%) |
| 65 to 74 Years | 14 (4.1%) | 0 (0.0%) |
| 75 Years and over | 0 (0.0%) | 0 (0.0%) |
| Total | 614 (42.6%) | 20 (3.3%) |
Employment Status by Educational Attainment in Warren
According to labor force statistics for Warren, 71.1% of individuals (572) out of the total population between 25 and 64 years of age (805) are in the labor force, with 3.5% or 20 of them being unemployed. The group with the highest labor force participation rate are those with the educational attainment of bachelor's degree or higher, with 84.4% or 232 individuals in the labor force. Within the labor force, individuals with college / associate degree education have the highest percentage of unemployment, with 9.3% or 20 of them being unemployed.
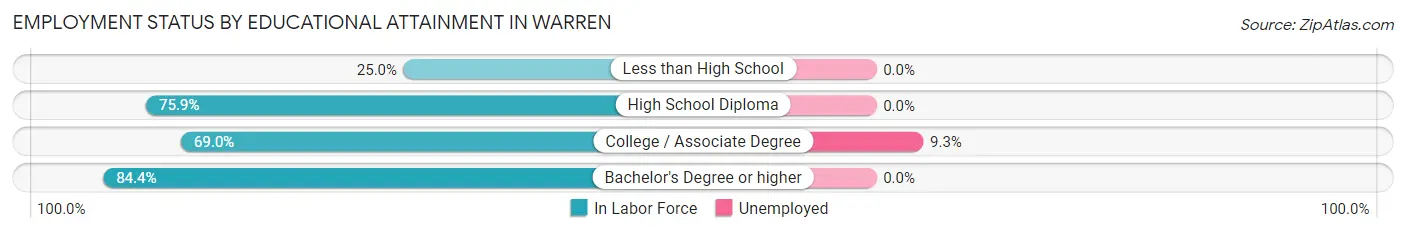
| Educational Attainment | In Labor Force | Unemployed |
| Less than High School | 20 (25.0%) | 0 (0.0%) |
| High School Diploma | 104 (75.9%) | 0 (0.0%) |
| College / Associate Degree | 216 (69.0%) | 29 (9.3%) |
| Bachelor's Degree or higher | 232 (84.4%) | 0 (0.0%) |
| Total | 572 (71.1%) | 28 (3.5%) |
Employment Occupations by Sex in Warren
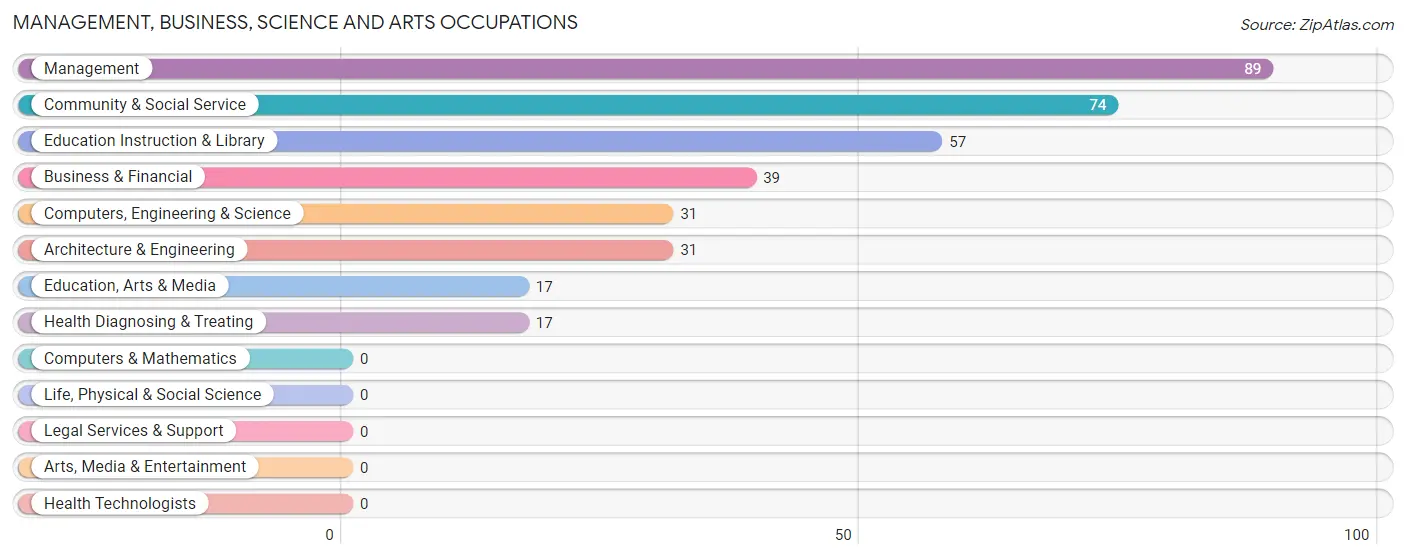
Management, Business, Science and Arts Occupations
The most common Management, Business, Science and Arts occupations in Warren are Management (89 | 15.0%), Community & Social Service (74 | 12.5%), Education Instruction & Library (57 | 9.6%), Business & Financial (39 | 6.6%), and Computers, Engineering & Science (31 | 5.2%).
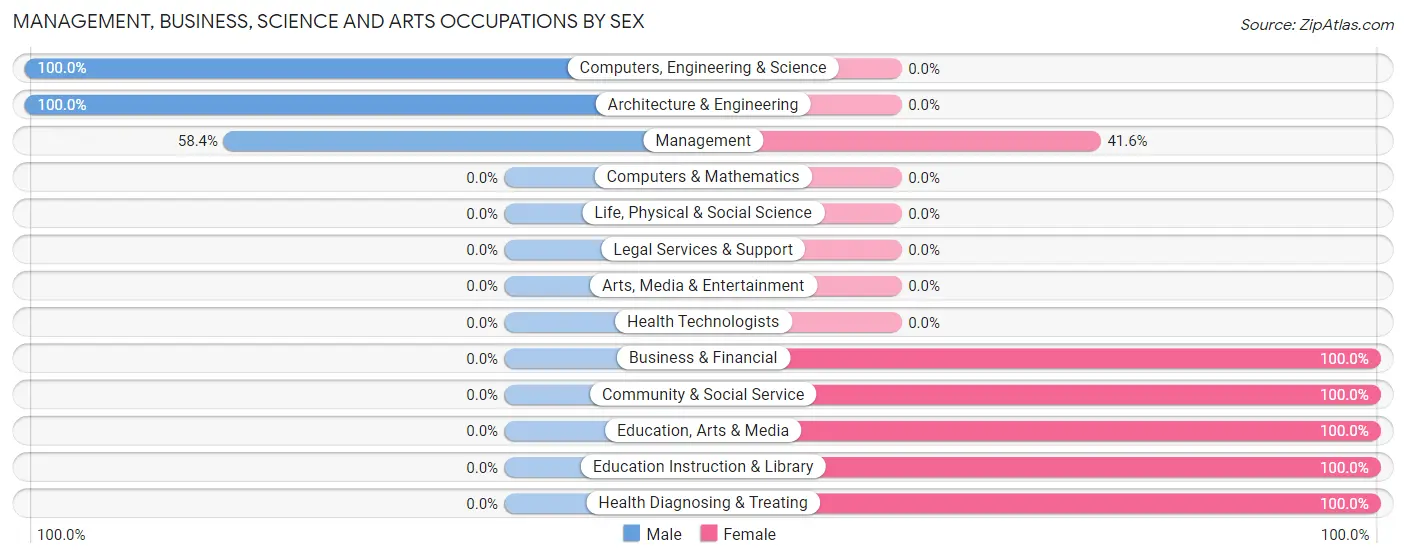
Management, Business, Science and Arts Occupations by Sex
Within the Management, Business, Science and Arts occupations in Warren, the most male-oriented occupations are Computers, Engineering & Science (100.0%), Architecture & Engineering (100.0%), and Management (58.4%), while the most female-oriented occupations are Business & Financial (100.0%), Community & Social Service (100.0%), and Education, Arts & Media (100.0%).
| Occupation | Male | Female |
| Management | 52 (58.4%) | 37 (41.6%) |
| Business & Financial | 0 (0.0%) | 39 (100.0%) |
| Computers, Engineering & Science | 31 (100.0%) | 0 (0.0%) |
| Computers & Mathematics | 0 (0.0%) | 0 (0.0%) |
| Architecture & Engineering | 31 (100.0%) | 0 (0.0%) |
| Life, Physical & Social Science | 0 (0.0%) | 0 (0.0%) |
| Community & Social Service | 0 (0.0%) | 74 (100.0%) |
| Education, Arts & Media | 0 (0.0%) | 17 (100.0%) |
| Legal Services & Support | 0 (0.0%) | 0 (0.0%) |
| Education Instruction & Library | 0 (0.0%) | 57 (100.0%) |
| Arts, Media & Entertainment | 0 (0.0%) | 0 (0.0%) |
| Health Diagnosing & Treating | 0 (0.0%) | 17 (100.0%) |
| Health Technologists | 0 (0.0%) | 0 (0.0%) |
| Total (Category) | 83 (33.2%) | 167 (66.8%) |
| Total (Overall) | 356 (59.9%) | 238 (40.1%) |
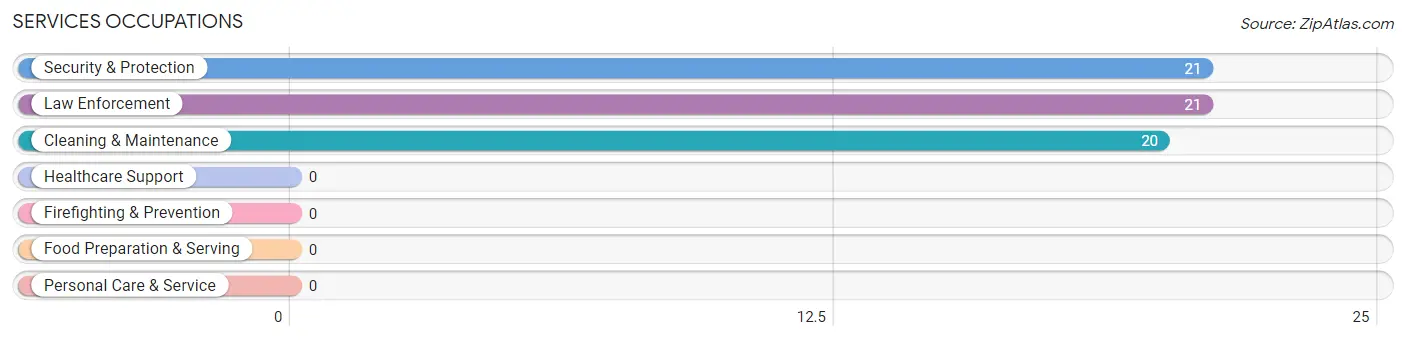
Services Occupations
The most common Services occupations in Warren are Security & Protection (21 | 3.5%), Law Enforcement (21 | 3.5%), and Cleaning & Maintenance (20 | 3.4%).
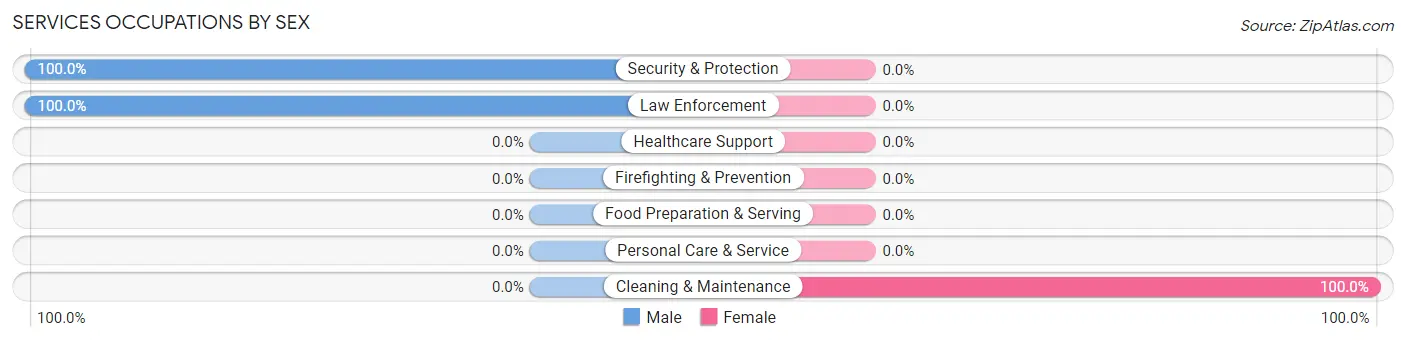
Services Occupations by Sex
| Occupation | Male | Female |
| Healthcare Support | 0 (0.0%) | 0 (0.0%) |
| Security & Protection | 21 (100.0%) | 0 (0.0%) |
| Firefighting & Prevention | 0 (0.0%) | 0 (0.0%) |
| Law Enforcement | 21 (100.0%) | 0 (0.0%) |
| Food Preparation & Serving | 0 (0.0%) | 0 (0.0%) |
| Cleaning & Maintenance | 0 (0.0%) | 20 (100.0%) |
| Personal Care & Service | 0 (0.0%) | 0 (0.0%) |
| Total (Category) | 21 (51.2%) | 20 (48.8%) |
| Total (Overall) | 356 (59.9%) | 238 (40.1%) |
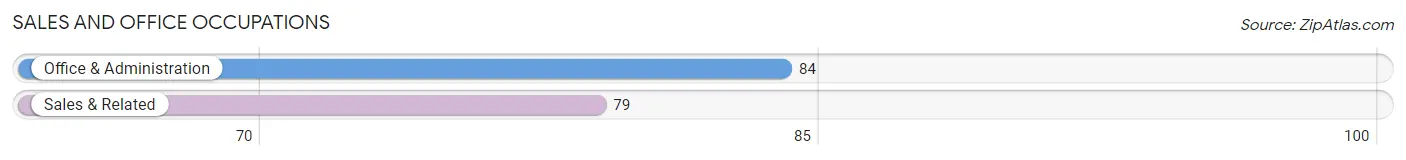
Sales and Office Occupations
The most common Sales and Office occupations in Warren are Office & Administration (84 | 14.1%), and Sales & Related (79 | 13.3%).
Sales and Office Occupations by Sex
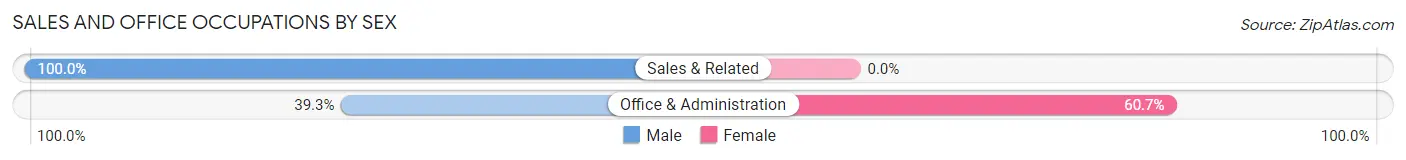
| Occupation | Male | Female |
| Sales & Related | 79 (100.0%) | 0 (0.0%) |
| Office & Administration | 33 (39.3%) | 51 (60.7%) |
| Total (Category) | 112 (68.7%) | 51 (31.3%) |
| Total (Overall) | 356 (59.9%) | 238 (40.1%) |
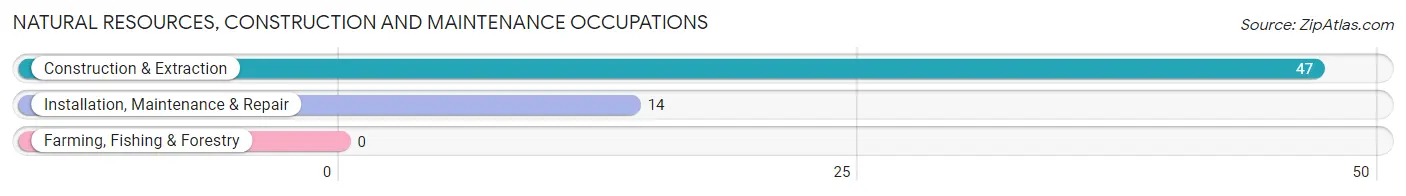
Natural Resources, Construction and Maintenance Occupations
The most common Natural Resources, Construction and Maintenance occupations in Warren are Construction & Extraction (47 | 7.9%), and Installation, Maintenance & Repair (14 | 2.4%).
Natural Resources, Construction and Maintenance Occupations by Sex
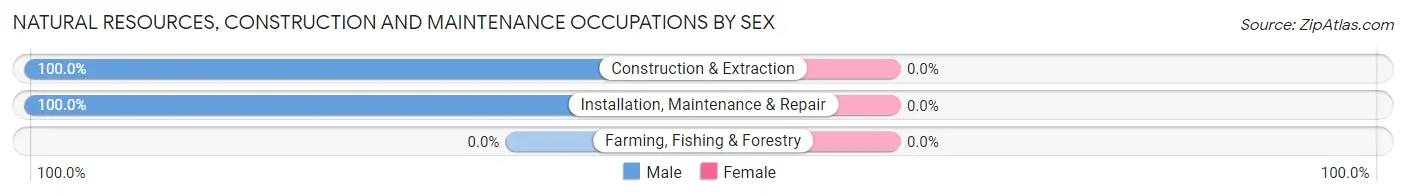
| Occupation | Male | Female |
| Farming, Fishing & Forestry | 0 (0.0%) | 0 (0.0%) |
| Construction & Extraction | 47 (100.0%) | 0 (0.0%) |
| Installation, Maintenance & Repair | 14 (100.0%) | 0 (0.0%) |
| Total (Category) | 61 (100.0%) | 0 (0.0%) |
| Total (Overall) | 356 (59.9%) | 238 (40.1%) |
Production, Transportation and Moving Occupations
The most common Production, Transportation and Moving occupations in Warren are Transportation (53 | 8.9%), and Production (26 | 4.4%).
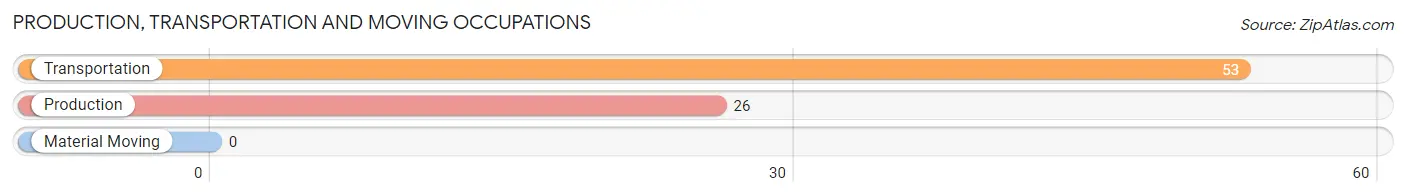
Production, Transportation and Moving Occupations by Sex
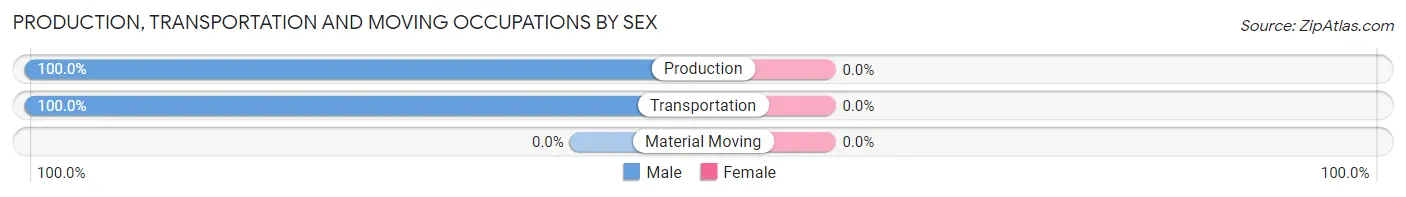
| Occupation | Male | Female |
| Production | 26 (100.0%) | 0 (0.0%) |
| Transportation | 53 (100.0%) | 0 (0.0%) |
| Material Moving | 0 (0.0%) | 0 (0.0%) |
| Total (Category) | 79 (100.0%) | 0 (0.0%) |
| Total (Overall) | 356 (59.9%) | 238 (40.1%) |
Employment Industries by Sex in Warren
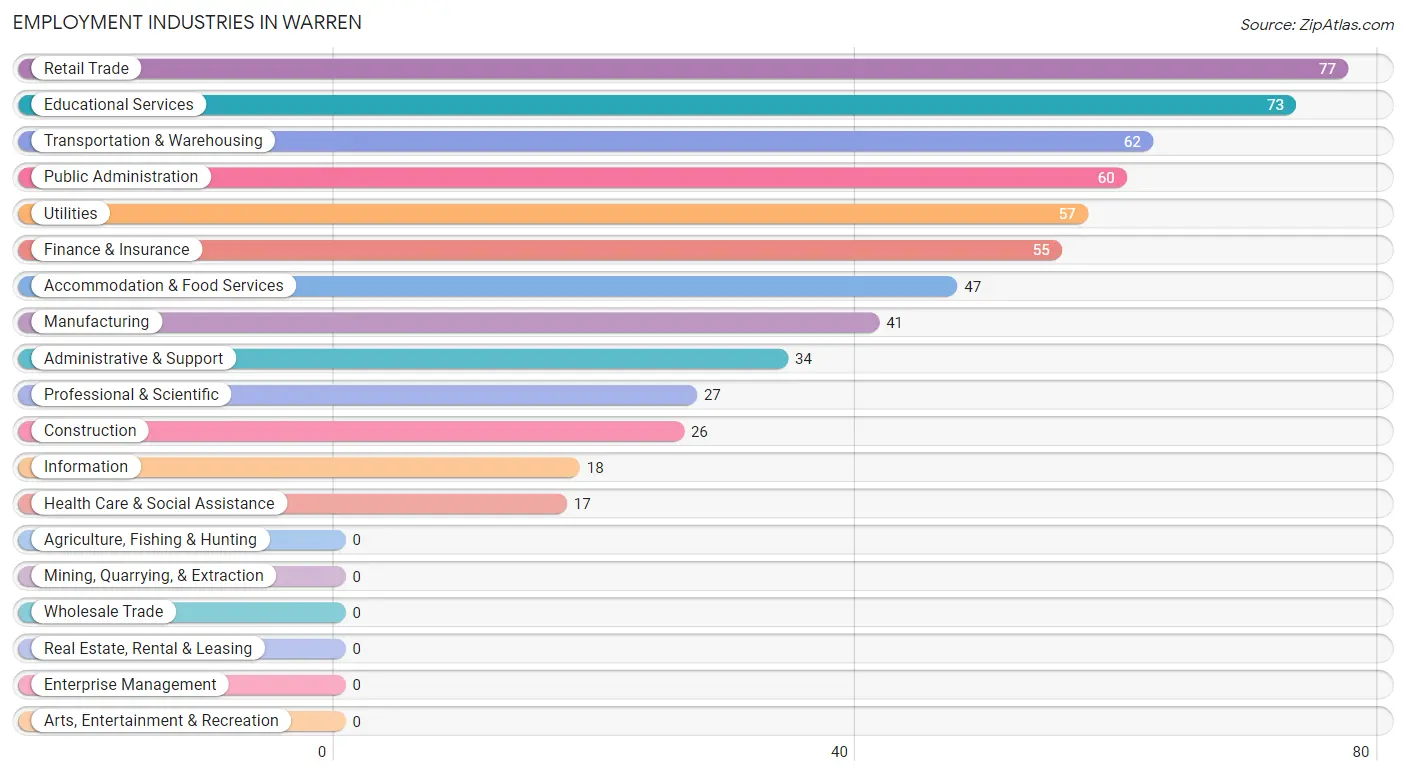
Employment Industries in Warren
The major employment industries in Warren include Retail Trade (77 | 13.0%), Educational Services (73 | 12.3%), Transportation & Warehousing (62 | 10.4%), Public Administration (60 | 10.1%), and Utilities (57 | 9.6%).
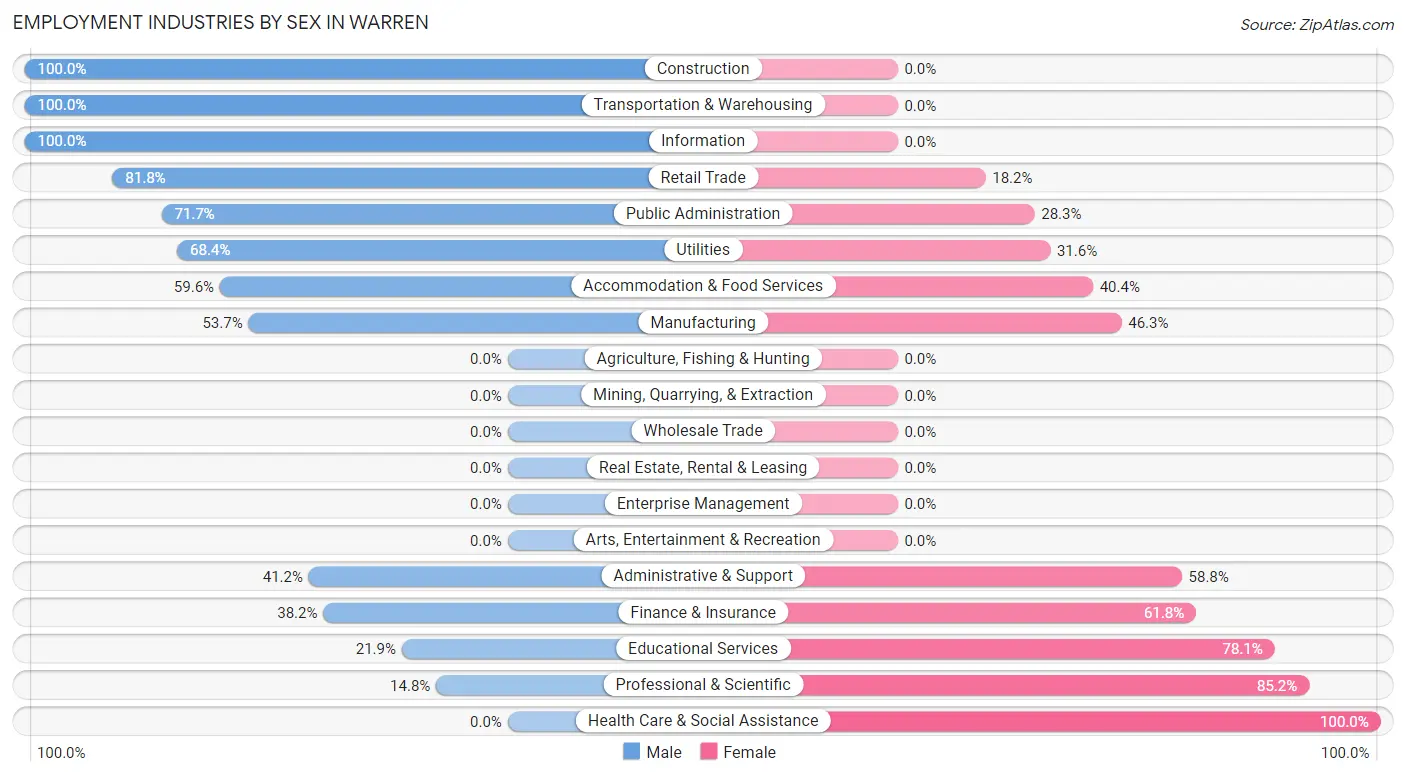
Employment Industries by Sex in Warren
The Warren industries that see more men than women are Construction (100.0%), Transportation & Warehousing (100.0%), and Information (100.0%), whereas the industries that tend to have a higher number of women are Health Care & Social Assistance (100.0%), Professional & Scientific (85.2%), and Educational Services (78.1%).
| Industry | Male | Female |
| Agriculture, Fishing & Hunting | 0 (0.0%) | 0 (0.0%) |
| Mining, Quarrying, & Extraction | 0 (0.0%) | 0 (0.0%) |
| Construction | 26 (100.0%) | 0 (0.0%) |
| Manufacturing | 22 (53.7%) | 19 (46.3%) |
| Wholesale Trade | 0 (0.0%) | 0 (0.0%) |
| Retail Trade | 63 (81.8%) | 14 (18.2%) |
| Transportation & Warehousing | 62 (100.0%) | 0 (0.0%) |
| Utilities | 39 (68.4%) | 18 (31.6%) |
| Information | 18 (100.0%) | 0 (0.0%) |
| Finance & Insurance | 21 (38.2%) | 34 (61.8%) |
| Real Estate, Rental & Leasing | 0 (0.0%) | 0 (0.0%) |
| Professional & Scientific | 4 (14.8%) | 23 (85.2%) |
| Enterprise Management | 0 (0.0%) | 0 (0.0%) |
| Administrative & Support | 14 (41.2%) | 20 (58.8%) |
| Educational Services | 16 (21.9%) | 57 (78.1%) |
| Health Care & Social Assistance | 0 (0.0%) | 17 (100.0%) |
| Arts, Entertainment & Recreation | 0 (0.0%) | 0 (0.0%) |
| Accommodation & Food Services | 28 (59.6%) | 19 (40.4%) |
| Public Administration | 43 (71.7%) | 17 (28.3%) |
| Total | 356 (59.9%) | 238 (40.1%) |
Education in Warren
School Enrollment in Warren
The most common levels of schooling among the 189 students in Warren are middle school (54 | 28.6%), elementary school (44 | 23.3%), and high school (42 | 22.2%).
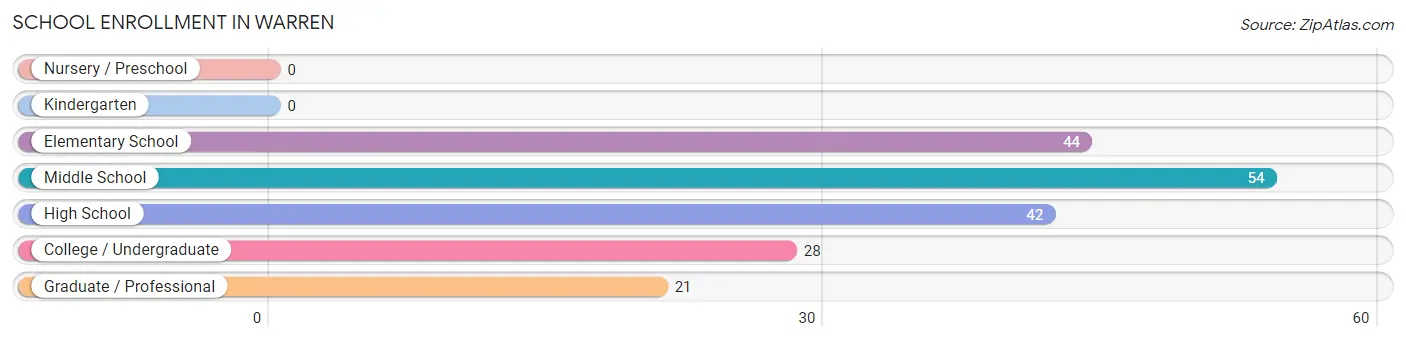
| School Level | # Students | % Students |
| Nursery / Preschool | 0 | 0.0% |
| Kindergarten | 0 | 0.0% |
| Elementary School | 44 | 23.3% |
| Middle School | 54 | 28.6% |
| High School | 42 | 22.2% |
| College / Undergraduate | 28 | 14.8% |
| Graduate / Professional | 21 | 11.1% |
| Total | 189 | 100.0% |
School Enrollment by Age by Funding Source in Warren
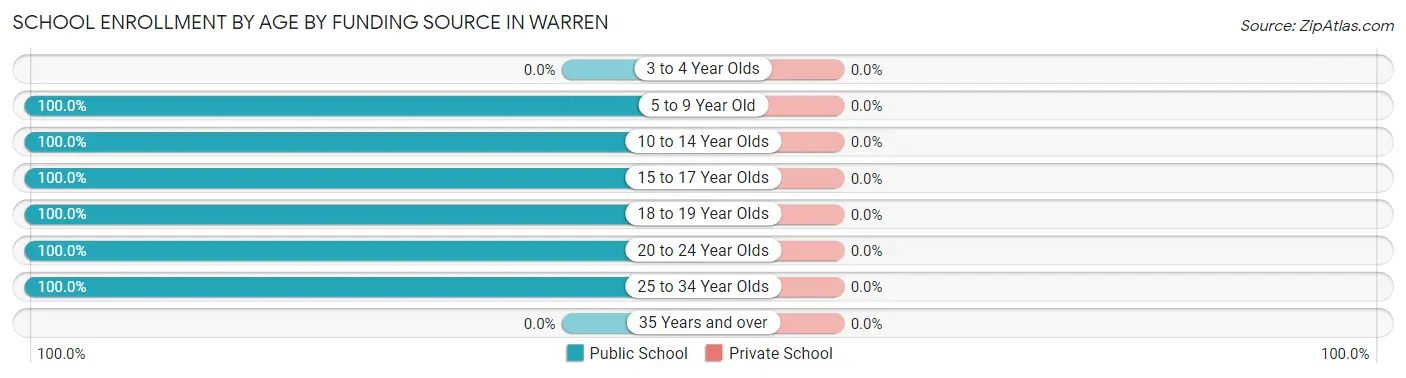
| Age Bracket | Public School | Private School |
| 3 to 4 Year Olds | 0 (0.0%) | 0 (0.0%) |
| 5 to 9 Year Old | 27 (100.0%) | 0 (0.0%) |
| 10 to 14 Year Olds | 71 (100.0%) | 0 (0.0%) |
| 15 to 17 Year Olds | 32 (100.0%) | 0 (0.0%) |
| 18 to 19 Year Olds | 10 (100.0%) | 0 (0.0%) |
| 20 to 24 Year Olds | 28 (100.0%) | 0 (0.0%) |
| 25 to 34 Year Olds | 21 (100.0%) | 0 (0.0%) |
| 35 Years and over | 0 (0.0%) | 0 (0.0%) |
| Total | 189 (100.0%) | 0 (0.0%) |
Educational Attainment by Field of Study in Warren
Business (242 | 45.1%), education (97 | 18.1%), arts & humanities (60 | 11.2%), social sciences (43 | 8.0%), and liberal arts & history (34 | 6.3%) are the most common fields of study among 537 individuals in Warren who have obtained a bachelor's degree or higher.
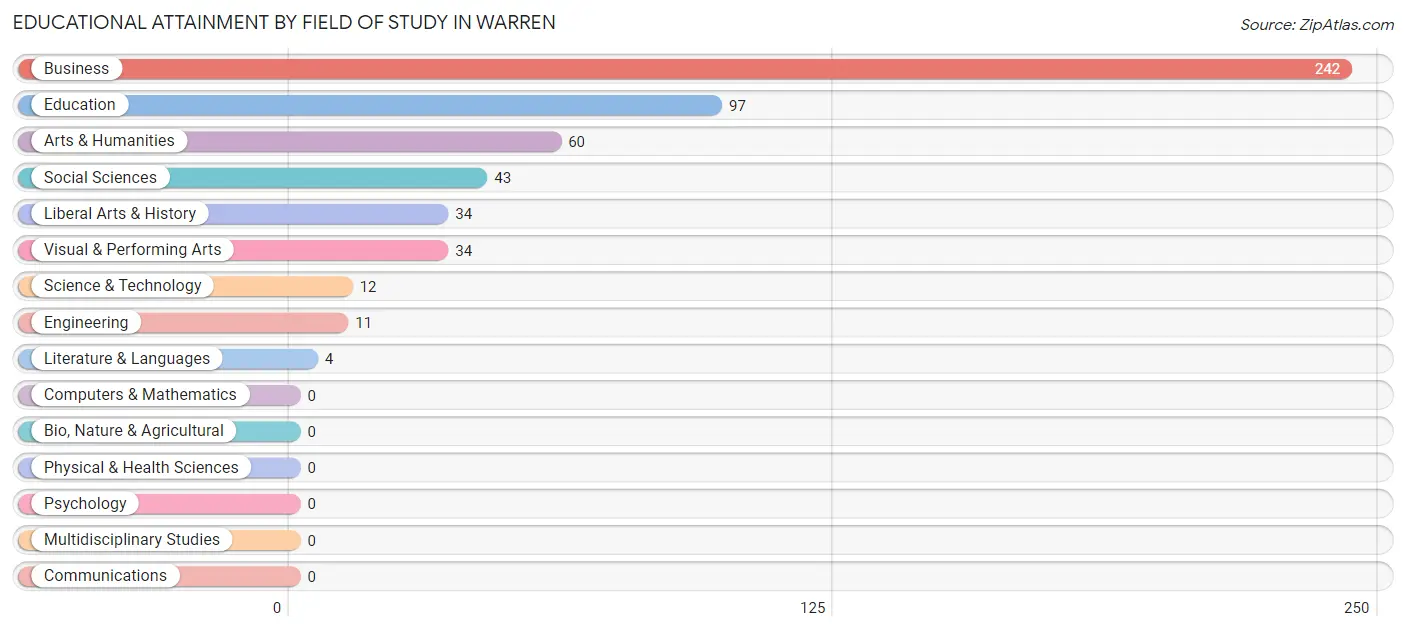
| Field of Study | # Graduates | % Graduates |
| Computers & Mathematics | 0 | 0.0% |
| Bio, Nature & Agricultural | 0 | 0.0% |
| Physical & Health Sciences | 0 | 0.0% |
| Psychology | 0 | 0.0% |
| Social Sciences | 43 | 8.0% |
| Engineering | 11 | 2.1% |
| Multidisciplinary Studies | 0 | 0.0% |
| Science & Technology | 12 | 2.2% |
| Business | 242 | 45.1% |
| Education | 97 | 18.1% |
| Literature & Languages | 4 | 0.7% |
| Liberal Arts & History | 34 | 6.3% |
| Visual & Performing Arts | 34 | 6.3% |
| Communications | 0 | 0.0% |
| Arts & Humanities | 60 | 11.2% |
| Total | 537 | 100.0% |
Transportation & Commute in Warren
Vehicle Availability by Sex in Warren
The most prevalent vehicle ownership categories in Warren are males with 3 vehicles (182, accounting for 51.1%) and females with 3 vehicles (97, making up 76.5%).
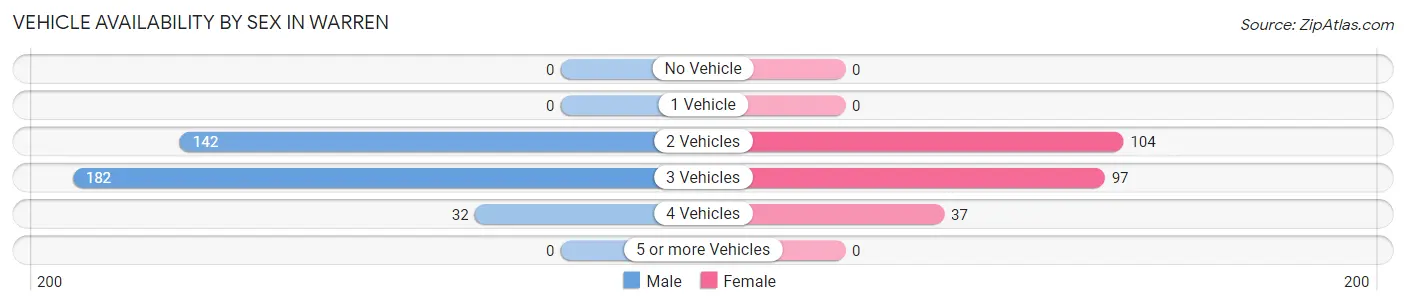
| Vehicles Available | Male | Female |
| No Vehicle | 0 (0.0%) | 0 (0.0%) |
| 1 Vehicle | 0 (0.0%) | 0 (0.0%) |
| 2 Vehicles | 142 (39.9%) | 104 (43.7%) |
| 3 Vehicles | 182 (51.1%) | 97 (40.8%) |
| 4 Vehicles | 32 (9.0%) | 37 (15.5%) |
| 5 or more Vehicles | 0 (0.0%) | 0 (0.0%) |
| Total | 356 (100.0%) | 238 (100.0%) |
Commute Time in Warren
The most frequently occuring commute durations in Warren are 45 to 59 minutes (129 commuters, 22.1%), 10 to 14 minutes (124 commuters, 21.2%), and 5 to 9 minutes (94 commuters, 16.1%).
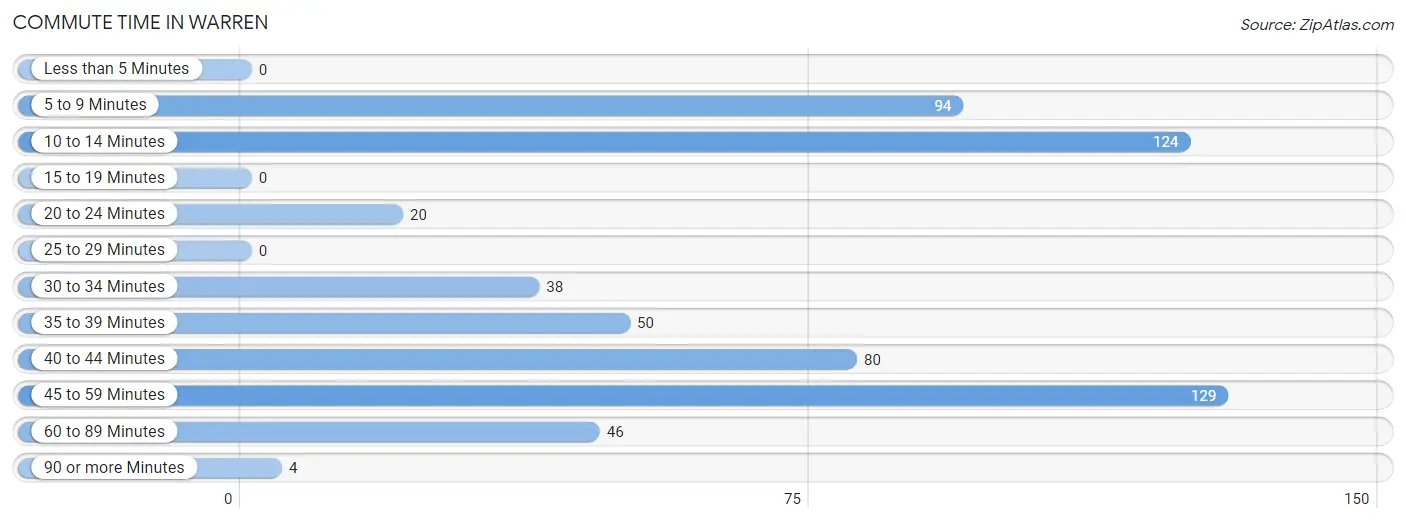
| Commute Time | # Commuters | % Commuters |
| Less than 5 Minutes | 0 | 0.0% |
| 5 to 9 Minutes | 94 | 16.1% |
| 10 to 14 Minutes | 124 | 21.2% |
| 15 to 19 Minutes | 0 | 0.0% |
| 20 to 24 Minutes | 20 | 3.4% |
| 25 to 29 Minutes | 0 | 0.0% |
| 30 to 34 Minutes | 38 | 6.5% |
| 35 to 39 Minutes | 50 | 8.6% |
| 40 to 44 Minutes | 80 | 13.7% |
| 45 to 59 Minutes | 129 | 22.1% |
| 60 to 89 Minutes | 46 | 7.9% |
| 90 or more Minutes | 4 | 0.7% |
Commute Time by Sex in Warren
The most common commute times in Warren are 5 to 9 minutes (75 commuters, 21.6%) for males and 10 to 14 minutes (94 commuters, 39.5%) for females.
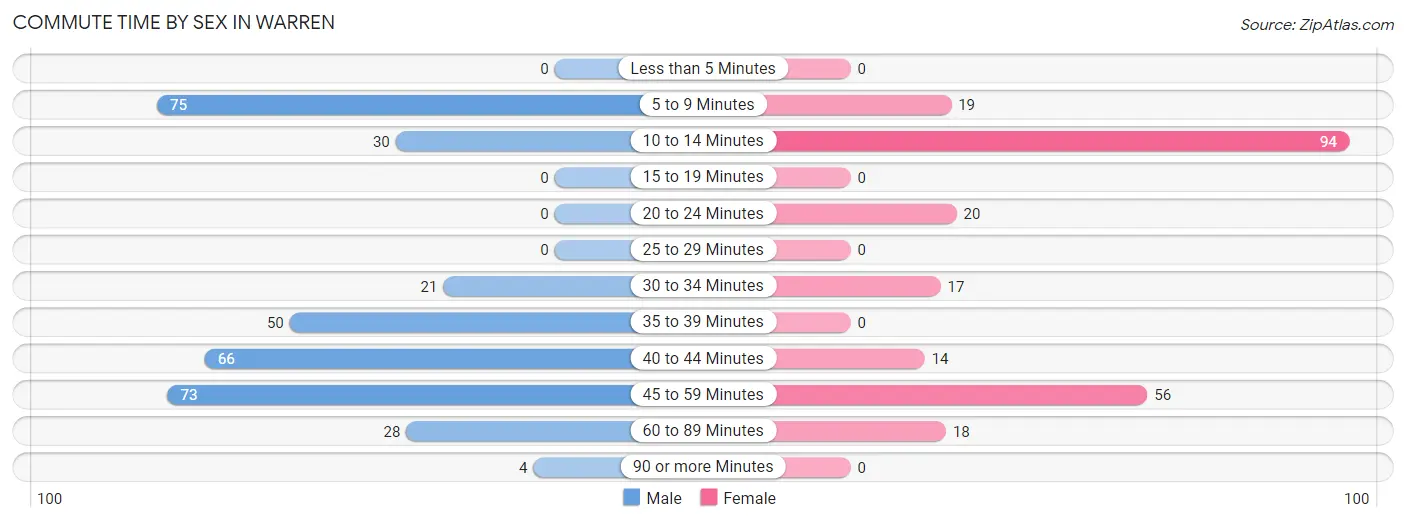
| Commute Time | Male | Female |
| Less than 5 Minutes | 0 (0.0%) | 0 (0.0%) |
| 5 to 9 Minutes | 75 (21.6%) | 19 (8.0%) |
| 10 to 14 Minutes | 30 (8.6%) | 94 (39.5%) |
| 15 to 19 Minutes | 0 (0.0%) | 0 (0.0%) |
| 20 to 24 Minutes | 0 (0.0%) | 20 (8.4%) |
| 25 to 29 Minutes | 0 (0.0%) | 0 (0.0%) |
| 30 to 34 Minutes | 21 (6.0%) | 17 (7.1%) |
| 35 to 39 Minutes | 50 (14.4%) | 0 (0.0%) |
| 40 to 44 Minutes | 66 (19.0%) | 14 (5.9%) |
| 45 to 59 Minutes | 73 (21.0%) | 56 (23.5%) |
| 60 to 89 Minutes | 28 (8.1%) | 18 (7.6%) |
| 90 or more Minutes | 4 (1.1%) | 0 (0.0%) |
Time of Departure to Work by Sex in Warren
The most frequent times of departure to work in Warren are 6:00 AM to 6:29 AM (53, 15.3%) for males and 7:30 AM to 7:59 AM (55, 23.1%) for females.
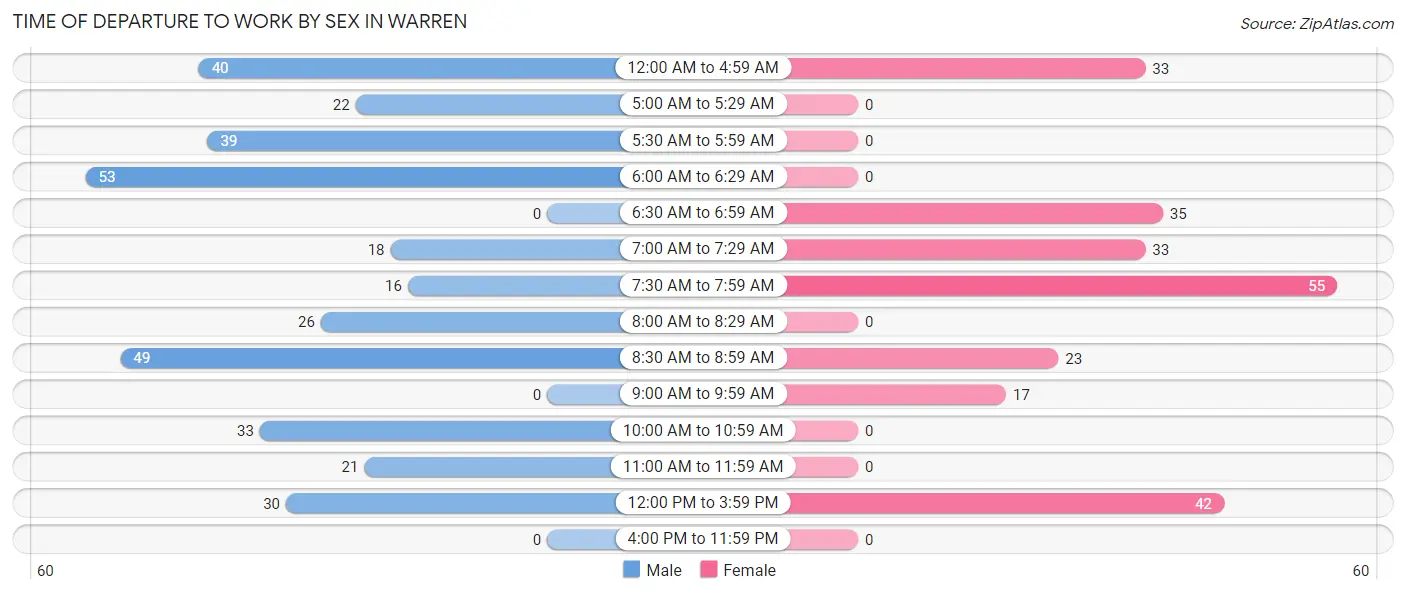
| Time of Departure | Male | Female |
| 12:00 AM to 4:59 AM | 40 (11.5%) | 33 (13.9%) |
| 5:00 AM to 5:29 AM | 22 (6.3%) | 0 (0.0%) |
| 5:30 AM to 5:59 AM | 39 (11.2%) | 0 (0.0%) |
| 6:00 AM to 6:29 AM | 53 (15.3%) | 0 (0.0%) |
| 6:30 AM to 6:59 AM | 0 (0.0%) | 35 (14.7%) |
| 7:00 AM to 7:29 AM | 18 (5.2%) | 33 (13.9%) |
| 7:30 AM to 7:59 AM | 16 (4.6%) | 55 (23.1%) |
| 8:00 AM to 8:29 AM | 26 (7.5%) | 0 (0.0%) |
| 8:30 AM to 8:59 AM | 49 (14.1%) | 23 (9.7%) |
| 9:00 AM to 9:59 AM | 0 (0.0%) | 17 (7.1%) |
| 10:00 AM to 10:59 AM | 33 (9.5%) | 0 (0.0%) |
| 11:00 AM to 11:59 AM | 21 (6.0%) | 0 (0.0%) |
| 12:00 PM to 3:59 PM | 30 (8.6%) | 42 (17.6%) |
| 4:00 PM to 11:59 PM | 0 (0.0%) | 0 (0.0%) |
| Total | 347 (100.0%) | 238 (100.0%) |
Housing Occupancy in Warren
Occupancy by Ownership in Warren
Of the total 791 dwellings in Warren, owner-occupied units account for 764 (96.6%), while renter-occupied units make up 27 (3.4%).
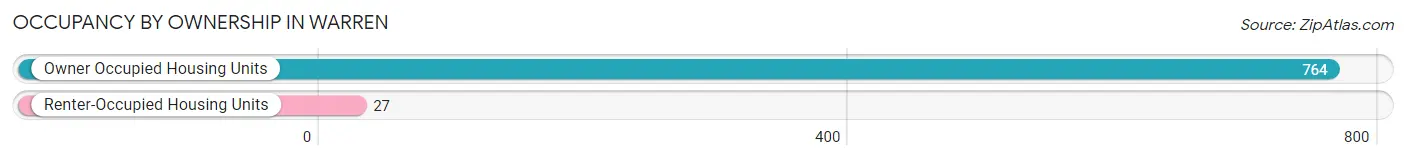
| Occupancy | # Housing Units | % Housing Units |
| Owner Occupied Housing Units | 764 | 96.6% |
| Renter-Occupied Housing Units | 27 | 3.4% |
| Total Occupied Housing Units | 791 | 100.0% |
Occupancy by Household Size in Warren
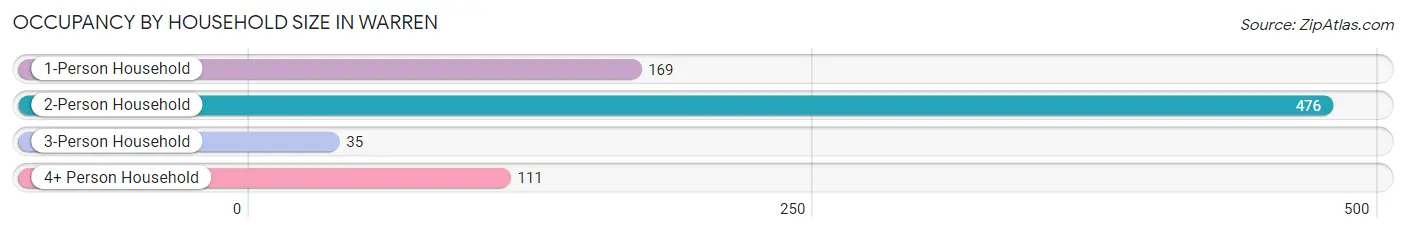
| Household Size | # Housing Units | % Housing Units |
| 1-Person Household | 169 | 21.4% |
| 2-Person Household | 476 | 60.2% |
| 3-Person Household | 35 | 4.4% |
| 4+ Person Household | 111 | 14.0% |
| Total Housing Units | 791 | 100.0% |
Occupancy by Ownership by Household Size in Warren
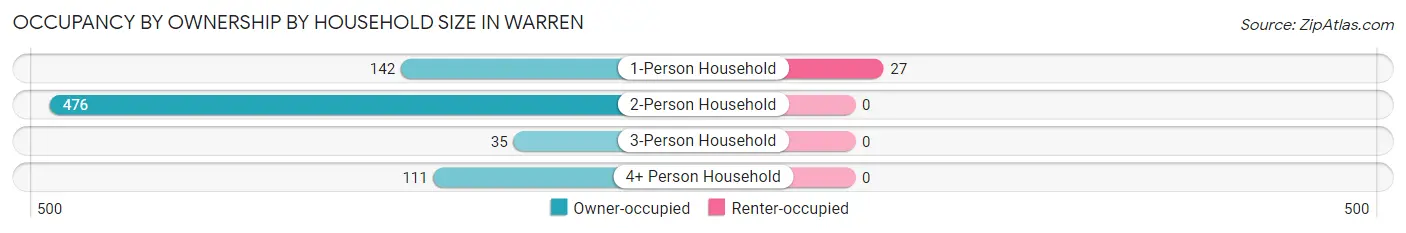
| Household Size | Owner-occupied | Renter-occupied |
| 1-Person Household | 142 (84.0%) | 27 (16.0%) |
| 2-Person Household | 476 (100.0%) | 0 (0.0%) |
| 3-Person Household | 35 (100.0%) | 0 (0.0%) |
| 4+ Person Household | 111 (100.0%) | 0 (0.0%) |
| Total Housing Units | 764 (96.6%) | 27 (3.4%) |
Occupancy by Educational Attainment in Warren
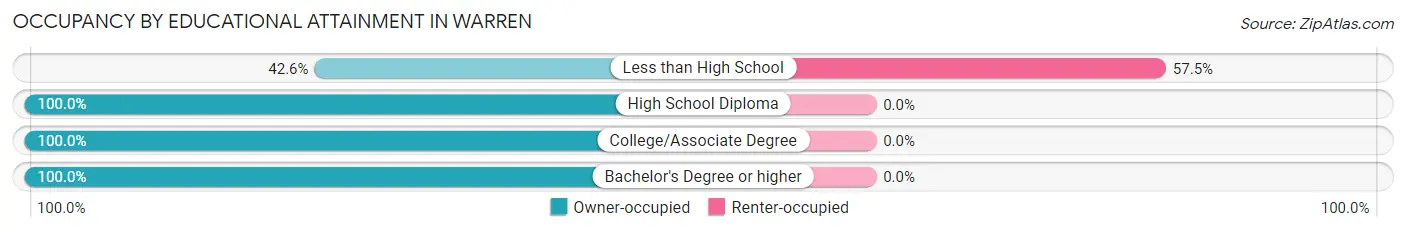
| Household Size | Owner-occupied | Renter-occupied |
| Less than High School | 20 (42.5%) | 27 (57.5%) |
| High School Diploma | 94 (100.0%) | 0 (0.0%) |
| College/Associate Degree | 344 (100.0%) | 0 (0.0%) |
| Bachelor's Degree or higher | 306 (100.0%) | 0 (0.0%) |
Occupancy by Age of Householder in Warren
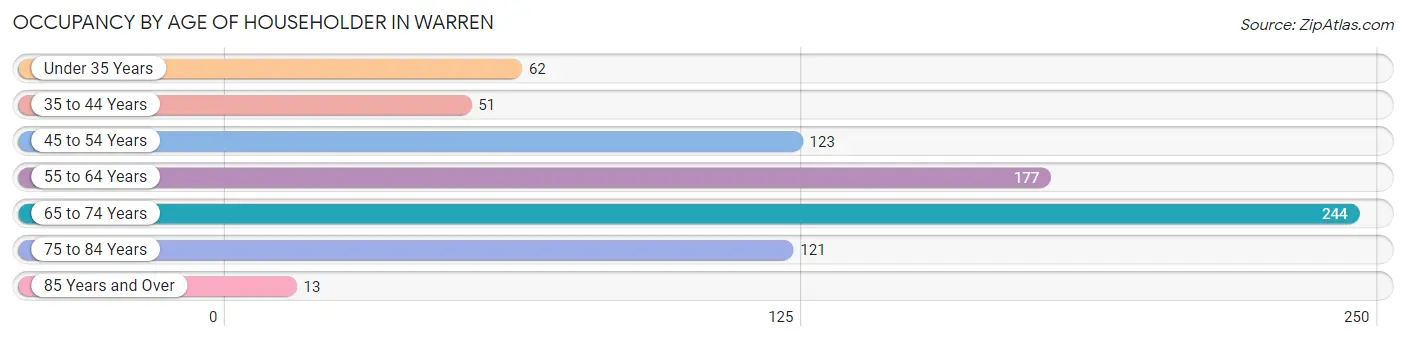
| Age Bracket | # Households | % Households |
| Under 35 Years | 62 | 7.8% |
| 35 to 44 Years | 51 | 6.5% |
| 45 to 54 Years | 123 | 15.5% |
| 55 to 64 Years | 177 | 22.4% |
| 65 to 74 Years | 244 | 30.8% |
| 75 to 84 Years | 121 | 15.3% |
| 85 Years and Over | 13 | 1.6% |
| Total | 791 | 100.0% |
Housing Finances in Warren
Median Income by Occupancy in Warren
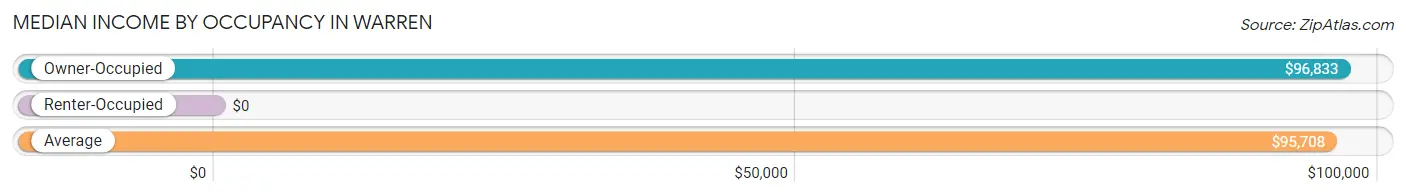
| Occupancy Type | # Households | Median Income |
| Owner-Occupied | 764 (96.6%) | $96,833 |
| Renter-Occupied | 27 (3.4%) | $0 |
| Average | 791 (100.0%) | $95,708 |
Occupancy by Householder Income Bracket in Warren
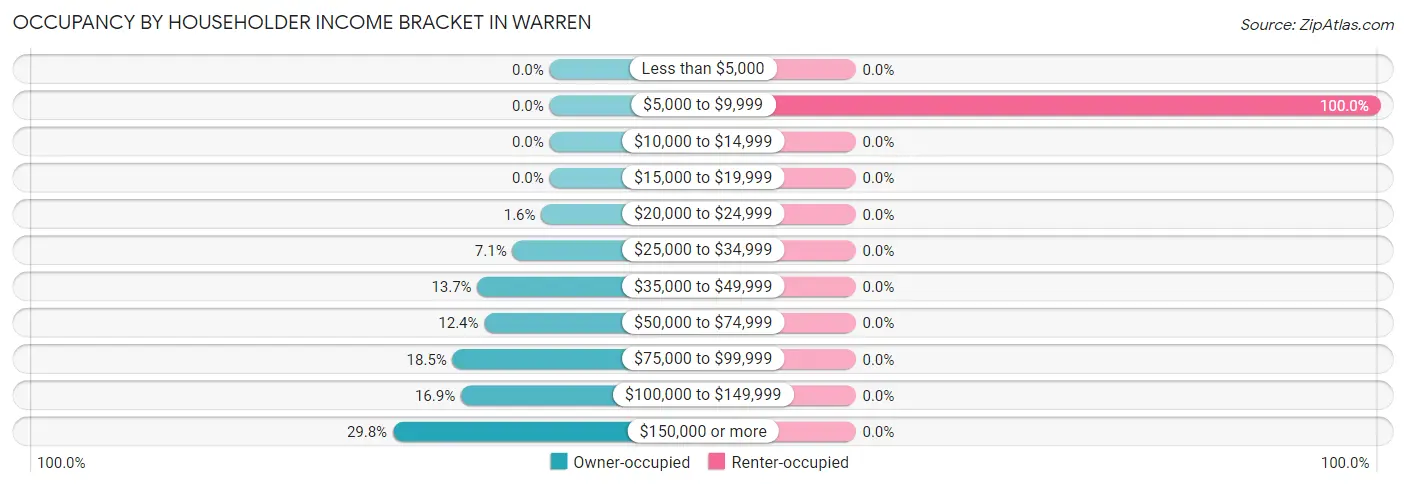
| Income Bracket | Owner-occupied | Renter-occupied |
| Less than $5,000 | 0 (0.0%) | 0 (0.0%) |
| $5,000 to $9,999 | 0 (0.0%) | 27 (100.0%) |
| $10,000 to $14,999 | 0 (0.0%) | 0 (0.0%) |
| $15,000 to $19,999 | 0 (0.0%) | 0 (0.0%) |
| $20,000 to $24,999 | 12 (1.6%) | 0 (0.0%) |
| $25,000 to $34,999 | 54 (7.1%) | 0 (0.0%) |
| $35,000 to $49,999 | 105 (13.7%) | 0 (0.0%) |
| $50,000 to $74,999 | 95 (12.4%) | 0 (0.0%) |
| $75,000 to $99,999 | 141 (18.5%) | 0 (0.0%) |
| $100,000 to $149,999 | 129 (16.9%) | 0 (0.0%) |
| $150,000 or more | 228 (29.8%) | 0 (0.0%) |
| Total | 764 (100.0%) | 27 (100.0%) |
Monthly Housing Cost Tiers in Warren
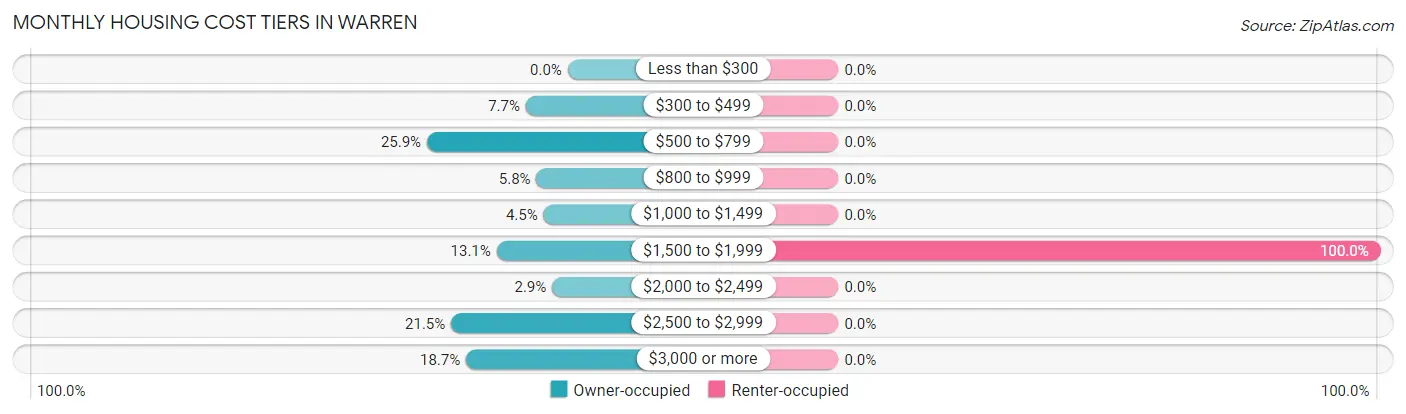
| Monthly Cost | Owner-occupied | Renter-occupied |
| Less than $300 | 0 (0.0%) | 0 (0.0%) |
| $300 to $499 | 59 (7.7%) | 0 (0.0%) |
| $500 to $799 | 198 (25.9%) | 0 (0.0%) |
| $800 to $999 | 44 (5.8%) | 0 (0.0%) |
| $1,000 to $1,499 | 34 (4.4%) | 0 (0.0%) |
| $1,500 to $1,999 | 100 (13.1%) | 27 (100.0%) |
| $2,000 to $2,499 | 22 (2.9%) | 0 (0.0%) |
| $2,500 to $2,999 | 164 (21.5%) | 0 (0.0%) |
| $3,000 or more | 143 (18.7%) | 0 (0.0%) |
| Total | 764 (100.0%) | 27 (100.0%) |
Physical Housing Characteristics in Warren
Housing Structures in Warren
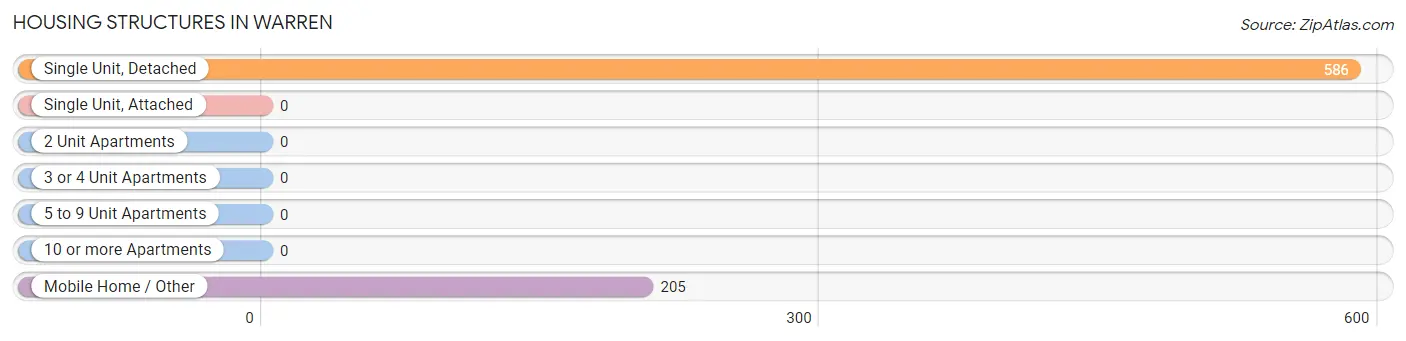
| Structure Type | # Housing Units | % Housing Units |
| Single Unit, Detached | 586 | 74.1% |
| Single Unit, Attached | 0 | 0.0% |
| 2 Unit Apartments | 0 | 0.0% |
| 3 or 4 Unit Apartments | 0 | 0.0% |
| 5 to 9 Unit Apartments | 0 | 0.0% |
| 10 or more Apartments | 0 | 0.0% |
| Mobile Home / Other | 205 | 25.9% |
| Total | 791 | 100.0% |
Housing Structures by Occupancy in Warren
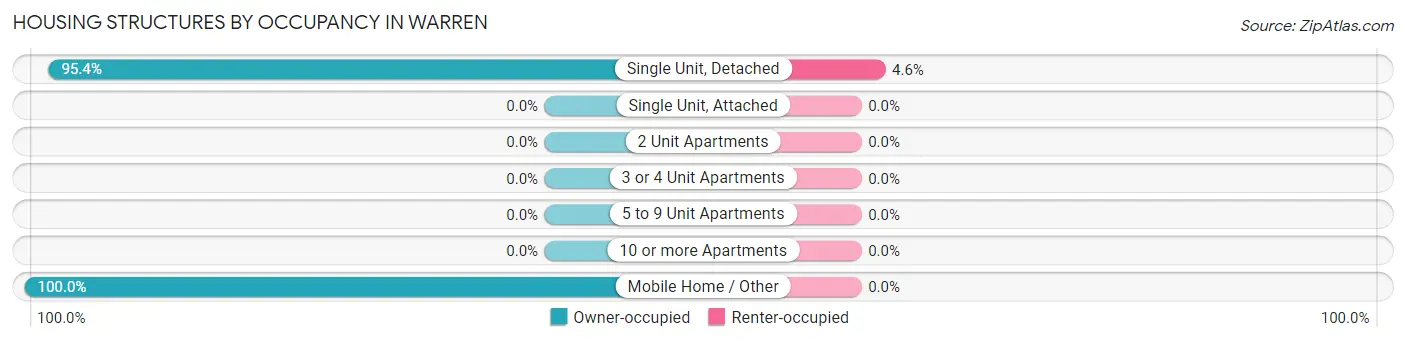
| Structure Type | Owner-occupied | Renter-occupied |
| Single Unit, Detached | 559 (95.4%) | 27 (4.6%) |
| Single Unit, Attached | 0 (0.0%) | 0 (0.0%) |
| 2 Unit Apartments | 0 (0.0%) | 0 (0.0%) |
| 3 or 4 Unit Apartments | 0 (0.0%) | 0 (0.0%) |
| 5 to 9 Unit Apartments | 0 (0.0%) | 0 (0.0%) |
| 10 or more Apartments | 0 (0.0%) | 0 (0.0%) |
| Mobile Home / Other | 205 (100.0%) | 0 (0.0%) |
| Total | 764 (96.6%) | 27 (3.4%) |
Housing Structures by Number of Rooms in Warren
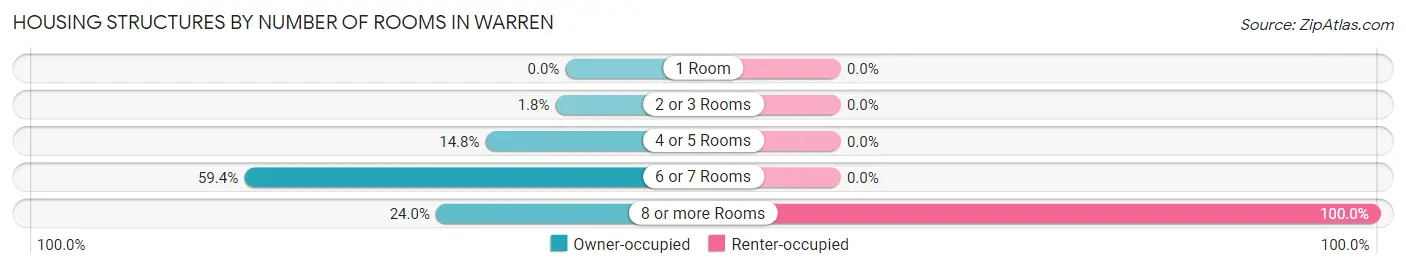
| Number of Rooms | Owner-occupied | Renter-occupied |
| 1 Room | 0 (0.0%) | 0 (0.0%) |
| 2 or 3 Rooms | 14 (1.8%) | 0 (0.0%) |
| 4 or 5 Rooms | 113 (14.8%) | 0 (0.0%) |
| 6 or 7 Rooms | 454 (59.4%) | 0 (0.0%) |
| 8 or more Rooms | 183 (23.9%) | 27 (100.0%) |
| Total | 764 (100.0%) | 27 (100.0%) |
Housing Structure by Heating Type in Warren
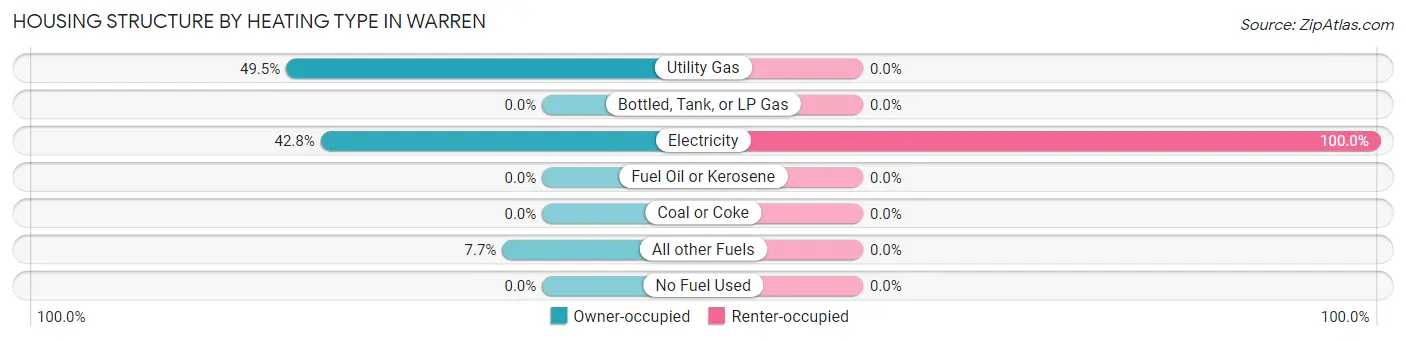
| Heating Type | Owner-occupied | Renter-occupied |
| Utility Gas | 378 (49.5%) | 0 (0.0%) |
| Bottled, Tank, or LP Gas | 0 (0.0%) | 0 (0.0%) |
| Electricity | 327 (42.8%) | 27 (100.0%) |
| Fuel Oil or Kerosene | 0 (0.0%) | 0 (0.0%) |
| Coal or Coke | 0 (0.0%) | 0 (0.0%) |
| All other Fuels | 59 (7.7%) | 0 (0.0%) |
| No Fuel Used | 0 (0.0%) | 0 (0.0%) |
| Total | 764 (100.0%) | 27 (100.0%) |
Household Vehicle Usage in Warren
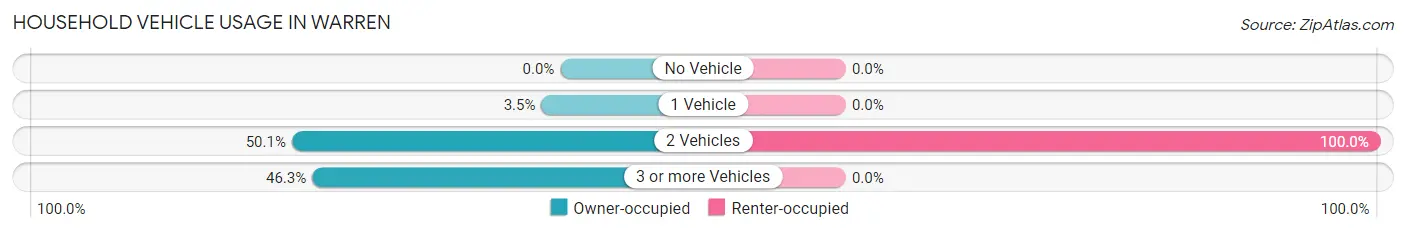
| Vehicles per Household | Owner-occupied | Renter-occupied |
| No Vehicle | 0 (0.0%) | 0 (0.0%) |
| 1 Vehicle | 27 (3.5%) | 0 (0.0%) |
| 2 Vehicles | 383 (50.1%) | 27 (100.0%) |
| 3 or more Vehicles | 354 (46.3%) | 0 (0.0%) |
| Total | 764 (100.0%) | 27 (100.0%) |
Real Estate & Mortgages in Warren
Real Estate and Mortgage Overview in Warren
| Characteristic | Without Mortgage | With Mortgage |
| Housing Units | 258 | 506 |
| Median Property Value | $504,300 | $385,200 |
| Median Household Income | $52,105 | $228 |
| Monthly Housing Costs | $567 | $143 |
| Real Estate Taxes | $4,071 | $0 |
Property Value by Mortgage Status in Warren
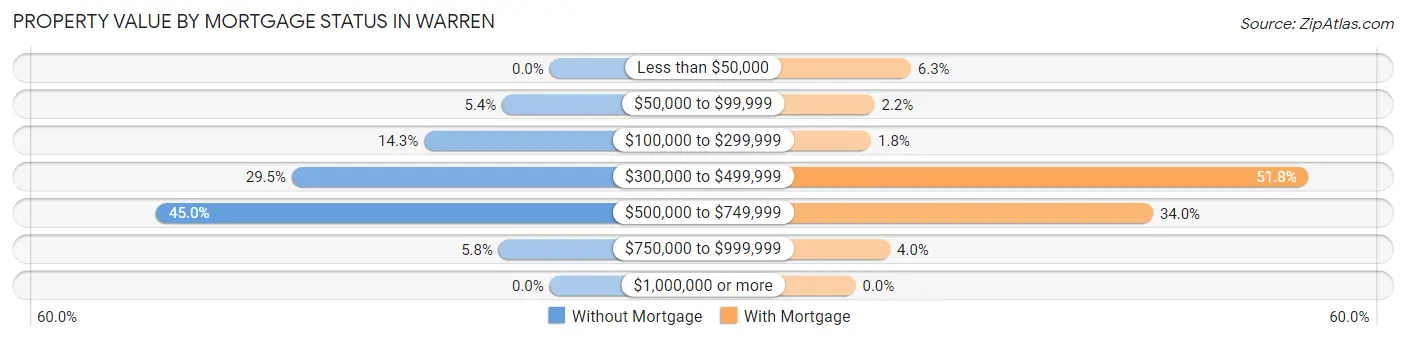
| Property Value | Without Mortgage | With Mortgage |
| Less than $50,000 | 0 (0.0%) | 32 (6.3%) |
| $50,000 to $99,999 | 14 (5.4%) | 11 (2.2%) |
| $100,000 to $299,999 | 37 (14.3%) | 9 (1.8%) |
| $300,000 to $499,999 | 76 (29.5%) | 262 (51.8%) |
| $500,000 to $749,999 | 116 (45.0%) | 172 (34.0%) |
| $750,000 to $999,999 | 15 (5.8%) | 20 (4.0%) |
| $1,000,000 or more | 0 (0.0%) | 0 (0.0%) |
| Total | 258 (100.0%) | 506 (100.0%) |
Household Income by Mortgage Status in Warren
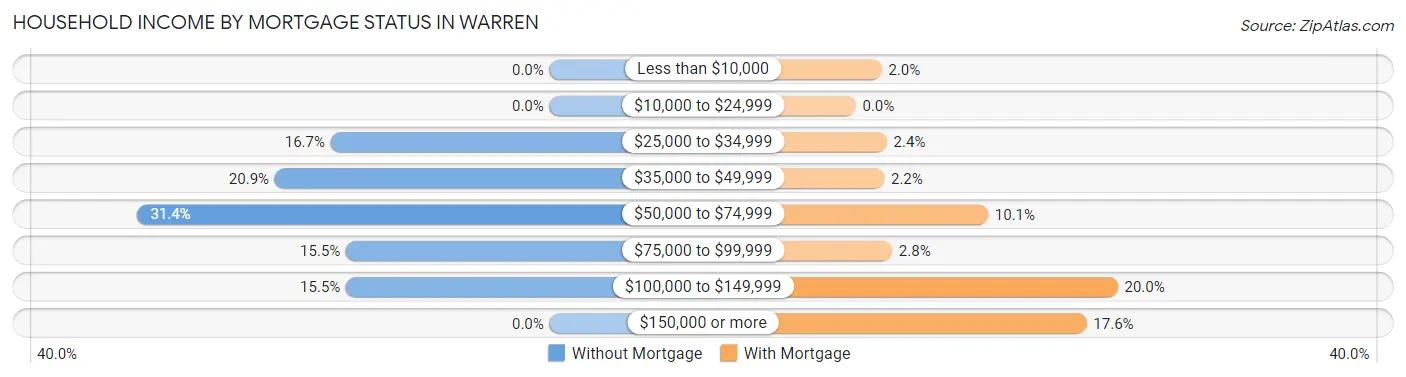
| Household Income | Without Mortgage | With Mortgage |
| Less than $10,000 | 0 (0.0%) | 10 (2.0%) |
| $10,000 to $24,999 | 0 (0.0%) | 0 (0.0%) |
| $25,000 to $34,999 | 43 (16.7%) | 12 (2.4%) |
| $35,000 to $49,999 | 54 (20.9%) | 11 (2.2%) |
| $50,000 to $74,999 | 81 (31.4%) | 51 (10.1%) |
| $75,000 to $99,999 | 40 (15.5%) | 14 (2.8%) |
| $100,000 to $149,999 | 40 (15.5%) | 101 (20.0%) |
| $150,000 or more | 0 (0.0%) | 89 (17.6%) |
| Total | 258 (100.0%) | 506 (100.0%) |
Property Value to Household Income Ratio in Warren
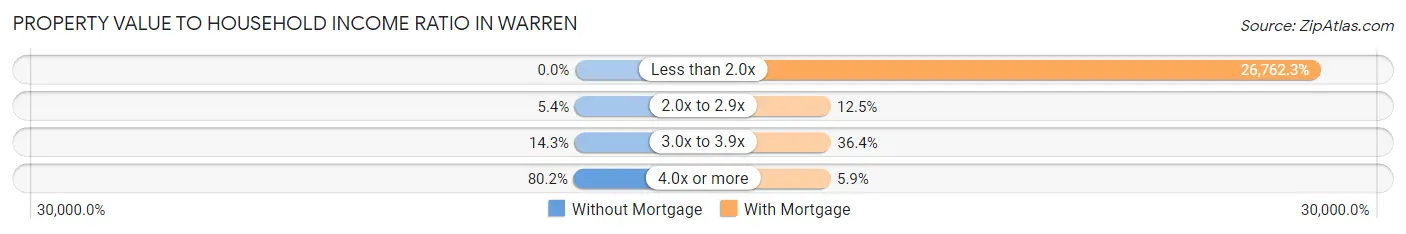
| Value-to-Income Ratio | Without Mortgage | With Mortgage |
| Less than 2.0x | 0 (0.0%) | 135,417 (26,762.3%) |
| 2.0x to 2.9x | 14 (5.4%) | 63 (12.4%) |
| 3.0x to 3.9x | 37 (14.3%) | 184 (36.4%) |
| 4.0x or more | 207 (80.2%) | 30 (5.9%) |
| Total | 258 (100.0%) | 506 (100.0%) |
Real Estate Taxes by Mortgage Status in Warren
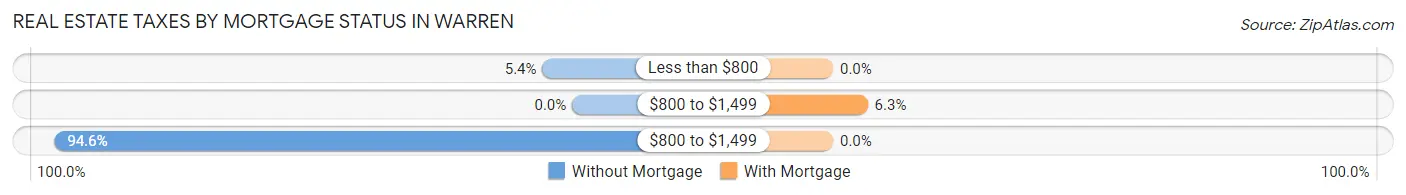
| Property Taxes | Without Mortgage | With Mortgage |
| Less than $800 | 14 (5.4%) | 0 (0.0%) |
| $800 to $1,499 | 0 (0.0%) | 32 (6.3%) |
| $800 to $1,499 | 244 (94.6%) | 0 (0.0%) |
| Total | 258 (100.0%) | 506 (100.0%) |
Health & Disability in Warren
Health Insurance Coverage by Age in Warren
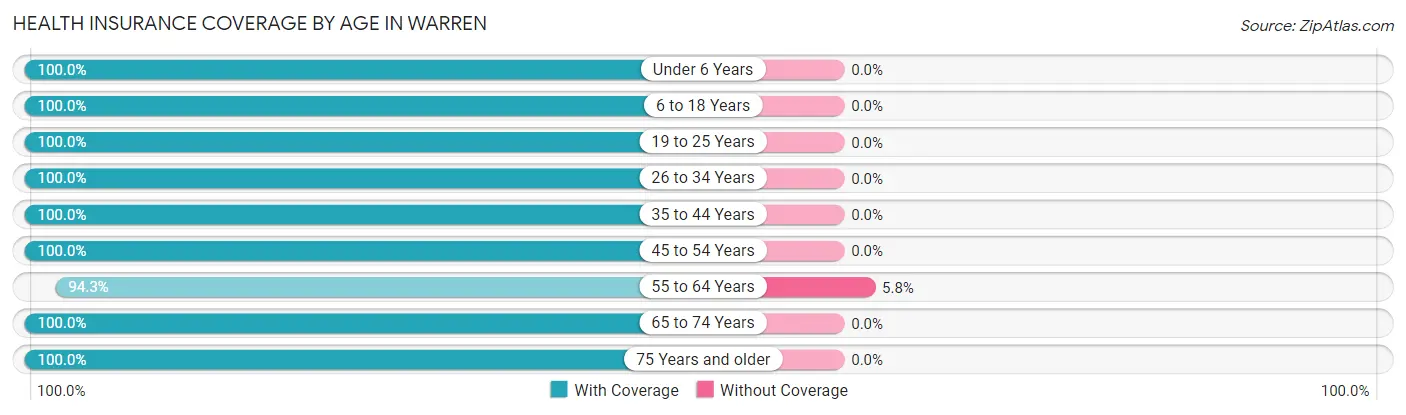
| Age Bracket | With Coverage | Without Coverage |
| Under 6 Years | 57 (100.0%) | 0 (0.0%) |
| 6 to 18 Years | 140 (100.0%) | 0 (0.0%) |
| 19 to 25 Years | 44 (100.0%) | 0 (0.0%) |
| 26 to 34 Years | 146 (100.0%) | 0 (0.0%) |
| 35 to 44 Years | 96 (100.0%) | 0 (0.0%) |
| 45 to 54 Years | 163 (100.0%) | 0 (0.0%) |
| 55 to 64 Years | 377 (94.3%) | 23 (5.8%) |
| 65 to 74 Years | 345 (100.0%) | 0 (0.0%) |
| 75 Years and older | 217 (100.0%) | 0 (0.0%) |
| Total | 1,585 (98.6%) | 23 (1.4%) |
Health Insurance Coverage by Citizenship Status in Warren
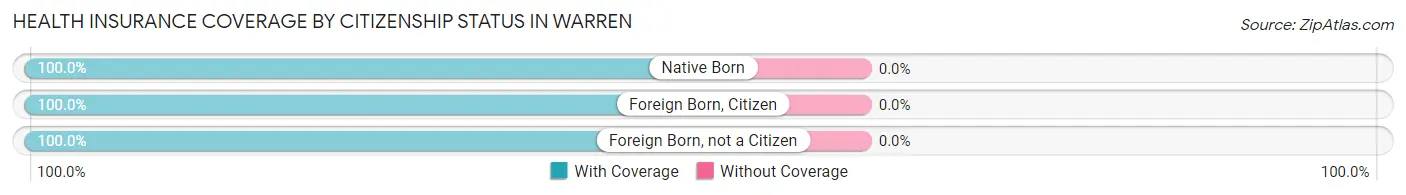
| Citizenship Status | With Coverage | Without Coverage |
| Native Born | 57 (100.0%) | 0 (0.0%) |
| Foreign Born, Citizen | 140 (100.0%) | 0 (0.0%) |
| Foreign Born, not a Citizen | 44 (100.0%) | 0 (0.0%) |
Health Insurance Coverage by Household Income in Warren
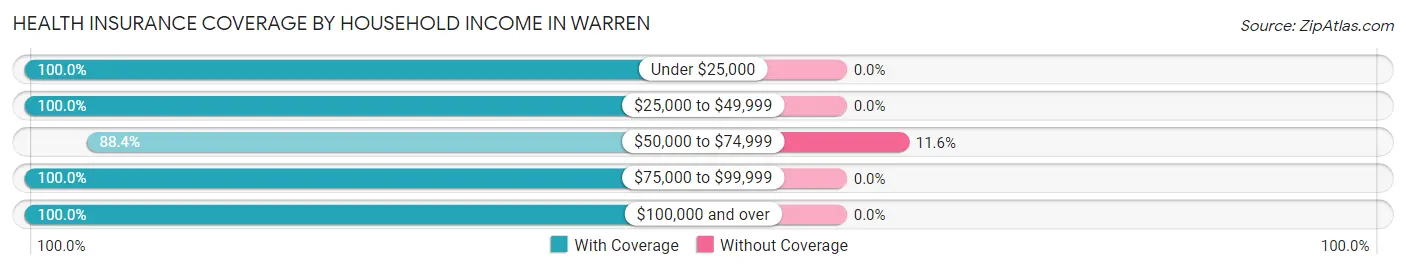
| Household Income | With Coverage | Without Coverage |
| Under $25,000 | 50 (100.0%) | 0 (0.0%) |
| $25,000 to $49,999 | 203 (100.0%) | 0 (0.0%) |
| $50,000 to $74,999 | 175 (88.4%) | 23 (11.6%) |
| $75,000 to $99,999 | 293 (100.0%) | 0 (0.0%) |
| $100,000 and over | 864 (100.0%) | 0 (0.0%) |
Public vs Private Health Insurance Coverage by Age in Warren
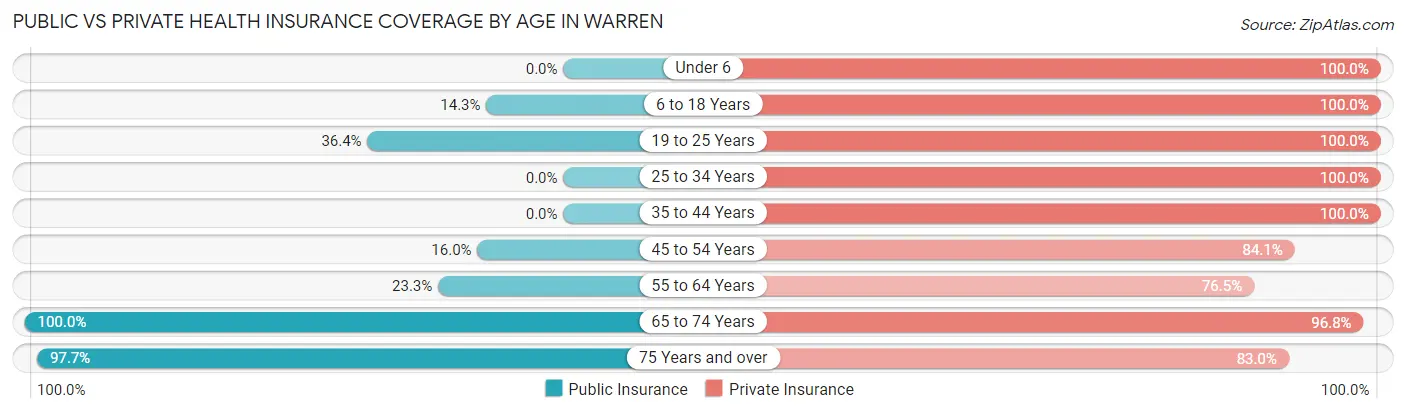
| Age Bracket | Public Insurance | Private Insurance |
| Under 6 | 0 (0.0%) | 57 (100.0%) |
| 6 to 18 Years | 20 (14.3%) | 140 (100.0%) |
| 19 to 25 Years | 16 (36.4%) | 44 (100.0%) |
| 25 to 34 Years | 0 (0.0%) | 146 (100.0%) |
| 35 to 44 Years | 0 (0.0%) | 96 (100.0%) |
| 45 to 54 Years | 26 (16.0%) | 137 (84.1%) |
| 55 to 64 Years | 93 (23.3%) | 306 (76.5%) |
| 65 to 74 Years | 345 (100.0%) | 334 (96.8%) |
| 75 Years and over | 212 (97.7%) | 180 (83.0%) |
| Total | 712 (44.3%) | 1,440 (89.5%) |
Disability Status by Sex by Age in Warren
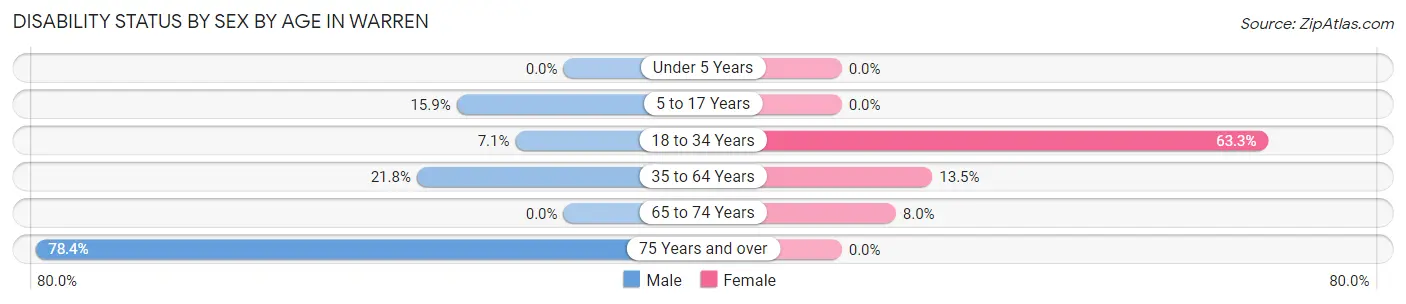
| Age Bracket | Male | Female |
| Under 5 Years | 0 (0.0%) | 0 (0.0%) |
| 5 to 17 Years | 20 (15.9%) | 0 (0.0%) |
| 18 to 34 Years | 10 (7.1%) | 38 (63.3%) |
| 35 to 64 Years | 69 (21.8%) | 46 (13.5%) |
| 65 to 74 Years | 0 (0.0%) | 11 (8.0%) |
| 75 Years and over | 138 (78.4%) | 0 (0.0%) |
Disability Class by Sex by Age in Warren
Disability Class: Hearing Difficulty
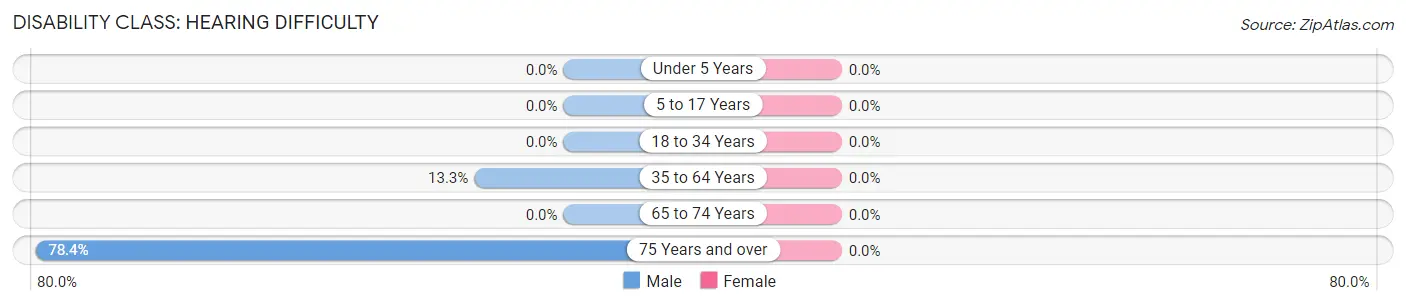
| Age Bracket | Male | Female |
| Under 5 Years | 0 (0.0%) | 0 (0.0%) |
| 5 to 17 Years | 0 (0.0%) | 0 (0.0%) |
| 18 to 34 Years | 0 (0.0%) | 0 (0.0%) |
| 35 to 64 Years | 42 (13.3%) | 0 (0.0%) |
| 65 to 74 Years | 0 (0.0%) | 0 (0.0%) |
| 75 Years and over | 138 (78.4%) | 0 (0.0%) |
Disability Class: Vision Difficulty
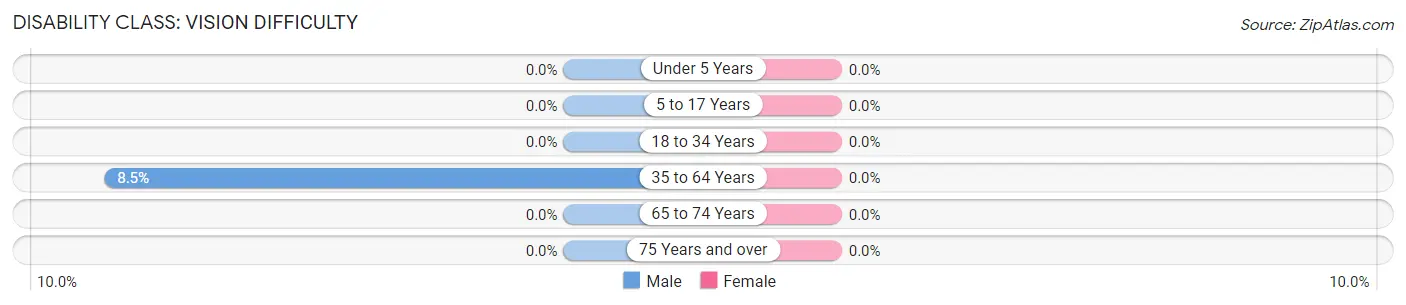
| Age Bracket | Male | Female |
| Under 5 Years | 0 (0.0%) | 0 (0.0%) |
| 5 to 17 Years | 0 (0.0%) | 0 (0.0%) |
| 18 to 34 Years | 0 (0.0%) | 0 (0.0%) |
| 35 to 64 Years | 27 (8.5%) | 0 (0.0%) |
| 65 to 74 Years | 0 (0.0%) | 0 (0.0%) |
| 75 Years and over | 0 (0.0%) | 0 (0.0%) |
Disability Class: Cognitive Difficulty
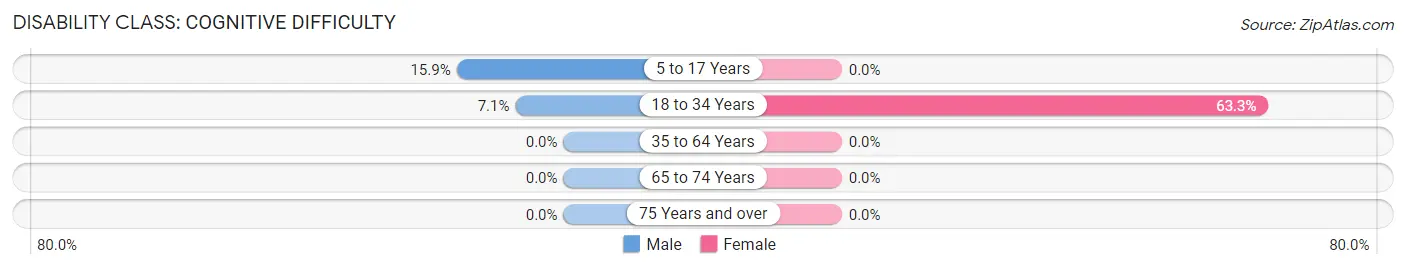
| Age Bracket | Male | Female |
| 5 to 17 Years | 20 (15.9%) | 0 (0.0%) |
| 18 to 34 Years | 10 (7.1%) | 38 (63.3%) |
| 35 to 64 Years | 0 (0.0%) | 0 (0.0%) |
| 65 to 74 Years | 0 (0.0%) | 0 (0.0%) |
| 75 Years and over | 0 (0.0%) | 0 (0.0%) |
Disability Class: Ambulatory Difficulty
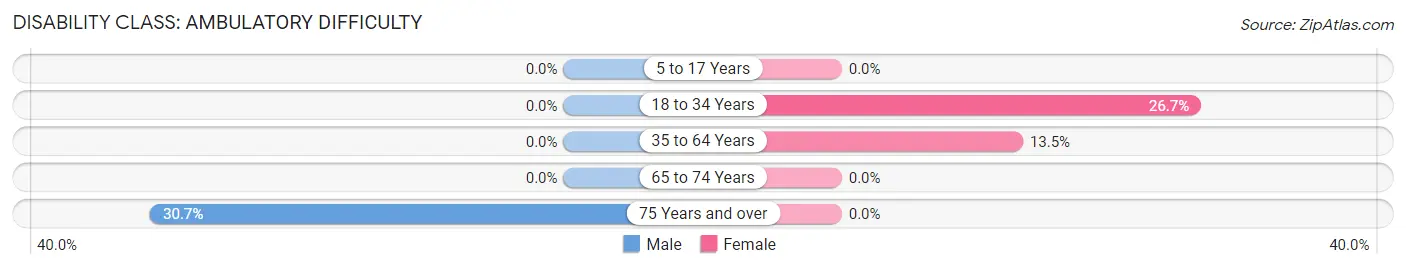
| Age Bracket | Male | Female |
| 5 to 17 Years | 0 (0.0%) | 0 (0.0%) |
| 18 to 34 Years | 0 (0.0%) | 16 (26.7%) |
| 35 to 64 Years | 0 (0.0%) | 46 (13.5%) |
| 65 to 74 Years | 0 (0.0%) | 0 (0.0%) |
| 75 Years and over | 54 (30.7%) | 0 (0.0%) |
Disability Class: Self-Care Difficulty
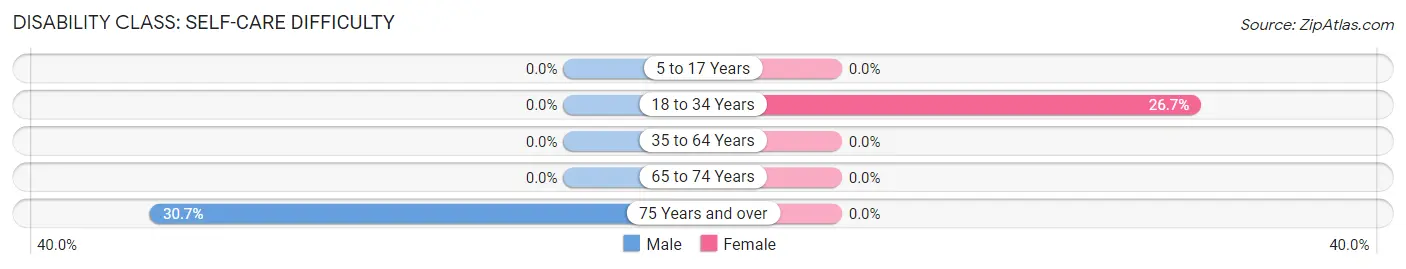
| Age Bracket | Male | Female |
| 5 to 17 Years | 0 (0.0%) | 0 (0.0%) |
| 18 to 34 Years | 0 (0.0%) | 16 (26.7%) |
| 35 to 64 Years | 0 (0.0%) | 0 (0.0%) |
| 65 to 74 Years | 0 (0.0%) | 0 (0.0%) |
| 75 Years and over | 54 (30.7%) | 0 (0.0%) |
Technology Access in Warren
Computing Device Access in Warren
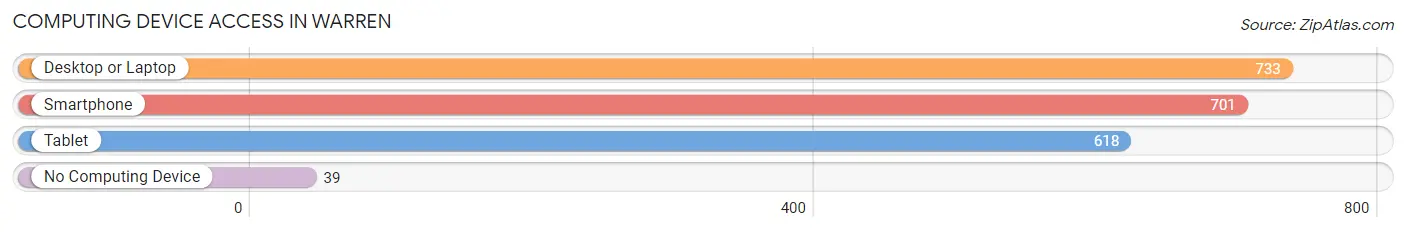
| Device Type | # Households | % Households |
| Desktop or Laptop | 733 | 92.7% |
| Smartphone | 701 | 88.6% |
| Tablet | 618 | 78.1% |
| No Computing Device | 39 | 4.9% |
| Total | 791 | 100.0% |
Internet Access in Warren
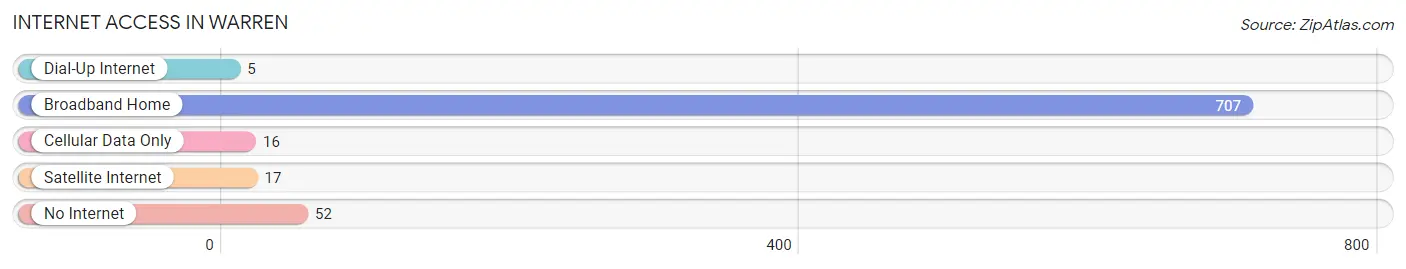
| Internet Type | # Households | % Households |
| Dial-Up Internet | 5 | 0.6% |
| Broadband Home | 707 | 89.4% |
| Cellular Data Only | 16 | 2.0% |
| Satellite Internet | 17 | 2.1% |
| No Internet | 52 | 6.6% |
| Total | 791 | 100.0% |
Warren Summary
Warren, Oregon is a small city located in the western part of the state, in the foothills of the Cascade Mountains. It is situated in the Willamette Valley, about 25 miles south of Portland. The city is home to approximately 1,500 people, and is part of the larger metropolitan area of Portland.
History
The area that is now Warren was first settled in the early 1800s by pioneers who were drawn to the area by its fertile soil and abundant natural resources. The first settlers were mostly farmers, and the area quickly became known for its agricultural production. In 1851, the town of Warren was officially established, and the first post office was opened in 1854.
In the late 1800s, the town began to grow and develop, and by the early 1900s, it had become a thriving community. The town was home to several businesses, including a sawmill, a flour mill, and a brickyard. The town also had a school, a church, and a library.
In the early 1900s, the town began to decline, as many of the businesses closed and the population began to dwindle. However, in the late 1970s, the town began to experience a resurgence, as new businesses opened and the population began to grow again.
Geography
Warren is located in the western part of Oregon, in the foothills of the Cascade Mountains. The city is situated in the Willamette Valley, about 25 miles south of Portland. The city is surrounded by rolling hills and lush forests, and is home to several small lakes and streams.
The climate in Warren is mild and temperate, with warm summers and cool winters. The average annual temperature is around 50 degrees Fahrenheit, and the average annual precipitation is around 40 inches.
Economy
The economy of Warren is largely based on agriculture and tourism. The city is home to several farms, which produce a variety of crops, including wheat, corn, and hay. The city is also home to several wineries, which produce a variety of wines.
In addition to agriculture, the city is also home to several small businesses, including restaurants, retail stores, and service providers. The city is also home to several manufacturing companies, which produce a variety of products, including furniture, clothing, and electronics.
Demographics
As of the 2010 census, the population of Warren was 1,500. The racial makeup of the city was 94.2% White, 0.7% African American, 0.7% Native American, 0.7% Asian, 0.7% from other races, and 2.7% from two or more races. Hispanic or Latino of any race were 2.7% of the population.
The median household income in Warren was $45,000, and the median family income was $50,000. The per capita income in Warren was $20,000. About 10.7% of the population was below the poverty line.
Common Questions
What is Per Capita Income in Warren?
Per Capita income in Warren is $51,482.
What is the Median Family Income in Warren?
Median Family Income in Warren is $110,417.
What is the Median Household income in Warren?
Median Household Income in Warren is $95,708.
What is Income or Wage Gap in Warren?
Income or Wage Gap in Warren is 21.0%.
Women in Warren earn 79.0 cents for every dollar earned by a man.
What is Inequality or Gini Index in Warren?
Inequality or Gini Index in Warren is 0.32.
What is the Total Population of Warren?
Total Population of Warren is 1,608.
What is the Total Male Population of Warren?
Total Male Population of Warren is 986.
What is the Total Female Population of Warren?
Total Female Population of Warren is 622.
What is the Ratio of Males per 100 Females in Warren?
There are 158.52 Males per 100 Females in Warren.
What is the Ratio of Females per 100 Males in Warren?
There are 63.08 Females per 100 Males in Warren.
What is the Median Population Age in Warren?
Median Population Age in Warren is 59.8 Years.
What is the Average Family Size in Warren
Average Family Size in Warren is 2.3 People.
What is the Average Household Size in Warren
Average Household Size in Warren is 2.0 People.
How Large is the Labor Force in Warren?
There are 614 People in the Labor Forcein in Warren.
What is the Percentage of People in the Labor Force in Warren?
42.6% of People are in the Labor Force in Warren.
What is the Unemployment Rate in Warren?
Unemployment Rate in Warren is 3.3%.