Sweet Home, OR Map & Demographics
Sweet Home Map
Sweet Home Overview
$28,349
PER CAPITA INCOME
$60,028
AVG FAMILY INCOME
$56,783
AVG HOUSEHOLD INCOME
22.8%
WAGE / INCOME GAP [ % ]
77.2¢/ $1
WAGE / INCOME GAP [ $ ]
0.44
INEQUALITY / GINI INDEX
9,852
TOTAL POPULATION
5,016
MALE POPULATION
4,836
FEMALE POPULATION
103.72
MALES / 100 FEMALES
96.41
FEMALES / 100 MALES
41.3
MEDIAN AGE
2.8
AVG FAMILY SIZE
2.5
AVG HOUSEHOLD SIZE
4,018
LABOR FORCE [ PEOPLE ]
49.0%
PERCENT IN LABOR FORCE
7.8%
UNEMPLOYMENT RATE
Sweet Home Zip Codes
Sweet Home Area Codes
Income in Sweet Home
Income Overview in Sweet Home
Per Capita Income in Sweet Home is $28,349, while median incomes of families and households are $60,028 and $56,783 respectively.
| Characteristic | Number | Measure |
| Per Capita Income | 9,852 | $28,349 |
| Median Family Income | 2,737 | $60,028 |
| Mean Family Income | 2,737 | $76,943 |
| Median Household Income | 3,922 | $56,783 |
| Mean Household Income | 3,922 | $70,149 |
| Income Deficit | 2,737 | $0 |
| Wage / Income Gap (%) | 9,852 | 22.75% |
| Wage / Income Gap ($) | 9,852 | 77.25¢ per $1 |
| Gini / Inequality Index | 9,852 | 0.44 |
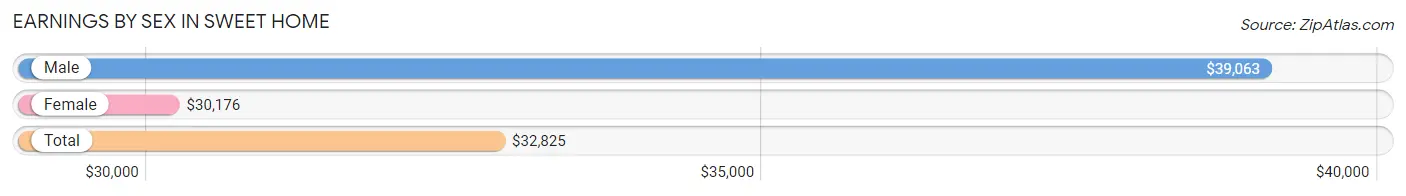
Earnings by Sex in Sweet Home
Average Earnings in Sweet Home are $32,825, $39,063 for men and $30,176 for women, a difference of 22.8%.
| Sex | Number | Average Earnings |
| Male | 2,475 (56.9%) | $39,063 |
| Female | 1,875 (43.1%) | $30,176 |
| Total | 4,350 (100.0%) | $32,825 |
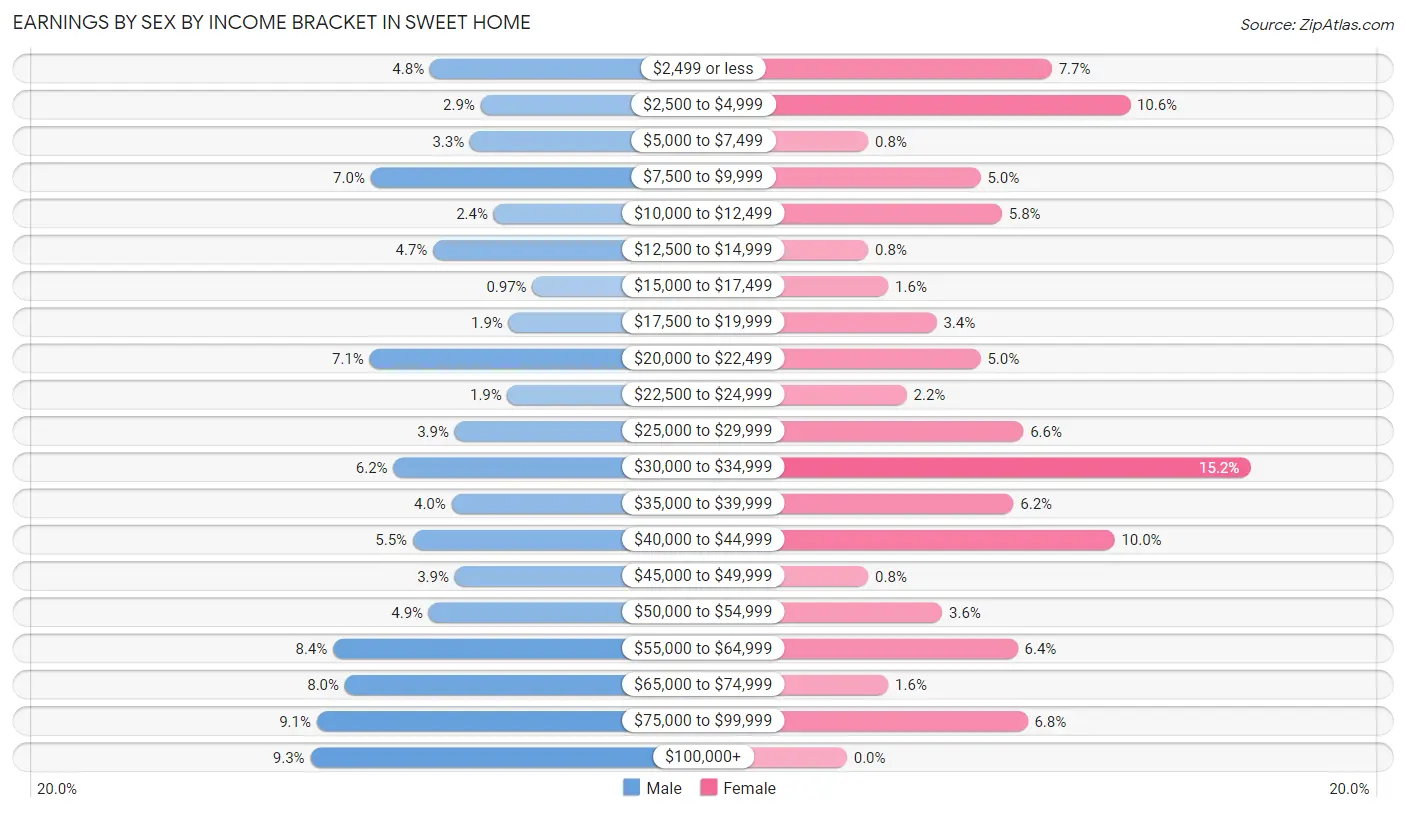
Earnings by Sex by Income Bracket in Sweet Home
The most common earnings brackets in Sweet Home are $100,000+ for men (230 | 9.3%) and $30,000 to $34,999 for women (284 | 15.1%).
| Income | Male | Female |
| $2,499 or less | 119 (4.8%) | 144 (7.7%) |
| $2,500 to $4,999 | 72 (2.9%) | 199 (10.6%) |
| $5,000 to $7,499 | 82 (3.3%) | 15 (0.8%) |
| $7,500 to $9,999 | 174 (7.0%) | 94 (5.0%) |
| $10,000 to $12,499 | 60 (2.4%) | 109 (5.8%) |
| $12,500 to $14,999 | 116 (4.7%) | 15 (0.8%) |
| $15,000 to $17,499 | 24 (1.0%) | 29 (1.5%) |
| $17,500 to $19,999 | 46 (1.9%) | 63 (3.4%) |
| $20,000 to $22,499 | 175 (7.1%) | 94 (5.0%) |
| $22,500 to $24,999 | 47 (1.9%) | 42 (2.2%) |
| $25,000 to $29,999 | 96 (3.9%) | 124 (6.6%) |
| $30,000 to $34,999 | 153 (6.2%) | 284 (15.1%) |
| $35,000 to $39,999 | 99 (4.0%) | 117 (6.2%) |
| $40,000 to $44,999 | 135 (5.4%) | 188 (10.0%) |
| $45,000 to $49,999 | 96 (3.9%) | 15 (0.8%) |
| $50,000 to $54,999 | 120 (4.9%) | 67 (3.6%) |
| $55,000 to $64,999 | 209 (8.4%) | 120 (6.4%) |
| $65,000 to $74,999 | 198 (8.0%) | 29 (1.5%) |
| $75,000 to $99,999 | 224 (9.0%) | 127 (6.8%) |
| $100,000+ | 230 (9.3%) | 0 (0.0%) |
| Total | 2,475 (100.0%) | 1,875 (100.0%) |
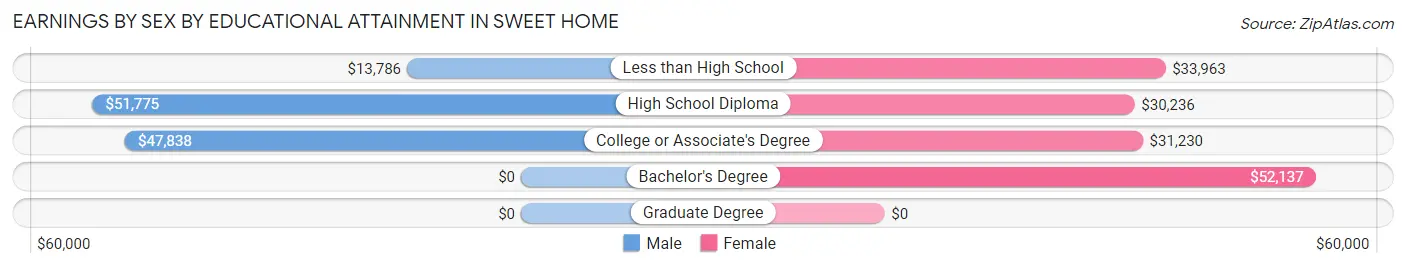
Earnings by Sex by Educational Attainment in Sweet Home
Average earnings in Sweet Home are $46,462 for men and $32,861 for women, a difference of 29.3%. Men with an educational attainment of high school diploma enjoy the highest average annual earnings of $51,775, while those with less than high school education earn the least with $13,786. Women with an educational attainment of bachelor's degree earn the most with the average annual earnings of $52,137, while those with high school diploma education have the smallest earnings of $30,236.
| Educational Attainment | Male Income | Female Income |
| Less than High School | $13,786 | $33,963 |
| High School Diploma | $51,775 | $30,236 |
| College or Associate's Degree | $47,838 | $31,230 |
| Bachelor's Degree | - | - |
| Graduate Degree | - | - |
| Total | $46,462 | $32,861 |
Family Income in Sweet Home
Family Income Brackets in Sweet Home
According to the Sweet Home family income data, there are 761 families falling into the $50,000 to $74,999 income range, which is the most common income bracket and makes up 27.8% of all families. Conversely, the $15,000 to $24,999 income bracket is the least frequent group with only 33 families (1.2%) belonging to this category.
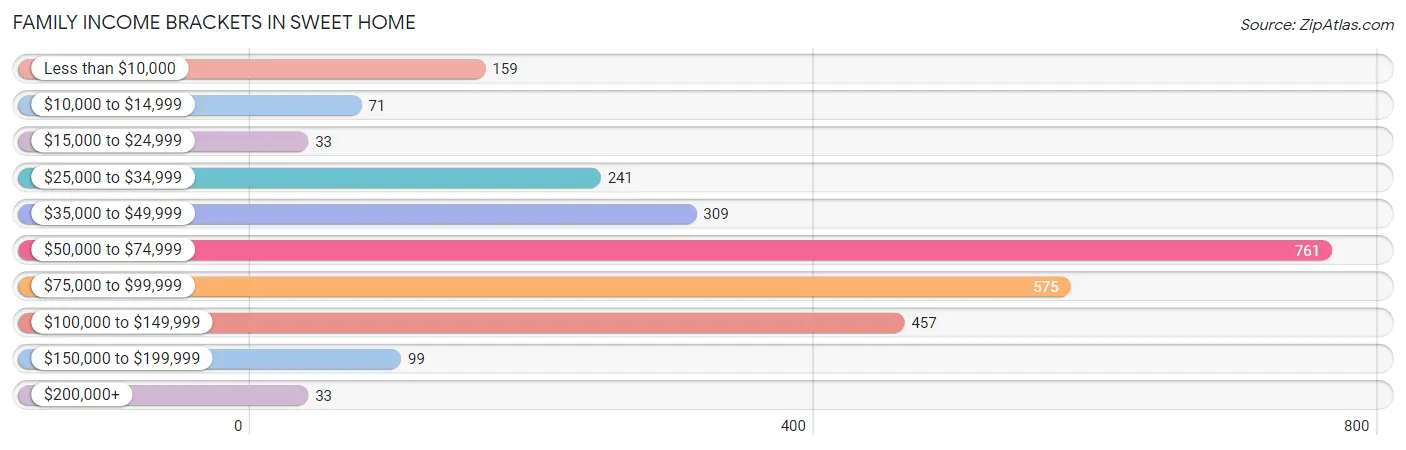
| Income Bracket | # Families | % Families |
| Less than $10,000 | 159 | 5.8% |
| $10,000 to $14,999 | 71 | 2.6% |
| $15,000 to $24,999 | 33 | 1.2% |
| $25,000 to $34,999 | 241 | 8.8% |
| $35,000 to $49,999 | 309 | 11.3% |
| $50,000 to $74,999 | 761 | 27.8% |
| $75,000 to $99,999 | 575 | 21.0% |
| $100,000 to $149,999 | 457 | 16.7% |
| $150,000 to $199,999 | 99 | 3.6% |
| $200,000+ | 33 | 1.2% |
Family Income by Famaliy Size in Sweet Home
5-person families (144 | 5.3%) account for the highest median family income in Sweet Home with $88,654 per family, while 2-person families (1,597 | 58.4%) have the highest median income of $30,970 per family member.
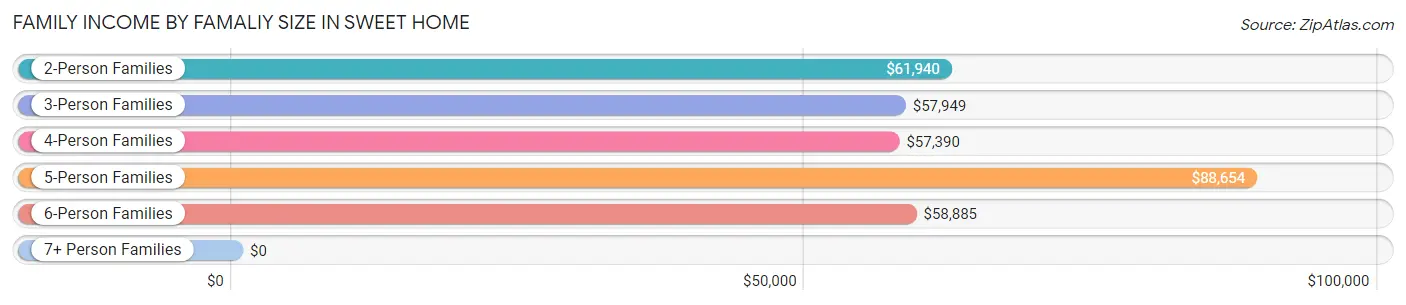
| Income Bracket | # Families | Median Income |
| 2-Person Families | 1,597 (58.4%) | $61,940 |
| 3-Person Families | 468 (17.1%) | $57,949 |
| 4-Person Families | 414 (15.1%) | $57,390 |
| 5-Person Families | 144 (5.3%) | $88,654 |
| 6-Person Families | 95 (3.5%) | $58,885 |
| 7+ Person Families | 19 (0.7%) | $0 |
| Total | 2,737 (100.0%) | $60,028 |
Family Income by Number of Earners in Sweet Home
The median family income in Sweet Home is $60,028, with families comprising 3+ earners (214) having the highest median family income of $84,860, while families with no earners (525) have the lowest median family income of $49,981, accounting for 7.8% and 19.2% of families, respectively.
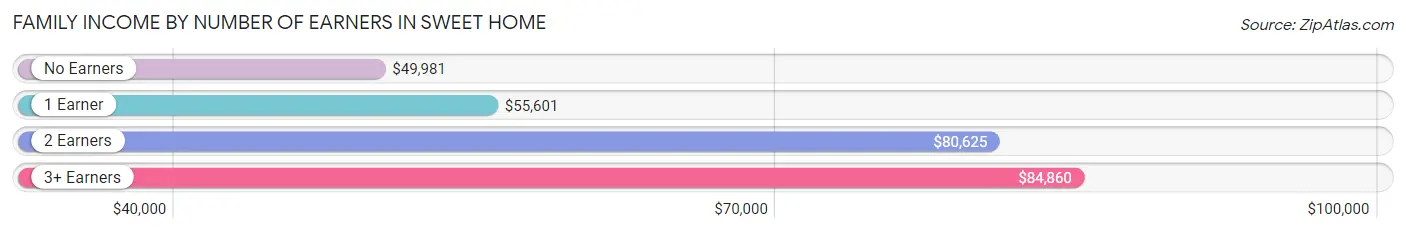
| Number of Earners | # Families | Median Income |
| No Earners | 525 (19.2%) | $49,981 |
| 1 Earner | 1,094 (40.0%) | $55,601 |
| 2 Earners | 904 (33.0%) | $80,625 |
| 3+ Earners | 214 (7.8%) | $84,860 |
| Total | 2,737 (100.0%) | $60,028 |
Household Income in Sweet Home
Household Income Brackets in Sweet Home
With 882 households falling in the category, the $50,000 to $74,999 income range is the most frequent in Sweet Home, accounting for 22.5% of all households. In contrast, only 47 households (1.2%) fall into the $200,000+ income bracket, making it the least populous group.
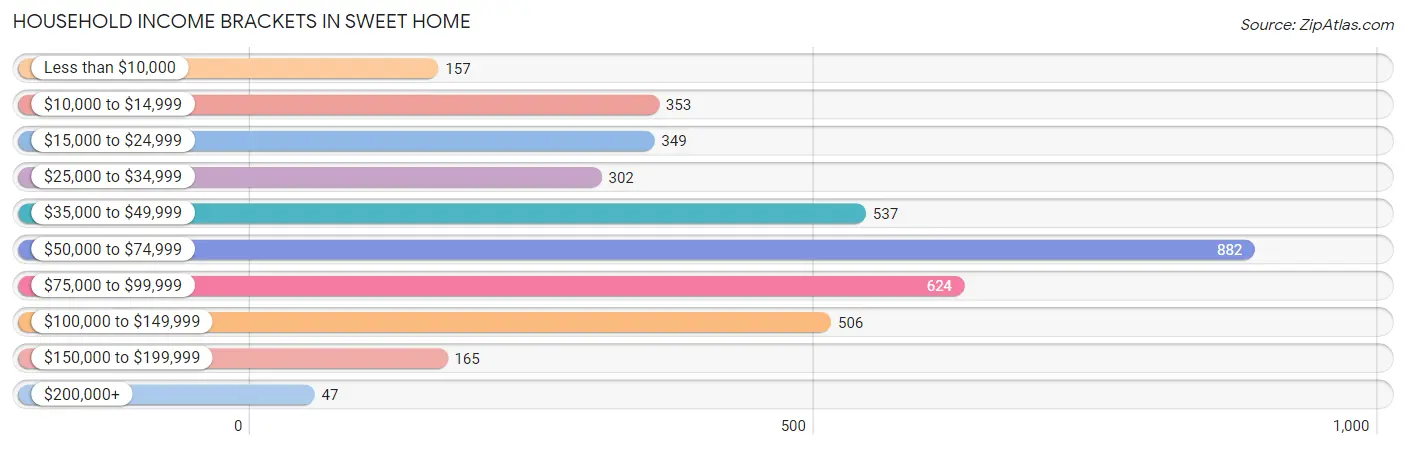
| Income Bracket | # Households | % Households |
| Less than $10,000 | 157 | 4.0% |
| $10,000 to $14,999 | 353 | 9.0% |
| $15,000 to $24,999 | 349 | 8.9% |
| $25,000 to $34,999 | 302 | 7.7% |
| $35,000 to $49,999 | 537 | 13.7% |
| $50,000 to $74,999 | 882 | 22.5% |
| $75,000 to $99,999 | 624 | 15.9% |
| $100,000 to $149,999 | 506 | 12.9% |
| $150,000 to $199,999 | 165 | 4.2% |
| $200,000+ | 47 | 1.2% |
Household Income by Householder Age in Sweet Home
The median household income in Sweet Home is $56,783, with the highest median household income of $65,313 found in the 25 to 44 years age bracket for the primary householder. A total of 1,206 households (30.7%) fall into this category. Meanwhile, the 15 to 24 years age bracket for the primary householder has the lowest median household income of $0, with 52 households (1.3%) in this group.
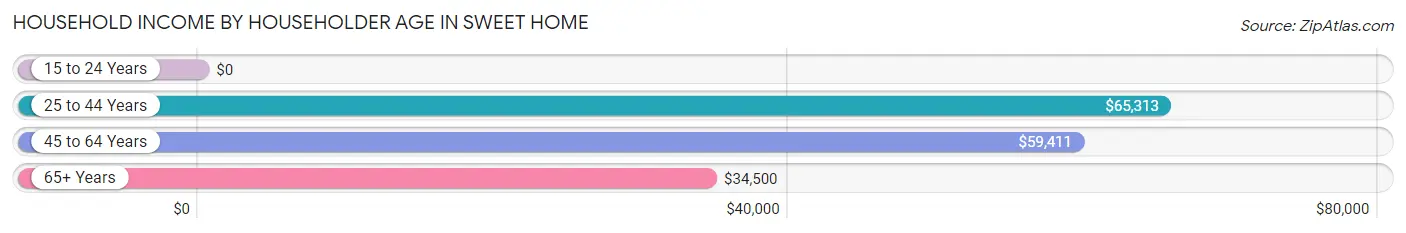
| Income Bracket | # Households | Median Income |
| 15 to 24 Years | 52 (1.3%) | $0 |
| 25 to 44 Years | 1,206 (30.7%) | $65,313 |
| 45 to 64 Years | 1,478 (37.7%) | $59,411 |
| 65+ Years | 1,186 (30.2%) | $34,500 |
| Total | 3,922 (100.0%) | $56,783 |
Poverty in Sweet Home
Income Below Poverty by Sex and Age in Sweet Home
With 15.2% poverty level for males and 19.8% for females among the residents of Sweet Home, 45 to 54 year old males and under 5 year old females are the most vulnerable to poverty, with 131 males (26.6%) and 63 females (35.6%) in their respective age groups living below the poverty level.
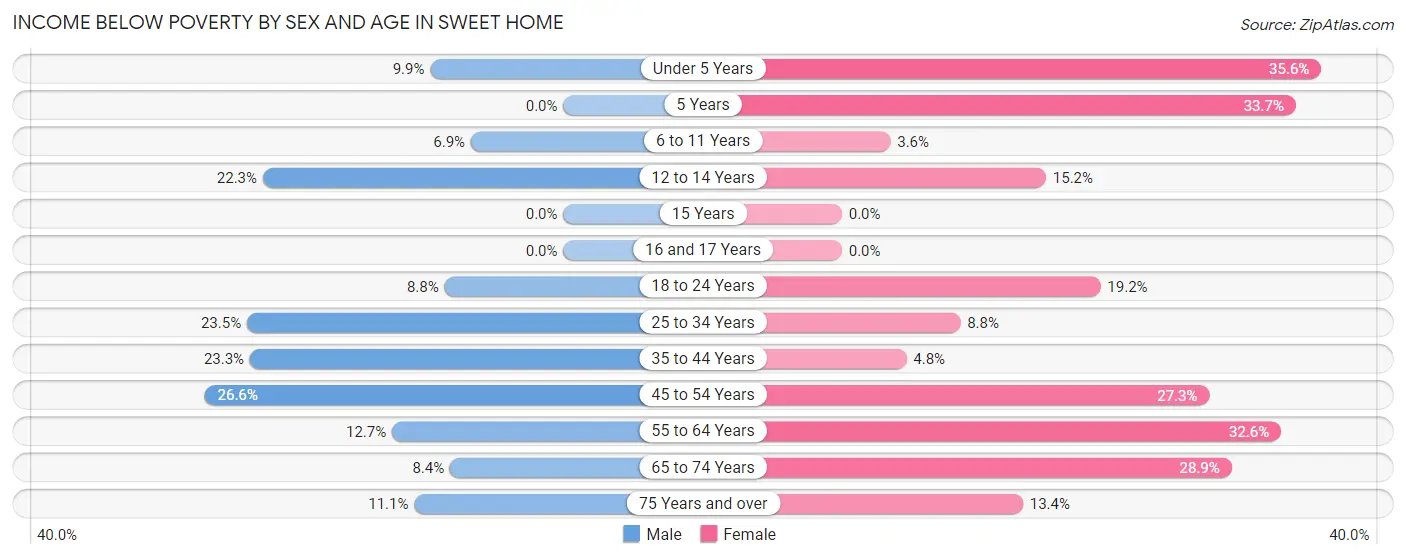
| Age Bracket | Male | Female |
| Under 5 Years | 24 (9.9%) | 63 (35.6%) |
| 5 Years | 0 (0.0%) | 31 (33.7%) |
| 6 to 11 Years | 21 (6.9%) | 10 (3.6%) |
| 12 to 14 Years | 29 (22.3%) | 25 (15.1%) |
| 15 Years | 0 (0.0%) | 0 (0.0%) |
| 16 and 17 Years | 0 (0.0%) | 0 (0.0%) |
| 18 to 24 Years | 35 (8.8%) | 62 (19.2%) |
| 25 to 34 Years | 152 (23.5%) | 43 (8.8%) |
| 35 to 44 Years | 175 (23.3%) | 27 (4.8%) |
| 45 to 54 Years | 131 (26.6%) | 218 (27.3%) |
| 55 to 64 Years | 107 (12.7%) | 226 (32.6%) |
| 65 to 74 Years | 37 (8.4%) | 180 (28.9%) |
| 75 Years and over | 30 (11.1%) | 50 (13.4%) |
| Total | 741 (15.2%) | 935 (19.8%) |
Income Above Poverty by Sex and Age in Sweet Home
According to the poverty statistics in Sweet Home, males aged 5 years and females aged 15 years are the age groups that are most secure financially, with 100.0% of males and 100.0% of females in these age groups living above the poverty line.
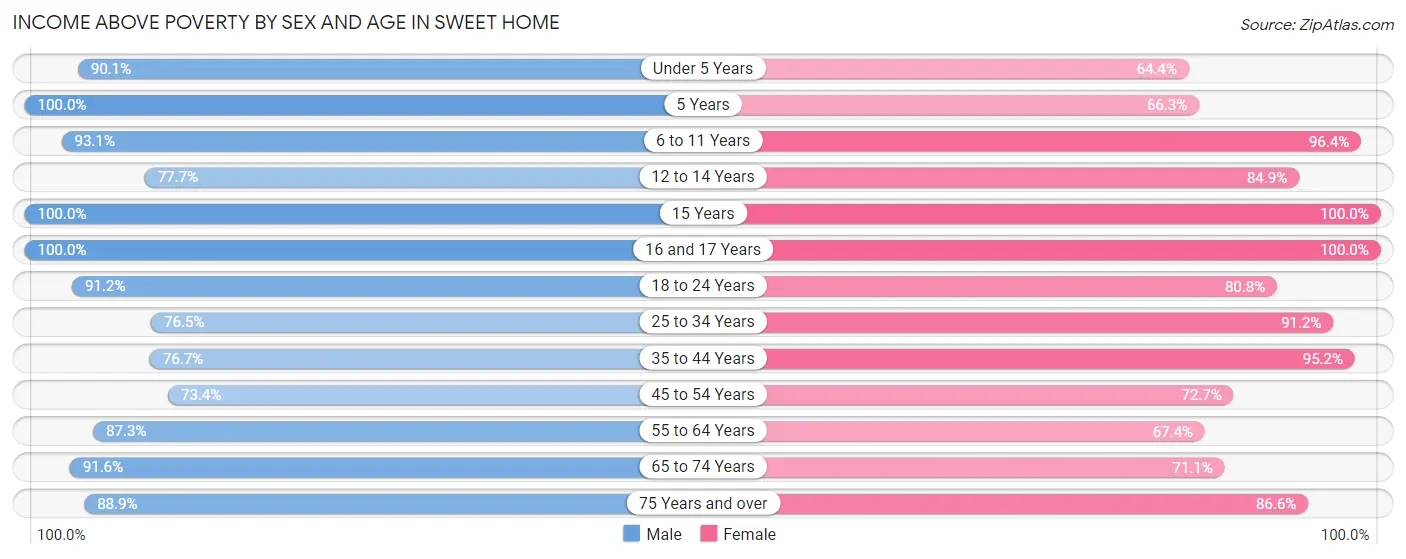
| Age Bracket | Male | Female |
| Under 5 Years | 219 (90.1%) | 114 (64.4%) |
| 5 Years | 21 (100.0%) | 61 (66.3%) |
| 6 to 11 Years | 285 (93.1%) | 268 (96.4%) |
| 12 to 14 Years | 101 (77.7%) | 140 (84.9%) |
| 15 Years | 45 (100.0%) | 24 (100.0%) |
| 16 and 17 Years | 293 (100.0%) | 133 (100.0%) |
| 18 to 24 Years | 362 (91.2%) | 261 (80.8%) |
| 25 to 34 Years | 495 (76.5%) | 446 (91.2%) |
| 35 to 44 Years | 577 (76.7%) | 537 (95.2%) |
| 45 to 54 Years | 361 (73.4%) | 581 (72.7%) |
| 55 to 64 Years | 734 (87.3%) | 467 (67.4%) |
| 65 to 74 Years | 403 (91.6%) | 442 (71.1%) |
| 75 Years and over | 241 (88.9%) | 322 (86.6%) |
| Total | 4,137 (84.8%) | 3,796 (80.2%) |
Income Below Poverty Among Married-Couple Families in Sweet Home
The poverty statistics for married-couple families in Sweet Home show that 7.1% or 127 of the total 1,780 families live below the poverty line. Families with 1 or 2 children have the highest poverty rate of 15.2%, comprising of 76 families. On the other hand, families with no children have the lowest poverty rate of 3.5%, which includes 39 families.
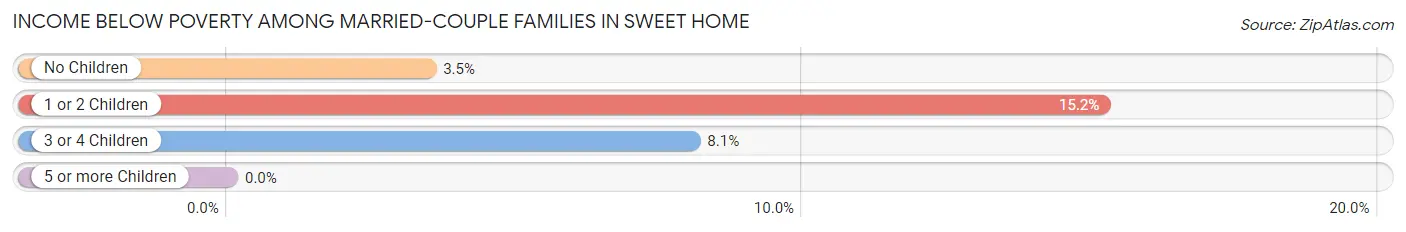
| Children | Above Poverty | Below Poverty |
| No Children | 1,092 (96.6%) | 39 (3.5%) |
| 1 or 2 Children | 424 (84.8%) | 76 (15.2%) |
| 3 or 4 Children | 137 (91.9%) | 12 (8.1%) |
| 5 or more Children | 0 (0.0%) | 0 (0.0%) |
| Total | 1,653 (92.9%) | 127 (7.1%) |
Income Below Poverty Among Single-Parent Households in Sweet Home
According to the poverty data in Sweet Home, 3.8% or 14 single-father households and 18.1% or 106 single-mother households are living below the poverty line. Among single-father households, those with 1 or 2 children have the highest poverty rate, with 14 households (6.0%) experiencing poverty. Likewise, among single-mother households, those with no children have the highest poverty rate, with 63 households (30.7%) falling below the poverty line.
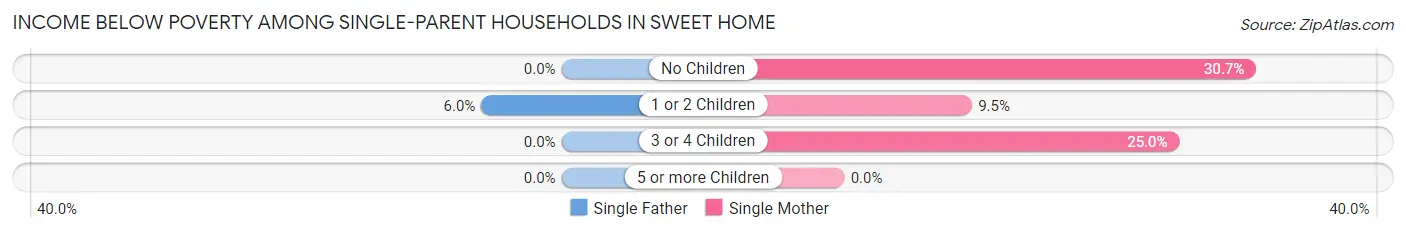
| Children | Single Father | Single Mother |
| No Children | 0 (0.0%) | 63 (30.7%) |
| 1 or 2 Children | 14 (6.0%) | 32 (9.5%) |
| 3 or 4 Children | 0 (0.0%) | 11 (25.0%) |
| 5 or more Children | 0 (0.0%) | 0 (0.0%) |
| Total | 14 (3.8%) | 106 (18.1%) |
Income Below Poverty Among Married-Couple vs Single-Parent Households in Sweet Home
The poverty data for Sweet Home shows that 127 of the married-couple family households (7.1%) and 120 of the single-parent households (12.5%) are living below the poverty level. Within the married-couple family households, those with 1 or 2 children have the highest poverty rate, with 76 households (15.2%) falling below the poverty line. Among the single-parent households, those with 3 or 4 children have the highest poverty rate, with 11 household (20.4%) living below poverty.
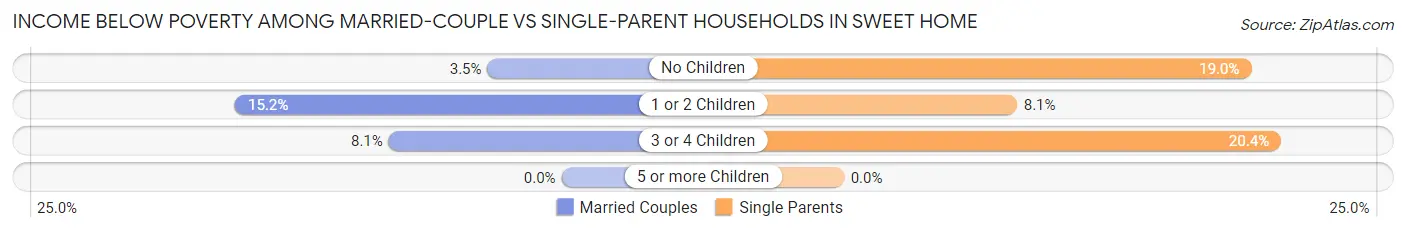
| Children | Married-Couple Families | Single-Parent Households |
| No Children | 39 (3.5%) | 63 (19.0%) |
| 1 or 2 Children | 76 (15.2%) | 46 (8.1%) |
| 3 or 4 Children | 12 (8.1%) | 11 (20.4%) |
| 5 or more Children | 0 (0.0%) | 0 (0.0%) |
| Total | 127 (7.1%) | 120 (12.5%) |
Race in Sweet Home
The most populous races in Sweet Home are White / Caucasian (8,760 | 88.9%), Hispanic or Latino (640 | 6.5%), and Two or more Races (444 | 4.5%).
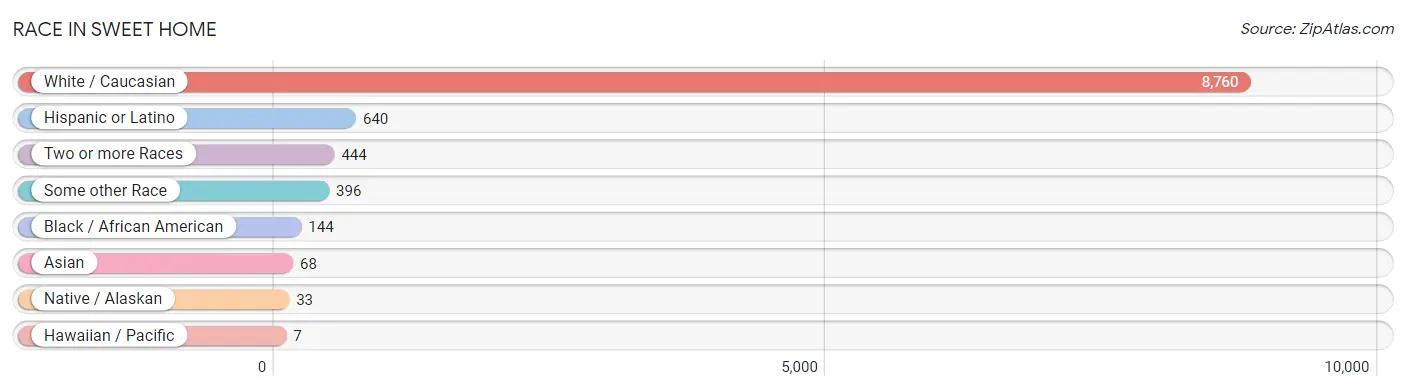
| Race | # Population | % Population |
| Asian | 68 | 0.7% |
| Black / African American | 144 | 1.5% |
| Hawaiian / Pacific | 7 | 0.1% |
| Hispanic or Latino | 640 | 6.5% |
| Native / Alaskan | 33 | 0.3% |
| White / Caucasian | 8,760 | 88.9% |
| Two or more Races | 444 | 4.5% |
| Some other Race | 396 | 4.0% |
| Total | 9,852 | 100.0% |
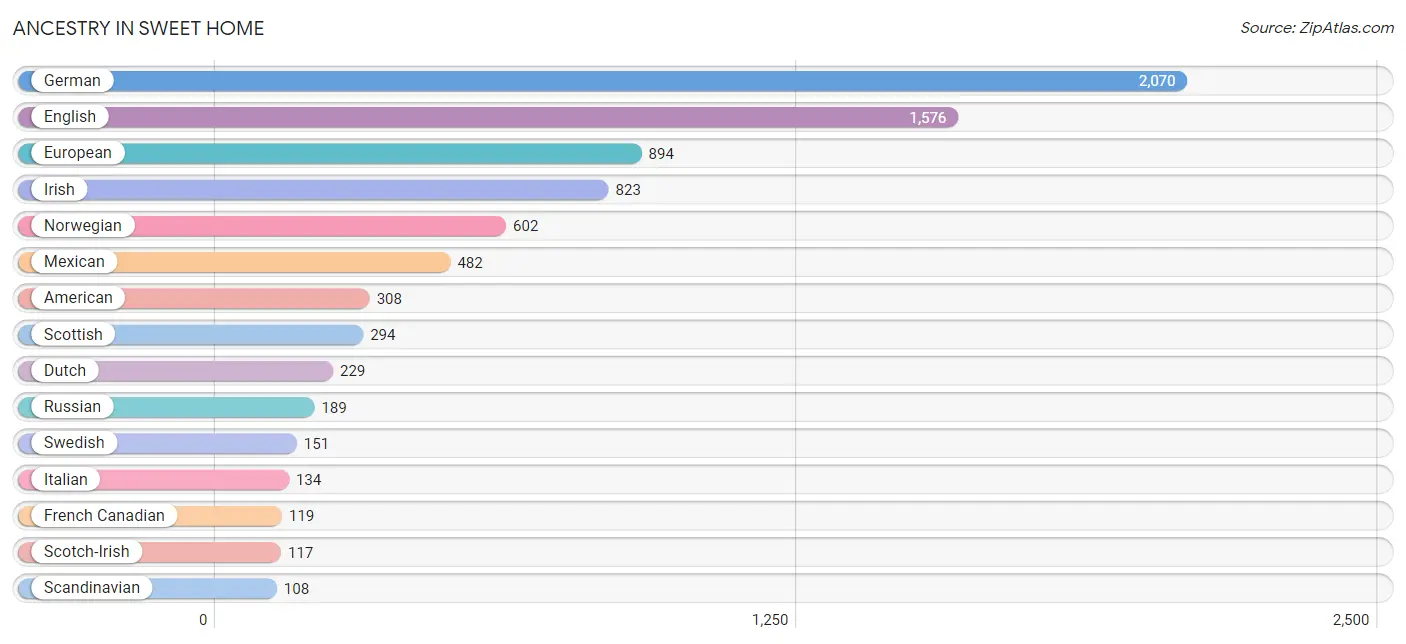
Ancestry in Sweet Home
The most populous ancestries reported in Sweet Home are German (2,070 | 21.0%), English (1,576 | 16.0%), European (894 | 9.1%), Irish (823 | 8.4%), and Norwegian (602 | 6.1%), together accounting for 60.5% of all Sweet Home residents.
| Ancestry | # Population | % Population |
| African | 20 | 0.2% |
| American | 308 | 3.1% |
| Arab | 42 | 0.4% |
| Belgian | 84 | 0.9% |
| British | 75 | 0.8% |
| Cherokee | 66 | 0.7% |
| Choctaw | 39 | 0.4% |
| Danish | 59 | 0.6% |
| Dominican | 20 | 0.2% |
| Dutch | 229 | 2.3% |
| Eastern European | 41 | 0.4% |
| English | 1,576 | 16.0% |
| European | 894 | 9.1% |
| Fijian | 15 | 0.2% |
| French | 103 | 1.1% |
| French Canadian | 119 | 1.2% |
| German | 2,070 | 21.0% |
| Haitian | 25 | 0.3% |
| Hungarian | 11 | 0.1% |
| Indian (Asian) | 24 | 0.2% |
| Irish | 823 | 8.4% |
| Italian | 134 | 1.4% |
| Korean | 44 | 0.4% |
| Lebanese | 8 | 0.1% |
| Mexican | 482 | 4.9% |
| Native Hawaiian | 21 | 0.2% |
| Norwegian | 602 | 6.1% |
| Polish | 31 | 0.3% |
| Portuguese | 47 | 0.5% |
| Puerto Rican | 13 | 0.1% |
| Russian | 189 | 1.9% |
| Scandinavian | 108 | 1.1% |
| Scotch-Irish | 117 | 1.2% |
| Scottish | 294 | 3.0% |
| Serbian | 22 | 0.2% |
| Sri Lankan | 12 | 0.1% |
| Subsaharan African | 20 | 0.2% |
| Swedish | 151 | 1.5% |
| Swiss | 36 | 0.4% |
| Syrian | 34 | 0.4% |
| Ukrainian | 19 | 0.2% |
| Welsh | 10 | 0.1% |
| Yugoslavian | 47 | 0.5% | View All 43 Rows |
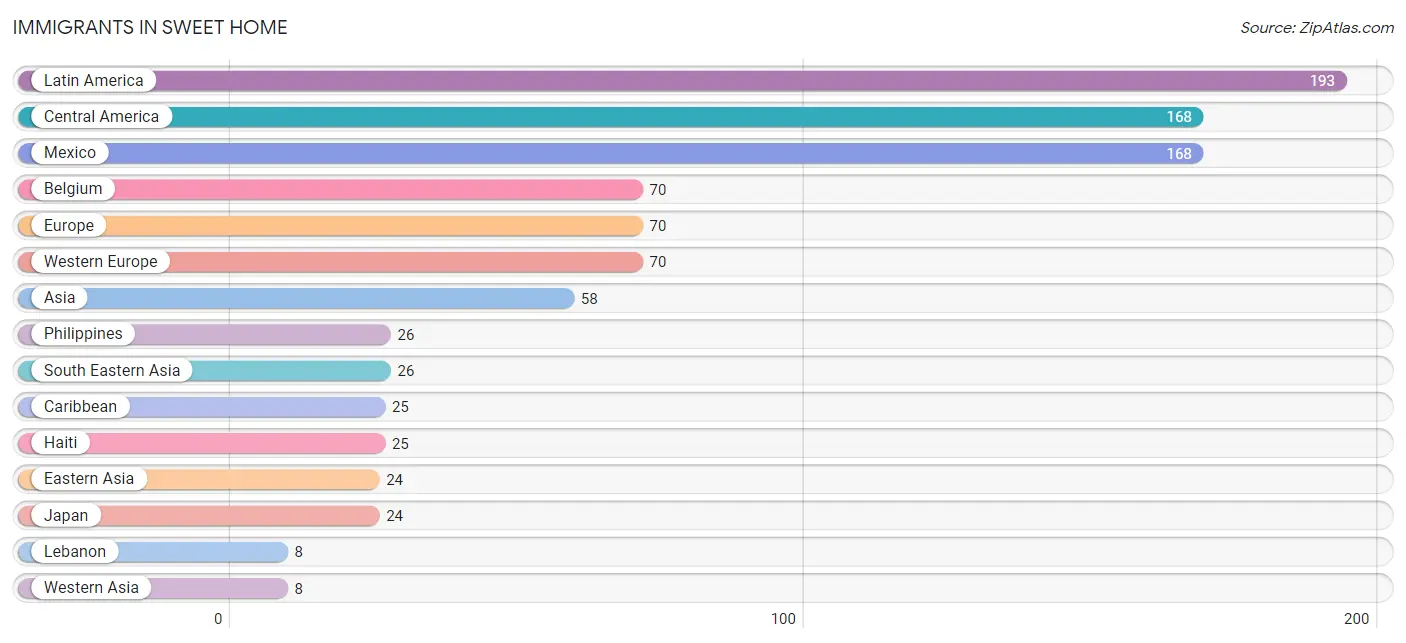
Immigrants in Sweet Home
The most numerous immigrant groups reported in Sweet Home came from Latin America (193 | 2.0%), Central America (168 | 1.7%), Mexico (168 | 1.7%), Belgium (70 | 0.7%), and Europe (70 | 0.7%), together accounting for 6.8% of all Sweet Home residents.
| Immigration Origin | # Population | % Population |
| Asia | 58 | 0.6% |
| Belgium | 70 | 0.7% |
| Caribbean | 25 | 0.3% |
| Central America | 168 | 1.7% |
| Eastern Asia | 24 | 0.2% |
| Europe | 70 | 0.7% |
| Haiti | 25 | 0.3% |
| Japan | 24 | 0.2% |
| Latin America | 193 | 2.0% |
| Lebanon | 8 | 0.1% |
| Mexico | 168 | 1.7% |
| Oceania | 7 | 0.1% |
| Philippines | 26 | 0.3% |
| South Eastern Asia | 26 | 0.3% |
| Western Asia | 8 | 0.1% |
| Western Europe | 70 | 0.7% | View All 16 Rows |
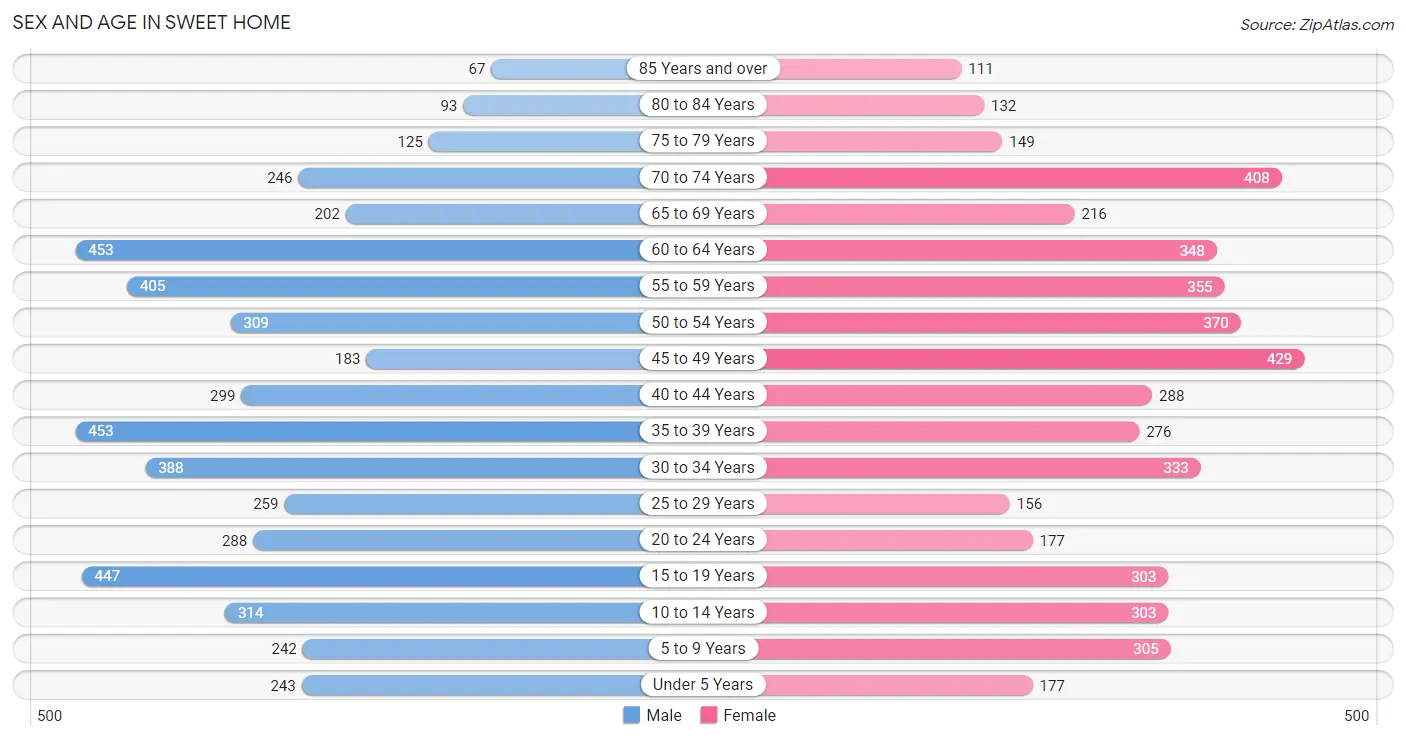
Sex and Age in Sweet Home
Sex and Age in Sweet Home
The most populous age groups in Sweet Home are 35 to 39 Years (453 | 9.0%) for men and 45 to 49 Years (429 | 8.9%) for women.
| Age Bracket | Male | Female |
| Under 5 Years | 243 (4.8%) | 177 (3.7%) |
| 5 to 9 Years | 242 (4.8%) | 305 (6.3%) |
| 10 to 14 Years | 314 (6.3%) | 303 (6.3%) |
| 15 to 19 Years | 447 (8.9%) | 303 (6.3%) |
| 20 to 24 Years | 288 (5.7%) | 177 (3.7%) |
| 25 to 29 Years | 259 (5.2%) | 156 (3.2%) |
| 30 to 34 Years | 388 (7.7%) | 333 (6.9%) |
| 35 to 39 Years | 453 (9.0%) | 276 (5.7%) |
| 40 to 44 Years | 299 (6.0%) | 288 (6.0%) |
| 45 to 49 Years | 183 (3.6%) | 429 (8.9%) |
| 50 to 54 Years | 309 (6.2%) | 370 (7.6%) |
| 55 to 59 Years | 405 (8.1%) | 355 (7.3%) |
| 60 to 64 Years | 453 (9.0%) | 348 (7.2%) |
| 65 to 69 Years | 202 (4.0%) | 216 (4.5%) |
| 70 to 74 Years | 246 (4.9%) | 408 (8.4%) |
| 75 to 79 Years | 125 (2.5%) | 149 (3.1%) |
| 80 to 84 Years | 93 (1.8%) | 132 (2.7%) |
| 85 Years and over | 67 (1.3%) | 111 (2.3%) |
| Total | 5,016 (100.0%) | 4,836 (100.0%) |
Families and Households in Sweet Home
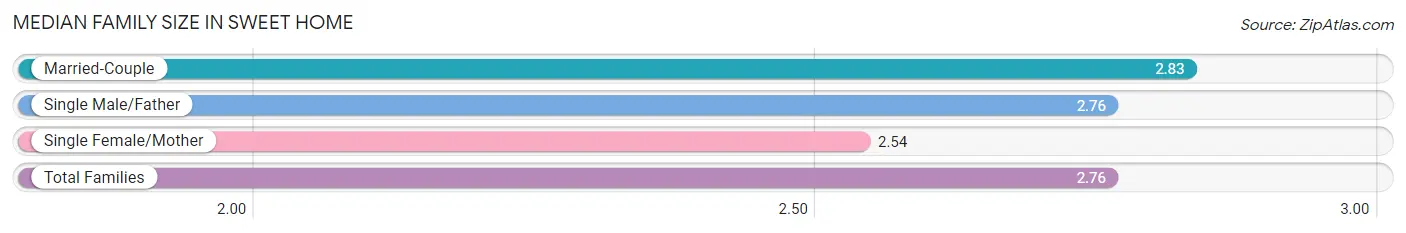
Median Family Size in Sweet Home
The median family size in Sweet Home is 2.76 persons per family, with married-couple families (1,780 | 65.0%) accounting for the largest median family size of 2.83 persons per family. On the other hand, single female/mother families (586 | 21.4%) represent the smallest median family size with 2.54 persons per family.
| Family Type | # Families | Family Size |
| Married-Couple | 1,780 (65.0%) | 2.83 |
| Single Male/Father | 371 (13.6%) | 2.76 |
| Single Female/Mother | 586 (21.4%) | 2.54 |
| Total Families | 2,737 (100.0%) | 2.76 |
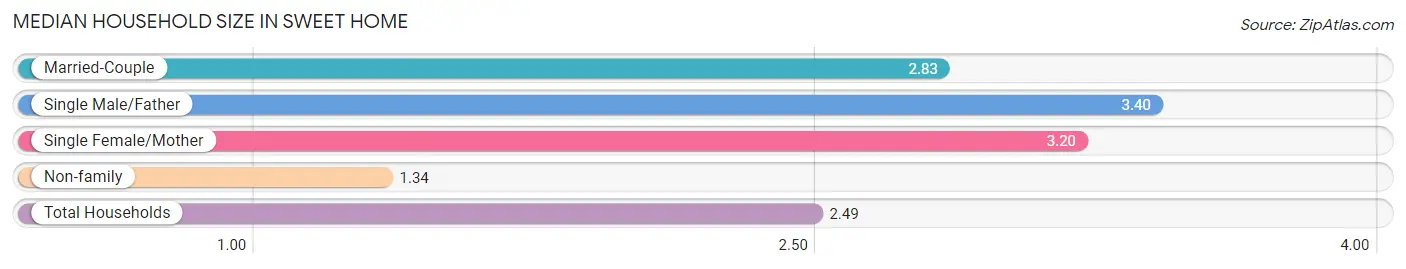
Median Household Size in Sweet Home
The median household size in Sweet Home is 2.49 persons per household, with single male/father households (371 | 9.5%) accounting for the largest median household size of 3.4 persons per household. non-family households (1,185 | 30.2%) represent the smallest median household size with 1.34 persons per household.
| Household Type | # Households | Household Size |
| Married-Couple | 1,780 (45.4%) | 2.83 |
| Single Male/Father | 371 (9.5%) | 3.40 |
| Single Female/Mother | 586 (14.9%) | 3.20 |
| Non-family | 1,185 (30.2%) | 1.34 |
| Total Households | 3,922 (100.0%) | 2.49 |
Household Size by Marriage Status in Sweet Home
Out of a total of 3,922 households in Sweet Home, 2,737 (69.8%) are family households, while 1,185 (30.2%) are nonfamily households. The most numerous type of family households are 2-person households, comprising 1,434, and the most common type of nonfamily households are 1-person households, comprising 799.
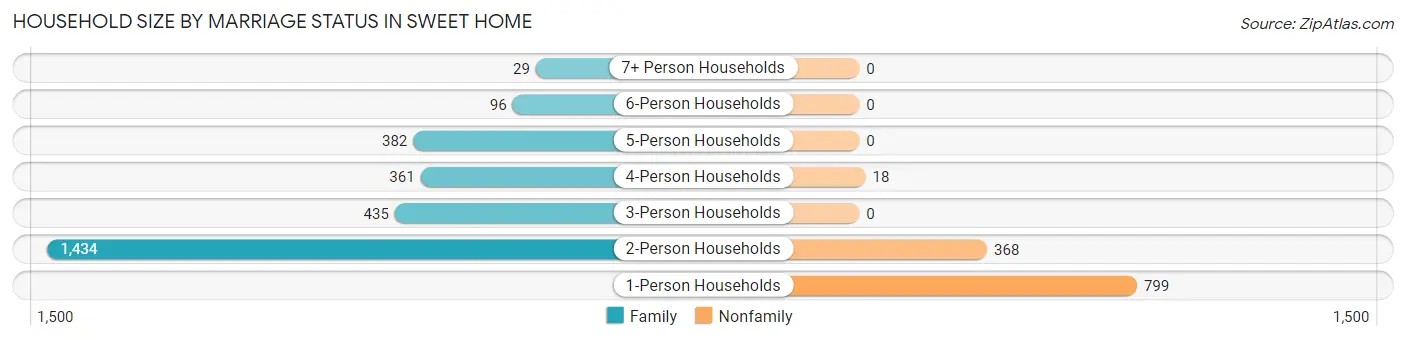
| Household Size | Family Households | Nonfamily Households |
| 1-Person Households | - | 799 (20.4%) |
| 2-Person Households | 1,434 (36.6%) | 368 (9.4%) |
| 3-Person Households | 435 (11.1%) | 0 (0.0%) |
| 4-Person Households | 361 (9.2%) | 18 (0.5%) |
| 5-Person Households | 382 (9.7%) | 0 (0.0%) |
| 6-Person Households | 96 (2.5%) | 0 (0.0%) |
| 7+ Person Households | 29 (0.7%) | 0 (0.0%) |
| Total | 2,737 (69.8%) | 1,185 (30.2%) |
Female Fertility in Sweet Home
Fertility by Age in Sweet Home
Average fertility rate in Sweet Home is 43.0 births per 1,000 women. Women in the age bracket of 20 to 34 years have the highest fertility rate with 89.0 births per 1,000 women. Women in the age bracket of 20 to 34 years acount for 68.6% of all women with births.
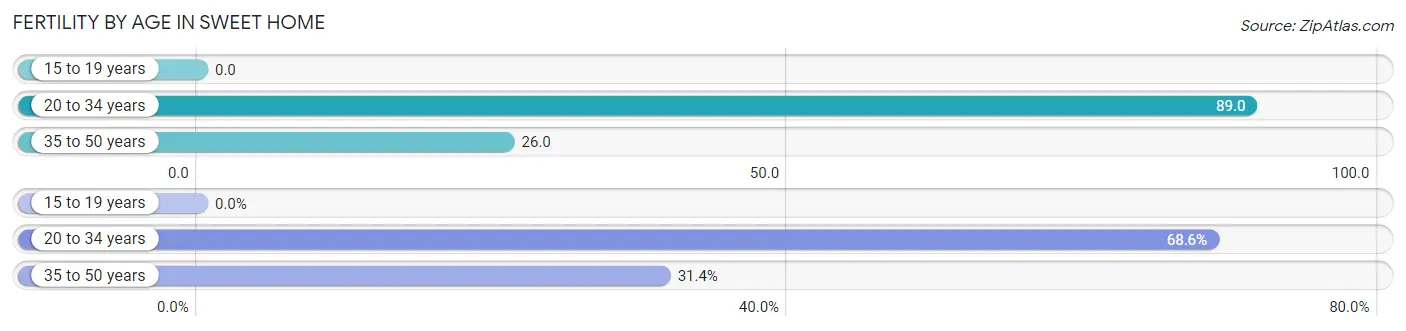
| Age Bracket | Women with Births | Births / 1,000 Women |
| 15 to 19 years | 0 (0.0%) | 0.0 |
| 20 to 34 years | 59 (68.6%) | 89.0 |
| 35 to 50 years | 27 (31.4%) | 26.0 |
| Total | 86 (100.0%) | 43.0 |
Fertility by Age by Marriage Status in Sweet Home
40.7% of women with births (86) in Sweet Home are married. The highest percentage of unmarried women with births falls into 35 to 50 years age bracket with 100.0% of them unmarried at the time of birth, while the lowest percentage of unmarried women with births belong to 20 to 34 years age bracket with 40.7% of them unmarried.
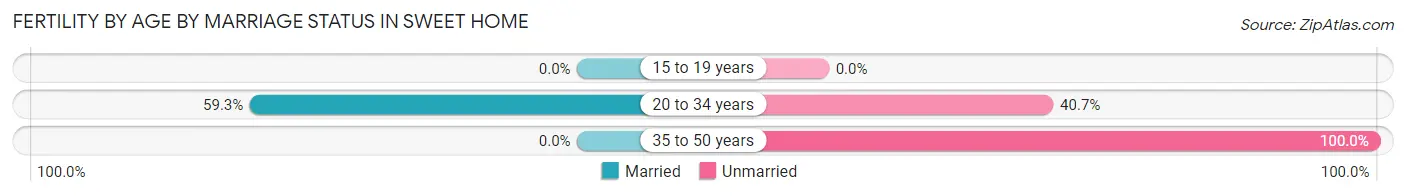
| Age Bracket | Married | Unmarried |
| 15 to 19 years | 0 (0.0%) | 0 (0.0%) |
| 20 to 34 years | 35 (59.3%) | 24 (40.7%) |
| 35 to 50 years | 0 (0.0%) | 27 (100.0%) |
| Total | 35 (40.7%) | 51 (59.3%) |
Fertility by Education in Sweet Home
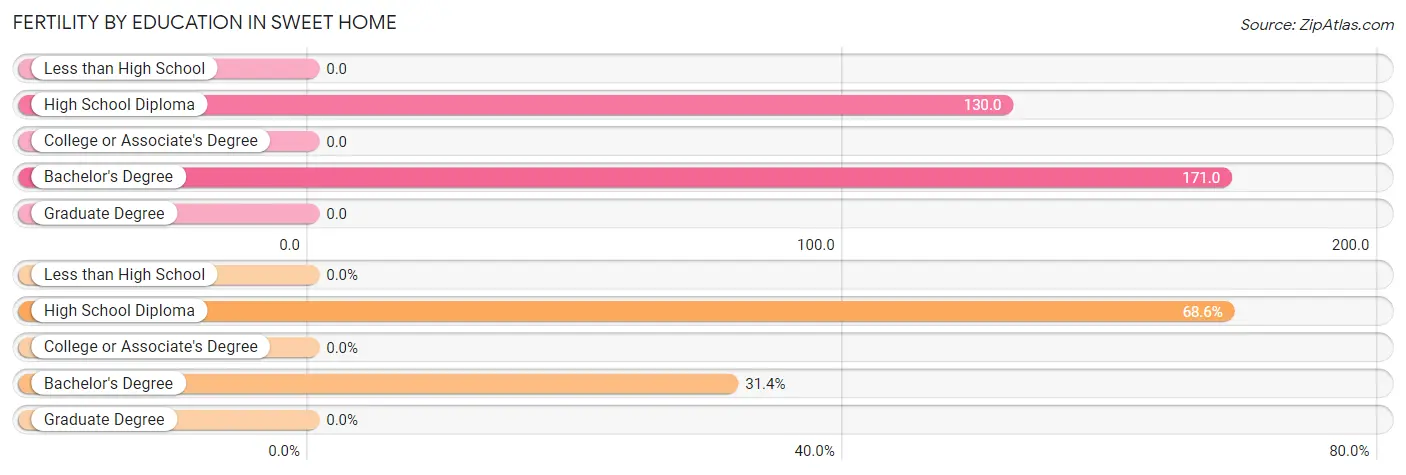
| Educational Attainment | Women with Births | Births / 1,000 Women |
| Less than High School | 0 (0.0%) | 0.0 |
| High School Diploma | 59 (68.6%) | 130.0 |
| College or Associate's Degree | 0 (0.0%) | 0.0 |
| Bachelor's Degree | 27 (31.4%) | 171.0 |
| Graduate Degree | 0 (0.0%) | 0.0 |
| Total | 86 (100.0%) | 43.0 |
Fertility by Education by Marriage Status in Sweet Home
59.3% of women with births in Sweet Home are unmarried. Women with the educational attainment of high school diploma are most likely to be married with 59.3% of them married at childbirth, while women with the educational attainment of bachelor's degree are least likely to be married with 100.0% of them unmarried at childbirth.
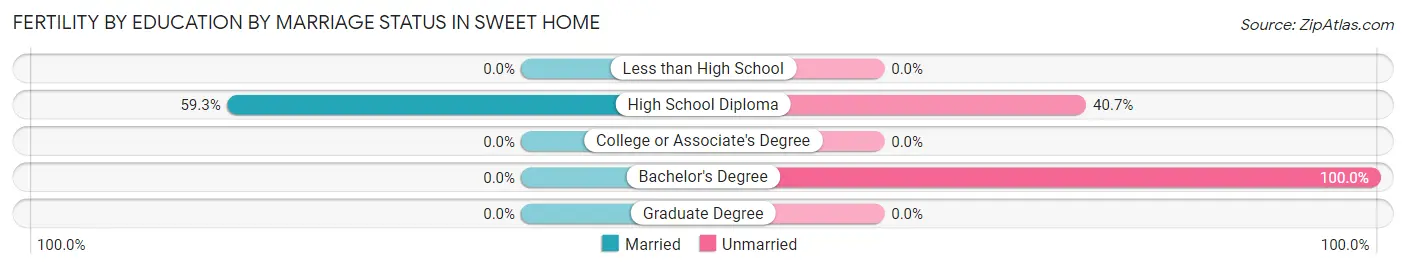
| Educational Attainment | Married | Unmarried |
| Less than High School | 0 (0.0%) | 0 (0.0%) |
| High School Diploma | 35 (59.3%) | 24 (40.7%) |
| College or Associate's Degree | 0 (0.0%) | 0 (0.0%) |
| Bachelor's Degree | 0 (0.0%) | 27 (100.0%) |
| Graduate Degree | 0 (0.0%) | 0 (0.0%) |
| Total | 35 (40.7%) | 51 (59.3%) |
Employment Characteristics in Sweet Home
Employment by Class of Employer in Sweet Home
Among the 3,637 employed individuals in Sweet Home, private company employees (2,702 | 74.3%), not-for-profit organizations (244 | 6.7%), and local government employees (218 | 6.0%) make up the most common classes of employment.
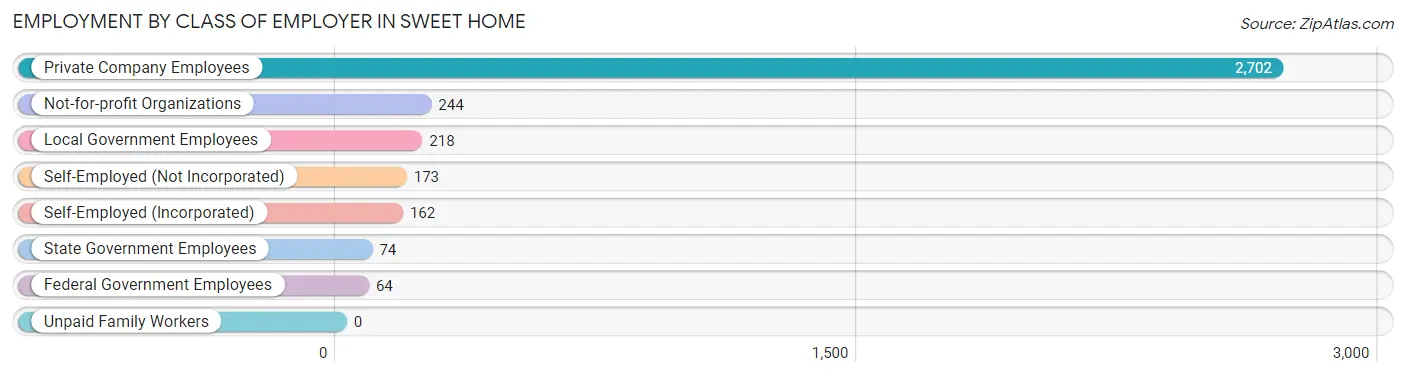
| Employer Class | # Employees | % Employees |
| Private Company Employees | 2,702 | 74.3% |
| Self-Employed (Incorporated) | 162 | 4.4% |
| Self-Employed (Not Incorporated) | 173 | 4.8% |
| Not-for-profit Organizations | 244 | 6.7% |
| Local Government Employees | 218 | 6.0% |
| State Government Employees | 74 | 2.0% |
| Federal Government Employees | 64 | 1.8% |
| Unpaid Family Workers | 0 | 0.0% |
| Total | 3,637 | 100.0% |
Employment Status by Age in Sweet Home
According to the labor force statistics for Sweet Home, out of the total population over 16 years of age (8,199), 49.0% or 4,018 individuals are in the labor force, with 7.8% or 313 of them unemployed. The age group with the highest labor force participation rate is 20 to 24 years, with 90.5% or 421 individuals in the labor force. Within the labor force, the 16 to 19 years age range has the highest percentage of unemployed individuals, with 30.3% or 77 of them being unemployed.
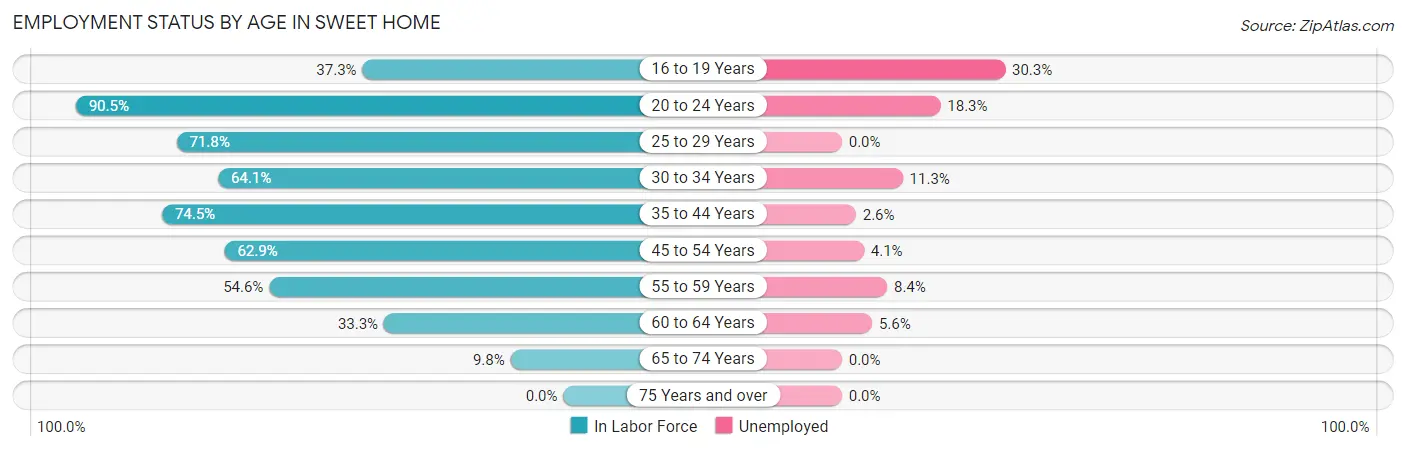
| Age Bracket | In Labor Force | Unemployed |
| 16 to 19 Years | 254 (37.3%) | 77 (30.3%) |
| 20 to 24 Years | 421 (90.5%) | 77 (18.3%) |
| 25 to 29 Years | 298 (71.8%) | 0 (0.0%) |
| 30 to 34 Years | 462 (64.1%) | 52 (11.3%) |
| 35 to 44 Years | 980 (74.5%) | 25 (2.6%) |
| 45 to 54 Years | 812 (62.9%) | 33 (4.1%) |
| 55 to 59 Years | 415 (54.6%) | 35 (8.4%) |
| 60 to 64 Years | 267 (33.3%) | 15 (5.6%) |
| 65 to 74 Years | 105 (9.8%) | 0 (0.0%) |
| 75 Years and over | 0 (0.0%) | 0 (0.0%) |
| Total | 4,018 (49.0%) | 313 (7.8%) |
Employment Status by Educational Attainment in Sweet Home
According to labor force statistics for Sweet Home, 61.0% of individuals (3,235) out of the total population between 25 and 64 years of age (5,304) are in the labor force, with 5.0% or 162 of them being unemployed. The group with the highest labor force participation rate are those with the educational attainment of college / associate degree, with 68.0% or 1,096 individuals in the labor force. Within the labor force, individuals with bachelor's degree or higher education have the highest percentage of unemployment, with 7.8% or 21 of them being unemployed.
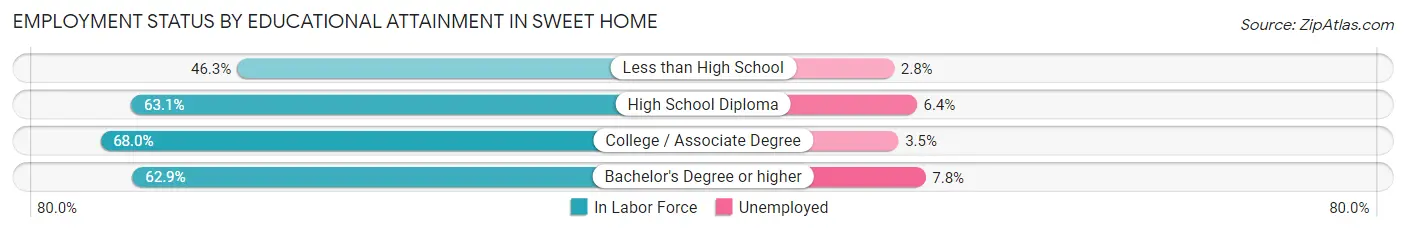
| Educational Attainment | In Labor Force | Unemployed |
| Less than High School | 529 (46.3%) | 32 (2.8%) |
| High School Diploma | 1,339 (63.1%) | 136 (6.4%) |
| College / Associate Degree | 1,096 (68.0%) | 56 (3.5%) |
| Bachelor's Degree or higher | 269 (62.9%) | 33 (7.8%) |
| Total | 3,235 (61.0%) | 265 (5.0%) |
Employment Occupations by Sex in Sweet Home
Management, Business, Science and Arts Occupations
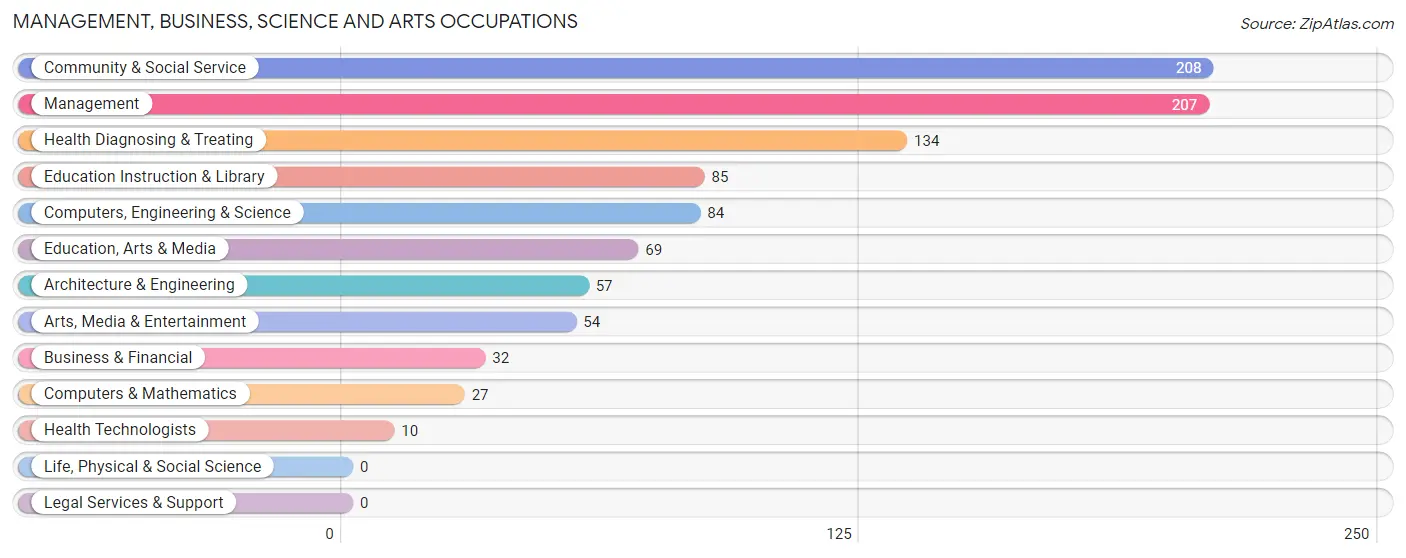
The most common Management, Business, Science and Arts occupations in Sweet Home are Community & Social Service (208 | 5.6%), Management (207 | 5.6%), Health Diagnosing & Treating (134 | 3.6%), Education Instruction & Library (85 | 2.3%), and Computers, Engineering & Science (84 | 2.3%).
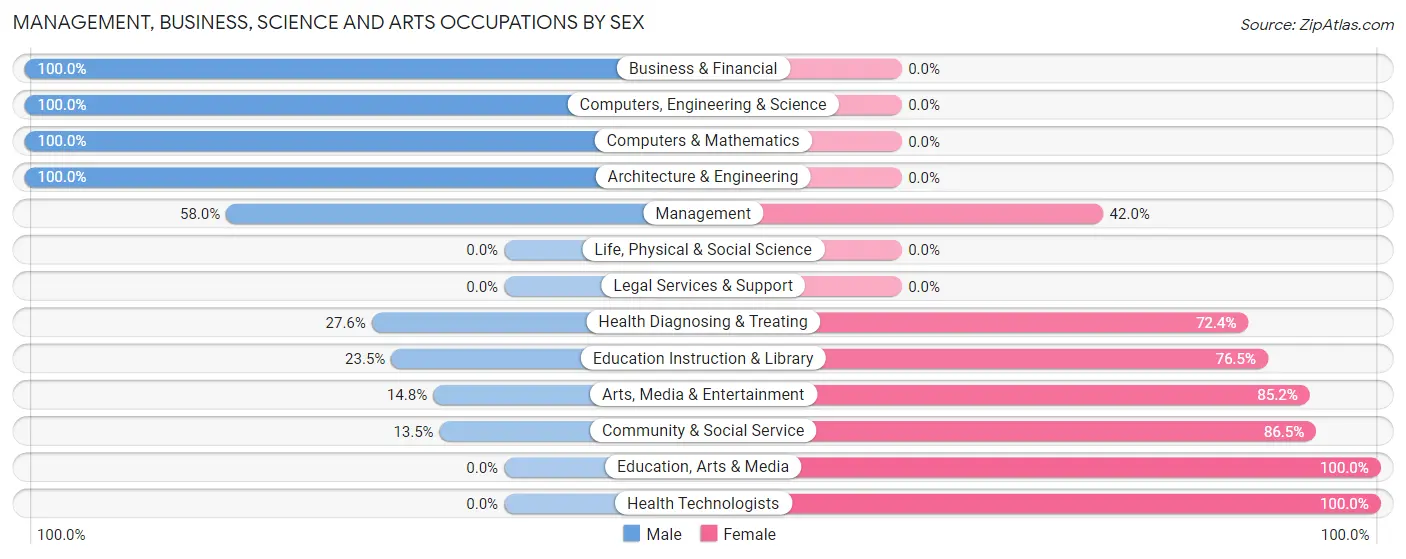
Management, Business, Science and Arts Occupations by Sex
Within the Management, Business, Science and Arts occupations in Sweet Home, the most male-oriented occupations are Business & Financial (100.0%), Computers, Engineering & Science (100.0%), and Computers & Mathematics (100.0%), while the most female-oriented occupations are Education, Arts & Media (100.0%), Health Technologists (100.0%), and Community & Social Service (86.5%).
| Occupation | Male | Female |
| Management | 120 (58.0%) | 87 (42.0%) |
| Business & Financial | 32 (100.0%) | 0 (0.0%) |
| Computers, Engineering & Science | 84 (100.0%) | 0 (0.0%) |
| Computers & Mathematics | 27 (100.0%) | 0 (0.0%) |
| Architecture & Engineering | 57 (100.0%) | 0 (0.0%) |
| Life, Physical & Social Science | 0 (0.0%) | 0 (0.0%) |
| Community & Social Service | 28 (13.5%) | 180 (86.5%) |
| Education, Arts & Media | 0 (0.0%) | 69 (100.0%) |
| Legal Services & Support | 0 (0.0%) | 0 (0.0%) |
| Education Instruction & Library | 20 (23.5%) | 65 (76.5%) |
| Arts, Media & Entertainment | 8 (14.8%) | 46 (85.2%) |
| Health Diagnosing & Treating | 37 (27.6%) | 97 (72.4%) |
| Health Technologists | 0 (0.0%) | 10 (100.0%) |
| Total (Category) | 301 (45.3%) | 364 (54.7%) |
| Total (Overall) | 2,227 (60.4%) | 1,461 (39.6%) |
Services Occupations
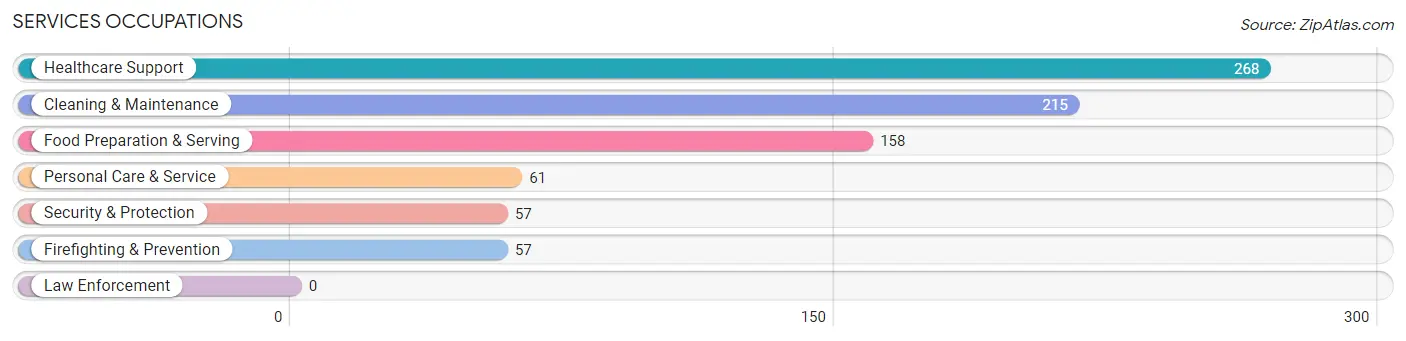
The most common Services occupations in Sweet Home are Healthcare Support (268 | 7.3%), Cleaning & Maintenance (215 | 5.8%), Food Preparation & Serving (158 | 4.3%), Personal Care & Service (61 | 1.7%), and Security & Protection (57 | 1.5%).
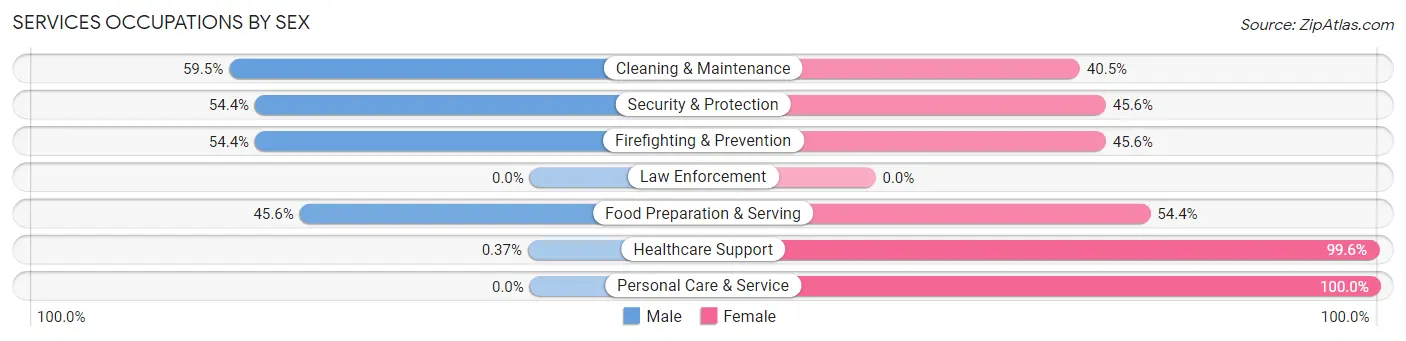
Services Occupations by Sex
Within the Services occupations in Sweet Home, the most male-oriented occupations are Cleaning & Maintenance (59.5%), Security & Protection (54.4%), and Firefighting & Prevention (54.4%), while the most female-oriented occupations are Personal Care & Service (100.0%), Healthcare Support (99.6%), and Food Preparation & Serving (54.4%).
| Occupation | Male | Female |
| Healthcare Support | 1 (0.4%) | 267 (99.6%) |
| Security & Protection | 31 (54.4%) | 26 (45.6%) |
| Firefighting & Prevention | 31 (54.4%) | 26 (45.6%) |
| Law Enforcement | 0 (0.0%) | 0 (0.0%) |
| Food Preparation & Serving | 72 (45.6%) | 86 (54.4%) |
| Cleaning & Maintenance | 128 (59.5%) | 87 (40.5%) |
| Personal Care & Service | 0 (0.0%) | 61 (100.0%) |
| Total (Category) | 232 (30.6%) | 527 (69.4%) |
| Total (Overall) | 2,227 (60.4%) | 1,461 (39.6%) |
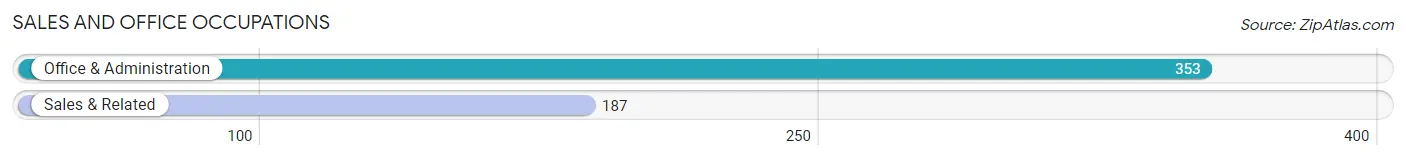
Sales and Office Occupations
The most common Sales and Office occupations in Sweet Home are Office & Administration (353 | 9.6%), and Sales & Related (187 | 5.1%).
Sales and Office Occupations by Sex
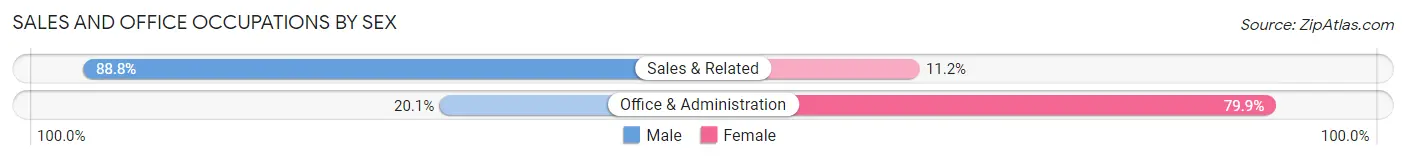
| Occupation | Male | Female |
| Sales & Related | 166 (88.8%) | 21 (11.2%) |
| Office & Administration | 71 (20.1%) | 282 (79.9%) |
| Total (Category) | 237 (43.9%) | 303 (56.1%) |
| Total (Overall) | 2,227 (60.4%) | 1,461 (39.6%) |
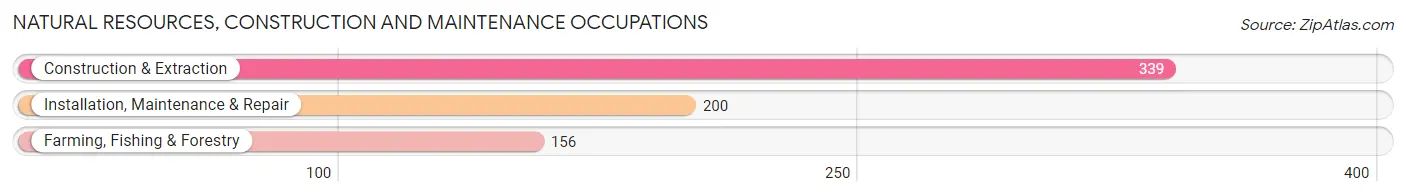
Natural Resources, Construction and Maintenance Occupations
The most common Natural Resources, Construction and Maintenance occupations in Sweet Home are Construction & Extraction (339 | 9.2%), Installation, Maintenance & Repair (200 | 5.4%), and Farming, Fishing & Forestry (156 | 4.2%).
Natural Resources, Construction and Maintenance Occupations by Sex
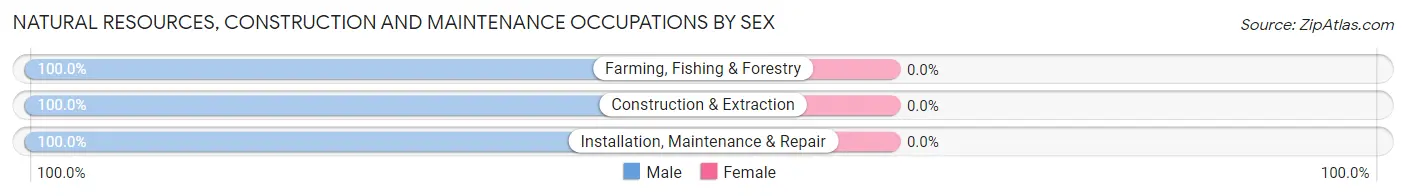
| Occupation | Male | Female |
| Farming, Fishing & Forestry | 156 (100.0%) | 0 (0.0%) |
| Construction & Extraction | 339 (100.0%) | 0 (0.0%) |
| Installation, Maintenance & Repair | 200 (100.0%) | 0 (0.0%) |
| Total (Category) | 695 (100.0%) | 0 (0.0%) |
| Total (Overall) | 2,227 (60.4%) | 1,461 (39.6%) |
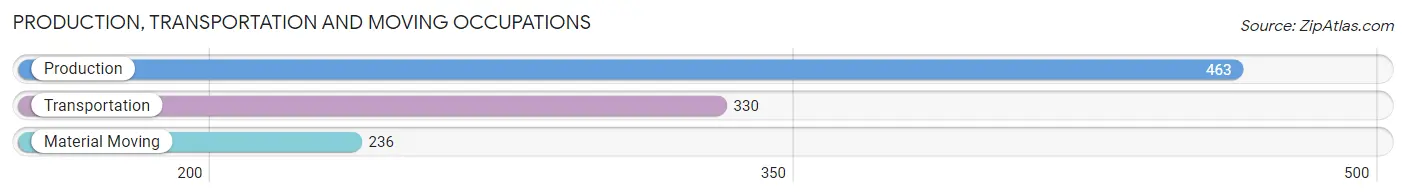
Production, Transportation and Moving Occupations
The most common Production, Transportation and Moving occupations in Sweet Home are Production (463 | 12.6%), Transportation (330 | 8.9%), and Material Moving (236 | 6.4%).
Production, Transportation and Moving Occupations by Sex
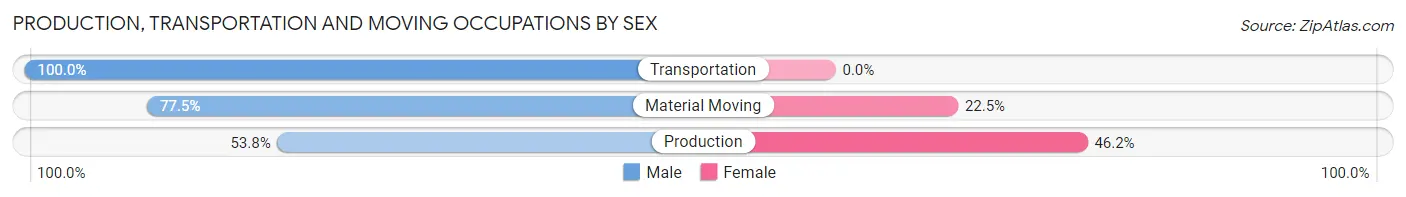
| Occupation | Male | Female |
| Production | 249 (53.8%) | 214 (46.2%) |
| Transportation | 330 (100.0%) | 0 (0.0%) |
| Material Moving | 183 (77.5%) | 53 (22.5%) |
| Total (Category) | 762 (74.1%) | 267 (26.0%) |
| Total (Overall) | 2,227 (60.4%) | 1,461 (39.6%) |
Employment Industries by Sex in Sweet Home
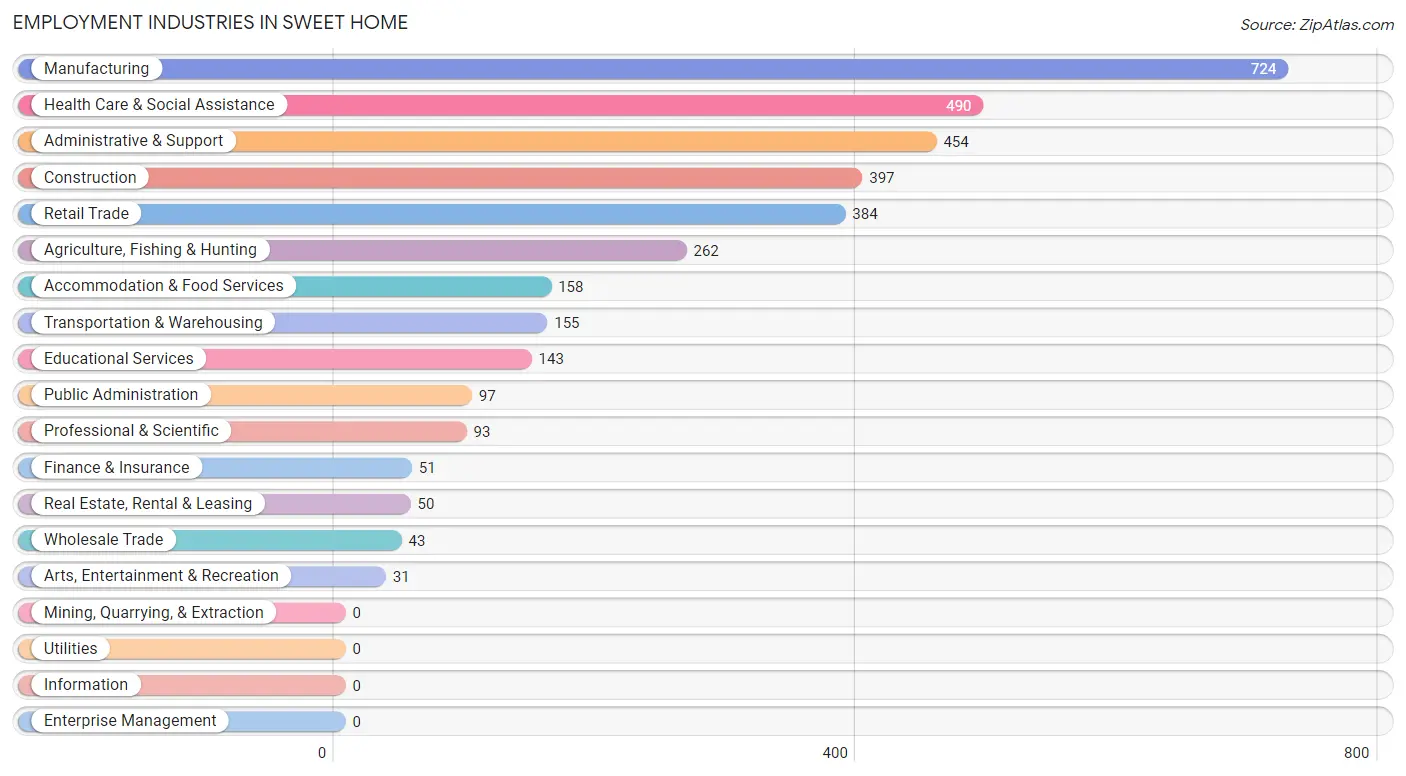
Employment Industries in Sweet Home
The major employment industries in Sweet Home include Manufacturing (724 | 19.6%), Health Care & Social Assistance (490 | 13.3%), Administrative & Support (454 | 12.3%), Construction (397 | 10.8%), and Retail Trade (384 | 10.4%).
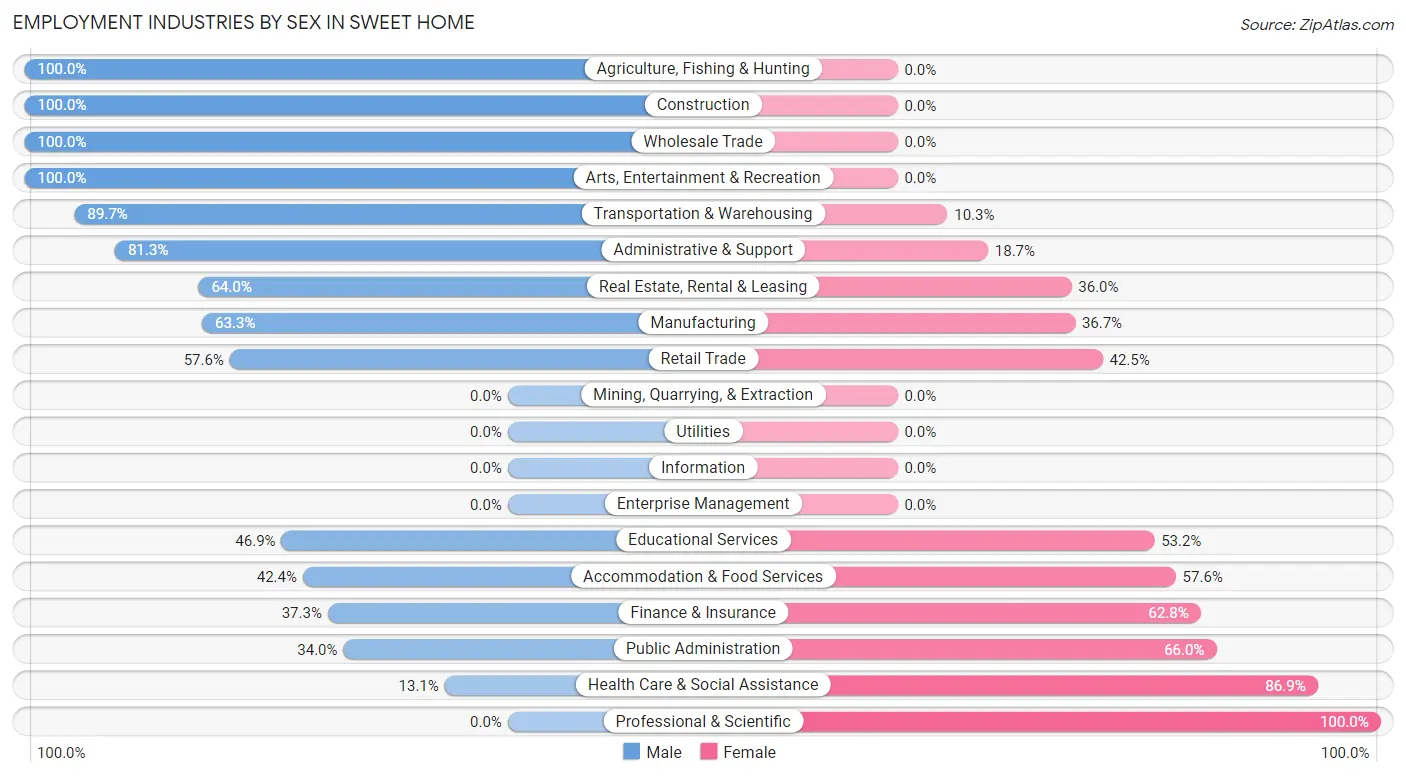
Employment Industries by Sex in Sweet Home
The Sweet Home industries that see more men than women are Agriculture, Fishing & Hunting (100.0%), Construction (100.0%), and Wholesale Trade (100.0%), whereas the industries that tend to have a higher number of women are Professional & Scientific (100.0%), Health Care & Social Assistance (86.9%), and Public Administration (66.0%).
| Industry | Male | Female |
| Agriculture, Fishing & Hunting | 262 (100.0%) | 0 (0.0%) |
| Mining, Quarrying, & Extraction | 0 (0.0%) | 0 (0.0%) |
| Construction | 397 (100.0%) | 0 (0.0%) |
| Manufacturing | 458 (63.3%) | 266 (36.7%) |
| Wholesale Trade | 43 (100.0%) | 0 (0.0%) |
| Retail Trade | 221 (57.6%) | 163 (42.4%) |
| Transportation & Warehousing | 139 (89.7%) | 16 (10.3%) |
| Utilities | 0 (0.0%) | 0 (0.0%) |
| Information | 0 (0.0%) | 0 (0.0%) |
| Finance & Insurance | 19 (37.2%) | 32 (62.7%) |
| Real Estate, Rental & Leasing | 32 (64.0%) | 18 (36.0%) |
| Professional & Scientific | 0 (0.0%) | 93 (100.0%) |
| Enterprise Management | 0 (0.0%) | 0 (0.0%) |
| Administrative & Support | 369 (81.3%) | 85 (18.7%) |
| Educational Services | 67 (46.9%) | 76 (53.1%) |
| Health Care & Social Assistance | 64 (13.1%) | 426 (86.9%) |
| Arts, Entertainment & Recreation | 31 (100.0%) | 0 (0.0%) |
| Accommodation & Food Services | 67 (42.4%) | 91 (57.6%) |
| Public Administration | 33 (34.0%) | 64 (66.0%) |
| Total | 2,227 (60.4%) | 1,461 (39.6%) |
Education in Sweet Home
School Enrollment in Sweet Home
The most common levels of schooling among the 2,112 students in Sweet Home are high school (677 | 32.1%), middle school (530 | 25.1%), and elementary school (366 | 17.3%).
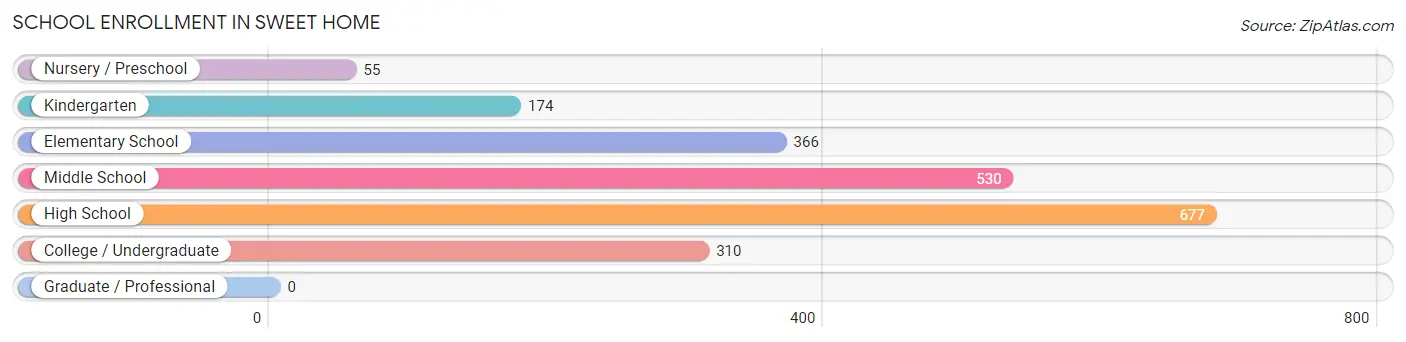
| School Level | # Students | % Students |
| Nursery / Preschool | 55 | 2.6% |
| Kindergarten | 174 | 8.2% |
| Elementary School | 366 | 17.3% |
| Middle School | 530 | 25.1% |
| High School | 677 | 32.1% |
| College / Undergraduate | 310 | 14.7% |
| Graduate / Professional | 0 | 0.0% |
| Total | 2,112 | 100.0% |
School Enrollment by Age by Funding Source in Sweet Home
Out of a total of 2,112 students who are enrolled in schools in Sweet Home, 120 (5.7%) attend a private institution, while the remaining 1,992 (94.3%) are enrolled in public schools. The age group of 3 to 4 year olds has the highest likelihood of being enrolled in private schools, with 18 (32.7% in the age bracket) enrolled. Conversely, the age group of 15 to 17 year olds has the lowest likelihood of being enrolled in a private school, with 495 (100.0% in the age bracket) attending a public institution.
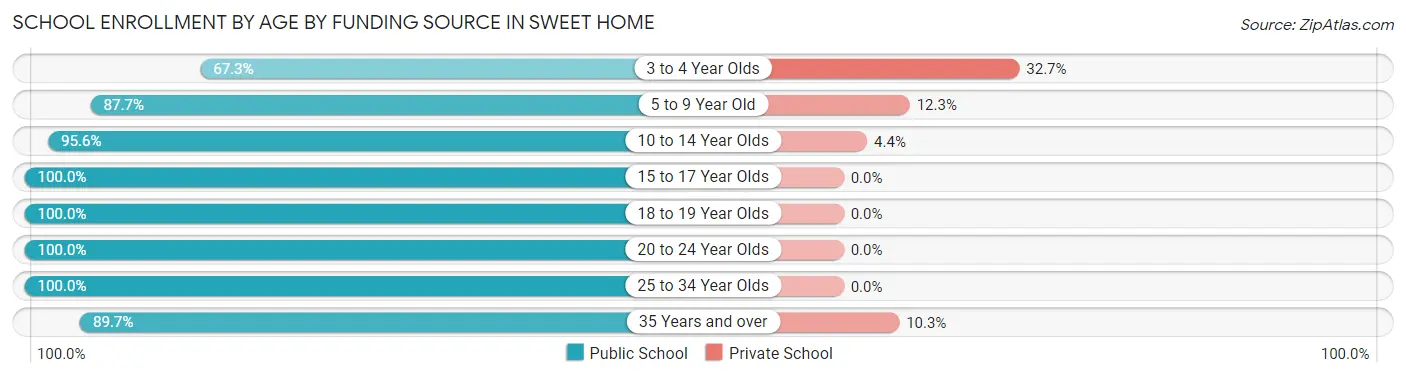
| Age Bracket | Public School | Private School |
| 3 to 4 Year Olds | 37 (67.3%) | 18 (32.7%) |
| 5 to 9 Year Old | 428 (87.7%) | 60 (12.3%) |
| 10 to 14 Year Olds | 590 (95.6%) | 27 (4.4%) |
| 15 to 17 Year Olds | 495 (100.0%) | 0 (0.0%) |
| 18 to 19 Year Olds | 183 (100.0%) | 0 (0.0%) |
| 20 to 24 Year Olds | 63 (100.0%) | 0 (0.0%) |
| 25 to 34 Year Olds | 66 (100.0%) | 0 (0.0%) |
| 35 Years and over | 130 (89.7%) | 15 (10.3%) |
| Total | 1,992 (94.3%) | 120 (5.7%) |
Educational Attainment by Field of Study in Sweet Home
Bio, nature & agricultural (124 | 19.1%), arts & humanities (101 | 15.6%), business (67 | 10.3%), visual & performing arts (58 | 8.9%), and education (55 | 8.5%) are the most common fields of study among 649 individuals in Sweet Home who have obtained a bachelor's degree or higher.
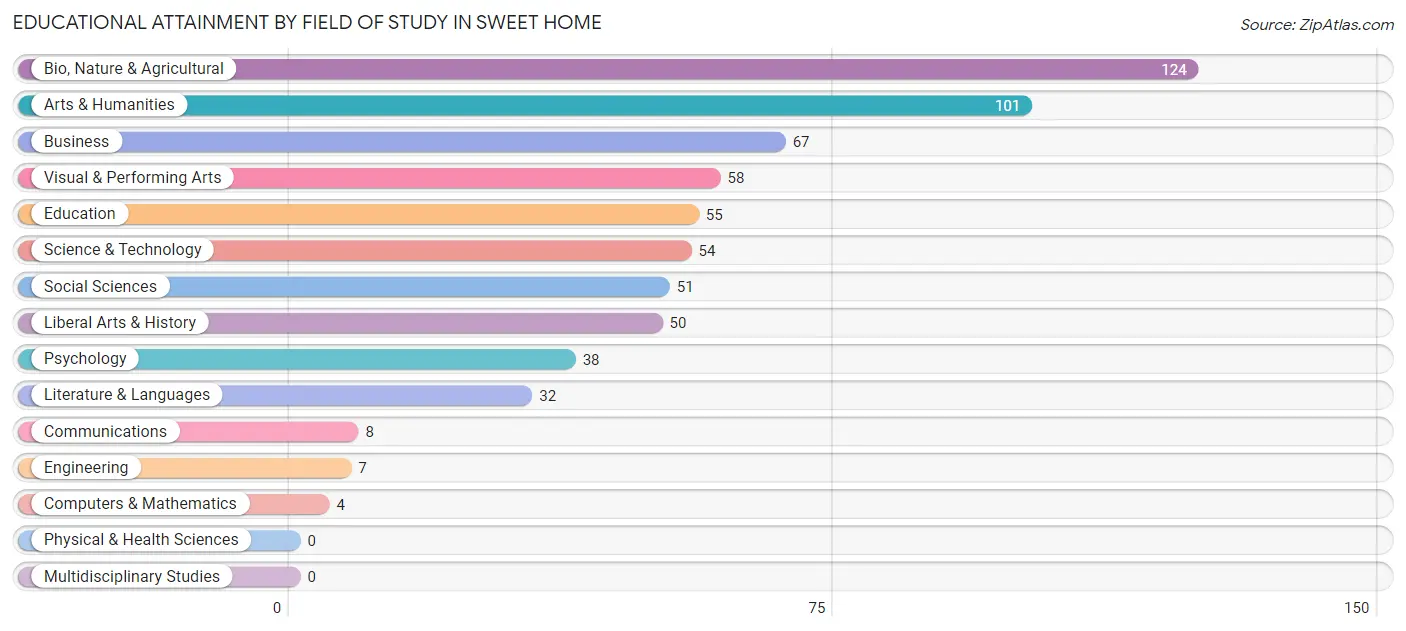
| Field of Study | # Graduates | % Graduates |
| Computers & Mathematics | 4 | 0.6% |
| Bio, Nature & Agricultural | 124 | 19.1% |
| Physical & Health Sciences | 0 | 0.0% |
| Psychology | 38 | 5.9% |
| Social Sciences | 51 | 7.9% |
| Engineering | 7 | 1.1% |
| Multidisciplinary Studies | 0 | 0.0% |
| Science & Technology | 54 | 8.3% |
| Business | 67 | 10.3% |
| Education | 55 | 8.5% |
| Literature & Languages | 32 | 4.9% |
| Liberal Arts & History | 50 | 7.7% |
| Visual & Performing Arts | 58 | 8.9% |
| Communications | 8 | 1.2% |
| Arts & Humanities | 101 | 15.6% |
| Total | 649 | 100.0% |
Transportation & Commute in Sweet Home
Vehicle Availability by Sex in Sweet Home
The most prevalent vehicle ownership categories in Sweet Home are males with 2 vehicles (707, accounting for 32.2%) and females with 2 vehicles (249, making up 49.3%).
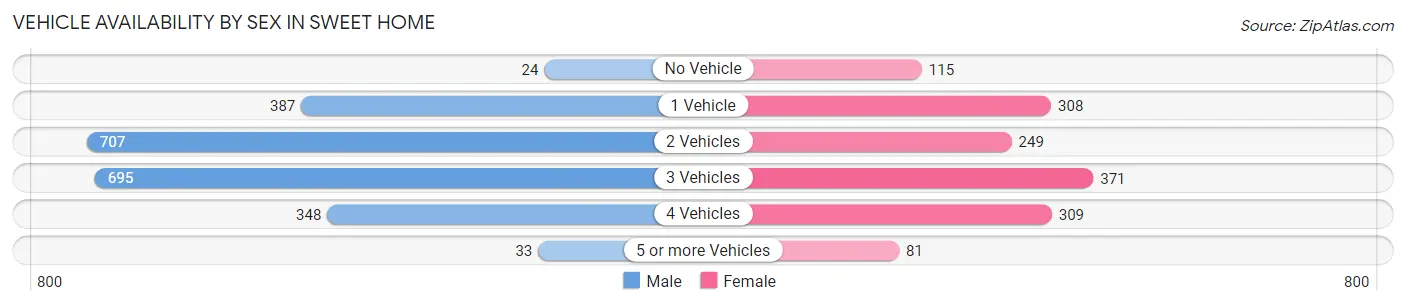
| Vehicles Available | Male | Female |
| No Vehicle | 24 (1.1%) | 115 (8.0%) |
| 1 Vehicle | 387 (17.6%) | 308 (21.5%) |
| 2 Vehicles | 707 (32.2%) | 249 (17.4%) |
| 3 Vehicles | 695 (31.7%) | 371 (25.9%) |
| 4 Vehicles | 348 (15.9%) | 309 (21.6%) |
| 5 or more Vehicles | 33 (1.5%) | 81 (5.7%) |
| Total | 2,194 (100.0%) | 1,433 (100.0%) |
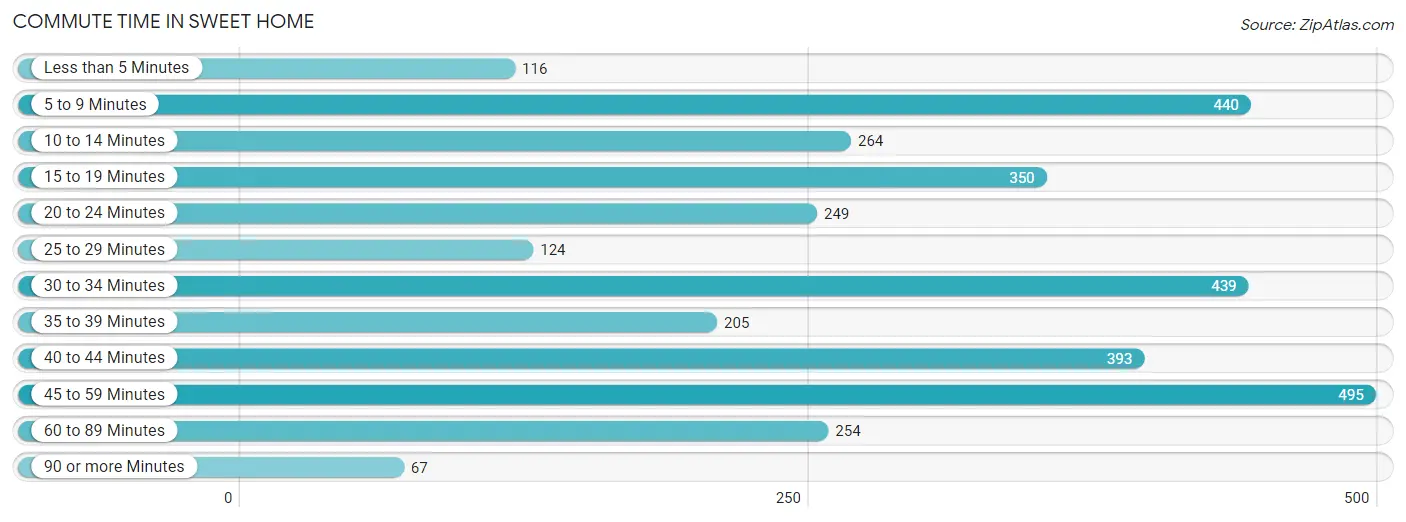
Commute Time in Sweet Home
The most frequently occuring commute durations in Sweet Home are 45 to 59 minutes (495 commuters, 14.6%), 5 to 9 minutes (440 commuters, 13.0%), and 30 to 34 minutes (439 commuters, 12.9%).
| Commute Time | # Commuters | % Commuters |
| Less than 5 Minutes | 116 | 3.4% |
| 5 to 9 Minutes | 440 | 13.0% |
| 10 to 14 Minutes | 264 | 7.8% |
| 15 to 19 Minutes | 350 | 10.3% |
| 20 to 24 Minutes | 249 | 7.3% |
| 25 to 29 Minutes | 124 | 3.6% |
| 30 to 34 Minutes | 439 | 12.9% |
| 35 to 39 Minutes | 205 | 6.0% |
| 40 to 44 Minutes | 393 | 11.6% |
| 45 to 59 Minutes | 495 | 14.6% |
| 60 to 89 Minutes | 254 | 7.5% |
| 90 or more Minutes | 67 | 2.0% |
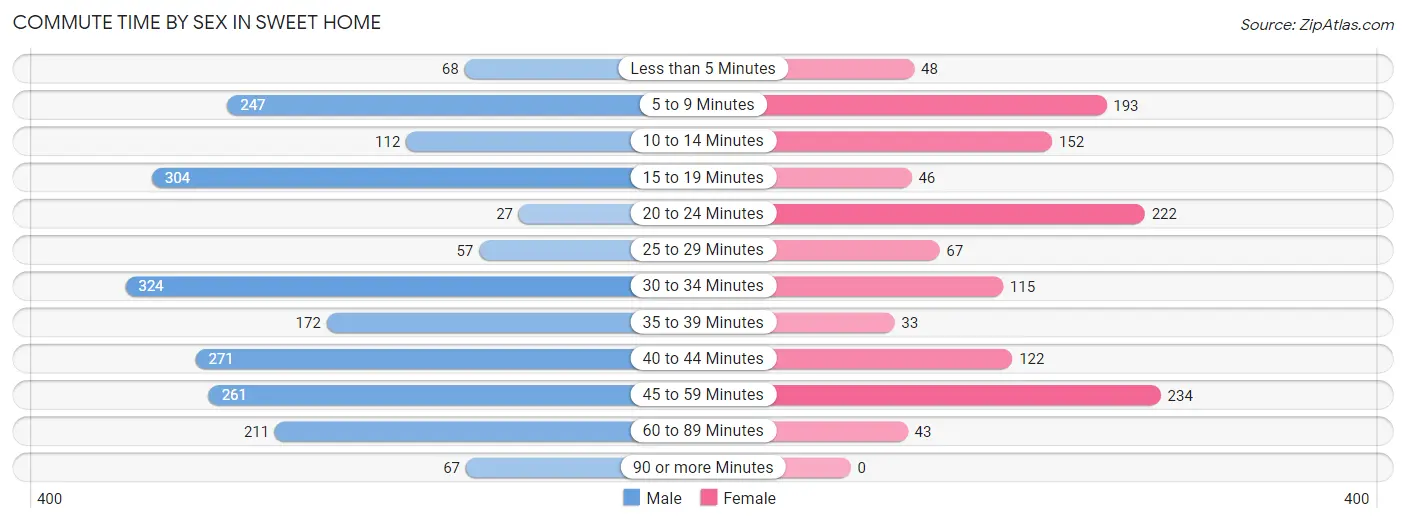
Commute Time by Sex in Sweet Home
The most common commute times in Sweet Home are 30 to 34 minutes (324 commuters, 15.3%) for males and 45 to 59 minutes (234 commuters, 18.3%) for females.
| Commute Time | Male | Female |
| Less than 5 Minutes | 68 (3.2%) | 48 (3.8%) |
| 5 to 9 Minutes | 247 (11.7%) | 193 (15.1%) |
| 10 to 14 Minutes | 112 (5.3%) | 152 (11.9%) |
| 15 to 19 Minutes | 304 (14.3%) | 46 (3.6%) |
| 20 to 24 Minutes | 27 (1.3%) | 222 (17.4%) |
| 25 to 29 Minutes | 57 (2.7%) | 67 (5.2%) |
| 30 to 34 Minutes | 324 (15.3%) | 115 (9.0%) |
| 35 to 39 Minutes | 172 (8.1%) | 33 (2.6%) |
| 40 to 44 Minutes | 271 (12.8%) | 122 (9.6%) |
| 45 to 59 Minutes | 261 (12.3%) | 234 (18.3%) |
| 60 to 89 Minutes | 211 (10.0%) | 43 (3.4%) |
| 90 or more Minutes | 67 (3.2%) | 0 (0.0%) |
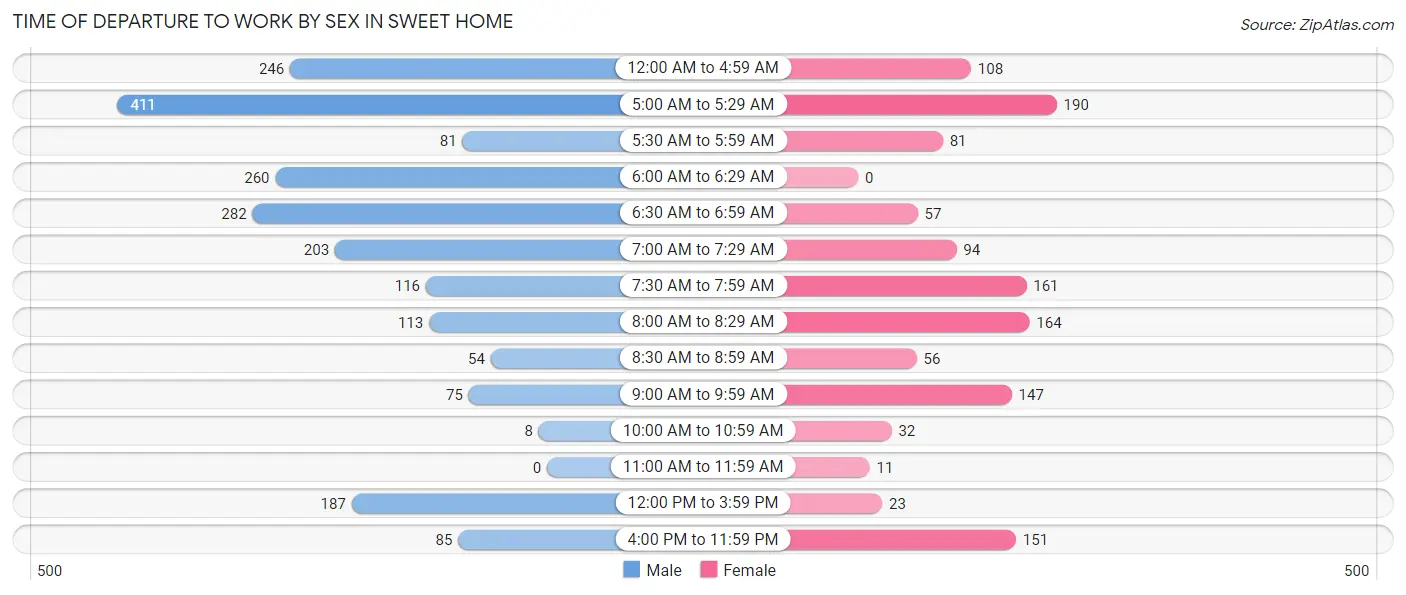
Time of Departure to Work by Sex in Sweet Home
The most frequent times of departure to work in Sweet Home are 5:00 AM to 5:29 AM (411, 19.4%) for males and 5:00 AM to 5:29 AM (190, 14.9%) for females.
| Time of Departure | Male | Female |
| 12:00 AM to 4:59 AM | 246 (11.6%) | 108 (8.5%) |
| 5:00 AM to 5:29 AM | 411 (19.4%) | 190 (14.9%) |
| 5:30 AM to 5:59 AM | 81 (3.8%) | 81 (6.4%) |
| 6:00 AM to 6:29 AM | 260 (12.3%) | 0 (0.0%) |
| 6:30 AM to 6:59 AM | 282 (13.3%) | 57 (4.5%) |
| 7:00 AM to 7:29 AM | 203 (9.6%) | 94 (7.4%) |
| 7:30 AM to 7:59 AM | 116 (5.5%) | 161 (12.6%) |
| 8:00 AM to 8:29 AM | 113 (5.3%) | 164 (12.9%) |
| 8:30 AM to 8:59 AM | 54 (2.5%) | 56 (4.4%) |
| 9:00 AM to 9:59 AM | 75 (3.5%) | 147 (11.5%) |
| 10:00 AM to 10:59 AM | 8 (0.4%) | 32 (2.5%) |
| 11:00 AM to 11:59 AM | 0 (0.0%) | 11 (0.9%) |
| 12:00 PM to 3:59 PM | 187 (8.8%) | 23 (1.8%) |
| 4:00 PM to 11:59 PM | 85 (4.0%) | 151 (11.8%) |
| Total | 2,121 (100.0%) | 1,275 (100.0%) |
Housing Occupancy in Sweet Home
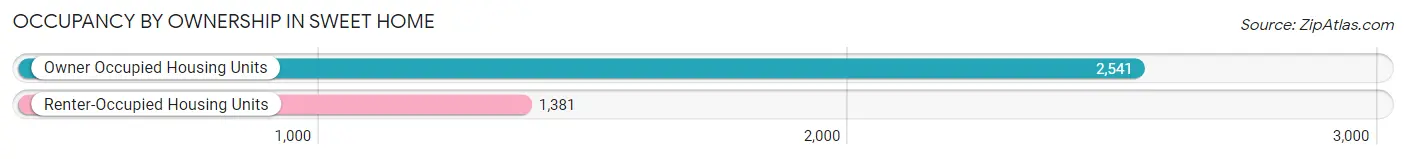
Occupancy by Ownership in Sweet Home
Of the total 3,922 dwellings in Sweet Home, owner-occupied units account for 2,541 (64.8%), while renter-occupied units make up 1,381 (35.2%).
| Occupancy | # Housing Units | % Housing Units |
| Owner Occupied Housing Units | 2,541 | 64.8% |
| Renter-Occupied Housing Units | 1,381 | 35.2% |
| Total Occupied Housing Units | 3,922 | 100.0% |
Occupancy by Household Size in Sweet Home
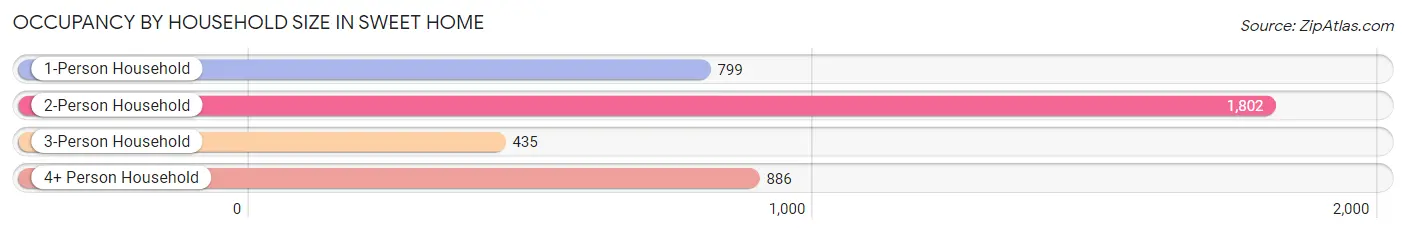
| Household Size | # Housing Units | % Housing Units |
| 1-Person Household | 799 | 20.4% |
| 2-Person Household | 1,802 | 46.0% |
| 3-Person Household | 435 | 11.1% |
| 4+ Person Household | 886 | 22.6% |
| Total Housing Units | 3,922 | 100.0% |
Occupancy by Ownership by Household Size in Sweet Home
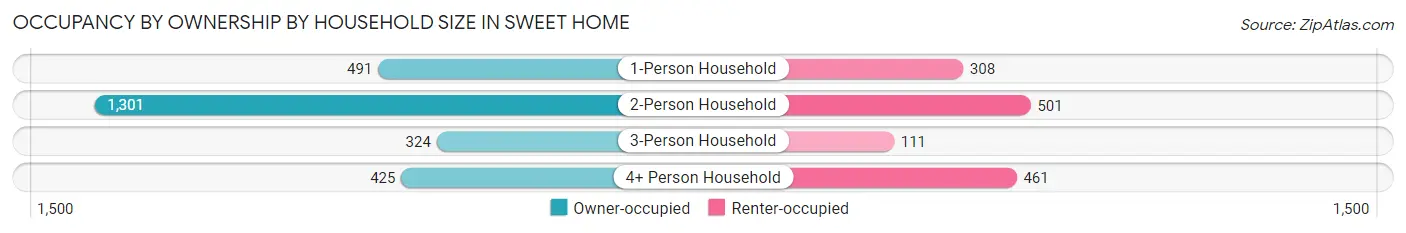
| Household Size | Owner-occupied | Renter-occupied |
| 1-Person Household | 491 (61.5%) | 308 (38.6%) |
| 2-Person Household | 1,301 (72.2%) | 501 (27.8%) |
| 3-Person Household | 324 (74.5%) | 111 (25.5%) |
| 4+ Person Household | 425 (48.0%) | 461 (52.0%) |
| Total Housing Units | 2,541 (64.8%) | 1,381 (35.2%) |
Occupancy by Educational Attainment in Sweet Home
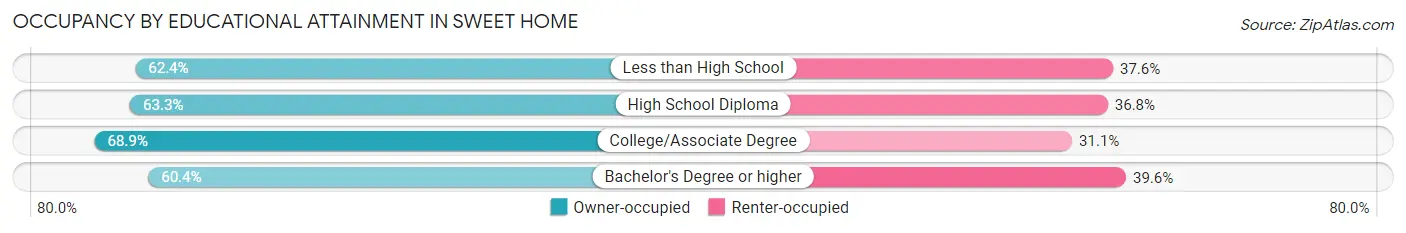
| Household Size | Owner-occupied | Renter-occupied |
| Less than High School | 467 (62.4%) | 281 (37.6%) |
| High School Diploma | 900 (63.2%) | 523 (36.7%) |
| College/Associate Degree | 944 (68.9%) | 426 (31.1%) |
| Bachelor's Degree or higher | 230 (60.4%) | 151 (39.6%) |
Occupancy by Age of Householder in Sweet Home
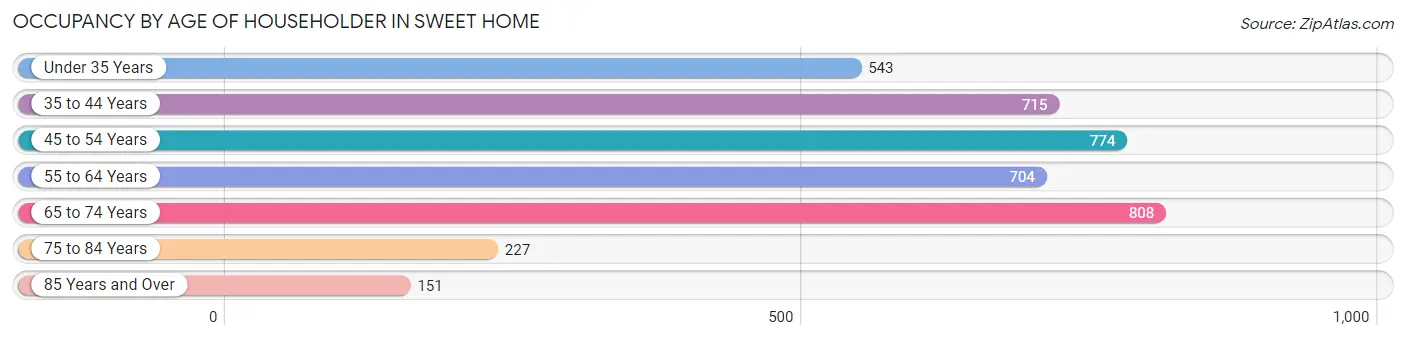
| Age Bracket | # Households | % Households |
| Under 35 Years | 543 | 13.8% |
| 35 to 44 Years | 715 | 18.2% |
| 45 to 54 Years | 774 | 19.7% |
| 55 to 64 Years | 704 | 17.9% |
| 65 to 74 Years | 808 | 20.6% |
| 75 to 84 Years | 227 | 5.8% |
| 85 Years and Over | 151 | 3.8% |
| Total | 3,922 | 100.0% |
Housing Finances in Sweet Home
Median Income by Occupancy in Sweet Home
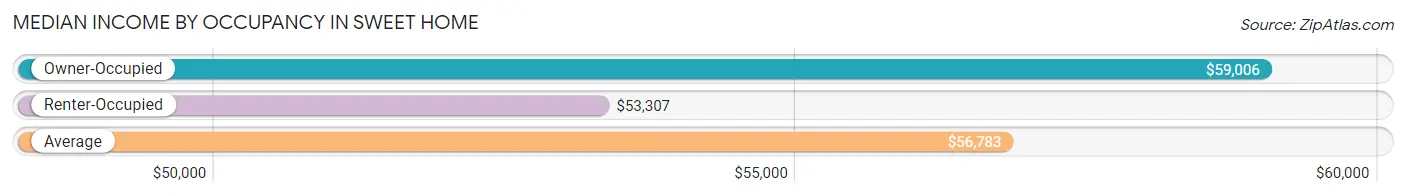
| Occupancy Type | # Households | Median Income |
| Owner-Occupied | 2,541 (64.8%) | $59,006 |
| Renter-Occupied | 1,381 (35.2%) | $53,307 |
| Average | 3,922 (100.0%) | $56,783 |
Occupancy by Householder Income Bracket in Sweet Home
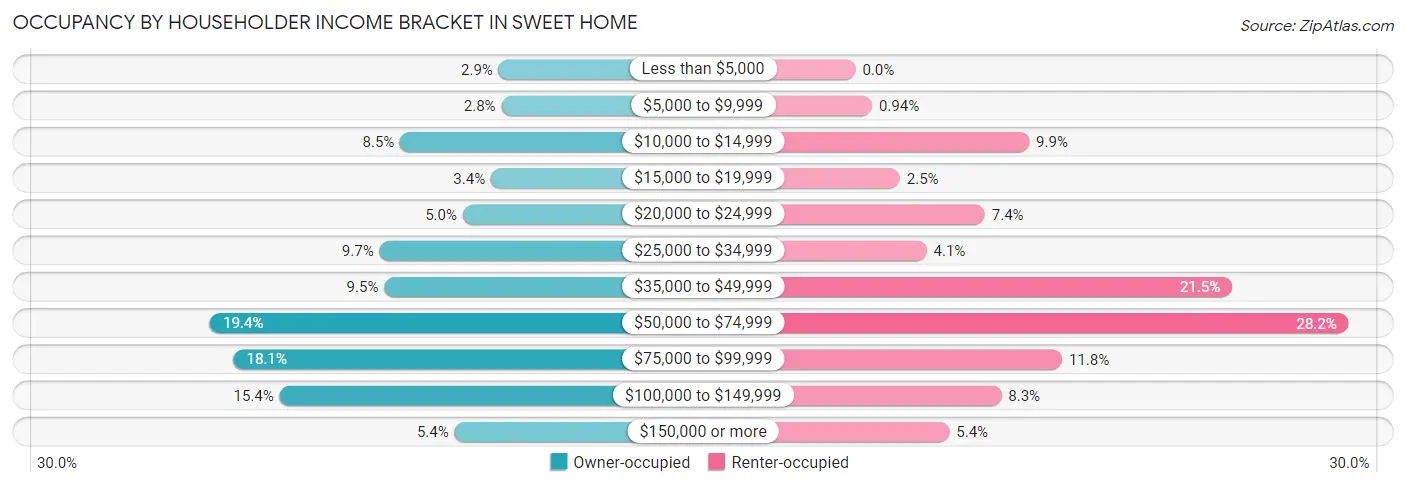
| Income Bracket | Owner-occupied | Renter-occupied |
| Less than $5,000 | 74 (2.9%) | 0 (0.0%) |
| $5,000 to $9,999 | 70 (2.8%) | 13 (0.9%) |
| $10,000 to $14,999 | 217 (8.5%) | 137 (9.9%) |
| $15,000 to $19,999 | 85 (3.4%) | 35 (2.5%) |
| $20,000 to $24,999 | 126 (5.0%) | 102 (7.4%) |
| $25,000 to $34,999 | 247 (9.7%) | 56 (4.1%) |
| $35,000 to $49,999 | 240 (9.5%) | 297 (21.5%) |
| $50,000 to $74,999 | 493 (19.4%) | 389 (28.2%) |
| $75,000 to $99,999 | 459 (18.1%) | 163 (11.8%) |
| $100,000 to $149,999 | 392 (15.4%) | 115 (8.3%) |
| $150,000 or more | 138 (5.4%) | 74 (5.4%) |
| Total | 2,541 (100.0%) | 1,381 (100.0%) |
Monthly Housing Cost Tiers in Sweet Home
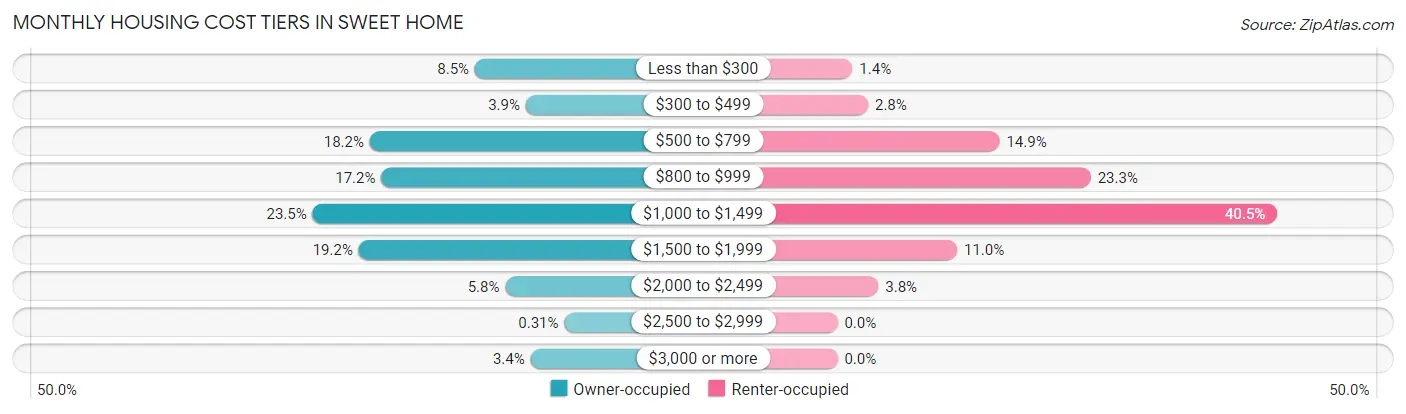
| Monthly Cost | Owner-occupied | Renter-occupied |
| Less than $300 | 217 (8.5%) | 19 (1.4%) |
| $300 to $499 | 98 (3.9%) | 39 (2.8%) |
| $500 to $799 | 463 (18.2%) | 206 (14.9%) |
| $800 to $999 | 436 (17.2%) | 322 (23.3%) |
| $1,000 to $1,499 | 597 (23.5%) | 559 (40.5%) |
| $1,500 to $1,999 | 489 (19.2%) | 152 (11.0%) |
| $2,000 to $2,499 | 146 (5.8%) | 52 (3.8%) |
| $2,500 to $2,999 | 8 (0.3%) | 0 (0.0%) |
| $3,000 or more | 87 (3.4%) | 0 (0.0%) |
| Total | 2,541 (100.0%) | 1,381 (100.0%) |
Physical Housing Characteristics in Sweet Home
Housing Structures in Sweet Home
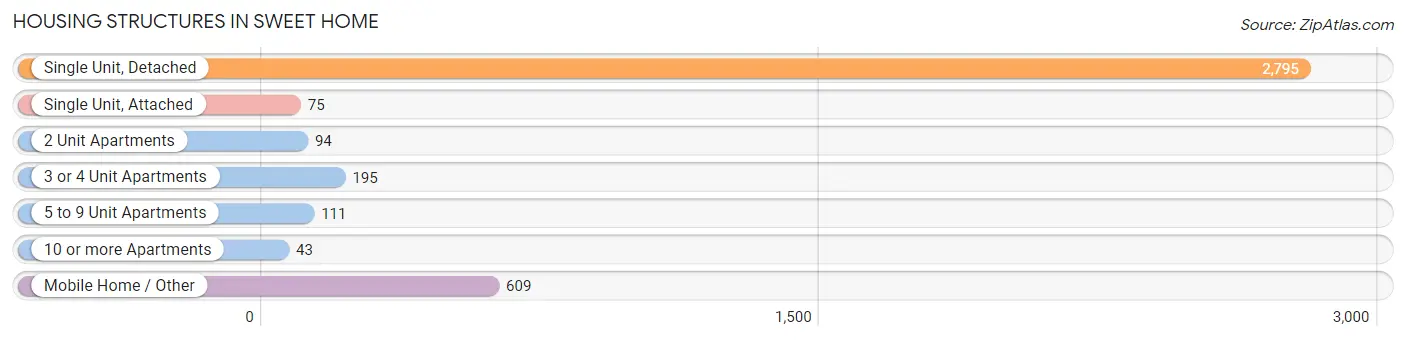
| Structure Type | # Housing Units | % Housing Units |
| Single Unit, Detached | 2,795 | 71.3% |
| Single Unit, Attached | 75 | 1.9% |
| 2 Unit Apartments | 94 | 2.4% |
| 3 or 4 Unit Apartments | 195 | 5.0% |
| 5 to 9 Unit Apartments | 111 | 2.8% |
| 10 or more Apartments | 43 | 1.1% |
| Mobile Home / Other | 609 | 15.5% |
| Total | 3,922 | 100.0% |
Housing Structures by Occupancy in Sweet Home
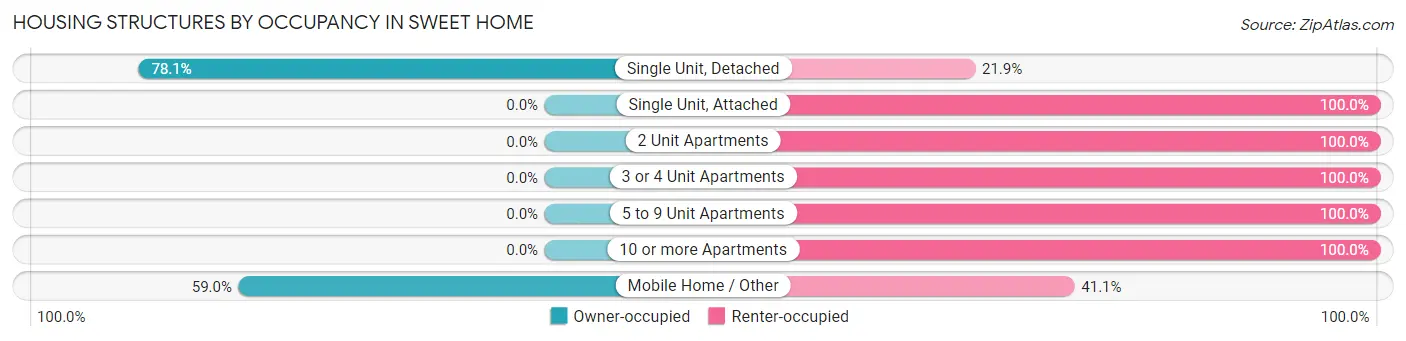
| Structure Type | Owner-occupied | Renter-occupied |
| Single Unit, Detached | 2,182 (78.1%) | 613 (21.9%) |
| Single Unit, Attached | 0 (0.0%) | 75 (100.0%) |
| 2 Unit Apartments | 0 (0.0%) | 94 (100.0%) |
| 3 or 4 Unit Apartments | 0 (0.0%) | 195 (100.0%) |
| 5 to 9 Unit Apartments | 0 (0.0%) | 111 (100.0%) |
| 10 or more Apartments | 0 (0.0%) | 43 (100.0%) |
| Mobile Home / Other | 359 (59.0%) | 250 (41.0%) |
| Total | 2,541 (64.8%) | 1,381 (35.2%) |
Housing Structures by Number of Rooms in Sweet Home
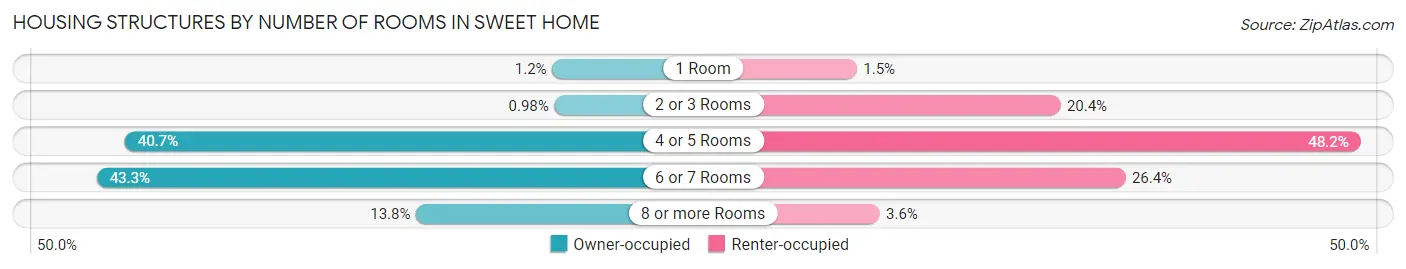
| Number of Rooms | Owner-occupied | Renter-occupied |
| 1 Room | 30 (1.2%) | 21 (1.5%) |
| 2 or 3 Rooms | 25 (1.0%) | 281 (20.3%) |
| 4 or 5 Rooms | 1,035 (40.7%) | 665 (48.1%) |
| 6 or 7 Rooms | 1,101 (43.3%) | 364 (26.4%) |
| 8 or more Rooms | 350 (13.8%) | 50 (3.6%) |
| Total | 2,541 (100.0%) | 1,381 (100.0%) |
Housing Structure by Heating Type in Sweet Home
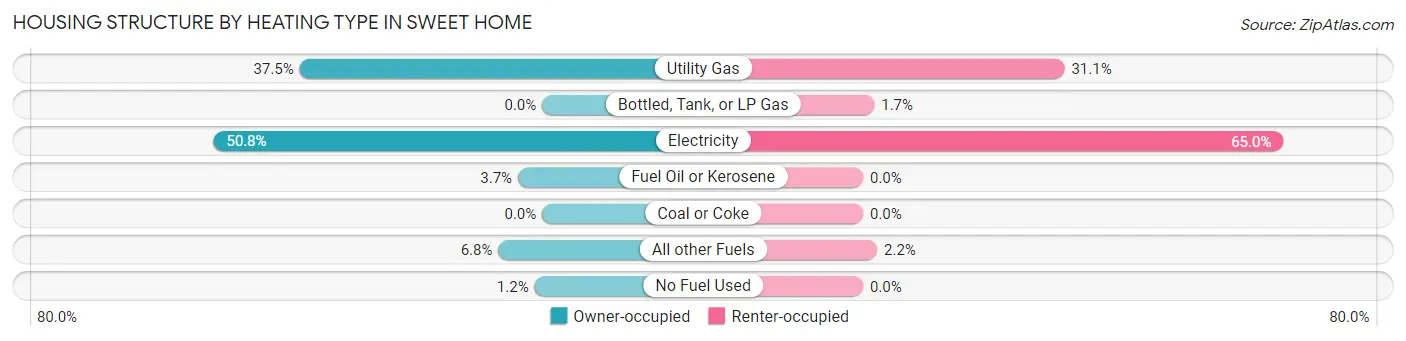
| Heating Type | Owner-occupied | Renter-occupied |
| Utility Gas | 953 (37.5%) | 430 (31.1%) |
| Bottled, Tank, or LP Gas | 0 (0.0%) | 24 (1.7%) |
| Electricity | 1,291 (50.8%) | 897 (64.9%) |
| Fuel Oil or Kerosene | 95 (3.7%) | 0 (0.0%) |
| Coal or Coke | 0 (0.0%) | 0 (0.0%) |
| All other Fuels | 172 (6.8%) | 30 (2.2%) |
| No Fuel Used | 30 (1.2%) | 0 (0.0%) |
| Total | 2,541 (100.0%) | 1,381 (100.0%) |
Household Vehicle Usage in Sweet Home
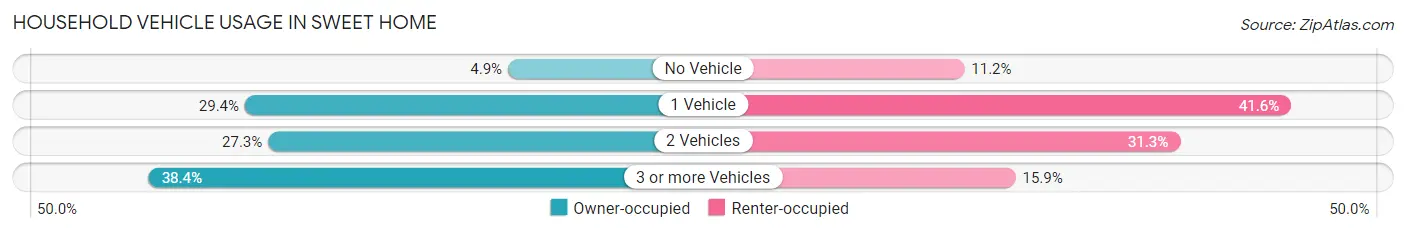
| Vehicles per Household | Owner-occupied | Renter-occupied |
| No Vehicle | 124 (4.9%) | 154 (11.2%) |
| 1 Vehicle | 748 (29.4%) | 575 (41.6%) |
| 2 Vehicles | 693 (27.3%) | 432 (31.3%) |
| 3 or more Vehicles | 976 (38.4%) | 220 (15.9%) |
| Total | 2,541 (100.0%) | 1,381 (100.0%) |
Real Estate & Mortgages in Sweet Home
Real Estate and Mortgage Overview in Sweet Home
| Characteristic | Without Mortgage | With Mortgage |
| Housing Units | 782 | 1,759 |
| Median Property Value | $230,200 | $224,600 |
| Median Household Income | $29,868 | $98 |
| Monthly Housing Costs | $620 | $31 |
| Real Estate Taxes | $2,112 | $18 |
Property Value by Mortgage Status in Sweet Home
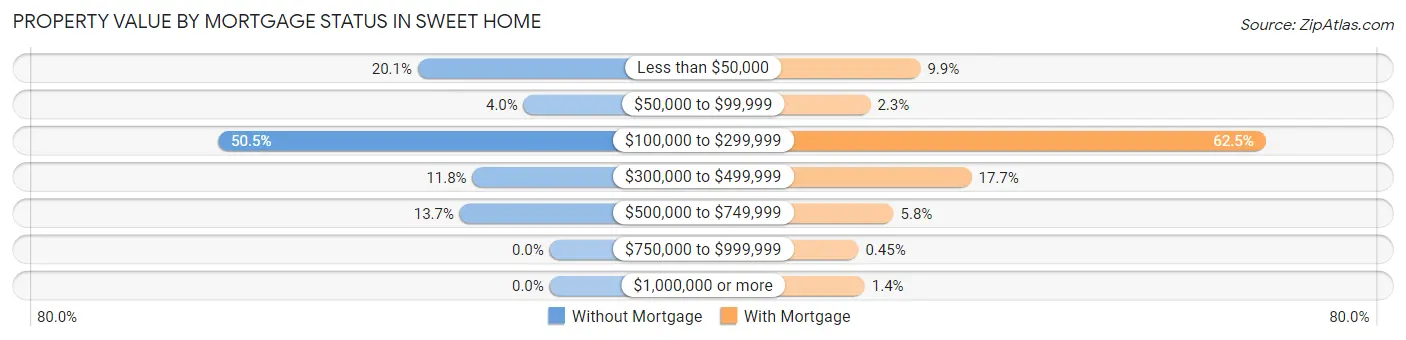
| Property Value | Without Mortgage | With Mortgage |
| Less than $50,000 | 157 (20.1%) | 174 (9.9%) |
| $50,000 to $99,999 | 31 (4.0%) | 40 (2.3%) |
| $100,000 to $299,999 | 395 (50.5%) | 1,099 (62.5%) |
| $300,000 to $499,999 | 92 (11.8%) | 311 (17.7%) |
| $500,000 to $749,999 | 107 (13.7%) | 102 (5.8%) |
| $750,000 to $999,999 | 0 (0.0%) | 8 (0.4%) |
| $1,000,000 or more | 0 (0.0%) | 25 (1.4%) |
| Total | 782 (100.0%) | 1,759 (100.0%) |
Household Income by Mortgage Status in Sweet Home
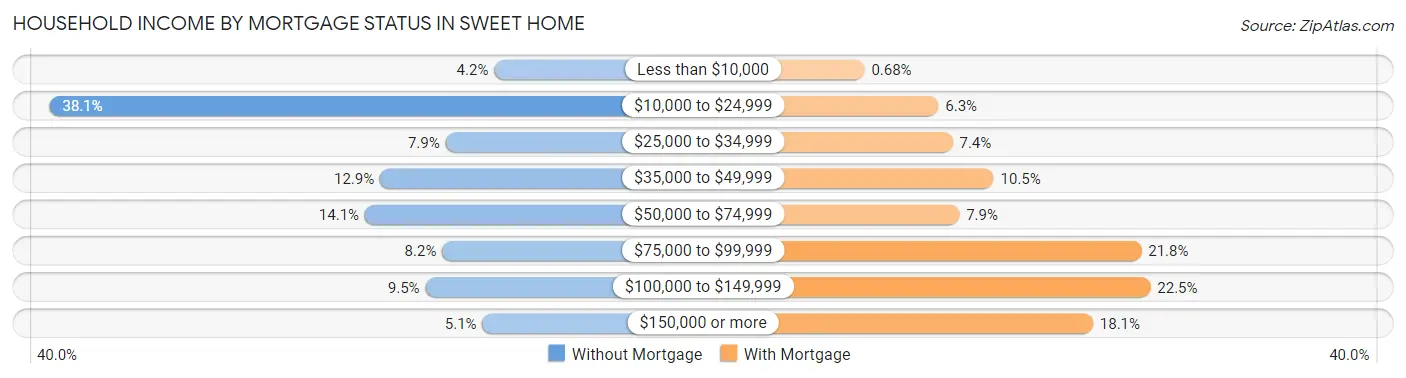
| Household Income | Without Mortgage | With Mortgage |
| Less than $10,000 | 33 (4.2%) | 12 (0.7%) |
| $10,000 to $24,999 | 298 (38.1%) | 111 (6.3%) |
| $25,000 to $34,999 | 62 (7.9%) | 130 (7.4%) |
| $35,000 to $49,999 | 101 (12.9%) | 185 (10.5%) |
| $50,000 to $74,999 | 110 (14.1%) | 139 (7.9%) |
| $75,000 to $99,999 | 64 (8.2%) | 383 (21.8%) |
| $100,000 to $149,999 | 74 (9.5%) | 395 (22.5%) |
| $150,000 or more | 40 (5.1%) | 318 (18.1%) |
| Total | 782 (100.0%) | 1,759 (100.0%) |
Property Value to Household Income Ratio in Sweet Home
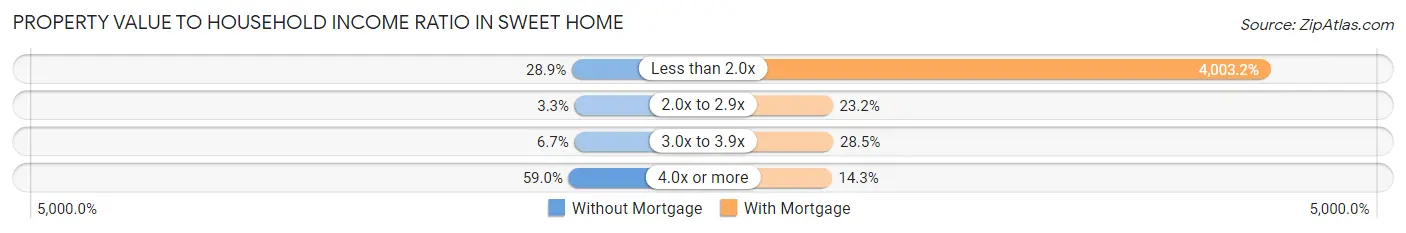
| Value-to-Income Ratio | Without Mortgage | With Mortgage |
| Less than 2.0x | 226 (28.9%) | 70,417 (4,003.2%) |
| 2.0x to 2.9x | 26 (3.3%) | 408 (23.2%) |
| 3.0x to 3.9x | 52 (6.7%) | 501 (28.5%) |
| 4.0x or more | 461 (59.0%) | 252 (14.3%) |
| Total | 782 (100.0%) | 1,759 (100.0%) |
Real Estate Taxes by Mortgage Status in Sweet Home
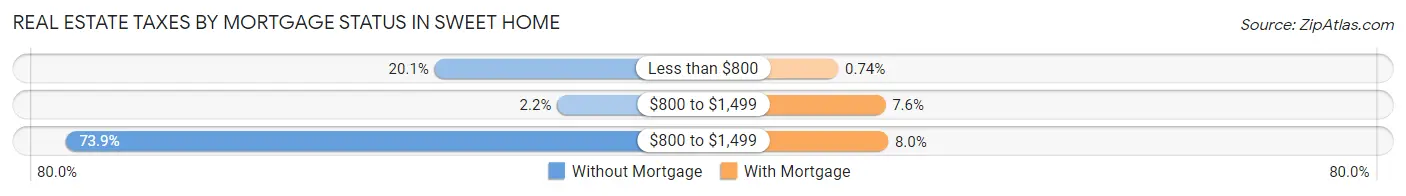
| Property Taxes | Without Mortgage | With Mortgage |
| Less than $800 | 157 (20.1%) | 13 (0.7%) |
| $800 to $1,499 | 17 (2.2%) | 134 (7.6%) |
| $800 to $1,499 | 578 (73.9%) | 141 (8.0%) |
| Total | 782 (100.0%) | 1,759 (100.0%) |
Health & Disability in Sweet Home
Health Insurance Coverage by Age in Sweet Home
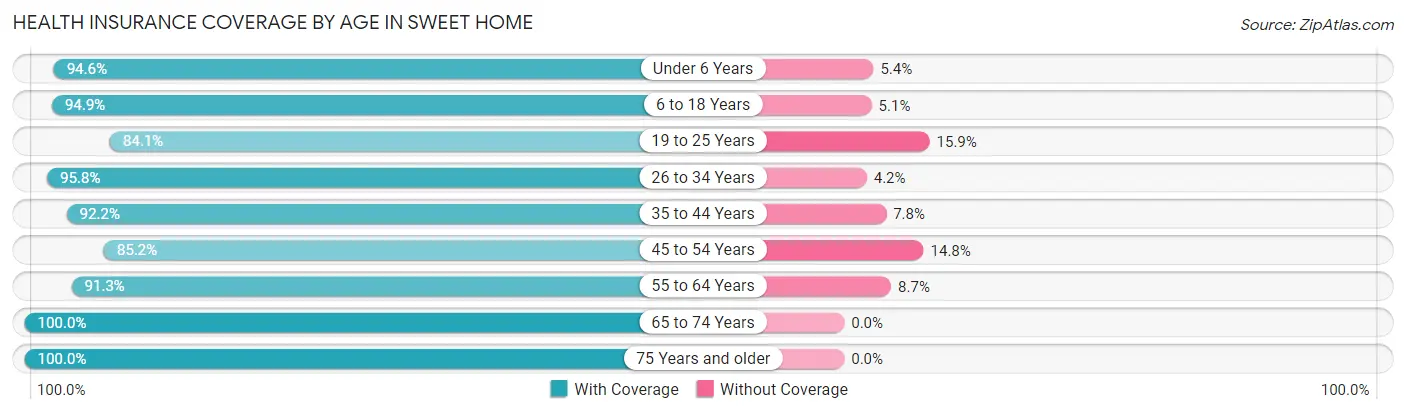
| Age Bracket | With Coverage | Without Coverage |
| Under 6 Years | 504 (94.6%) | 29 (5.4%) |
| 6 to 18 Years | 1,601 (94.9%) | 86 (5.1%) |
| 19 to 25 Years | 539 (84.1%) | 102 (15.9%) |
| 26 to 34 Years | 1,029 (95.8%) | 45 (4.2%) |
| 35 to 44 Years | 1,202 (92.2%) | 102 (7.8%) |
| 45 to 54 Years | 1,100 (85.2%) | 191 (14.8%) |
| 55 to 64 Years | 1,400 (91.3%) | 134 (8.7%) |
| 65 to 74 Years | 1,062 (100.0%) | 0 (0.0%) |
| 75 Years and older | 643 (100.0%) | 0 (0.0%) |
| Total | 9,080 (92.9%) | 689 (7.0%) |
Health Insurance Coverage by Citizenship Status in Sweet Home
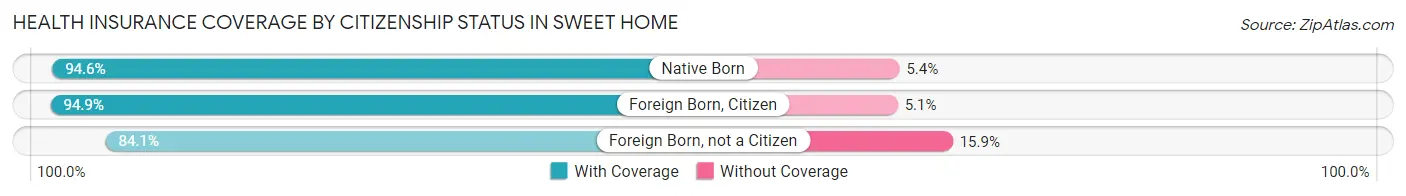
| Citizenship Status | With Coverage | Without Coverage |
| Native Born | 504 (94.6%) | 29 (5.4%) |
| Foreign Born, Citizen | 1,601 (94.9%) | 86 (5.1%) |
| Foreign Born, not a Citizen | 539 (84.1%) | 102 (15.9%) |
Health Insurance Coverage by Household Income in Sweet Home
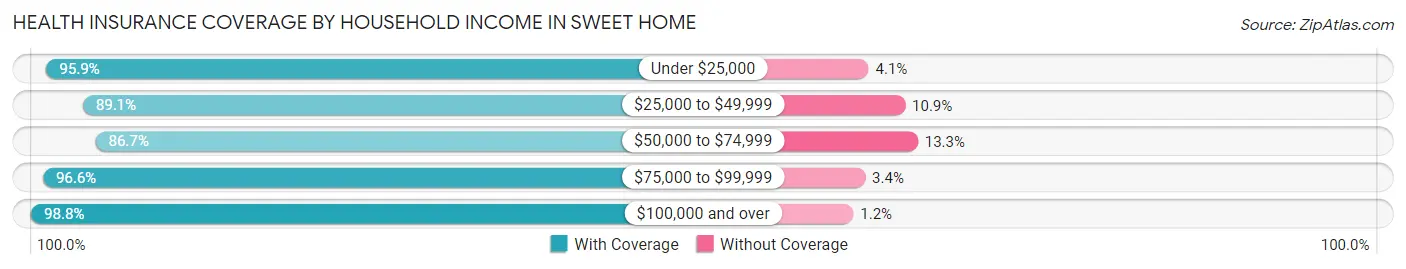
| Household Income | With Coverage | Without Coverage |
| Under $25,000 | 1,312 (95.9%) | 56 (4.1%) |
| $25,000 to $49,999 | 1,697 (89.1%) | 208 (10.9%) |
| $50,000 to $74,999 | 2,190 (86.7%) | 336 (13.3%) |
| $75,000 to $99,999 | 1,766 (96.6%) | 63 (3.4%) |
| $100,000 and over | 2,087 (98.8%) | 26 (1.2%) |
Public vs Private Health Insurance Coverage by Age in Sweet Home
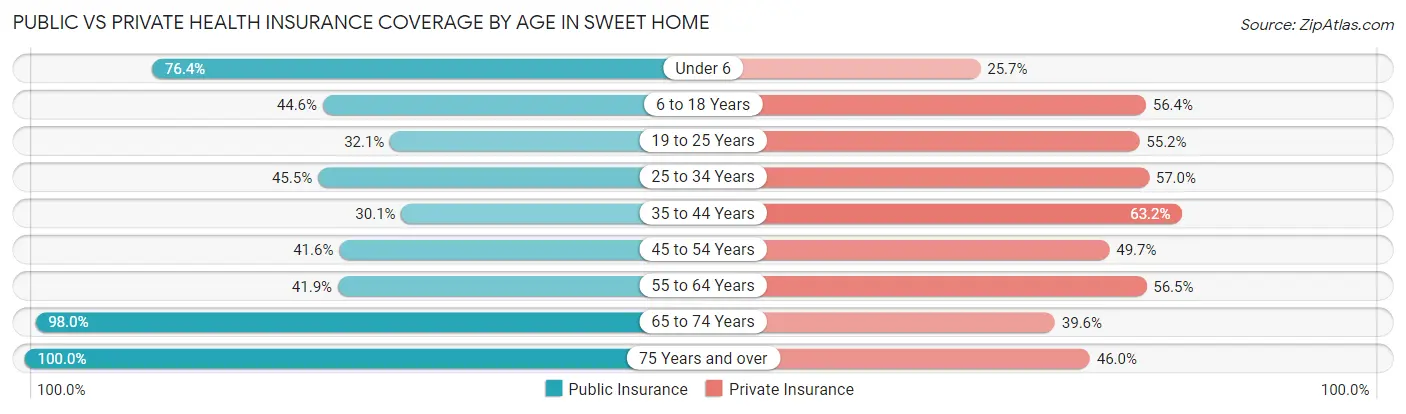
| Age Bracket | Public Insurance | Private Insurance |
| Under 6 | 407 (76.4%) | 137 (25.7%) |
| 6 to 18 Years | 753 (44.6%) | 952 (56.4%) |
| 19 to 25 Years | 206 (32.1%) | 354 (55.2%) |
| 25 to 34 Years | 489 (45.5%) | 612 (57.0%) |
| 35 to 44 Years | 392 (30.1%) | 824 (63.2%) |
| 45 to 54 Years | 537 (41.6%) | 641 (49.6%) |
| 55 to 64 Years | 642 (41.8%) | 867 (56.5%) |
| 65 to 74 Years | 1,041 (98.0%) | 420 (39.6%) |
| 75 Years and over | 643 (100.0%) | 296 (46.0%) |
| Total | 5,110 (52.3%) | 5,103 (52.2%) |
Disability Status by Sex by Age in Sweet Home
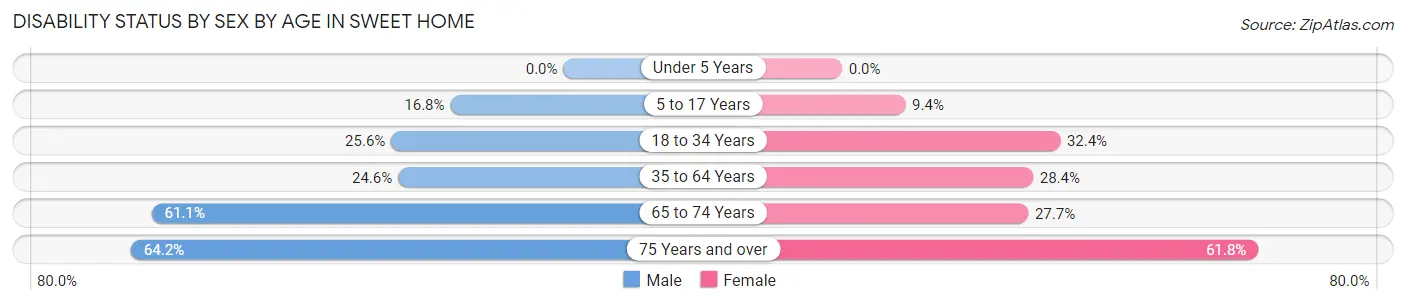
| Age Bracket | Male | Female |
| Under 5 Years | 0 (0.0%) | 0 (0.0%) |
| 5 to 17 Years | 150 (16.8%) | 72 (9.4%) |
| 18 to 34 Years | 267 (25.6%) | 263 (32.4%) |
| 35 to 64 Years | 509 (24.5%) | 583 (28.4%) |
| 65 to 74 Years | 269 (61.1%) | 172 (27.7%) |
| 75 Years and over | 174 (64.2%) | 230 (61.8%) |
Disability Class by Sex by Age in Sweet Home
Disability Class: Hearing Difficulty
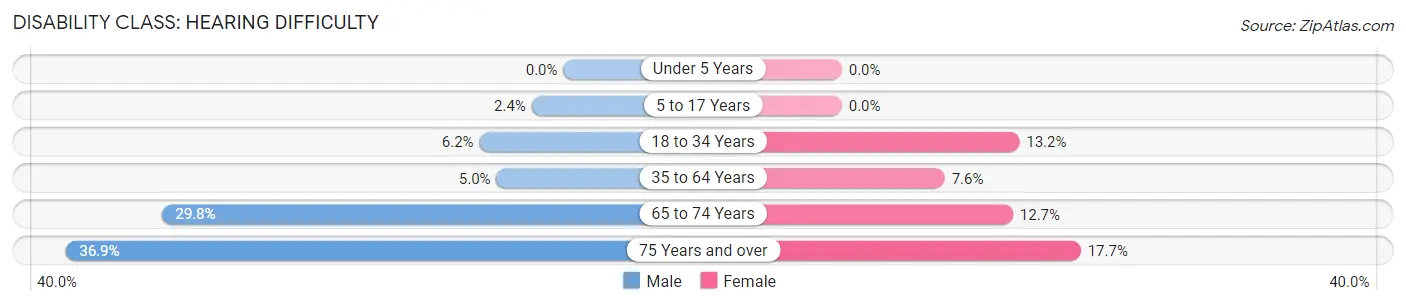
| Age Bracket | Male | Female |
| Under 5 Years | 0 (0.0%) | 0 (0.0%) |
| 5 to 17 Years | 21 (2.4%) | 0 (0.0%) |
| 18 to 34 Years | 65 (6.2%) | 107 (13.2%) |
| 35 to 64 Years | 103 (5.0%) | 157 (7.6%) |
| 65 to 74 Years | 131 (29.8%) | 79 (12.7%) |
| 75 Years and over | 100 (36.9%) | 66 (17.7%) |
Disability Class: Vision Difficulty
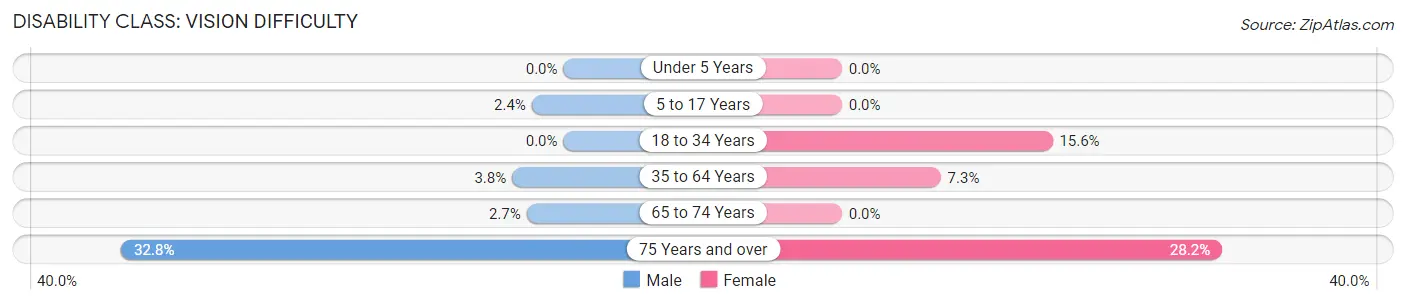
| Age Bracket | Male | Female |
| Under 5 Years | 0 (0.0%) | 0 (0.0%) |
| 5 to 17 Years | 21 (2.4%) | 0 (0.0%) |
| 18 to 34 Years | 0 (0.0%) | 127 (15.6%) |
| 35 to 64 Years | 79 (3.8%) | 151 (7.3%) |
| 65 to 74 Years | 12 (2.7%) | 0 (0.0%) |
| 75 Years and over | 89 (32.8%) | 105 (28.2%) |
Disability Class: Cognitive Difficulty
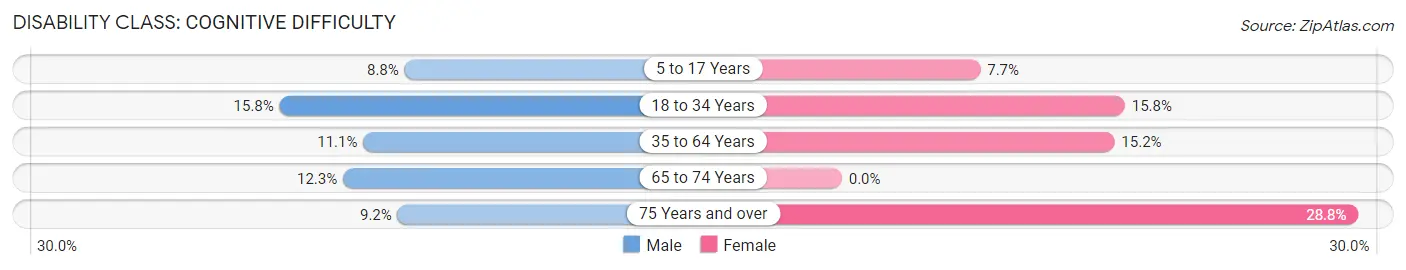
| Age Bracket | Male | Female |
| 5 to 17 Years | 79 (8.8%) | 59 (7.7%) |
| 18 to 34 Years | 165 (15.8%) | 128 (15.8%) |
| 35 to 64 Years | 231 (11.1%) | 312 (15.2%) |
| 65 to 74 Years | 54 (12.3%) | 0 (0.0%) |
| 75 Years and over | 25 (9.2%) | 107 (28.8%) |
Disability Class: Ambulatory Difficulty
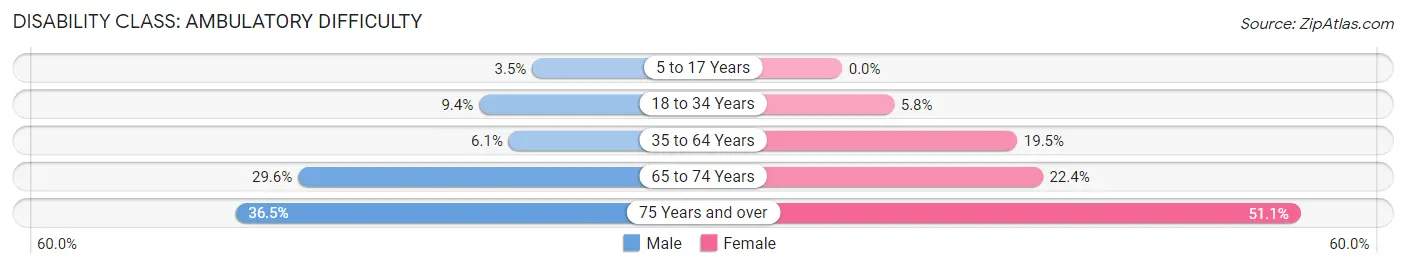
| Age Bracket | Male | Female |
| 5 to 17 Years | 31 (3.5%) | 0 (0.0%) |
| 18 to 34 Years | 98 (9.4%) | 47 (5.8%) |
| 35 to 64 Years | 126 (6.1%) | 401 (19.5%) |
| 65 to 74 Years | 130 (29.5%) | 139 (22.4%) |
| 75 Years and over | 99 (36.5%) | 190 (51.1%) |
Disability Class: Self-Care Difficulty
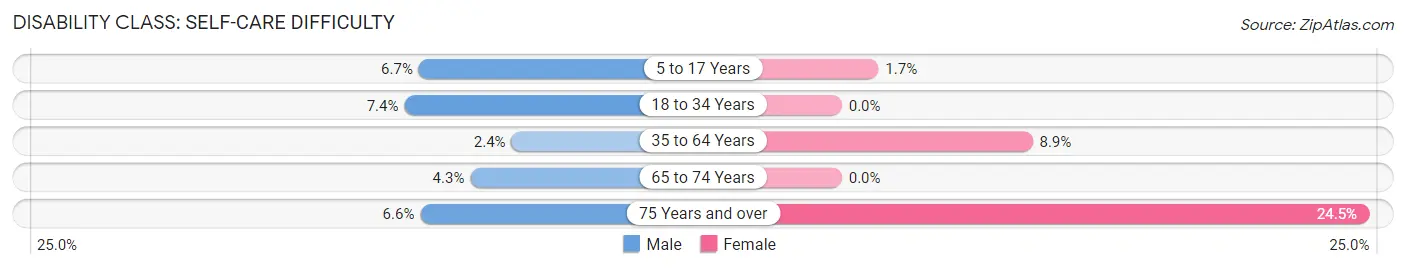
| Age Bracket | Male | Female |
| 5 to 17 Years | 60 (6.7%) | 13 (1.7%) |
| 18 to 34 Years | 77 (7.4%) | 0 (0.0%) |
| 35 to 64 Years | 50 (2.4%) | 182 (8.8%) |
| 65 to 74 Years | 19 (4.3%) | 0 (0.0%) |
| 75 Years and over | 18 (6.6%) | 91 (24.5%) |
Technology Access in Sweet Home
Computing Device Access in Sweet Home
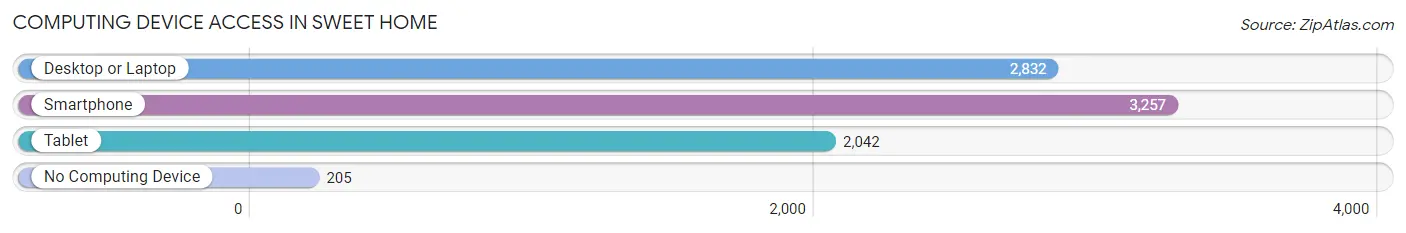
| Device Type | # Households | % Households |
| Desktop or Laptop | 2,832 | 72.2% |
| Smartphone | 3,257 | 83.0% |
| Tablet | 2,042 | 52.1% |
| No Computing Device | 205 | 5.2% |
| Total | 3,922 | 100.0% |
Internet Access in Sweet Home
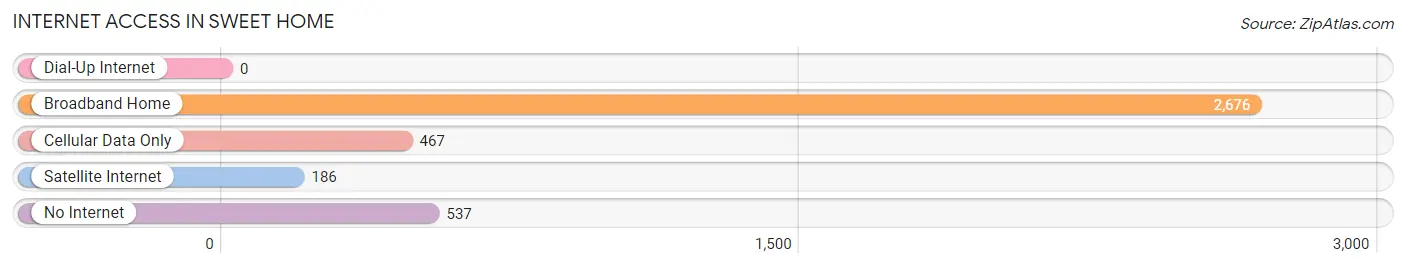
| Internet Type | # Households | % Households |
| Dial-Up Internet | 0 | 0.0% |
| Broadband Home | 2,676 | 68.2% |
| Cellular Data Only | 467 | 11.9% |
| Satellite Internet | 186 | 4.7% |
| No Internet | 537 | 13.7% |
| Total | 3,922 | 100.0% |
Sweet Home Summary
Home Sweet Home Oregon
Home Sweet Home, Oregon is a small town located in the foothills of the Cascade Mountains in the Willamette Valley. It is situated in the western part of the state, about 25 miles south of Portland. The town has a population of just over 1,000 people and is known for its rural charm and small-town atmosphere.
History
Home Sweet Home was founded in 1851 by a group of settlers from the Midwest. The town was originally called “Home” and was later changed to “Home Sweet Home” in 1853. The town was originally a farming community, but over the years it has become a popular tourist destination.
The town was originally part of the Oregon Territory, but in 1859 it became part of the newly formed state of Oregon. In the late 1800s, the town was a popular stop for travelers on the Oregon Trail. The town was also home to a number of businesses, including a hotel, a general store, and a blacksmith shop.
Geography
Home Sweet Home is located in the foothills of the Cascade Mountains in the Willamette Valley. The town is situated at an elevation of 1,000 feet and is surrounded by rolling hills and lush forests. The town is located near the confluence of the Clackamas and Willamette Rivers.
The climate in Home Sweet Home is mild and temperate. The average temperature in the summer is around 75 degrees Fahrenheit and in the winter it is around 40 degrees Fahrenheit. The town receives an average of 35 inches of rain per year.
Economy
Home Sweet Home is a small town with a limited economy. The town is primarily supported by tourism, as it is a popular destination for outdoor activities such as hiking, fishing, and camping. The town also has a number of small businesses, including restaurants, shops, and galleries.
Demographics
As of the 2010 census, the population of Home Sweet Home was 1,072. The town is predominantly white, with a small percentage of African Americans, Asians, and Hispanics. The median household income in the town is $45,000 and the median home value is $200,000.
Conclusion
Home Sweet Home, Oregon is a small town with a rich history and a unique atmosphere. The town is situated in the foothills of the Cascade Mountains and is surrounded by lush forests and rolling hills. The town is primarily supported by tourism and has a number of small businesses. The population of the town is predominantly white, with a small percentage of African Americans, Asians, and Hispanics. Home Sweet Home is a great place to visit and explore the beauty of the Willamette Valley.
Common Questions
What is Per Capita Income in Sweet Home?
Per Capita income in Sweet Home is $28,349.
What is the Median Family Income in Sweet Home?
Median Family Income in Sweet Home is $60,028.
What is the Median Household income in Sweet Home?
Median Household Income in Sweet Home is $56,783.
What is Income or Wage Gap in Sweet Home?
Income or Wage Gap in Sweet Home is 22.8%.
Women in Sweet Home earn 77.2 cents for every dollar earned by a man.
What is Inequality or Gini Index in Sweet Home?
Inequality or Gini Index in Sweet Home is 0.44.
What is the Total Population of Sweet Home?
Total Population of Sweet Home is 9,852.
What is the Total Male Population of Sweet Home?
Total Male Population of Sweet Home is 5,016.
What is the Total Female Population of Sweet Home?
Total Female Population of Sweet Home is 4,836.
What is the Ratio of Males per 100 Females in Sweet Home?
There are 103.72 Males per 100 Females in Sweet Home.
What is the Ratio of Females per 100 Males in Sweet Home?
There are 96.41 Females per 100 Males in Sweet Home.
What is the Median Population Age in Sweet Home?
Median Population Age in Sweet Home is 41.3 Years.
What is the Average Family Size in Sweet Home
Average Family Size in Sweet Home is 2.8 People.
What is the Average Household Size in Sweet Home
Average Household Size in Sweet Home is 2.5 People.
How Large is the Labor Force in Sweet Home?
There are 4,018 People in the Labor Forcein in Sweet Home.
What is the Percentage of People in the Labor Force in Sweet Home?
49.0% of People are in the Labor Force in Sweet Home.
What is the Unemployment Rate in Sweet Home?
Unemployment Rate in Sweet Home is 7.8%.