Sumpter, OR Map & Demographics
Sumpter Map
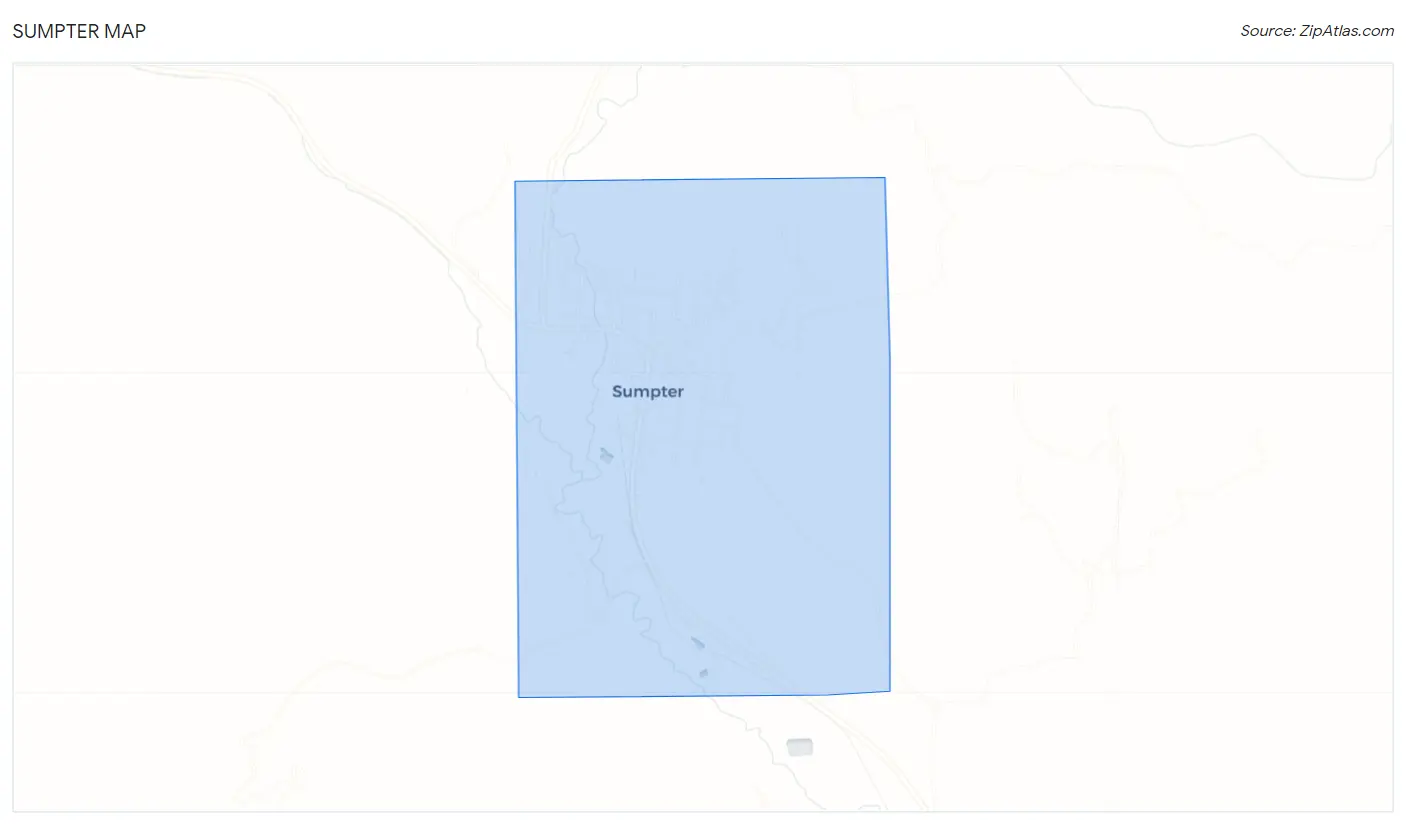
Sumpter Overview
$25,333
PER CAPITA INCOME
$24,362
AVG HOUSEHOLD INCOME
0.53
INEQUALITY / GINI INDEX
206
TOTAL POPULATION
100
MALE POPULATION
106
FEMALE POPULATION
94.34
MALES / 100 FEMALES
106.00
FEMALES / 100 MALES
70.3
MEDIAN AGE
2.1
AVG FAMILY SIZE
1.8
AVG HOUSEHOLD SIZE
15
LABOR FORCE [ PEOPLE ]
7.3%
PERCENT IN LABOR FORCE
26.7%
UNEMPLOYMENT RATE
Sumpter Zip Codes
Sumpter Area Codes
Income in Sumpter
Income Overview in Sumpter
| Characteristic | Number | Measure |
| Per Capita Income | 206 | $25,333 |
| Median Family Income | 69 | $0 |
| Mean Family Income | 69 | $58,607 |
| Median Household Income | 112 | $24,362 |
| Mean Household Income | 112 | $46,227 |
| Income Deficit | 69 | $0 |
| Wage / Income Gap (%) | 206 | 0.00% |
| Wage / Income Gap ($) | 206 | 100.00¢ per $1 |
| Gini / Inequality Index | 206 | 0.53 |
Earnings by Sex in Sumpter
| Sex | Number | Average Earnings |
| Male | 14 (63.6%) | $0 |
| Female | 8 (36.4%) | $0 |
| Total | 22 (100.0%) | $0 |
Earnings by Sex by Income Bracket in Sumpter
The most common earnings brackets in Sumpter are $2,499 or less for men (7 | 50.0%) and $2,499 or less for women (4 | 50.0%).
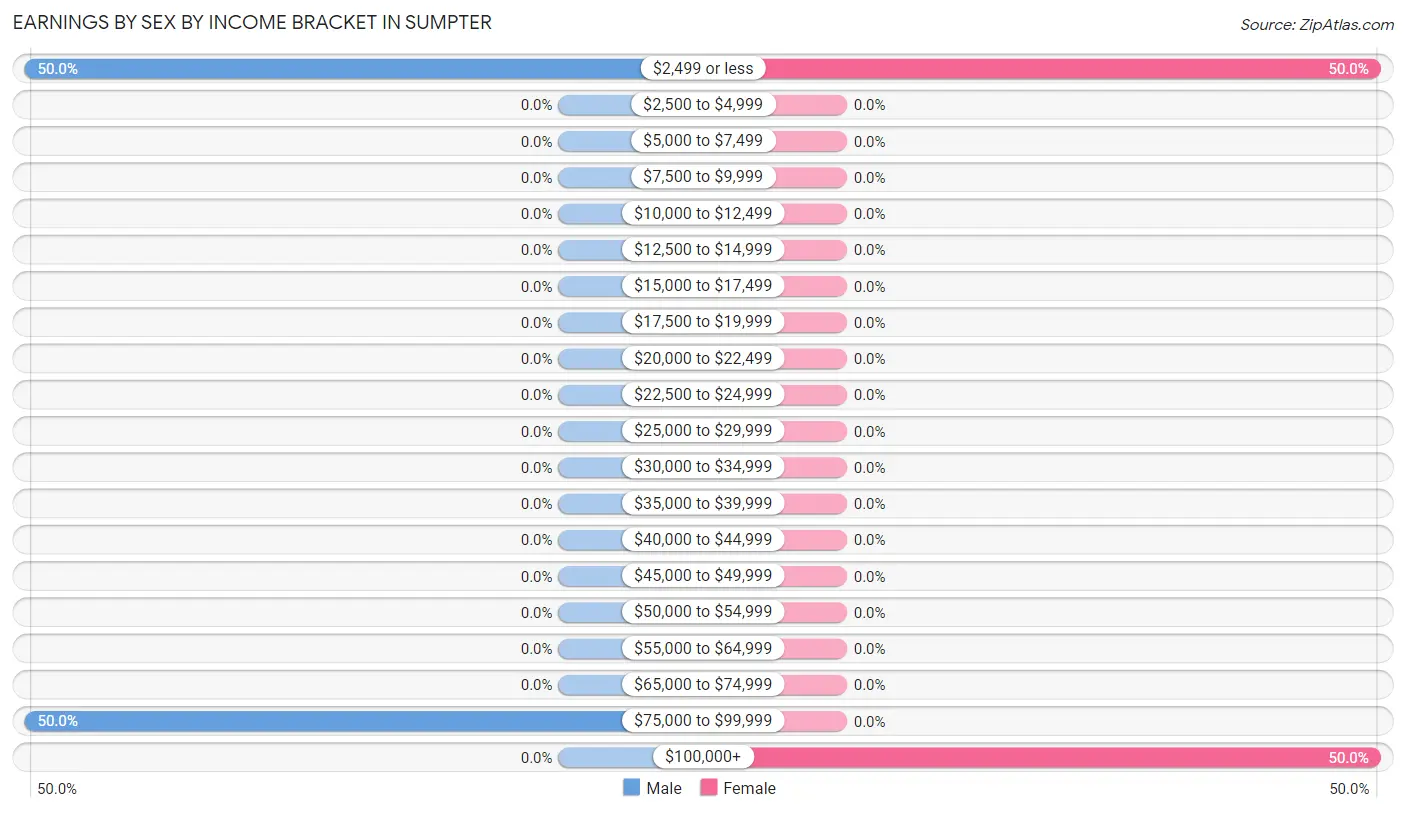
| Income | Male | Female |
| $2,499 or less | 7 (50.0%) | 4 (50.0%) |
| $2,500 to $4,999 | 0 (0.0%) | 0 (0.0%) |
| $5,000 to $7,499 | 0 (0.0%) | 0 (0.0%) |
| $7,500 to $9,999 | 0 (0.0%) | 0 (0.0%) |
| $10,000 to $12,499 | 0 (0.0%) | 0 (0.0%) |
| $12,500 to $14,999 | 0 (0.0%) | 0 (0.0%) |
| $15,000 to $17,499 | 0 (0.0%) | 0 (0.0%) |
| $17,500 to $19,999 | 0 (0.0%) | 0 (0.0%) |
| $20,000 to $22,499 | 0 (0.0%) | 0 (0.0%) |
| $22,500 to $24,999 | 0 (0.0%) | 0 (0.0%) |
| $25,000 to $29,999 | 0 (0.0%) | 0 (0.0%) |
| $30,000 to $34,999 | 0 (0.0%) | 0 (0.0%) |
| $35,000 to $39,999 | 0 (0.0%) | 0 (0.0%) |
| $40,000 to $44,999 | 0 (0.0%) | 0 (0.0%) |
| $45,000 to $49,999 | 0 (0.0%) | 0 (0.0%) |
| $50,000 to $54,999 | 0 (0.0%) | 0 (0.0%) |
| $55,000 to $64,999 | 0 (0.0%) | 0 (0.0%) |
| $65,000 to $74,999 | 0 (0.0%) | 0 (0.0%) |
| $75,000 to $99,999 | 7 (50.0%) | 0 (0.0%) |
| $100,000+ | 0 (0.0%) | 4 (50.0%) |
| Total | 14 (100.0%) | 8 (100.0%) |
Earnings by Sex by Educational Attainment in Sumpter
| Educational Attainment | Male Income | Female Income |
| Less than High School | - | - |
| High School Diploma | - | - |
| College or Associate's Degree | - | - |
| Bachelor's Degree | - | - |
| Graduate Degree | - | - |
| Total | - | - |
Family Income in Sumpter
Family Income Brackets in Sumpter
According to the Sumpter family income data, there are 47 families falling into the $15,000 to $24,999 income range, which is the most common income bracket and makes up 68.1% of all families.
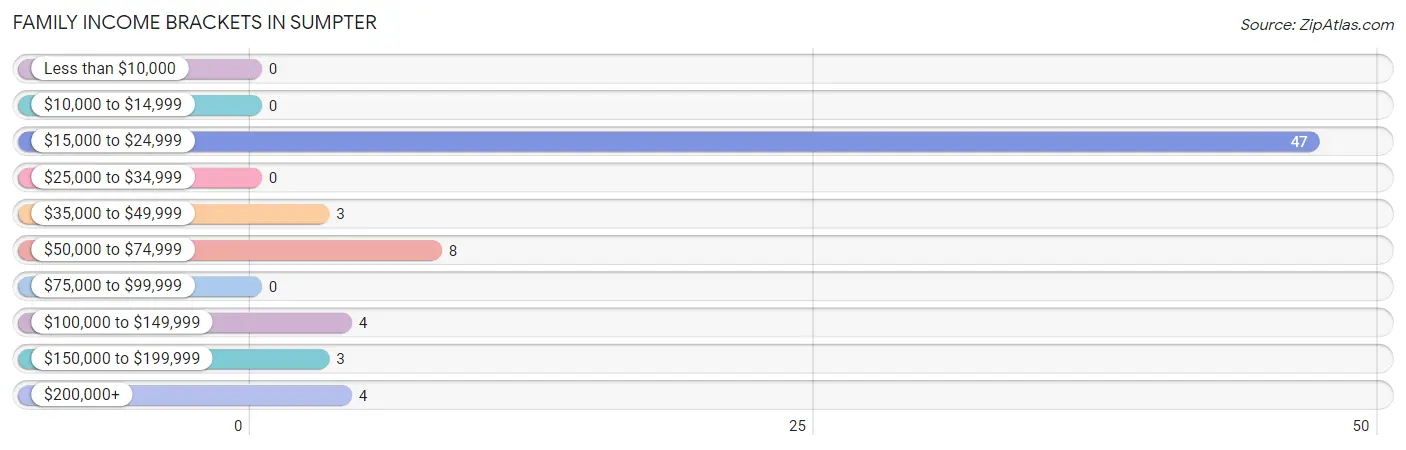
| Income Bracket | # Families | % Families |
| Less than $10,000 | 0 | 0.0% |
| $10,000 to $14,999 | 0 | 0.0% |
| $15,000 to $24,999 | 47 | 68.1% |
| $25,000 to $34,999 | 0 | 0.0% |
| $35,000 to $49,999 | 3 | 4.3% |
| $50,000 to $74,999 | 8 | 11.6% |
| $75,000 to $99,999 | 0 | 0.0% |
| $100,000 to $149,999 | 4 | 5.8% |
| $150,000 to $199,999 | 3 | 4.3% |
| $200,000+ | 4 | 5.8% |
Family Income by Famaliy Size in Sumpter
| Income Bracket | # Families | Median Income |
| 2-Person Families | 69 (100.0%) | $0 |
| 3-Person Families | 0 (0.0%) | $0 |
| 4-Person Families | 0 (0.0%) | $0 |
| 5-Person Families | 0 (0.0%) | $0 |
| 6-Person Families | 0 (0.0%) | $0 |
| 7+ Person Families | 0 (0.0%) | $0 |
| Total | 69 (100.0%) | $0 |
Family Income by Number of Earners in Sumpter
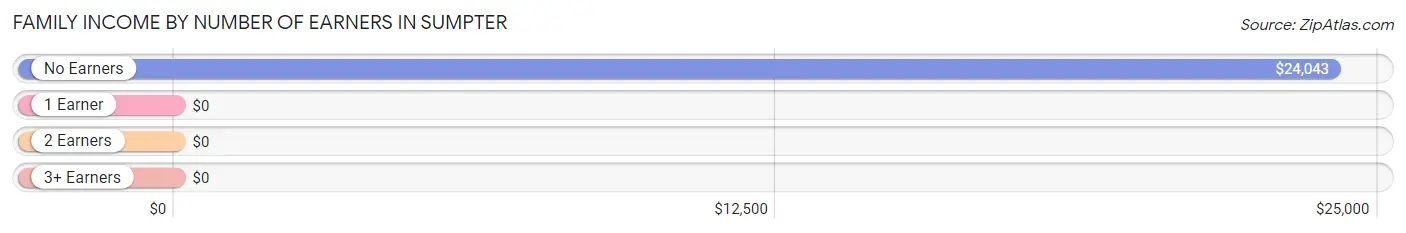
| Number of Earners | # Families | Median Income |
| No Earners | 58 (84.1%) | $24,043 |
| 1 Earner | 7 (10.1%) | $0 |
| 2 Earners | 4 (5.8%) | $0 |
| 3+ Earners | 0 (0.0%) | $0 |
| Total | 69 (100.0%) | $0 |
Household Income in Sumpter
Household Income Brackets in Sumpter
With 53 households falling in the category, the $15,000 to $24,999 income range is the most frequent in Sumpter, accounting for 47.3% of all households.
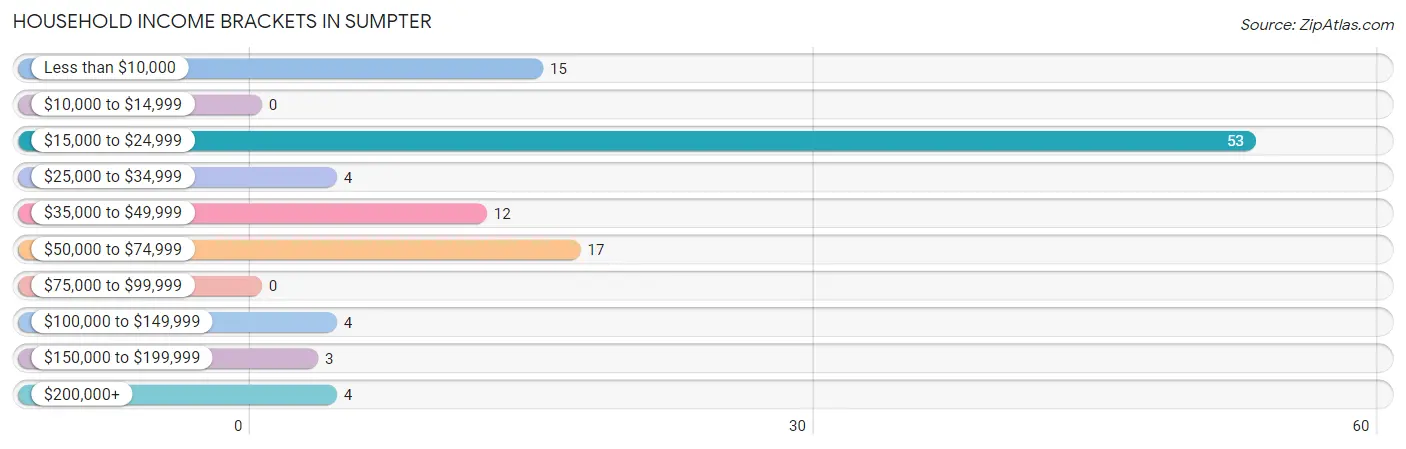
| Income Bracket | # Households | % Households |
| Less than $10,000 | 15 | 13.4% |
| $10,000 to $14,999 | 0 | 0.0% |
| $15,000 to $24,999 | 53 | 47.3% |
| $25,000 to $34,999 | 4 | 3.6% |
| $35,000 to $49,999 | 12 | 10.7% |
| $50,000 to $74,999 | 17 | 15.2% |
| $75,000 to $99,999 | 0 | 0.0% |
| $100,000 to $149,999 | 4 | 3.6% |
| $150,000 to $199,999 | 3 | 2.7% |
| $200,000+ | 4 | 3.6% |
Household Income by Householder Age in Sumpter
The median household income in Sumpter is $24,362, with the highest median household income of $24,574 found in the 65+ years age bracket for the primary householder. A total of 104 households (92.9%) fall into this category.
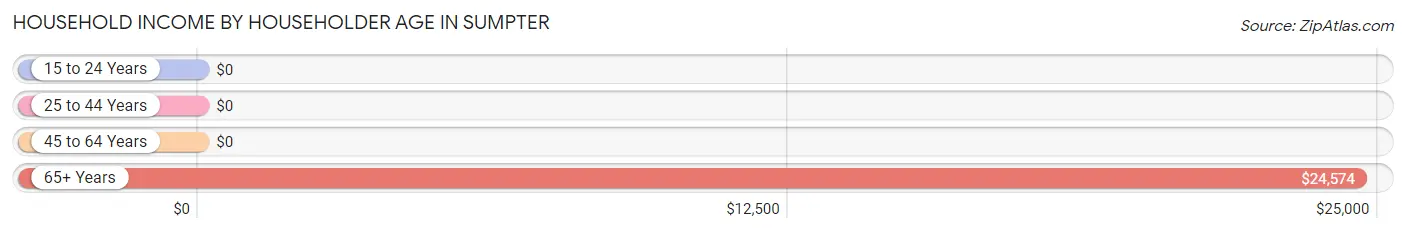
| Income Bracket | # Households | Median Income |
| 15 to 24 Years | 0 (0.0%) | $0 |
| 25 to 44 Years | 0 (0.0%) | $0 |
| 45 to 64 Years | 8 (7.1%) | $0 |
| 65+ Years | 104 (92.9%) | $24,574 |
| Total | 112 (100.0%) | $24,362 |
Poverty in Sumpter
Income Below Poverty by Sex and Age in Sumpter
With 7.0% poverty level for males and 22.6% for females among the residents of Sumpter, 75 year old and over males and 55 to 64 year old females are the most vulnerable to poverty, with 7 males (38.9%) and 16 females (100.0%) in their respective age groups living below the poverty level.
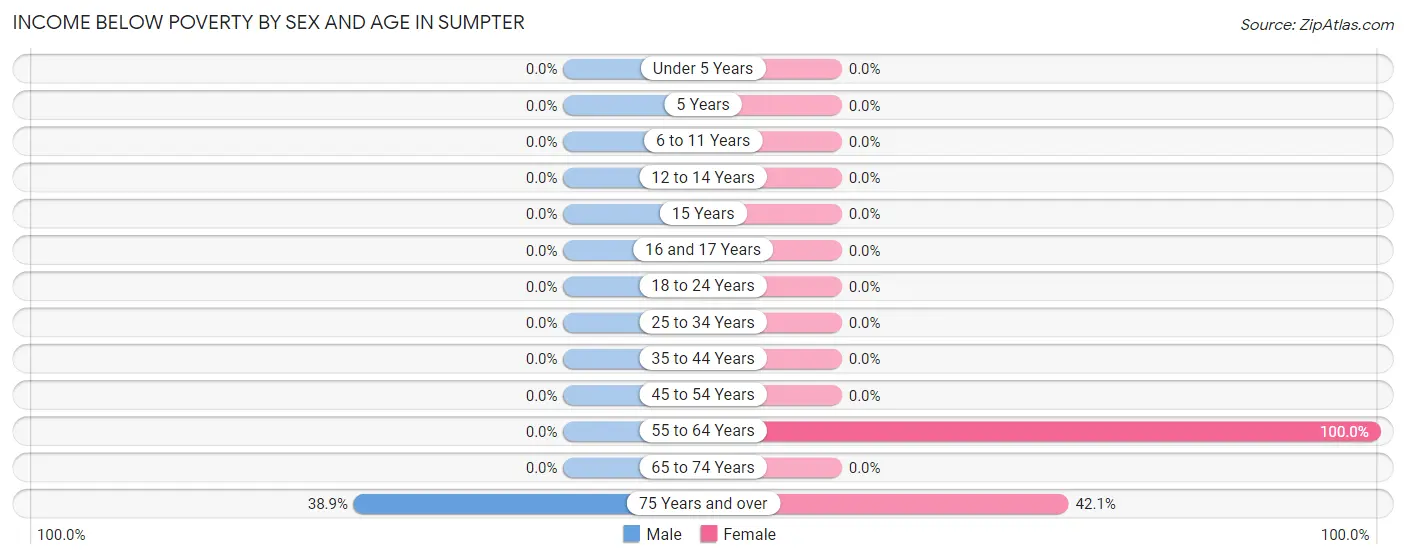
| Age Bracket | Male | Female |
| Under 5 Years | 0 (0.0%) | 0 (0.0%) |
| 5 Years | 0 (0.0%) | 0 (0.0%) |
| 6 to 11 Years | 0 (0.0%) | 0 (0.0%) |
| 12 to 14 Years | 0 (0.0%) | 0 (0.0%) |
| 15 Years | 0 (0.0%) | 0 (0.0%) |
| 16 and 17 Years | 0 (0.0%) | 0 (0.0%) |
| 18 to 24 Years | 0 (0.0%) | 0 (0.0%) |
| 25 to 34 Years | 0 (0.0%) | 0 (0.0%) |
| 35 to 44 Years | 0 (0.0%) | 0 (0.0%) |
| 45 to 54 Years | 0 (0.0%) | 0 (0.0%) |
| 55 to 64 Years | 0 (0.0%) | 16 (100.0%) |
| 65 to 74 Years | 0 (0.0%) | 0 (0.0%) |
| 75 Years and over | 7 (38.9%) | 8 (42.1%) |
| Total | 7 (7.0%) | 24 (22.6%) |
Income Above Poverty by Sex and Age in Sumpter
According to the poverty statistics in Sumpter, males aged 55 to 64 years and females aged 65 to 74 years are the age groups that are most secure financially, with 100.0% of males and 100.0% of females in these age groups living above the poverty line.
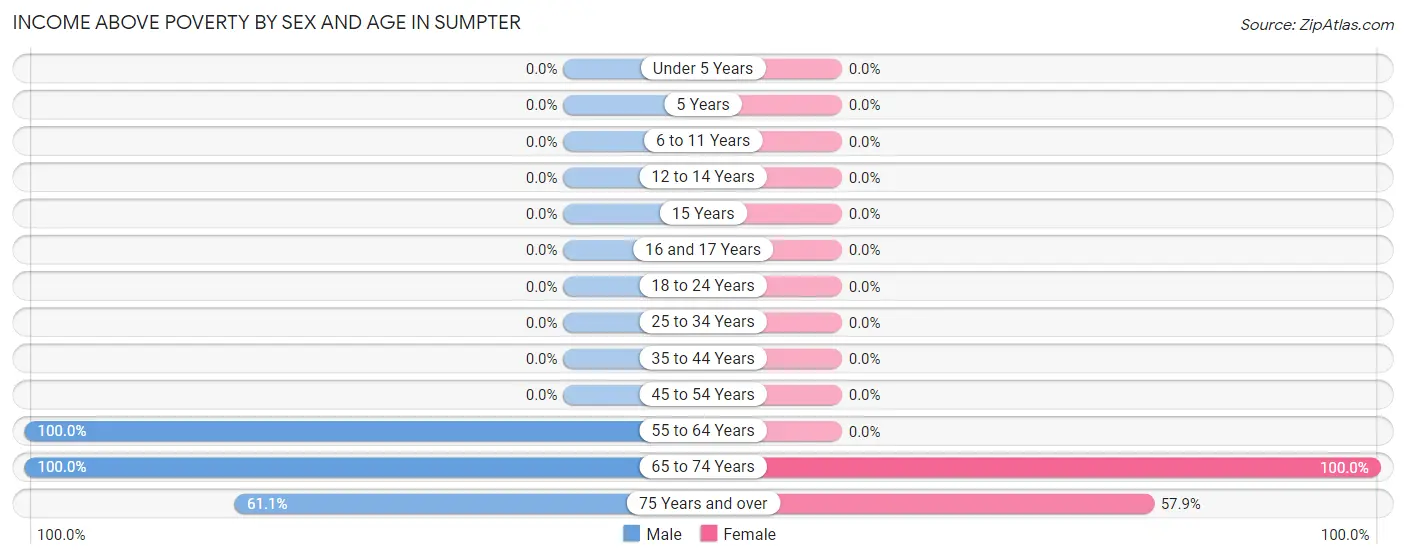
| Age Bracket | Male | Female |
| Under 5 Years | 0 (0.0%) | 0 (0.0%) |
| 5 Years | 0 (0.0%) | 0 (0.0%) |
| 6 to 11 Years | 0 (0.0%) | 0 (0.0%) |
| 12 to 14 Years | 0 (0.0%) | 0 (0.0%) |
| 15 Years | 0 (0.0%) | 0 (0.0%) |
| 16 and 17 Years | 0 (0.0%) | 0 (0.0%) |
| 18 to 24 Years | 0 (0.0%) | 0 (0.0%) |
| 25 to 34 Years | 0 (0.0%) | 0 (0.0%) |
| 35 to 44 Years | 0 (0.0%) | 0 (0.0%) |
| 45 to 54 Years | 0 (0.0%) | 0 (0.0%) |
| 55 to 64 Years | 11 (100.0%) | 0 (0.0%) |
| 65 to 74 Years | 71 (100.0%) | 71 (100.0%) |
| 75 Years and over | 11 (61.1%) | 11 (57.9%) |
| Total | 93 (93.0%) | 82 (77.4%) |
Income Below Poverty Among Married-Couple Families in Sumpter
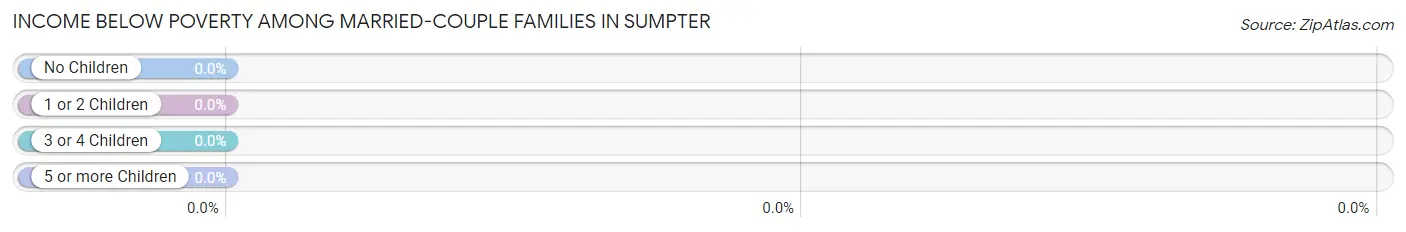
| Children | Above Poverty | Below Poverty |
| No Children | 66 (100.0%) | 0 (0.0%) |
| 1 or 2 Children | 0 (0.0%) | 0 (0.0%) |
| 3 or 4 Children | 0 (0.0%) | 0 (0.0%) |
| 5 or more Children | 0 (0.0%) | 0 (0.0%) |
| Total | 66 (100.0%) | 0 (0.0%) |
Income Below Poverty Among Single-Parent Households in Sumpter
| Children | Single Father | Single Mother |
| No Children | 0 (0.0%) | 0 (0.0%) |
| 1 or 2 Children | 0 (0.0%) | 0 (0.0%) |
| 3 or 4 Children | 0 (0.0%) | 0 (0.0%) |
| 5 or more Children | 0 (0.0%) | 0 (0.0%) |
| Total | 0 (0.0%) | 0 (0.0%) |
Income Below Poverty Among Married-Couple vs Single-Parent Households in Sumpter
| Children | Married-Couple Families | Single-Parent Households |
| No Children | 0 (0.0%) | 0 (0.0%) |
| 1 or 2 Children | 0 (0.0%) | 0 (0.0%) |
| 3 or 4 Children | 0 (0.0%) | 0 (0.0%) |
| 5 or more Children | 0 (0.0%) | 0 (0.0%) |
| Total | 0 (0.0%) | 0 (0.0%) |
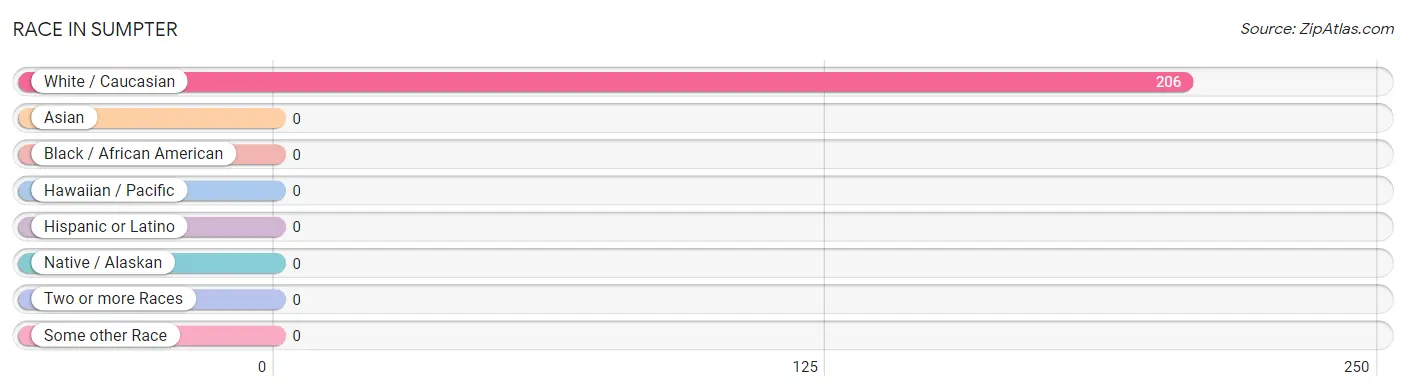
Race in Sumpter
The most populous races in Sumpter are , and White / Caucasian (206 | 100.0%).
| Race | # Population | % Population |
| Asian | 0 | 0.0% |
| Black / African American | 0 | 0.0% |
| Hawaiian / Pacific | 0 | 0.0% |
| Hispanic or Latino | 0 | 0.0% |
| Native / Alaskan | 0 | 0.0% |
| White / Caucasian | 206 | 100.0% |
| Two or more Races | 0 | 0.0% |
| Some other Race | 0 | 0.0% |
| Total | 206 | 100.0% |
Ancestry in Sumpter
The most populous ancestries reported in Sumpter are Irish (70 | 34.0%), Swedish (48 | 23.3%), English (23 | 11.2%), Dutch (20 | 9.7%), and German (13 | 6.3%), together accounting for 84.5% of all Sumpter residents.
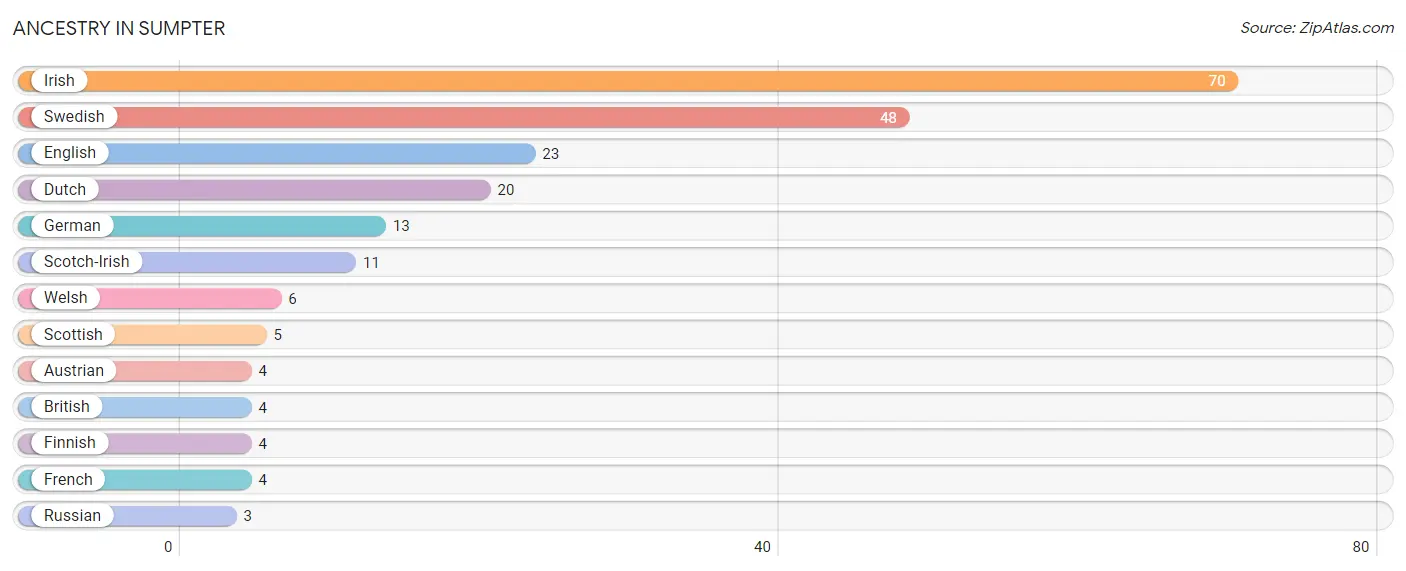
| Ancestry | # Population | % Population |
| Austrian | 4 | 1.9% |
| British | 4 | 1.9% |
| Dutch | 20 | 9.7% |
| English | 23 | 11.2% |
| Finnish | 4 | 1.9% |
| French | 4 | 1.9% |
| German | 13 | 6.3% |
| Irish | 70 | 34.0% |
| Russian | 3 | 1.5% |
| Scotch-Irish | 11 | 5.3% |
| Scottish | 5 | 2.4% |
| Swedish | 48 | 23.3% |
| Welsh | 6 | 2.9% | View All 13 Rows |
Immigrants in Sumpter

| Immigration Origin | # Population | % Population | View All 0 Rows |
Sex and Age in Sumpter
Sex and Age in Sumpter
The most populous age groups in Sumpter are 70 to 74 Years (62 | 62.0%) for men and 65 to 69 Years (63 | 59.4%) for women.
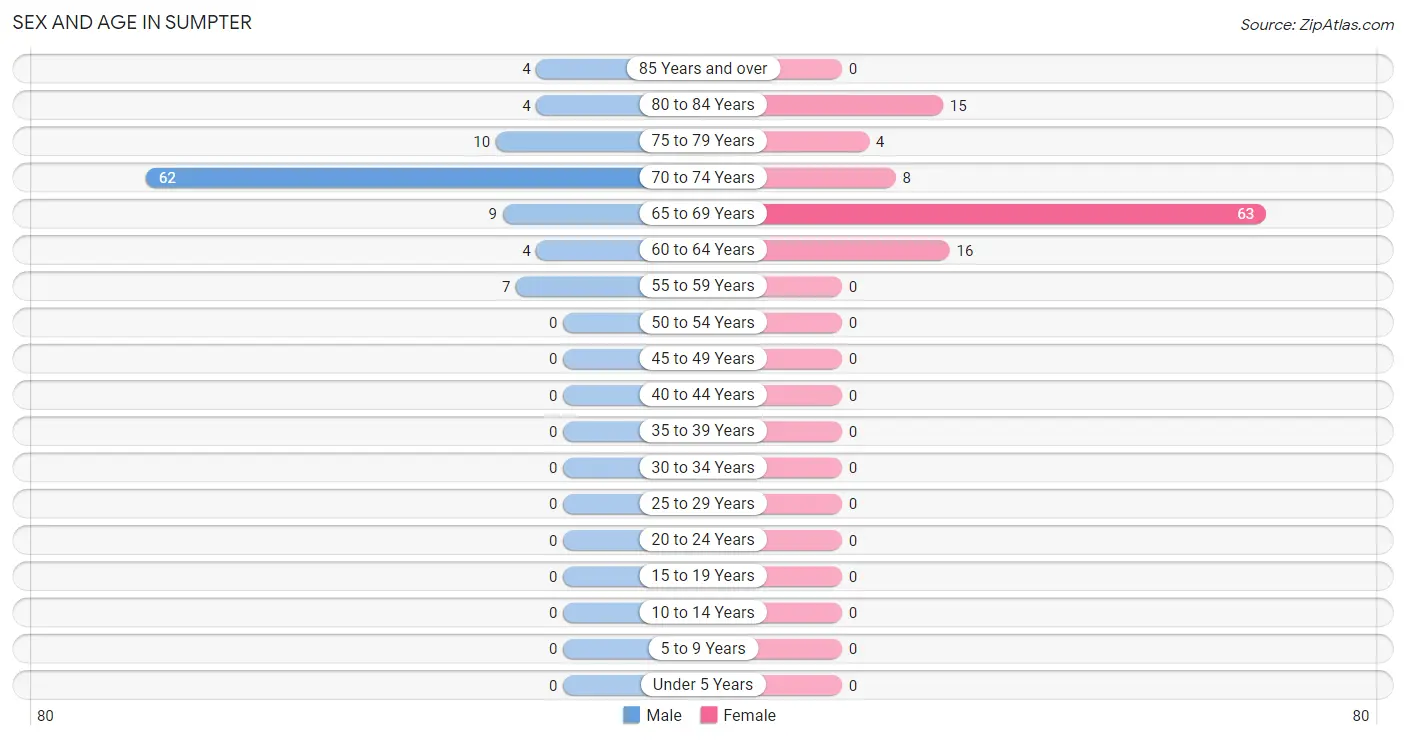
| Age Bracket | Male | Female |
| Under 5 Years | 0 (0.0%) | 0 (0.0%) |
| 5 to 9 Years | 0 (0.0%) | 0 (0.0%) |
| 10 to 14 Years | 0 (0.0%) | 0 (0.0%) |
| 15 to 19 Years | 0 (0.0%) | 0 (0.0%) |
| 20 to 24 Years | 0 (0.0%) | 0 (0.0%) |
| 25 to 29 Years | 0 (0.0%) | 0 (0.0%) |
| 30 to 34 Years | 0 (0.0%) | 0 (0.0%) |
| 35 to 39 Years | 0 (0.0%) | 0 (0.0%) |
| 40 to 44 Years | 0 (0.0%) | 0 (0.0%) |
| 45 to 49 Years | 0 (0.0%) | 0 (0.0%) |
| 50 to 54 Years | 0 (0.0%) | 0 (0.0%) |
| 55 to 59 Years | 7 (7.0%) | 0 (0.0%) |
| 60 to 64 Years | 4 (4.0%) | 16 (15.1%) |
| 65 to 69 Years | 9 (9.0%) | 63 (59.4%) |
| 70 to 74 Years | 62 (62.0%) | 8 (7.5%) |
| 75 to 79 Years | 10 (10.0%) | 4 (3.8%) |
| 80 to 84 Years | 4 (4.0%) | 15 (14.1%) |
| 85 Years and over | 4 (4.0%) | 0 (0.0%) |
| Total | 100 (100.0%) | 106 (100.0%) |
Families and Households in Sumpter
Median Family Size in Sumpter
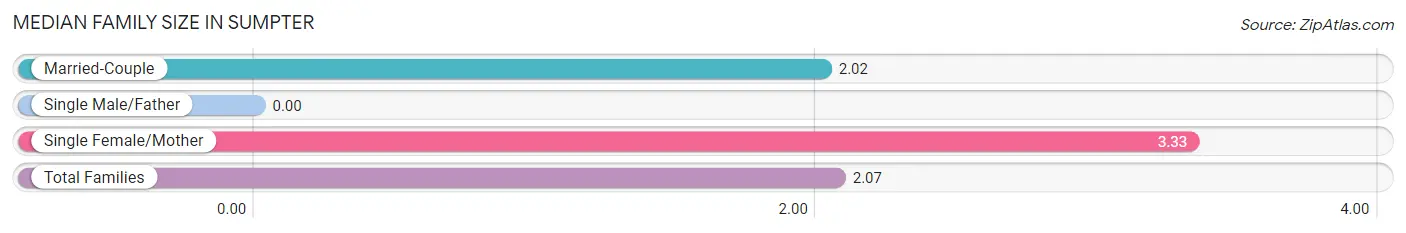
| Family Type | # Families | Family Size |
| Married-Couple | 66 (95.7%) | 2.02 |
| Single Male/Father | 0 (0.0%) | - |
| Single Female/Mother | 3 (4.3%) | 3.33 |
| Total Families | 69 (100.0%) | 2.07 |
Median Household Size in Sumpter
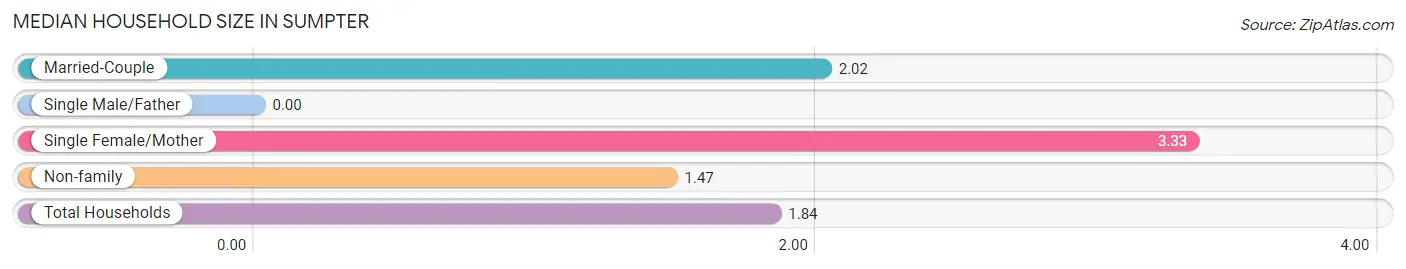
| Household Type | # Households | Household Size |
| Married-Couple | 66 (58.9%) | 2.02 |
| Single Male/Father | 0 (0.0%) | - |
| Single Female/Mother | 3 (2.7%) | 3.33 |
| Non-family | 43 (38.4%) | 1.47 |
| Total Households | 112 (100.0%) | 1.84 |
Household Size by Marriage Status in Sumpter
Out of a total of 112 households in Sumpter, 69 (61.6%) are family households, while 43 (38.4%) are nonfamily households. The most numerous type of family households are 2-person households, comprising 69, and the most common type of nonfamily households are 1-person households, comprising 29.
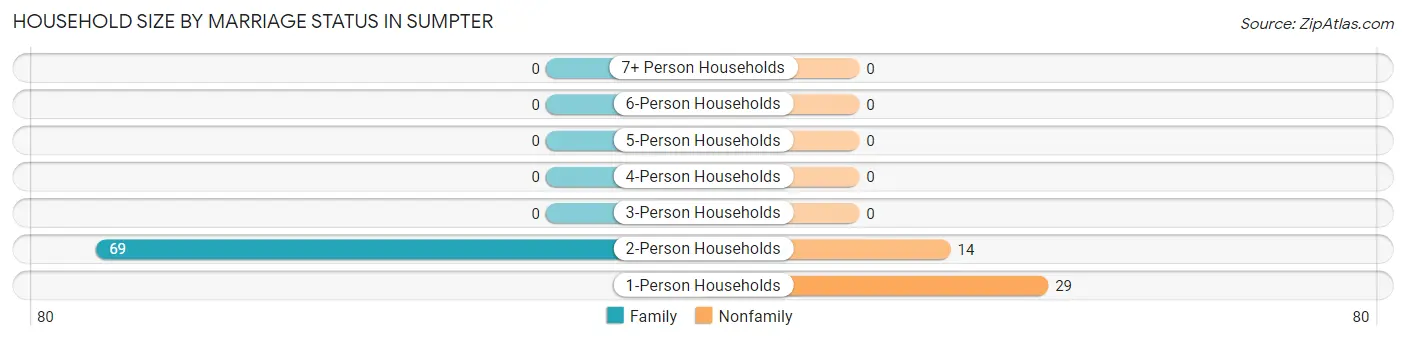
| Household Size | Family Households | Nonfamily Households |
| 1-Person Households | - | 29 (25.9%) |
| 2-Person Households | 69 (61.6%) | 14 (12.5%) |
| 3-Person Households | 0 (0.0%) | 0 (0.0%) |
| 4-Person Households | 0 (0.0%) | 0 (0.0%) |
| 5-Person Households | 0 (0.0%) | 0 (0.0%) |
| 6-Person Households | 0 (0.0%) | 0 (0.0%) |
| 7+ Person Households | 0 (0.0%) | 0 (0.0%) |
| Total | 69 (61.6%) | 43 (38.4%) |
Female Fertility in Sumpter
Fertility by Age in Sumpter
| Age Bracket | Women with Births | Births / 1,000 Women |
| 15 to 19 years | 0 (0.0%) | 0.0 |
| 20 to 34 years | 0 (0.0%) | 0.0 |
| 35 to 50 years | 0 (0.0%) | 0.0 |
| Total | 0 (0.0%) | 0.0 |
Fertility by Age by Marriage Status in Sumpter
| Age Bracket | Married | Unmarried |
| 15 to 19 years | 0 (0.0%) | 0 (0.0%) |
| 20 to 34 years | 0 (0.0%) | 0 (0.0%) |
| 35 to 50 years | 0 (0.0%) | 0 (0.0%) |
| Total | 0 (0.0%) | 0 (0.0%) |
Fertility by Education in Sumpter
| Educational Attainment | Women with Births | Births / 1,000 Women |
| Less than High School | 0 (0.0%) | 0.0 |
| High School Diploma | 0 (0.0%) | 0.0 |
| College or Associate's Degree | 0 (0.0%) | 0.0 |
| Bachelor's Degree | 0 (0.0%) | 0.0 |
| Graduate Degree | 0 (0.0%) | 0.0 |
| Total | 0 (0.0%) | 0.0 |
Fertility by Education by Marriage Status in Sumpter
| Educational Attainment | Married | Unmarried |
| Less than High School | 0 (0.0%) | 0 (0.0%) |
| High School Diploma | 0 (0.0%) | 0 (0.0%) |
| College or Associate's Degree | 0 (0.0%) | 0 (0.0%) |
| Bachelor's Degree | 0 (0.0%) | 0 (0.0%) |
| Graduate Degree | 0 (0.0%) | 0 (0.0%) |
| Total | 0 (0.0%) | 0 (0.0%) |
Employment Characteristics in Sumpter
Employment by Class of Employer in Sumpter
Among the 11 employed individuals in Sumpter, private company employees (7 | 63.6%), and self-employed (incorporated) (4 | 36.4%) make up the most common classes of employment.
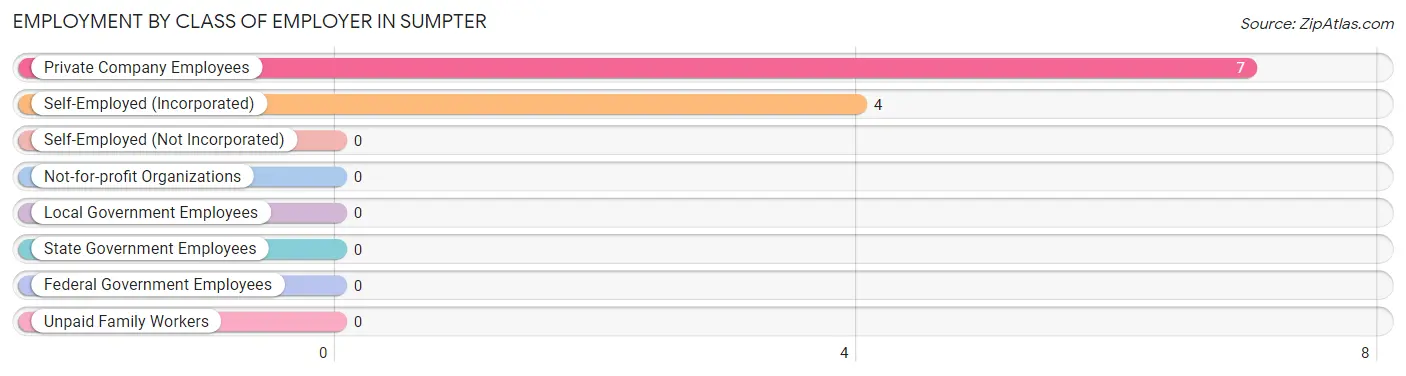
| Employer Class | # Employees | % Employees |
| Private Company Employees | 7 | 63.6% |
| Self-Employed (Incorporated) | 4 | 36.4% |
| Self-Employed (Not Incorporated) | 0 | 0.0% |
| Not-for-profit Organizations | 0 | 0.0% |
| Local Government Employees | 0 | 0.0% |
| State Government Employees | 0 | 0.0% |
| Federal Government Employees | 0 | 0.0% |
| Unpaid Family Workers | 0 | 0.0% |
| Total | 11 | 100.0% |
Employment Status by Age in Sumpter
According to the labor force statistics for Sumpter, out of the total population over 16 years of age (206), 7.3% or 15 individuals are in the labor force, with 26.7% or 4 of them unemployed. The age group with the highest labor force participation rate is 60 to 64 years, with 40.0% or 8 individuals in the labor force. Within the labor force, the 60 to 64 years age range has the highest percentage of unemployed individuals, with 50.0% or 4 of them being unemployed.
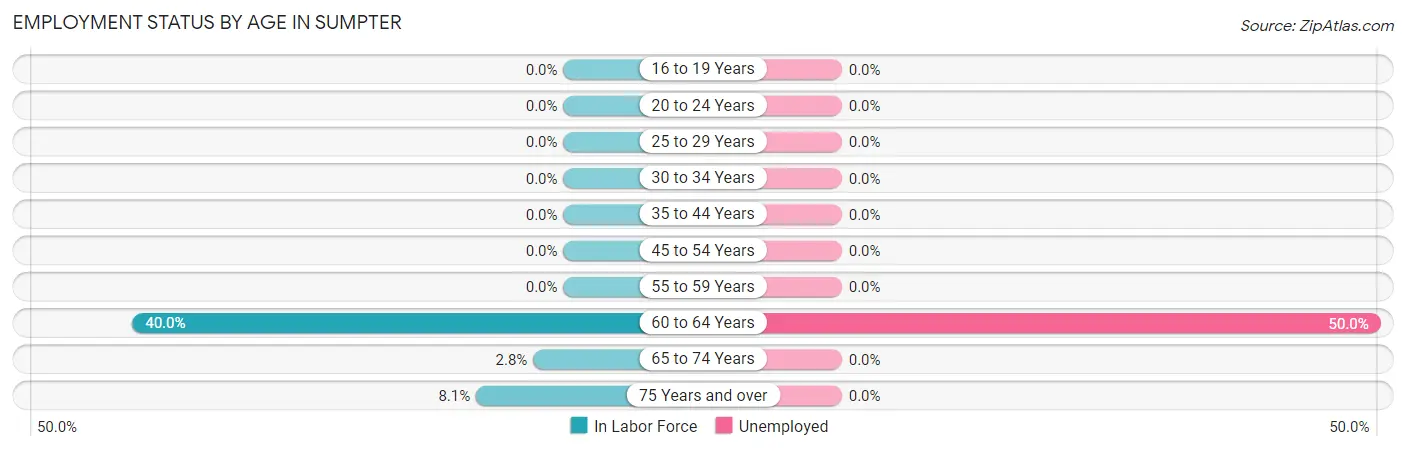
| Age Bracket | In Labor Force | Unemployed |
| 16 to 19 Years | 0 (0.0%) | 0 (0.0%) |
| 20 to 24 Years | 0 (0.0%) | 0 (0.0%) |
| 25 to 29 Years | 0 (0.0%) | 0 (0.0%) |
| 30 to 34 Years | 0 (0.0%) | 0 (0.0%) |
| 35 to 44 Years | 0 (0.0%) | 0 (0.0%) |
| 45 to 54 Years | 0 (0.0%) | 0 (0.0%) |
| 55 to 59 Years | 0 (0.0%) | 0 (0.0%) |
| 60 to 64 Years | 8 (40.0%) | 4 (50.0%) |
| 65 to 74 Years | 4 (2.8%) | 0 (0.0%) |
| 75 Years and over | 3 (8.1%) | 0 (0.0%) |
| Total | 15 (7.3%) | 4 (26.7%) |
Employment Status by Educational Attainment in Sumpter
According to labor force statistics for Sumpter, 29.6% of individuals (8) out of the total population between 25 and 64 years of age (27) are in the labor force, with 50.0% or 4 of them being unemployed. The group with the highest labor force participation rate are those with the educational attainment of bachelor's degree or higher, with 50.0% or 8 individuals in the labor force. Within the labor force, individuals with bachelor's degree or higher education have the highest percentage of unemployment, with 50.0% or 4 of them being unemployed.
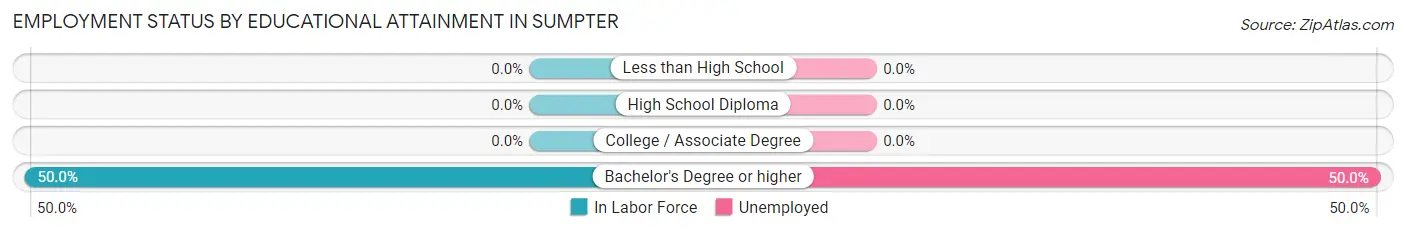
| Educational Attainment | In Labor Force | Unemployed |
| Less than High School | 0 (0.0%) | 0 (0.0%) |
| High School Diploma | 0 (0.0%) | 0 (0.0%) |
| College / Associate Degree | 0 (0.0%) | 0 (0.0%) |
| Bachelor's Degree or higher | 8 (50.0%) | 8 (50.0%) |
| Total | 8 (29.6%) | 14 (50.0%) |
Employment Occupations by Sex in Sumpter
Management, Business, Science and Arts Occupations
The most common Management, Business, Science and Arts occupations in Sumpter are Community & Social Service (4 | 36.4%), Legal Services & Support (4 | 36.4%), and Management (3 | 27.3%).
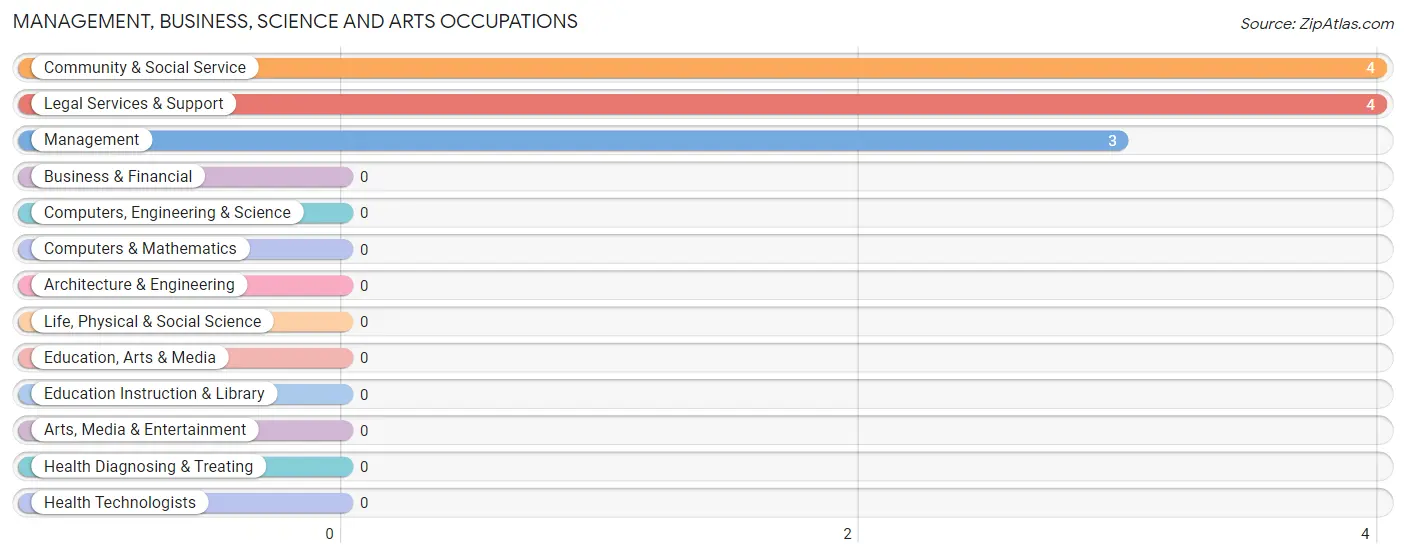
Management, Business, Science and Arts Occupations by Sex
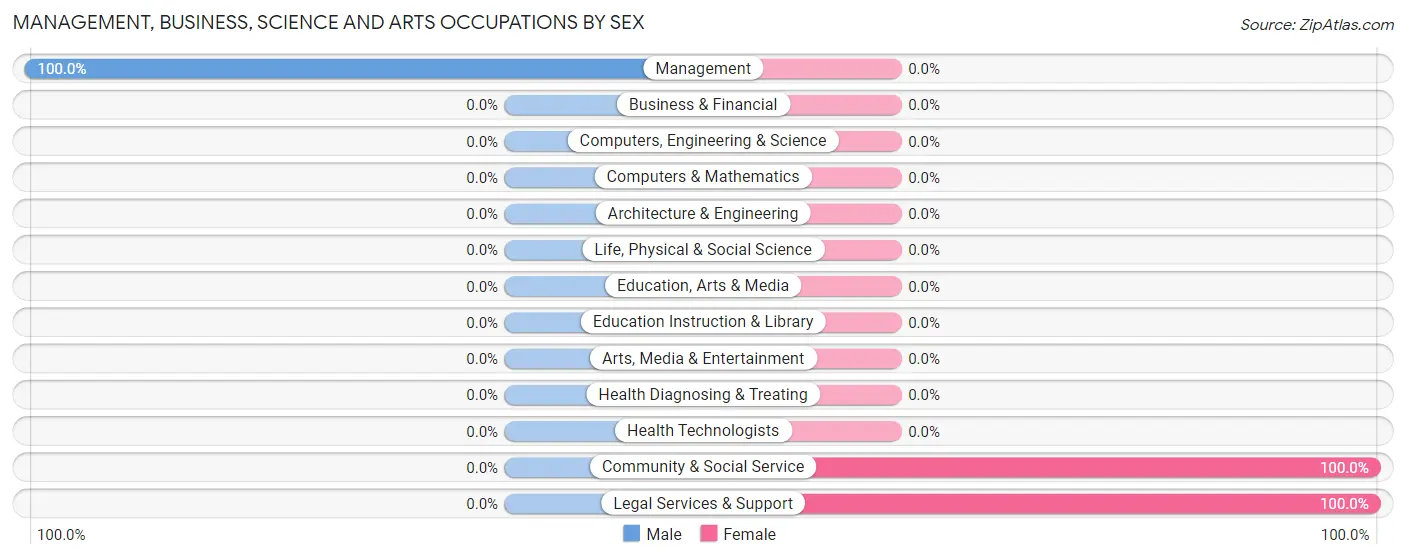
| Occupation | Male | Female |
| Management | 3 (100.0%) | 0 (0.0%) |
| Business & Financial | 0 (0.0%) | 0 (0.0%) |
| Computers, Engineering & Science | 0 (0.0%) | 0 (0.0%) |
| Computers & Mathematics | 0 (0.0%) | 0 (0.0%) |
| Architecture & Engineering | 0 (0.0%) | 0 (0.0%) |
| Life, Physical & Social Science | 0 (0.0%) | 0 (0.0%) |
| Community & Social Service | 0 (0.0%) | 4 (100.0%) |
| Education, Arts & Media | 0 (0.0%) | 0 (0.0%) |
| Legal Services & Support | 0 (0.0%) | 4 (100.0%) |
| Education Instruction & Library | 0 (0.0%) | 0 (0.0%) |
| Arts, Media & Entertainment | 0 (0.0%) | 0 (0.0%) |
| Health Diagnosing & Treating | 0 (0.0%) | 0 (0.0%) |
| Health Technologists | 0 (0.0%) | 0 (0.0%) |
| Total (Category) | 3 (42.9%) | 4 (57.1%) |
| Total (Overall) | 7 (63.6%) | 4 (36.4%) |
Services Occupations
Services Occupations by Sex
| Occupation | Male | Female |
| Healthcare Support | 0 (0.0%) | 0 (0.0%) |
| Security & Protection | 0 (0.0%) | 0 (0.0%) |
| Firefighting & Prevention | 0 (0.0%) | 0 (0.0%) |
| Law Enforcement | 0 (0.0%) | 0 (0.0%) |
| Food Preparation & Serving | 0 (0.0%) | 0 (0.0%) |
| Cleaning & Maintenance | 0 (0.0%) | 0 (0.0%) |
| Personal Care & Service | 0 (0.0%) | 0 (0.0%) |
| Total (Category) | 0 (0.0%) | 0 (0.0%) |
| Total (Overall) | 7 (63.6%) | 4 (36.4%) |
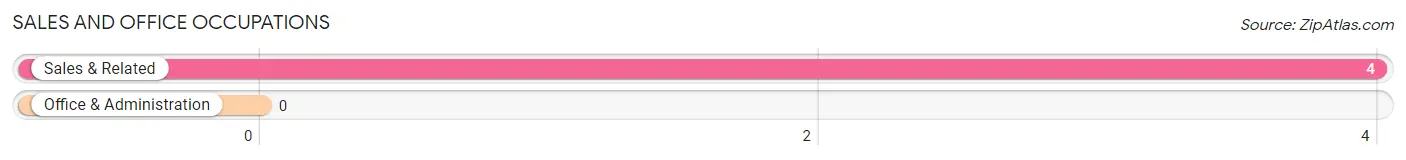
Sales and Office Occupations
The most common Sales and Office occupations in Sumpter are , and Sales & Related (4 | 36.4%).
Sales and Office Occupations by Sex
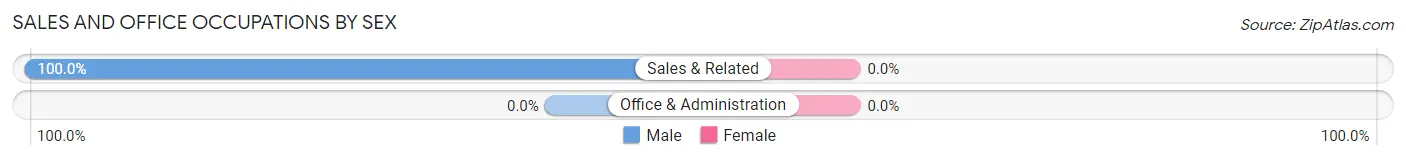
| Occupation | Male | Female |
| Sales & Related | 4 (100.0%) | 0 (0.0%) |
| Office & Administration | 0 (0.0%) | 0 (0.0%) |
| Total (Category) | 4 (100.0%) | 0 (0.0%) |
| Total (Overall) | 7 (63.6%) | 4 (36.4%) |
Natural Resources, Construction and Maintenance Occupations
Natural Resources, Construction and Maintenance Occupations by Sex
| Occupation | Male | Female |
| Farming, Fishing & Forestry | 0 (0.0%) | 0 (0.0%) |
| Construction & Extraction | 0 (0.0%) | 0 (0.0%) |
| Installation, Maintenance & Repair | 0 (0.0%) | 0 (0.0%) |
| Total (Category) | 0 (0.0%) | 0 (0.0%) |
| Total (Overall) | 7 (63.6%) | 4 (36.4%) |
Production, Transportation and Moving Occupations
Production, Transportation and Moving Occupations by Sex
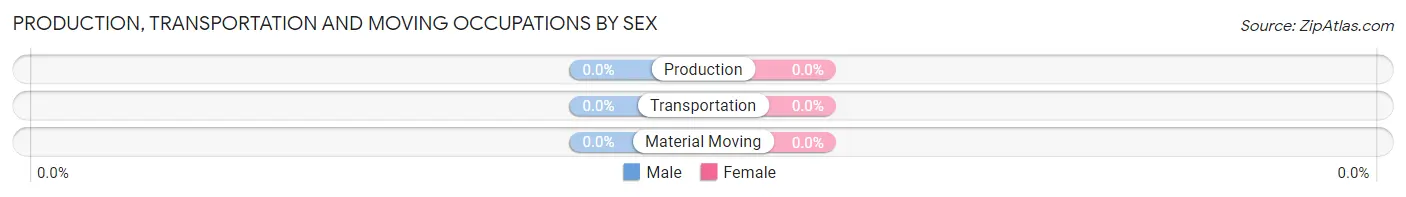
| Occupation | Male | Female |
| Production | 0 (0.0%) | 0 (0.0%) |
| Transportation | 0 (0.0%) | 0 (0.0%) |
| Material Moving | 0 (0.0%) | 0 (0.0%) |
| Total (Category) | 0 (0.0%) | 0 (0.0%) |
| Total (Overall) | 7 (63.6%) | 4 (36.4%) |
Employment Industries by Sex in Sumpter
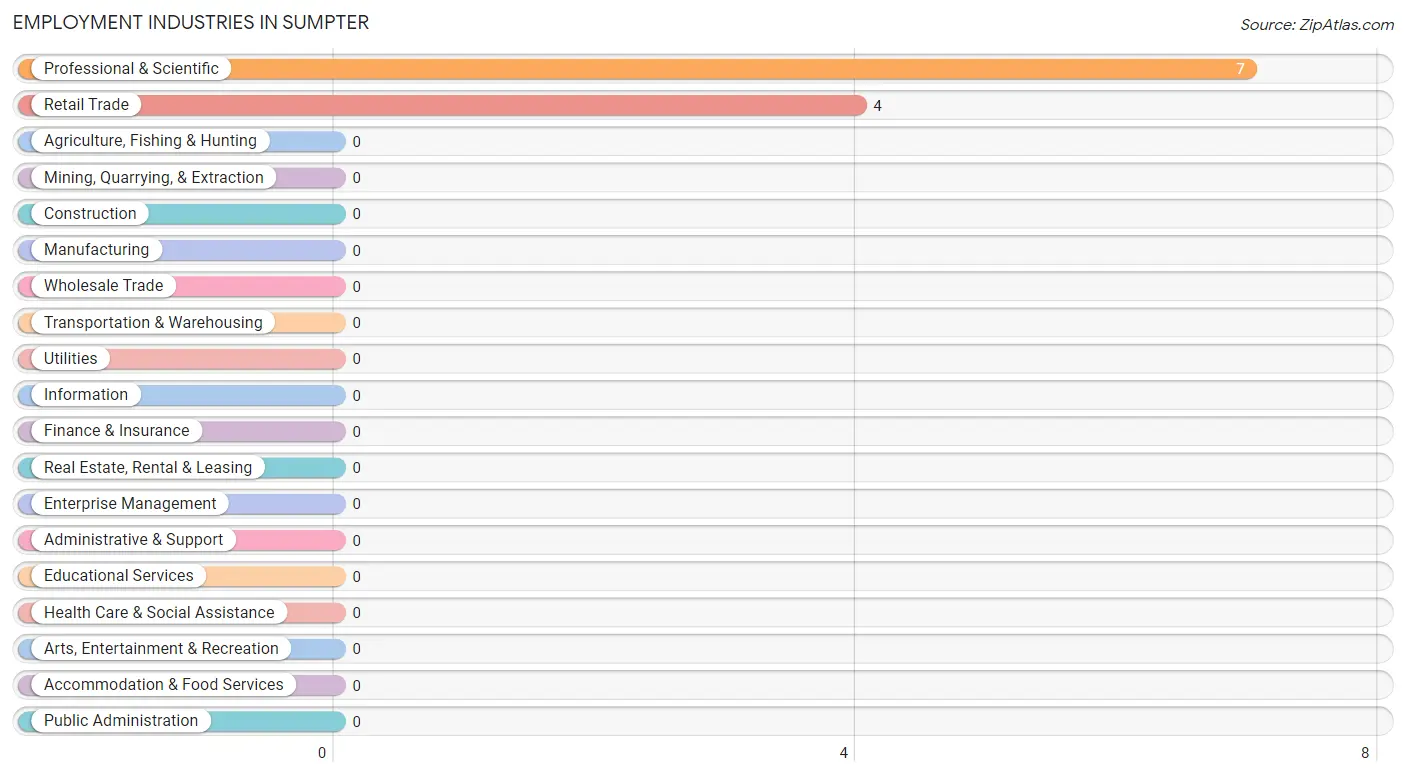
Employment Industries in Sumpter
The major employment industries in Sumpter include Professional & Scientific (7 | 63.6%), and Retail Trade (4 | 36.4%).
Employment Industries by Sex in Sumpter
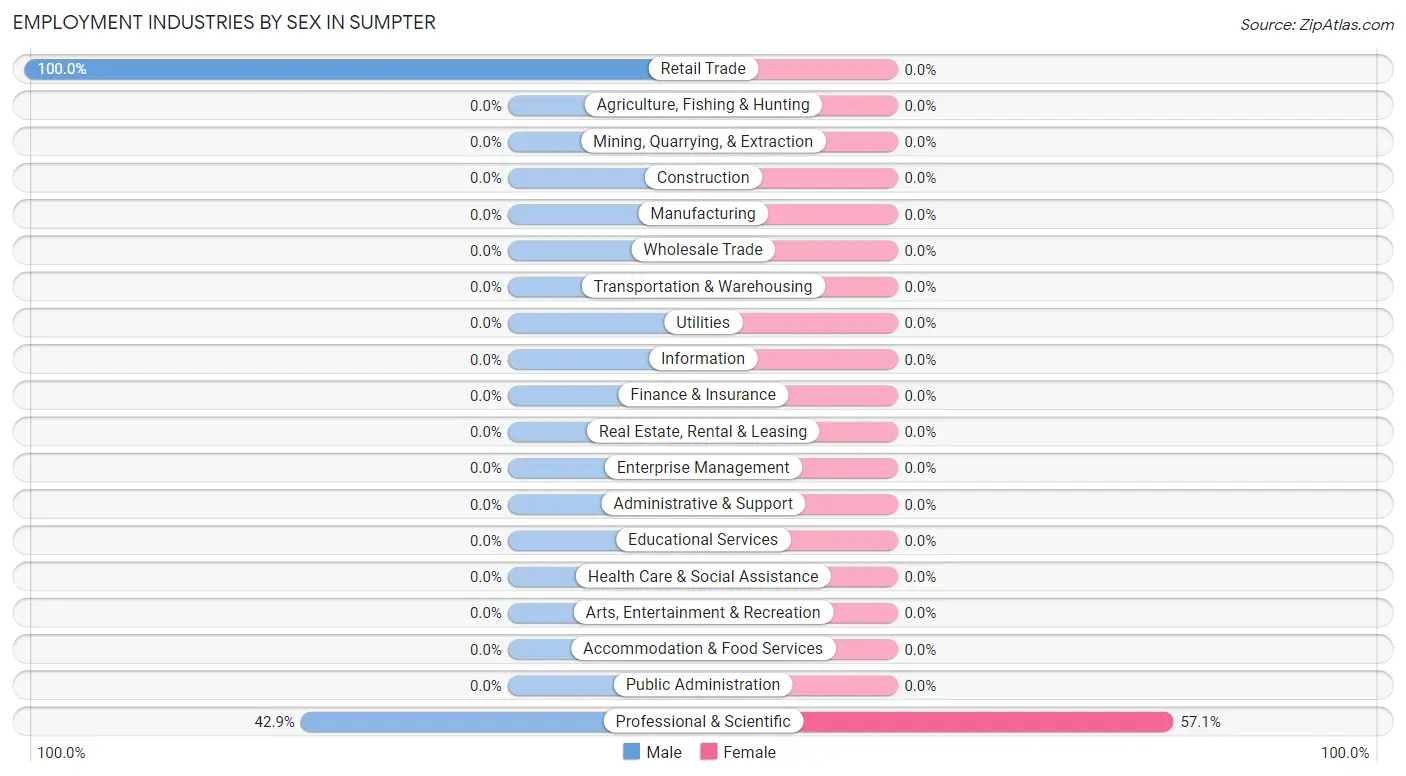
| Industry | Male | Female |
| Agriculture, Fishing & Hunting | 0 (0.0%) | 0 (0.0%) |
| Mining, Quarrying, & Extraction | 0 (0.0%) | 0 (0.0%) |
| Construction | 0 (0.0%) | 0 (0.0%) |
| Manufacturing | 0 (0.0%) | 0 (0.0%) |
| Wholesale Trade | 0 (0.0%) | 0 (0.0%) |
| Retail Trade | 4 (100.0%) | 0 (0.0%) |
| Transportation & Warehousing | 0 (0.0%) | 0 (0.0%) |
| Utilities | 0 (0.0%) | 0 (0.0%) |
| Information | 0 (0.0%) | 0 (0.0%) |
| Finance & Insurance | 0 (0.0%) | 0 (0.0%) |
| Real Estate, Rental & Leasing | 0 (0.0%) | 0 (0.0%) |
| Professional & Scientific | 3 (42.9%) | 4 (57.1%) |
| Enterprise Management | 0 (0.0%) | 0 (0.0%) |
| Administrative & Support | 0 (0.0%) | 0 (0.0%) |
| Educational Services | 0 (0.0%) | 0 (0.0%) |
| Health Care & Social Assistance | 0 (0.0%) | 0 (0.0%) |
| Arts, Entertainment & Recreation | 0 (0.0%) | 0 (0.0%) |
| Accommodation & Food Services | 0 (0.0%) | 0 (0.0%) |
| Public Administration | 0 (0.0%) | 0 (0.0%) |
| Total | 7 (63.6%) | 4 (36.4%) |
Education in Sumpter
School Enrollment in Sumpter
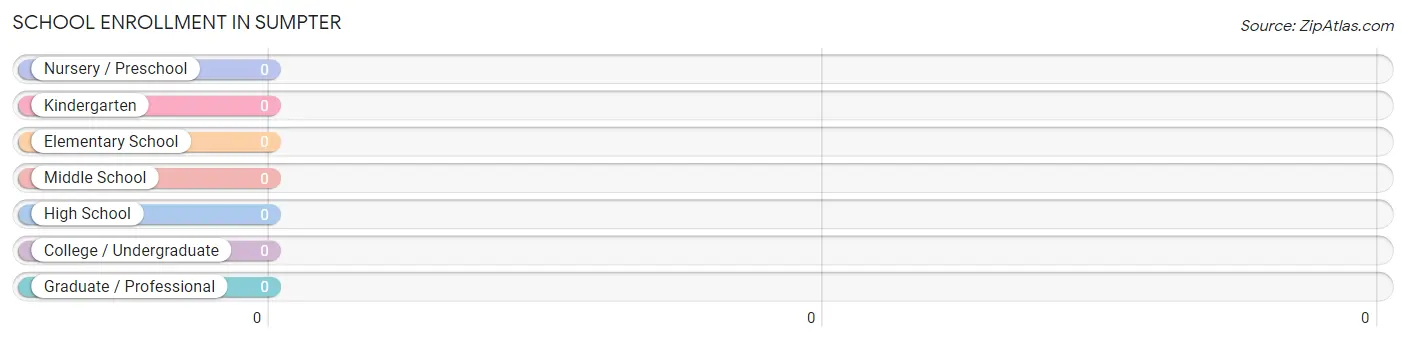
| School Level | # Students | % Students |
| Nursery / Preschool | 0 | 0.0% |
| Kindergarten | 0 | 0.0% |
| Elementary School | 0 | 0.0% |
| Middle School | 0 | 0.0% |
| High School | 0 | 0.0% |
| College / Undergraduate | 0 | 0.0% |
| Graduate / Professional | 0 | 0.0% |
| Total | 0 | 0.0% |
School Enrollment by Age by Funding Source in Sumpter
| Age Bracket | Public School | Private School |
| 3 to 4 Year Olds | 0 (0.0%) | 0 (0.0%) |
| 5 to 9 Year Old | 0 (0.0%) | 0 (0.0%) |
| 10 to 14 Year Olds | 0 (0.0%) | 0 (0.0%) |
| 15 to 17 Year Olds | 0 (0.0%) | 0 (0.0%) |
| 18 to 19 Year Olds | 0 (0.0%) | 0 (0.0%) |
| 20 to 24 Year Olds | 0 (0.0%) | 0 (0.0%) |
| 25 to 34 Year Olds | 0 (0.0%) | 0 (0.0%) |
| 35 Years and over | 0 (0.0%) | 0 (0.0%) |
| Total | 0 (0.0%) | 0 (0.0%) |
Educational Attainment by Field of Study in Sumpter
Bio, nature & agricultural (8 | 23.5%), computers & mathematics (4 | 11.8%), psychology (4 | 11.8%), science & technology (4 | 11.8%), and visual & performing arts (4 | 11.8%) are the most common fields of study among 34 individuals in Sumpter who have obtained a bachelor's degree or higher.
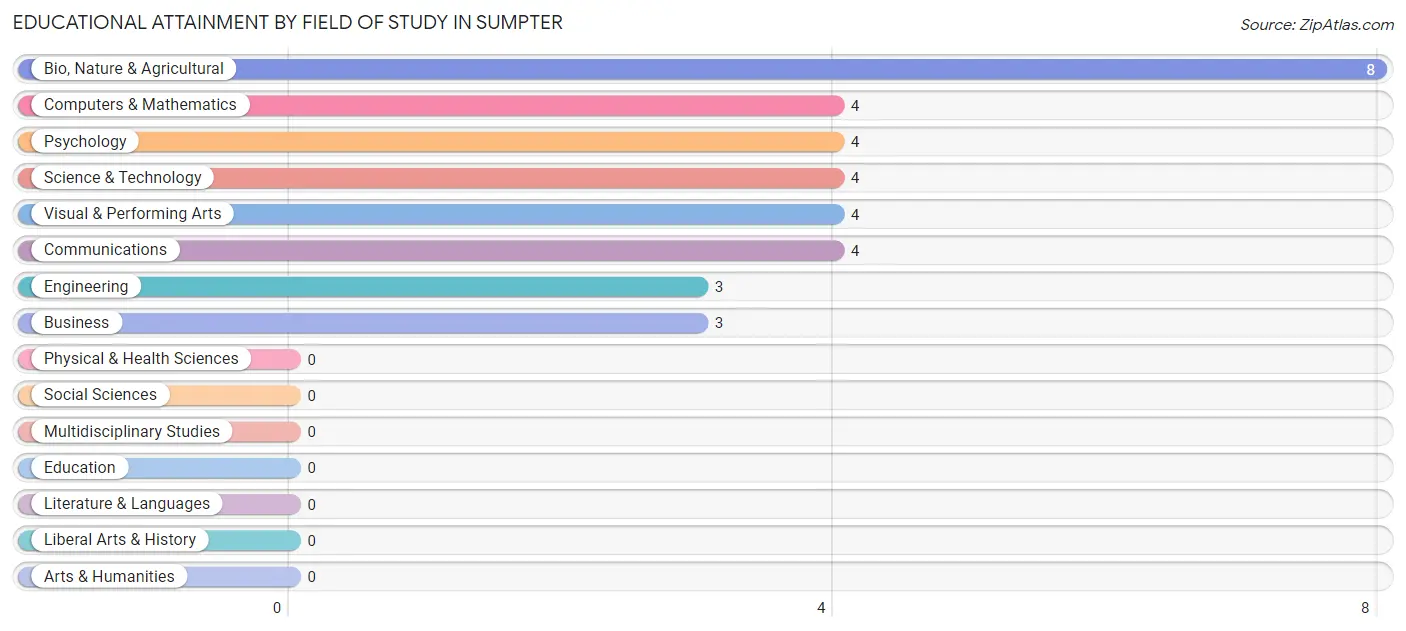
| Field of Study | # Graduates | % Graduates |
| Computers & Mathematics | 4 | 11.8% |
| Bio, Nature & Agricultural | 8 | 23.5% |
| Physical & Health Sciences | 0 | 0.0% |
| Psychology | 4 | 11.8% |
| Social Sciences | 0 | 0.0% |
| Engineering | 3 | 8.8% |
| Multidisciplinary Studies | 0 | 0.0% |
| Science & Technology | 4 | 11.8% |
| Business | 3 | 8.8% |
| Education | 0 | 0.0% |
| Literature & Languages | 0 | 0.0% |
| Liberal Arts & History | 0 | 0.0% |
| Visual & Performing Arts | 4 | 11.8% |
| Communications | 4 | 11.8% |
| Arts & Humanities | 0 | 0.0% |
| Total | 34 | 100.0% |
Transportation & Commute in Sumpter
Vehicle Availability by Sex in Sumpter
The most prevalent vehicle ownership categories in Sumpter are males with 2 vehicles (7, accounting for 100.0%) and females with 2 vehicles (4, making up 175.0%).
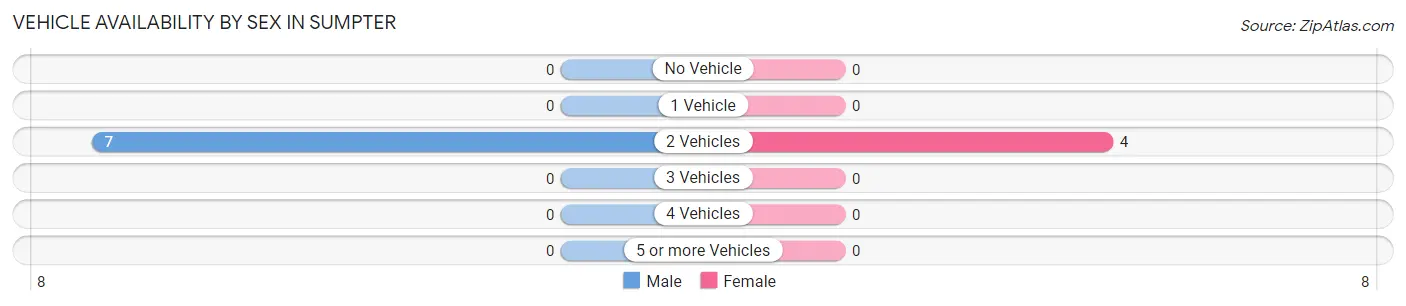
| Vehicles Available | Male | Female |
| No Vehicle | 0 (0.0%) | 0 (0.0%) |
| 1 Vehicle | 0 (0.0%) | 0 (0.0%) |
| 2 Vehicles | 7 (100.0%) | 4 (100.0%) |
| 3 Vehicles | 0 (0.0%) | 0 (0.0%) |
| 4 Vehicles | 0 (0.0%) | 0 (0.0%) |
| 5 or more Vehicles | 0 (0.0%) | 0 (0.0%) |
| Total | 7 (100.0%) | 4 (100.0%) |
Commute Time in Sumpter
The most frequently occuring commute durations in Sumpter are 5 to 9 minutes (7 commuters, 63.6%), 45 to 59 minutes (4 commuters, 36.4%), and less than 5 minutes (0 commuters, 0.0%).
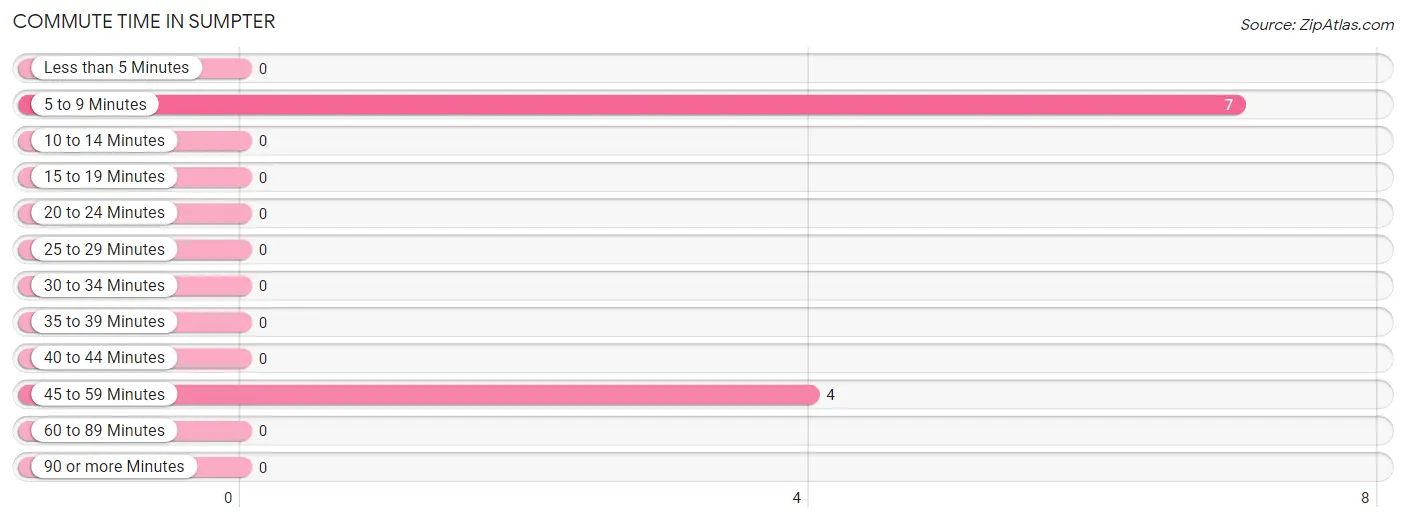
| Commute Time | # Commuters | % Commuters |
| Less than 5 Minutes | 0 | 0.0% |
| 5 to 9 Minutes | 7 | 63.6% |
| 10 to 14 Minutes | 0 | 0.0% |
| 15 to 19 Minutes | 0 | 0.0% |
| 20 to 24 Minutes | 0 | 0.0% |
| 25 to 29 Minutes | 0 | 0.0% |
| 30 to 34 Minutes | 0 | 0.0% |
| 35 to 39 Minutes | 0 | 0.0% |
| 40 to 44 Minutes | 0 | 0.0% |
| 45 to 59 Minutes | 4 | 36.4% |
| 60 to 89 Minutes | 0 | 0.0% |
| 90 or more Minutes | 0 | 0.0% |
Commute Time by Sex in Sumpter
The most common commute times in Sumpter are 45 to 59 minutes (4 commuters, 57.1%) for males and 5 to 9 minutes (4 commuters, 100.0%) for females.
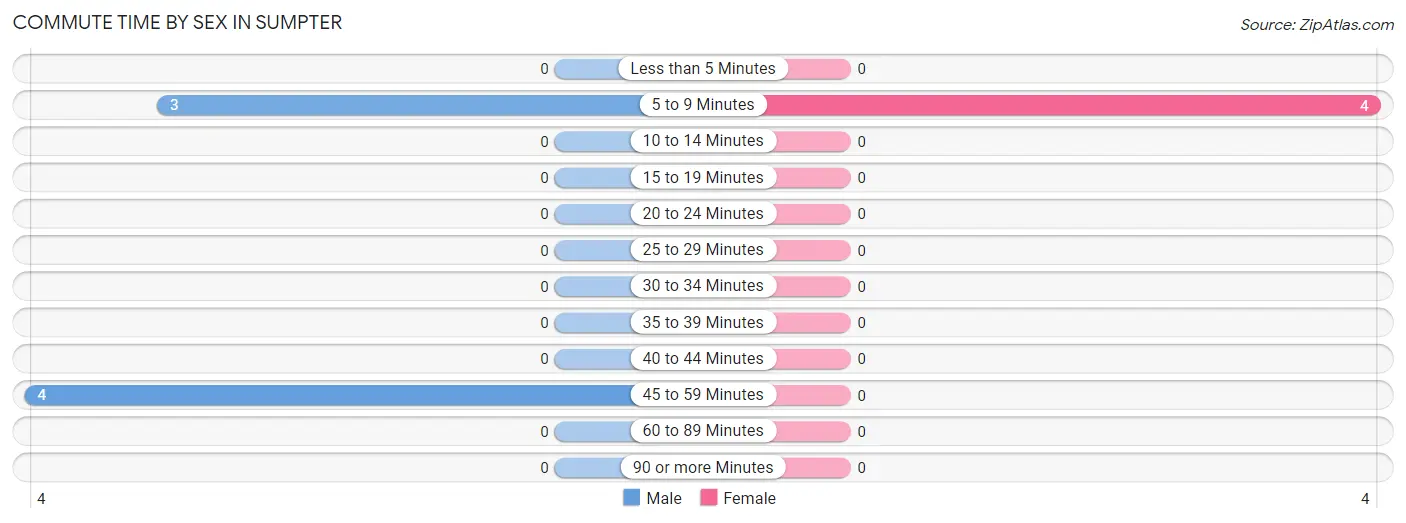
| Commute Time | Male | Female |
| Less than 5 Minutes | 0 (0.0%) | 0 (0.0%) |
| 5 to 9 Minutes | 3 (42.9%) | 4 (100.0%) |
| 10 to 14 Minutes | 0 (0.0%) | 0 (0.0%) |
| 15 to 19 Minutes | 0 (0.0%) | 0 (0.0%) |
| 20 to 24 Minutes | 0 (0.0%) | 0 (0.0%) |
| 25 to 29 Minutes | 0 (0.0%) | 0 (0.0%) |
| 30 to 34 Minutes | 0 (0.0%) | 0 (0.0%) |
| 35 to 39 Minutes | 0 (0.0%) | 0 (0.0%) |
| 40 to 44 Minutes | 0 (0.0%) | 0 (0.0%) |
| 45 to 59 Minutes | 4 (57.1%) | 0 (0.0%) |
| 60 to 89 Minutes | 0 (0.0%) | 0 (0.0%) |
| 90 or more Minutes | 0 (0.0%) | 0 (0.0%) |
Time of Departure to Work by Sex in Sumpter
The most frequent times of departure to work in Sumpter are 6:00 AM to 6:29 AM (4, 57.1%) for males and 8:00 AM to 8:29 AM (4, 100.0%) for females.
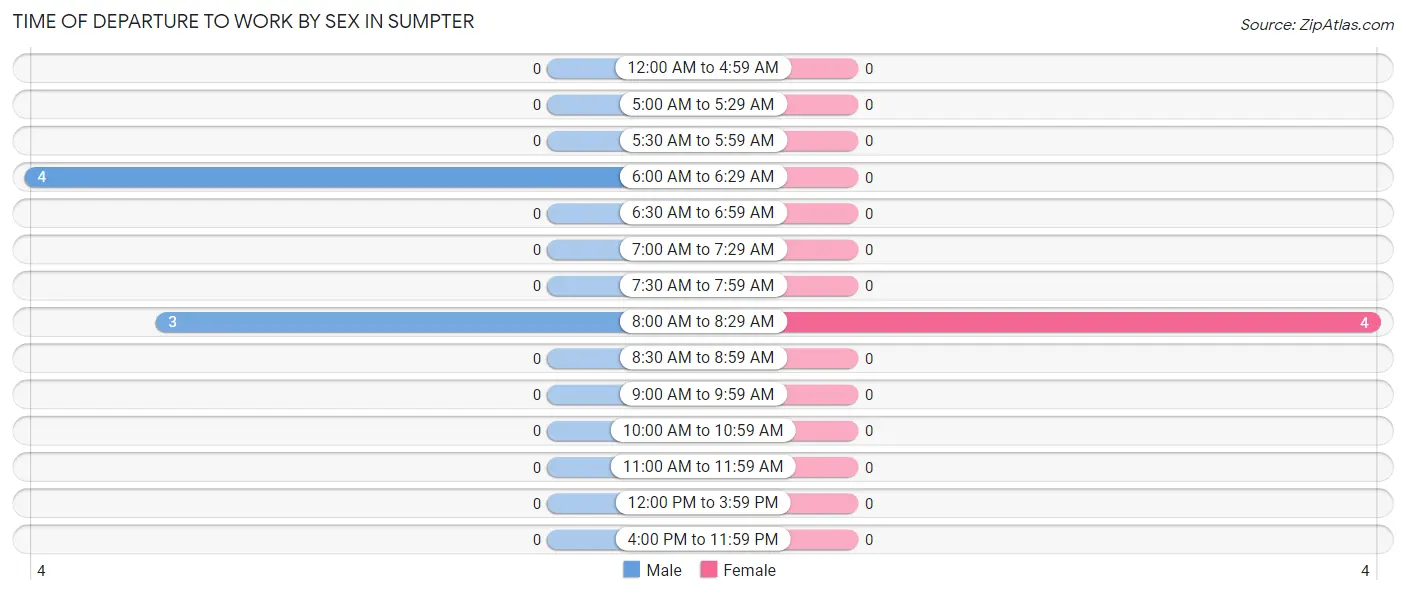
| Time of Departure | Male | Female |
| 12:00 AM to 4:59 AM | 0 (0.0%) | 0 (0.0%) |
| 5:00 AM to 5:29 AM | 0 (0.0%) | 0 (0.0%) |
| 5:30 AM to 5:59 AM | 0 (0.0%) | 0 (0.0%) |
| 6:00 AM to 6:29 AM | 4 (57.1%) | 0 (0.0%) |
| 6:30 AM to 6:59 AM | 0 (0.0%) | 0 (0.0%) |
| 7:00 AM to 7:29 AM | 0 (0.0%) | 0 (0.0%) |
| 7:30 AM to 7:59 AM | 0 (0.0%) | 0 (0.0%) |
| 8:00 AM to 8:29 AM | 3 (42.9%) | 4 (100.0%) |
| 8:30 AM to 8:59 AM | 0 (0.0%) | 0 (0.0%) |
| 9:00 AM to 9:59 AM | 0 (0.0%) | 0 (0.0%) |
| 10:00 AM to 10:59 AM | 0 (0.0%) | 0 (0.0%) |
| 11:00 AM to 11:59 AM | 0 (0.0%) | 0 (0.0%) |
| 12:00 PM to 3:59 PM | 0 (0.0%) | 0 (0.0%) |
| 4:00 PM to 11:59 PM | 0 (0.0%) | 0 (0.0%) |
| Total | 7 (100.0%) | 4 (100.0%) |
Housing Occupancy in Sumpter
Occupancy by Ownership in Sumpter
Of the total 112 dwellings in Sumpter, owner-occupied units account for 104 (92.9%), while renter-occupied units make up 8 (7.1%).
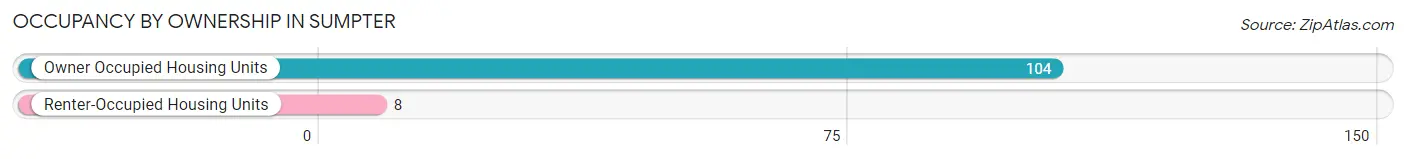
| Occupancy | # Housing Units | % Housing Units |
| Owner Occupied Housing Units | 104 | 92.9% |
| Renter-Occupied Housing Units | 8 | 7.1% |
| Total Occupied Housing Units | 112 | 100.0% |
Occupancy by Household Size in Sumpter
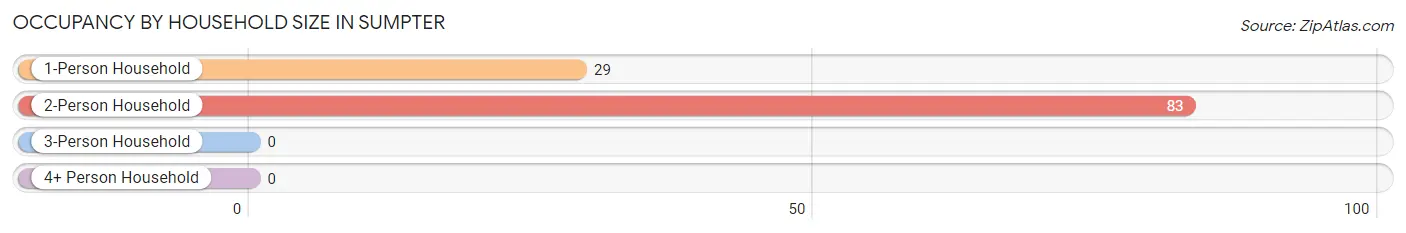
| Household Size | # Housing Units | % Housing Units |
| 1-Person Household | 29 | 25.9% |
| 2-Person Household | 83 | 74.1% |
| 3-Person Household | 0 | 0.0% |
| 4+ Person Household | 0 | 0.0% |
| Total Housing Units | 112 | 100.0% |
Occupancy by Ownership by Household Size in Sumpter
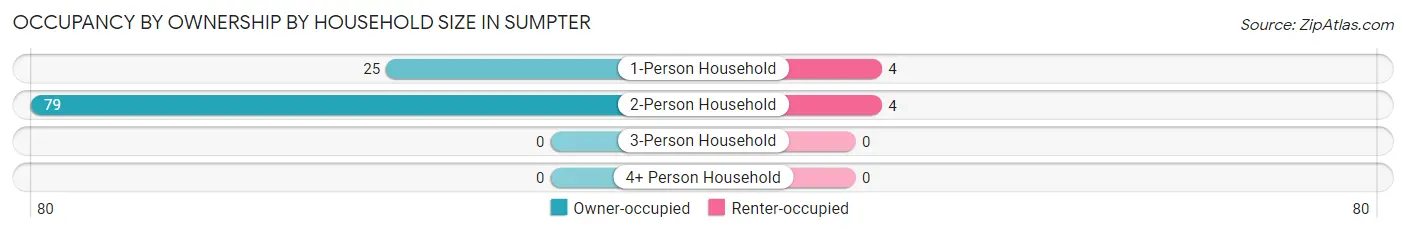
| Household Size | Owner-occupied | Renter-occupied |
| 1-Person Household | 25 (86.2%) | 4 (13.8%) |
| 2-Person Household | 79 (95.2%) | 4 (4.8%) |
| 3-Person Household | 0 (0.0%) | 0 (0.0%) |
| 4+ Person Household | 0 (0.0%) | 0 (0.0%) |
| Total Housing Units | 104 (92.9%) | 8 (7.1%) |
Occupancy by Educational Attainment in Sumpter
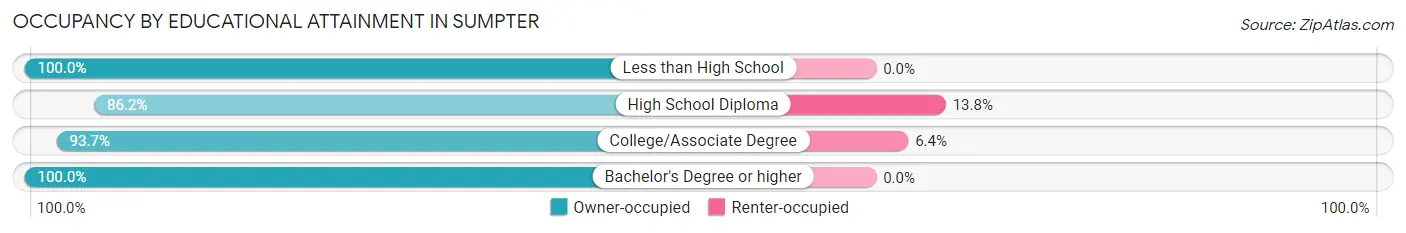
| Household Size | Owner-occupied | Renter-occupied |
| Less than High School | 9 (100.0%) | 0 (0.0%) |
| High School Diploma | 25 (86.2%) | 4 (13.8%) |
| College/Associate Degree | 59 (93.6%) | 4 (6.4%) |
| Bachelor's Degree or higher | 11 (100.0%) | 0 (0.0%) |
Occupancy by Age of Householder in Sumpter
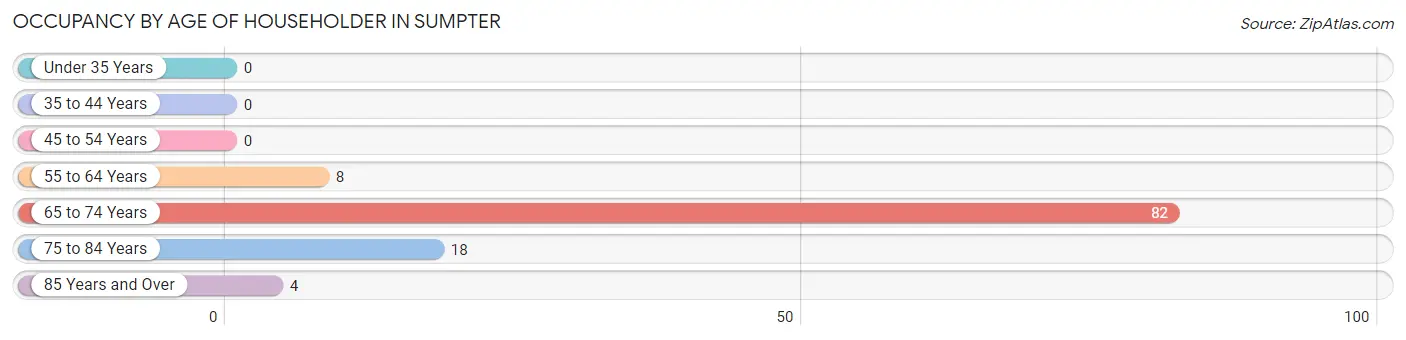
| Age Bracket | # Households | % Households |
| Under 35 Years | 0 | 0.0% |
| 35 to 44 Years | 0 | 0.0% |
| 45 to 54 Years | 0 | 0.0% |
| 55 to 64 Years | 8 | 7.1% |
| 65 to 74 Years | 82 | 73.2% |
| 75 to 84 Years | 18 | 16.1% |
| 85 Years and Over | 4 | 3.6% |
| Total | 112 | 100.0% |
Housing Finances in Sumpter
Median Income by Occupancy in Sumpter
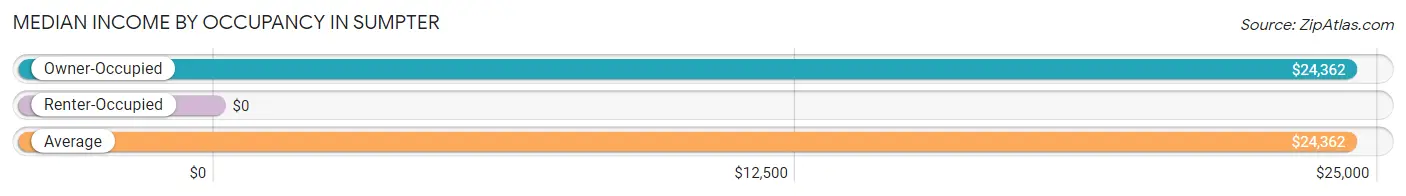
| Occupancy Type | # Households | Median Income |
| Owner-Occupied | 104 (92.9%) | $24,362 |
| Renter-Occupied | 8 (7.1%) | $0 |
| Average | 112 (100.0%) | $24,362 |
Occupancy by Householder Income Bracket in Sumpter
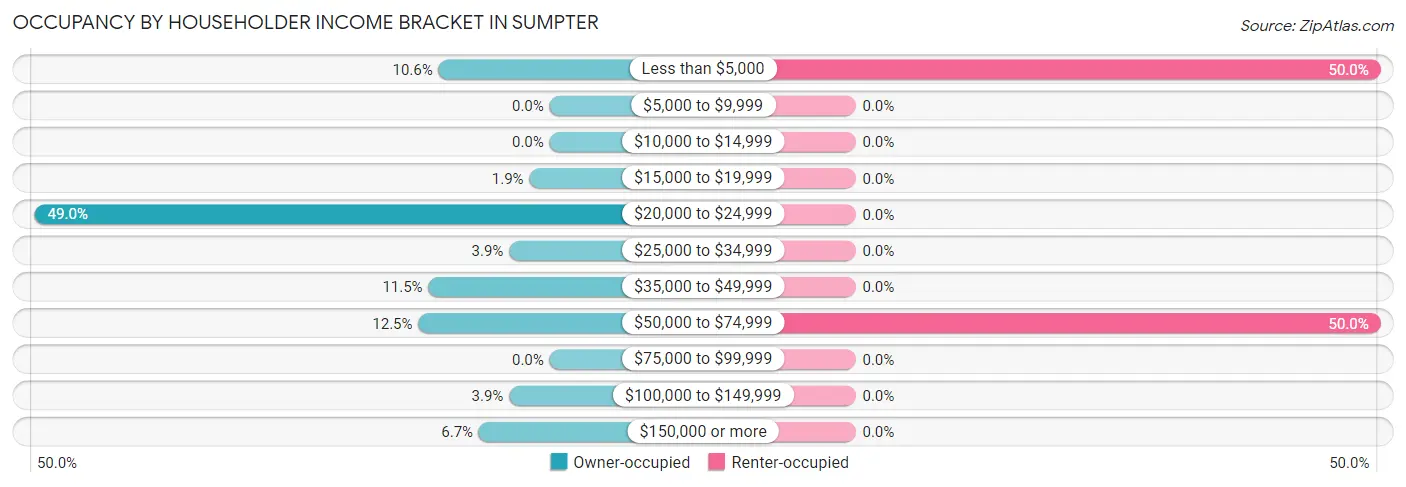
| Income Bracket | Owner-occupied | Renter-occupied |
| Less than $5,000 | 11 (10.6%) | 4 (50.0%) |
| $5,000 to $9,999 | 0 (0.0%) | 0 (0.0%) |
| $10,000 to $14,999 | 0 (0.0%) | 0 (0.0%) |
| $15,000 to $19,999 | 2 (1.9%) | 0 (0.0%) |
| $20,000 to $24,999 | 51 (49.0%) | 0 (0.0%) |
| $25,000 to $34,999 | 4 (3.8%) | 0 (0.0%) |
| $35,000 to $49,999 | 12 (11.5%) | 0 (0.0%) |
| $50,000 to $74,999 | 13 (12.5%) | 4 (50.0%) |
| $75,000 to $99,999 | 0 (0.0%) | 0 (0.0%) |
| $100,000 to $149,999 | 4 (3.8%) | 0 (0.0%) |
| $150,000 or more | 7 (6.7%) | 0 (0.0%) |
| Total | 104 (100.0%) | 8 (100.0%) |
Monthly Housing Cost Tiers in Sumpter
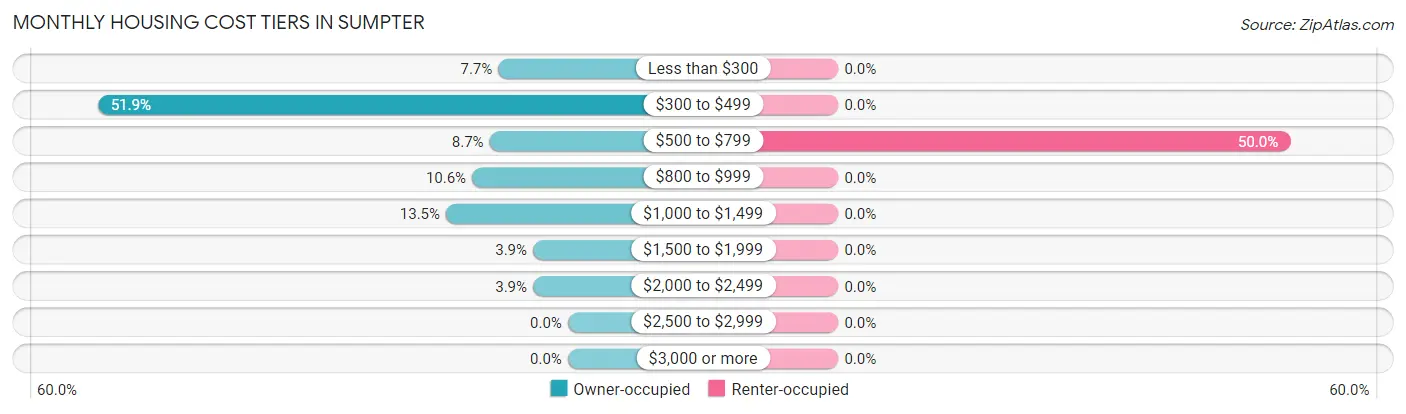
| Monthly Cost | Owner-occupied | Renter-occupied |
| Less than $300 | 8 (7.7%) | 0 (0.0%) |
| $300 to $499 | 54 (51.9%) | 0 (0.0%) |
| $500 to $799 | 9 (8.6%) | 4 (50.0%) |
| $800 to $999 | 11 (10.6%) | 0 (0.0%) |
| $1,000 to $1,499 | 14 (13.5%) | 0 (0.0%) |
| $1,500 to $1,999 | 4 (3.8%) | 0 (0.0%) |
| $2,000 to $2,499 | 4 (3.8%) | 0 (0.0%) |
| $2,500 to $2,999 | 0 (0.0%) | 0 (0.0%) |
| $3,000 or more | 0 (0.0%) | 0 (0.0%) |
| Total | 104 (100.0%) | 8 (100.0%) |
Physical Housing Characteristics in Sumpter
Housing Structures in Sumpter
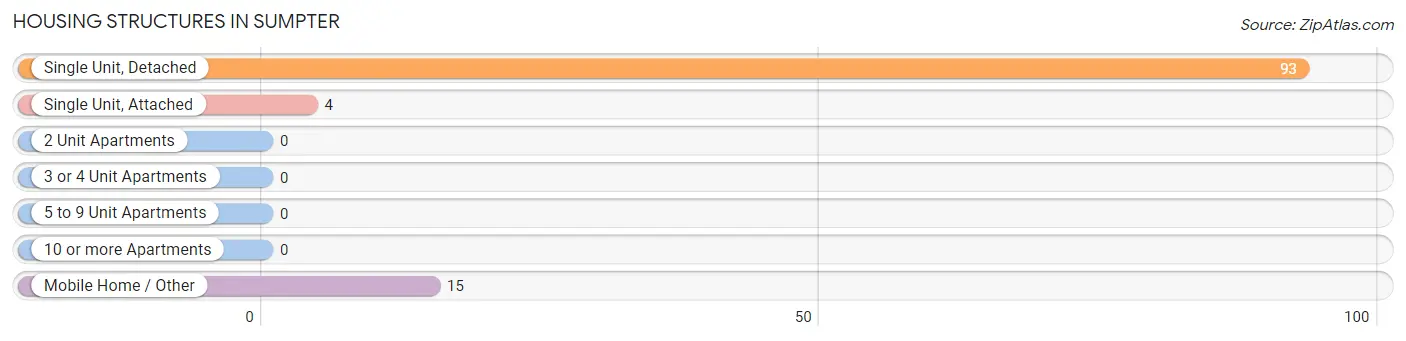
| Structure Type | # Housing Units | % Housing Units |
| Single Unit, Detached | 93 | 83.0% |
| Single Unit, Attached | 4 | 3.6% |
| 2 Unit Apartments | 0 | 0.0% |
| 3 or 4 Unit Apartments | 0 | 0.0% |
| 5 to 9 Unit Apartments | 0 | 0.0% |
| 10 or more Apartments | 0 | 0.0% |
| Mobile Home / Other | 15 | 13.4% |
| Total | 112 | 100.0% |
Housing Structures by Occupancy in Sumpter
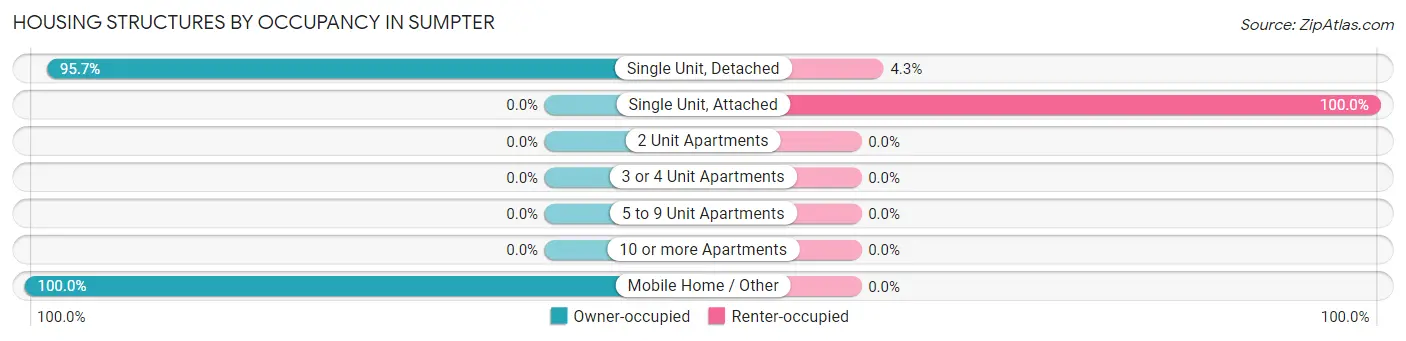
| Structure Type | Owner-occupied | Renter-occupied |
| Single Unit, Detached | 89 (95.7%) | 4 (4.3%) |
| Single Unit, Attached | 0 (0.0%) | 4 (100.0%) |
| 2 Unit Apartments | 0 (0.0%) | 0 (0.0%) |
| 3 or 4 Unit Apartments | 0 (0.0%) | 0 (0.0%) |
| 5 to 9 Unit Apartments | 0 (0.0%) | 0 (0.0%) |
| 10 or more Apartments | 0 (0.0%) | 0 (0.0%) |
| Mobile Home / Other | 15 (100.0%) | 0 (0.0%) |
| Total | 104 (92.9%) | 8 (7.1%) |
Housing Structures by Number of Rooms in Sumpter
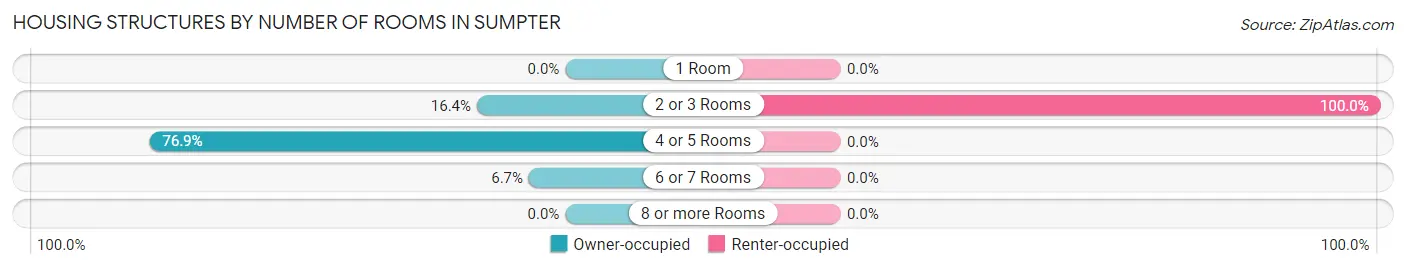
| Number of Rooms | Owner-occupied | Renter-occupied |
| 1 Room | 0 (0.0%) | 0 (0.0%) |
| 2 or 3 Rooms | 17 (16.4%) | 8 (100.0%) |
| 4 or 5 Rooms | 80 (76.9%) | 0 (0.0%) |
| 6 or 7 Rooms | 7 (6.7%) | 0 (0.0%) |
| 8 or more Rooms | 0 (0.0%) | 0 (0.0%) |
| Total | 104 (100.0%) | 8 (100.0%) |
Housing Structure by Heating Type in Sumpter
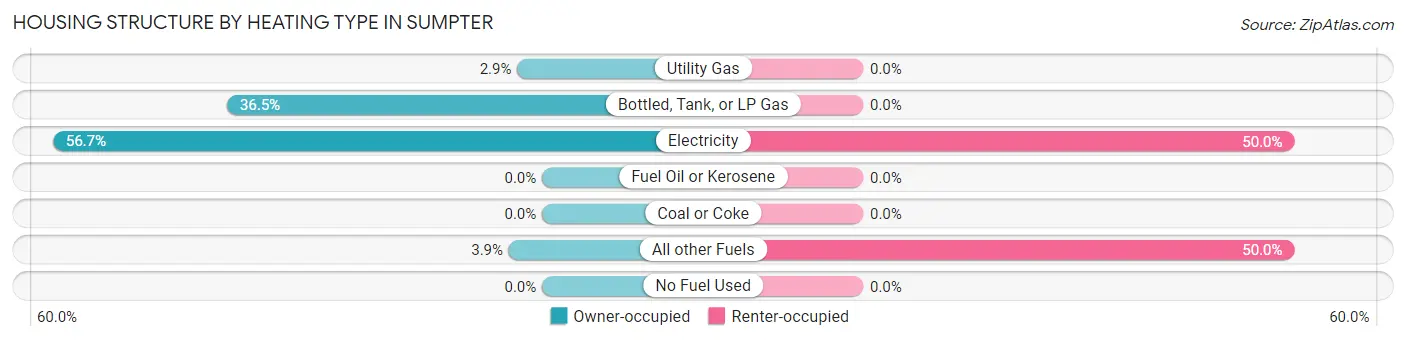
| Heating Type | Owner-occupied | Renter-occupied |
| Utility Gas | 3 (2.9%) | 0 (0.0%) |
| Bottled, Tank, or LP Gas | 38 (36.5%) | 0 (0.0%) |
| Electricity | 59 (56.7%) | 4 (50.0%) |
| Fuel Oil or Kerosene | 0 (0.0%) | 0 (0.0%) |
| Coal or Coke | 0 (0.0%) | 0 (0.0%) |
| All other Fuels | 4 (3.8%) | 4 (50.0%) |
| No Fuel Used | 0 (0.0%) | 0 (0.0%) |
| Total | 104 (100.0%) | 8 (100.0%) |
Household Vehicle Usage in Sumpter
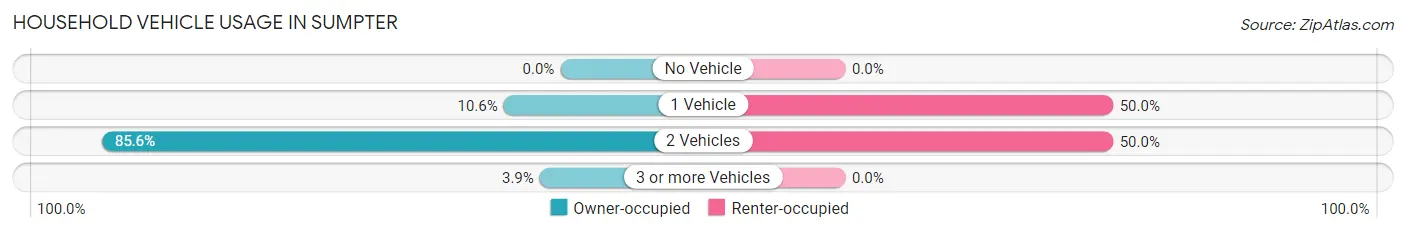
| Vehicles per Household | Owner-occupied | Renter-occupied |
| No Vehicle | 0 (0.0%) | 0 (0.0%) |
| 1 Vehicle | 11 (10.6%) | 4 (50.0%) |
| 2 Vehicles | 89 (85.6%) | 4 (50.0%) |
| 3 or more Vehicles | 4 (3.8%) | 0 (0.0%) |
| Total | 104 (100.0%) | 8 (100.0%) |
Real Estate & Mortgages in Sumpter
Real Estate and Mortgage Overview in Sumpter
| Characteristic | Without Mortgage | With Mortgage |
| Housing Units | 76 | 28 |
| Median Property Value | - | - |
| Median Household Income | $23,936 | $0 |
| Monthly Housing Costs | $452 | $0 |
| Real Estate Taxes | $1,319 | $0 |
Property Value by Mortgage Status in Sumpter
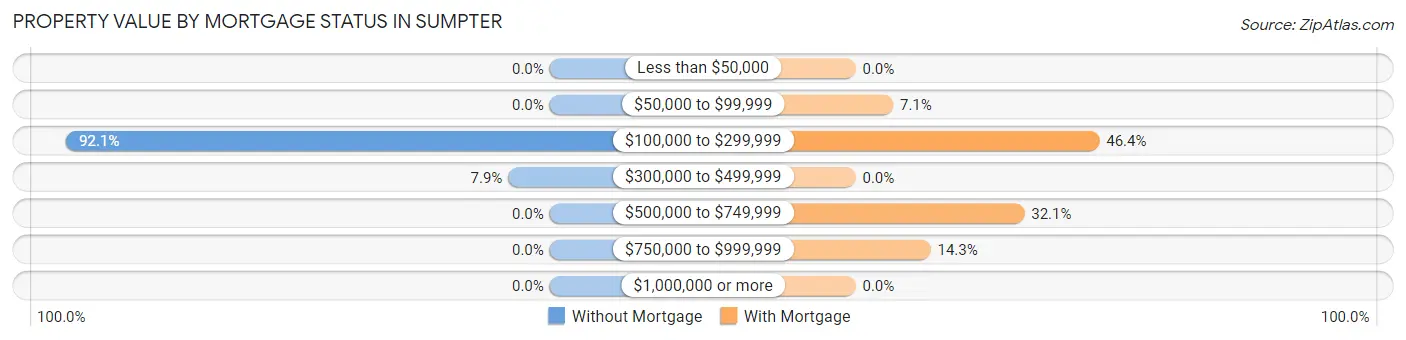
| Property Value | Without Mortgage | With Mortgage |
| Less than $50,000 | 0 (0.0%) | 0 (0.0%) |
| $50,000 to $99,999 | 0 (0.0%) | 2 (7.1%) |
| $100,000 to $299,999 | 70 (92.1%) | 13 (46.4%) |
| $300,000 to $499,999 | 6 (7.9%) | 0 (0.0%) |
| $500,000 to $749,999 | 0 (0.0%) | 9 (32.1%) |
| $750,000 to $999,999 | 0 (0.0%) | 4 (14.3%) |
| $1,000,000 or more | 0 (0.0%) | 0 (0.0%) |
| Total | 76 (100.0%) | 28 (100.0%) |
Household Income by Mortgage Status in Sumpter
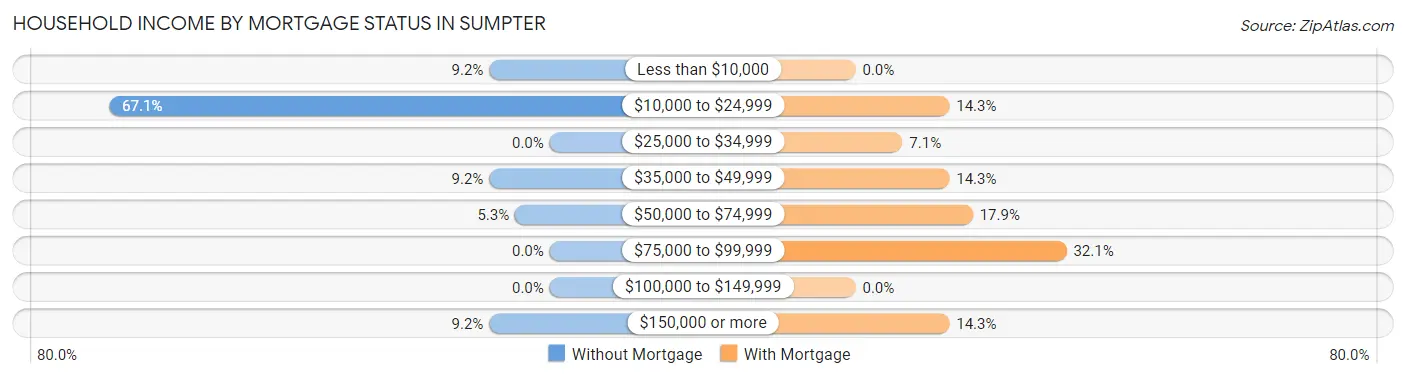
| Household Income | Without Mortgage | With Mortgage |
| Less than $10,000 | 7 (9.2%) | 0 (0.0%) |
| $10,000 to $24,999 | 51 (67.1%) | 4 (14.3%) |
| $25,000 to $34,999 | 0 (0.0%) | 2 (7.1%) |
| $35,000 to $49,999 | 7 (9.2%) | 4 (14.3%) |
| $50,000 to $74,999 | 4 (5.3%) | 5 (17.9%) |
| $75,000 to $99,999 | 0 (0.0%) | 9 (32.1%) |
| $100,000 to $149,999 | 0 (0.0%) | 0 (0.0%) |
| $150,000 or more | 7 (9.2%) | 4 (14.3%) |
| Total | 76 (100.0%) | 28 (100.0%) |
Property Value to Household Income Ratio in Sumpter
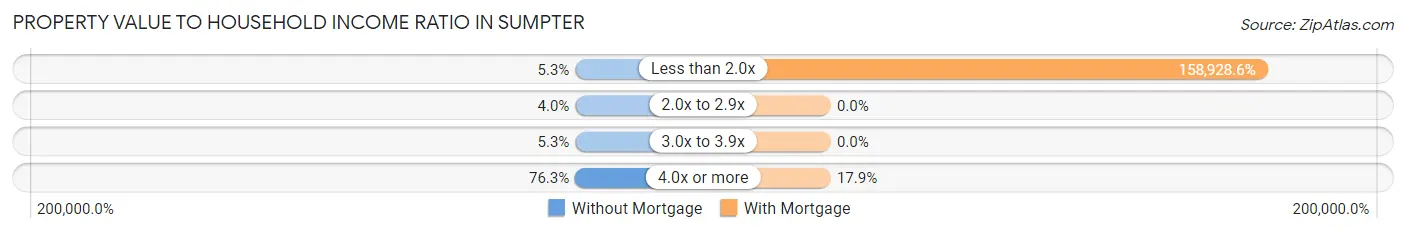
| Value-to-Income Ratio | Without Mortgage | With Mortgage |
| Less than 2.0x | 4 (5.3%) | 44,500 (158,928.6%) |
| 2.0x to 2.9x | 3 (4.0%) | 0 (0.0%) |
| 3.0x to 3.9x | 4 (5.3%) | 0 (0.0%) |
| 4.0x or more | 58 (76.3%) | 5 (17.9%) |
| Total | 76 (100.0%) | 28 (100.0%) |
Real Estate Taxes by Mortgage Status in Sumpter
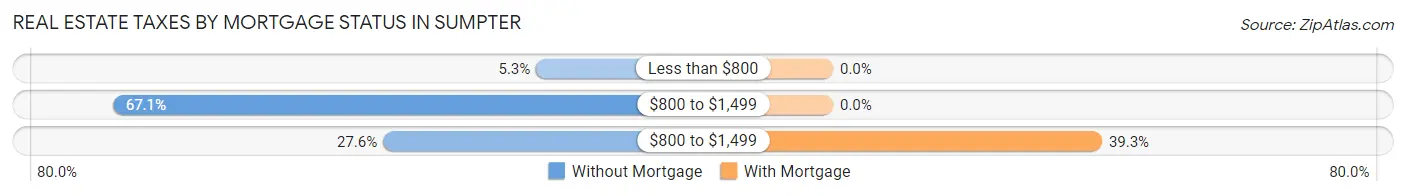
| Property Taxes | Without Mortgage | With Mortgage |
| Less than $800 | 4 (5.3%) | 0 (0.0%) |
| $800 to $1,499 | 51 (67.1%) | 0 (0.0%) |
| $800 to $1,499 | 21 (27.6%) | 11 (39.3%) |
| Total | 76 (100.0%) | 28 (100.0%) |
Health & Disability in Sumpter
Health Insurance Coverage by Age in Sumpter
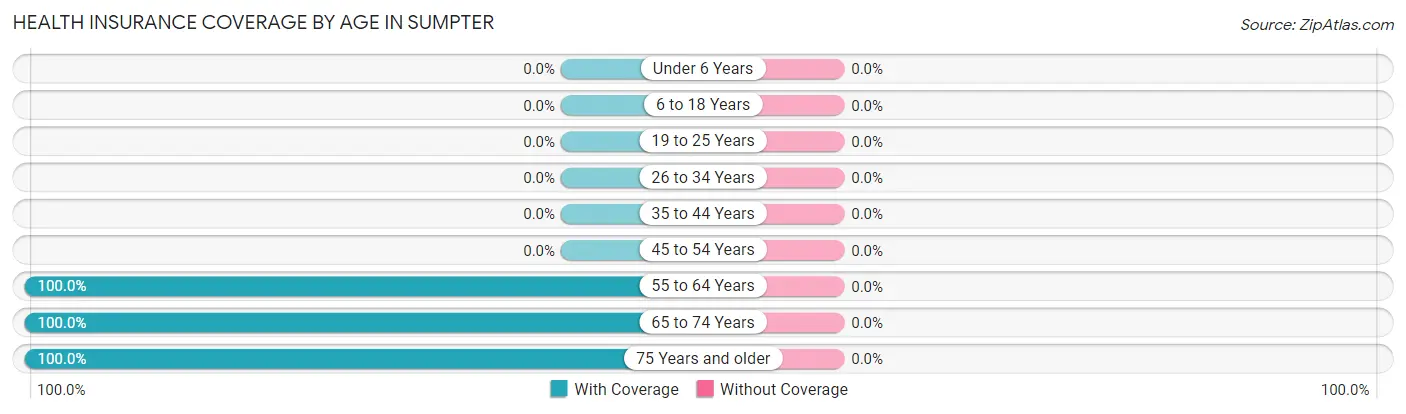
| Age Bracket | With Coverage | Without Coverage |
| Under 6 Years | 0 (0.0%) | 0 (0.0%) |
| 6 to 18 Years | 0 (0.0%) | 0 (0.0%) |
| 19 to 25 Years | 0 (0.0%) | 0 (0.0%) |
| 26 to 34 Years | 0 (0.0%) | 0 (0.0%) |
| 35 to 44 Years | 0 (0.0%) | 0 (0.0%) |
| 45 to 54 Years | 0 (0.0%) | 0 (0.0%) |
| 55 to 64 Years | 27 (100.0%) | 0 (0.0%) |
| 65 to 74 Years | 142 (100.0%) | 0 (0.0%) |
| 75 Years and older | 37 (100.0%) | 0 (0.0%) |
| Total | 206 (100.0%) | 0 (0.0%) |
Health Insurance Coverage by Citizenship Status in Sumpter
| Citizenship Status | With Coverage | Without Coverage |
| Native Born | 0 (0.0%) | 0 (0.0%) |
| Foreign Born, Citizen | 0 (0.0%) | 0 (0.0%) |
| Foreign Born, not a Citizen | 0 (0.0%) | 0 (0.0%) |
Health Insurance Coverage by Household Income in Sumpter
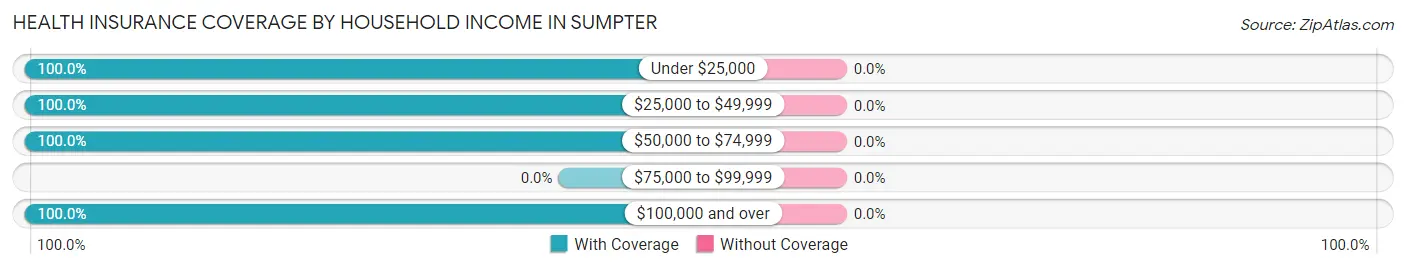
| Household Income | With Coverage | Without Coverage |
| Under $25,000 | 116 (100.0%) | 0 (0.0%) |
| $25,000 to $49,999 | 31 (100.0%) | 0 (0.0%) |
| $50,000 to $74,999 | 37 (100.0%) | 0 (0.0%) |
| $75,000 to $99,999 | 0 (0.0%) | 0 (0.0%) |
| $100,000 and over | 22 (100.0%) | 0 (0.0%) |
Public vs Private Health Insurance Coverage by Age in Sumpter
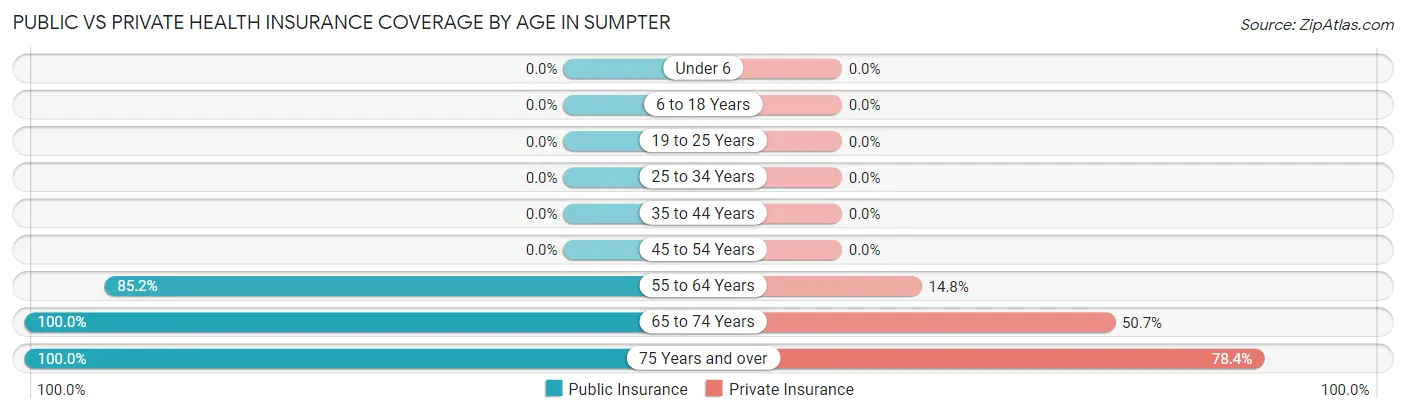
| Age Bracket | Public Insurance | Private Insurance |
| Under 6 | 0 (0.0%) | 0 (0.0%) |
| 6 to 18 Years | 0 (0.0%) | 0 (0.0%) |
| 19 to 25 Years | 0 (0.0%) | 0 (0.0%) |
| 25 to 34 Years | 0 (0.0%) | 0 (0.0%) |
| 35 to 44 Years | 0 (0.0%) | 0 (0.0%) |
| 45 to 54 Years | 0 (0.0%) | 0 (0.0%) |
| 55 to 64 Years | 23 (85.2%) | 4 (14.8%) |
| 65 to 74 Years | 142 (100.0%) | 72 (50.7%) |
| 75 Years and over | 37 (100.0%) | 29 (78.4%) |
| Total | 202 (98.1%) | 105 (51.0%) |
Disability Status by Sex by Age in Sumpter
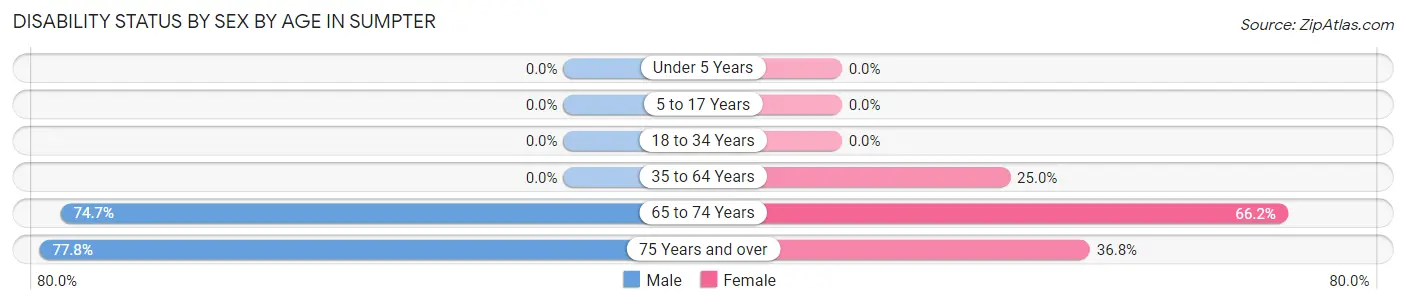
| Age Bracket | Male | Female |
| Under 5 Years | 0 (0.0%) | 0 (0.0%) |
| 5 to 17 Years | 0 (0.0%) | 0 (0.0%) |
| 18 to 34 Years | 0 (0.0%) | 0 (0.0%) |
| 35 to 64 Years | 0 (0.0%) | 4 (25.0%) |
| 65 to 74 Years | 53 (74.7%) | 47 (66.2%) |
| 75 Years and over | 14 (77.8%) | 7 (36.8%) |
Disability Class by Sex by Age in Sumpter
Disability Class: Hearing Difficulty
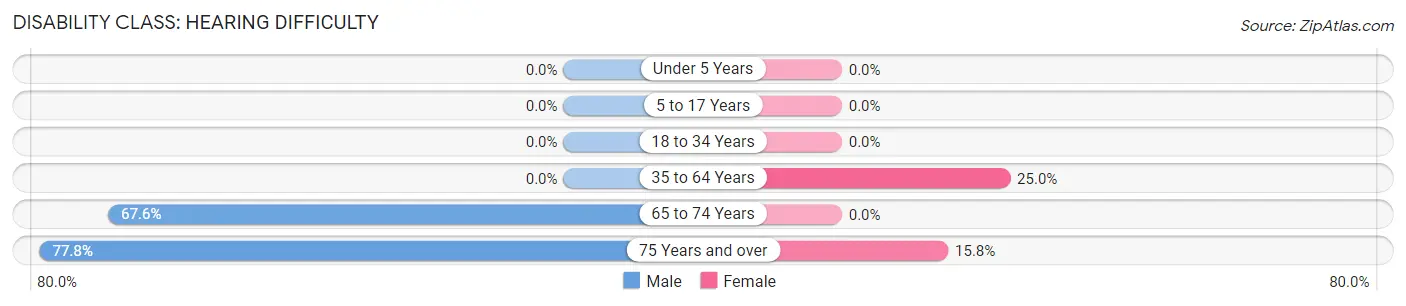
| Age Bracket | Male | Female |
| Under 5 Years | 0 (0.0%) | 0 (0.0%) |
| 5 to 17 Years | 0 (0.0%) | 0 (0.0%) |
| 18 to 34 Years | 0 (0.0%) | 0 (0.0%) |
| 35 to 64 Years | 0 (0.0%) | 4 (25.0%) |
| 65 to 74 Years | 48 (67.6%) | 0 (0.0%) |
| 75 Years and over | 14 (77.8%) | 3 (15.8%) |
Disability Class: Vision Difficulty
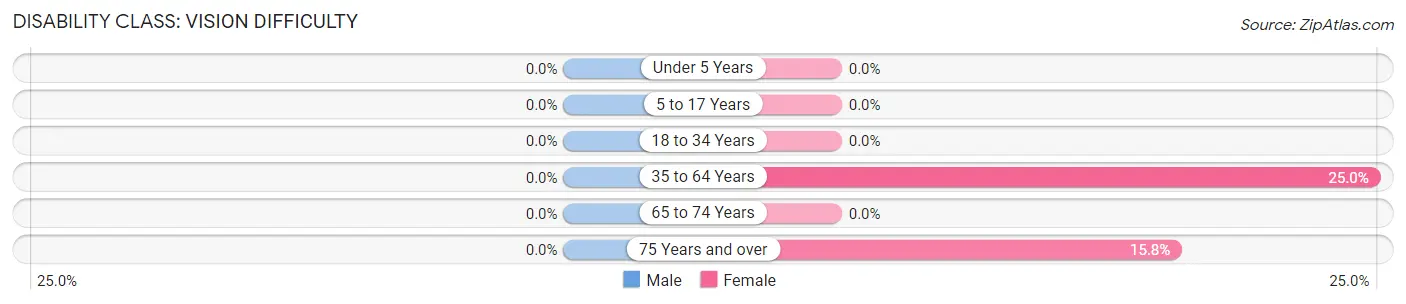
| Age Bracket | Male | Female |
| Under 5 Years | 0 (0.0%) | 0 (0.0%) |
| 5 to 17 Years | 0 (0.0%) | 0 (0.0%) |
| 18 to 34 Years | 0 (0.0%) | 0 (0.0%) |
| 35 to 64 Years | 0 (0.0%) | 4 (25.0%) |
| 65 to 74 Years | 0 (0.0%) | 0 (0.0%) |
| 75 Years and over | 0 (0.0%) | 3 (15.8%) |
Disability Class: Cognitive Difficulty
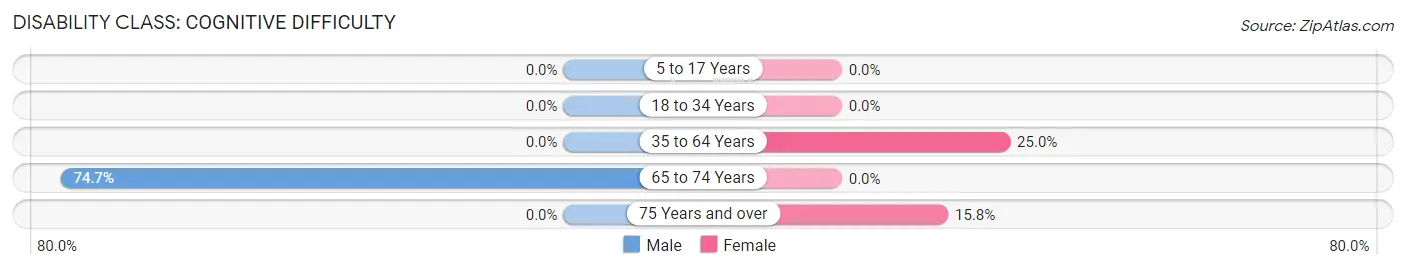
| Age Bracket | Male | Female |
| 5 to 17 Years | 0 (0.0%) | 0 (0.0%) |
| 18 to 34 Years | 0 (0.0%) | 0 (0.0%) |
| 35 to 64 Years | 0 (0.0%) | 4 (25.0%) |
| 65 to 74 Years | 53 (74.7%) | 0 (0.0%) |
| 75 Years and over | 0 (0.0%) | 3 (15.8%) |
Disability Class: Ambulatory Difficulty
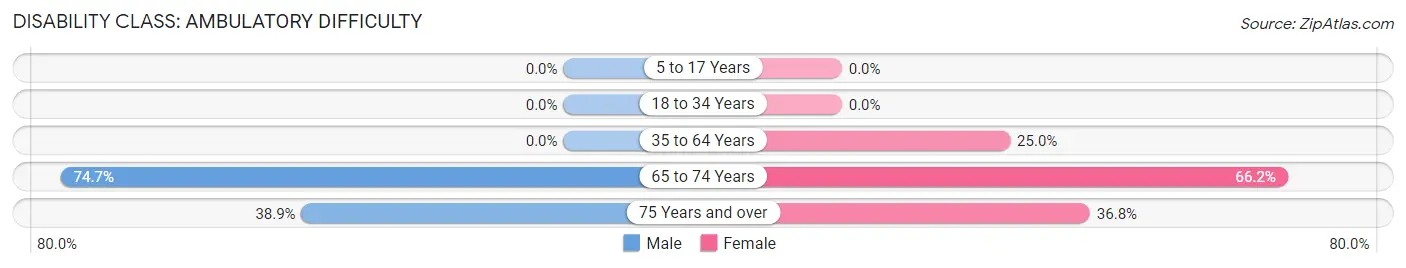
| Age Bracket | Male | Female |
| 5 to 17 Years | 0 (0.0%) | 0 (0.0%) |
| 18 to 34 Years | 0 (0.0%) | 0 (0.0%) |
| 35 to 64 Years | 0 (0.0%) | 4 (25.0%) |
| 65 to 74 Years | 53 (74.7%) | 47 (66.2%) |
| 75 Years and over | 7 (38.9%) | 7 (36.8%) |
Disability Class: Self-Care Difficulty
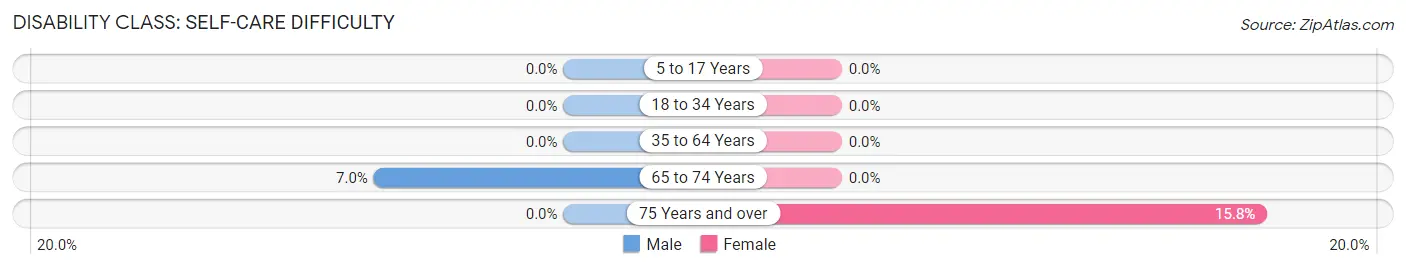
| Age Bracket | Male | Female |
| 5 to 17 Years | 0 (0.0%) | 0 (0.0%) |
| 18 to 34 Years | 0 (0.0%) | 0 (0.0%) |
| 35 to 64 Years | 0 (0.0%) | 0 (0.0%) |
| 65 to 74 Years | 5 (7.0%) | 0 (0.0%) |
| 75 Years and over | 0 (0.0%) | 3 (15.8%) |
Technology Access in Sumpter
Computing Device Access in Sumpter
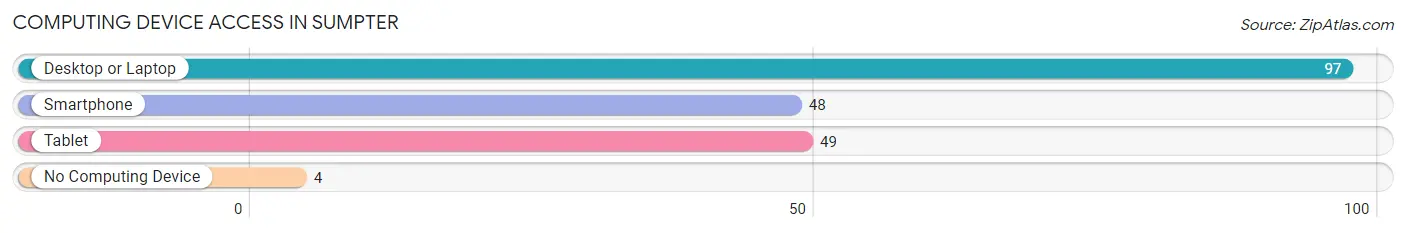
| Device Type | # Households | % Households |
| Desktop or Laptop | 97 | 86.6% |
| Smartphone | 48 | 42.9% |
| Tablet | 49 | 43.8% |
| No Computing Device | 4 | 3.6% |
| Total | 112 | 100.0% |
Internet Access in Sumpter
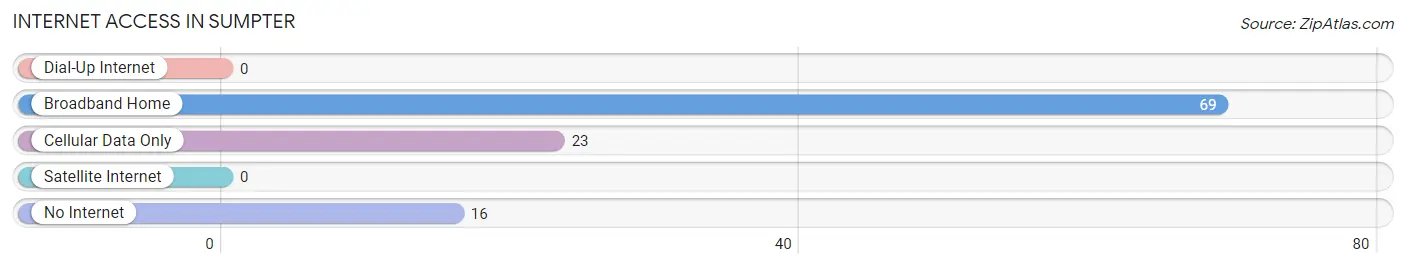
| Internet Type | # Households | % Households |
| Dial-Up Internet | 0 | 0.0% |
| Broadband Home | 69 | 61.6% |
| Cellular Data Only | 23 | 20.5% |
| Satellite Internet | 0 | 0.0% |
| No Internet | 16 | 14.3% |
| Total | 112 | 100.0% |
Sumpter Summary
Sumpter, Oregon is a small town located in the Blue Mountains of Eastern Oregon. It is situated in the Powder River Valley, at an elevation of 4,000 feet. The town was founded in 1862 and is the oldest incorporated town in Baker County. It is located about 30 miles east of Baker City and is home to about 400 people.
History
Sumpter was founded in 1862 by a group of miners who were searching for gold in the area. The town was named after the nearby Sumpter Valley Railroad, which was built in 1875 to transport ore from the mines to the railhead in Baker City. The town quickly grew and by the late 1800s, it was a bustling mining town with a population of over 1,000 people.
The town was home to several gold mines, including the Sumpter Valley Gold Mine, which was the largest gold mine in the state. The mine operated until the early 1900s, when it was closed due to a lack of ore. The town also had a number of other businesses, including a sawmill, a flour mill, a brewery, and a hotel.
In the early 1900s, the town began to decline as the gold mines closed and the population dwindled. In the 1950s, the town was revitalized when the Sumpter Valley Railroad was restored and began to transport tourists to the area. The town has since become a popular tourist destination, with many visitors coming to ride the historic railroad and explore the area’s history.
Geography
Sumpter is located in the Blue Mountains of Eastern Oregon. The town is situated in the Powder River Valley, at an elevation of 4,000 feet. The town is surrounded by the Elkhorn Mountains to the north, the Wallowa Mountains to the east, and the Strawberry Mountains to the south. The town is located about 30 miles east of Baker City.
The climate in Sumpter is semi-arid, with hot summers and cold winters. The average annual temperature is around 50 degrees Fahrenheit. The area receives an average of 12 inches of precipitation per year, with most of it falling in the form of snow in the winter months.
Economy
The economy of Sumpter is largely based on tourism. The town is home to the Sumpter Valley Railroad, which is a popular tourist attraction. The railroad offers scenic rides through the area and is a popular destination for visitors.
The town also has a number of other businesses, including restaurants, shops, and lodging. The town is also home to a number of small farms and ranches, which produce hay, cattle, and other agricultural products.
Demographics
As of the 2010 census, the population of Sumpter was 400 people. The town is predominantly white, with about 95% of the population being white. The median household income is around $35,000, and the median age is around 45 years old. The town has a low unemployment rate, with only about 4% of the population being unemployed.
Common Questions
What is Per Capita Income in Sumpter?
Per Capita income in Sumpter is $25,333.
What is the Median Household income in Sumpter?
Median Household Income in Sumpter is $24,362.
What is Inequality or Gini Index in Sumpter?
Inequality or Gini Index in Sumpter is 0.53.
What is the Total Population of Sumpter?
Total Population of Sumpter is 206.
What is the Total Male Population of Sumpter?
Total Male Population of Sumpter is 100.
What is the Total Female Population of Sumpter?
Total Female Population of Sumpter is 106.
What is the Ratio of Males per 100 Females in Sumpter?
There are 94.34 Males per 100 Females in Sumpter.
What is the Ratio of Females per 100 Males in Sumpter?
There are 106.00 Females per 100 Males in Sumpter.
What is the Median Population Age in Sumpter?
Median Population Age in Sumpter is 70.3 Years.
What is the Average Family Size in Sumpter
Average Family Size in Sumpter is 2.1 People.
What is the Average Household Size in Sumpter
Average Household Size in Sumpter is 1.8 People.
How Large is the Labor Force in Sumpter?
There are 15 People in the Labor Forcein in Sumpter.
What is the Percentage of People in the Labor Force in Sumpter?
7.3% of People are in the Labor Force in Sumpter.
What is the Unemployment Rate in Sumpter?
Unemployment Rate in Sumpter is 26.7%.