Scio, OR Map & Demographics
Scio Map
Scio Overview
$33,603
PER CAPITA INCOME
$77,292
AVG FAMILY INCOME
$75,625
AVG HOUSEHOLD INCOME
20.4%
WAGE / INCOME GAP [ % ]
79.6¢/ $1
WAGE / INCOME GAP [ $ ]
0.35
INEQUALITY / GINI INDEX
860
TOTAL POPULATION
455
MALE POPULATION
405
FEMALE POPULATION
112.35
MALES / 100 FEMALES
89.01
FEMALES / 100 MALES
40.7
MEDIAN AGE
3.0
AVG FAMILY SIZE
2.6
AVG HOUSEHOLD SIZE
409
LABOR FORCE [ PEOPLE ]
62.8%
PERCENT IN LABOR FORCE
6.8%
UNEMPLOYMENT RATE
Scio Zip Codes
Scio Area Codes
Income in Scio
Income Overview in Scio
Per Capita Income in Scio is $33,603, while median incomes of families and households are $77,292 and $75,625 respectively.
| Characteristic | Number | Measure |
| Per Capita Income | 860 | $33,603 |
| Median Family Income | 251 | $77,292 |
| Mean Family Income | 251 | $87,655 |
| Median Household Income | 331 | $75,625 |
| Mean Household Income | 331 | $85,717 |
| Income Deficit | 251 | $0 |
| Wage / Income Gap (%) | 860 | 20.39% |
| Wage / Income Gap ($) | 860 | 79.61¢ per $1 |
| Gini / Inequality Index | 860 | 0.35 |
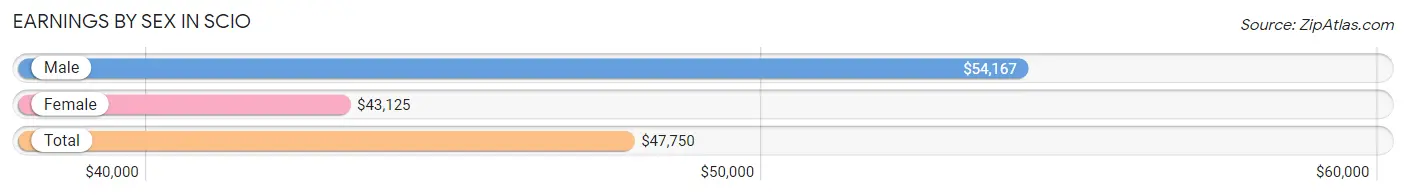
Earnings by Sex in Scio
Average Earnings in Scio are $47,750, $54,167 for men and $43,125 for women, a difference of 20.4%.
| Sex | Number | Average Earnings |
| Male | 228 (55.7%) | $54,167 |
| Female | 181 (44.3%) | $43,125 |
| Total | 409 (100.0%) | $47,750 |
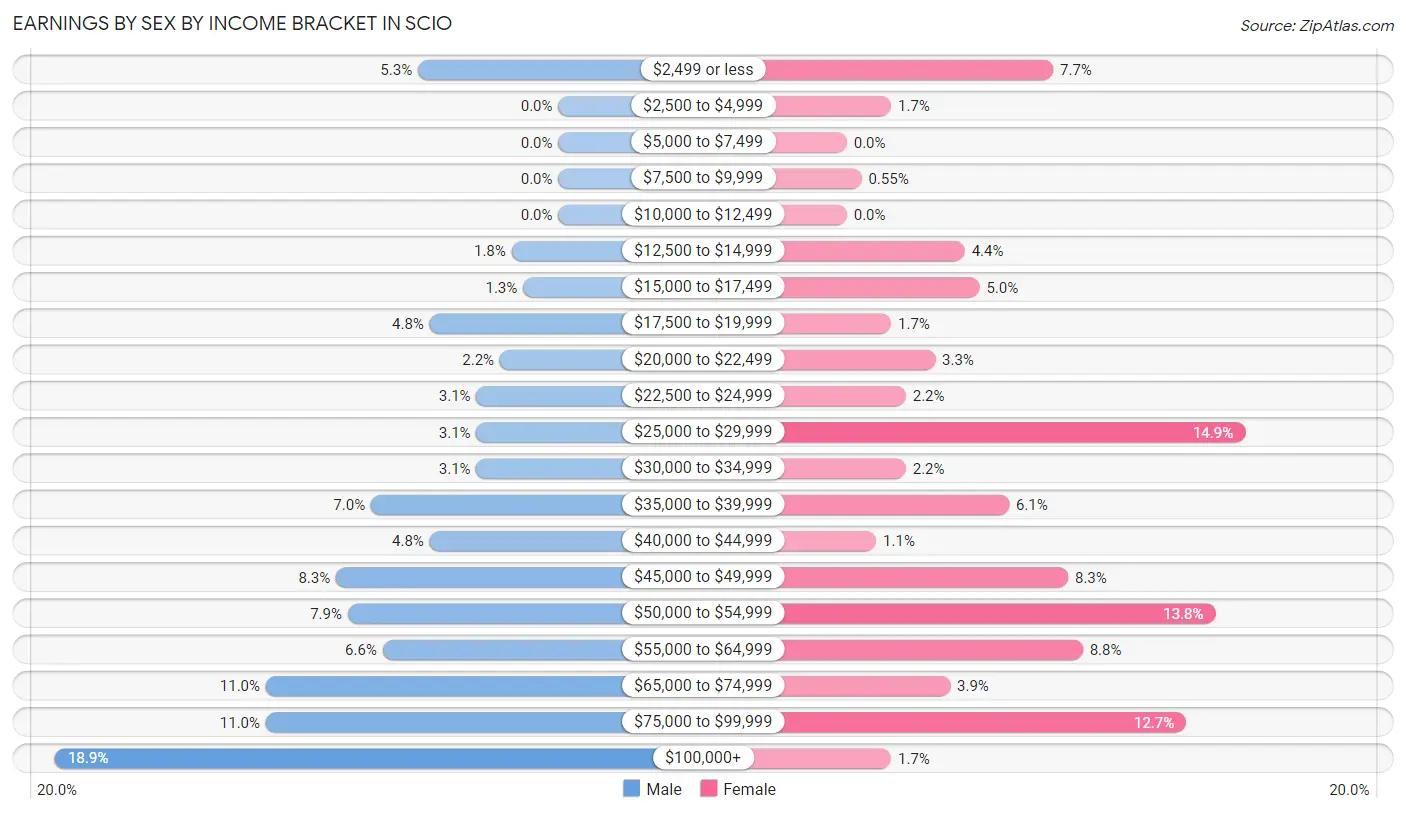
Earnings by Sex by Income Bracket in Scio
The most common earnings brackets in Scio are $100,000+ for men (43 | 18.9%) and $25,000 to $29,999 for women (27 | 14.9%).
| Income | Male | Female |
| $2,499 or less | 12 (5.3%) | 14 (7.7%) |
| $2,500 to $4,999 | 0 (0.0%) | 3 (1.7%) |
| $5,000 to $7,499 | 0 (0.0%) | 0 (0.0%) |
| $7,500 to $9,999 | 0 (0.0%) | 1 (0.5%) |
| $10,000 to $12,499 | 0 (0.0%) | 0 (0.0%) |
| $12,500 to $14,999 | 4 (1.8%) | 8 (4.4%) |
| $15,000 to $17,499 | 3 (1.3%) | 9 (5.0%) |
| $17,500 to $19,999 | 11 (4.8%) | 3 (1.7%) |
| $20,000 to $22,499 | 5 (2.2%) | 6 (3.3%) |
| $22,500 to $24,999 | 7 (3.1%) | 4 (2.2%) |
| $25,000 to $29,999 | 7 (3.1%) | 27 (14.9%) |
| $30,000 to $34,999 | 7 (3.1%) | 4 (2.2%) |
| $35,000 to $39,999 | 16 (7.0%) | 11 (6.1%) |
| $40,000 to $44,999 | 11 (4.8%) | 2 (1.1%) |
| $45,000 to $49,999 | 19 (8.3%) | 15 (8.3%) |
| $50,000 to $54,999 | 18 (7.9%) | 25 (13.8%) |
| $55,000 to $64,999 | 15 (6.6%) | 16 (8.8%) |
| $65,000 to $74,999 | 25 (11.0%) | 7 (3.9%) |
| $75,000 to $99,999 | 25 (11.0%) | 23 (12.7%) |
| $100,000+ | 43 (18.9%) | 3 (1.7%) |
| Total | 228 (100.0%) | 181 (100.0%) |
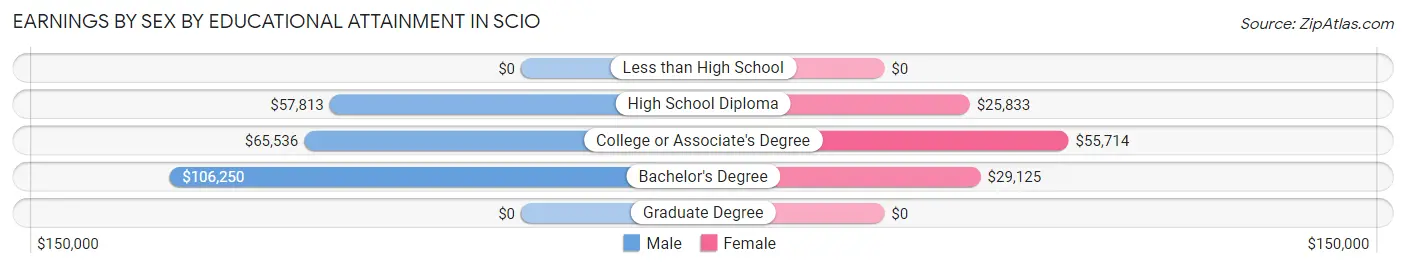
Earnings by Sex by Educational Attainment in Scio
Average earnings in Scio are $59,844 for men and $45,781 for women, a difference of 23.5%. Men with an educational attainment of bachelor's degree enjoy the highest average annual earnings of $106,250, while those with high school diploma education earn the least with $57,813. Women with an educational attainment of college or associate's degree earn the most with the average annual earnings of $55,714, while those with high school diploma education have the smallest earnings of $25,833.
| Educational Attainment | Male Income | Female Income |
| Less than High School | - | - |
| High School Diploma | $57,813 | $25,833 |
| College or Associate's Degree | $65,536 | $55,714 |
| Bachelor's Degree | $106,250 | $29,125 |
| Graduate Degree | - | - |
| Total | $59,844 | $45,781 |
Family Income in Scio
Family Income Brackets in Scio
According to the Scio family income data, there are 75 families falling into the $100,000 to $149,999 income range, which is the most common income bracket and makes up 29.9% of all families. Conversely, the less than $10,000 income bracket is the least frequent group with only 4 families (1.6%) belonging to this category.
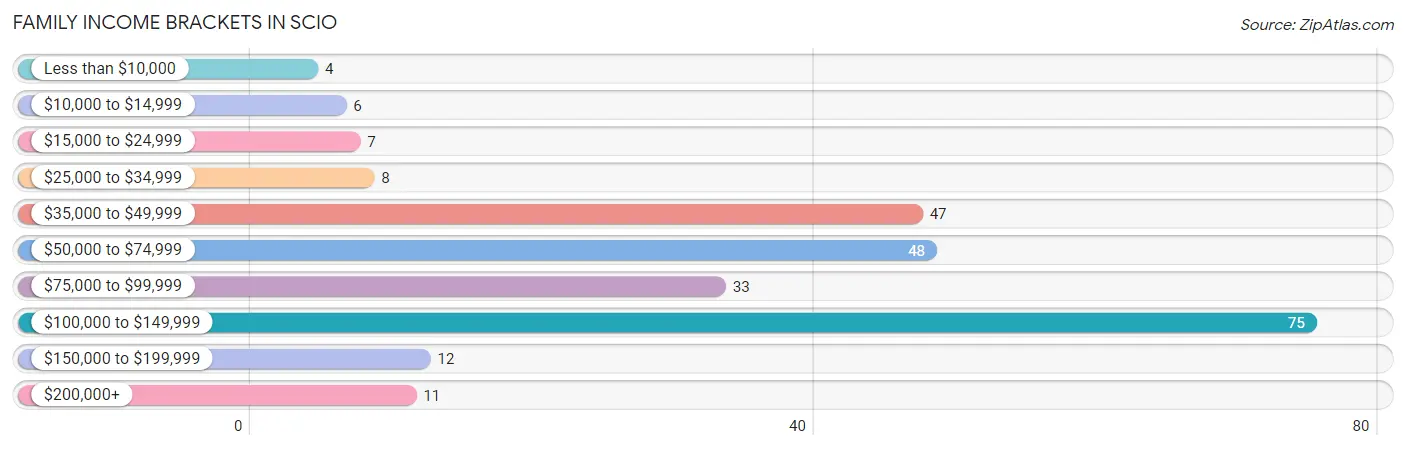
| Income Bracket | # Families | % Families |
| Less than $10,000 | 4 | 1.6% |
| $10,000 to $14,999 | 6 | 2.4% |
| $15,000 to $24,999 | 7 | 2.8% |
| $25,000 to $34,999 | 8 | 3.2% |
| $35,000 to $49,999 | 47 | 18.7% |
| $50,000 to $74,999 | 48 | 19.1% |
| $75,000 to $99,999 | 33 | 13.1% |
| $100,000 to $149,999 | 75 | 29.9% |
| $150,000 to $199,999 | 12 | 4.8% |
| $200,000+ | 11 | 4.4% |
Family Income by Famaliy Size in Scio
5-person families (8 | 3.2%) account for the highest median family income in Scio with $138,750 per family, while 2-person families (138 | 55.0%) have the highest median income of $36,180 per family member.
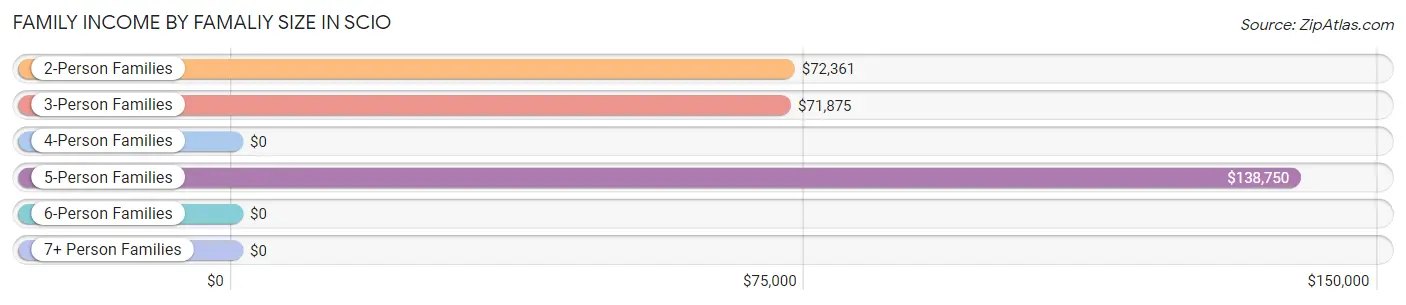
| Income Bracket | # Families | Median Income |
| 2-Person Families | 138 (55.0%) | $72,361 |
| 3-Person Families | 35 (13.9%) | $71,875 |
| 4-Person Families | 53 (21.1%) | $0 |
| 5-Person Families | 8 (3.2%) | $138,750 |
| 6-Person Families | 17 (6.8%) | $0 |
| 7+ Person Families | 0 (0.0%) | $0 |
| Total | 251 (100.0%) | $77,292 |
Family Income by Number of Earners in Scio
The median family income in Scio is $77,292, with families comprising 3+ earners (20) having the highest median family income of $136,250, while families with no earners (56) have the lowest median family income of $42,031, accounting for 8.0% and 22.3% of families, respectively.
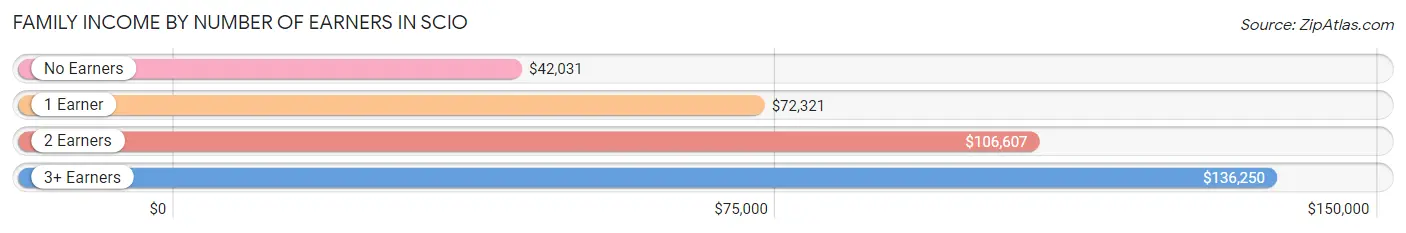
| Number of Earners | # Families | Median Income |
| No Earners | 56 (22.3%) | $42,031 |
| 1 Earner | 94 (37.4%) | $72,321 |
| 2 Earners | 81 (32.3%) | $106,607 |
| 3+ Earners | 20 (8.0%) | $136,250 |
| Total | 251 (100.0%) | $77,292 |
Household Income in Scio
Household Income Brackets in Scio
With 93 households falling in the category, the $100,000 to $149,999 income range is the most frequent in Scio, accounting for 28.1% of all households. In contrast, only 6 households (1.8%) fall into the less than $10,000 income bracket, making it the least populous group.
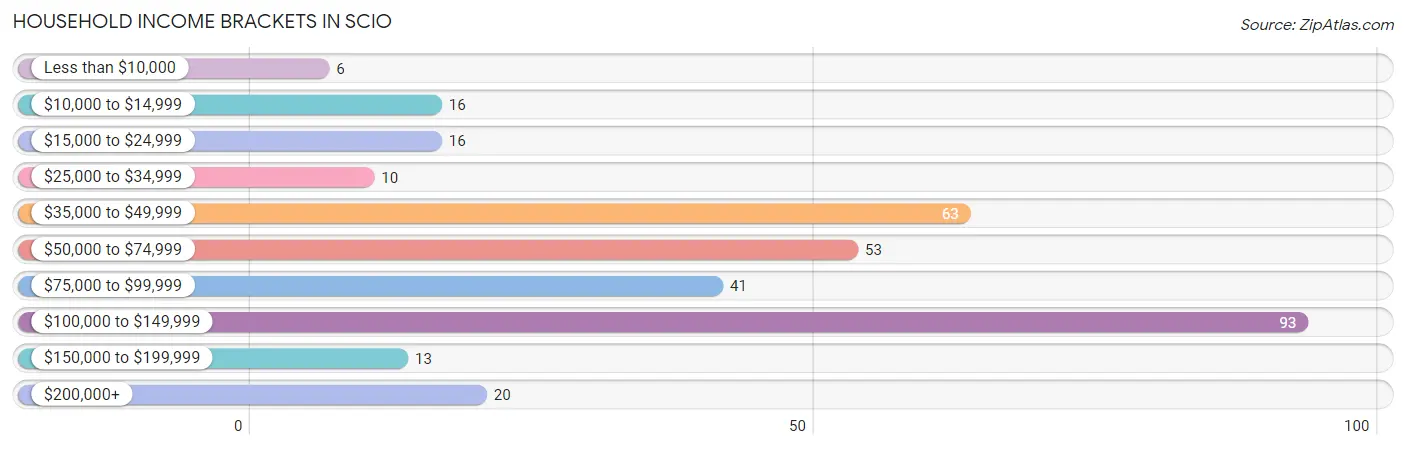
| Income Bracket | # Households | % Households |
| Less than $10,000 | 6 | 1.8% |
| $10,000 to $14,999 | 16 | 4.8% |
| $15,000 to $24,999 | 16 | 4.8% |
| $25,000 to $34,999 | 10 | 3.0% |
| $35,000 to $49,999 | 63 | 19.0% |
| $50,000 to $74,999 | 53 | 16.0% |
| $75,000 to $99,999 | 41 | 12.4% |
| $100,000 to $149,999 | 93 | 28.1% |
| $150,000 to $199,999 | 13 | 3.9% |
| $200,000+ | 20 | 6.0% |
Household Income by Householder Age in Scio
The median household income in Scio is $75,625, with the highest median household income of $108,542 found in the 25 to 44 years age bracket for the primary householder. A total of 99 households (29.9%) fall into this category. Meanwhile, the 15 to 24 years age bracket for the primary householder has the lowest median household income of $0, with 7 households (2.1%) in this group.
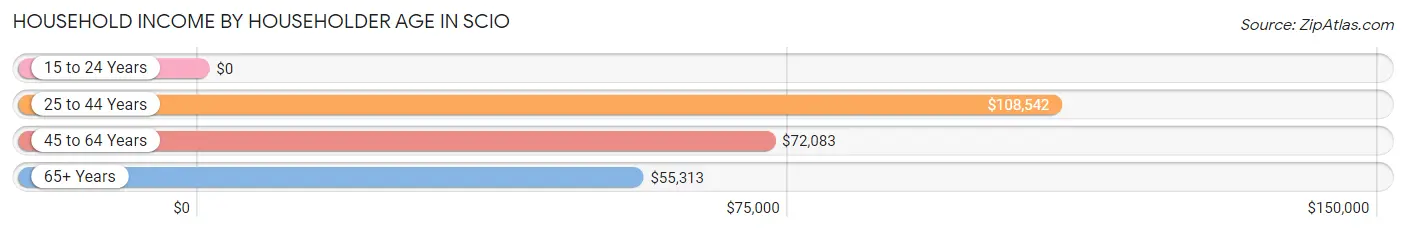
| Income Bracket | # Households | Median Income |
| 15 to 24 Years | 7 (2.1%) | $0 |
| 25 to 44 Years | 99 (29.9%) | $108,542 |
| 45 to 64 Years | 122 (36.9%) | $72,083 |
| 65+ Years | 103 (31.1%) | $55,313 |
| Total | 331 (100.0%) | $75,625 |
Poverty in Scio
Income Below Poverty by Sex and Age in Scio
With 5.8% poverty level for males and 8.4% for females among the residents of Scio, 15 year old males and 18 to 24 year old females are the most vulnerable to poverty, with 6 males (100.0%) and 5 females (35.7%) in their respective age groups living below the poverty level.
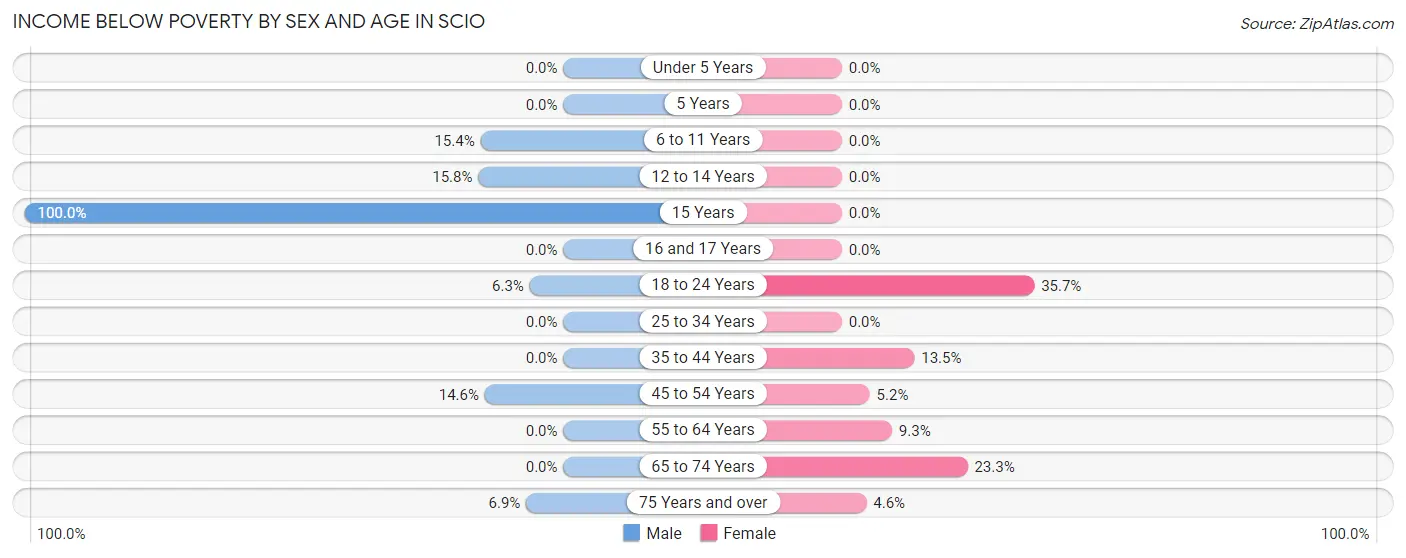
| Age Bracket | Male | Female |
| Under 5 Years | 0 (0.0%) | 0 (0.0%) |
| 5 Years | 0 (0.0%) | 0 (0.0%) |
| 6 to 11 Years | 6 (15.4%) | 0 (0.0%) |
| 12 to 14 Years | 3 (15.8%) | 0 (0.0%) |
| 15 Years | 6 (100.0%) | 0 (0.0%) |
| 16 and 17 Years | 0 (0.0%) | 0 (0.0%) |
| 18 to 24 Years | 2 (6.2%) | 5 (35.7%) |
| 25 to 34 Years | 0 (0.0%) | 0 (0.0%) |
| 35 to 44 Years | 0 (0.0%) | 7 (13.5%) |
| 45 to 54 Years | 7 (14.6%) | 3 (5.2%) |
| 55 to 64 Years | 0 (0.0%) | 4 (9.3%) |
| 65 to 74 Years | 0 (0.0%) | 14 (23.3%) |
| 75 Years and over | 2 (6.9%) | 1 (4.5%) |
| Total | 26 (5.8%) | 34 (8.4%) |
Income Above Poverty by Sex and Age in Scio
According to the poverty statistics in Scio, males aged under 5 years and females aged under 5 years are the age groups that are most secure financially, with 100.0% of males and 100.0% of females in these age groups living above the poverty line.
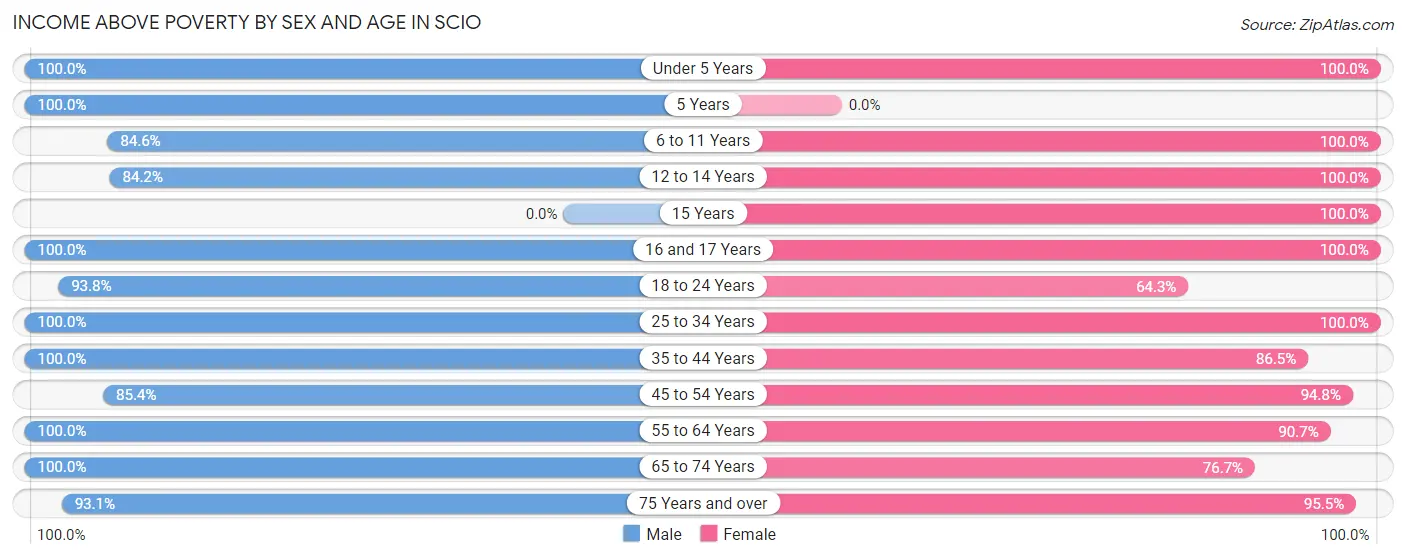
| Age Bracket | Male | Female |
| Under 5 Years | 52 (100.0%) | 45 (100.0%) |
| 5 Years | 4 (100.0%) | 0 (0.0%) |
| 6 to 11 Years | 33 (84.6%) | 24 (100.0%) |
| 12 to 14 Years | 16 (84.2%) | 11 (100.0%) |
| 15 Years | 0 (0.0%) | 3 (100.0%) |
| 16 and 17 Years | 2 (100.0%) | 11 (100.0%) |
| 18 to 24 Years | 30 (93.8%) | 9 (64.3%) |
| 25 to 34 Years | 58 (100.0%) | 60 (100.0%) |
| 35 to 44 Years | 50 (100.0%) | 45 (86.5%) |
| 45 to 54 Years | 41 (85.4%) | 55 (94.8%) |
| 55 to 64 Years | 64 (100.0%) | 39 (90.7%) |
| 65 to 74 Years | 48 (100.0%) | 46 (76.7%) |
| 75 Years and over | 27 (93.1%) | 21 (95.5%) |
| Total | 425 (94.2%) | 369 (91.6%) |
Income Below Poverty Among Married-Couple Families in Scio
The poverty statistics for married-couple families in Scio show that 4.1% or 8 of the total 195 families live below the poverty line. Families with 1 or 2 children have the highest poverty rate of 12.3%, comprising of 7 families. On the other hand, families with 3 or 4 children have the lowest poverty rate of 0.0%, which includes 0 families.
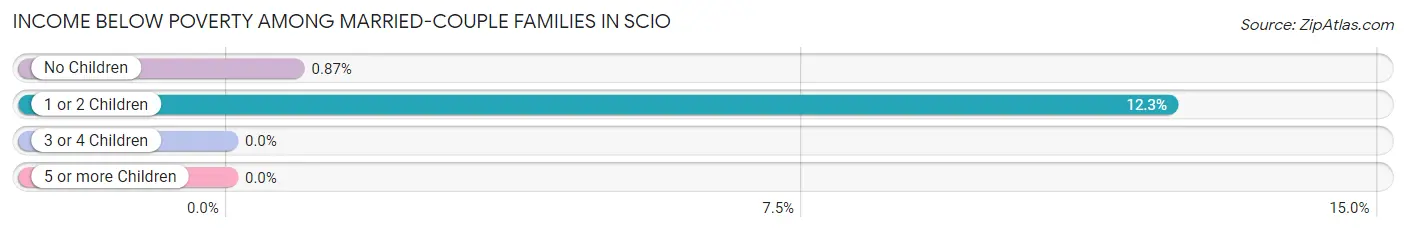
| Children | Above Poverty | Below Poverty |
| No Children | 114 (99.1%) | 1 (0.9%) |
| 1 or 2 Children | 50 (87.7%) | 7 (12.3%) |
| 3 or 4 Children | 23 (100.0%) | 0 (0.0%) |
| 5 or more Children | 0 (0.0%) | 0 (0.0%) |
| Total | 187 (95.9%) | 8 (4.1%) |
Income Below Poverty Among Single-Parent Households in Scio
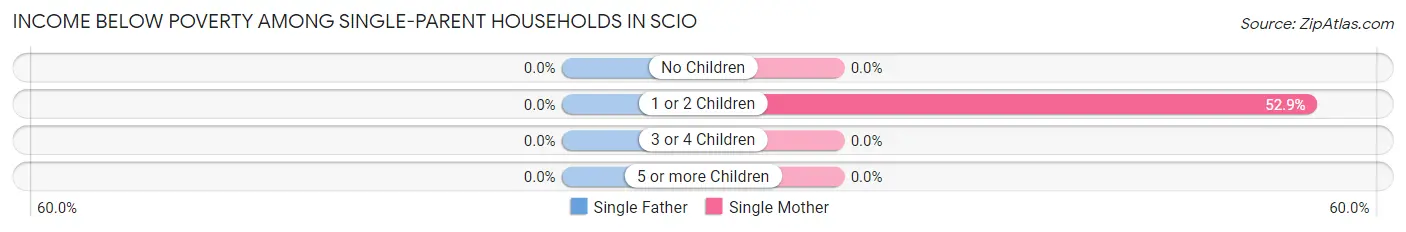
| Children | Single Father | Single Mother |
| No Children | 0 (0.0%) | 0 (0.0%) |
| 1 or 2 Children | 0 (0.0%) | 9 (52.9%) |
| 3 or 4 Children | 0 (0.0%) | 0 (0.0%) |
| 5 or more Children | 0 (0.0%) | 0 (0.0%) |
| Total | 0 (0.0%) | 9 (24.3%) |
Income Below Poverty Among Married-Couple vs Single-Parent Households in Scio
The poverty data for Scio shows that 8 of the married-couple family households (4.1%) and 9 of the single-parent households (16.1%) are living below the poverty level. Within the married-couple family households, those with 1 or 2 children have the highest poverty rate, with 7 households (12.3%) falling below the poverty line. Among the single-parent households, those with 1 or 2 children have the highest poverty rate, with 9 household (37.5%) living below poverty.
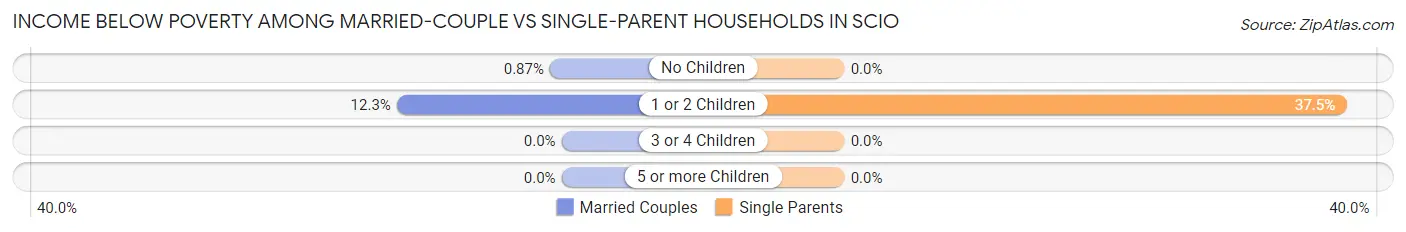
| Children | Married-Couple Families | Single-Parent Households |
| No Children | 1 (0.9%) | 0 (0.0%) |
| 1 or 2 Children | 7 (12.3%) | 9 (37.5%) |
| 3 or 4 Children | 0 (0.0%) | 0 (0.0%) |
| 5 or more Children | 0 (0.0%) | 0 (0.0%) |
| Total | 8 (4.1%) | 9 (16.1%) |
Race in Scio
The most populous races in Scio are White / Caucasian (836 | 97.2%), Hispanic or Latino (80 | 9.3%), and Two or more Races (13 | 1.5%).
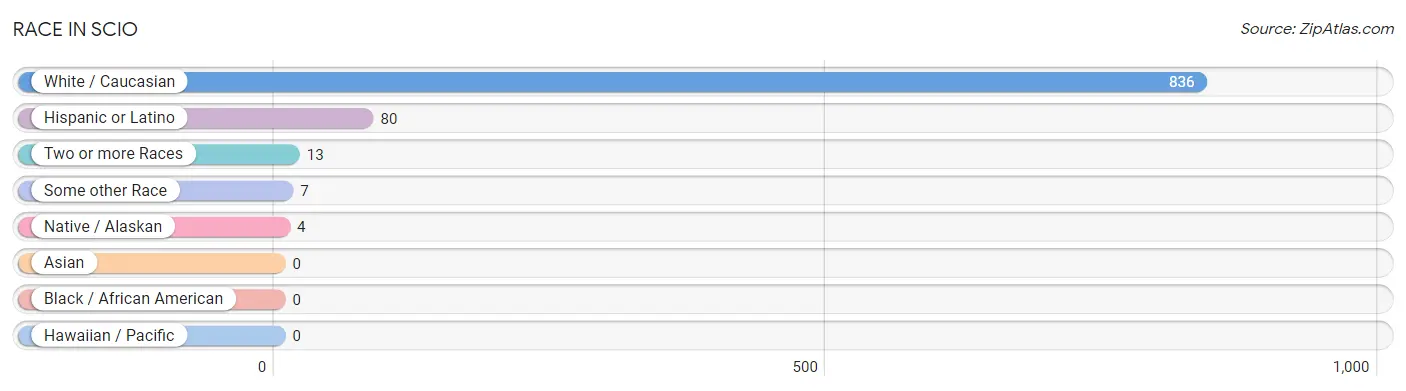
| Race | # Population | % Population |
| Asian | 0 | 0.0% |
| Black / African American | 0 | 0.0% |
| Hawaiian / Pacific | 0 | 0.0% |
| Hispanic or Latino | 80 | 9.3% |
| Native / Alaskan | 4 | 0.5% |
| White / Caucasian | 836 | 97.2% |
| Two or more Races | 13 | 1.5% |
| Some other Race | 7 | 0.8% |
| Total | 860 | 100.0% |
Ancestry in Scio
The most populous ancestries reported in Scio are English (268 | 31.2%), German (177 | 20.6%), Irish (97 | 11.3%), Mexican (80 | 9.3%), and Norwegian (34 | 4.0%), together accounting for 76.3% of all Scio residents.
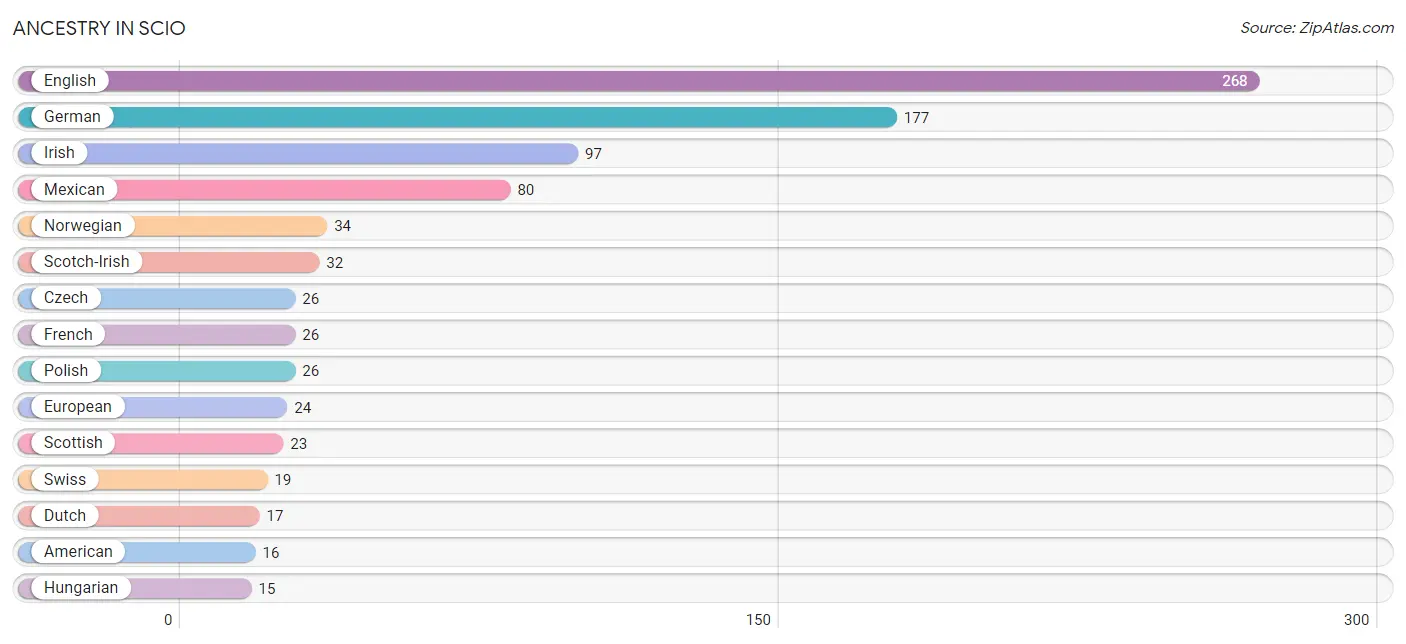
| Ancestry | # Population | % Population |
| Alaskan Athabascan | 2 | 0.2% |
| American | 16 | 1.9% |
| Blackfeet | 2 | 0.2% |
| Canadian | 2 | 0.2% |
| Celtic | 4 | 0.5% |
| Cherokee | 5 | 0.6% |
| Colville | 3 | 0.4% |
| Czech | 26 | 3.0% |
| Czechoslovakian | 2 | 0.2% |
| Danish | 7 | 0.8% |
| Dutch | 17 | 2.0% |
| English | 268 | 31.2% |
| European | 24 | 2.8% |
| French | 26 | 3.0% |
| French Canadian | 2 | 0.2% |
| German | 177 | 20.6% |
| Hungarian | 15 | 1.7% |
| Irish | 97 | 11.3% |
| Italian | 10 | 1.2% |
| Latvian | 2 | 0.2% |
| Mexican | 80 | 9.3% |
| Northern European | 4 | 0.5% |
| Norwegian | 34 | 4.0% |
| Polish | 26 | 3.0% |
| Scotch-Irish | 32 | 3.7% |
| Scottish | 23 | 2.7% |
| Swedish | 11 | 1.3% |
| Swiss | 19 | 2.2% |
| Welsh | 13 | 1.5% | View All 29 Rows |
Immigrants in Scio
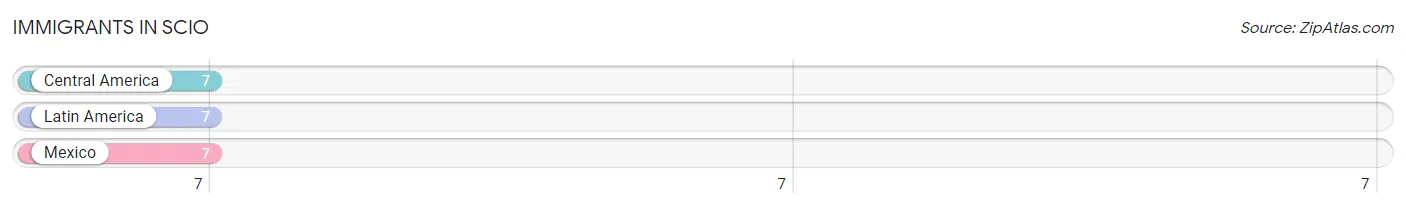
The most numerous immigrant groups reported in Scio came from Central America (7 | 0.8%), Latin America (7 | 0.8%), and Mexico (7 | 0.8%), together accounting for 2.4% of all Scio residents.
| Immigration Origin | # Population | % Population |
| Central America | 7 | 0.8% |
| Latin America | 7 | 0.8% |
| Mexico | 7 | 0.8% | View All 3 Rows |
Sex and Age in Scio
Sex and Age in Scio
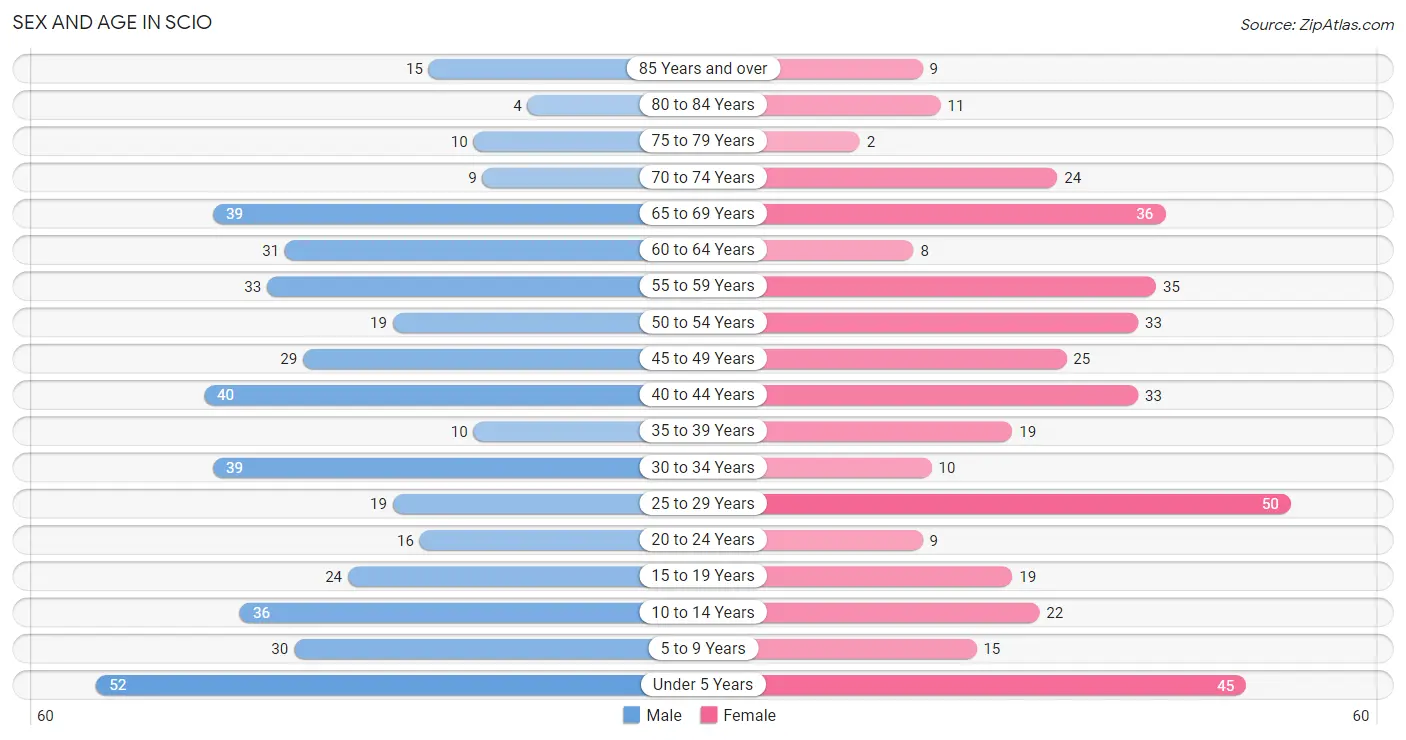
The most populous age groups in Scio are Under 5 Years (52 | 11.4%) for men and 25 to 29 Years (50 | 12.3%) for women.
| Age Bracket | Male | Female |
| Under 5 Years | 52 (11.4%) | 45 (11.1%) |
| 5 to 9 Years | 30 (6.6%) | 15 (3.7%) |
| 10 to 14 Years | 36 (7.9%) | 22 (5.4%) |
| 15 to 19 Years | 24 (5.3%) | 19 (4.7%) |
| 20 to 24 Years | 16 (3.5%) | 9 (2.2%) |
| 25 to 29 Years | 19 (4.2%) | 50 (12.3%) |
| 30 to 34 Years | 39 (8.6%) | 10 (2.5%) |
| 35 to 39 Years | 10 (2.2%) | 19 (4.7%) |
| 40 to 44 Years | 40 (8.8%) | 33 (8.2%) |
| 45 to 49 Years | 29 (6.4%) | 25 (6.2%) |
| 50 to 54 Years | 19 (4.2%) | 33 (8.2%) |
| 55 to 59 Years | 33 (7.2%) | 35 (8.6%) |
| 60 to 64 Years | 31 (6.8%) | 8 (2.0%) |
| 65 to 69 Years | 39 (8.6%) | 36 (8.9%) |
| 70 to 74 Years | 9 (2.0%) | 24 (5.9%) |
| 75 to 79 Years | 10 (2.2%) | 2 (0.5%) |
| 80 to 84 Years | 4 (0.9%) | 11 (2.7%) |
| 85 Years and over | 15 (3.3%) | 9 (2.2%) |
| Total | 455 (100.0%) | 405 (100.0%) |
Families and Households in Scio
Median Family Size in Scio
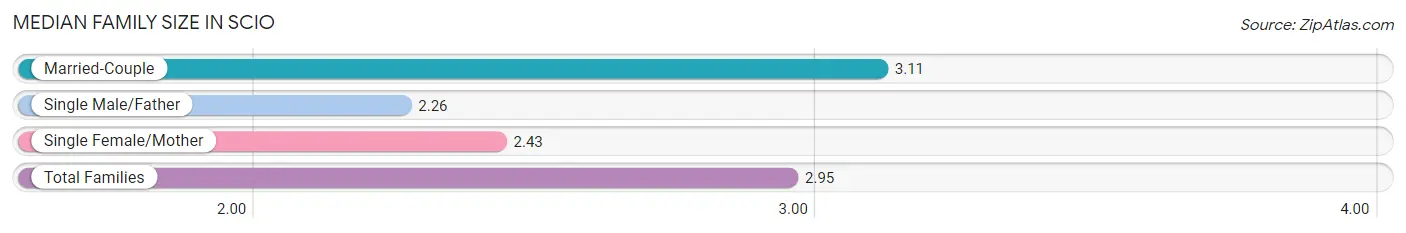
The median family size in Scio is 2.95 persons per family, with married-couple families (195 | 77.7%) accounting for the largest median family size of 3.11 persons per family. On the other hand, single male/father families (19 | 7.6%) represent the smallest median family size with 2.26 persons per family.
| Family Type | # Families | Family Size |
| Married-Couple | 195 (77.7%) | 3.11 |
| Single Male/Father | 19 (7.6%) | 2.26 |
| Single Female/Mother | 37 (14.7%) | 2.43 |
| Total Families | 251 (100.0%) | 2.95 |
Median Household Size in Scio
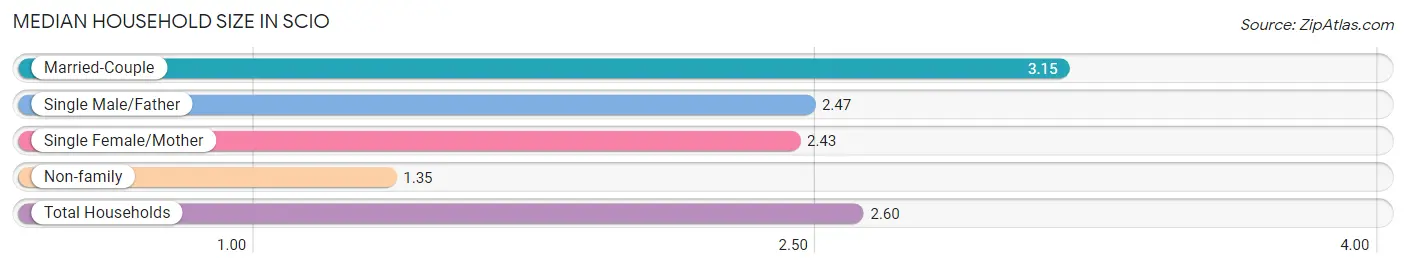
The median household size in Scio is 2.60 persons per household, with married-couple households (195 | 58.9%) accounting for the largest median household size of 3.15 persons per household. non-family households (80 | 24.2%) represent the smallest median household size with 1.35 persons per household.
| Household Type | # Households | Household Size |
| Married-Couple | 195 (58.9%) | 3.15 |
| Single Male/Father | 19 (5.7%) | 2.47 |
| Single Female/Mother | 37 (11.2%) | 2.43 |
| Non-family | 80 (24.2%) | 1.35 |
| Total Households | 331 (100.0%) | 2.60 |
Household Size by Marriage Status in Scio
Out of a total of 331 households in Scio, 251 (75.8%) are family households, while 80 (24.2%) are nonfamily households. The most numerous type of family households are 2-person households, comprising 135, and the most common type of nonfamily households are 1-person households, comprising 61.
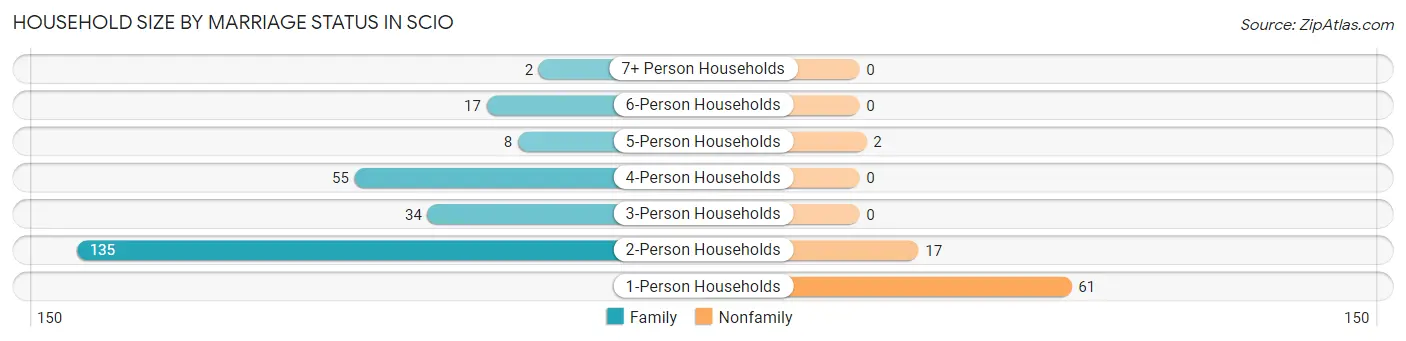
| Household Size | Family Households | Nonfamily Households |
| 1-Person Households | - | 61 (18.4%) |
| 2-Person Households | 135 (40.8%) | 17 (5.1%) |
| 3-Person Households | 34 (10.3%) | 0 (0.0%) |
| 4-Person Households | 55 (16.6%) | 0 (0.0%) |
| 5-Person Households | 8 (2.4%) | 2 (0.6%) |
| 6-Person Households | 17 (5.1%) | 0 (0.0%) |
| 7+ Person Households | 2 (0.6%) | 0 (0.0%) |
| Total | 251 (75.8%) | 80 (24.2%) |
Female Fertility in Scio
Fertility by Age in Scio
Average fertility rate in Scio is 99.0 births per 1,000 women. Women in the age bracket of 20 to 34 years have the highest fertility rate with 246.0 births per 1,000 women. Women in the age bracket of 20 to 34 years acount for 100.0% of all women with births.
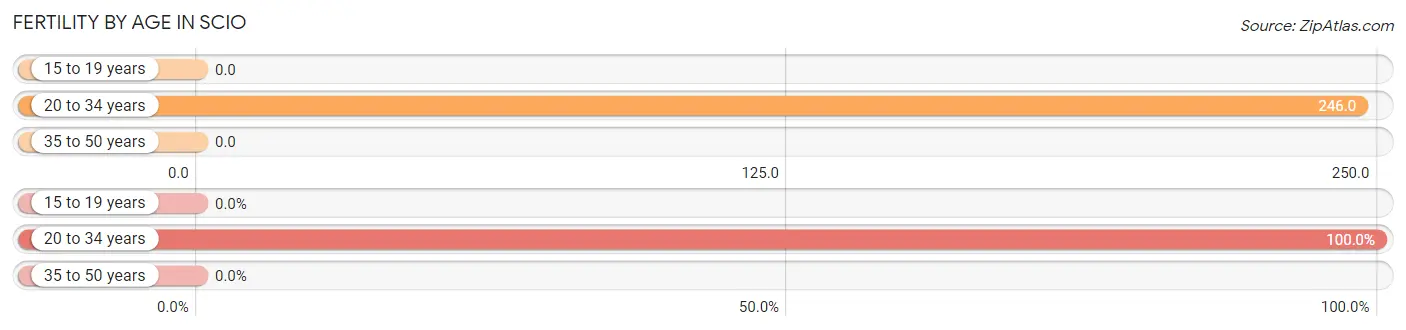
| Age Bracket | Women with Births | Births / 1,000 Women |
| 15 to 19 years | 0 (0.0%) | 0.0 |
| 20 to 34 years | 17 (100.0%) | 246.0 |
| 35 to 50 years | 0 (0.0%) | 0.0 |
| Total | 17 (100.0%) | 99.0 |
Fertility by Age by Marriage Status in Scio
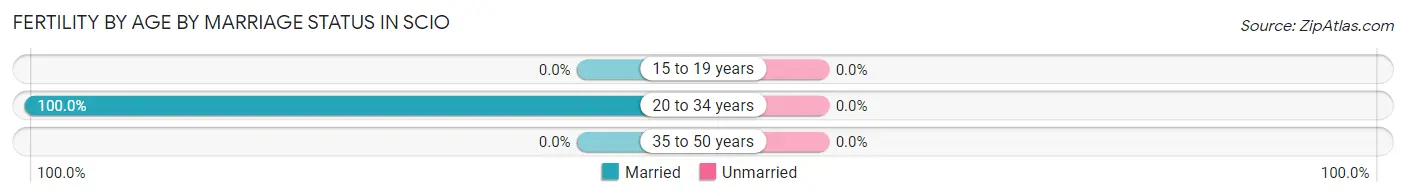
| Age Bracket | Married | Unmarried |
| 15 to 19 years | 0 (0.0%) | 0 (0.0%) |
| 20 to 34 years | 17 (100.0%) | 0 (0.0%) |
| 35 to 50 years | 0 (0.0%) | 0 (0.0%) |
| Total | 17 (100.0%) | 0 (0.0%) |
Fertility by Education in Scio
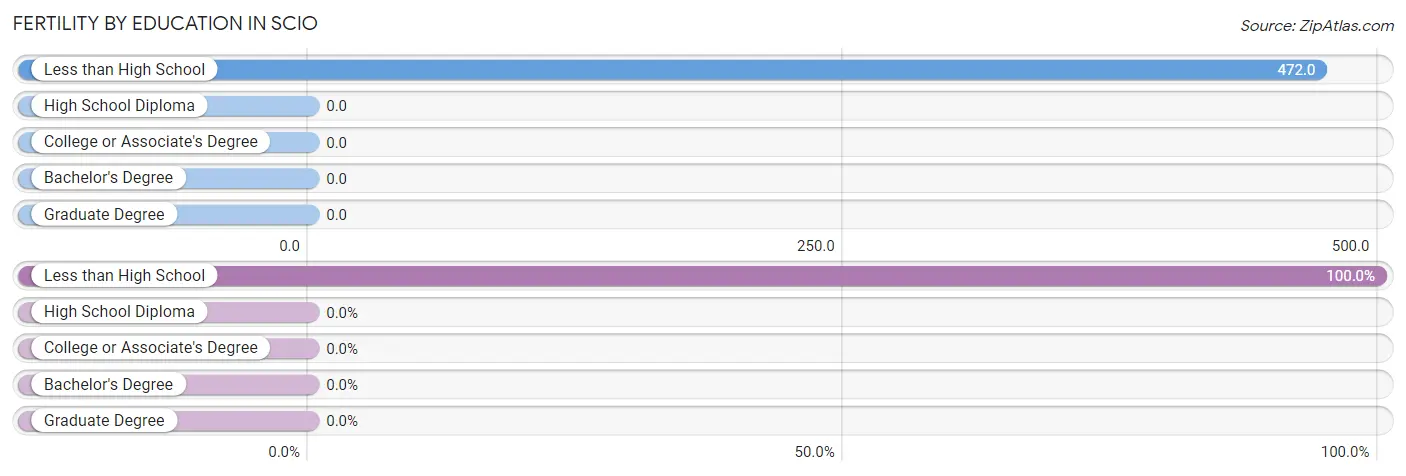
| Educational Attainment | Women with Births | Births / 1,000 Women |
| Less than High School | 17 (100.0%) | 472.0 |
| High School Diploma | 0 (0.0%) | 0.0 |
| College or Associate's Degree | 0 (0.0%) | 0.0 |
| Bachelor's Degree | 0 (0.0%) | 0.0 |
| Graduate Degree | 0 (0.0%) | 0.0 |
| Total | 17 (100.0%) | 99.0 |
Fertility by Education by Marriage Status in Scio
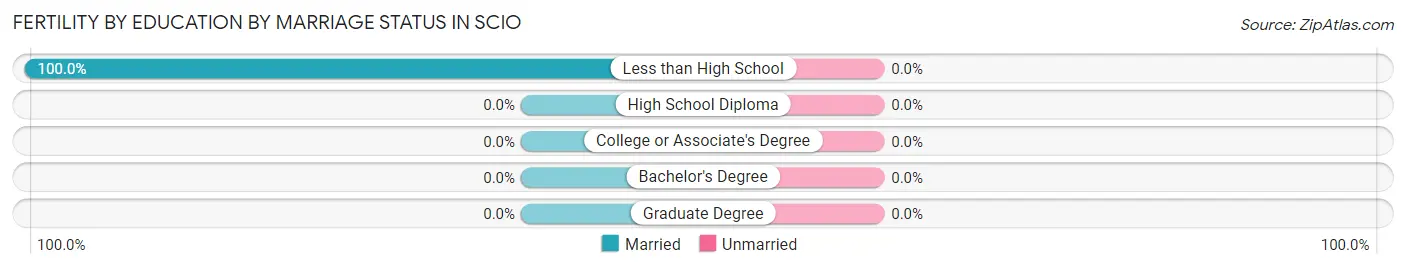
| Educational Attainment | Married | Unmarried |
| Less than High School | 17 (100.0%) | 0 (0.0%) |
| High School Diploma | 0 (0.0%) | 0 (0.0%) |
| College or Associate's Degree | 0 (0.0%) | 0 (0.0%) |
| Bachelor's Degree | 0 (0.0%) | 0 (0.0%) |
| Graduate Degree | 0 (0.0%) | 0 (0.0%) |
| Total | 17 (100.0%) | 0 (0.0%) |
Employment Characteristics in Scio
Employment by Class of Employer in Scio
Among the 375 employed individuals in Scio, private company employees (248 | 66.1%), local government employees (55 | 14.7%), and not-for-profit organizations (30 | 8.0%) make up the most common classes of employment.
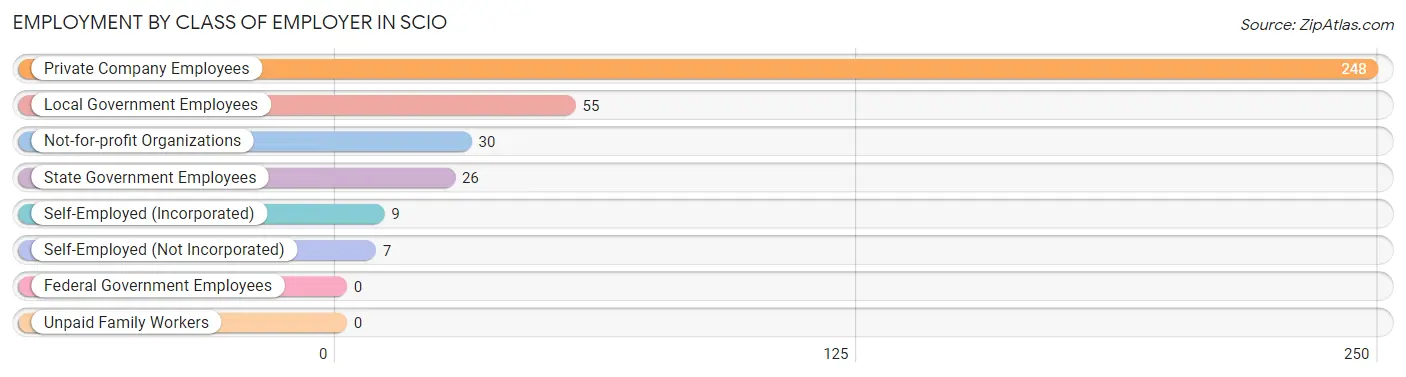
| Employer Class | # Employees | % Employees |
| Private Company Employees | 248 | 66.1% |
| Self-Employed (Incorporated) | 9 | 2.4% |
| Self-Employed (Not Incorporated) | 7 | 1.9% |
| Not-for-profit Organizations | 30 | 8.0% |
| Local Government Employees | 55 | 14.7% |
| State Government Employees | 26 | 6.9% |
| Federal Government Employees | 0 | 0.0% |
| Unpaid Family Workers | 0 | 0.0% |
| Total | 375 | 100.0% |
Employment Status by Age in Scio
According to the labor force statistics for Scio, out of the total population over 16 years of age (651), 62.8% or 409 individuals are in the labor force, with 6.8% or 28 of them unemployed. The age group with the highest labor force participation rate is 20 to 24 years, with 100.0% or 25 individuals in the labor force. Within the labor force, the 16 to 19 years age range has the highest percentage of unemployed individuals, with 53.1% or 17 of them being unemployed.
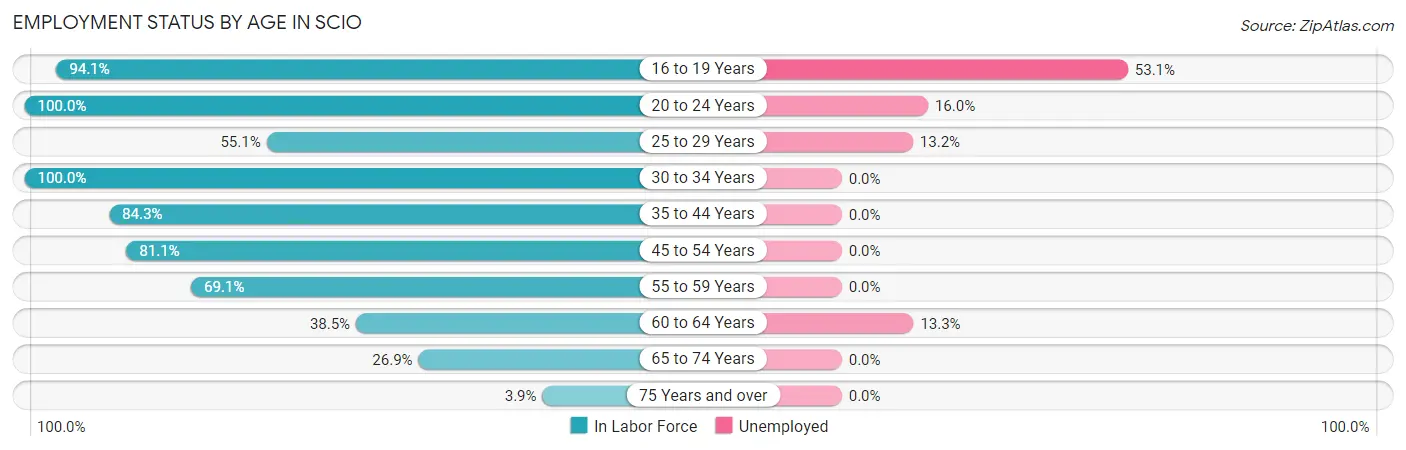
| Age Bracket | In Labor Force | Unemployed |
| 16 to 19 Years | 32 (94.1%) | 17 (53.1%) |
| 20 to 24 Years | 25 (100.0%) | 4 (16.0%) |
| 25 to 29 Years | 38 (55.1%) | 5 (13.2%) |
| 30 to 34 Years | 49 (100.0%) | 0 (0.0%) |
| 35 to 44 Years | 86 (84.3%) | 0 (0.0%) |
| 45 to 54 Years | 86 (81.1%) | 0 (0.0%) |
| 55 to 59 Years | 47 (69.1%) | 0 (0.0%) |
| 60 to 64 Years | 15 (38.5%) | 2 (13.3%) |
| 65 to 74 Years | 29 (26.9%) | 0 (0.0%) |
| 75 Years and over | 2 (3.9%) | 0 (0.0%) |
| Total | 409 (62.8%) | 28 (6.8%) |
Employment Status by Educational Attainment in Scio
According to labor force statistics for Scio, 74.1% of individuals (321) out of the total population between 25 and 64 years of age (433) are in the labor force, with 2.2% or 7 of them being unemployed. The group with the highest labor force participation rate are those with the educational attainment of bachelor's degree or higher, with 97.7% or 42 individuals in the labor force. Within the labor force, individuals with high school diploma education have the highest percentage of unemployment, with 5.3% or 5 of them being unemployed.
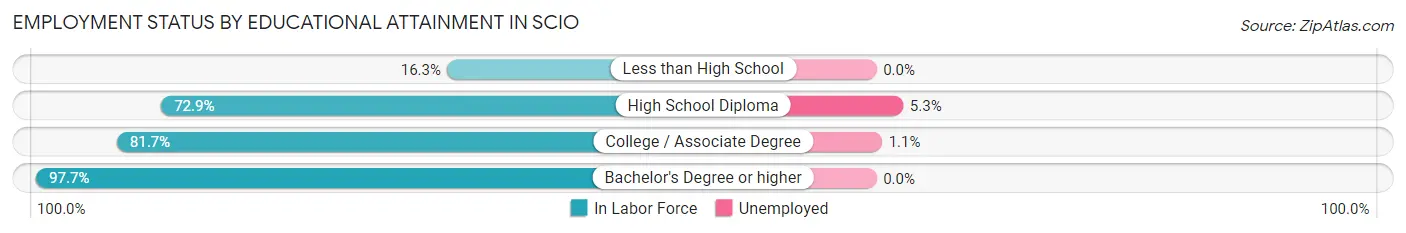
| Educational Attainment | In Labor Force | Unemployed |
| Less than High School | 7 (16.3%) | 0 (0.0%) |
| High School Diploma | 94 (72.9%) | 7 (5.3%) |
| College / Associate Degree | 178 (81.7%) | 2 (1.1%) |
| Bachelor's Degree or higher | 42 (97.7%) | 0 (0.0%) |
| Total | 321 (74.1%) | 10 (2.2%) |
Employment Occupations by Sex in Scio
Management, Business, Science and Arts Occupations
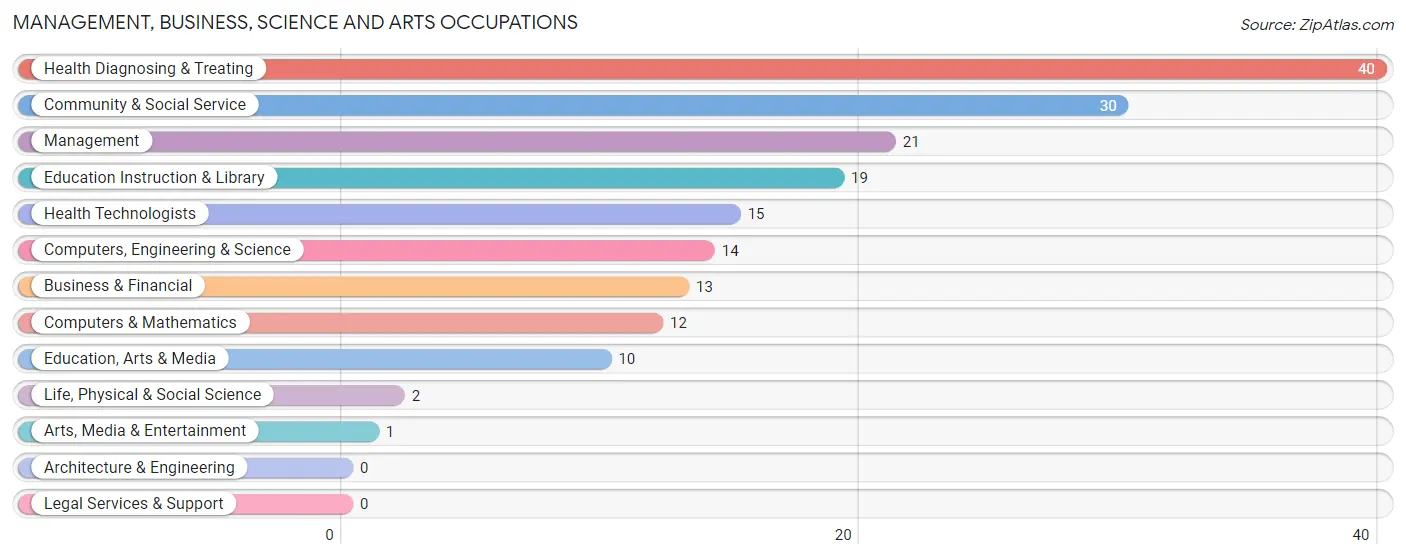
The most common Management, Business, Science and Arts occupations in Scio are Health Diagnosing & Treating (40 | 10.5%), Community & Social Service (30 | 7.9%), Management (21 | 5.5%), Education Instruction & Library (19 | 5.0%), and Health Technologists (15 | 3.9%).
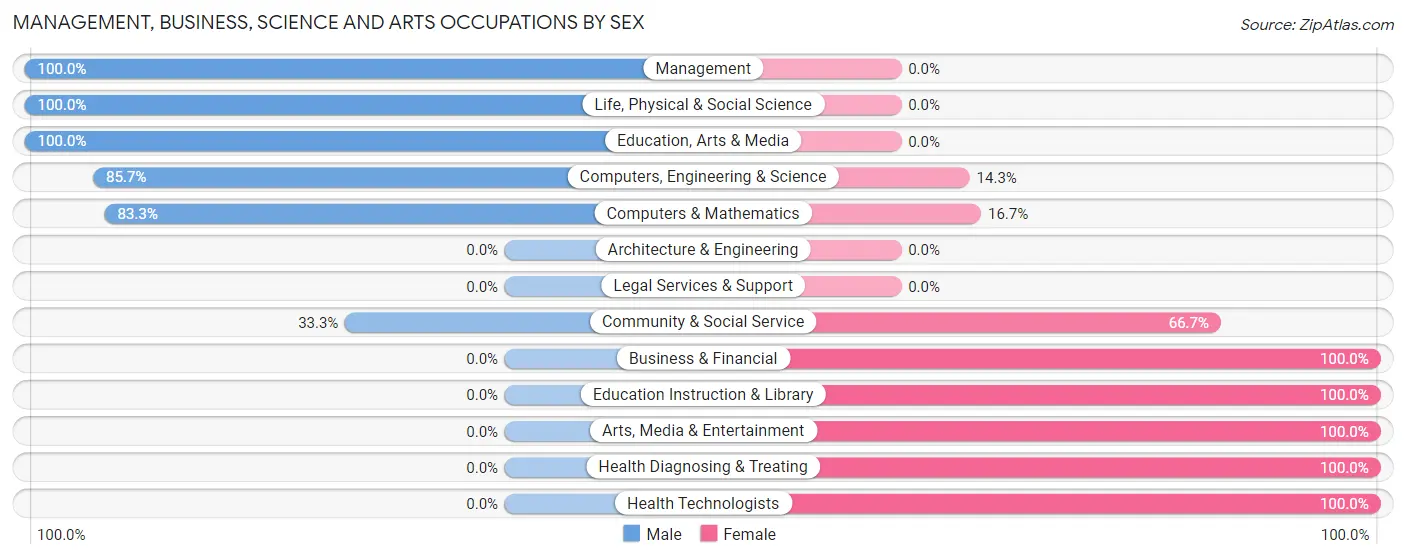
Management, Business, Science and Arts Occupations by Sex
Within the Management, Business, Science and Arts occupations in Scio, the most male-oriented occupations are Management (100.0%), Life, Physical & Social Science (100.0%), and Education, Arts & Media (100.0%), while the most female-oriented occupations are Business & Financial (100.0%), Education Instruction & Library (100.0%), and Arts, Media & Entertainment (100.0%).
| Occupation | Male | Female |
| Management | 21 (100.0%) | 0 (0.0%) |
| Business & Financial | 0 (0.0%) | 13 (100.0%) |
| Computers, Engineering & Science | 12 (85.7%) | 2 (14.3%) |
| Computers & Mathematics | 10 (83.3%) | 2 (16.7%) |
| Architecture & Engineering | 0 (0.0%) | 0 (0.0%) |
| Life, Physical & Social Science | 2 (100.0%) | 0 (0.0%) |
| Community & Social Service | 10 (33.3%) | 20 (66.7%) |
| Education, Arts & Media | 10 (100.0%) | 0 (0.0%) |
| Legal Services & Support | 0 (0.0%) | 0 (0.0%) |
| Education Instruction & Library | 0 (0.0%) | 19 (100.0%) |
| Arts, Media & Entertainment | 0 (0.0%) | 1 (100.0%) |
| Health Diagnosing & Treating | 0 (0.0%) | 40 (100.0%) |
| Health Technologists | 0 (0.0%) | 15 (100.0%) |
| Total (Category) | 43 (36.4%) | 75 (63.6%) |
| Total (Overall) | 208 (54.6%) | 173 (45.4%) |
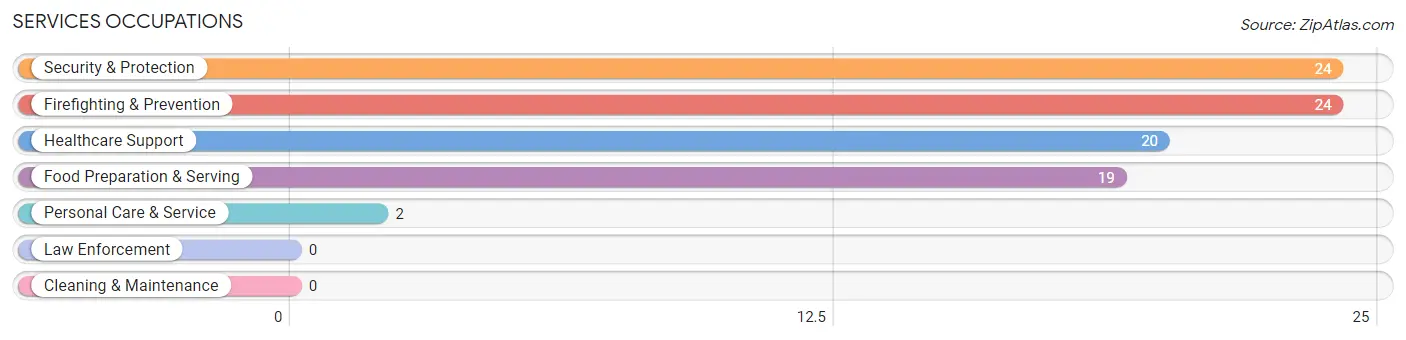
Services Occupations
The most common Services occupations in Scio are Security & Protection (24 | 6.3%), Firefighting & Prevention (24 | 6.3%), Healthcare Support (20 | 5.2%), Food Preparation & Serving (19 | 5.0%), and Personal Care & Service (2 | 0.5%).
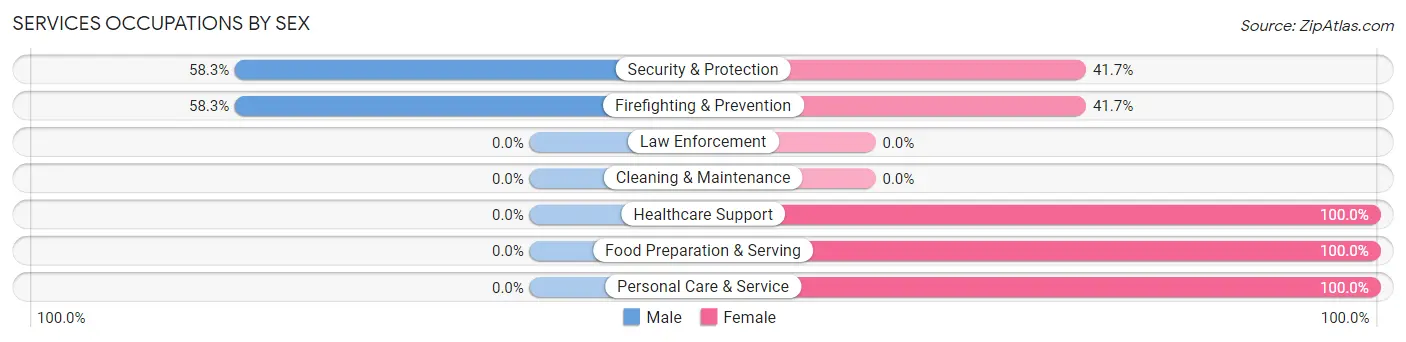
Services Occupations by Sex
Within the Services occupations in Scio, the most male-oriented occupations are Security & Protection (58.3%), and Firefighting & Prevention (58.3%), while the most female-oriented occupations are Healthcare Support (100.0%), Food Preparation & Serving (100.0%), and Personal Care & Service (100.0%).
| Occupation | Male | Female |
| Healthcare Support | 0 (0.0%) | 20 (100.0%) |
| Security & Protection | 14 (58.3%) | 10 (41.7%) |
| Firefighting & Prevention | 14 (58.3%) | 10 (41.7%) |
| Law Enforcement | 0 (0.0%) | 0 (0.0%) |
| Food Preparation & Serving | 0 (0.0%) | 19 (100.0%) |
| Cleaning & Maintenance | 0 (0.0%) | 0 (0.0%) |
| Personal Care & Service | 0 (0.0%) | 2 (100.0%) |
| Total (Category) | 14 (21.5%) | 51 (78.5%) |
| Total (Overall) | 208 (54.6%) | 173 (45.4%) |
Sales and Office Occupations
The most common Sales and Office occupations in Scio are Office & Administration (46 | 12.1%), and Sales & Related (19 | 5.0%).
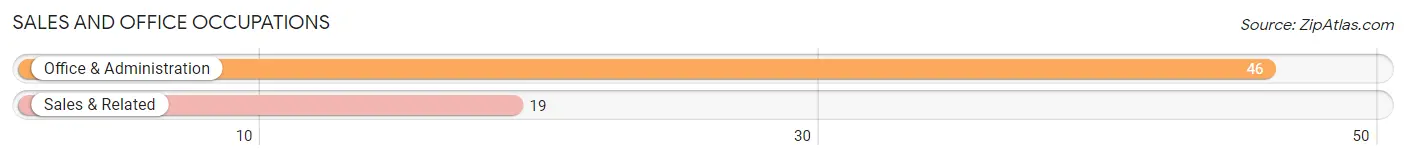
Sales and Office Occupations by Sex
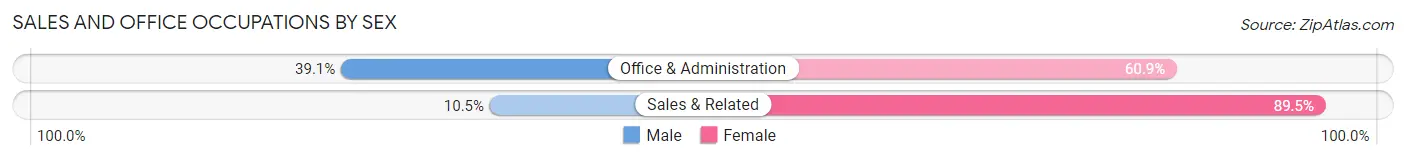
| Occupation | Male | Female |
| Sales & Related | 2 (10.5%) | 17 (89.5%) |
| Office & Administration | 18 (39.1%) | 28 (60.9%) |
| Total (Category) | 20 (30.8%) | 45 (69.2%) |
| Total (Overall) | 208 (54.6%) | 173 (45.4%) |
Natural Resources, Construction and Maintenance Occupations
The most common Natural Resources, Construction and Maintenance occupations in Scio are Construction & Extraction (46 | 12.1%), and Installation, Maintenance & Repair (28 | 7.3%).
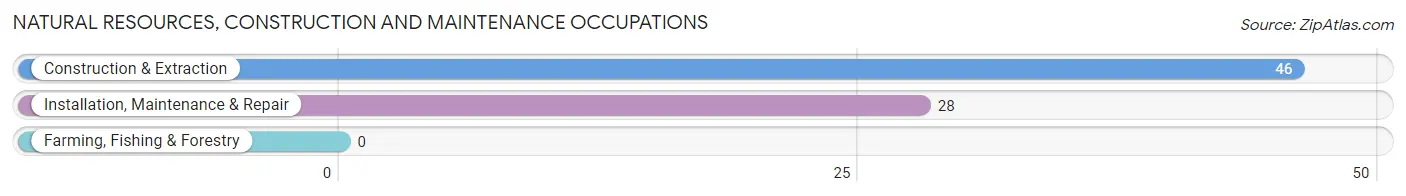
Natural Resources, Construction and Maintenance Occupations by Sex
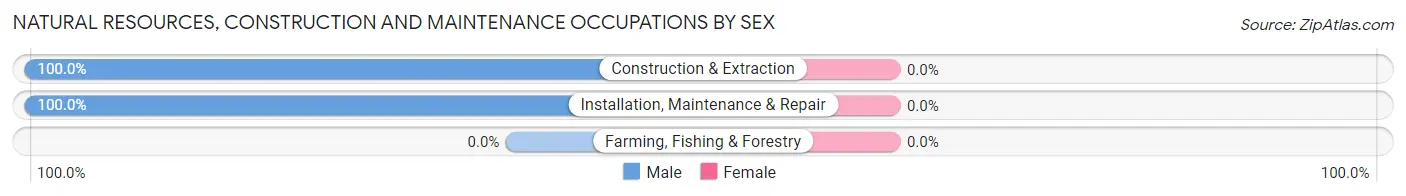
| Occupation | Male | Female |
| Farming, Fishing & Forestry | 0 (0.0%) | 0 (0.0%) |
| Construction & Extraction | 46 (100.0%) | 0 (0.0%) |
| Installation, Maintenance & Repair | 28 (100.0%) | 0 (0.0%) |
| Total (Category) | 74 (100.0%) | 0 (0.0%) |
| Total (Overall) | 208 (54.6%) | 173 (45.4%) |
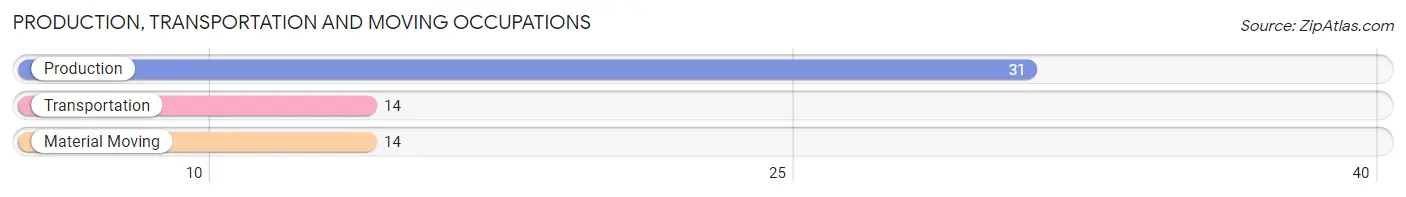
Production, Transportation and Moving Occupations
The most common Production, Transportation and Moving occupations in Scio are Production (31 | 8.1%), Transportation (14 | 3.7%), and Material Moving (14 | 3.7%).
Production, Transportation and Moving Occupations by Sex
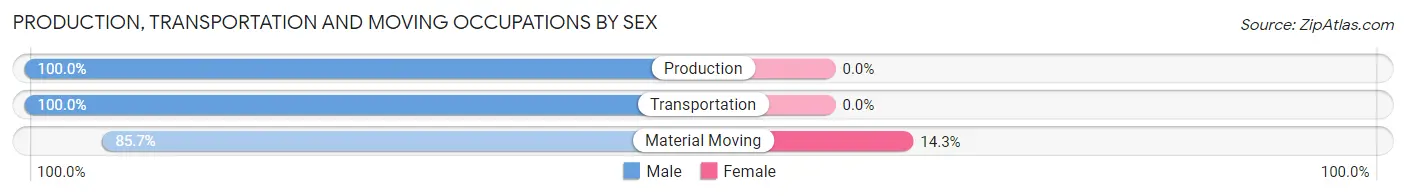
| Occupation | Male | Female |
| Production | 31 (100.0%) | 0 (0.0%) |
| Transportation | 14 (100.0%) | 0 (0.0%) |
| Material Moving | 12 (85.7%) | 2 (14.3%) |
| Total (Category) | 57 (96.6%) | 2 (3.4%) |
| Total (Overall) | 208 (54.6%) | 173 (45.4%) |
Employment Industries by Sex in Scio
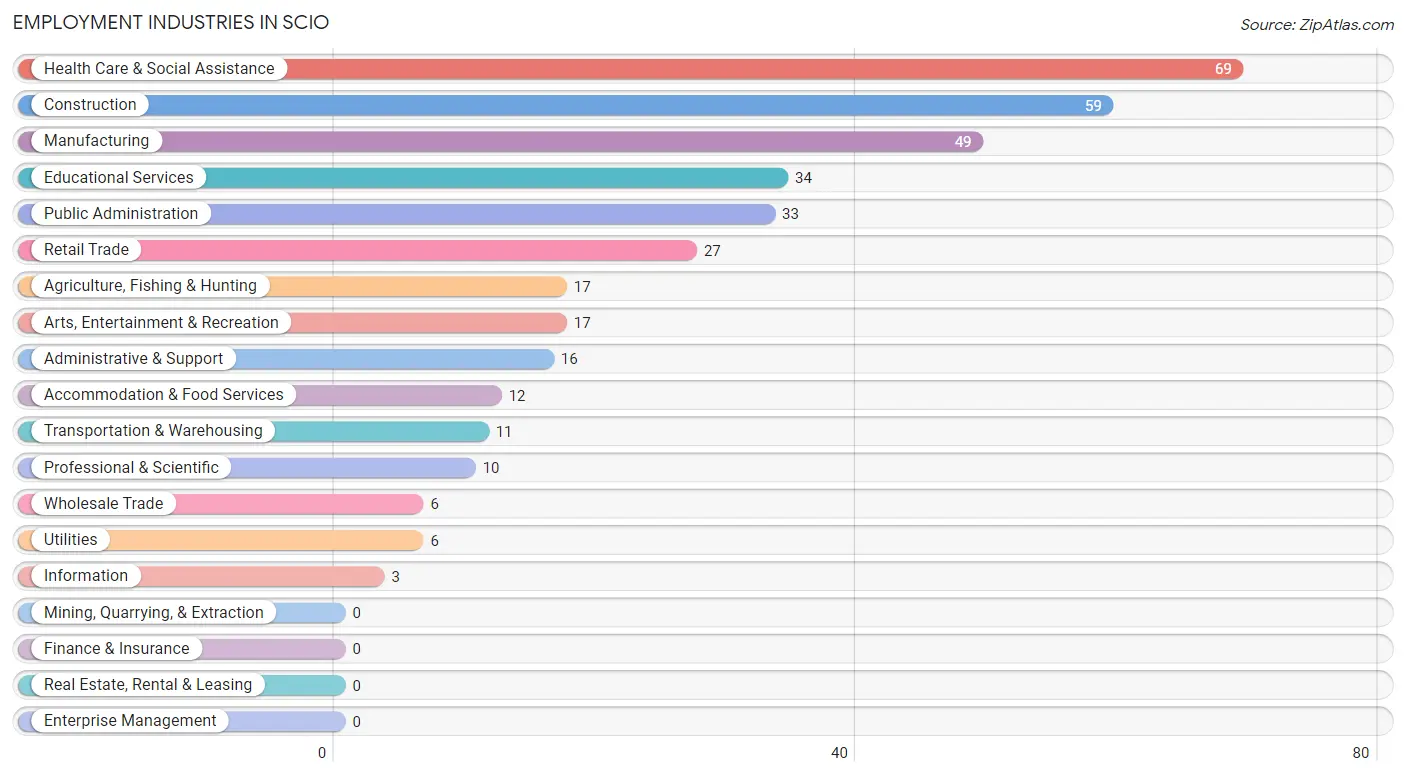
Employment Industries in Scio
The major employment industries in Scio include Health Care & Social Assistance (69 | 18.1%), Construction (59 | 15.5%), Manufacturing (49 | 12.9%), Educational Services (34 | 8.9%), and Public Administration (33 | 8.7%).
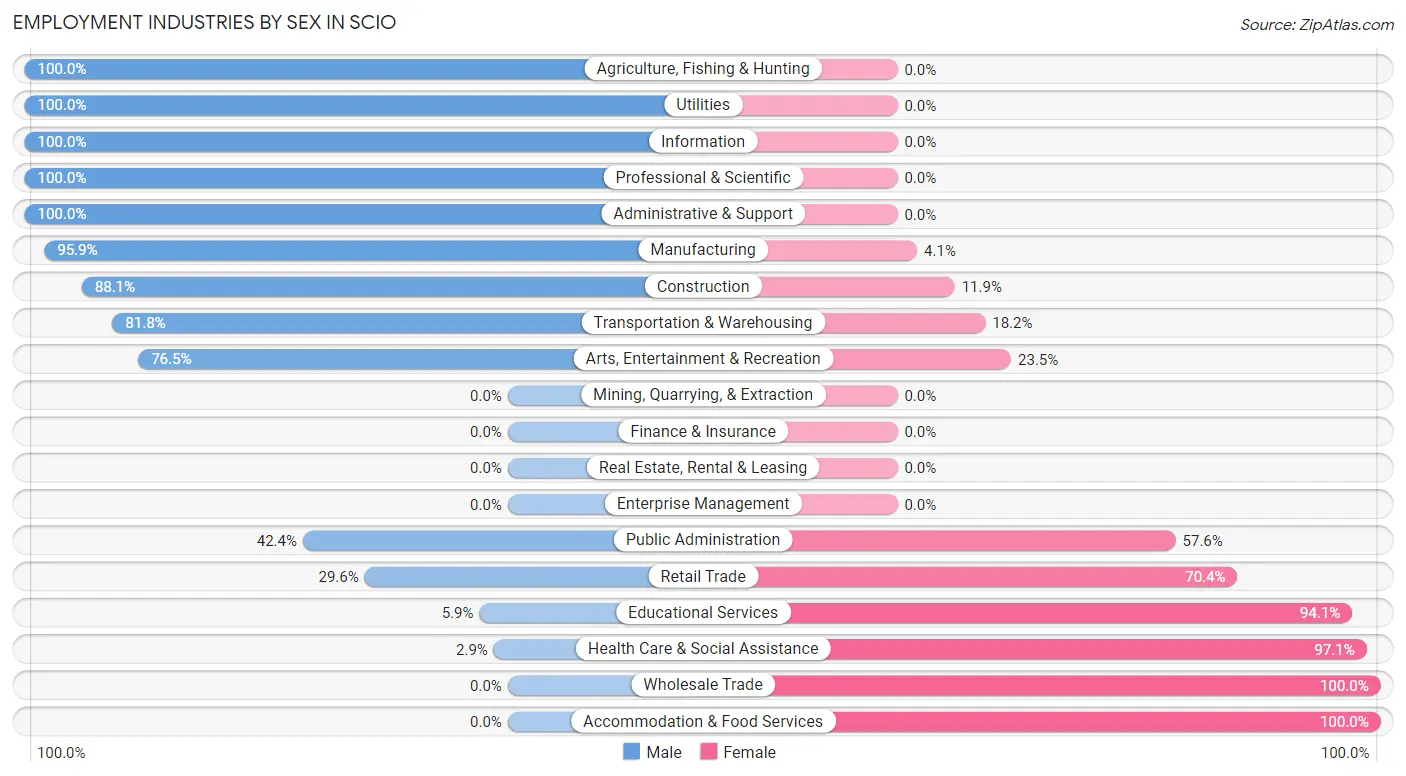
Employment Industries by Sex in Scio
The Scio industries that see more men than women are Agriculture, Fishing & Hunting (100.0%), Utilities (100.0%), and Information (100.0%), whereas the industries that tend to have a higher number of women are Wholesale Trade (100.0%), Accommodation & Food Services (100.0%), and Health Care & Social Assistance (97.1%).
| Industry | Male | Female |
| Agriculture, Fishing & Hunting | 17 (100.0%) | 0 (0.0%) |
| Mining, Quarrying, & Extraction | 0 (0.0%) | 0 (0.0%) |
| Construction | 52 (88.1%) | 7 (11.9%) |
| Manufacturing | 47 (95.9%) | 2 (4.1%) |
| Wholesale Trade | 0 (0.0%) | 6 (100.0%) |
| Retail Trade | 8 (29.6%) | 19 (70.4%) |
| Transportation & Warehousing | 9 (81.8%) | 2 (18.2%) |
| Utilities | 6 (100.0%) | 0 (0.0%) |
| Information | 3 (100.0%) | 0 (0.0%) |
| Finance & Insurance | 0 (0.0%) | 0 (0.0%) |
| Real Estate, Rental & Leasing | 0 (0.0%) | 0 (0.0%) |
| Professional & Scientific | 10 (100.0%) | 0 (0.0%) |
| Enterprise Management | 0 (0.0%) | 0 (0.0%) |
| Administrative & Support | 16 (100.0%) | 0 (0.0%) |
| Educational Services | 2 (5.9%) | 32 (94.1%) |
| Health Care & Social Assistance | 2 (2.9%) | 67 (97.1%) |
| Arts, Entertainment & Recreation | 13 (76.5%) | 4 (23.5%) |
| Accommodation & Food Services | 0 (0.0%) | 12 (100.0%) |
| Public Administration | 14 (42.4%) | 19 (57.6%) |
| Total | 208 (54.6%) | 173 (45.4%) |
Education in Scio
School Enrollment in Scio
The most common levels of schooling among the 160 students in Scio are elementary school (44 | 27.5%), middle school (41 | 25.6%), and high school (34 | 21.2%).
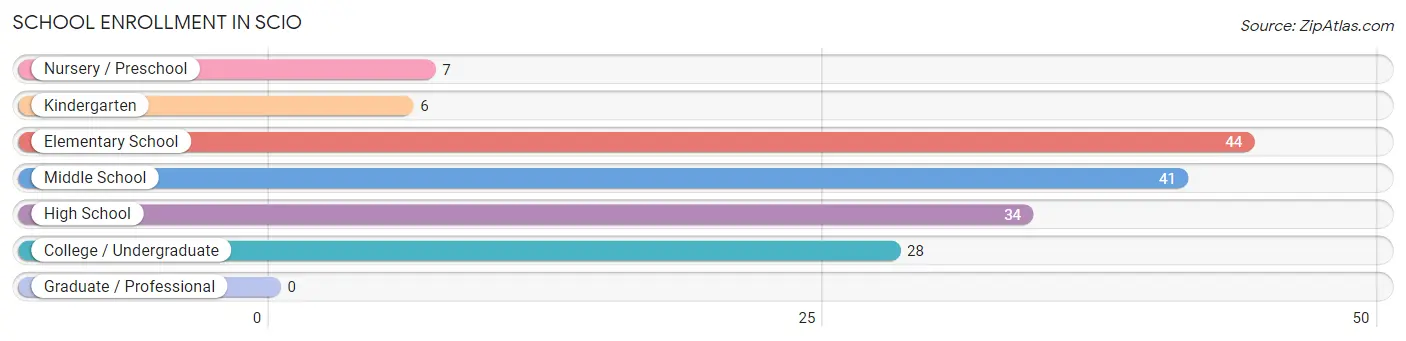
| School Level | # Students | % Students |
| Nursery / Preschool | 7 | 4.4% |
| Kindergarten | 6 | 3.7% |
| Elementary School | 44 | 27.5% |
| Middle School | 41 | 25.6% |
| High School | 34 | 21.2% |
| College / Undergraduate | 28 | 17.5% |
| Graduate / Professional | 0 | 0.0% |
| Total | 160 | 100.0% |
School Enrollment by Age by Funding Source in Scio
Out of a total of 160 students who are enrolled in schools in Scio, 13 (8.1%) attend a private institution, while the remaining 147 (91.9%) are enrolled in public schools. The age group of 3 to 4 year olds has the highest likelihood of being enrolled in private schools, with 4 (100.0% in the age bracket) enrolled. Conversely, the age group of 10 to 14 year olds has the lowest likelihood of being enrolled in a private school, with 55 (100.0% in the age bracket) attending a public institution.
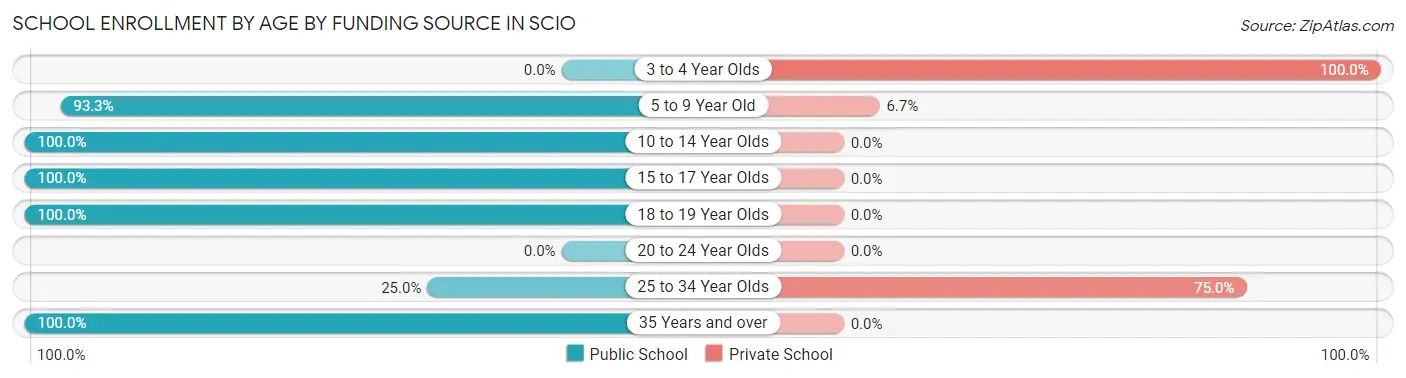
| Age Bracket | Public School | Private School |
| 3 to 4 Year Olds | 0 (0.0%) | 4 (100.0%) |
| 5 to 9 Year Old | 42 (93.3%) | 3 (6.7%) |
| 10 to 14 Year Olds | 55 (100.0%) | 0 (0.0%) |
| 15 to 17 Year Olds | 15 (100.0%) | 0 (0.0%) |
| 18 to 19 Year Olds | 11 (100.0%) | 0 (0.0%) |
| 20 to 24 Year Olds | 0 (0.0%) | 0 (0.0%) |
| 25 to 34 Year Olds | 2 (25.0%) | 6 (75.0%) |
| 35 Years and over | 22 (100.0%) | 0 (0.0%) |
| Total | 147 (91.9%) | 13 (8.1%) |
Educational Attainment by Field of Study in Scio
Education (14 | 25.0%), science & technology (11 | 19.6%), business (7 | 12.5%), psychology (6 | 10.7%), and computers & mathematics (5 | 8.9%) are the most common fields of study among 56 individuals in Scio who have obtained a bachelor's degree or higher.
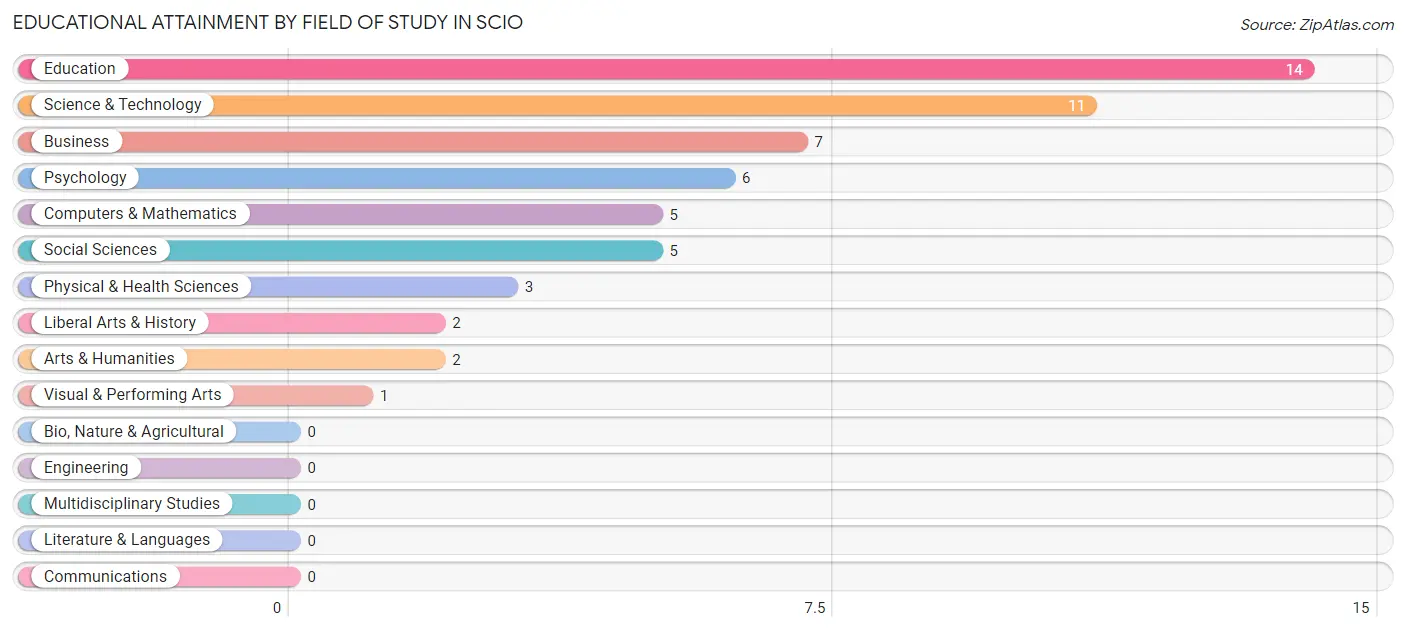
| Field of Study | # Graduates | % Graduates |
| Computers & Mathematics | 5 | 8.9% |
| Bio, Nature & Agricultural | 0 | 0.0% |
| Physical & Health Sciences | 3 | 5.4% |
| Psychology | 6 | 10.7% |
| Social Sciences | 5 | 8.9% |
| Engineering | 0 | 0.0% |
| Multidisciplinary Studies | 0 | 0.0% |
| Science & Technology | 11 | 19.6% |
| Business | 7 | 12.5% |
| Education | 14 | 25.0% |
| Literature & Languages | 0 | 0.0% |
| Liberal Arts & History | 2 | 3.6% |
| Visual & Performing Arts | 1 | 1.8% |
| Communications | 0 | 0.0% |
| Arts & Humanities | 2 | 3.6% |
| Total | 56 | 100.0% |
Transportation & Commute in Scio
Vehicle Availability by Sex in Scio
The most prevalent vehicle ownership categories in Scio are males with 2 vehicles (106, accounting for 51.0%) and females with 2 vehicles (71, making up 63.5%).
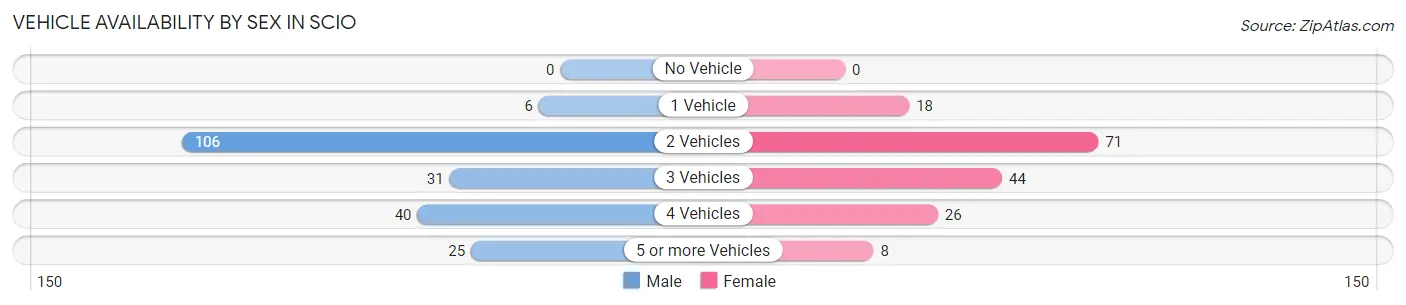
| Vehicles Available | Male | Female |
| No Vehicle | 0 (0.0%) | 0 (0.0%) |
| 1 Vehicle | 6 (2.9%) | 18 (10.8%) |
| 2 Vehicles | 106 (51.0%) | 71 (42.5%) |
| 3 Vehicles | 31 (14.9%) | 44 (26.4%) |
| 4 Vehicles | 40 (19.2%) | 26 (15.6%) |
| 5 or more Vehicles | 25 (12.0%) | 8 (4.8%) |
| Total | 208 (100.0%) | 167 (100.0%) |
Commute Time in Scio
The most frequently occuring commute durations in Scio are 30 to 34 minutes (61 commuters, 18.4%), 45 to 59 minutes (58 commuters, 17.5%), and 15 to 19 minutes (35 commuters, 10.5%).
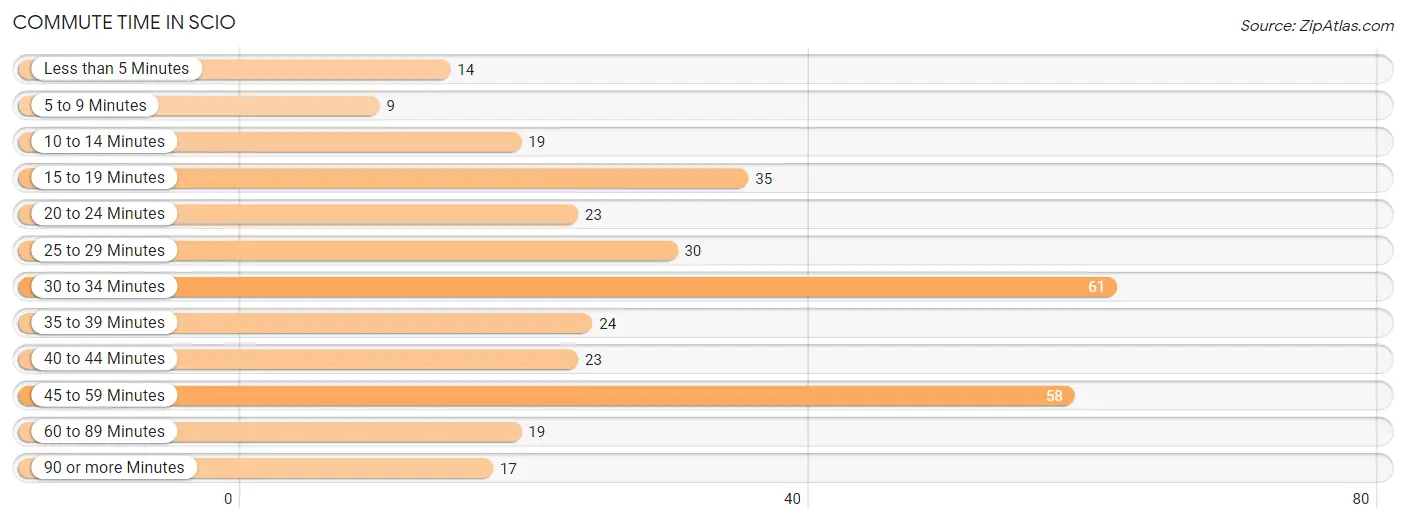
| Commute Time | # Commuters | % Commuters |
| Less than 5 Minutes | 14 | 4.2% |
| 5 to 9 Minutes | 9 | 2.7% |
| 10 to 14 Minutes | 19 | 5.7% |
| 15 to 19 Minutes | 35 | 10.5% |
| 20 to 24 Minutes | 23 | 6.9% |
| 25 to 29 Minutes | 30 | 9.0% |
| 30 to 34 Minutes | 61 | 18.4% |
| 35 to 39 Minutes | 24 | 7.2% |
| 40 to 44 Minutes | 23 | 6.9% |
| 45 to 59 Minutes | 58 | 17.5% |
| 60 to 89 Minutes | 19 | 5.7% |
| 90 or more Minutes | 17 | 5.1% |
Commute Time by Sex in Scio
The most common commute times in Scio are 15 to 19 minutes (25 commuters, 13.1%) for males and 30 to 34 minutes (36 commuters, 25.5%) for females.
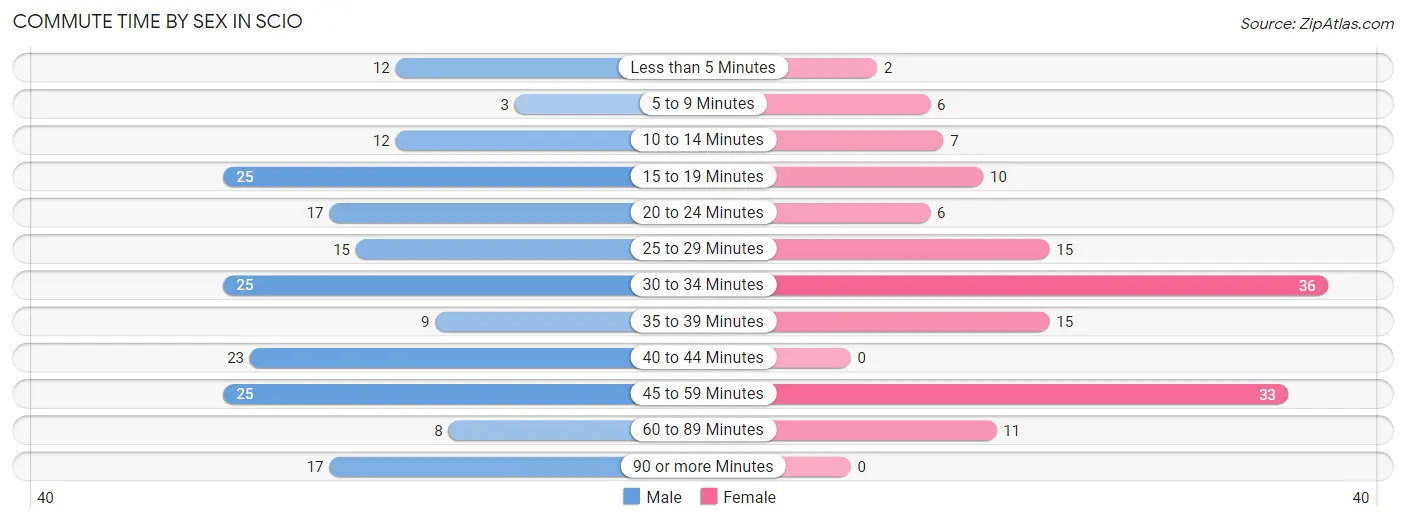
| Commute Time | Male | Female |
| Less than 5 Minutes | 12 (6.3%) | 2 (1.4%) |
| 5 to 9 Minutes | 3 (1.6%) | 6 (4.3%) |
| 10 to 14 Minutes | 12 (6.3%) | 7 (5.0%) |
| 15 to 19 Minutes | 25 (13.1%) | 10 (7.1%) |
| 20 to 24 Minutes | 17 (8.9%) | 6 (4.3%) |
| 25 to 29 Minutes | 15 (7.9%) | 15 (10.6%) |
| 30 to 34 Minutes | 25 (13.1%) | 36 (25.5%) |
| 35 to 39 Minutes | 9 (4.7%) | 15 (10.6%) |
| 40 to 44 Minutes | 23 (12.0%) | 0 (0.0%) |
| 45 to 59 Minutes | 25 (13.1%) | 33 (23.4%) |
| 60 to 89 Minutes | 8 (4.2%) | 11 (7.8%) |
| 90 or more Minutes | 17 (8.9%) | 0 (0.0%) |
Time of Departure to Work by Sex in Scio
The most frequent times of departure to work in Scio are 6:30 AM to 6:59 AM (41, 21.5%) for males and 6:00 AM to 6:29 AM (42, 29.8%) for females.
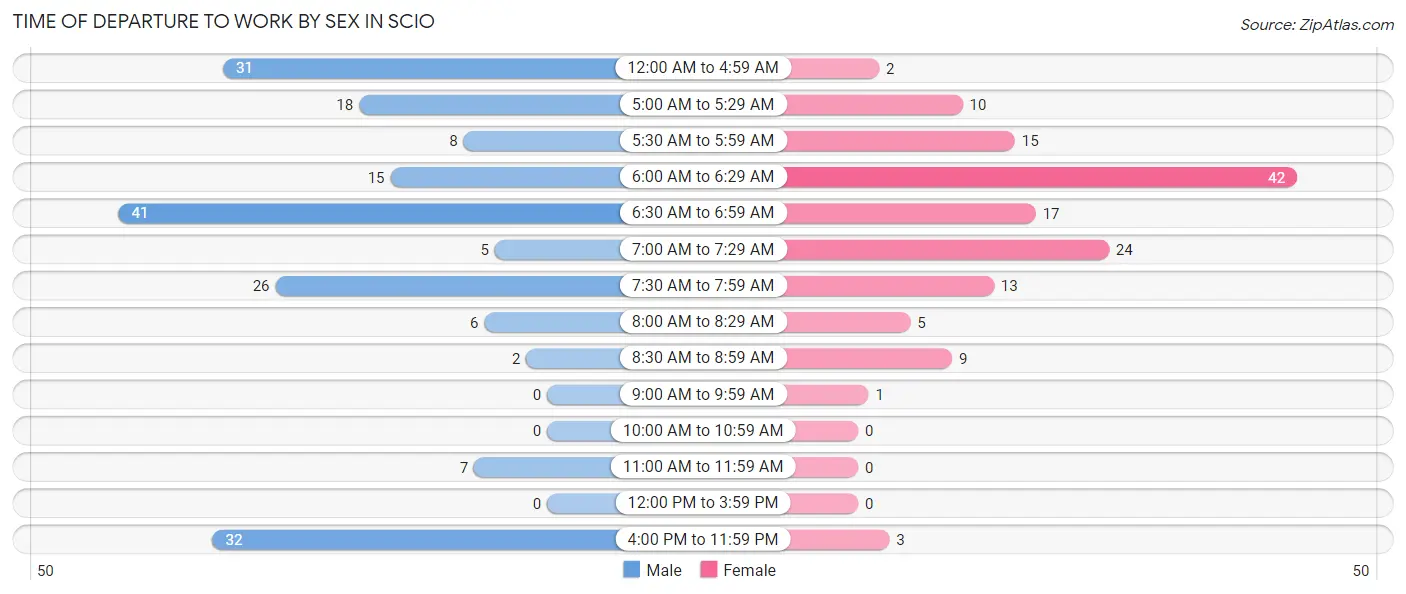
| Time of Departure | Male | Female |
| 12:00 AM to 4:59 AM | 31 (16.2%) | 2 (1.4%) |
| 5:00 AM to 5:29 AM | 18 (9.4%) | 10 (7.1%) |
| 5:30 AM to 5:59 AM | 8 (4.2%) | 15 (10.6%) |
| 6:00 AM to 6:29 AM | 15 (7.9%) | 42 (29.8%) |
| 6:30 AM to 6:59 AM | 41 (21.5%) | 17 (12.1%) |
| 7:00 AM to 7:29 AM | 5 (2.6%) | 24 (17.0%) |
| 7:30 AM to 7:59 AM | 26 (13.6%) | 13 (9.2%) |
| 8:00 AM to 8:29 AM | 6 (3.1%) | 5 (3.5%) |
| 8:30 AM to 8:59 AM | 2 (1.1%) | 9 (6.4%) |
| 9:00 AM to 9:59 AM | 0 (0.0%) | 1 (0.7%) |
| 10:00 AM to 10:59 AM | 0 (0.0%) | 0 (0.0%) |
| 11:00 AM to 11:59 AM | 7 (3.7%) | 0 (0.0%) |
| 12:00 PM to 3:59 PM | 0 (0.0%) | 0 (0.0%) |
| 4:00 PM to 11:59 PM | 32 (16.8%) | 3 (2.1%) |
| Total | 191 (100.0%) | 141 (100.0%) |
Housing Occupancy in Scio
Occupancy by Ownership in Scio
Of the total 331 dwellings in Scio, owner-occupied units account for 230 (69.5%), while renter-occupied units make up 101 (30.5%).
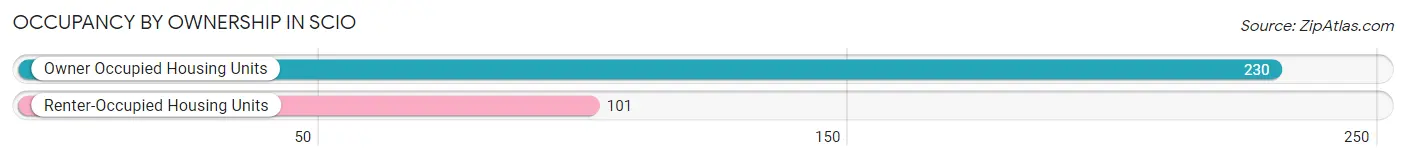
| Occupancy | # Housing Units | % Housing Units |
| Owner Occupied Housing Units | 230 | 69.5% |
| Renter-Occupied Housing Units | 101 | 30.5% |
| Total Occupied Housing Units | 331 | 100.0% |
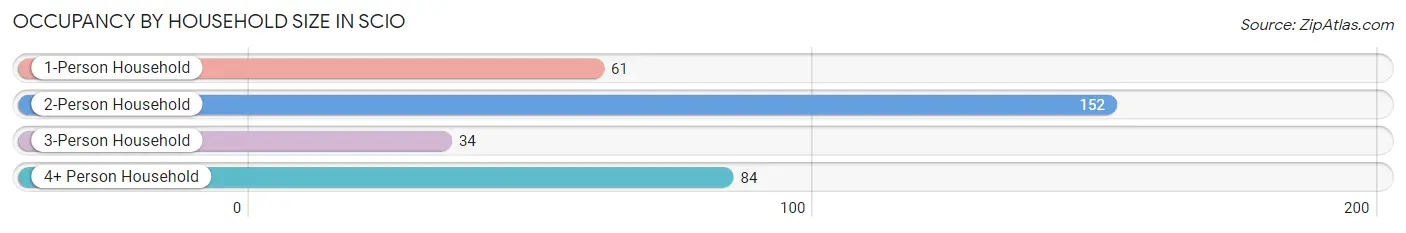
Occupancy by Household Size in Scio
| Household Size | # Housing Units | % Housing Units |
| 1-Person Household | 61 | 18.4% |
| 2-Person Household | 152 | 45.9% |
| 3-Person Household | 34 | 10.3% |
| 4+ Person Household | 84 | 25.4% |
| Total Housing Units | 331 | 100.0% |
Occupancy by Ownership by Household Size in Scio
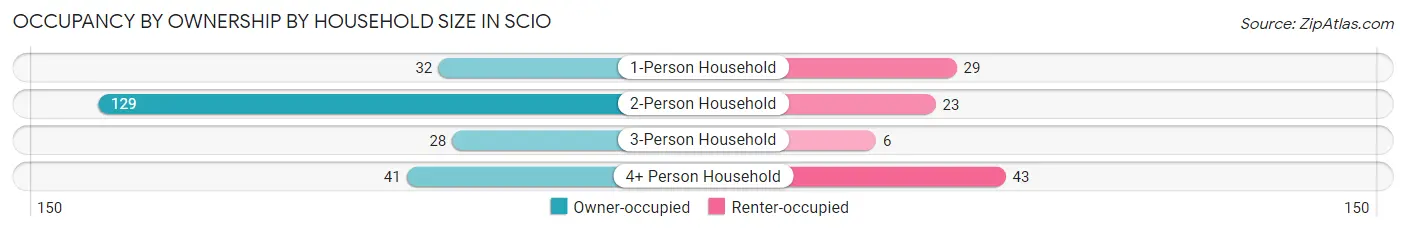
| Household Size | Owner-occupied | Renter-occupied |
| 1-Person Household | 32 (52.5%) | 29 (47.5%) |
| 2-Person Household | 129 (84.9%) | 23 (15.1%) |
| 3-Person Household | 28 (82.4%) | 6 (17.6%) |
| 4+ Person Household | 41 (48.8%) | 43 (51.2%) |
| Total Housing Units | 230 (69.5%) | 101 (30.5%) |
Occupancy by Educational Attainment in Scio
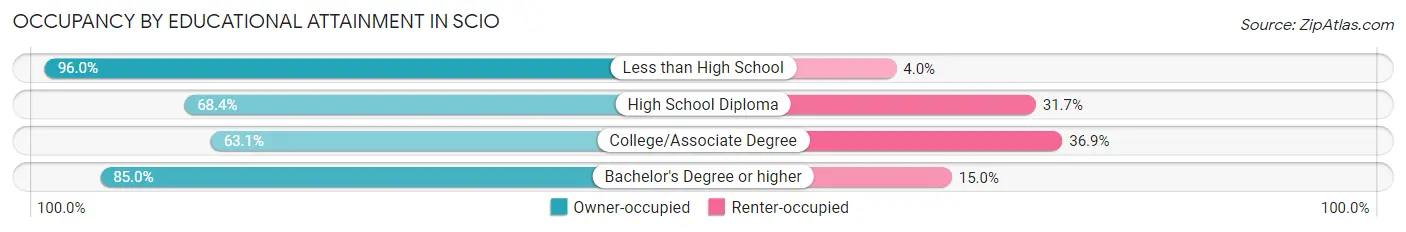
| Household Size | Owner-occupied | Renter-occupied |
| Less than High School | 24 (96.0%) | 1 (4.0%) |
| High School Diploma | 54 (68.3%) | 25 (31.7%) |
| College/Associate Degree | 118 (63.1%) | 69 (36.9%) |
| Bachelor's Degree or higher | 34 (85.0%) | 6 (15.0%) |
Occupancy by Age of Householder in Scio
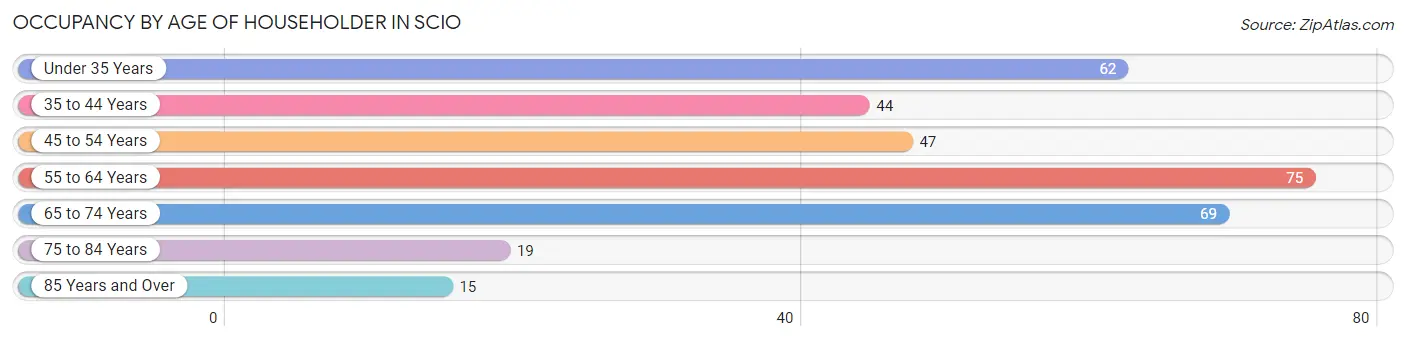
| Age Bracket | # Households | % Households |
| Under 35 Years | 62 | 18.7% |
| 35 to 44 Years | 44 | 13.3% |
| 45 to 54 Years | 47 | 14.2% |
| 55 to 64 Years | 75 | 22.7% |
| 65 to 74 Years | 69 | 20.8% |
| 75 to 84 Years | 19 | 5.7% |
| 85 Years and Over | 15 | 4.5% |
| Total | 331 | 100.0% |
Housing Finances in Scio
Median Income by Occupancy in Scio
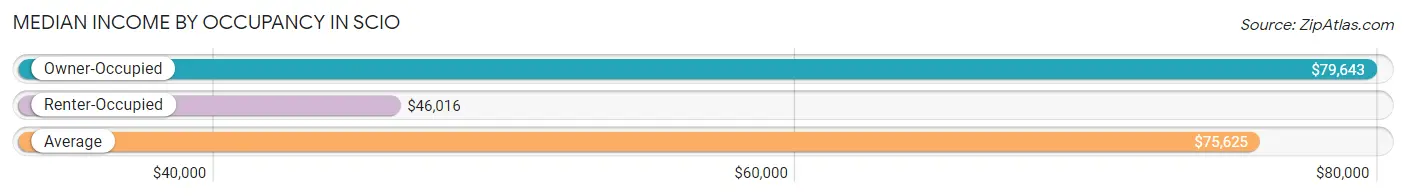
| Occupancy Type | # Households | Median Income |
| Owner-Occupied | 230 (69.5%) | $79,643 |
| Renter-Occupied | 101 (30.5%) | $46,016 |
| Average | 331 (100.0%) | $75,625 |
Occupancy by Householder Income Bracket in Scio
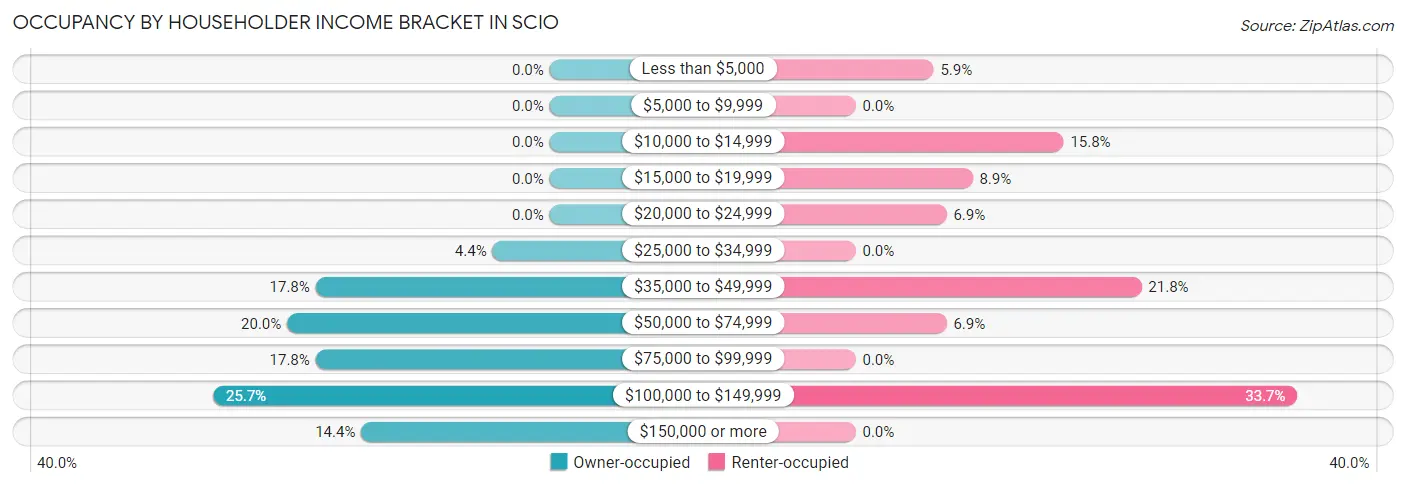
| Income Bracket | Owner-occupied | Renter-occupied |
| Less than $5,000 | 0 (0.0%) | 6 (5.9%) |
| $5,000 to $9,999 | 0 (0.0%) | 0 (0.0%) |
| $10,000 to $14,999 | 0 (0.0%) | 16 (15.8%) |
| $15,000 to $19,999 | 0 (0.0%) | 9 (8.9%) |
| $20,000 to $24,999 | 0 (0.0%) | 7 (6.9%) |
| $25,000 to $34,999 | 10 (4.3%) | 0 (0.0%) |
| $35,000 to $49,999 | 41 (17.8%) | 22 (21.8%) |
| $50,000 to $74,999 | 46 (20.0%) | 7 (6.9%) |
| $75,000 to $99,999 | 41 (17.8%) | 0 (0.0%) |
| $100,000 to $149,999 | 59 (25.7%) | 34 (33.7%) |
| $150,000 or more | 33 (14.3%) | 0 (0.0%) |
| Total | 230 (100.0%) | 101 (100.0%) |
Monthly Housing Cost Tiers in Scio
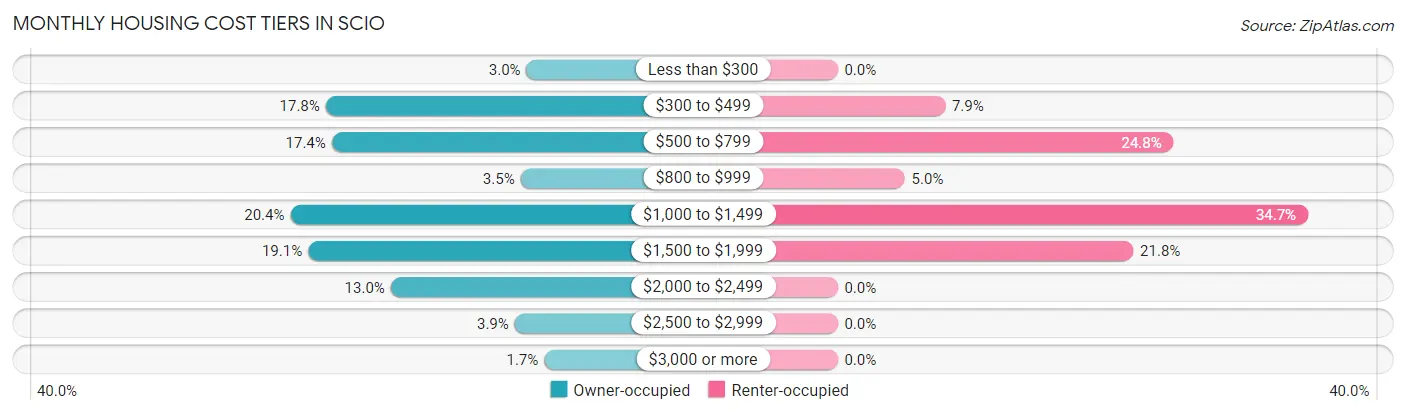
| Monthly Cost | Owner-occupied | Renter-occupied |
| Less than $300 | 7 (3.0%) | 0 (0.0%) |
| $300 to $499 | 41 (17.8%) | 8 (7.9%) |
| $500 to $799 | 40 (17.4%) | 25 (24.7%) |
| $800 to $999 | 8 (3.5%) | 5 (5.0%) |
| $1,000 to $1,499 | 47 (20.4%) | 35 (34.6%) |
| $1,500 to $1,999 | 44 (19.1%) | 22 (21.8%) |
| $2,000 to $2,499 | 30 (13.0%) | 0 (0.0%) |
| $2,500 to $2,999 | 9 (3.9%) | 0 (0.0%) |
| $3,000 or more | 4 (1.7%) | 0 (0.0%) |
| Total | 230 (100.0%) | 101 (100.0%) |
Physical Housing Characteristics in Scio
Housing Structures in Scio
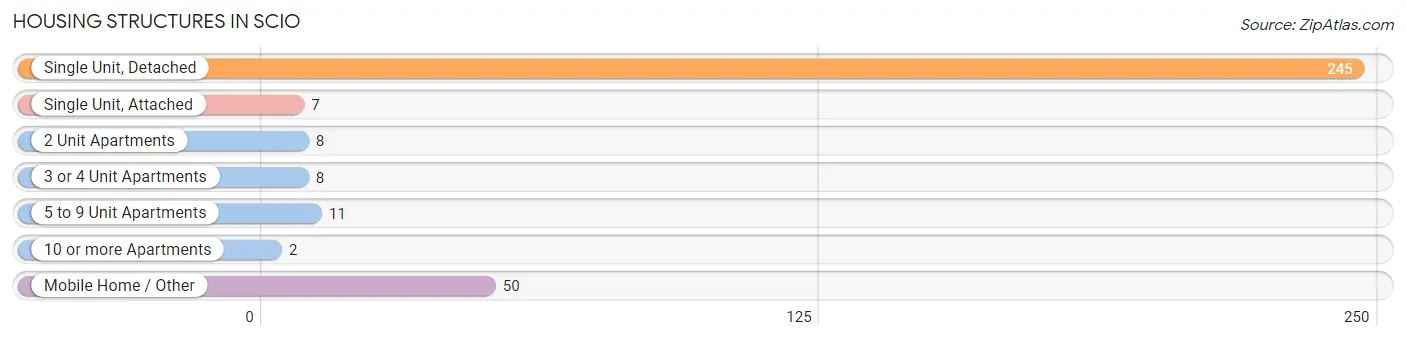
| Structure Type | # Housing Units | % Housing Units |
| Single Unit, Detached | 245 | 74.0% |
| Single Unit, Attached | 7 | 2.1% |
| 2 Unit Apartments | 8 | 2.4% |
| 3 or 4 Unit Apartments | 8 | 2.4% |
| 5 to 9 Unit Apartments | 11 | 3.3% |
| 10 or more Apartments | 2 | 0.6% |
| Mobile Home / Other | 50 | 15.1% |
| Total | 331 | 100.0% |
Housing Structures by Occupancy in Scio
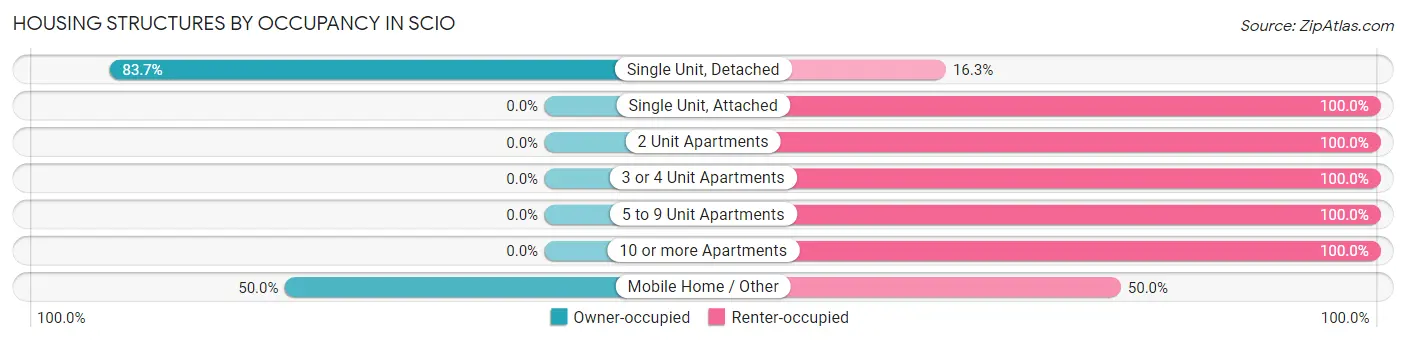
| Structure Type | Owner-occupied | Renter-occupied |
| Single Unit, Detached | 205 (83.7%) | 40 (16.3%) |
| Single Unit, Attached | 0 (0.0%) | 7 (100.0%) |
| 2 Unit Apartments | 0 (0.0%) | 8 (100.0%) |
| 3 or 4 Unit Apartments | 0 (0.0%) | 8 (100.0%) |
| 5 to 9 Unit Apartments | 0 (0.0%) | 11 (100.0%) |
| 10 or more Apartments | 0 (0.0%) | 2 (100.0%) |
| Mobile Home / Other | 25 (50.0%) | 25 (50.0%) |
| Total | 230 (69.5%) | 101 (30.5%) |
Housing Structures by Number of Rooms in Scio
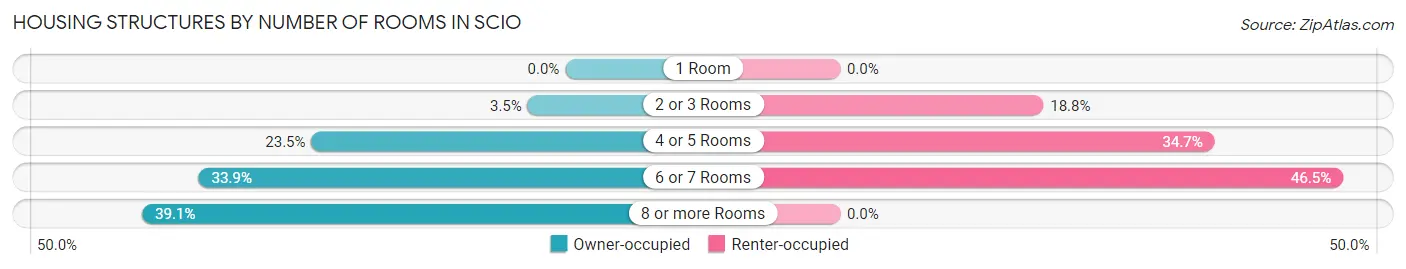
| Number of Rooms | Owner-occupied | Renter-occupied |
| 1 Room | 0 (0.0%) | 0 (0.0%) |
| 2 or 3 Rooms | 8 (3.5%) | 19 (18.8%) |
| 4 or 5 Rooms | 54 (23.5%) | 35 (34.6%) |
| 6 or 7 Rooms | 78 (33.9%) | 47 (46.5%) |
| 8 or more Rooms | 90 (39.1%) | 0 (0.0%) |
| Total | 230 (100.0%) | 101 (100.0%) |
Housing Structure by Heating Type in Scio
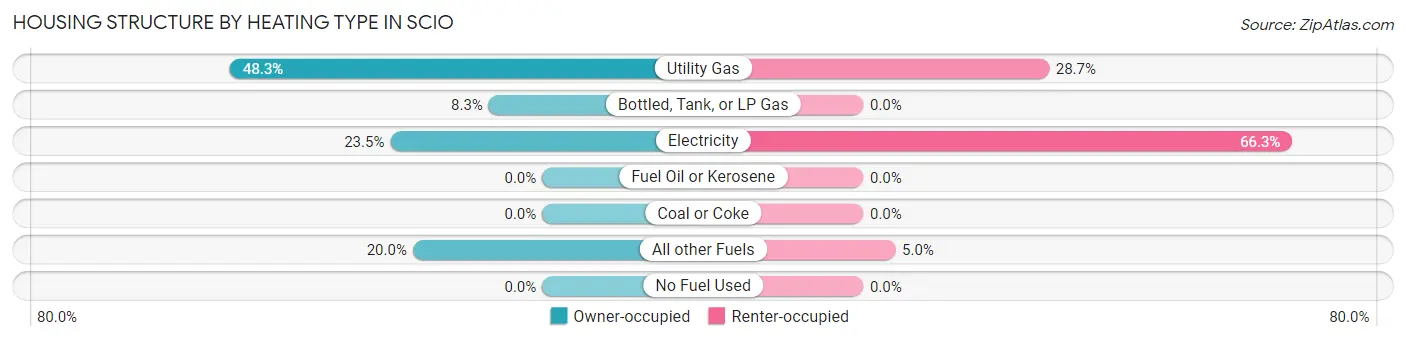
| Heating Type | Owner-occupied | Renter-occupied |
| Utility Gas | 111 (48.3%) | 29 (28.7%) |
| Bottled, Tank, or LP Gas | 19 (8.3%) | 0 (0.0%) |
| Electricity | 54 (23.5%) | 67 (66.3%) |
| Fuel Oil or Kerosene | 0 (0.0%) | 0 (0.0%) |
| Coal or Coke | 0 (0.0%) | 0 (0.0%) |
| All other Fuels | 46 (20.0%) | 5 (5.0%) |
| No Fuel Used | 0 (0.0%) | 0 (0.0%) |
| Total | 230 (100.0%) | 101 (100.0%) |
Household Vehicle Usage in Scio
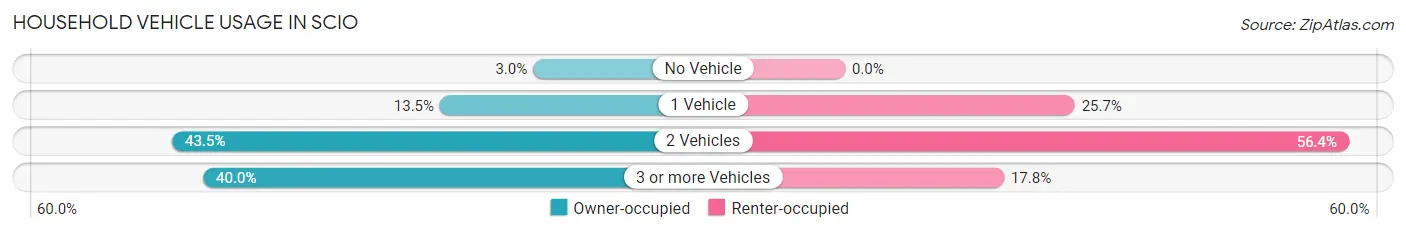
| Vehicles per Household | Owner-occupied | Renter-occupied |
| No Vehicle | 7 (3.0%) | 0 (0.0%) |
| 1 Vehicle | 31 (13.5%) | 26 (25.7%) |
| 2 Vehicles | 100 (43.5%) | 57 (56.4%) |
| 3 or more Vehicles | 92 (40.0%) | 18 (17.8%) |
| Total | 230 (100.0%) | 101 (100.0%) |
Real Estate & Mortgages in Scio
Real Estate and Mortgage Overview in Scio
| Characteristic | Without Mortgage | With Mortgage |
| Housing Units | 90 | 140 |
| Median Property Value | $288,400 | $323,300 |
| Median Household Income | $76,250 | $31 |
| Monthly Housing Costs | $488 | $4 |
| Real Estate Taxes | $2,130 | $0 |
Property Value by Mortgage Status in Scio
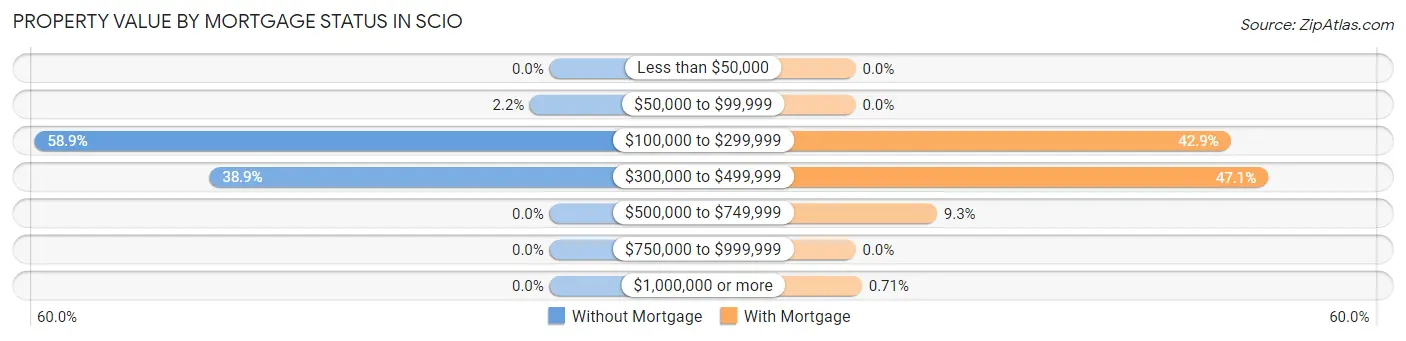
| Property Value | Without Mortgage | With Mortgage |
| Less than $50,000 | 0 (0.0%) | 0 (0.0%) |
| $50,000 to $99,999 | 2 (2.2%) | 0 (0.0%) |
| $100,000 to $299,999 | 53 (58.9%) | 60 (42.9%) |
| $300,000 to $499,999 | 35 (38.9%) | 66 (47.1%) |
| $500,000 to $749,999 | 0 (0.0%) | 13 (9.3%) |
| $750,000 to $999,999 | 0 (0.0%) | 0 (0.0%) |
| $1,000,000 or more | 0 (0.0%) | 1 (0.7%) |
| Total | 90 (100.0%) | 140 (100.0%) |
Household Income by Mortgage Status in Scio
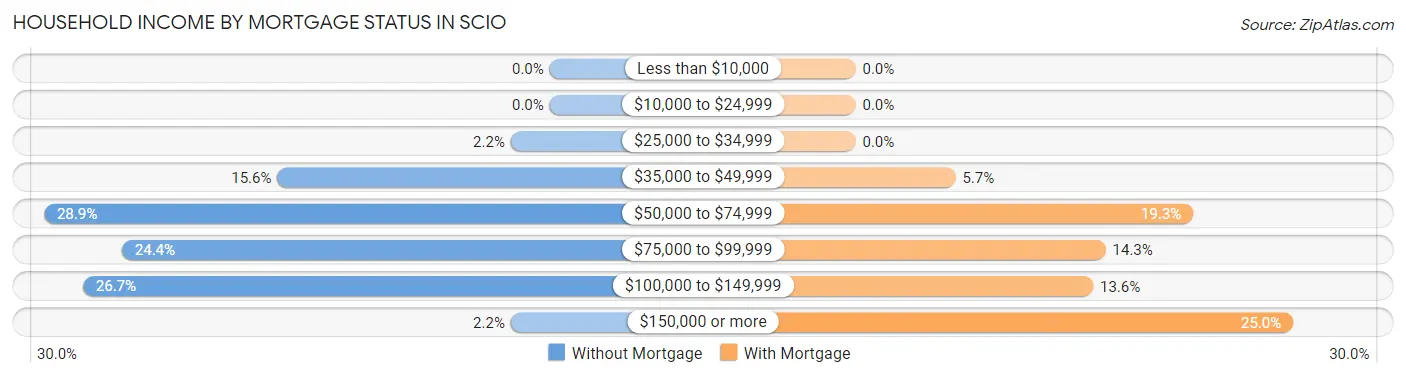
| Household Income | Without Mortgage | With Mortgage |
| Less than $10,000 | 0 (0.0%) | 0 (0.0%) |
| $10,000 to $24,999 | 0 (0.0%) | 0 (0.0%) |
| $25,000 to $34,999 | 2 (2.2%) | 0 (0.0%) |
| $35,000 to $49,999 | 14 (15.6%) | 8 (5.7%) |
| $50,000 to $74,999 | 26 (28.9%) | 27 (19.3%) |
| $75,000 to $99,999 | 22 (24.4%) | 20 (14.3%) |
| $100,000 to $149,999 | 24 (26.7%) | 19 (13.6%) |
| $150,000 or more | 2 (2.2%) | 35 (25.0%) |
| Total | 90 (100.0%) | 140 (100.0%) |
Property Value to Household Income Ratio in Scio
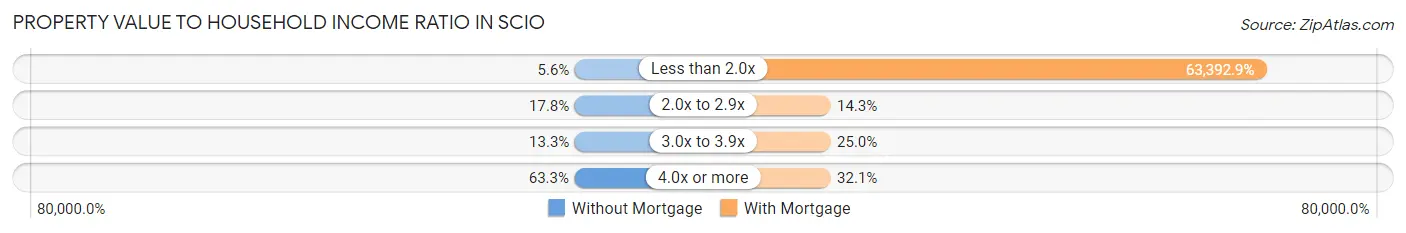
| Value-to-Income Ratio | Without Mortgage | With Mortgage |
| Less than 2.0x | 5 (5.6%) | 88,750 (63,392.9%) |
| 2.0x to 2.9x | 16 (17.8%) | 20 (14.3%) |
| 3.0x to 3.9x | 12 (13.3%) | 35 (25.0%) |
| 4.0x or more | 57 (63.3%) | 45 (32.1%) |
| Total | 90 (100.0%) | 140 (100.0%) |
Real Estate Taxes by Mortgage Status in Scio
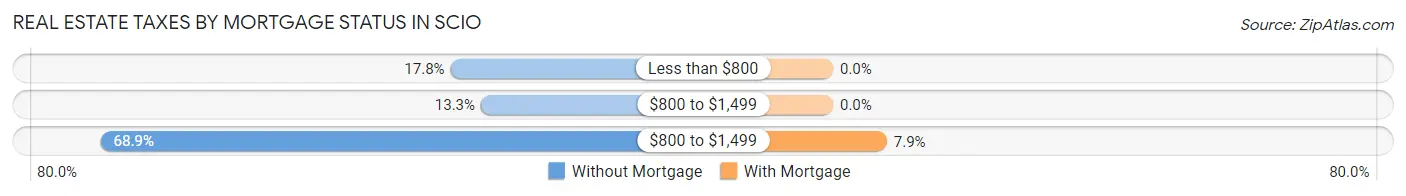
| Property Taxes | Without Mortgage | With Mortgage |
| Less than $800 | 16 (17.8%) | 0 (0.0%) |
| $800 to $1,499 | 12 (13.3%) | 0 (0.0%) |
| $800 to $1,499 | 62 (68.9%) | 11 (7.9%) |
| Total | 90 (100.0%) | 140 (100.0%) |
Health & Disability in Scio
Health Insurance Coverage by Age in Scio
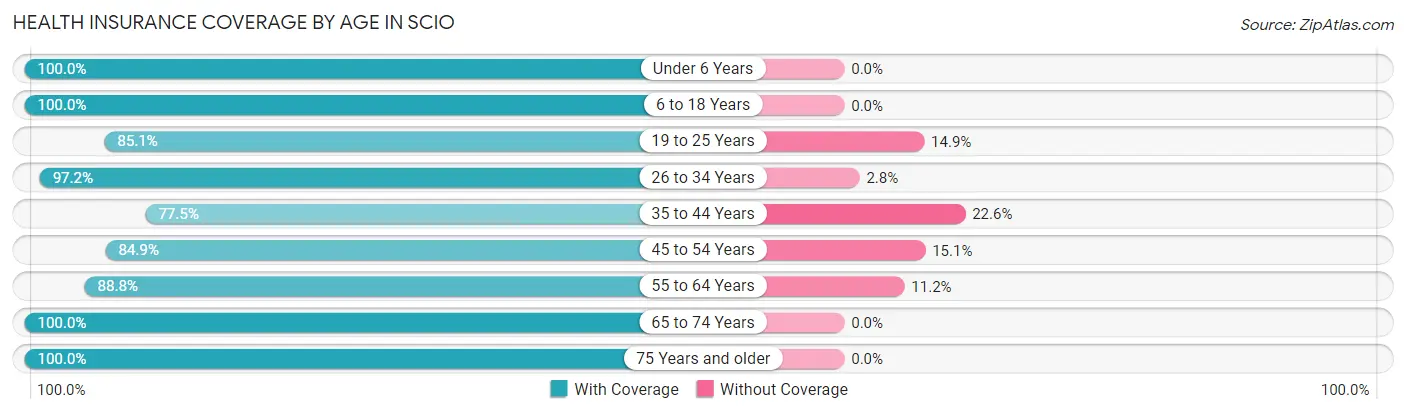
| Age Bracket | With Coverage | Without Coverage |
| Under 6 Years | 101 (100.0%) | 0 (0.0%) |
| 6 to 18 Years | 132 (100.0%) | 0 (0.0%) |
| 19 to 25 Years | 40 (85.1%) | 7 (14.9%) |
| 26 to 34 Years | 103 (97.2%) | 3 (2.8%) |
| 35 to 44 Years | 79 (77.4%) | 23 (22.6%) |
| 45 to 54 Years | 90 (84.9%) | 16 (15.1%) |
| 55 to 64 Years | 95 (88.8%) | 12 (11.2%) |
| 65 to 74 Years | 108 (100.0%) | 0 (0.0%) |
| 75 Years and older | 51 (100.0%) | 0 (0.0%) |
| Total | 799 (92.9%) | 61 (7.1%) |
Health Insurance Coverage by Citizenship Status in Scio
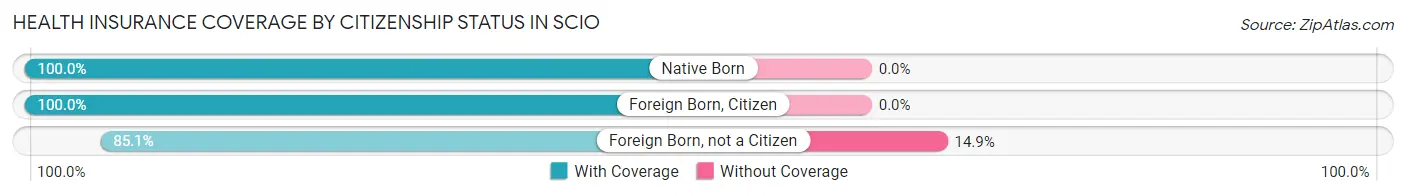
| Citizenship Status | With Coverage | Without Coverage |
| Native Born | 101 (100.0%) | 0 (0.0%) |
| Foreign Born, Citizen | 132 (100.0%) | 0 (0.0%) |
| Foreign Born, not a Citizen | 40 (85.1%) | 7 (14.9%) |
Health Insurance Coverage by Household Income in Scio
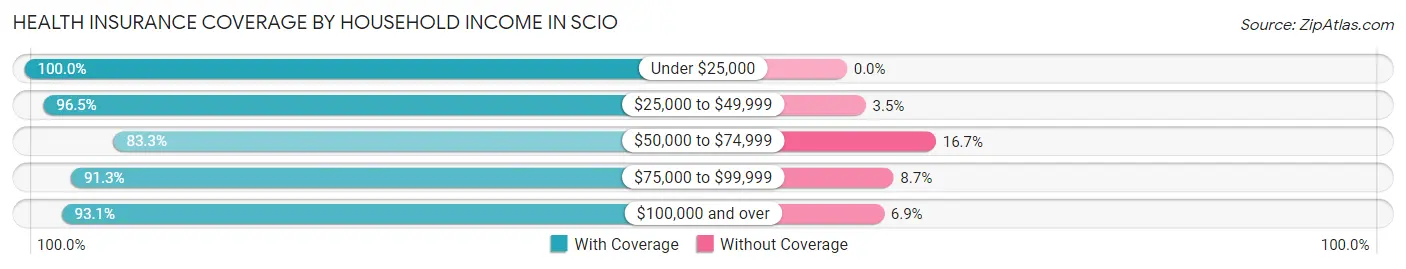
| Household Income | With Coverage | Without Coverage |
| Under $25,000 | 67 (100.0%) | 0 (0.0%) |
| $25,000 to $49,999 | 192 (96.5%) | 7 (3.5%) |
| $50,000 to $74,999 | 90 (83.3%) | 18 (16.7%) |
| $75,000 to $99,999 | 115 (91.3%) | 11 (8.7%) |
| $100,000 and over | 335 (93.1%) | 25 (6.9%) |
Public vs Private Health Insurance Coverage by Age in Scio
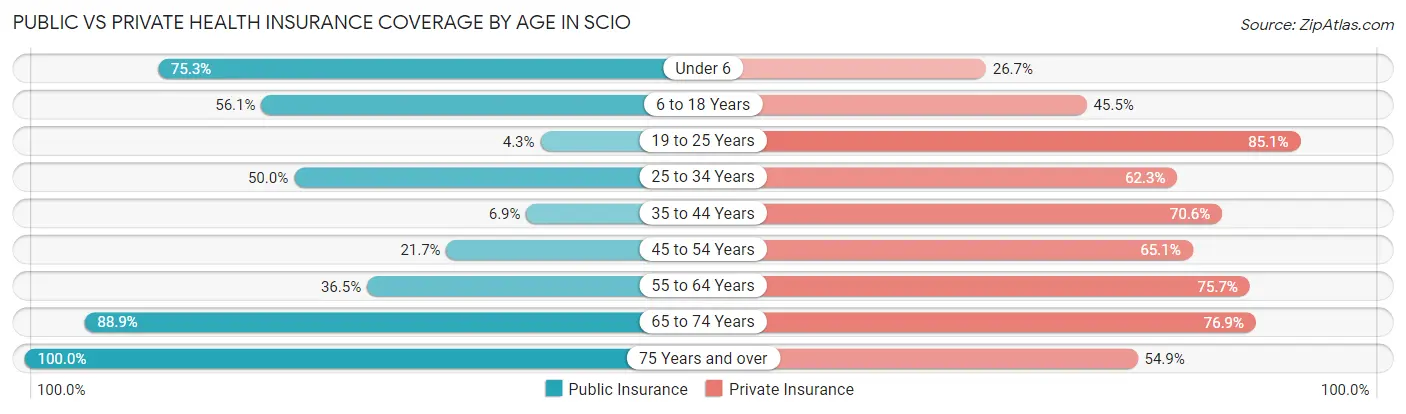
| Age Bracket | Public Insurance | Private Insurance |
| Under 6 | 76 (75.2%) | 27 (26.7%) |
| 6 to 18 Years | 74 (56.1%) | 60 (45.5%) |
| 19 to 25 Years | 2 (4.3%) | 40 (85.1%) |
| 25 to 34 Years | 53 (50.0%) | 66 (62.3%) |
| 35 to 44 Years | 7 (6.9%) | 72 (70.6%) |
| 45 to 54 Years | 23 (21.7%) | 69 (65.1%) |
| 55 to 64 Years | 39 (36.4%) | 81 (75.7%) |
| 65 to 74 Years | 96 (88.9%) | 83 (76.8%) |
| 75 Years and over | 51 (100.0%) | 28 (54.9%) |
| Total | 421 (48.9%) | 526 (61.2%) |
Disability Status by Sex by Age in Scio
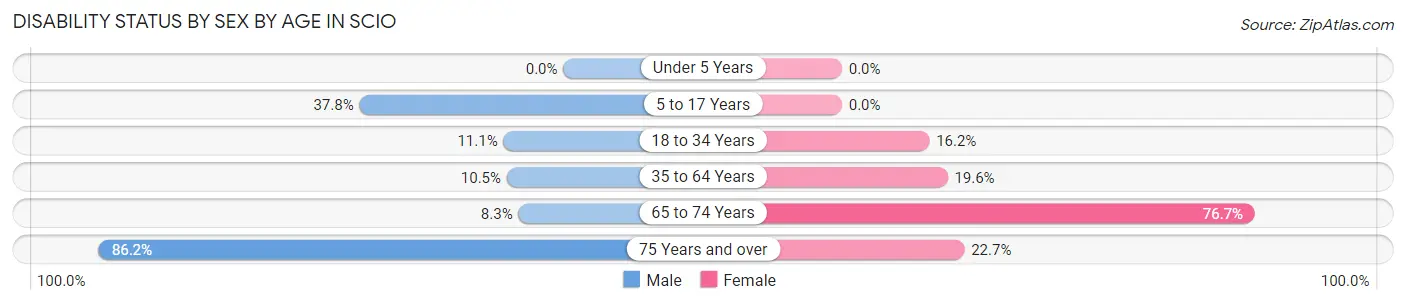
| Age Bracket | Male | Female |
| Under 5 Years | 0 (0.0%) | 0 (0.0%) |
| 5 to 17 Years | 28 (37.8%) | 0 (0.0%) |
| 18 to 34 Years | 10 (11.1%) | 12 (16.2%) |
| 35 to 64 Years | 17 (10.5%) | 30 (19.6%) |
| 65 to 74 Years | 4 (8.3%) | 46 (76.7%) |
| 75 Years and over | 25 (86.2%) | 5 (22.7%) |
Disability Class by Sex by Age in Scio
Disability Class: Hearing Difficulty
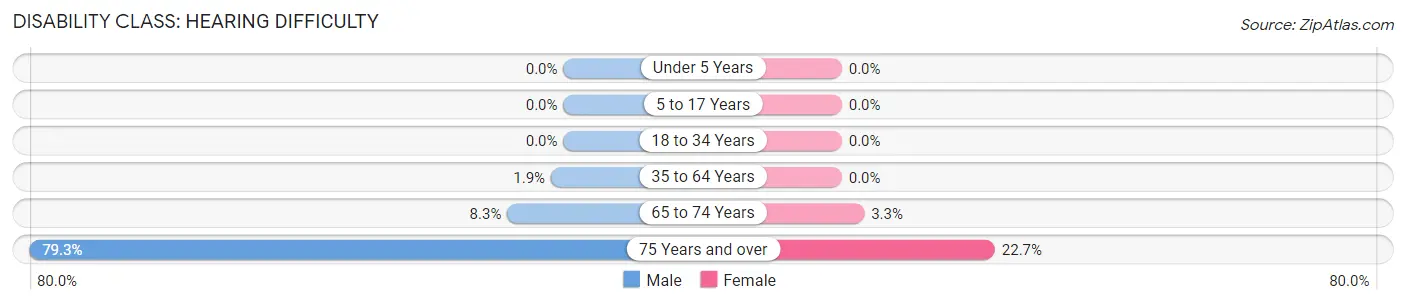
| Age Bracket | Male | Female |
| Under 5 Years | 0 (0.0%) | 0 (0.0%) |
| 5 to 17 Years | 0 (0.0%) | 0 (0.0%) |
| 18 to 34 Years | 0 (0.0%) | 0 (0.0%) |
| 35 to 64 Years | 3 (1.8%) | 0 (0.0%) |
| 65 to 74 Years | 4 (8.3%) | 2 (3.3%) |
| 75 Years and over | 23 (79.3%) | 5 (22.7%) |
Disability Class: Vision Difficulty
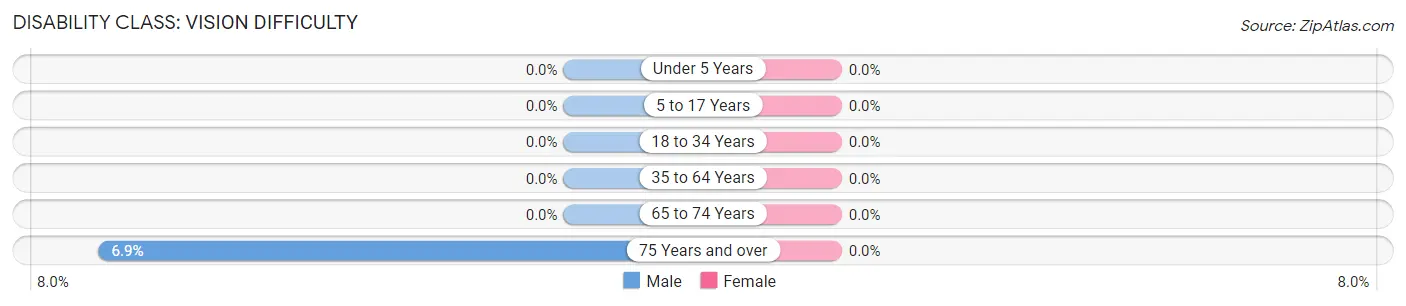
| Age Bracket | Male | Female |
| Under 5 Years | 0 (0.0%) | 0 (0.0%) |
| 5 to 17 Years | 0 (0.0%) | 0 (0.0%) |
| 18 to 34 Years | 0 (0.0%) | 0 (0.0%) |
| 35 to 64 Years | 0 (0.0%) | 0 (0.0%) |
| 65 to 74 Years | 0 (0.0%) | 0 (0.0%) |
| 75 Years and over | 2 (6.9%) | 0 (0.0%) |
Disability Class: Cognitive Difficulty
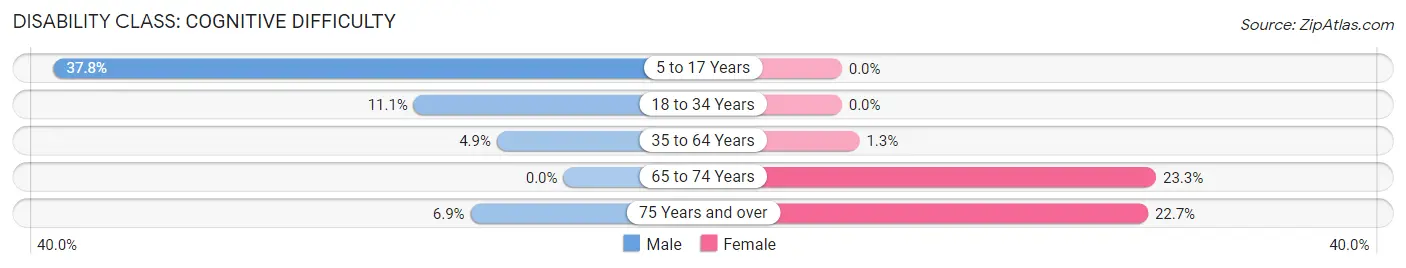
| Age Bracket | Male | Female |
| 5 to 17 Years | 28 (37.8%) | 0 (0.0%) |
| 18 to 34 Years | 10 (11.1%) | 0 (0.0%) |
| 35 to 64 Years | 8 (4.9%) | 2 (1.3%) |
| 65 to 74 Years | 0 (0.0%) | 14 (23.3%) |
| 75 Years and over | 2 (6.9%) | 5 (22.7%) |
Disability Class: Ambulatory Difficulty
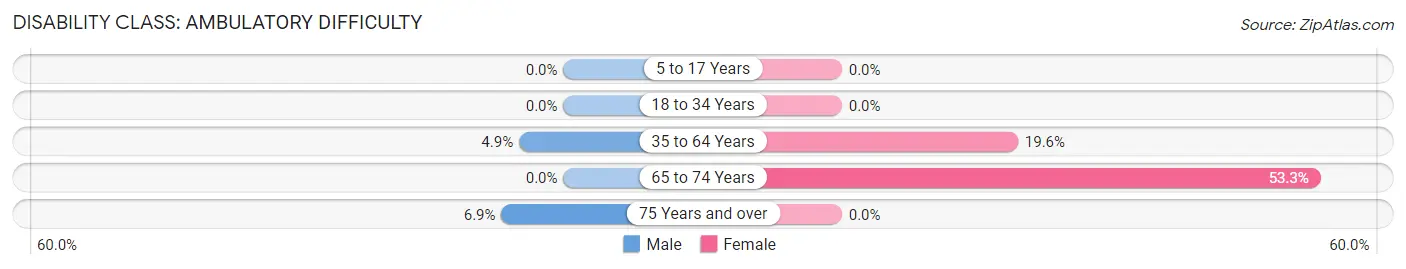
| Age Bracket | Male | Female |
| 5 to 17 Years | 0 (0.0%) | 0 (0.0%) |
| 18 to 34 Years | 0 (0.0%) | 0 (0.0%) |
| 35 to 64 Years | 8 (4.9%) | 30 (19.6%) |
| 65 to 74 Years | 0 (0.0%) | 32 (53.3%) |
| 75 Years and over | 2 (6.9%) | 0 (0.0%) |
Disability Class: Self-Care Difficulty
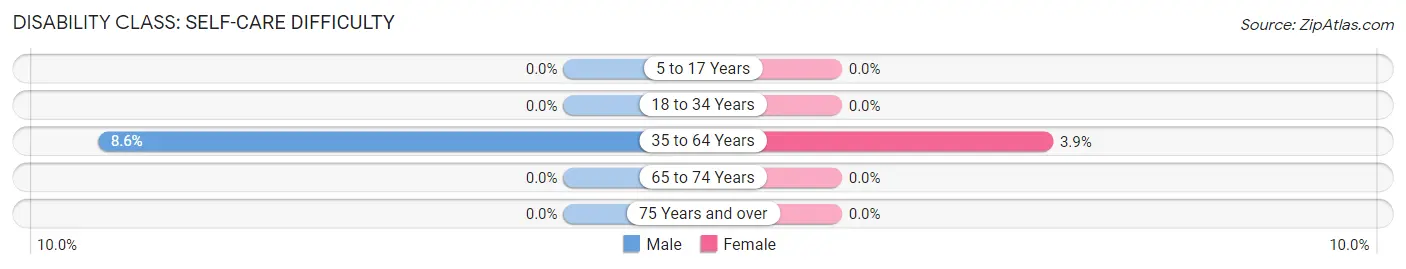
| Age Bracket | Male | Female |
| 5 to 17 Years | 0 (0.0%) | 0 (0.0%) |
| 18 to 34 Years | 0 (0.0%) | 0 (0.0%) |
| 35 to 64 Years | 14 (8.6%) | 6 (3.9%) |
| 65 to 74 Years | 0 (0.0%) | 0 (0.0%) |
| 75 Years and over | 0 (0.0%) | 0 (0.0%) |
Technology Access in Scio
Computing Device Access in Scio
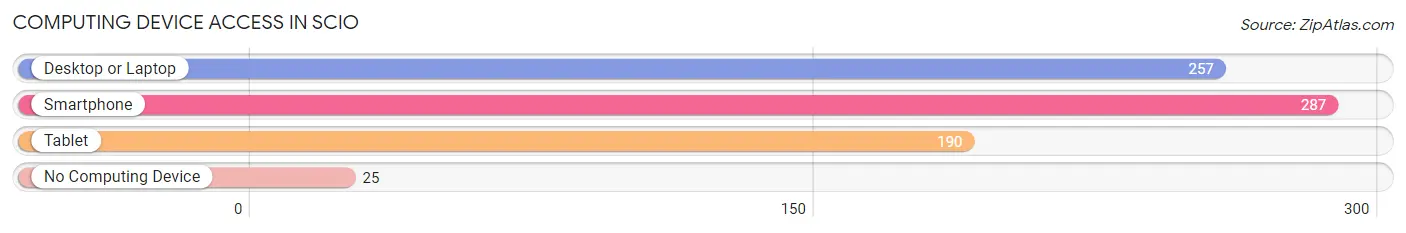
| Device Type | # Households | % Households |
| Desktop or Laptop | 257 | 77.6% |
| Smartphone | 287 | 86.7% |
| Tablet | 190 | 57.4% |
| No Computing Device | 25 | 7.5% |
| Total | 331 | 100.0% |
Internet Access in Scio
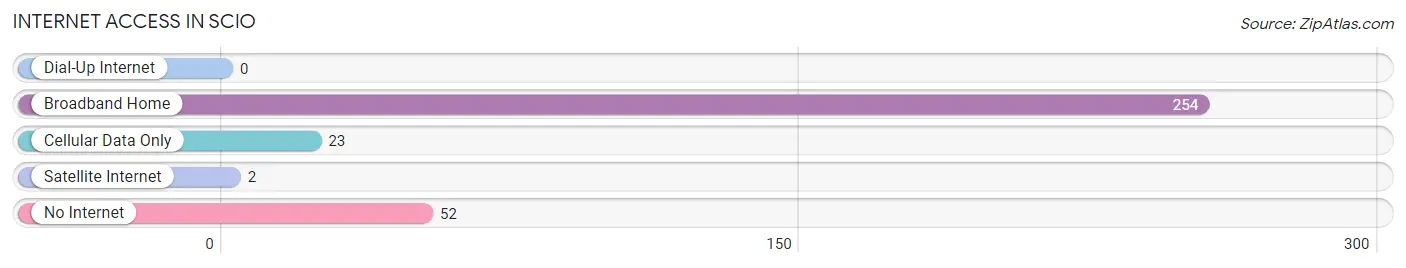
| Internet Type | # Households | % Households |
| Dial-Up Internet | 0 | 0.0% |
| Broadband Home | 254 | 76.7% |
| Cellular Data Only | 23 | 7.0% |
| Satellite Internet | 2 | 0.6% |
| No Internet | 52 | 15.7% |
| Total | 331 | 100.0% |
Scio Summary
Scio is a small city located in the foothills of the Cascade Mountains in the state of Oregon. It is situated in the Linn County, about 40 miles southeast of the state capital, Salem. The city has a population of 1,717 people, according to the 2010 census.
History
The area around Scio was first settled in the 1840s by pioneers who were attracted to the fertile soil and abundant timber. The first post office was established in 1851 and the town was officially incorporated in 1885. The name Scio is derived from the Greek word for “knowledge” and was chosen to reflect the educational aspirations of the early settlers.
In the late 19th century, Scio was a thriving agricultural community, with a variety of crops being grown in the area. The town was also home to several sawmills and a brickyard. In the early 20th century, the town’s economy shifted to focus more on timber and lumber production.
Geography
Scio is located in the foothills of the Cascade Mountains, about 40 miles southeast of Salem. The city is situated in the Willamette Valley, which is known for its fertile soil and abundant timber. The city is bordered by the Calapooia River to the north and the Santiam River to the south.
The city has a total area of 1.2 square miles, all of which is land. The elevation of the city is 545 feet above sea level. The climate in Scio is mild, with warm summers and cool winters.
Economy
The economy of Scio is largely based on agriculture and timber production. The city is home to several farms, which produce a variety of crops, including wheat, hay, and vegetables. The city is also home to several sawmills and lumber yards, which produce lumber for construction and other uses.
The city is also home to several small businesses, including restaurants, retail stores, and service providers. The city is also home to a branch of the Linn-Benton Community College, which offers a variety of educational programs.
Demographics
According to the 2010 census, the population of Scio was 1,717 people. The racial makeup of the city was 94.3% White, 0.7% African American, 0.3% Native American, 0.7% Asian, 0.1% Pacific Islander, 1.2% from other races, and 2.9% from two or more races. Hispanic or Latino of any race were 4.2% of the population.
The median household income in Scio was $41,250, and the median family income was $48,750. The per capita income for the city was $19,945. About 11.2% of families and 14.2% of the population were below the poverty line, including 19.2% of those under age 18 and 8.3% of those age 65 or over.
Common Questions
What is Per Capita Income in Scio?
Per Capita income in Scio is $33,603.
What is the Median Family Income in Scio?
Median Family Income in Scio is $77,292.
What is the Median Household income in Scio?
Median Household Income in Scio is $75,625.
What is Income or Wage Gap in Scio?
Income or Wage Gap in Scio is 20.4%.
Women in Scio earn 79.6 cents for every dollar earned by a man.
What is Inequality or Gini Index in Scio?
Inequality or Gini Index in Scio is 0.35.
What is the Total Population of Scio?
Total Population of Scio is 860.
What is the Total Male Population of Scio?
Total Male Population of Scio is 455.
What is the Total Female Population of Scio?
Total Female Population of Scio is 405.
What is the Ratio of Males per 100 Females in Scio?
There are 112.35 Males per 100 Females in Scio.
What is the Ratio of Females per 100 Males in Scio?
There are 89.01 Females per 100 Males in Scio.
What is the Median Population Age in Scio?
Median Population Age in Scio is 40.7 Years.
What is the Average Family Size in Scio
Average Family Size in Scio is 3.0 People.
What is the Average Household Size in Scio
Average Household Size in Scio is 2.6 People.
How Large is the Labor Force in Scio?
There are 409 People in the Labor Forcein in Scio.
What is the Percentage of People in the Labor Force in Scio?
62.8% of People are in the Labor Force in Scio.
What is the Unemployment Rate in Scio?
Unemployment Rate in Scio is 6.8%.