Scappoose, OR Map & Demographics
Scappoose Map
Scappoose Overview
$43,401
PER CAPITA INCOME
$106,184
AVG FAMILY INCOME
$96,339
AVG HOUSEHOLD INCOME
30.5%
WAGE / INCOME GAP [ % ]
69.5¢/ $1
WAGE / INCOME GAP [ $ ]
$8,152
FAMILY INCOME DEFICIT
0.37
INEQUALITY / GINI INDEX
8,003
TOTAL POPULATION
4,217
MALE POPULATION
3,786
FEMALE POPULATION
111.38
MALES / 100 FEMALES
89.78
FEMALES / 100 MALES
38.7
MEDIAN AGE
3.0
AVG FAMILY SIZE
2.7
AVG HOUSEHOLD SIZE
3,982
LABOR FORCE [ PEOPLE ]
64.8%
PERCENT IN LABOR FORCE
2.5%
UNEMPLOYMENT RATE
Scappoose Zip Codes
Scappoose Area Codes
Income in Scappoose
Income Overview in Scappoose
Per Capita Income in Scappoose is $43,401, while median incomes of families and households are $106,184 and $96,339 respectively.
| Characteristic | Number | Measure |
| Per Capita Income | 8,003 | $43,401 |
| Median Family Income | 2,088 | $106,184 |
| Mean Family Income | 2,088 | $122,630 |
| Median Household Income | 2,948 | $96,339 |
| Mean Household Income | 2,948 | $116,207 |
| Income Deficit | 2,088 | $8,152 |
| Wage / Income Gap (%) | 8,003 | 30.54% |
| Wage / Income Gap ($) | 8,003 | 69.46¢ per $1 |
| Gini / Inequality Index | 8,003 | 0.37 |
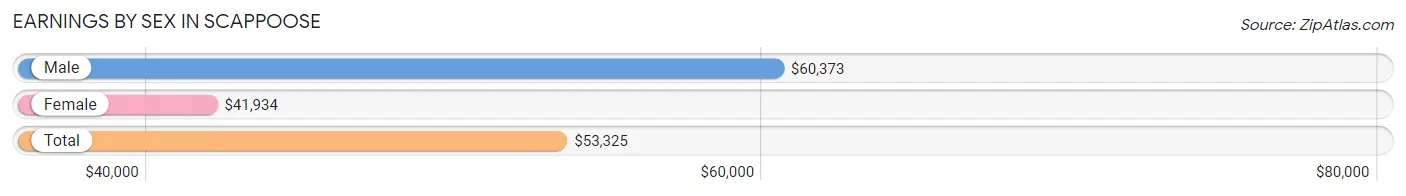
Earnings by Sex in Scappoose
Average Earnings in Scappoose are $53,325, $60,373 for men and $41,934 for women, a difference of 30.5%.
| Sex | Number | Average Earnings |
| Male | 2,380 (58.2%) | $60,373 |
| Female | 1,710 (41.8%) | $41,934 |
| Total | 4,090 (100.0%) | $53,325 |
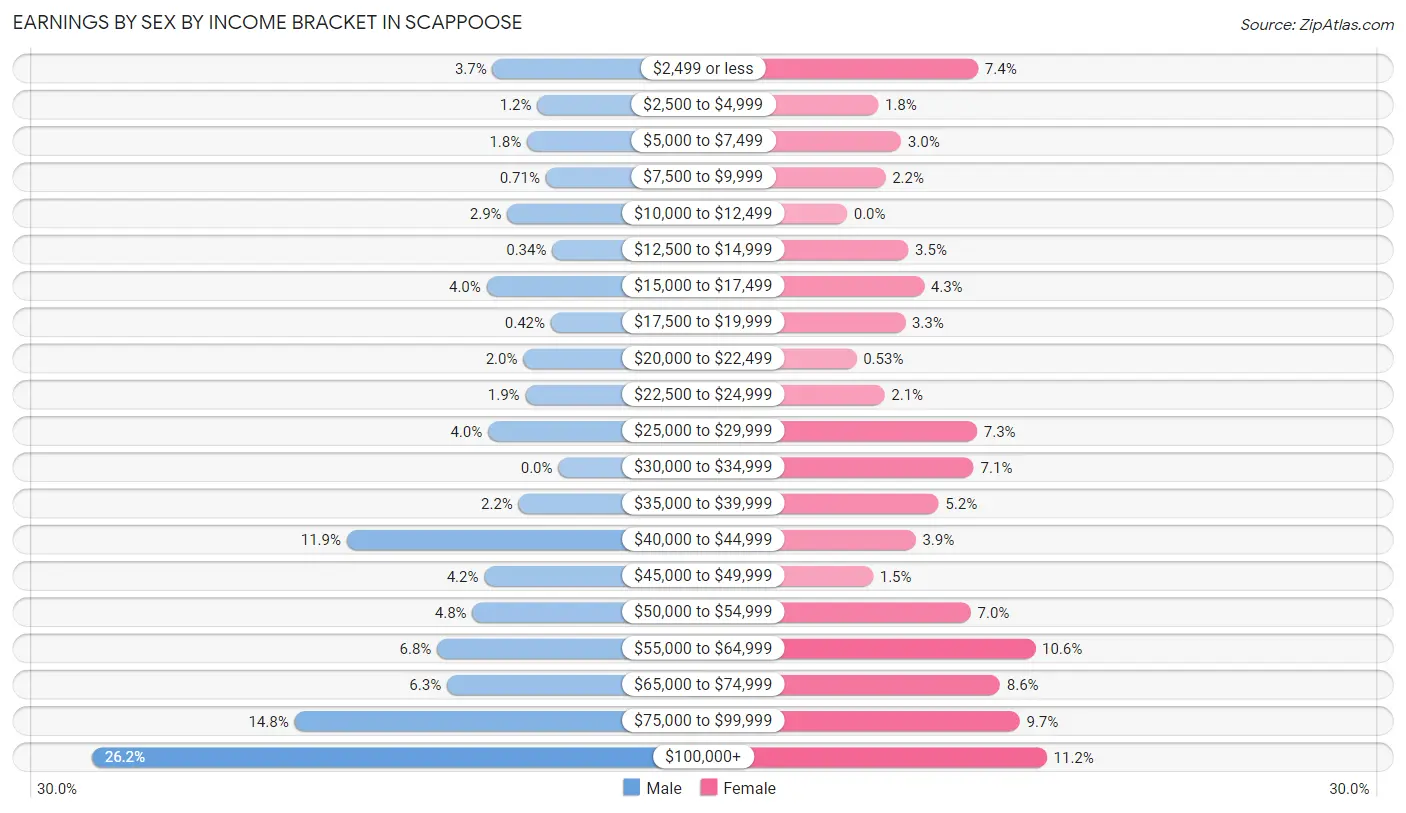
Earnings by Sex by Income Bracket in Scappoose
The most common earnings brackets in Scappoose are $100,000+ for men (624 | 26.2%) and $100,000+ for women (192 | 11.2%).
| Income | Male | Female |
| $2,499 or less | 88 (3.7%) | 126 (7.4%) |
| $2,500 to $4,999 | 28 (1.2%) | 30 (1.8%) |
| $5,000 to $7,499 | 42 (1.8%) | 52 (3.0%) |
| $7,500 to $9,999 | 17 (0.7%) | 37 (2.2%) |
| $10,000 to $12,499 | 68 (2.9%) | 0 (0.0%) |
| $12,500 to $14,999 | 8 (0.3%) | 59 (3.5%) |
| $15,000 to $17,499 | 96 (4.0%) | 74 (4.3%) |
| $17,500 to $19,999 | 10 (0.4%) | 56 (3.3%) |
| $20,000 to $22,499 | 47 (2.0%) | 9 (0.5%) |
| $22,500 to $24,999 | 44 (1.8%) | 36 (2.1%) |
| $25,000 to $29,999 | 94 (4.0%) | 125 (7.3%) |
| $30,000 to $34,999 | 0 (0.0%) | 122 (7.1%) |
| $35,000 to $39,999 | 53 (2.2%) | 88 (5.1%) |
| $40,000 to $44,999 | 283 (11.9%) | 66 (3.9%) |
| $45,000 to $49,999 | 99 (4.2%) | 25 (1.5%) |
| $50,000 to $54,999 | 115 (4.8%) | 119 (7.0%) |
| $55,000 to $64,999 | 162 (6.8%) | 181 (10.6%) |
| $65,000 to $74,999 | 149 (6.3%) | 147 (8.6%) |
| $75,000 to $99,999 | 353 (14.8%) | 166 (9.7%) |
| $100,000+ | 624 (26.2%) | 192 (11.2%) |
| Total | 2,380 (100.0%) | 1,710 (100.0%) |
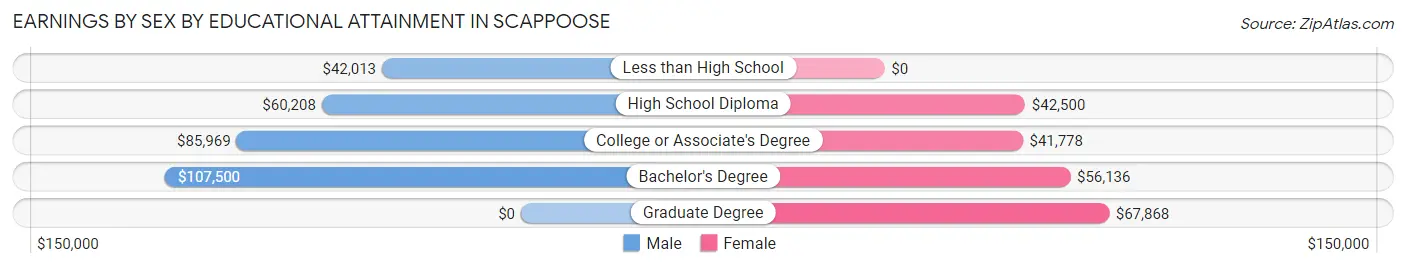
Earnings by Sex by Educational Attainment in Scappoose
Average earnings in Scappoose are $70,881 for men and $51,500 for women, a difference of 27.3%. Men with an educational attainment of bachelor's degree enjoy the highest average annual earnings of $107,500, while those with less than high school education earn the least with $42,013. Women with an educational attainment of graduate degree earn the most with the average annual earnings of $67,868, while those with college or associate's degree education have the smallest earnings of $41,778.
| Educational Attainment | Male Income | Female Income |
| Less than High School | $42,013 | $0 |
| High School Diploma | $60,208 | $42,500 |
| College or Associate's Degree | $85,969 | $41,778 |
| Bachelor's Degree | $107,500 | $56,136 |
| Graduate Degree | - | - |
| Total | $70,881 | $51,500 |
Family Income in Scappoose
Family Income Brackets in Scappoose
According to the Scappoose family income data, there are 712 families falling into the $100,000 to $149,999 income range, which is the most common income bracket and makes up 34.1% of all families. Conversely, the less than $10,000 income bracket is the least frequent group with only 13 families (0.6%) belonging to this category.
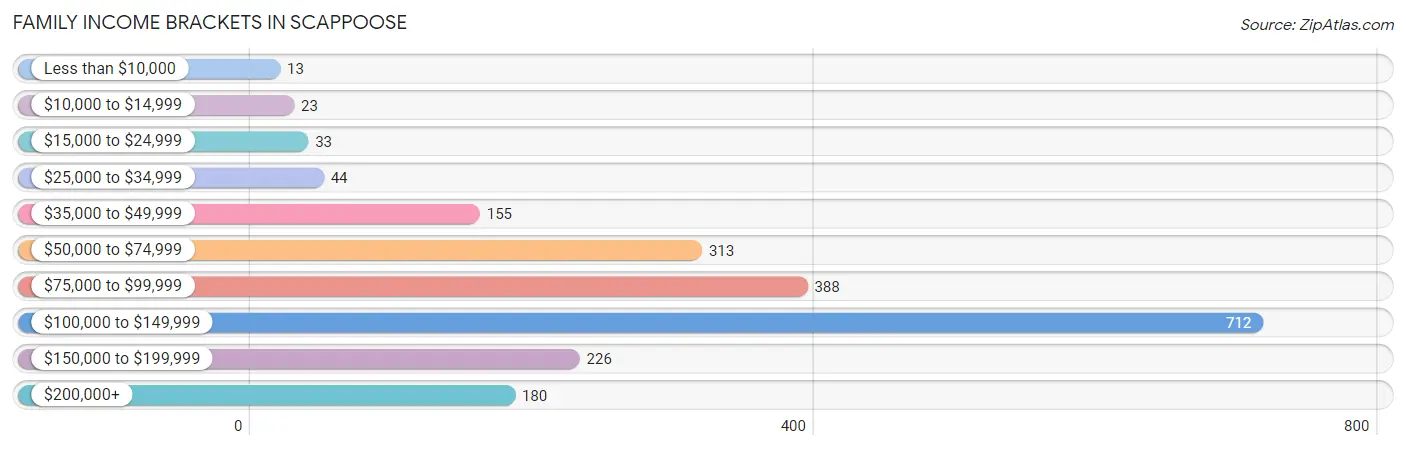
| Income Bracket | # Families | % Families |
| Less than $10,000 | 13 | 0.6% |
| $10,000 to $14,999 | 23 | 1.1% |
| $15,000 to $24,999 | 33 | 1.6% |
| $25,000 to $34,999 | 44 | 2.1% |
| $35,000 to $49,999 | 155 | 7.4% |
| $50,000 to $74,999 | 313 | 15.0% |
| $75,000 to $99,999 | 388 | 18.6% |
| $100,000 to $149,999 | 712 | 34.1% |
| $150,000 to $199,999 | 226 | 10.8% |
| $200,000+ | 180 | 8.6% |
Family Income by Famaliy Size in Scappoose
5-person families (169 | 8.1%) account for the highest median family income in Scappoose with $116,493 per family, while 2-person families (986 | 47.2%) have the highest median income of $51,974 per family member.
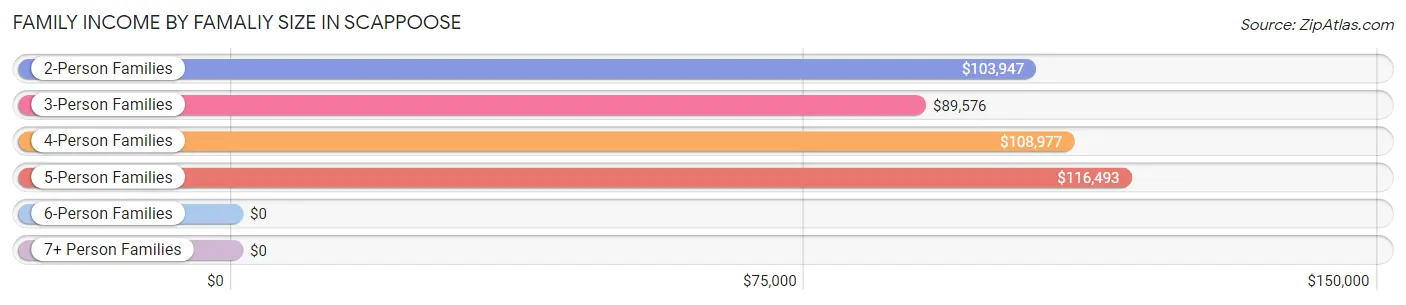
| Income Bracket | # Families | Median Income |
| 2-Person Families | 986 (47.2%) | $103,947 |
| 3-Person Families | 488 (23.4%) | $89,576 |
| 4-Person Families | 346 (16.6%) | $108,977 |
| 5-Person Families | 169 (8.1%) | $116,493 |
| 6-Person Families | 99 (4.7%) | $0 |
| 7+ Person Families | 0 (0.0%) | $0 |
| Total | 2,088 (100.0%) | $106,184 |
Family Income by Number of Earners in Scappoose
The median family income in Scappoose is $106,184, with families comprising 3+ earners (232) having the highest median family income of $183,100, while families with no earners (417) have the lowest median family income of $76,264, accounting for 11.1% and 20.0% of families, respectively.
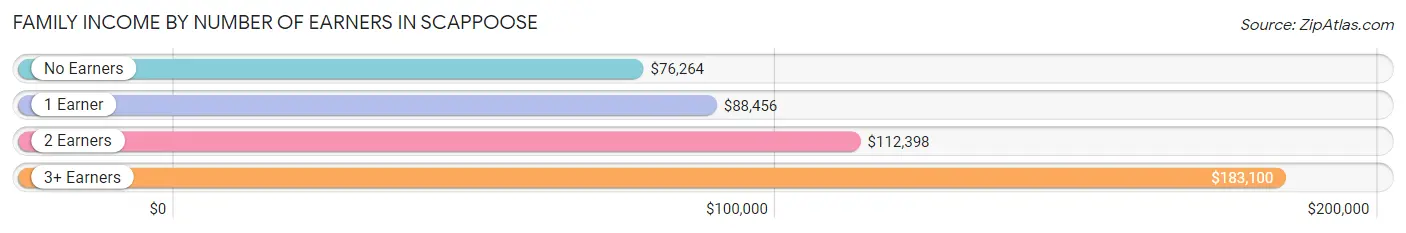
| Number of Earners | # Families | Median Income |
| No Earners | 417 (20.0%) | $76,264 |
| 1 Earner | 556 (26.6%) | $88,456 |
| 2 Earners | 883 (42.3%) | $112,398 |
| 3+ Earners | 232 (11.1%) | $183,100 |
| Total | 2,088 (100.0%) | $106,184 |
Household Income in Scappoose
Household Income Brackets in Scappoose
With 876 households falling in the category, the $100,000 to $149,999 income range is the most frequent in Scappoose, accounting for 29.7% of all households. In contrast, only 35 households (1.2%) fall into the $10,000 to $14,999 income bracket, making it the least populous group.
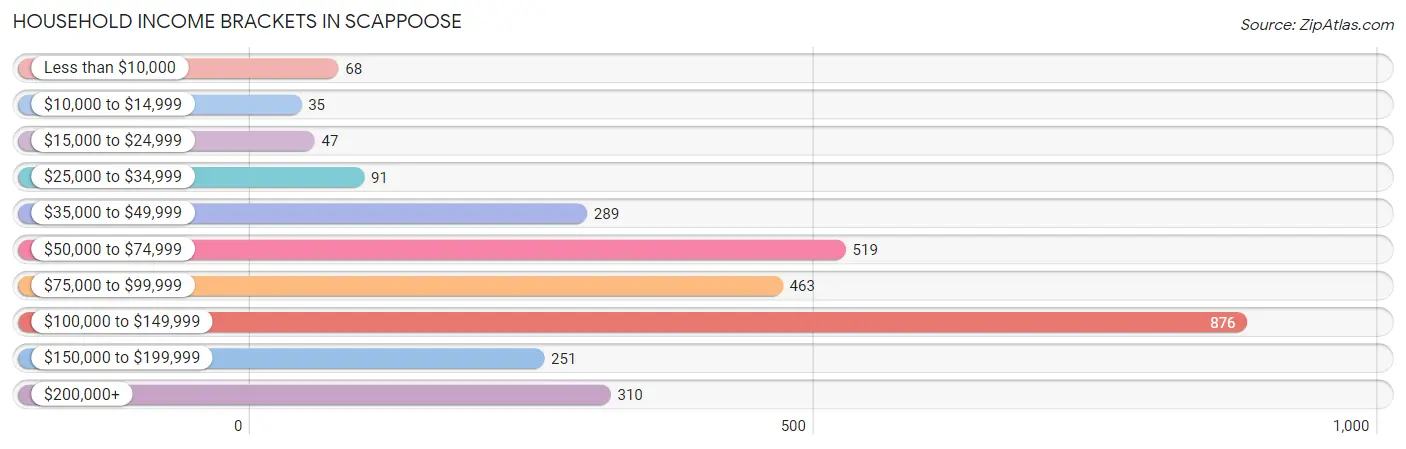
| Income Bracket | # Households | % Households |
| Less than $10,000 | 68 | 2.3% |
| $10,000 to $14,999 | 35 | 1.2% |
| $15,000 to $24,999 | 47 | 1.6% |
| $25,000 to $34,999 | 91 | 3.1% |
| $35,000 to $49,999 | 289 | 9.8% |
| $50,000 to $74,999 | 519 | 17.6% |
| $75,000 to $99,999 | 463 | 15.7% |
| $100,000 to $149,999 | 876 | 29.7% |
| $150,000 to $199,999 | 251 | 8.5% |
| $200,000+ | 310 | 10.5% |
Household Income by Householder Age in Scappoose
The median household income in Scappoose is $96,339, with the highest median household income of $118,438 found in the 45 to 64 years age bracket for the primary householder. A total of 911 households (30.9%) fall into this category. Meanwhile, the 15 to 24 years age bracket for the primary householder has the lowest median household income of $0, with 57 households (1.9%) in this group.
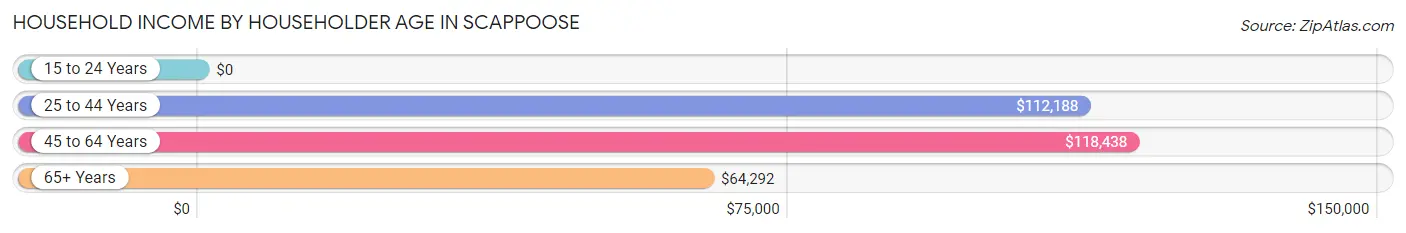
| Income Bracket | # Households | Median Income |
| 15 to 24 Years | 57 (1.9%) | $0 |
| 25 to 44 Years | 1,238 (42.0%) | $112,188 |
| 45 to 64 Years | 911 (30.9%) | $118,438 |
| 65+ Years | 742 (25.2%) | $64,292 |
| Total | 2,948 (100.0%) | $96,339 |
Poverty in Scappoose
Income Below Poverty by Sex and Age in Scappoose
With 4.5% poverty level for males and 10.1% for females among the residents of Scappoose, 15 year old males and 18 to 24 year old females are the most vulnerable to poverty, with 65 males (100.0%) and 137 females (41.3%) in their respective age groups living below the poverty level.
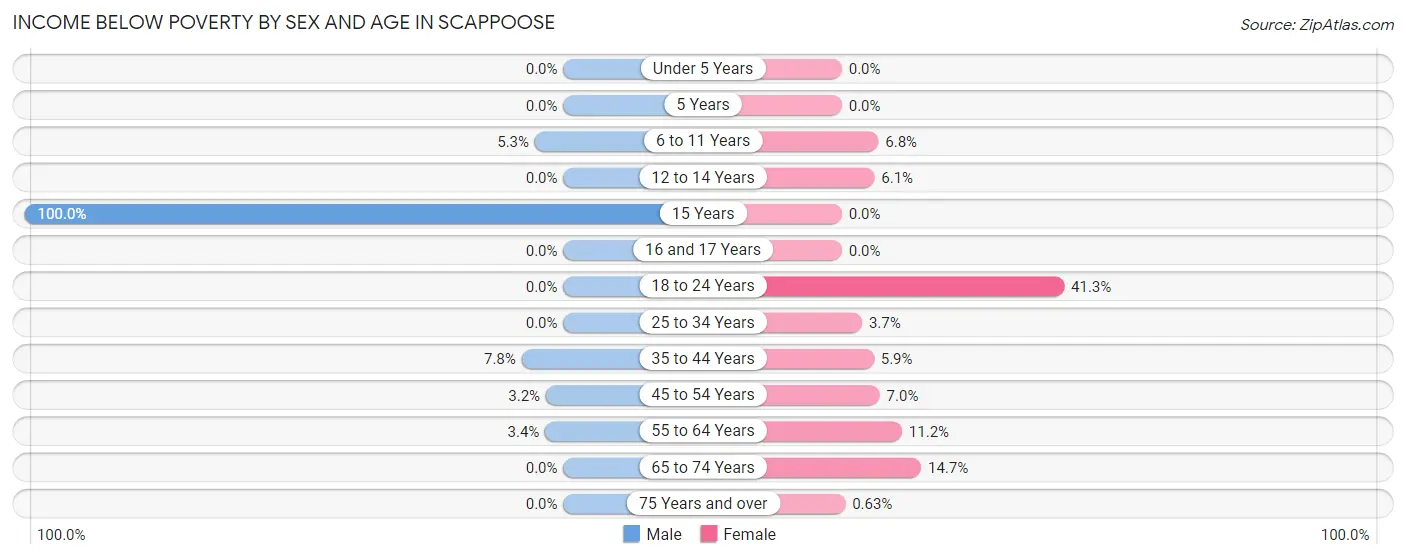
| Age Bracket | Male | Female |
| Under 5 Years | 0 (0.0%) | 0 (0.0%) |
| 5 Years | 0 (0.0%) | 0 (0.0%) |
| 6 to 11 Years | 19 (5.3%) | 26 (6.8%) |
| 12 to 14 Years | 0 (0.0%) | 19 (6.0%) |
| 15 Years | 65 (100.0%) | 0 (0.0%) |
| 16 and 17 Years | 0 (0.0%) | 0 (0.0%) |
| 18 to 24 Years | 0 (0.0%) | 137 (41.3%) |
| 25 to 34 Years | 0 (0.0%) | 13 (3.7%) |
| 35 to 44 Years | 77 (7.7%) | 42 (5.9%) |
| 45 to 54 Years | 17 (3.2%) | 22 (7.0%) |
| 55 to 64 Years | 10 (3.4%) | 56 (11.2%) |
| 65 to 74 Years | 0 (0.0%) | 65 (14.7%) |
| 75 Years and over | 0 (0.0%) | 1 (0.6%) |
| Total | 188 (4.5%) | 381 (10.1%) |
Income Above Poverty by Sex and Age in Scappoose
According to the poverty statistics in Scappoose, males aged under 5 years and females aged under 5 years are the age groups that are most secure financially, with 100.0% of males and 100.0% of females in these age groups living above the poverty line.
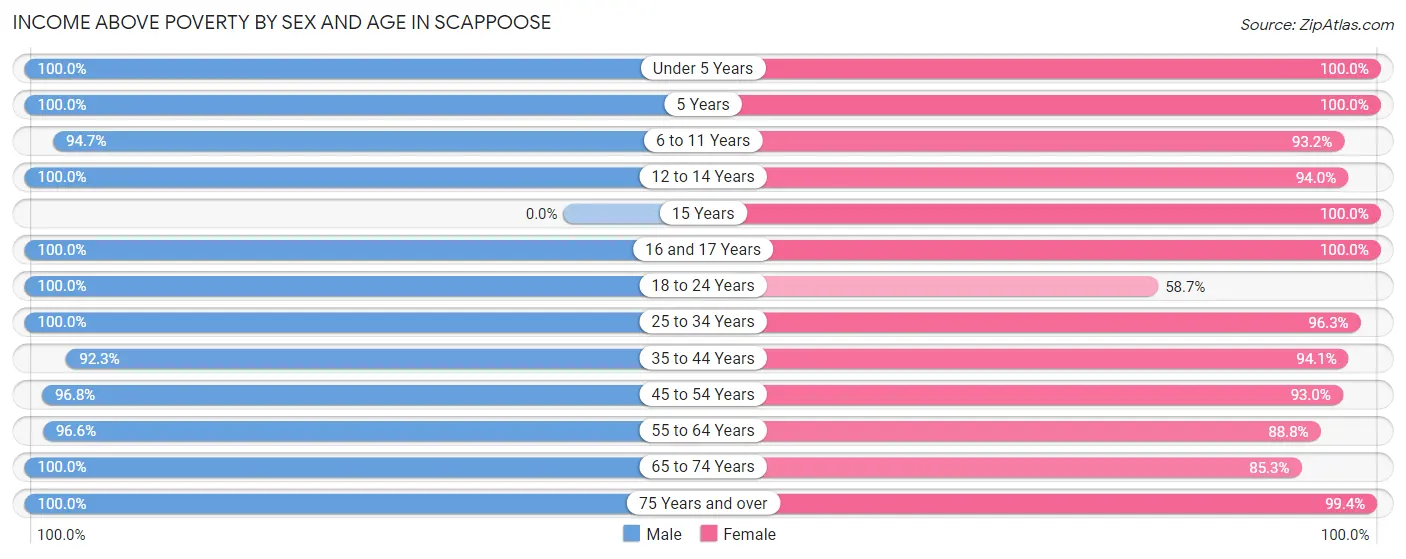
| Age Bracket | Male | Female |
| Under 5 Years | 416 (100.0%) | 135 (100.0%) |
| 5 Years | 16 (100.0%) | 23 (100.0%) |
| 6 to 11 Years | 340 (94.7%) | 357 (93.2%) |
| 12 to 14 Years | 70 (100.0%) | 295 (94.0%) |
| 15 Years | 0 (0.0%) | 77 (100.0%) |
| 16 and 17 Years | 91 (100.0%) | 37 (100.0%) |
| 18 to 24 Years | 261 (100.0%) | 195 (58.7%) |
| 25 to 34 Years | 448 (100.0%) | 335 (96.3%) |
| 35 to 44 Years | 916 (92.2%) | 665 (94.1%) |
| 45 to 54 Years | 510 (96.8%) | 291 (93.0%) |
| 55 to 64 Years | 287 (96.6%) | 446 (88.8%) |
| 65 to 74 Years | 413 (100.0%) | 377 (85.3%) |
| 75 Years and over | 249 (100.0%) | 157 (99.4%) |
| Total | 4,017 (95.5%) | 3,390 (89.9%) |
Income Below Poverty Among Married-Couple Families in Scappoose
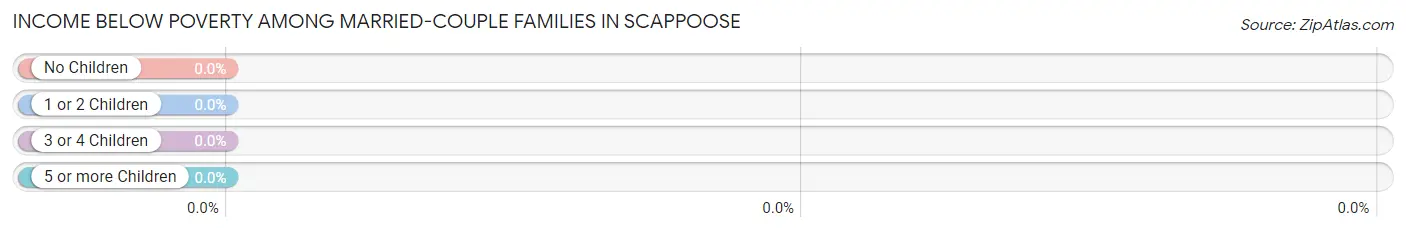
| Children | Above Poverty | Below Poverty |
| No Children | 947 (100.0%) | 0 (0.0%) |
| 1 or 2 Children | 440 (100.0%) | 0 (0.0%) |
| 3 or 4 Children | 204 (100.0%) | 0 (0.0%) |
| 5 or more Children | 0 (0.0%) | 0 (0.0%) |
| Total | 1,591 (100.0%) | 0 (0.0%) |
Income Below Poverty Among Single-Parent Households in Scappoose
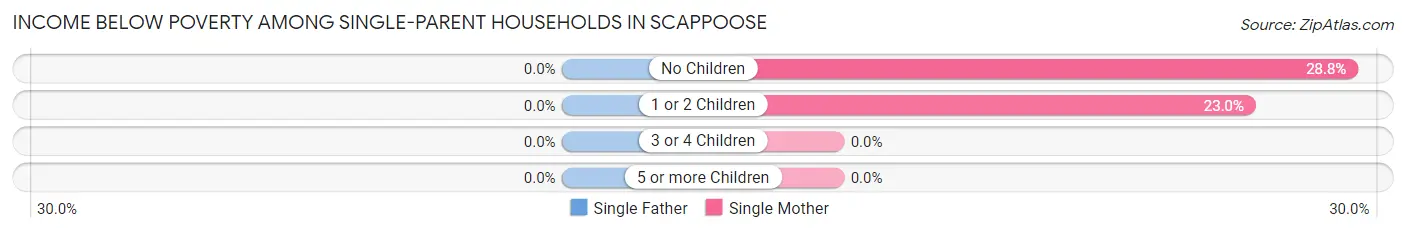
| Children | Single Father | Single Mother |
| No Children | 0 (0.0%) | 23 (28.7%) |
| 1 or 2 Children | 0 (0.0%) | 35 (23.0%) |
| 3 or 4 Children | 0 (0.0%) | 0 (0.0%) |
| 5 or more Children | 0 (0.0%) | 0 (0.0%) |
| Total | 0 (0.0%) | 58 (23.8%) |
Income Below Poverty Among Married-Couple vs Single-Parent Households in Scappoose
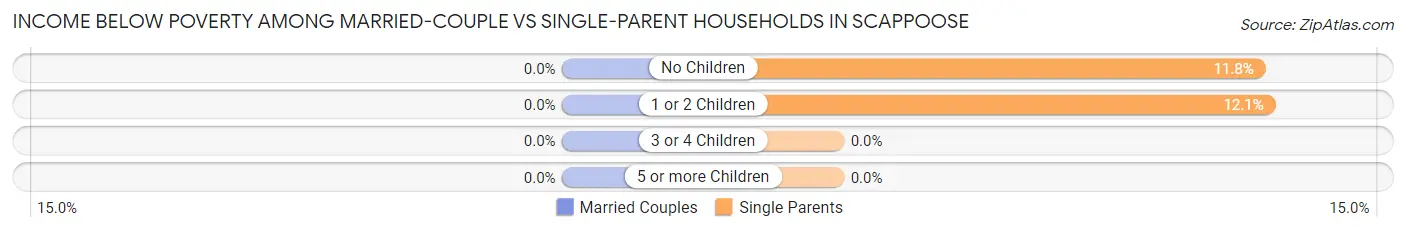
| Children | Married-Couple Families | Single-Parent Households |
| No Children | 0 (0.0%) | 23 (11.8%) |
| 1 or 2 Children | 0 (0.0%) | 35 (12.1%) |
| 3 or 4 Children | 0 (0.0%) | 0 (0.0%) |
| 5 or more Children | 0 (0.0%) | 0 (0.0%) |
| Total | 0 (0.0%) | 58 (11.7%) |
Race in Scappoose
The most populous races in Scappoose are White / Caucasian (7,078 | 88.4%), Two or more Races (723 | 9.0%), and Hispanic or Latino (530 | 6.6%).
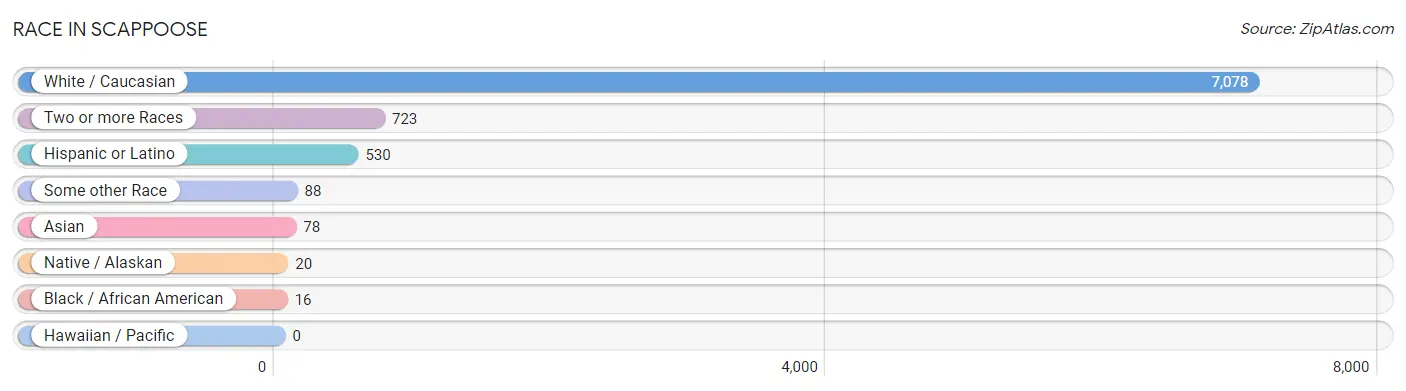
| Race | # Population | % Population |
| Asian | 78 | 1.0% |
| Black / African American | 16 | 0.2% |
| Hawaiian / Pacific | 0 | 0.0% |
| Hispanic or Latino | 530 | 6.6% |
| Native / Alaskan | 20 | 0.3% |
| White / Caucasian | 7,078 | 88.4% |
| Two or more Races | 723 | 9.0% |
| Some other Race | 88 | 1.1% |
| Total | 8,003 | 100.0% |
Ancestry in Scappoose
The most populous ancestries reported in Scappoose are German (2,046 | 25.6%), English (1,008 | 12.6%), Irish (990 | 12.4%), Italian (547 | 6.8%), and Dutch (493 | 6.2%), together accounting for 63.5% of all Scappoose residents.
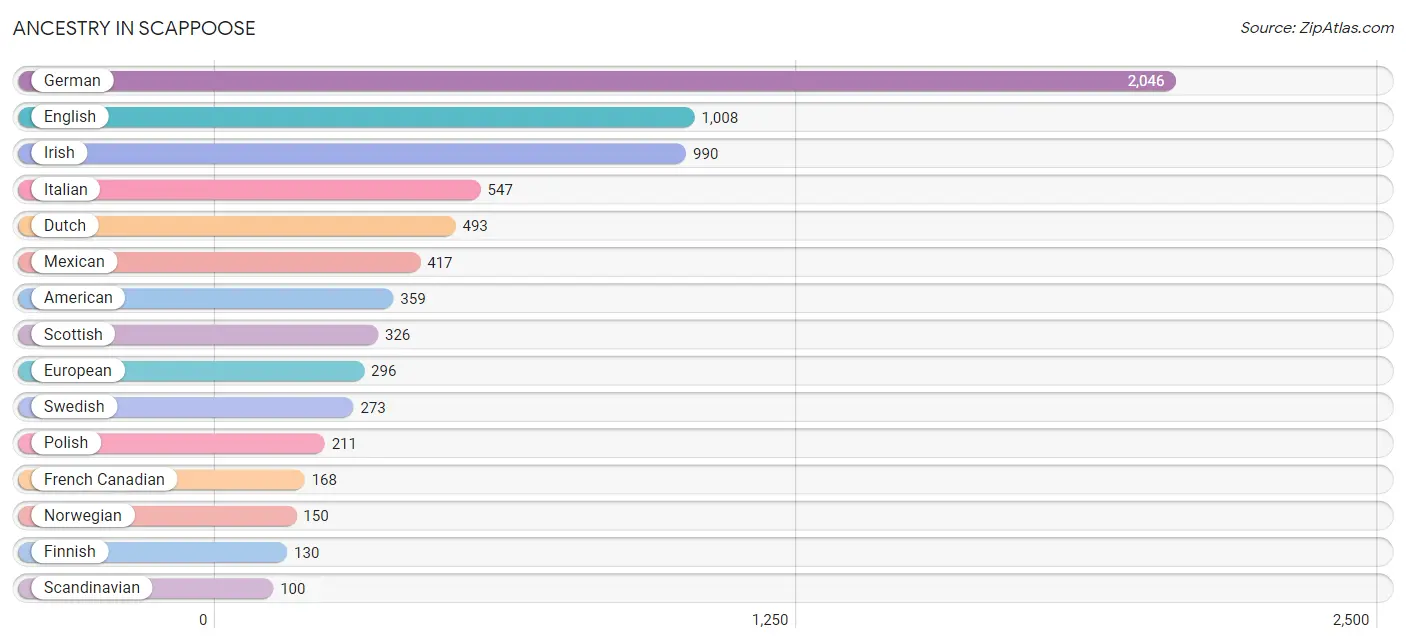
| Ancestry | # Population | % Population |
| American | 359 | 4.5% |
| Australian | 55 | 0.7% |
| Austrian | 10 | 0.1% |
| Bolivian | 27 | 0.3% |
| Brazilian | 21 | 0.3% |
| British | 25 | 0.3% |
| Canadian | 13 | 0.2% |
| Cherokee | 38 | 0.5% |
| Chilean | 8 | 0.1% |
| Creek | 20 | 0.3% |
| Croatian | 18 | 0.2% |
| Czech | 35 | 0.4% |
| Danish | 18 | 0.2% |
| Dutch | 493 | 6.2% |
| English | 1,008 | 12.6% |
| European | 296 | 3.7% |
| Finnish | 130 | 1.6% |
| French | 91 | 1.1% |
| French Canadian | 168 | 2.1% |
| German | 2,046 | 25.6% |
| Greek | 69 | 0.9% |
| Hungarian | 13 | 0.2% |
| Indian (Asian) | 32 | 0.4% |
| Irish | 990 | 12.4% |
| Iroquois | 17 | 0.2% |
| Italian | 547 | 6.8% |
| Japanese | 50 | 0.6% |
| Korean | 13 | 0.2% |
| Mexican | 417 | 5.2% |
| Norwegian | 150 | 1.9% |
| Polish | 211 | 2.6% |
| Portuguese | 66 | 0.8% |
| Puerto Rican | 77 | 1.0% |
| Russian | 67 | 0.8% |
| Scandinavian | 100 | 1.3% |
| Scotch-Irish | 89 | 1.1% |
| Scottish | 326 | 4.1% |
| Sioux | 20 | 0.3% |
| Slavic | 18 | 0.2% |
| Slovak | 18 | 0.2% |
| Slovene | 16 | 0.2% |
| South American | 35 | 0.4% |
| Swedish | 273 | 3.4% |
| Swiss | 58 | 0.7% |
| Tsimshian | 7 | 0.1% |
| Welsh | 31 | 0.4% | View All 46 Rows |
Immigrants in Scappoose
The most numerous immigrant groups reported in Scappoose came from Asia (66 | 0.8%), Latin America (61 | 0.8%), South Eastern Asia (46 | 0.6%), South America (35 | 0.4%), and Cambodia (33 | 0.4%), together accounting for 3.0% of all Scappoose residents.
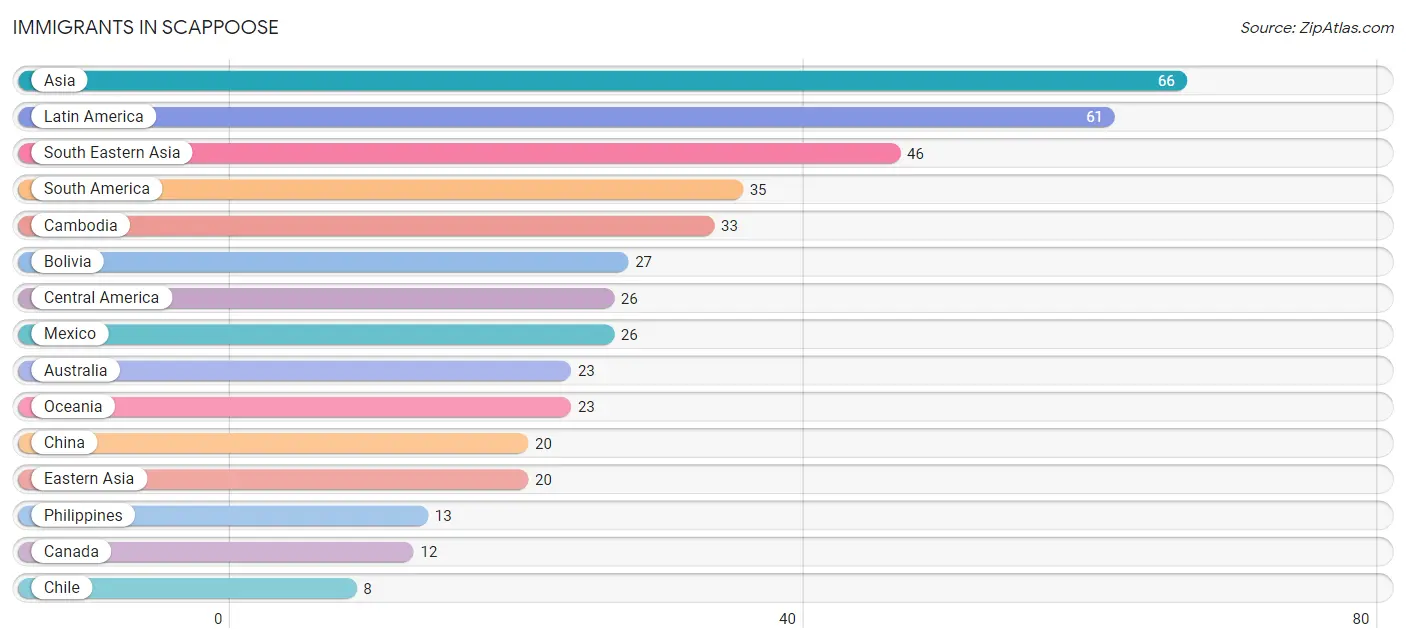
| Immigration Origin | # Population | % Population |
| Asia | 66 | 0.8% |
| Australia | 23 | 0.3% |
| Bolivia | 27 | 0.3% |
| Cambodia | 33 | 0.4% |
| Canada | 12 | 0.2% |
| Central America | 26 | 0.3% |
| Chile | 8 | 0.1% |
| China | 20 | 0.3% |
| Eastern Asia | 20 | 0.3% |
| Latin America | 61 | 0.8% |
| Mexico | 26 | 0.3% |
| Oceania | 23 | 0.3% |
| Philippines | 13 | 0.2% |
| South America | 35 | 0.4% |
| South Eastern Asia | 46 | 0.6% | View All 15 Rows |
Sex and Age in Scappoose
Sex and Age in Scappoose
The most populous age groups in Scappoose are 40 to 44 Years (599 | 14.2%) for men and 35 to 39 Years (380 | 10.0%) for women.
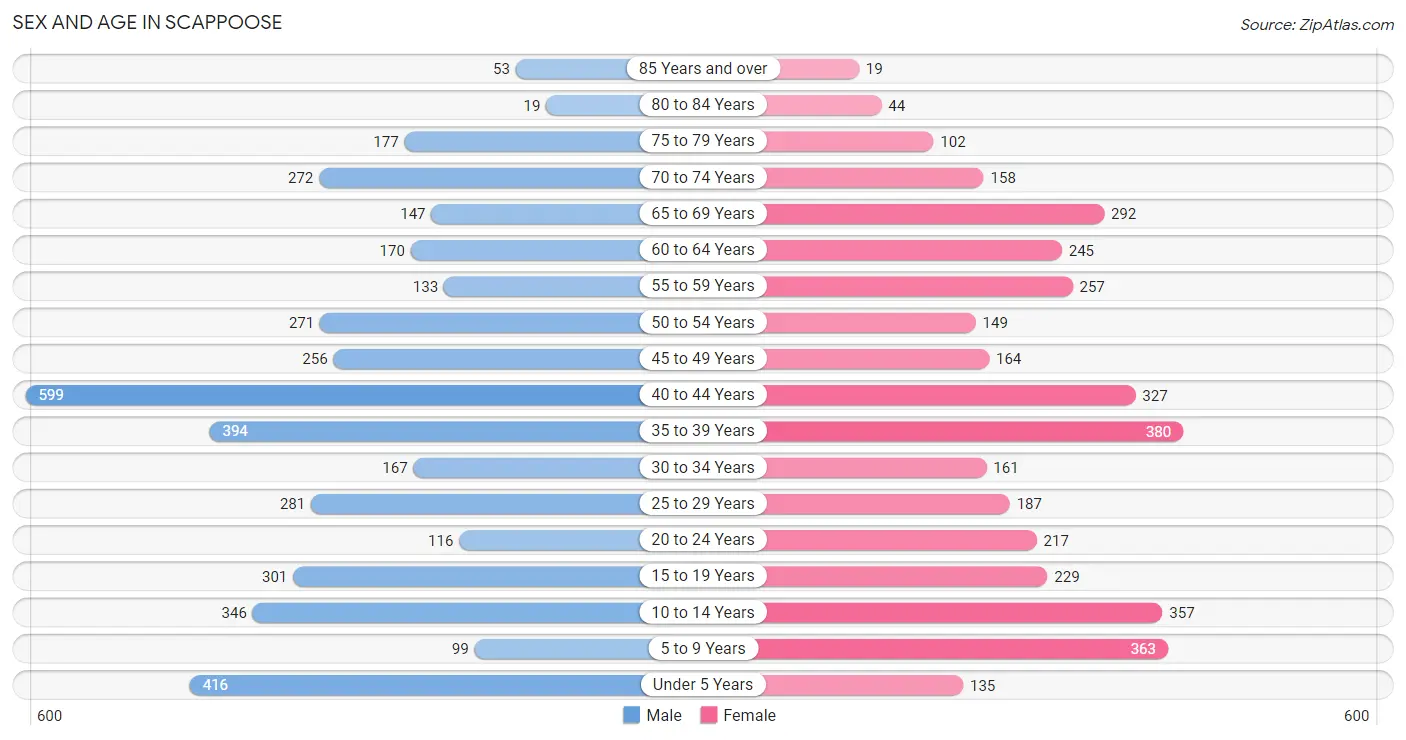
| Age Bracket | Male | Female |
| Under 5 Years | 416 (9.9%) | 135 (3.6%) |
| 5 to 9 Years | 99 (2.4%) | 363 (9.6%) |
| 10 to 14 Years | 346 (8.2%) | 357 (9.4%) |
| 15 to 19 Years | 301 (7.1%) | 229 (6.0%) |
| 20 to 24 Years | 116 (2.8%) | 217 (5.7%) |
| 25 to 29 Years | 281 (6.7%) | 187 (4.9%) |
| 30 to 34 Years | 167 (4.0%) | 161 (4.3%) |
| 35 to 39 Years | 394 (9.3%) | 380 (10.0%) |
| 40 to 44 Years | 599 (14.2%) | 327 (8.6%) |
| 45 to 49 Years | 256 (6.1%) | 164 (4.3%) |
| 50 to 54 Years | 271 (6.4%) | 149 (3.9%) |
| 55 to 59 Years | 133 (3.2%) | 257 (6.8%) |
| 60 to 64 Years | 170 (4.0%) | 245 (6.5%) |
| 65 to 69 Years | 147 (3.5%) | 292 (7.7%) |
| 70 to 74 Years | 272 (6.5%) | 158 (4.2%) |
| 75 to 79 Years | 177 (4.2%) | 102 (2.7%) |
| 80 to 84 Years | 19 (0.4%) | 44 (1.2%) |
| 85 Years and over | 53 (1.3%) | 19 (0.5%) |
| Total | 4,217 (100.0%) | 3,786 (100.0%) |
Families and Households in Scappoose
Median Family Size in Scappoose
The median family size in Scappoose is 3.05 persons per family, with married-couple families (1,591 | 76.2%) accounting for the largest median family size of 3.24 persons per family. On the other hand, single male/father families (253 | 12.1%) represent the smallest median family size with 2.14 persons per family.
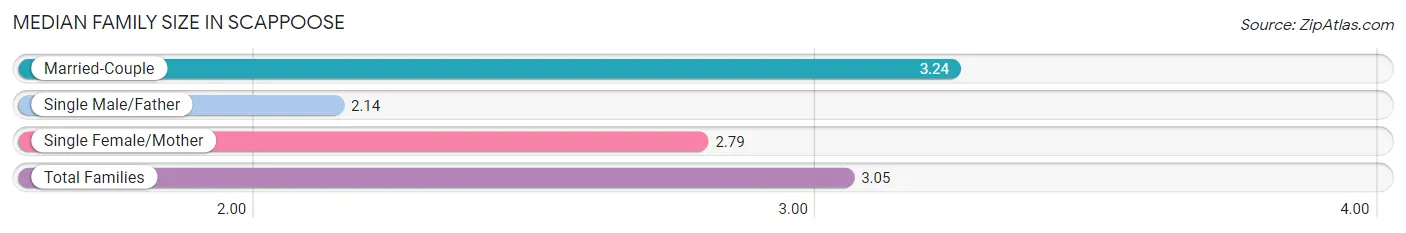
| Family Type | # Families | Family Size |
| Married-Couple | 1,591 (76.2%) | 3.24 |
| Single Male/Father | 253 (12.1%) | 2.14 |
| Single Female/Mother | 244 (11.7%) | 2.79 |
| Total Families | 2,088 (100.0%) | 3.05 |
Median Household Size in Scappoose
The median household size in Scappoose is 2.70 persons per household, with single female/mother households (244 | 8.3%) accounting for the largest median household size of 3.28 persons per household. non-family households (860 | 29.2%) represent the smallest median household size with 1.45 persons per household.
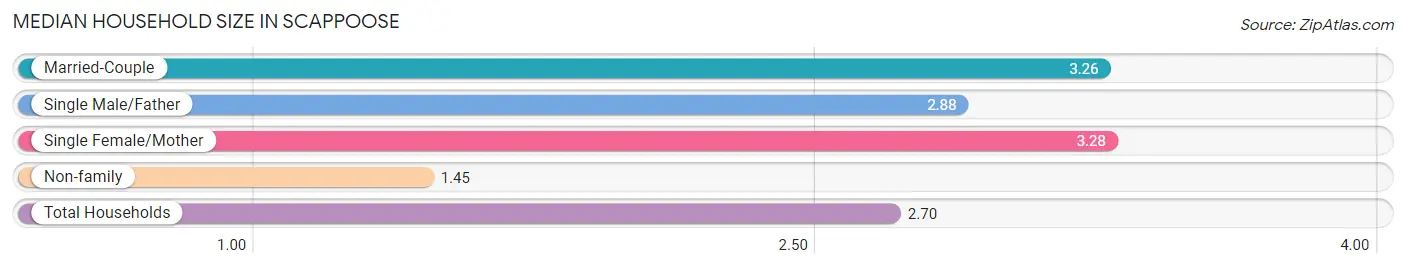
| Household Type | # Households | Household Size |
| Married-Couple | 1,591 (54.0%) | 3.26 |
| Single Male/Father | 253 (8.6%) | 2.88 |
| Single Female/Mother | 244 (8.3%) | 3.28 |
| Non-family | 860 (29.2%) | 1.45 |
| Total Households | 2,948 (100.0%) | 2.70 |
Household Size by Marriage Status in Scappoose
Out of a total of 2,948 households in Scappoose, 2,088 (70.8%) are family households, while 860 (29.2%) are nonfamily households. The most numerous type of family households are 2-person households, comprising 772, and the most common type of nonfamily households are 1-person households, comprising 705.
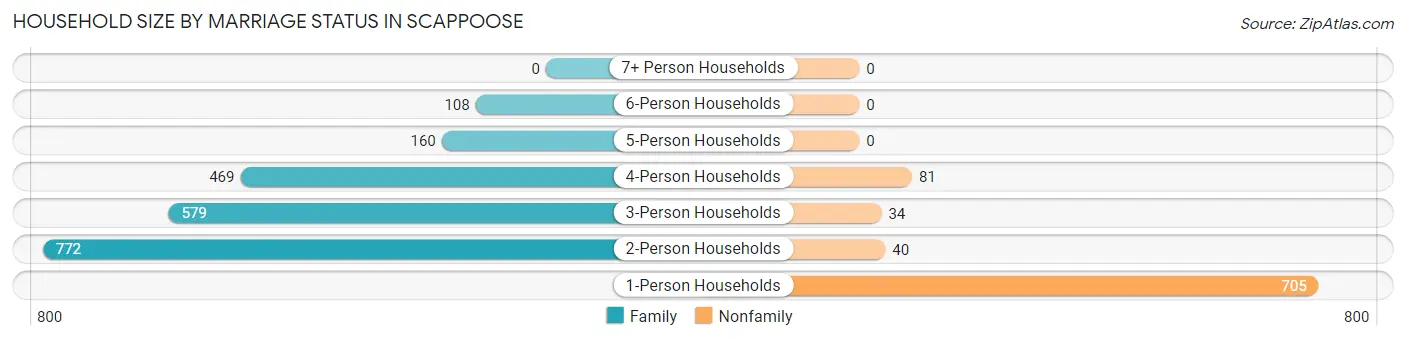
| Household Size | Family Households | Nonfamily Households |
| 1-Person Households | - | 705 (23.9%) |
| 2-Person Households | 772 (26.2%) | 40 (1.4%) |
| 3-Person Households | 579 (19.6%) | 34 (1.1%) |
| 4-Person Households | 469 (15.9%) | 81 (2.8%) |
| 5-Person Households | 160 (5.4%) | 0 (0.0%) |
| 6-Person Households | 108 (3.7%) | 0 (0.0%) |
| 7+ Person Households | 0 (0.0%) | 0 (0.0%) |
| Total | 2,088 (70.8%) | 860 (29.2%) |
Female Fertility in Scappoose
Fertility by Age in Scappoose
Average fertility rate in Scappoose is 92.0 births per 1,000 women. Women in the age bracket of 35 to 50 years have the highest fertility rate with 126.0 births per 1,000 women. Women in the age bracket of 35 to 50 years acount for 73.1% of all women with births.
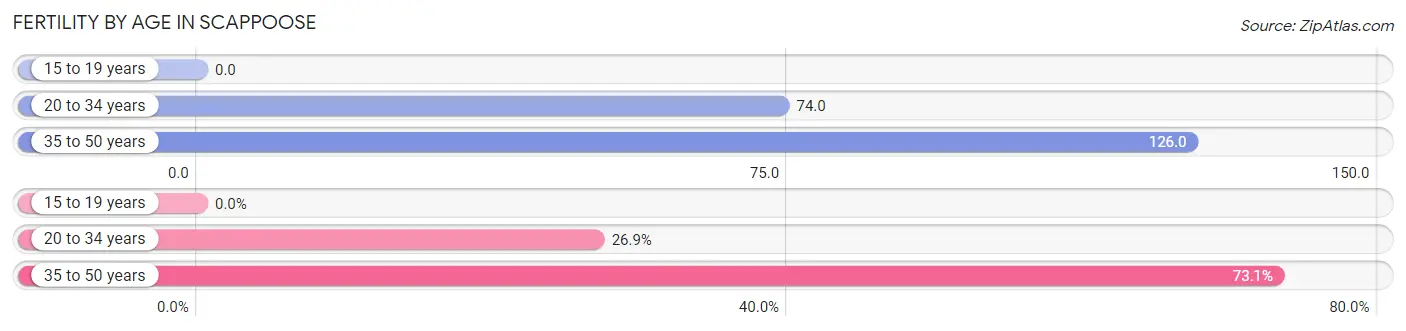
| Age Bracket | Women with Births | Births / 1,000 Women |
| 15 to 19 years | 0 (0.0%) | 0.0 |
| 20 to 34 years | 42 (26.9%) | 74.0 |
| 35 to 50 years | 114 (73.1%) | 126.0 |
| Total | 156 (100.0%) | 92.0 |
Fertility by Age by Marriage Status in Scappoose
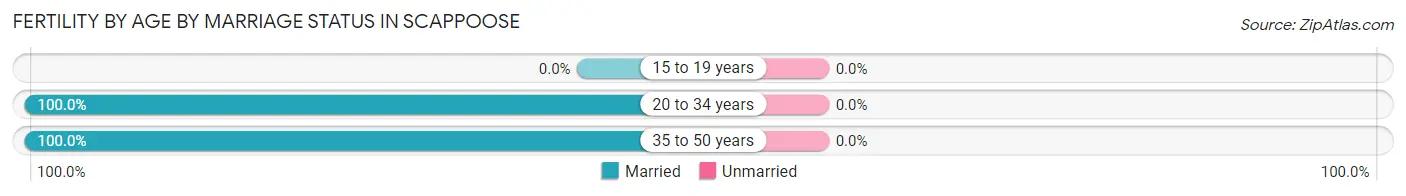
| Age Bracket | Married | Unmarried |
| 15 to 19 years | 0 (0.0%) | 0 (0.0%) |
| 20 to 34 years | 42 (100.0%) | 0 (0.0%) |
| 35 to 50 years | 114 (100.0%) | 0 (0.0%) |
| Total | 156 (100.0%) | 0 (0.0%) |
Fertility by Education in Scappoose
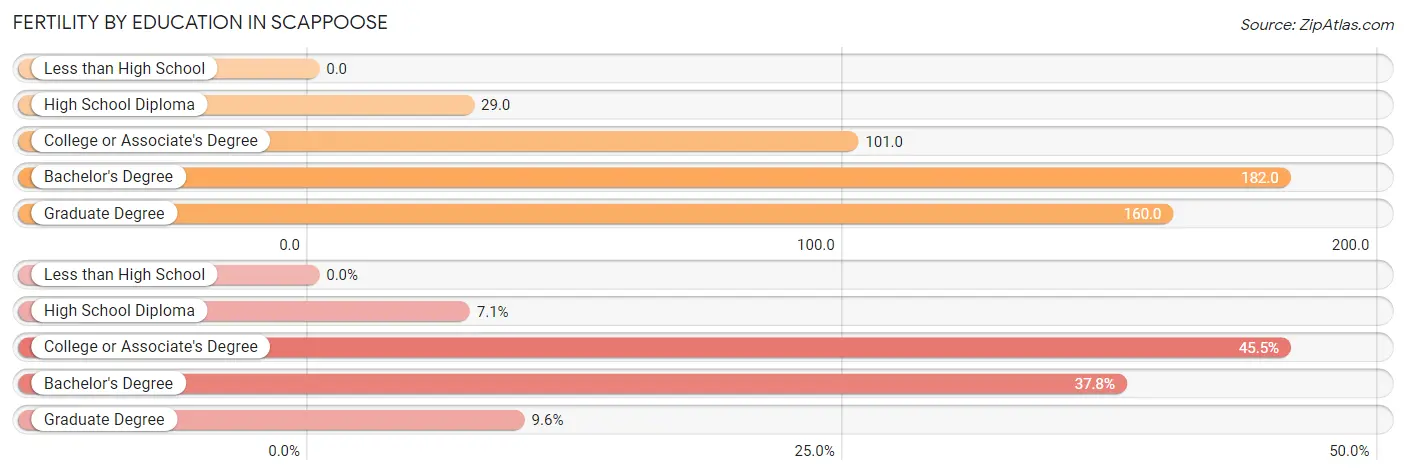
| Educational Attainment | Women with Births | Births / 1,000 Women |
| Less than High School | 0 (0.0%) | 0.0 |
| High School Diploma | 11 (7.0%) | 29.0 |
| College or Associate's Degree | 71 (45.5%) | 101.0 |
| Bachelor's Degree | 59 (37.8%) | 182.0 |
| Graduate Degree | 15 (9.6%) | 160.0 |
| Total | 156 (100.0%) | 92.0 |
Fertility by Education by Marriage Status in Scappoose
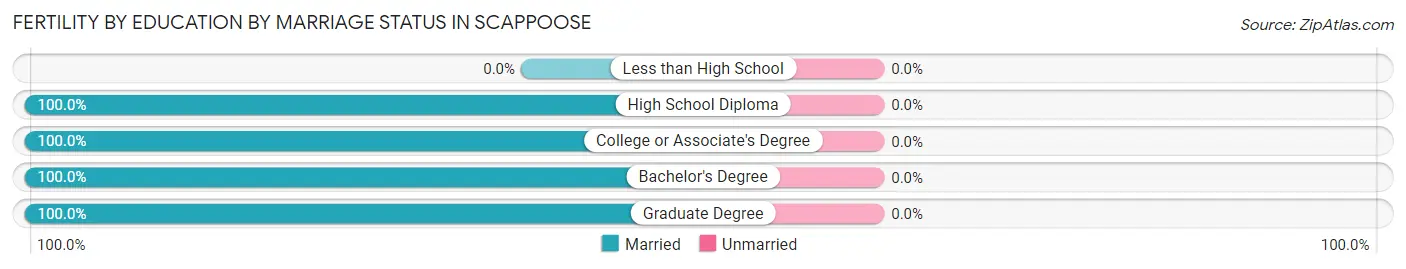
| Educational Attainment | Married | Unmarried |
| Less than High School | 0 (0.0%) | 0 (0.0%) |
| High School Diploma | 11 (100.0%) | 0 (0.0%) |
| College or Associate's Degree | 71 (100.0%) | 0 (0.0%) |
| Bachelor's Degree | 59 (100.0%) | 0 (0.0%) |
| Graduate Degree | 15 (100.0%) | 0 (0.0%) |
| Total | 156 (100.0%) | 0 (0.0%) |
Employment Characteristics in Scappoose
Employment by Class of Employer in Scappoose
Among the 3,813 employed individuals in Scappoose, private company employees (2,678 | 70.2%), local government employees (357 | 9.4%), and self-employed (not incorporated) (244 | 6.4%) make up the most common classes of employment.
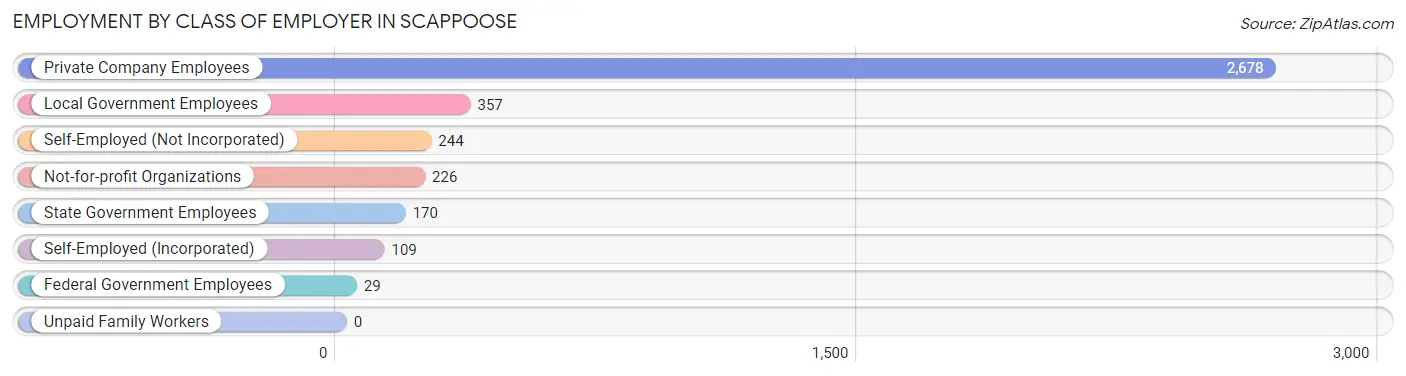
| Employer Class | # Employees | % Employees |
| Private Company Employees | 2,678 | 70.2% |
| Self-Employed (Incorporated) | 109 | 2.9% |
| Self-Employed (Not Incorporated) | 244 | 6.4% |
| Not-for-profit Organizations | 226 | 5.9% |
| Local Government Employees | 357 | 9.4% |
| State Government Employees | 170 | 4.5% |
| Federal Government Employees | 29 | 0.8% |
| Unpaid Family Workers | 0 | 0.0% |
| Total | 3,813 | 100.0% |
Employment Status by Age in Scappoose
According to the labor force statistics for Scappoose, out of the total population over 16 years of age (6,145), 64.8% or 3,982 individuals are in the labor force, with 2.5% or 100 of them unemployed. The age group with the highest labor force participation rate is 25 to 29 years, with 100.0% or 468 individuals in the labor force. Within the labor force, the 60 to 64 years age range has the highest percentage of unemployed individuals, with 9.3% or 23 of them being unemployed.
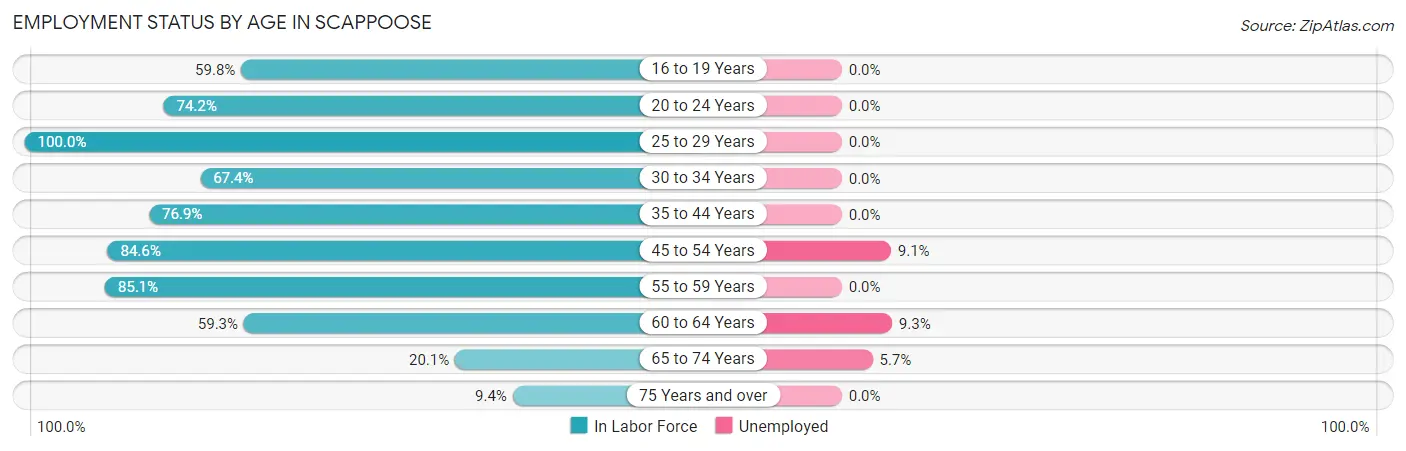
| Age Bracket | In Labor Force | Unemployed |
| 16 to 19 Years | 232 (59.8%) | 0 (0.0%) |
| 20 to 24 Years | 247 (74.2%) | 0 (0.0%) |
| 25 to 29 Years | 468 (100.0%) | 0 (0.0%) |
| 30 to 34 Years | 221 (67.4%) | 0 (0.0%) |
| 35 to 44 Years | 1,307 (76.9%) | 0 (0.0%) |
| 45 to 54 Years | 711 (84.6%) | 65 (9.1%) |
| 55 to 59 Years | 332 (85.1%) | 0 (0.0%) |
| 60 to 64 Years | 246 (59.3%) | 23 (9.3%) |
| 65 to 74 Years | 175 (20.1%) | 10 (5.7%) |
| 75 Years and over | 39 (9.4%) | 0 (0.0%) |
| Total | 3,982 (64.8%) | 100 (2.5%) |
Employment Status by Educational Attainment in Scappoose
According to labor force statistics for Scappoose, 79.4% of individuals (3,288) out of the total population between 25 and 64 years of age (4,141) are in the labor force, with 2.7% or 89 of them being unemployed. The group with the highest labor force participation rate are those with the educational attainment of bachelor's degree or higher, with 88.4% or 814 individuals in the labor force. Within the labor force, individuals with less than high school education have the highest percentage of unemployment, with 15.9% or 40 of them being unemployed.
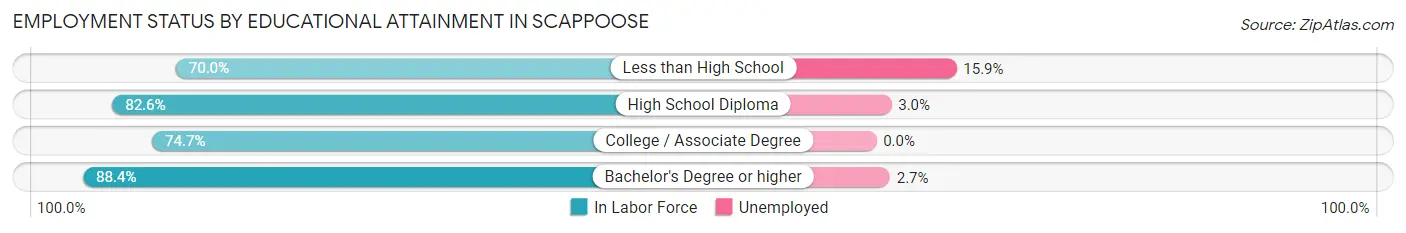
| Educational Attainment | In Labor Force | Unemployed |
| Less than High School | 252 (70.0%) | 57 (15.9%) |
| High School Diploma | 868 (82.6%) | 32 (3.0%) |
| College / Associate Degree | 1,351 (74.7%) | 0 (0.0%) |
| Bachelor's Degree or higher | 814 (88.4%) | 25 (2.7%) |
| Total | 3,288 (79.4%) | 112 (2.7%) |
Employment Occupations by Sex in Scappoose
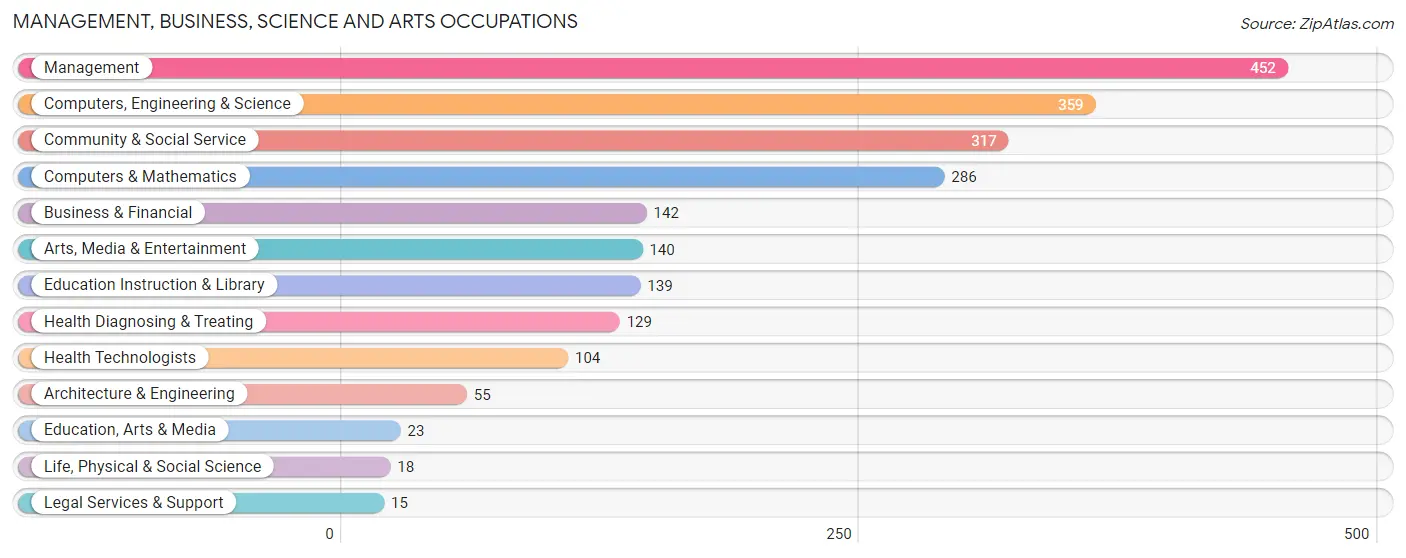
Management, Business, Science and Arts Occupations
The most common Management, Business, Science and Arts occupations in Scappoose are Management (452 | 11.7%), Computers, Engineering & Science (359 | 9.2%), Community & Social Service (317 | 8.2%), Computers & Mathematics (286 | 7.4%), and Business & Financial (142 | 3.7%).
Management, Business, Science and Arts Occupations by Sex
Within the Management, Business, Science and Arts occupations in Scappoose, the most male-oriented occupations are Computers & Mathematics (100.0%), Life, Physical & Social Science (100.0%), and Computers, Engineering & Science (96.7%), while the most female-oriented occupations are Education, Arts & Media (100.0%), Legal Services & Support (100.0%), and Health Diagnosing & Treating (89.9%).
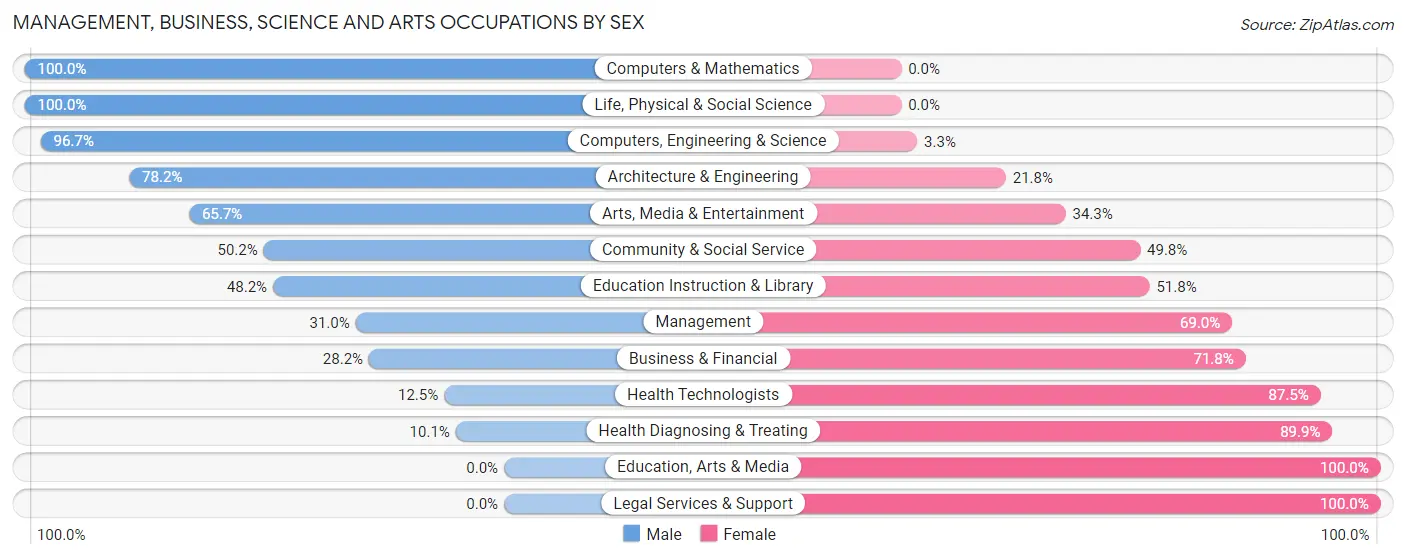
| Occupation | Male | Female |
| Management | 140 (31.0%) | 312 (69.0%) |
| Business & Financial | 40 (28.2%) | 102 (71.8%) |
| Computers, Engineering & Science | 347 (96.7%) | 12 (3.3%) |
| Computers & Mathematics | 286 (100.0%) | 0 (0.0%) |
| Architecture & Engineering | 43 (78.2%) | 12 (21.8%) |
| Life, Physical & Social Science | 18 (100.0%) | 0 (0.0%) |
| Community & Social Service | 159 (50.2%) | 158 (49.8%) |
| Education, Arts & Media | 0 (0.0%) | 23 (100.0%) |
| Legal Services & Support | 0 (0.0%) | 15 (100.0%) |
| Education Instruction & Library | 67 (48.2%) | 72 (51.8%) |
| Arts, Media & Entertainment | 92 (65.7%) | 48 (34.3%) |
| Health Diagnosing & Treating | 13 (10.1%) | 116 (89.9%) |
| Health Technologists | 13 (12.5%) | 91 (87.5%) |
| Total (Category) | 699 (50.0%) | 700 (50.0%) |
| Total (Overall) | 2,302 (59.3%) | 1,579 (40.7%) |
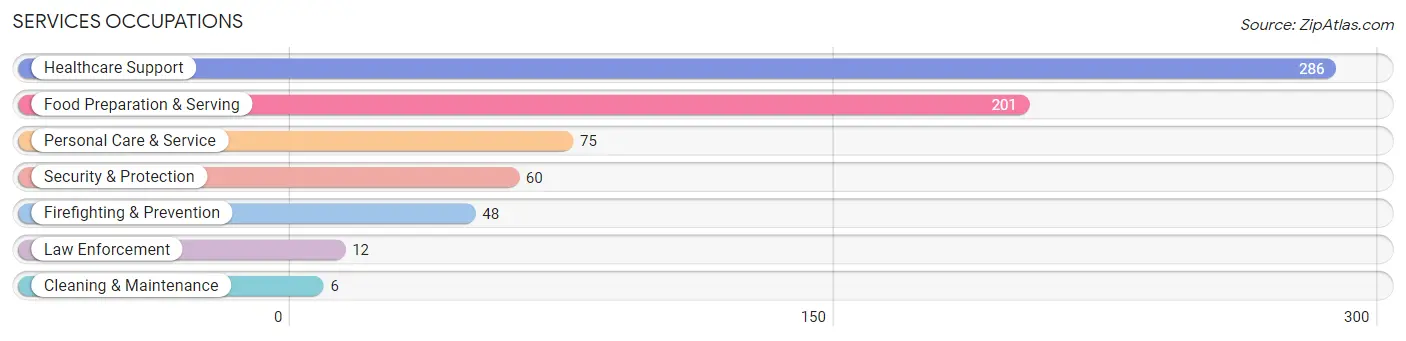
Services Occupations
The most common Services occupations in Scappoose are Healthcare Support (286 | 7.4%), Food Preparation & Serving (201 | 5.2%), Personal Care & Service (75 | 1.9%), Security & Protection (60 | 1.5%), and Firefighting & Prevention (48 | 1.2%).
Services Occupations by Sex
Within the Services occupations in Scappoose, the most male-oriented occupations are Security & Protection (100.0%), Firefighting & Prevention (100.0%), and Law Enforcement (100.0%), while the most female-oriented occupations are Food Preparation & Serving (82.6%), Healthcare Support (79.0%), and Personal Care & Service (52.0%).
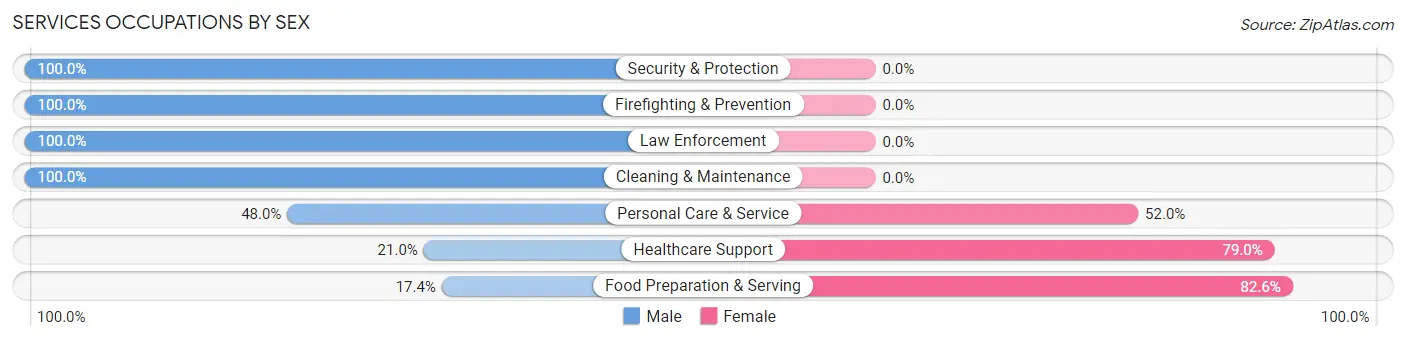
| Occupation | Male | Female |
| Healthcare Support | 60 (21.0%) | 226 (79.0%) |
| Security & Protection | 60 (100.0%) | 0 (0.0%) |
| Firefighting & Prevention | 48 (100.0%) | 0 (0.0%) |
| Law Enforcement | 12 (100.0%) | 0 (0.0%) |
| Food Preparation & Serving | 35 (17.4%) | 166 (82.6%) |
| Cleaning & Maintenance | 6 (100.0%) | 0 (0.0%) |
| Personal Care & Service | 36 (48.0%) | 39 (52.0%) |
| Total (Category) | 197 (31.4%) | 431 (68.6%) |
| Total (Overall) | 2,302 (59.3%) | 1,579 (40.7%) |
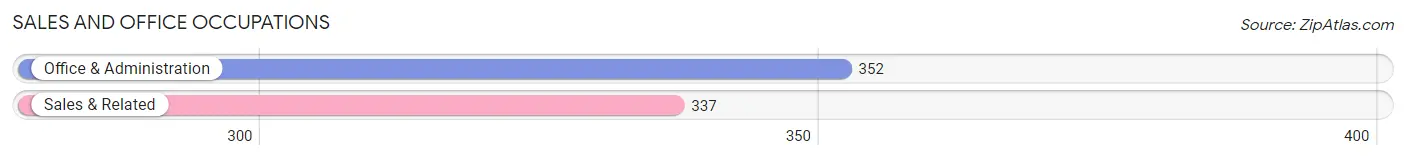
Sales and Office Occupations
The most common Sales and Office occupations in Scappoose are Office & Administration (352 | 9.1%), and Sales & Related (337 | 8.7%).
Sales and Office Occupations by Sex
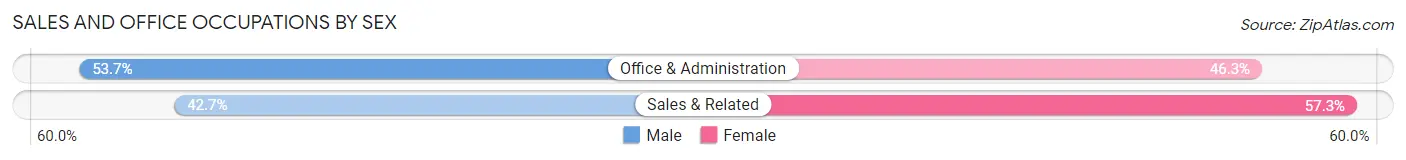
| Occupation | Male | Female |
| Sales & Related | 144 (42.7%) | 193 (57.3%) |
| Office & Administration | 189 (53.7%) | 163 (46.3%) |
| Total (Category) | 333 (48.3%) | 356 (51.7%) |
| Total (Overall) | 2,302 (59.3%) | 1,579 (40.7%) |
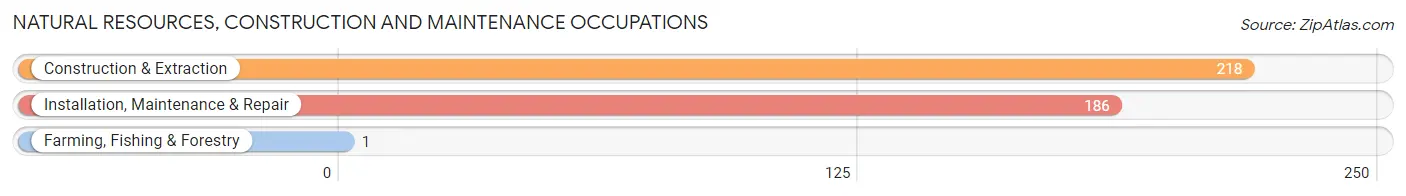
Natural Resources, Construction and Maintenance Occupations
The most common Natural Resources, Construction and Maintenance occupations in Scappoose are Construction & Extraction (218 | 5.6%), Installation, Maintenance & Repair (186 | 4.8%), and Farming, Fishing & Forestry (1 | 0.0%).
Natural Resources, Construction and Maintenance Occupations by Sex
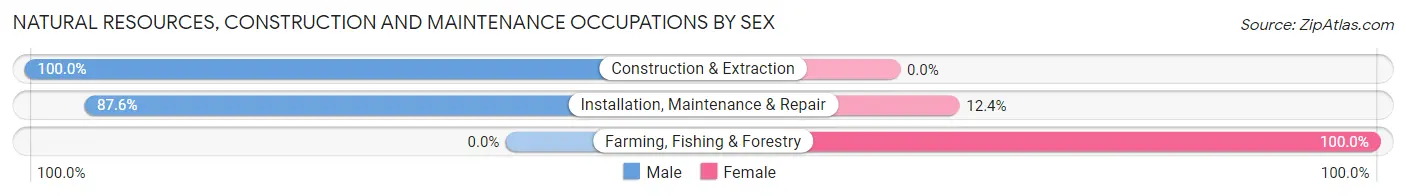
| Occupation | Male | Female |
| Farming, Fishing & Forestry | 0 (0.0%) | 1 (100.0%) |
| Construction & Extraction | 218 (100.0%) | 0 (0.0%) |
| Installation, Maintenance & Repair | 163 (87.6%) | 23 (12.4%) |
| Total (Category) | 381 (94.1%) | 24 (5.9%) |
| Total (Overall) | 2,302 (59.3%) | 1,579 (40.7%) |
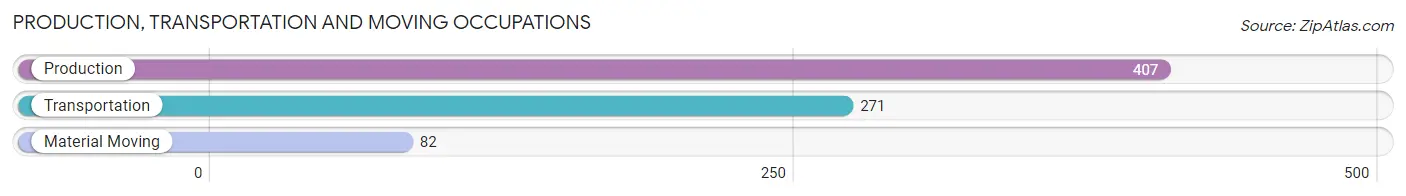
Production, Transportation and Moving Occupations
The most common Production, Transportation and Moving occupations in Scappoose are Production (407 | 10.5%), Transportation (271 | 7.0%), and Material Moving (82 | 2.1%).
Production, Transportation and Moving Occupations by Sex
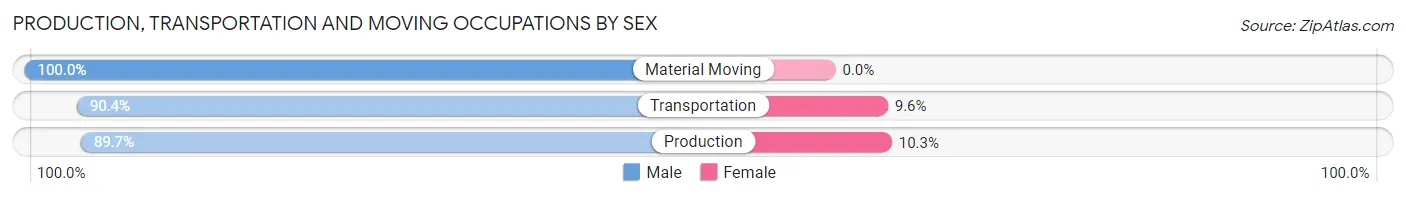
| Occupation | Male | Female |
| Production | 365 (89.7%) | 42 (10.3%) |
| Transportation | 245 (90.4%) | 26 (9.6%) |
| Material Moving | 82 (100.0%) | 0 (0.0%) |
| Total (Category) | 692 (91.0%) | 68 (8.9%) |
| Total (Overall) | 2,302 (59.3%) | 1,579 (40.7%) |
Employment Industries by Sex in Scappoose
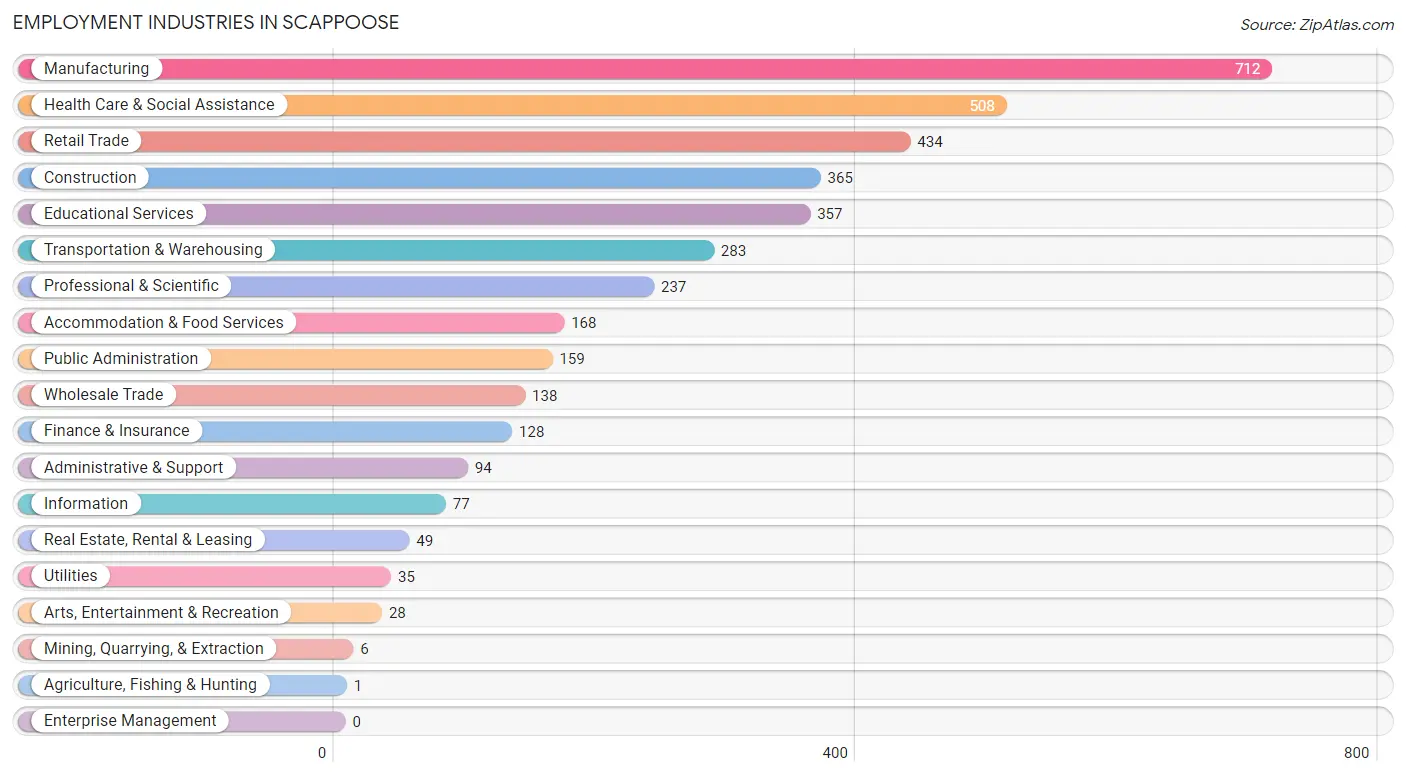
Employment Industries in Scappoose
The major employment industries in Scappoose include Manufacturing (712 | 18.3%), Health Care & Social Assistance (508 | 13.1%), Retail Trade (434 | 11.2%), Construction (365 | 9.4%), and Educational Services (357 | 9.2%).
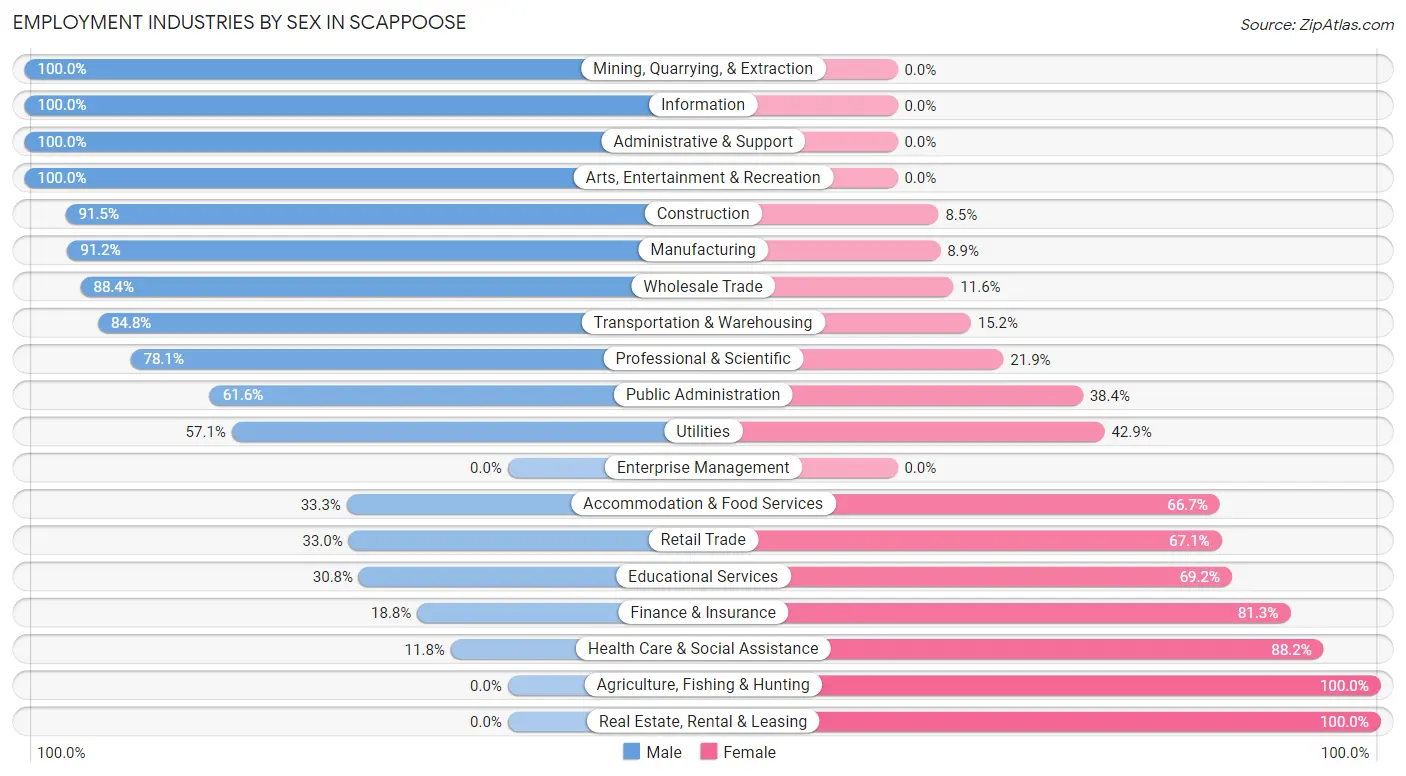
Employment Industries by Sex in Scappoose
The Scappoose industries that see more men than women are Mining, Quarrying, & Extraction (100.0%), Information (100.0%), and Administrative & Support (100.0%), whereas the industries that tend to have a higher number of women are Agriculture, Fishing & Hunting (100.0%), Real Estate, Rental & Leasing (100.0%), and Health Care & Social Assistance (88.2%).
| Industry | Male | Female |
| Agriculture, Fishing & Hunting | 0 (0.0%) | 1 (100.0%) |
| Mining, Quarrying, & Extraction | 6 (100.0%) | 0 (0.0%) |
| Construction | 334 (91.5%) | 31 (8.5%) |
| Manufacturing | 649 (91.1%) | 63 (8.8%) |
| Wholesale Trade | 122 (88.4%) | 16 (11.6%) |
| Retail Trade | 143 (33.0%) | 291 (67.0%) |
| Transportation & Warehousing | 240 (84.8%) | 43 (15.2%) |
| Utilities | 20 (57.1%) | 15 (42.9%) |
| Information | 77 (100.0%) | 0 (0.0%) |
| Finance & Insurance | 24 (18.8%) | 104 (81.2%) |
| Real Estate, Rental & Leasing | 0 (0.0%) | 49 (100.0%) |
| Professional & Scientific | 185 (78.1%) | 52 (21.9%) |
| Enterprise Management | 0 (0.0%) | 0 (0.0%) |
| Administrative & Support | 94 (100.0%) | 0 (0.0%) |
| Educational Services | 110 (30.8%) | 247 (69.2%) |
| Health Care & Social Assistance | 60 (11.8%) | 448 (88.2%) |
| Arts, Entertainment & Recreation | 28 (100.0%) | 0 (0.0%) |
| Accommodation & Food Services | 56 (33.3%) | 112 (66.7%) |
| Public Administration | 98 (61.6%) | 61 (38.4%) |
| Total | 2,302 (59.3%) | 1,579 (40.7%) |
Education in Scappoose
School Enrollment in Scappoose
The most common levels of schooling among the 1,730 students in Scappoose are middle school (592 | 34.2%), elementary school (398 | 23.0%), and high school (378 | 21.8%).
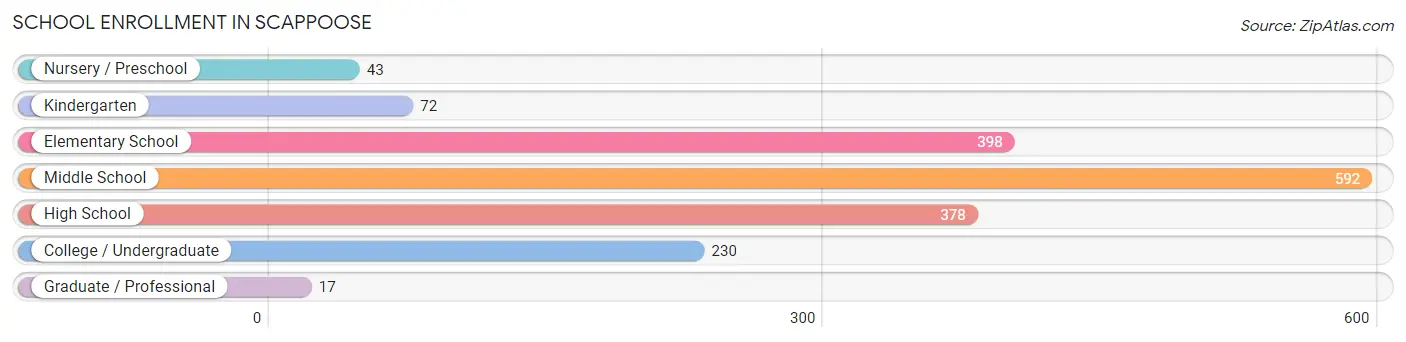
| School Level | # Students | % Students |
| Nursery / Preschool | 43 | 2.5% |
| Kindergarten | 72 | 4.2% |
| Elementary School | 398 | 23.0% |
| Middle School | 592 | 34.2% |
| High School | 378 | 21.8% |
| College / Undergraduate | 230 | 13.3% |
| Graduate / Professional | 17 | 1.0% |
| Total | 1,730 | 100.0% |
School Enrollment by Age by Funding Source in Scappoose
Out of a total of 1,730 students who are enrolled in schools in Scappoose, 149 (8.6%) attend a private institution, while the remaining 1,581 (91.4%) are enrolled in public schools. The age group of 3 to 4 year olds has the highest likelihood of being enrolled in private schools, with 31 (72.1% in the age bracket) enrolled. Conversely, the age group of 20 to 24 year olds has the lowest likelihood of being enrolled in a private school, with 110 (100.0% in the age bracket) attending a public institution.
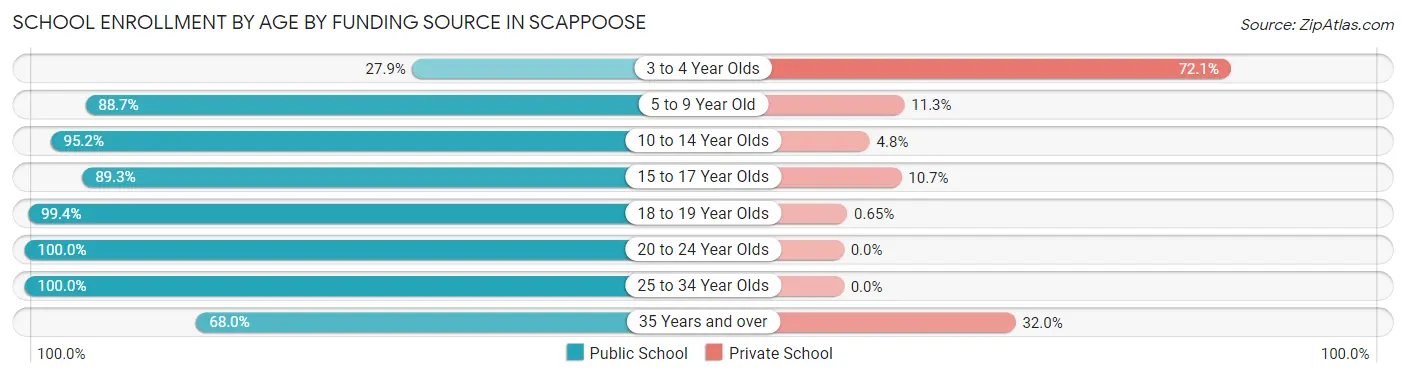
| Age Bracket | Public School | Private School |
| 3 to 4 Year Olds | 12 (27.9%) | 31 (72.1%) |
| 5 to 9 Year Old | 353 (88.7%) | 45 (11.3%) |
| 10 to 14 Year Olds | 669 (95.2%) | 34 (4.8%) |
| 15 to 17 Year Olds | 241 (89.3%) | 29 (10.7%) |
| 18 to 19 Year Olds | 152 (99.4%) | 1 (0.6%) |
| 20 to 24 Year Olds | 110 (100.0%) | 0 (0.0%) |
| 25 to 34 Year Olds | 28 (100.0%) | 0 (0.0%) |
| 35 Years and over | 17 (68.0%) | 8 (32.0%) |
| Total | 1,581 (91.4%) | 149 (8.6%) |
Educational Attainment by Field of Study in Scappoose
Business (245 | 18.9%), education (188 | 14.5%), science & technology (157 | 12.1%), visual & performing arts (138 | 10.6%), and liberal arts & history (137 | 10.6%) are the most common fields of study among 1,297 individuals in Scappoose who have obtained a bachelor's degree or higher.
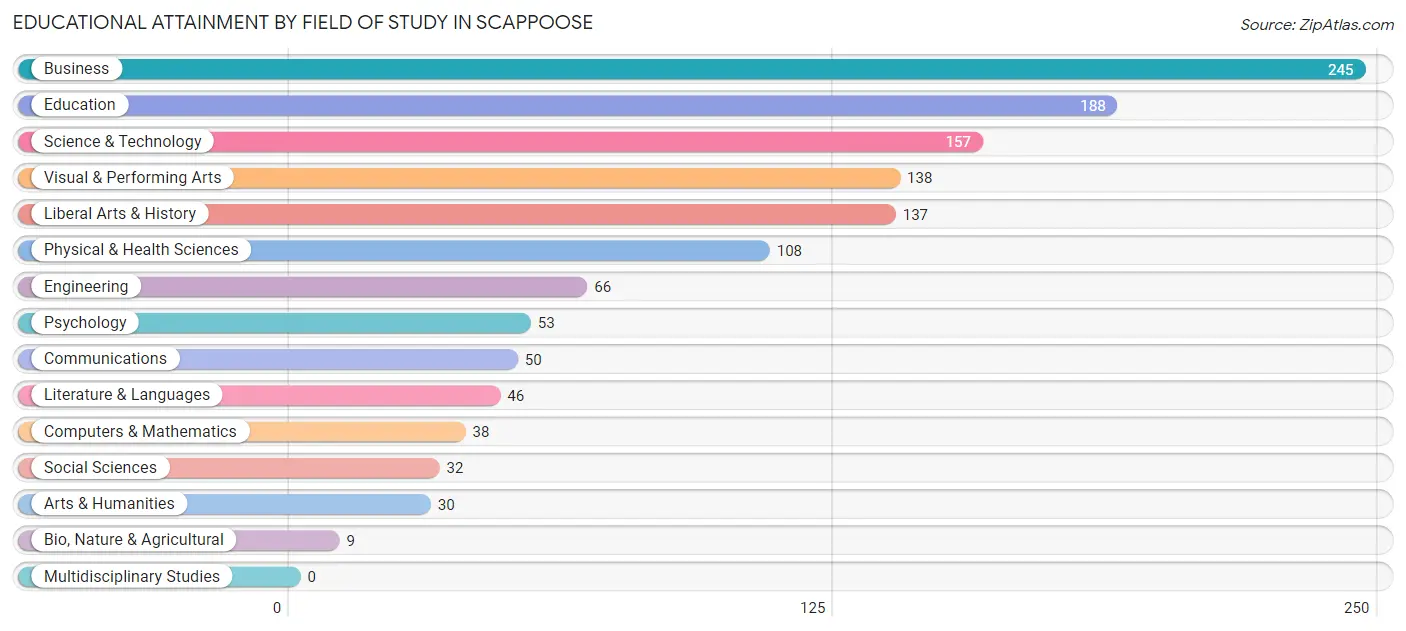
| Field of Study | # Graduates | % Graduates |
| Computers & Mathematics | 38 | 2.9% |
| Bio, Nature & Agricultural | 9 | 0.7% |
| Physical & Health Sciences | 108 | 8.3% |
| Psychology | 53 | 4.1% |
| Social Sciences | 32 | 2.5% |
| Engineering | 66 | 5.1% |
| Multidisciplinary Studies | 0 | 0.0% |
| Science & Technology | 157 | 12.1% |
| Business | 245 | 18.9% |
| Education | 188 | 14.5% |
| Literature & Languages | 46 | 3.5% |
| Liberal Arts & History | 137 | 10.6% |
| Visual & Performing Arts | 138 | 10.6% |
| Communications | 50 | 3.9% |
| Arts & Humanities | 30 | 2.3% |
| Total | 1,297 | 100.0% |
Transportation & Commute in Scappoose
Vehicle Availability by Sex in Scappoose
The most prevalent vehicle ownership categories in Scappoose are males with 2 vehicles (858, accounting for 37.9%) and females with 2 vehicles (586, making up 55.4%).
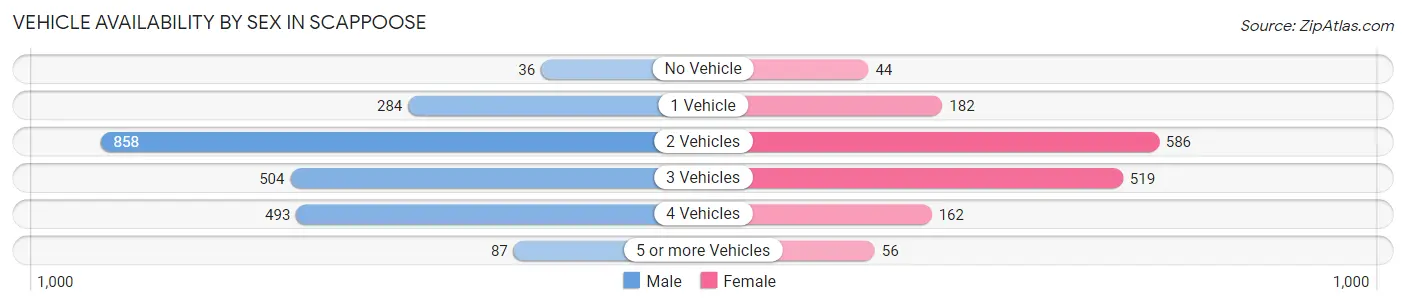
| Vehicles Available | Male | Female |
| No Vehicle | 36 (1.6%) | 44 (2.8%) |
| 1 Vehicle | 284 (12.6%) | 182 (11.7%) |
| 2 Vehicles | 858 (37.9%) | 586 (37.8%) |
| 3 Vehicles | 504 (22.3%) | 519 (33.5%) |
| 4 Vehicles | 493 (21.8%) | 162 (10.5%) |
| 5 or more Vehicles | 87 (3.8%) | 56 (3.6%) |
| Total | 2,262 (100.0%) | 1,549 (100.0%) |
Commute Time in Scappoose
The most frequently occuring commute durations in Scappoose are 30 to 34 minutes (818 commuters, 23.6%), 45 to 59 minutes (674 commuters, 19.5%), and 5 to 9 minutes (347 commuters, 10.0%).
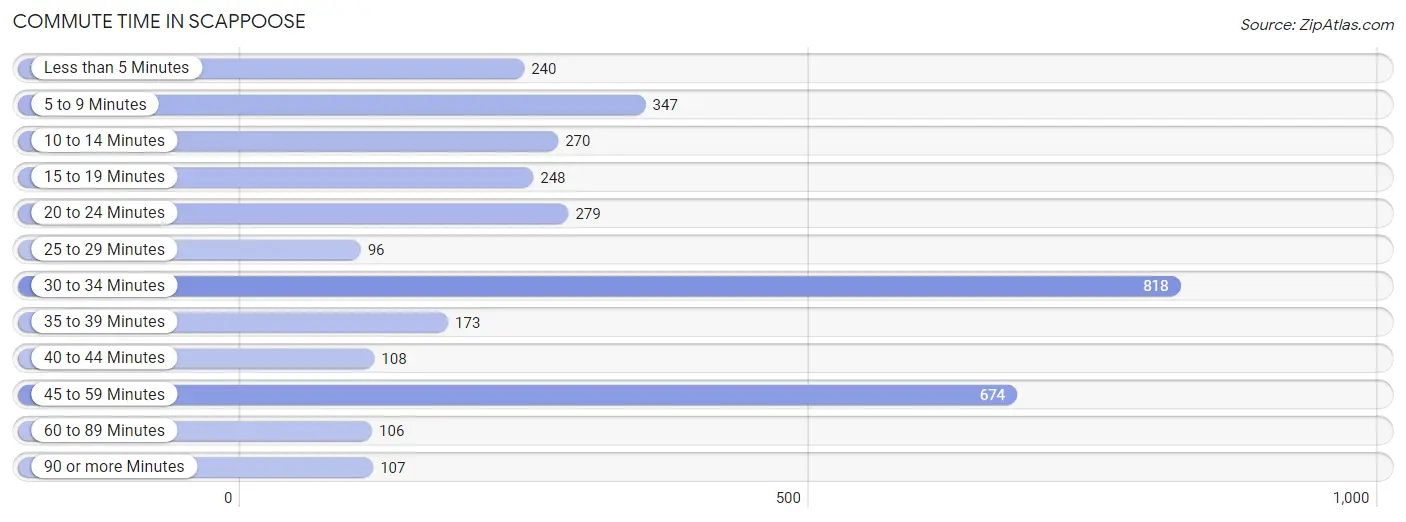
| Commute Time | # Commuters | % Commuters |
| Less than 5 Minutes | 240 | 6.9% |
| 5 to 9 Minutes | 347 | 10.0% |
| 10 to 14 Minutes | 270 | 7.8% |
| 15 to 19 Minutes | 248 | 7.2% |
| 20 to 24 Minutes | 279 | 8.1% |
| 25 to 29 Minutes | 96 | 2.8% |
| 30 to 34 Minutes | 818 | 23.6% |
| 35 to 39 Minutes | 173 | 5.0% |
| 40 to 44 Minutes | 108 | 3.1% |
| 45 to 59 Minutes | 674 | 19.5% |
| 60 to 89 Minutes | 106 | 3.1% |
| 90 or more Minutes | 107 | 3.1% |
Commute Time by Sex in Scappoose
The most common commute times in Scappoose are 30 to 34 minutes (663 commuters, 31.9%) for males and 45 to 59 minutes (397 commuters, 28.6%) for females.

| Commute Time | Male | Female |
| Less than 5 Minutes | 85 (4.1%) | 155 (11.2%) |
| 5 to 9 Minutes | 167 (8.0%) | 180 (13.0%) |
| 10 to 14 Minutes | 137 (6.6%) | 133 (9.6%) |
| 15 to 19 Minutes | 131 (6.3%) | 117 (8.4%) |
| 20 to 24 Minutes | 204 (9.8%) | 75 (5.4%) |
| 25 to 29 Minutes | 81 (3.9%) | 15 (1.1%) |
| 30 to 34 Minutes | 663 (31.9%) | 155 (11.2%) |
| 35 to 39 Minutes | 109 (5.2%) | 64 (4.6%) |
| 40 to 44 Minutes | 35 (1.7%) | 73 (5.3%) |
| 45 to 59 Minutes | 277 (13.3%) | 397 (28.6%) |
| 60 to 89 Minutes | 83 (4.0%) | 23 (1.7%) |
| 90 or more Minutes | 107 (5.1%) | 0 (0.0%) |
Time of Departure to Work by Sex in Scappoose
The most frequent times of departure to work in Scappoose are 8:00 AM to 8:29 AM (334, 16.1%) for males and 7:30 AM to 7:59 AM (246, 17.7%) for females.
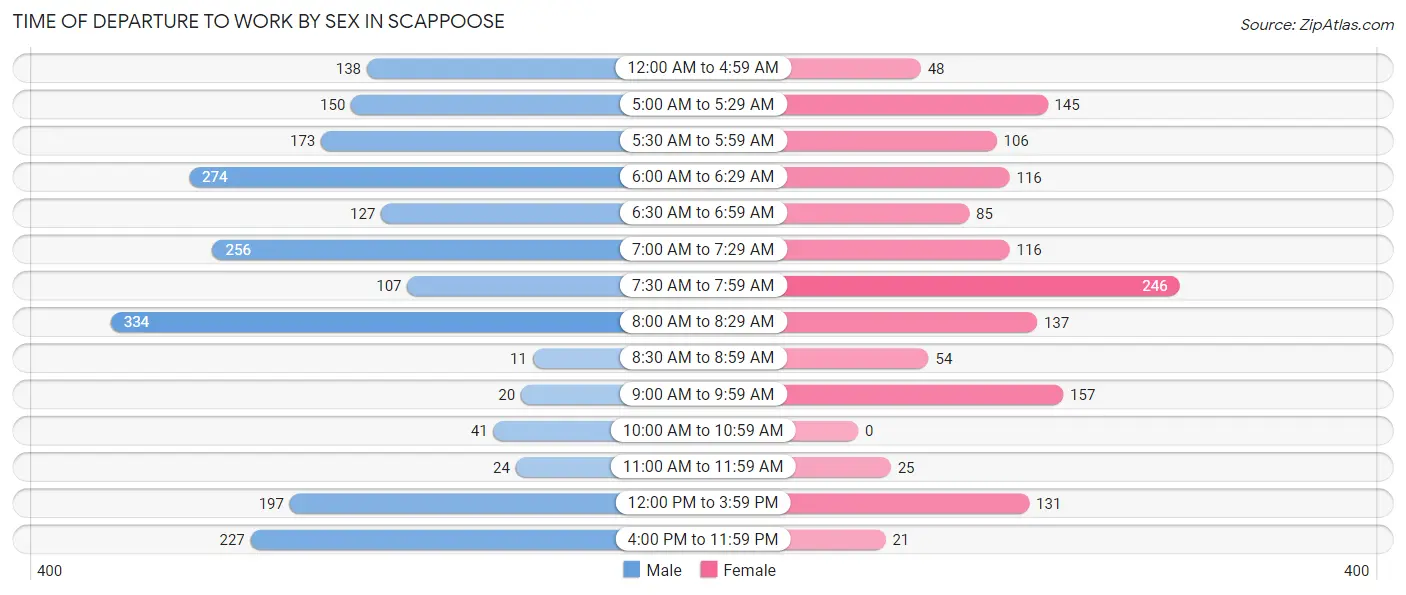
| Time of Departure | Male | Female |
| 12:00 AM to 4:59 AM | 138 (6.6%) | 48 (3.5%) |
| 5:00 AM to 5:29 AM | 150 (7.2%) | 145 (10.4%) |
| 5:30 AM to 5:59 AM | 173 (8.3%) | 106 (7.6%) |
| 6:00 AM to 6:29 AM | 274 (13.2%) | 116 (8.4%) |
| 6:30 AM to 6:59 AM | 127 (6.1%) | 85 (6.1%) |
| 7:00 AM to 7:29 AM | 256 (12.3%) | 116 (8.4%) |
| 7:30 AM to 7:59 AM | 107 (5.1%) | 246 (17.7%) |
| 8:00 AM to 8:29 AM | 334 (16.1%) | 137 (9.9%) |
| 8:30 AM to 8:59 AM | 11 (0.5%) | 54 (3.9%) |
| 9:00 AM to 9:59 AM | 20 (1.0%) | 157 (11.3%) |
| 10:00 AM to 10:59 AM | 41 (2.0%) | 0 (0.0%) |
| 11:00 AM to 11:59 AM | 24 (1.1%) | 25 (1.8%) |
| 12:00 PM to 3:59 PM | 197 (9.5%) | 131 (9.4%) |
| 4:00 PM to 11:59 PM | 227 (10.9%) | 21 (1.5%) |
| Total | 2,079 (100.0%) | 1,387 (100.0%) |
Housing Occupancy in Scappoose
Occupancy by Ownership in Scappoose
Of the total 2,948 dwellings in Scappoose, owner-occupied units account for 2,304 (78.1%), while renter-occupied units make up 644 (21.8%).
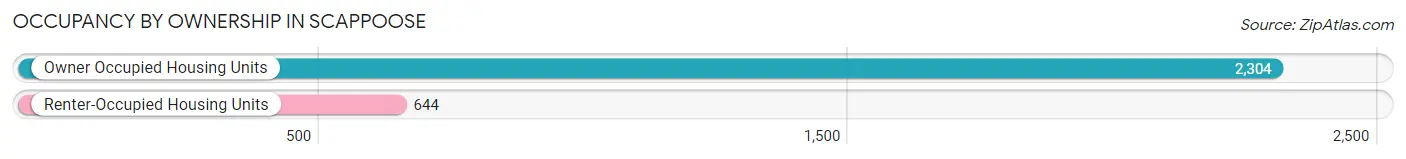
| Occupancy | # Housing Units | % Housing Units |
| Owner Occupied Housing Units | 2,304 | 78.1% |
| Renter-Occupied Housing Units | 644 | 21.8% |
| Total Occupied Housing Units | 2,948 | 100.0% |
Occupancy by Household Size in Scappoose
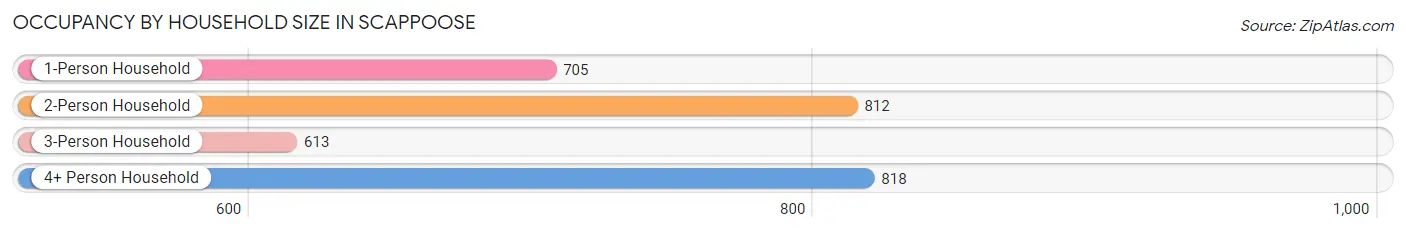
| Household Size | # Housing Units | % Housing Units |
| 1-Person Household | 705 | 23.9% |
| 2-Person Household | 812 | 27.5% |
| 3-Person Household | 613 | 20.8% |
| 4+ Person Household | 818 | 27.8% |
| Total Housing Units | 2,948 | 100.0% |
Occupancy by Ownership by Household Size in Scappoose
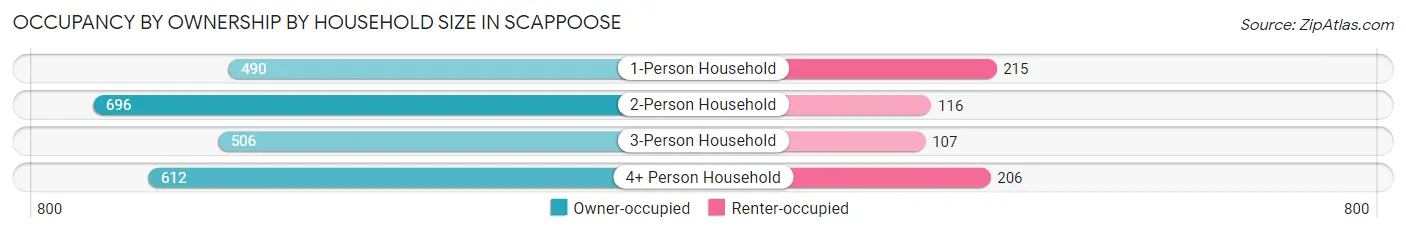
| Household Size | Owner-occupied | Renter-occupied |
| 1-Person Household | 490 (69.5%) | 215 (30.5%) |
| 2-Person Household | 696 (85.7%) | 116 (14.3%) |
| 3-Person Household | 506 (82.5%) | 107 (17.5%) |
| 4+ Person Household | 612 (74.8%) | 206 (25.2%) |
| Total Housing Units | 2,304 (78.1%) | 644 (21.8%) |
Occupancy by Educational Attainment in Scappoose
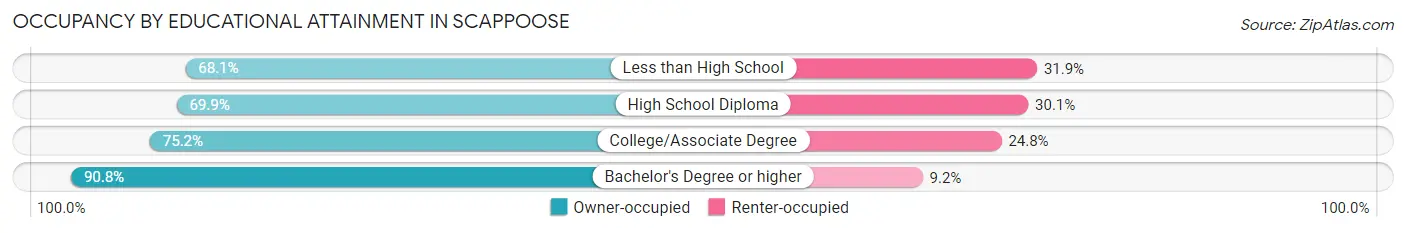
| Household Size | Owner-occupied | Renter-occupied |
| Less than High School | 109 (68.1%) | 51 (31.9%) |
| High School Diploma | 392 (69.9%) | 169 (30.1%) |
| College/Associate Degree | 1,053 (75.2%) | 348 (24.8%) |
| Bachelor's Degree or higher | 750 (90.8%) | 76 (9.2%) |
Occupancy by Age of Householder in Scappoose
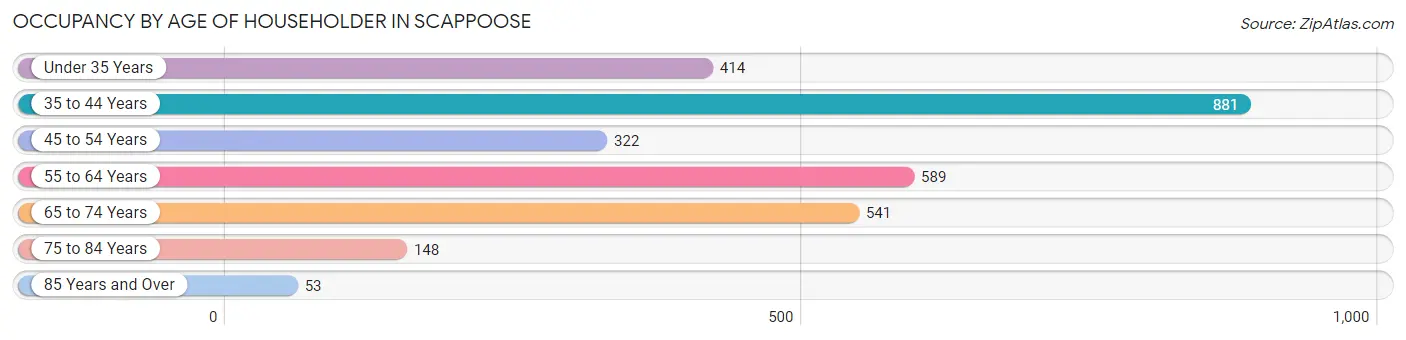
| Age Bracket | # Households | % Households |
| Under 35 Years | 414 | 14.0% |
| 35 to 44 Years | 881 | 29.9% |
| 45 to 54 Years | 322 | 10.9% |
| 55 to 64 Years | 589 | 20.0% |
| 65 to 74 Years | 541 | 18.3% |
| 75 to 84 Years | 148 | 5.0% |
| 85 Years and Over | 53 | 1.8% |
| Total | 2,948 | 100.0% |
Housing Finances in Scappoose
Median Income by Occupancy in Scappoose
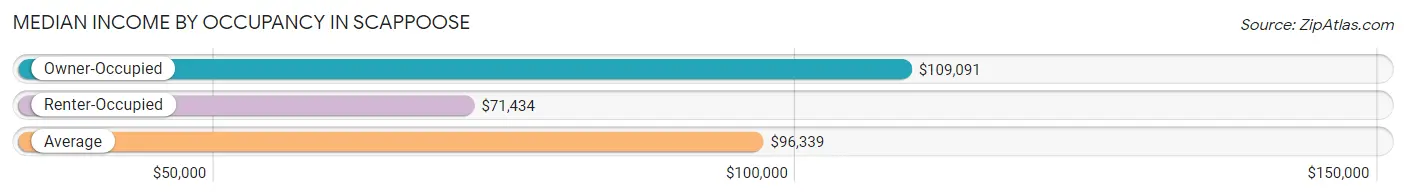
| Occupancy Type | # Households | Median Income |
| Owner-Occupied | 2,304 (78.1%) | $109,091 |
| Renter-Occupied | 644 (21.8%) | $71,434 |
| Average | 2,948 (100.0%) | $96,339 |
Occupancy by Householder Income Bracket in Scappoose
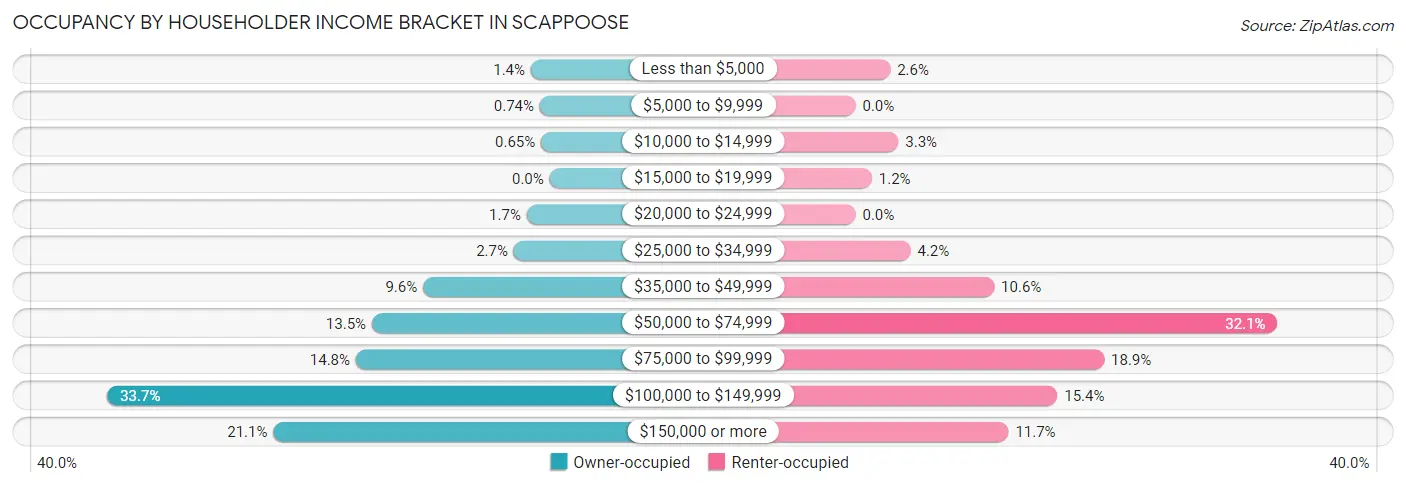
| Income Bracket | Owner-occupied | Renter-occupied |
| Less than $5,000 | 33 (1.4%) | 17 (2.6%) |
| $5,000 to $9,999 | 17 (0.7%) | 0 (0.0%) |
| $10,000 to $14,999 | 15 (0.6%) | 21 (3.3%) |
| $15,000 to $19,999 | 0 (0.0%) | 8 (1.2%) |
| $20,000 to $24,999 | 40 (1.7%) | 0 (0.0%) |
| $25,000 to $34,999 | 63 (2.7%) | 27 (4.2%) |
| $35,000 to $49,999 | 222 (9.6%) | 68 (10.6%) |
| $50,000 to $74,999 | 312 (13.5%) | 207 (32.1%) |
| $75,000 to $99,999 | 340 (14.8%) | 122 (18.9%) |
| $100,000 to $149,999 | 777 (33.7%) | 99 (15.4%) |
| $150,000 or more | 485 (21.0%) | 75 (11.7%) |
| Total | 2,304 (100.0%) | 644 (100.0%) |
Monthly Housing Cost Tiers in Scappoose
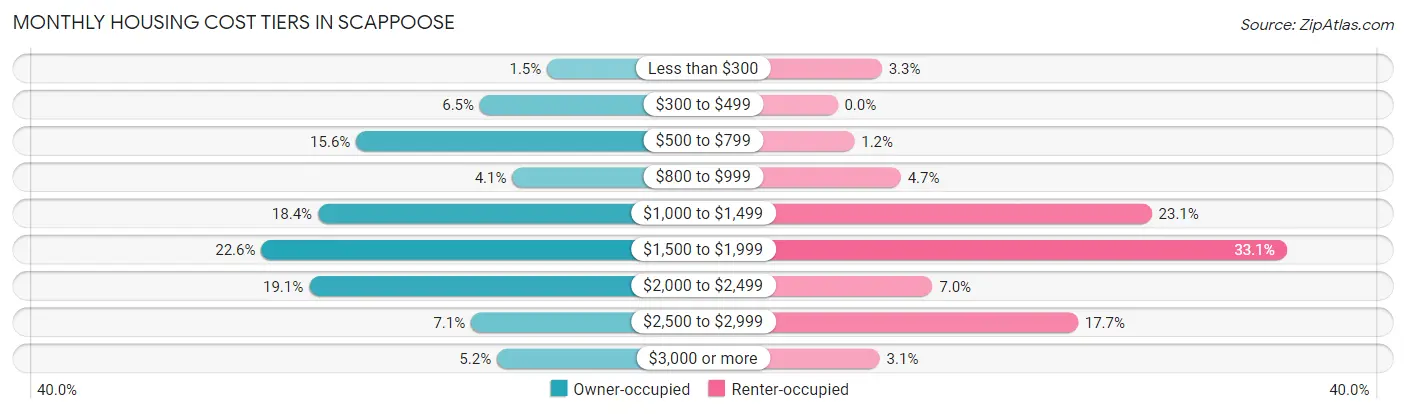
| Monthly Cost | Owner-occupied | Renter-occupied |
| Less than $300 | 35 (1.5%) | 21 (3.3%) |
| $300 to $499 | 149 (6.5%) | 0 (0.0%) |
| $500 to $799 | 359 (15.6%) | 8 (1.2%) |
| $800 to $999 | 94 (4.1%) | 30 (4.7%) |
| $1,000 to $1,499 | 424 (18.4%) | 149 (23.1%) |
| $1,500 to $1,999 | 520 (22.6%) | 213 (33.1%) |
| $2,000 to $2,499 | 439 (19.1%) | 45 (7.0%) |
| $2,500 to $2,999 | 164 (7.1%) | 114 (17.7%) |
| $3,000 or more | 120 (5.2%) | 20 (3.1%) |
| Total | 2,304 (100.0%) | 644 (100.0%) |
Physical Housing Characteristics in Scappoose
Housing Structures in Scappoose
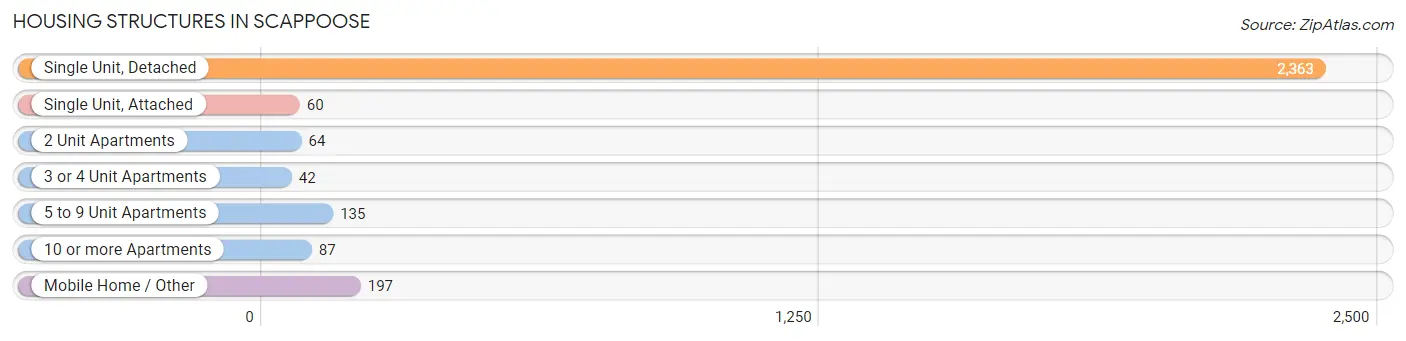
| Structure Type | # Housing Units | % Housing Units |
| Single Unit, Detached | 2,363 | 80.2% |
| Single Unit, Attached | 60 | 2.0% |
| 2 Unit Apartments | 64 | 2.2% |
| 3 or 4 Unit Apartments | 42 | 1.4% |
| 5 to 9 Unit Apartments | 135 | 4.6% |
| 10 or more Apartments | 87 | 2.9% |
| Mobile Home / Other | 197 | 6.7% |
| Total | 2,948 | 100.0% |
Housing Structures by Occupancy in Scappoose
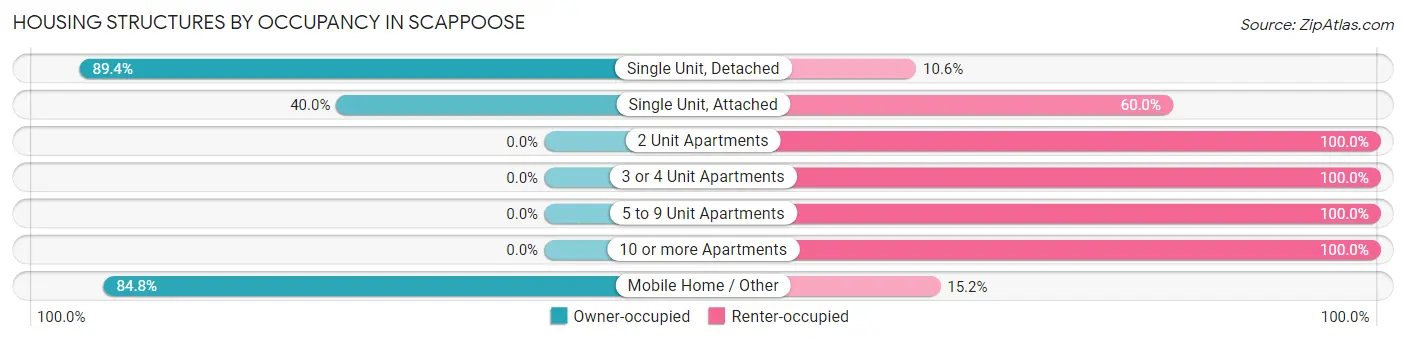
| Structure Type | Owner-occupied | Renter-occupied |
| Single Unit, Detached | 2,113 (89.4%) | 250 (10.6%) |
| Single Unit, Attached | 24 (40.0%) | 36 (60.0%) |
| 2 Unit Apartments | 0 (0.0%) | 64 (100.0%) |
| 3 or 4 Unit Apartments | 0 (0.0%) | 42 (100.0%) |
| 5 to 9 Unit Apartments | 0 (0.0%) | 135 (100.0%) |
| 10 or more Apartments | 0 (0.0%) | 87 (100.0%) |
| Mobile Home / Other | 167 (84.8%) | 30 (15.2%) |
| Total | 2,304 (78.1%) | 644 (21.8%) |
Housing Structures by Number of Rooms in Scappoose
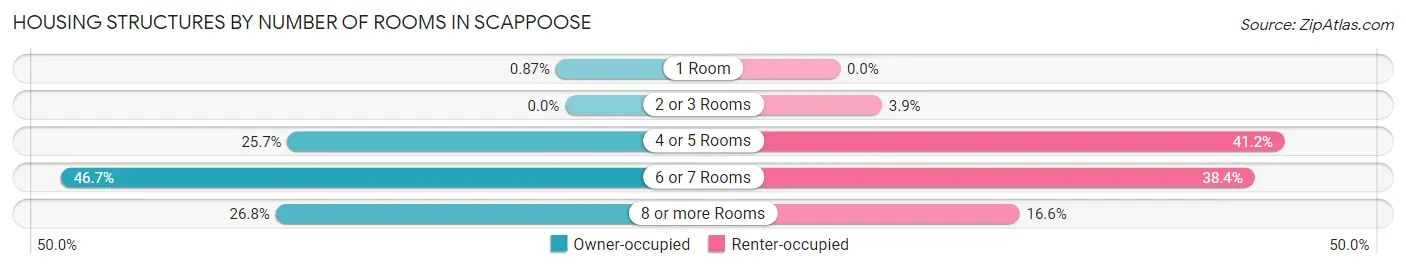
| Number of Rooms | Owner-occupied | Renter-occupied |
| 1 Room | 20 (0.9%) | 0 (0.0%) |
| 2 or 3 Rooms | 0 (0.0%) | 25 (3.9%) |
| 4 or 5 Rooms | 592 (25.7%) | 265 (41.1%) |
| 6 or 7 Rooms | 1,075 (46.7%) | 247 (38.4%) |
| 8 or more Rooms | 617 (26.8%) | 107 (16.6%) |
| Total | 2,304 (100.0%) | 644 (100.0%) |
Housing Structure by Heating Type in Scappoose
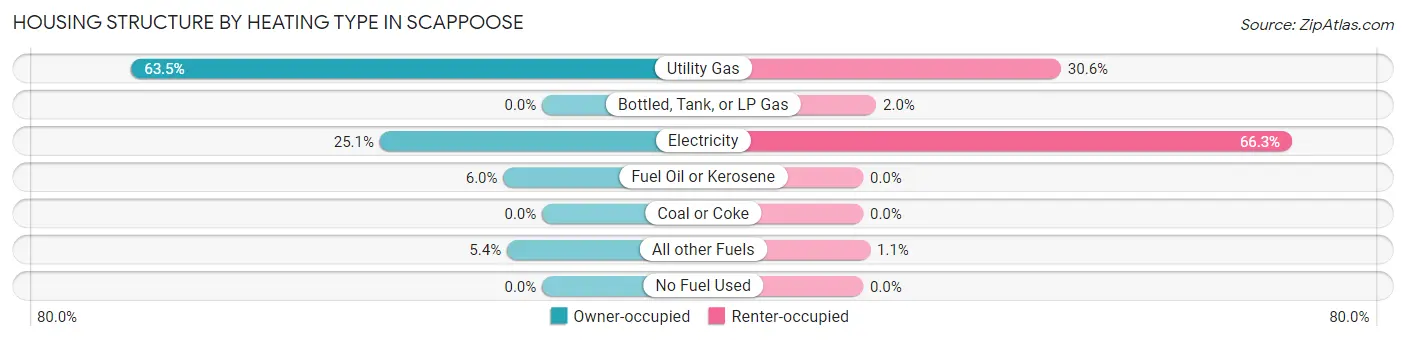
| Heating Type | Owner-occupied | Renter-occupied |
| Utility Gas | 1,463 (63.5%) | 197 (30.6%) |
| Bottled, Tank, or LP Gas | 0 (0.0%) | 13 (2.0%) |
| Electricity | 578 (25.1%) | 427 (66.3%) |
| Fuel Oil or Kerosene | 138 (6.0%) | 0 (0.0%) |
| Coal or Coke | 0 (0.0%) | 0 (0.0%) |
| All other Fuels | 125 (5.4%) | 7 (1.1%) |
| No Fuel Used | 0 (0.0%) | 0 (0.0%) |
| Total | 2,304 (100.0%) | 644 (100.0%) |
Household Vehicle Usage in Scappoose
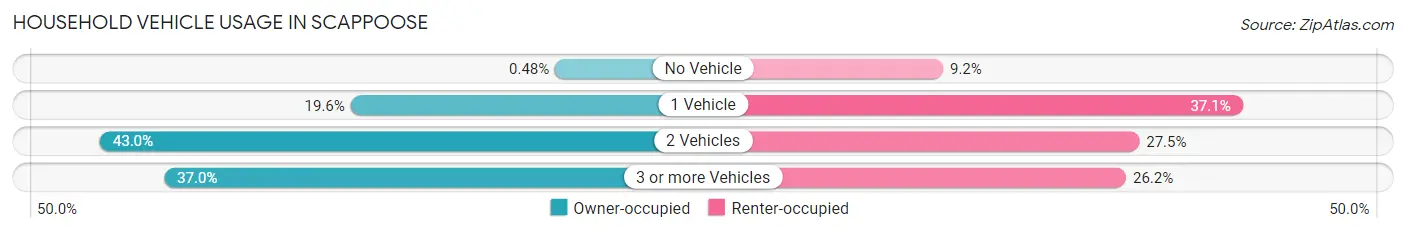
| Vehicles per Household | Owner-occupied | Renter-occupied |
| No Vehicle | 11 (0.5%) | 59 (9.2%) |
| 1 Vehicle | 451 (19.6%) | 239 (37.1%) |
| 2 Vehicles | 990 (43.0%) | 177 (27.5%) |
| 3 or more Vehicles | 852 (37.0%) | 169 (26.2%) |
| Total | 2,304 (100.0%) | 644 (100.0%) |
Real Estate & Mortgages in Scappoose
Real Estate and Mortgage Overview in Scappoose
| Characteristic | Without Mortgage | With Mortgage |
| Housing Units | 640 | 1,664 |
| Median Property Value | $395,700 | $413,300 |
| Median Household Income | $65,104 | $373 |
| Monthly Housing Costs | $625 | $120 |
| Real Estate Taxes | $3,712 | $3 |
Property Value by Mortgage Status in Scappoose
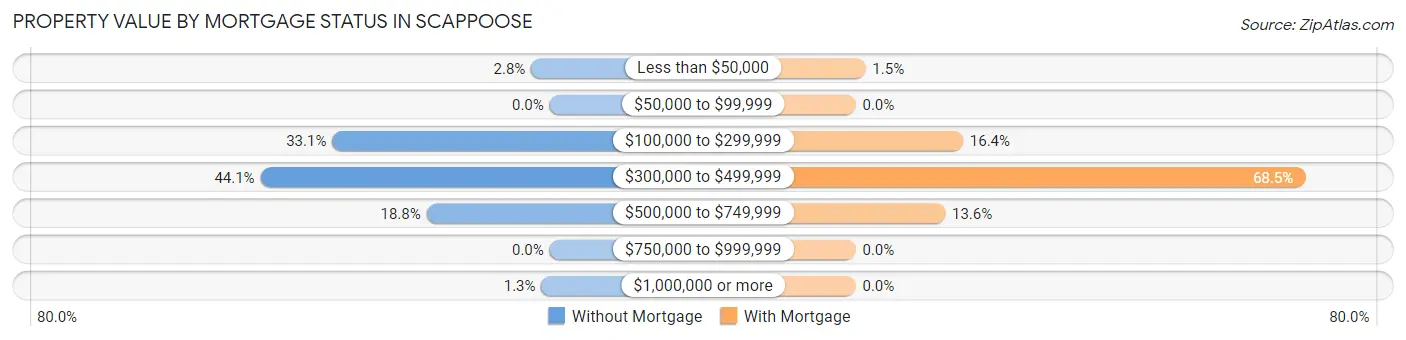
| Property Value | Without Mortgage | With Mortgage |
| Less than $50,000 | 18 (2.8%) | 25 (1.5%) |
| $50,000 to $99,999 | 0 (0.0%) | 0 (0.0%) |
| $100,000 to $299,999 | 212 (33.1%) | 272 (16.4%) |
| $300,000 to $499,999 | 282 (44.1%) | 1,140 (68.5%) |
| $500,000 to $749,999 | 120 (18.8%) | 227 (13.6%) |
| $750,000 to $999,999 | 0 (0.0%) | 0 (0.0%) |
| $1,000,000 or more | 8 (1.3%) | 0 (0.0%) |
| Total | 640 (100.0%) | 1,664 (100.0%) |
Household Income by Mortgage Status in Scappoose
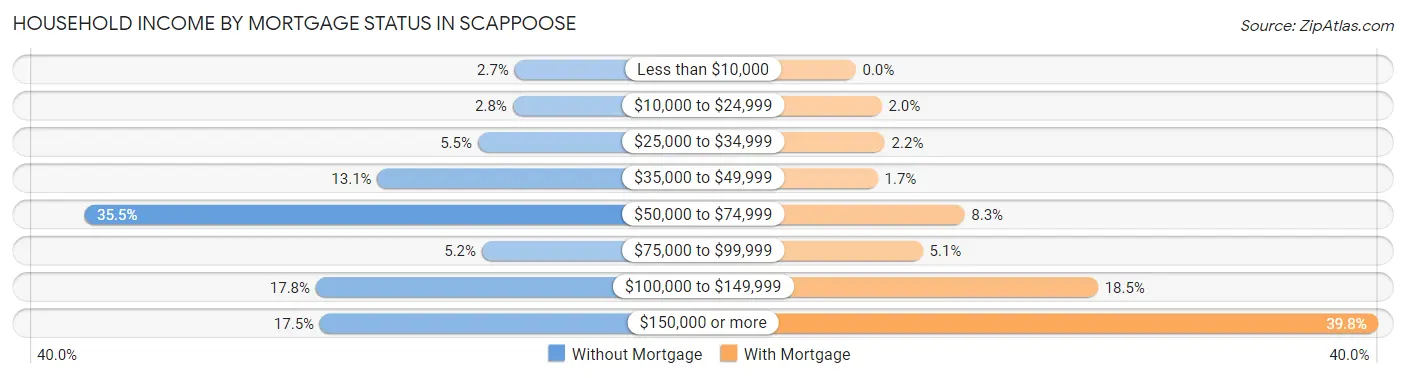
| Household Income | Without Mortgage | With Mortgage |
| Less than $10,000 | 17 (2.7%) | 0 (0.0%) |
| $10,000 to $24,999 | 18 (2.8%) | 33 (2.0%) |
| $25,000 to $34,999 | 35 (5.5%) | 37 (2.2%) |
| $35,000 to $49,999 | 84 (13.1%) | 28 (1.7%) |
| $50,000 to $74,999 | 227 (35.5%) | 138 (8.3%) |
| $75,000 to $99,999 | 33 (5.2%) | 85 (5.1%) |
| $100,000 to $149,999 | 114 (17.8%) | 307 (18.4%) |
| $150,000 or more | 112 (17.5%) | 663 (39.8%) |
| Total | 640 (100.0%) | 1,664 (100.0%) |
Property Value to Household Income Ratio in Scappoose
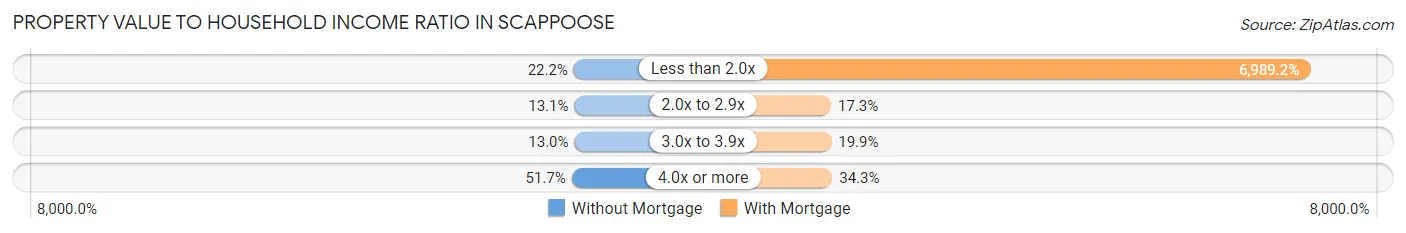
| Value-to-Income Ratio | Without Mortgage | With Mortgage |
| Less than 2.0x | 142 (22.2%) | 116,300 (6,989.2%) |
| 2.0x to 2.9x | 84 (13.1%) | 287 (17.2%) |
| 3.0x to 3.9x | 83 (13.0%) | 331 (19.9%) |
| 4.0x or more | 331 (51.7%) | 570 (34.3%) |
| Total | 640 (100.0%) | 1,664 (100.0%) |
Real Estate Taxes by Mortgage Status in Scappoose
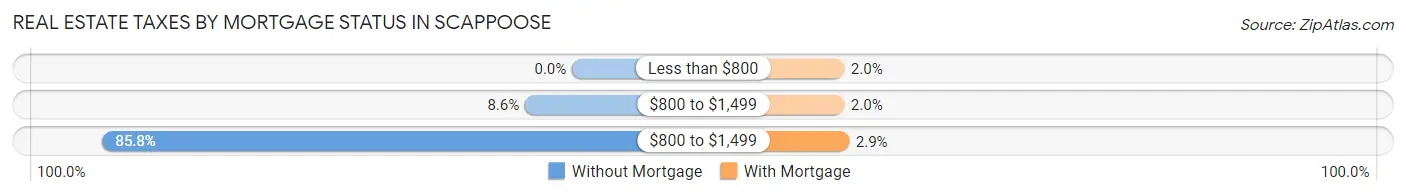
| Property Taxes | Without Mortgage | With Mortgage |
| Less than $800 | 0 (0.0%) | 33 (2.0%) |
| $800 to $1,499 | 55 (8.6%) | 33 (2.0%) |
| $800 to $1,499 | 549 (85.8%) | 48 (2.9%) |
| Total | 640 (100.0%) | 1,664 (100.0%) |
Health & Disability in Scappoose
Health Insurance Coverage by Age in Scappoose
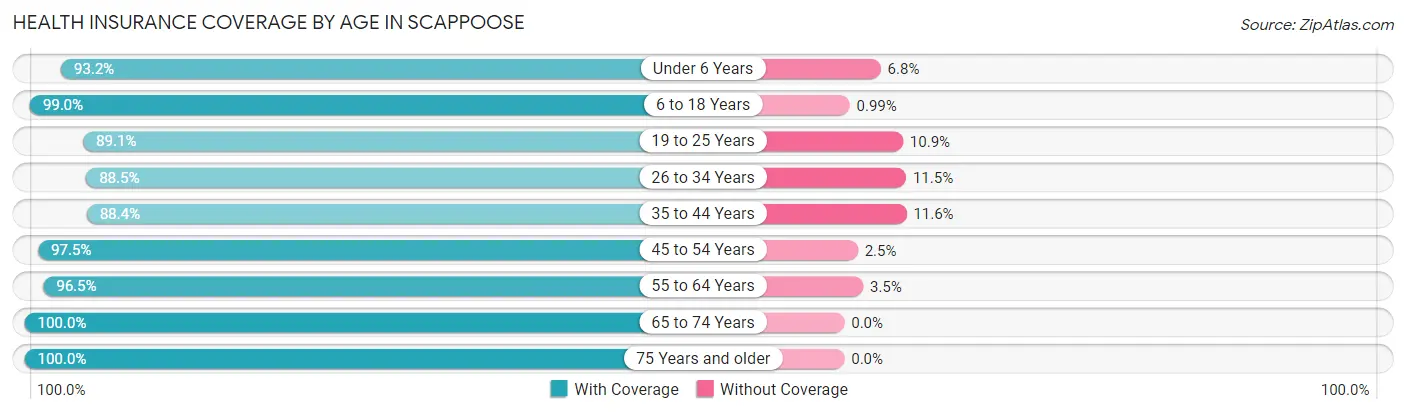
| Age Bracket | With Coverage | Without Coverage |
| Under 6 Years | 550 (93.2%) | 40 (6.8%) |
| 6 to 18 Years | 1,499 (99.0%) | 15 (1.0%) |
| 19 to 25 Years | 497 (89.1%) | 61 (10.9%) |
| 26 to 34 Years | 631 (88.5%) | 82 (11.5%) |
| 35 to 44 Years | 1,503 (88.4%) | 197 (11.6%) |
| 45 to 54 Years | 819 (97.5%) | 21 (2.5%) |
| 55 to 64 Years | 771 (96.5%) | 28 (3.5%) |
| 65 to 74 Years | 855 (100.0%) | 0 (0.0%) |
| 75 Years and older | 407 (100.0%) | 0 (0.0%) |
| Total | 7,532 (94.4%) | 444 (5.6%) |
Health Insurance Coverage by Citizenship Status in Scappoose
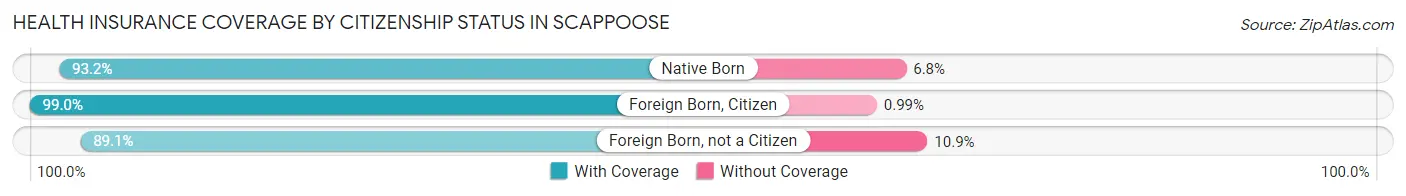
| Citizenship Status | With Coverage | Without Coverage |
| Native Born | 550 (93.2%) | 40 (6.8%) |
| Foreign Born, Citizen | 1,499 (99.0%) | 15 (1.0%) |
| Foreign Born, not a Citizen | 497 (89.1%) | 61 (10.9%) |
Health Insurance Coverage by Household Income in Scappoose
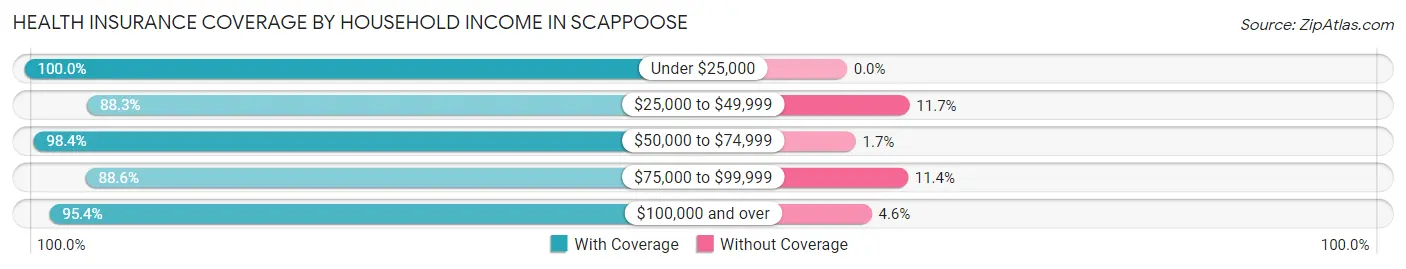
| Household Income | With Coverage | Without Coverage |
| Under $25,000 | 232 (100.0%) | 0 (0.0%) |
| $25,000 to $49,999 | 662 (88.3%) | 88 (11.7%) |
| $50,000 to $74,999 | 1,434 (98.4%) | 24 (1.7%) |
| $75,000 to $99,999 | 976 (88.6%) | 126 (11.4%) |
| $100,000 and over | 4,219 (95.4%) | 205 (4.6%) |
Public vs Private Health Insurance Coverage by Age in Scappoose
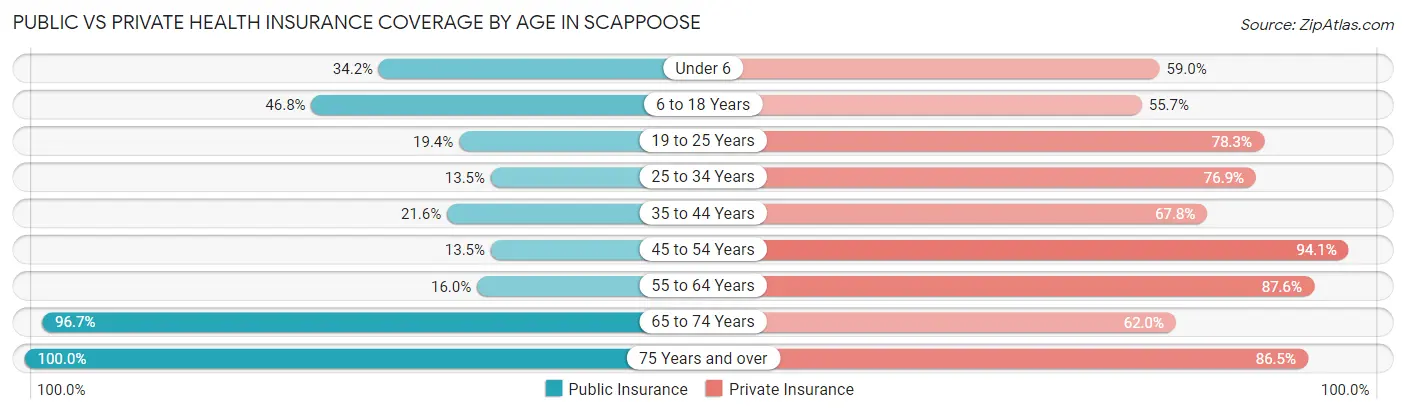
| Age Bracket | Public Insurance | Private Insurance |
| Under 6 | 202 (34.2%) | 348 (59.0%) |
| 6 to 18 Years | 708 (46.8%) | 843 (55.7%) |
| 19 to 25 Years | 108 (19.4%) | 437 (78.3%) |
| 25 to 34 Years | 96 (13.5%) | 548 (76.9%) |
| 35 to 44 Years | 367 (21.6%) | 1,153 (67.8%) |
| 45 to 54 Years | 113 (13.5%) | 790 (94.1%) |
| 55 to 64 Years | 128 (16.0%) | 700 (87.6%) |
| 65 to 74 Years | 827 (96.7%) | 530 (62.0%) |
| 75 Years and over | 407 (100.0%) | 352 (86.5%) |
| Total | 2,956 (37.1%) | 5,701 (71.5%) |
Disability Status by Sex by Age in Scappoose
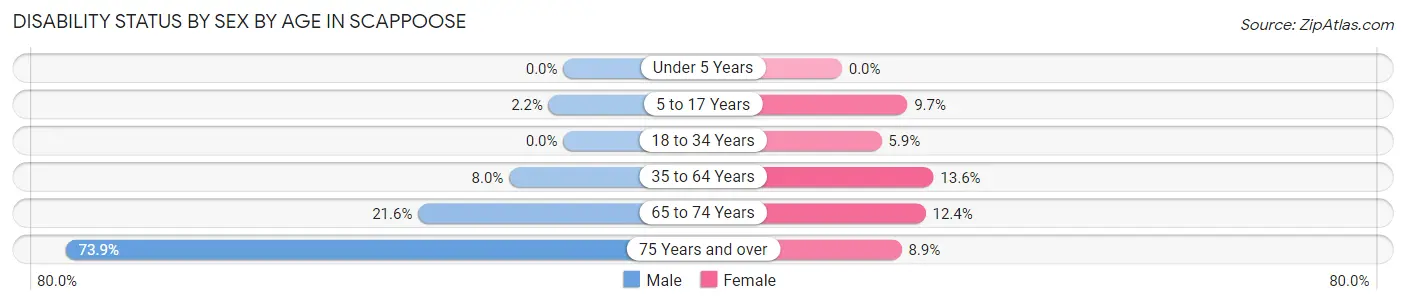
| Age Bracket | Male | Female |
| Under 5 Years | 0 (0.0%) | 0 (0.0%) |
| 5 to 17 Years | 13 (2.2%) | 81 (9.7%) |
| 18 to 34 Years | 0 (0.0%) | 40 (5.9%) |
| 35 to 64 Years | 146 (8.0%) | 207 (13.6%) |
| 65 to 74 Years | 89 (21.5%) | 55 (12.4%) |
| 75 Years and over | 184 (73.9%) | 14 (8.9%) |
Disability Class by Sex by Age in Scappoose
Disability Class: Hearing Difficulty
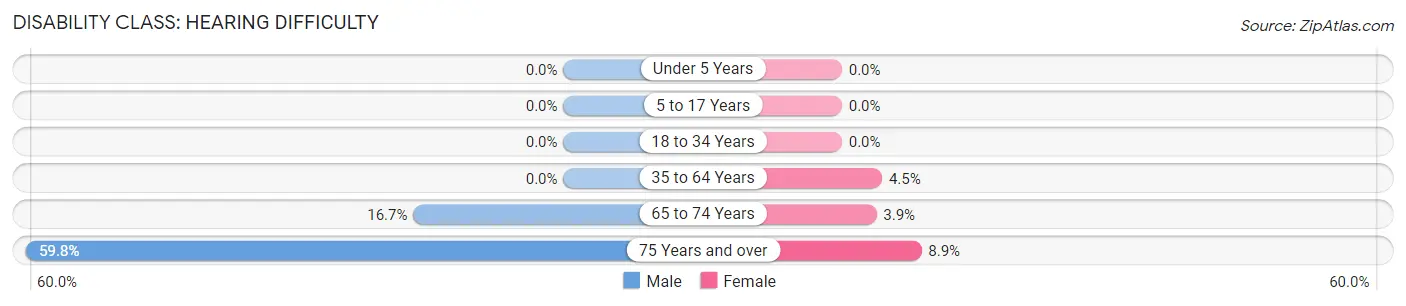
| Age Bracket | Male | Female |
| Under 5 Years | 0 (0.0%) | 0 (0.0%) |
| 5 to 17 Years | 0 (0.0%) | 0 (0.0%) |
| 18 to 34 Years | 0 (0.0%) | 0 (0.0%) |
| 35 to 64 Years | 0 (0.0%) | 68 (4.5%) |
| 65 to 74 Years | 69 (16.7%) | 17 (3.8%) |
| 75 Years and over | 149 (59.8%) | 14 (8.9%) |
Disability Class: Vision Difficulty
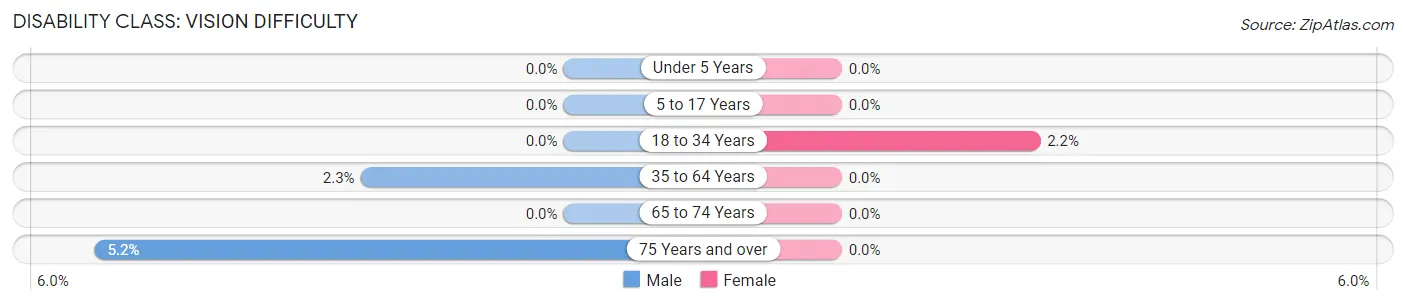
| Age Bracket | Male | Female |
| Under 5 Years | 0 (0.0%) | 0 (0.0%) |
| 5 to 17 Years | 0 (0.0%) | 0 (0.0%) |
| 18 to 34 Years | 0 (0.0%) | 15 (2.2%) |
| 35 to 64 Years | 41 (2.3%) | 0 (0.0%) |
| 65 to 74 Years | 0 (0.0%) | 0 (0.0%) |
| 75 Years and over | 13 (5.2%) | 0 (0.0%) |
Disability Class: Cognitive Difficulty
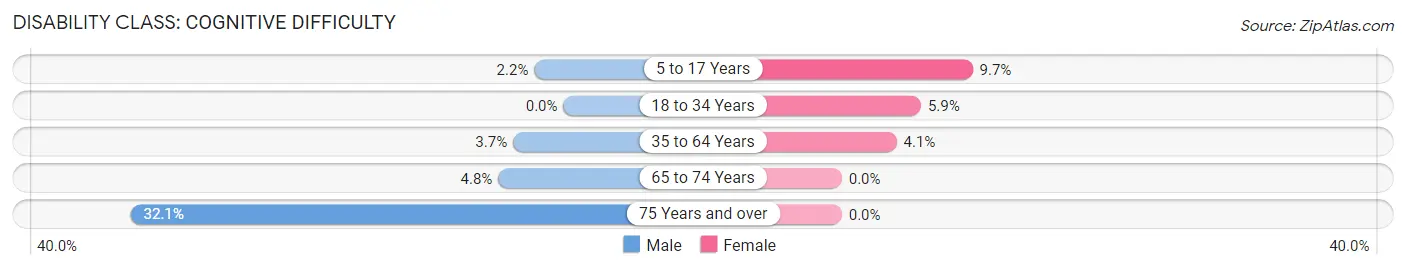
| Age Bracket | Male | Female |
| 5 to 17 Years | 13 (2.2%) | 81 (9.7%) |
| 18 to 34 Years | 0 (0.0%) | 40 (5.9%) |
| 35 to 64 Years | 68 (3.7%) | 62 (4.1%) |
| 65 to 74 Years | 20 (4.8%) | 0 (0.0%) |
| 75 Years and over | 80 (32.1%) | 0 (0.0%) |
Disability Class: Ambulatory Difficulty
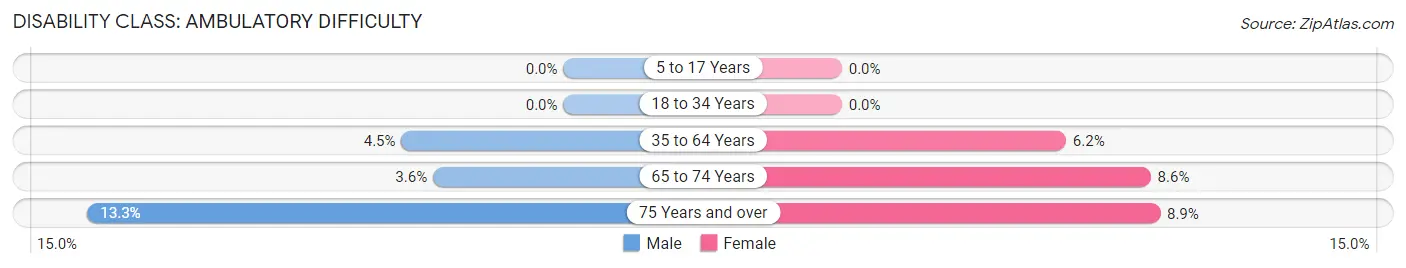
| Age Bracket | Male | Female |
| 5 to 17 Years | 0 (0.0%) | 0 (0.0%) |
| 18 to 34 Years | 0 (0.0%) | 0 (0.0%) |
| 35 to 64 Years | 82 (4.5%) | 95 (6.2%) |
| 65 to 74 Years | 15 (3.6%) | 38 (8.6%) |
| 75 Years and over | 33 (13.3%) | 14 (8.9%) |
Disability Class: Self-Care Difficulty
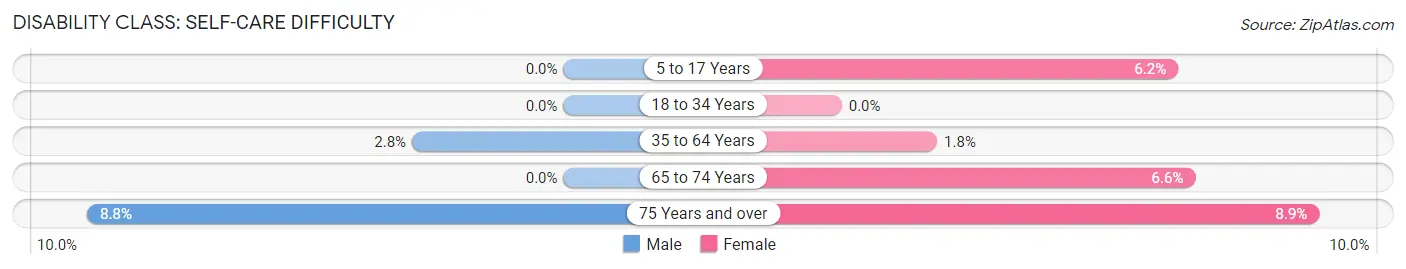
| Age Bracket | Male | Female |
| 5 to 17 Years | 0 (0.0%) | 52 (6.2%) |
| 18 to 34 Years | 0 (0.0%) | 0 (0.0%) |
| 35 to 64 Years | 51 (2.8%) | 27 (1.8%) |
| 65 to 74 Years | 0 (0.0%) | 29 (6.6%) |
| 75 Years and over | 22 (8.8%) | 14 (8.9%) |
Technology Access in Scappoose
Computing Device Access in Scappoose
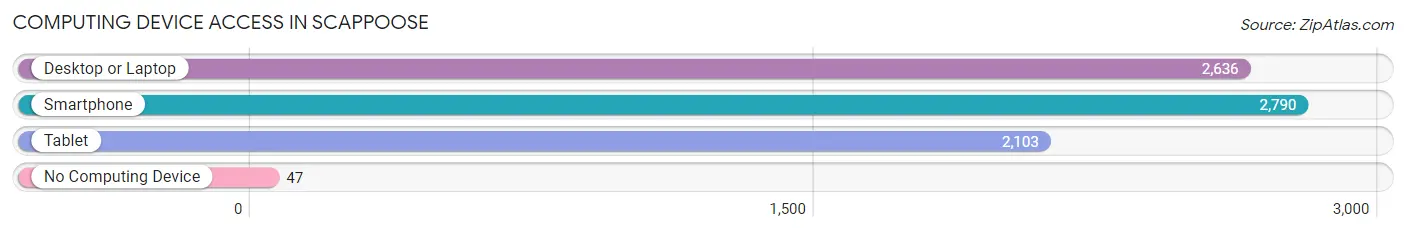
| Device Type | # Households | % Households |
| Desktop or Laptop | 2,636 | 89.4% |
| Smartphone | 2,790 | 94.6% |
| Tablet | 2,103 | 71.3% |
| No Computing Device | 47 | 1.6% |
| Total | 2,948 | 100.0% |
Internet Access in Scappoose
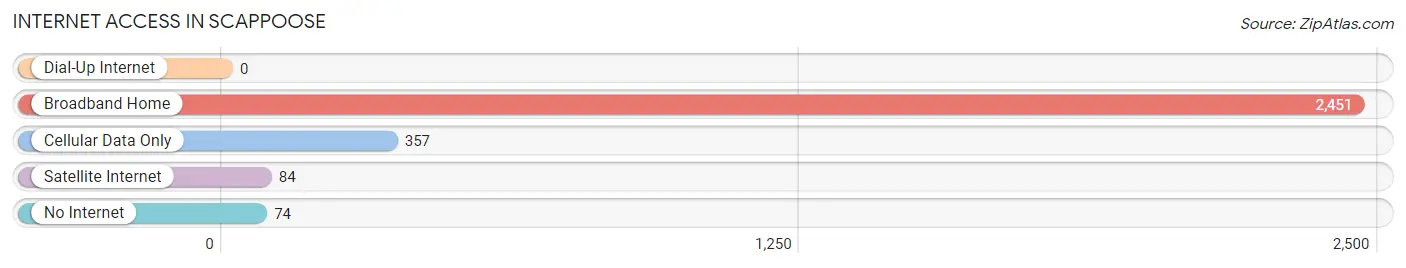
| Internet Type | # Households | % Households |
| Dial-Up Internet | 0 | 0.0% |
| Broadband Home | 2,451 | 83.1% |
| Cellular Data Only | 357 | 12.1% |
| Satellite Internet | 84 | 2.9% |
| No Internet | 74 | 2.5% |
| Total | 2,948 | 100.0% |
Scappoose Summary
Scappoose, Oregon is a small city located in Columbia County, Oregon, United States. It is situated on the Columbia River, approximately 30 miles northwest of Portland. The city has a population of approximately 6,500 people and is part of the Portland metropolitan area.
History
The area that is now Scappoose was originally inhabited by the Chinook and Clatskanie Native American tribes. The first European settlers arrived in the area in the early 1800s, and the town was officially founded in 1851. The town was named after the Chinook word for “gravelly plain”, which was used to describe the area.
In the late 1800s, the town began to grow as a result of the timber industry. The town was home to several sawmills and lumber companies, and the population grew to over 1,000 people by the early 1900s.
In the mid-1900s, the timber industry began to decline, and the town’s population began to decline as well. In the late 1900s, the town began to experience a resurgence as a result of the growth of the Portland metropolitan area.
Geography
Scappoose is located in Columbia County, Oregon, approximately 30 miles northwest of Portland. The city is situated on the Columbia River, and is surrounded by forests and rolling hills. The city has a total area of 4.2 square miles, of which 4.1 square miles is land and 0.1 square miles is water.
The climate in Scappoose is mild and temperate, with warm summers and cool winters. The average annual temperature is around 50 degrees Fahrenheit, and the average annual precipitation is around 40 inches.
Economy
The economy of Scappoose is largely based on the timber industry. The city is home to several sawmills and lumber companies, and the timber industry is the largest employer in the city.
In addition to the timber industry, Scappoose is also home to several manufacturing companies, including a plastics manufacturer and a metal fabrication company. The city is also home to several retail stores, restaurants, and other businesses.
Demographics
As of the 2010 census, the population of Scappoose was 6,543. The racial makeup of the city was 90.2% White, 0.7% African American, 0.7% Native American, 1.2% Asian, 0.2% Pacific Islander, 4.2% from other races, and 2.8% from two or more races. Hispanic or Latino of any race were 8.2% of the population.
The median household income in Scappoose was $45,945, and the median family income was $51,945. The per capita income in the city was $20,945. About 11.2% of families and 14.2% of the population were below the poverty line, including 18.2% of those under age 18 and 8.2% of those age 65 or over.
Scappoose is a small city with a rich history and a diverse economy. The city is home to several sawmills and lumber companies, as well as several manufacturing companies and retail stores. The population of the city is diverse, with a mix of different racial and ethnic backgrounds. The city has a mild climate and is a great place to live and work.
Common Questions
What is Per Capita Income in Scappoose?
Per Capita income in Scappoose is $43,401.
What is the Median Family Income in Scappoose?
Median Family Income in Scappoose is $106,184.
What is the Median Household income in Scappoose?
Median Household Income in Scappoose is $96,339.
What is Income or Wage Gap in Scappoose?
Income or Wage Gap in Scappoose is 30.5%.
Women in Scappoose earn 69.5 cents for every dollar earned by a man.
What is Family Income Deficit in Scappoose?
Family Income Deficit in Scappoose is $8,152.
Families that are below poverty line in Scappoose earn $8,152 less on average than the poverty threshold level.
What is Inequality or Gini Index in Scappoose?
Inequality or Gini Index in Scappoose is 0.37.
What is the Total Population of Scappoose?
Total Population of Scappoose is 8,003.
What is the Total Male Population of Scappoose?
Total Male Population of Scappoose is 4,217.
What is the Total Female Population of Scappoose?
Total Female Population of Scappoose is 3,786.
What is the Ratio of Males per 100 Females in Scappoose?
There are 111.38 Males per 100 Females in Scappoose.
What is the Ratio of Females per 100 Males in Scappoose?
There are 89.78 Females per 100 Males in Scappoose.
What is the Median Population Age in Scappoose?
Median Population Age in Scappoose is 38.7 Years.
What is the Average Family Size in Scappoose
Average Family Size in Scappoose is 3.0 People.
What is the Average Household Size in Scappoose
Average Household Size in Scappoose is 2.7 People.
How Large is the Labor Force in Scappoose?
There are 3,982 People in the Labor Forcein in Scappoose.
What is the Percentage of People in the Labor Force in Scappoose?
64.8% of People are in the Labor Force in Scappoose.
What is the Unemployment Rate in Scappoose?
Unemployment Rate in Scappoose is 2.5%.