Sandy, OR Map & Demographics
Sandy Map
Sandy Overview
$40,271
PER CAPITA INCOME
$107,654
AVG FAMILY INCOME
$98,341
AVG HOUSEHOLD INCOME
27.4%
WAGE / INCOME GAP [ % ]
72.6¢/ $1
WAGE / INCOME GAP [ $ ]
$7,463
FAMILY INCOME DEFICIT
0.35
INEQUALITY / GINI INDEX
12,592
TOTAL POPULATION
6,403
MALE POPULATION
6,189
FEMALE POPULATION
103.46
MALES / 100 FEMALES
96.66
FEMALES / 100 MALES
34.5
MEDIAN AGE
3.2
AVG FAMILY SIZE
2.9
AVG HOUSEHOLD SIZE
6,791
LABOR FORCE [ PEOPLE ]
67.4%
PERCENT IN LABOR FORCE
4.8%
UNEMPLOYMENT RATE
Sandy Zip Codes
Sandy Area Codes
Income in Sandy
Income Overview in Sandy
Per Capita Income in Sandy is $40,271, while median incomes of families and households are $107,654 and $98,341 respectively.
| Characteristic | Number | Measure |
| Per Capita Income | 12,592 | $40,271 |
| Median Family Income | 3,367 | $107,654 |
| Mean Family Income | 3,367 | $118,464 |
| Median Household Income | 4,387 | $98,341 |
| Mean Household Income | 4,387 | $111,700 |
| Income Deficit | 3,367 | $7,463 |
| Wage / Income Gap (%) | 12,592 | 27.44% |
| Wage / Income Gap ($) | 12,592 | 72.56¢ per $1 |
| Gini / Inequality Index | 12,592 | 0.35 |
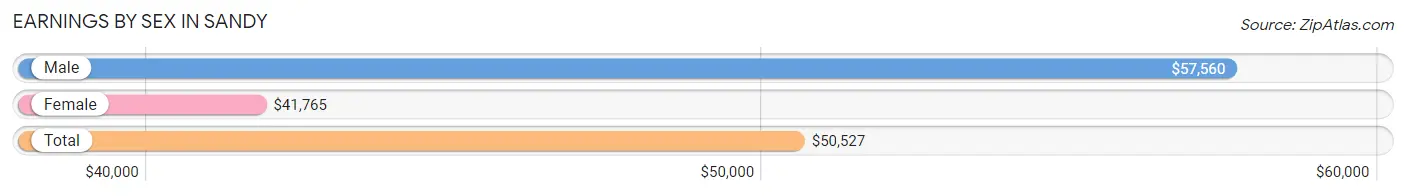
Earnings by Sex in Sandy
Average Earnings in Sandy are $50,527, $57,560 for men and $41,765 for women, a difference of 27.4%.
| Sex | Number | Average Earnings |
| Male | 3,760 (52.0%) | $57,560 |
| Female | 3,469 (48.0%) | $41,765 |
| Total | 7,229 (100.0%) | $50,527 |
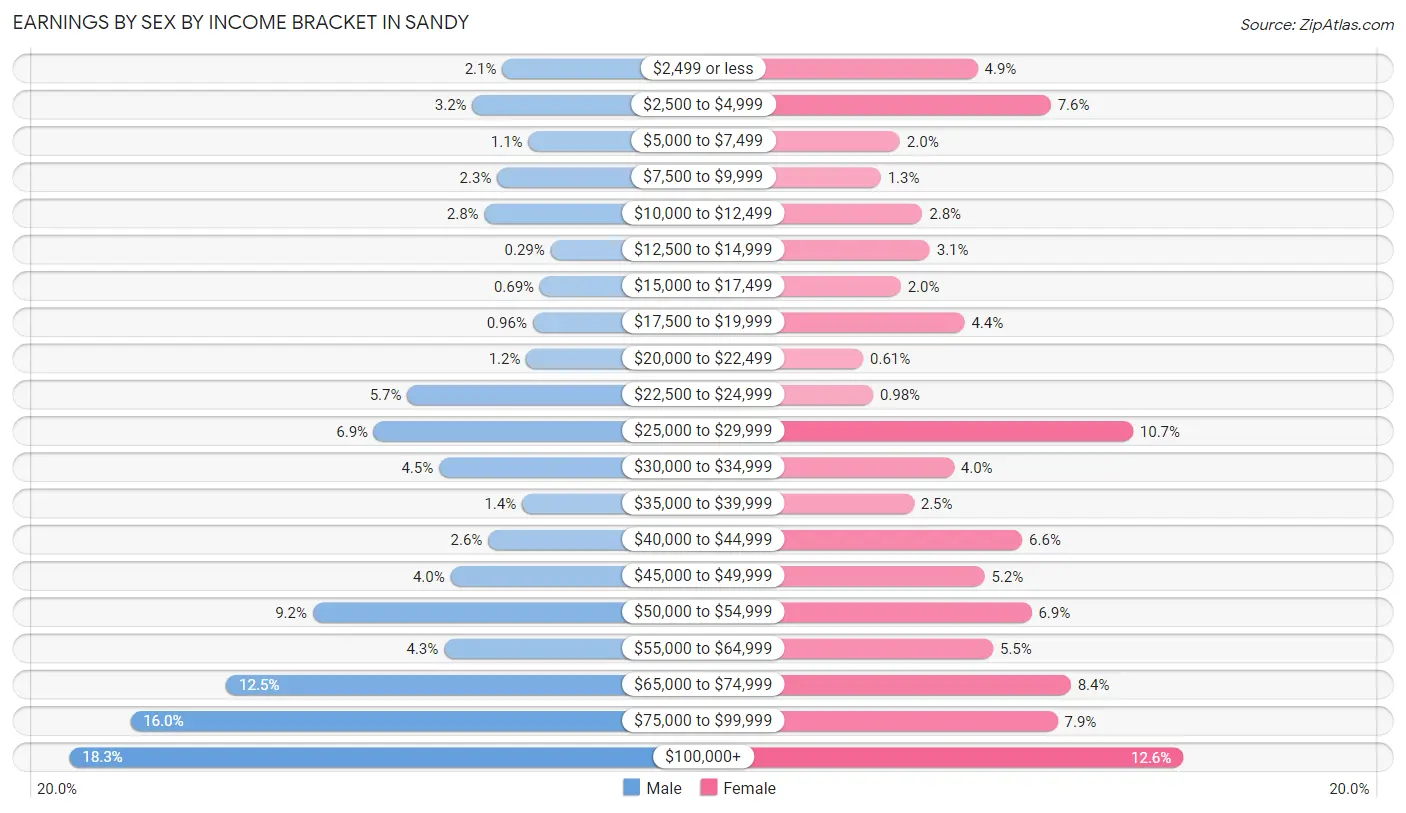
Earnings by Sex by Income Bracket in Sandy
The most common earnings brackets in Sandy are $100,000+ for men (689 | 18.3%) and $100,000+ for women (437 | 12.6%).
| Income | Male | Female |
| $2,499 or less | 79 (2.1%) | 170 (4.9%) |
| $2,500 to $4,999 | 121 (3.2%) | 265 (7.6%) |
| $5,000 to $7,499 | 42 (1.1%) | 69 (2.0%) |
| $7,500 to $9,999 | 86 (2.3%) | 44 (1.3%) |
| $10,000 to $12,499 | 104 (2.8%) | 98 (2.8%) |
| $12,500 to $14,999 | 11 (0.3%) | 108 (3.1%) |
| $15,000 to $17,499 | 26 (0.7%) | 70 (2.0%) |
| $17,500 to $19,999 | 36 (1.0%) | 153 (4.4%) |
| $20,000 to $22,499 | 45 (1.2%) | 21 (0.6%) |
| $22,500 to $24,999 | 213 (5.7%) | 34 (1.0%) |
| $25,000 to $29,999 | 260 (6.9%) | 372 (10.7%) |
| $30,000 to $34,999 | 168 (4.5%) | 139 (4.0%) |
| $35,000 to $39,999 | 51 (1.4%) | 87 (2.5%) |
| $40,000 to $44,999 | 99 (2.6%) | 228 (6.6%) |
| $45,000 to $49,999 | 152 (4.0%) | 179 (5.2%) |
| $50,000 to $54,999 | 346 (9.2%) | 240 (6.9%) |
| $55,000 to $64,999 | 161 (4.3%) | 190 (5.5%) |
| $65,000 to $74,999 | 468 (12.4%) | 291 (8.4%) |
| $75,000 to $99,999 | 603 (16.0%) | 274 (7.9%) |
| $100,000+ | 689 (18.3%) | 437 (12.6%) |
| Total | 3,760 (100.0%) | 3,469 (100.0%) |
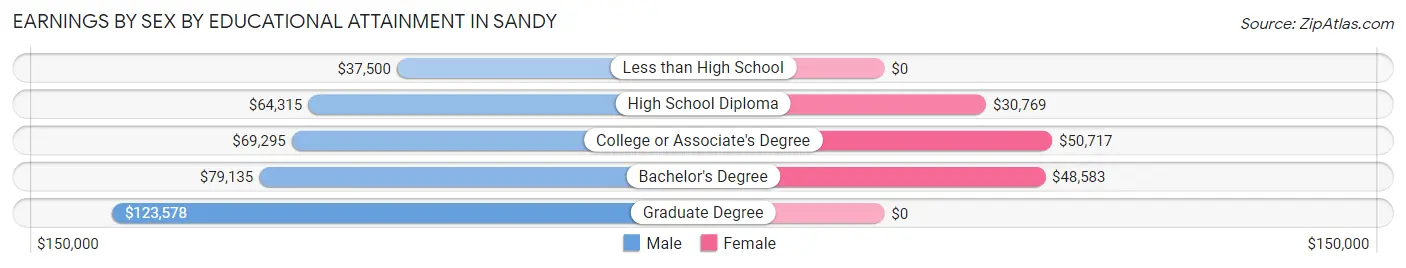
Earnings by Sex by Educational Attainment in Sandy
Average earnings in Sandy are $68,394 for men and $47,164 for women, a difference of 31.0%. Men with an educational attainment of graduate degree enjoy the highest average annual earnings of $123,578, while those with less than high school education earn the least with $37,500. Women with an educational attainment of college or associate's degree earn the most with the average annual earnings of $50,717, while those with high school diploma education have the smallest earnings of $30,769.
| Educational Attainment | Male Income | Female Income |
| Less than High School | $37,500 | $0 |
| High School Diploma | $64,315 | $30,769 |
| College or Associate's Degree | $69,295 | $50,717 |
| Bachelor's Degree | $79,135 | $48,583 |
| Graduate Degree | $123,578 | $0 |
| Total | $68,394 | $47,164 |
Family Income in Sandy
Family Income Brackets in Sandy
According to the Sandy family income data, there are 828 families falling into the $100,000 to $149,999 income range, which is the most common income bracket and makes up 24.6% of all families.
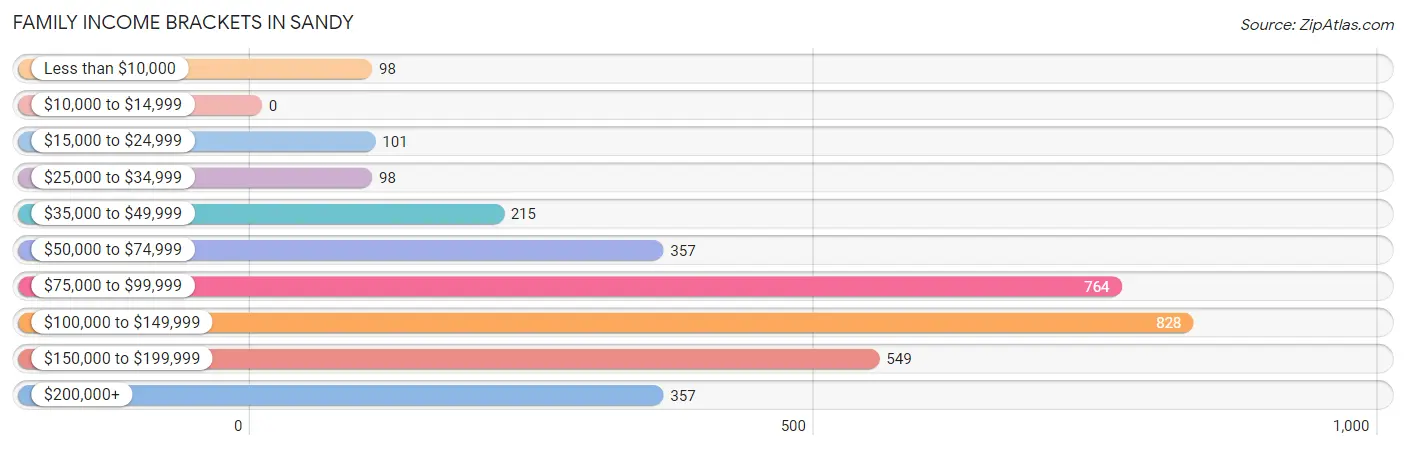
| Income Bracket | # Families | % Families |
| Less than $10,000 | 98 | 2.9% |
| $10,000 to $14,999 | 0 | 0.0% |
| $15,000 to $24,999 | 101 | 3.0% |
| $25,000 to $34,999 | 98 | 2.9% |
| $35,000 to $49,999 | 215 | 6.4% |
| $50,000 to $74,999 | 357 | 10.6% |
| $75,000 to $99,999 | 764 | 22.7% |
| $100,000 to $149,999 | 828 | 24.6% |
| $150,000 to $199,999 | 549 | 16.3% |
| $200,000+ | 357 | 10.6% |
Family Income by Famaliy Size in Sandy
3-person families (1,080 | 32.1%) account for the highest median family income in Sandy with $127,355 per family, while 3-person families (1,080 | 32.1%) have the highest median income of $42,452 per family member.
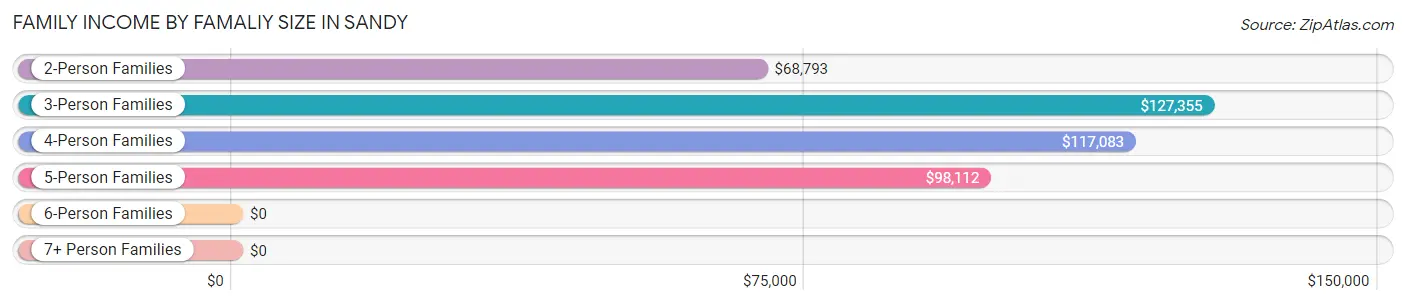
| Income Bracket | # Families | Median Income |
| 2-Person Families | 1,100 (32.7%) | $68,793 |
| 3-Person Families | 1,080 (32.1%) | $127,355 |
| 4-Person Families | 880 (26.1%) | $117,083 |
| 5-Person Families | 267 (7.9%) | $98,112 |
| 6-Person Families | 40 (1.2%) | $0 |
| 7+ Person Families | 0 (0.0%) | $0 |
| Total | 3,367 (100.0%) | $107,654 |
Family Income by Number of Earners in Sandy
The median family income in Sandy is $107,654, with families comprising 3+ earners (488) having the highest median family income of $163,398, while families with no earners (428) have the lowest median family income of $53,482, accounting for 14.5% and 12.7% of families, respectively.
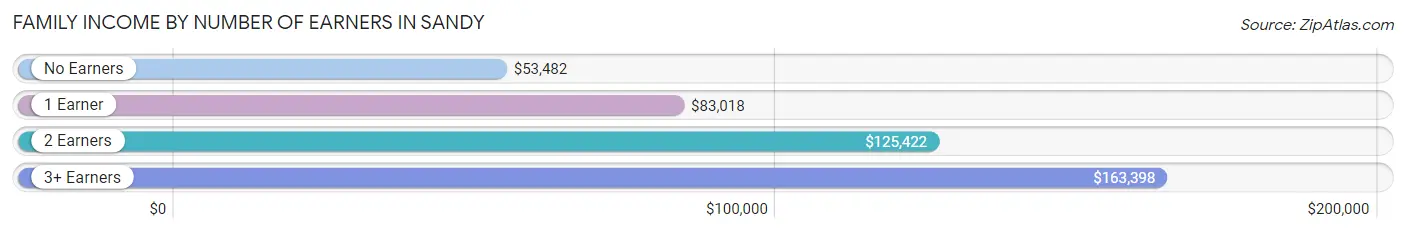
| Number of Earners | # Families | Median Income |
| No Earners | 428 (12.7%) | $53,482 |
| 1 Earner | 873 (25.9%) | $83,018 |
| 2 Earners | 1,578 (46.9%) | $125,422 |
| 3+ Earners | 488 (14.5%) | $163,398 |
| Total | 3,367 (100.0%) | $107,654 |
Household Income in Sandy
Household Income Brackets in Sandy
With 948 households falling in the category, the $100,000 to $149,999 income range is the most frequent in Sandy, accounting for 21.6% of all households. In contrast, only 22 households (0.5%) fall into the $10,000 to $14,999 income bracket, making it the least populous group.
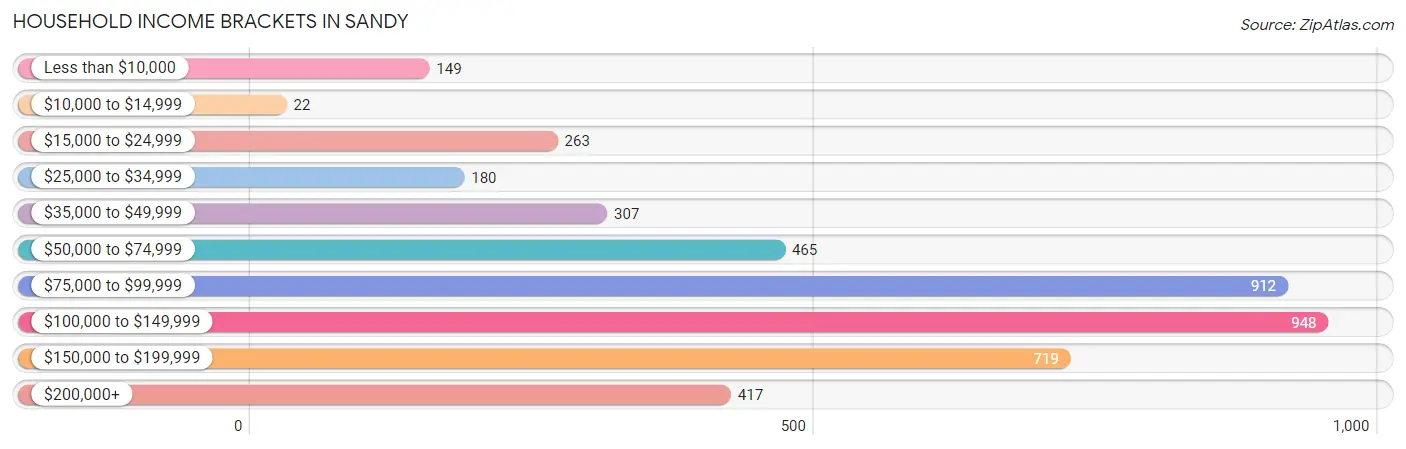
| Income Bracket | # Households | % Households |
| Less than $10,000 | 149 | 3.4% |
| $10,000 to $14,999 | 22 | 0.5% |
| $15,000 to $24,999 | 263 | 6.0% |
| $25,000 to $34,999 | 180 | 4.1% |
| $35,000 to $49,999 | 307 | 7.0% |
| $50,000 to $74,999 | 465 | 10.6% |
| $75,000 to $99,999 | 912 | 20.8% |
| $100,000 to $149,999 | 948 | 21.6% |
| $150,000 to $199,999 | 719 | 16.4% |
| $200,000+ | 417 | 9.5% |
Household Income by Householder Age in Sandy
The median household income in Sandy is $98,341, with the highest median household income of $128,836 found in the 25 to 44 years age bracket for the primary householder. A total of 1,883 households (42.9%) fall into this category. Meanwhile, the 15 to 24 years age bracket for the primary householder has the lowest median household income of $0, with 35 households (0.8%) in this group.
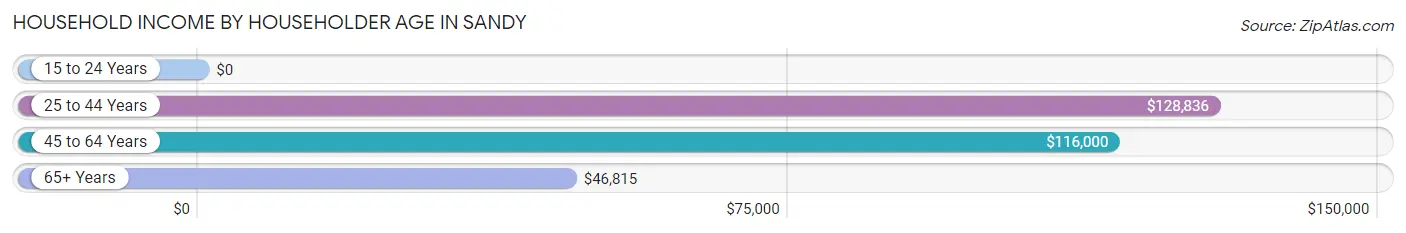
| Income Bracket | # Households | Median Income |
| 15 to 24 Years | 35 (0.8%) | $0 |
| 25 to 44 Years | 1,883 (42.9%) | $128,836 |
| 45 to 64 Years | 1,462 (33.3%) | $116,000 |
| 65+ Years | 1,007 (23.0%) | $46,815 |
| Total | 4,387 (100.0%) | $98,341 |
Poverty in Sandy
Income Below Poverty by Sex and Age in Sandy
With 5.2% poverty level for males and 5.1% for females among the residents of Sandy, 75 year old and over males and 75 year old and over females are the most vulnerable to poverty, with 57 males (14.5%) and 103 females (19.7%) in their respective age groups living below the poverty level.
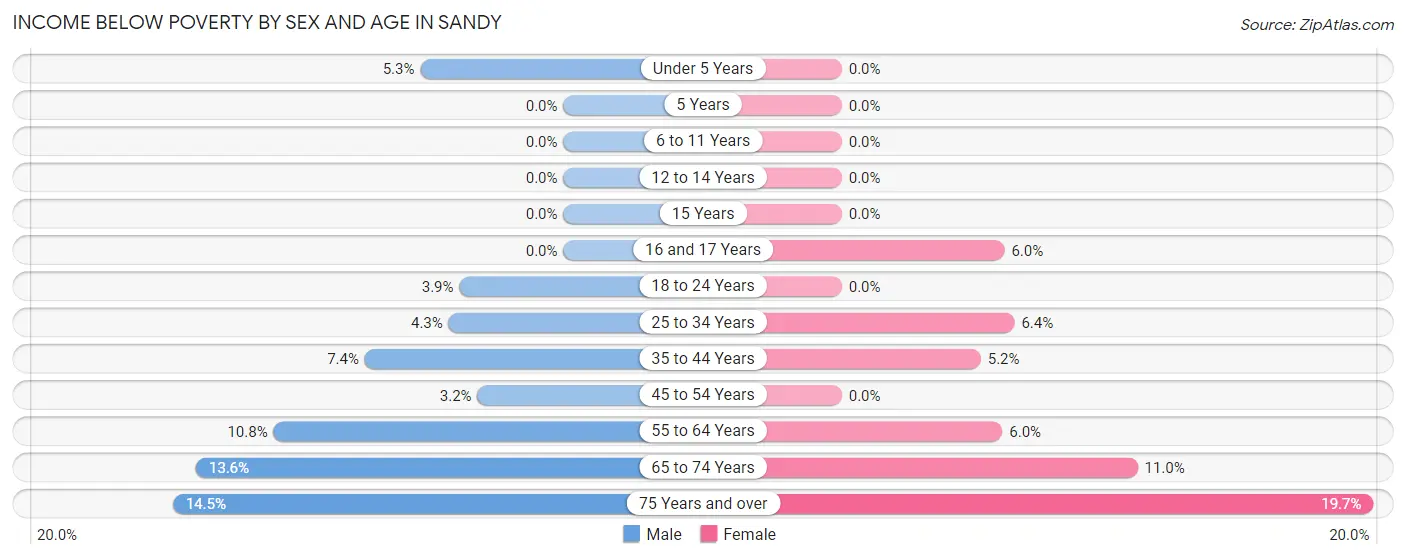
| Age Bracket | Male | Female |
| Under 5 Years | 26 (5.3%) | 0 (0.0%) |
| 5 Years | 0 (0.0%) | 0 (0.0%) |
| 6 to 11 Years | 0 (0.0%) | 0 (0.0%) |
| 12 to 14 Years | 0 (0.0%) | 0 (0.0%) |
| 15 Years | 0 (0.0%) | 0 (0.0%) |
| 16 and 17 Years | 0 (0.0%) | 11 (6.0%) |
| 18 to 24 Years | 28 (3.9%) | 0 (0.0%) |
| 25 to 34 Years | 49 (4.3%) | 81 (6.4%) |
| 35 to 44 Years | 54 (7.4%) | 43 (5.2%) |
| 45 to 54 Years | 29 (3.2%) | 0 (0.0%) |
| 55 to 64 Years | 48 (10.8%) | 35 (6.0%) |
| 65 to 74 Years | 42 (13.6%) | 46 (11.0%) |
| 75 Years and over | 57 (14.5%) | 103 (19.7%) |
| Total | 333 (5.2%) | 319 (5.1%) |
Income Above Poverty by Sex and Age in Sandy
According to the poverty statistics in Sandy, males aged 5 years and females aged under 5 years are the age groups that are most secure financially, with 100.0% of males and 100.0% of females in these age groups living above the poverty line.
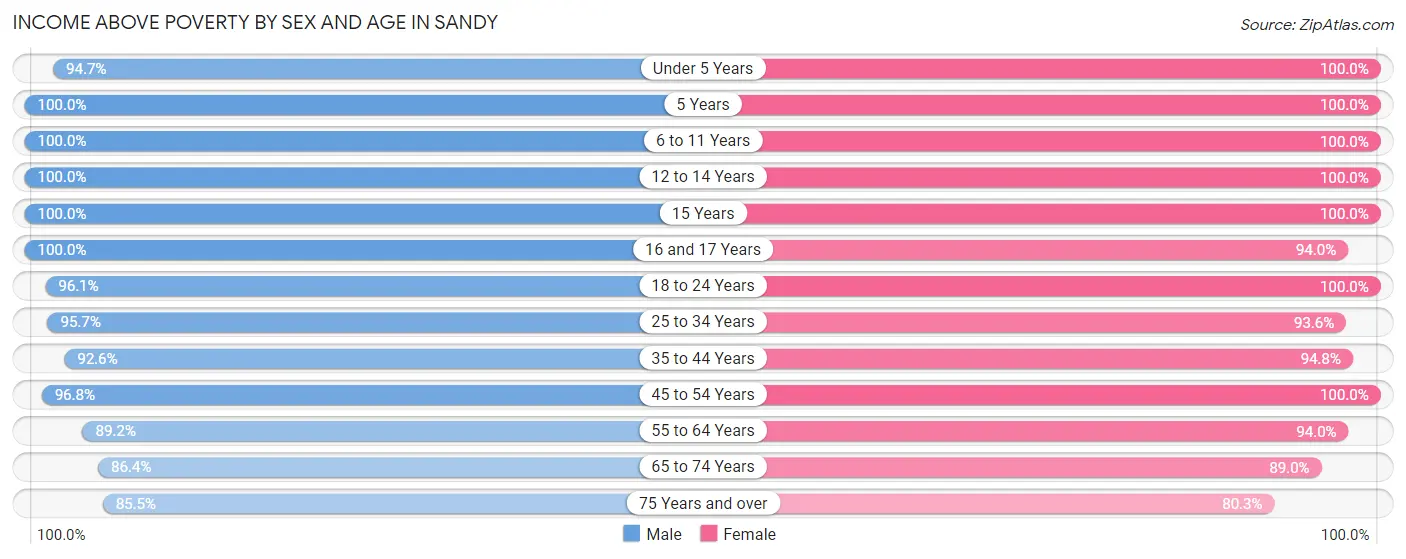
| Age Bracket | Male | Female |
| Under 5 Years | 464 (94.7%) | 302 (100.0%) |
| 5 Years | 24 (100.0%) | 53 (100.0%) |
| 6 to 11 Years | 392 (100.0%) | 426 (100.0%) |
| 12 to 14 Years | 434 (100.0%) | 216 (100.0%) |
| 15 Years | 121 (100.0%) | 22 (100.0%) |
| 16 and 17 Years | 242 (100.0%) | 171 (94.0%) |
| 18 to 24 Years | 697 (96.1%) | 495 (100.0%) |
| 25 to 34 Years | 1,102 (95.7%) | 1,182 (93.6%) |
| 35 to 44 Years | 679 (92.6%) | 791 (94.8%) |
| 45 to 54 Years | 879 (96.8%) | 868 (100.0%) |
| 55 to 64 Years | 398 (89.2%) | 552 (94.0%) |
| 65 to 74 Years | 266 (86.4%) | 373 (89.0%) |
| 75 Years and over | 336 (85.5%) | 419 (80.3%) |
| Total | 6,034 (94.8%) | 5,870 (94.9%) |
Income Below Poverty Among Married-Couple Families in Sandy
The poverty statistics for married-couple families in Sandy show that 4.3% or 117 of the total 2,750 families live below the poverty line. Families with no children have the highest poverty rate of 9.5%, comprising of 117 families. On the other hand, families with 1 or 2 children have the lowest poverty rate of 0.0%, which includes 0 families.
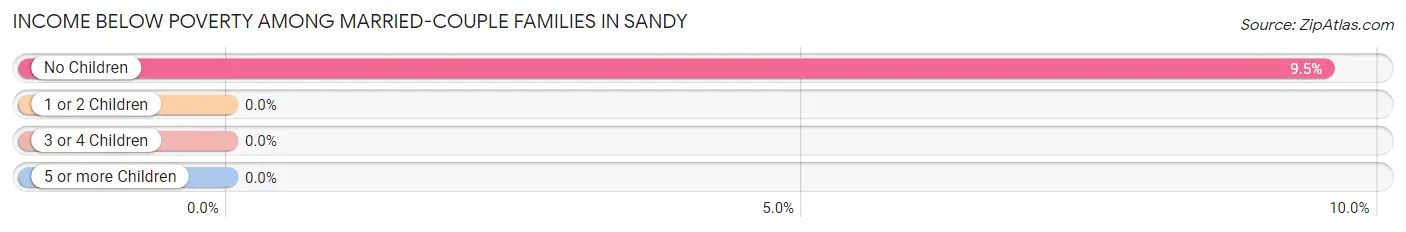
| Children | Above Poverty | Below Poverty |
| No Children | 1,110 (90.5%) | 117 (9.5%) |
| 1 or 2 Children | 1,338 (100.0%) | 0 (0.0%) |
| 3 or 4 Children | 185 (100.0%) | 0 (0.0%) |
| 5 or more Children | 0 (0.0%) | 0 (0.0%) |
| Total | 2,633 (95.8%) | 117 (4.3%) |
Income Below Poverty Among Single-Parent Households in Sandy
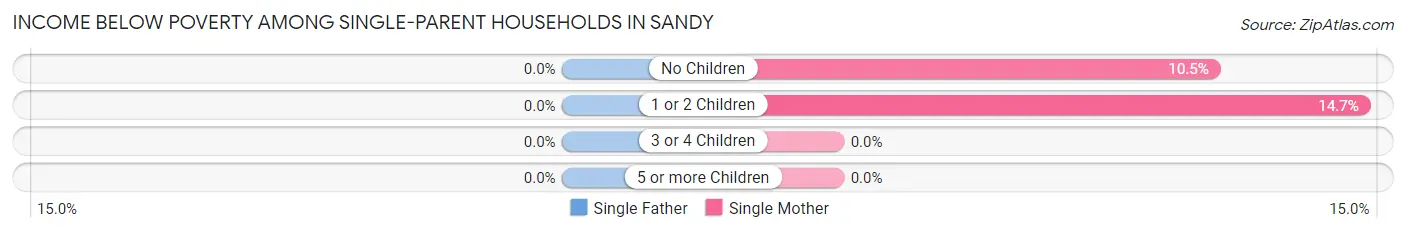
| Children | Single Father | Single Mother |
| No Children | 0 (0.0%) | 16 (10.5%) |
| 1 or 2 Children | 0 (0.0%) | 39 (14.7%) |
| 3 or 4 Children | 0 (0.0%) | 0 (0.0%) |
| 5 or more Children | 0 (0.0%) | 0 (0.0%) |
| Total | 0 (0.0%) | 55 (13.2%) |
Income Below Poverty Among Married-Couple vs Single-Parent Households in Sandy
The poverty data for Sandy shows that 117 of the married-couple family households (4.3%) and 55 of the single-parent households (8.9%) are living below the poverty level. Within the married-couple family households, those with no children have the highest poverty rate, with 117 households (9.5%) falling below the poverty line. Among the single-parent households, those with 1 or 2 children have the highest poverty rate, with 39 household (10.1%) living below poverty.
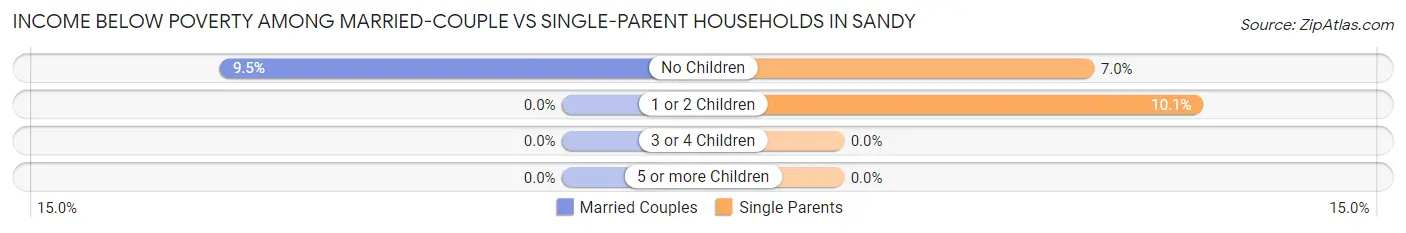
| Children | Married-Couple Families | Single-Parent Households |
| No Children | 117 (9.5%) | 16 (7.0%) |
| 1 or 2 Children | 0 (0.0%) | 39 (10.1%) |
| 3 or 4 Children | 0 (0.0%) | 0 (0.0%) |
| 5 or more Children | 0 (0.0%) | 0 (0.0%) |
| Total | 117 (4.3%) | 55 (8.9%) |
Race in Sandy
The most populous races in Sandy are White / Caucasian (11,007 | 87.4%), Two or more Races (1,021 | 8.1%), and Hispanic or Latino (782 | 6.2%).
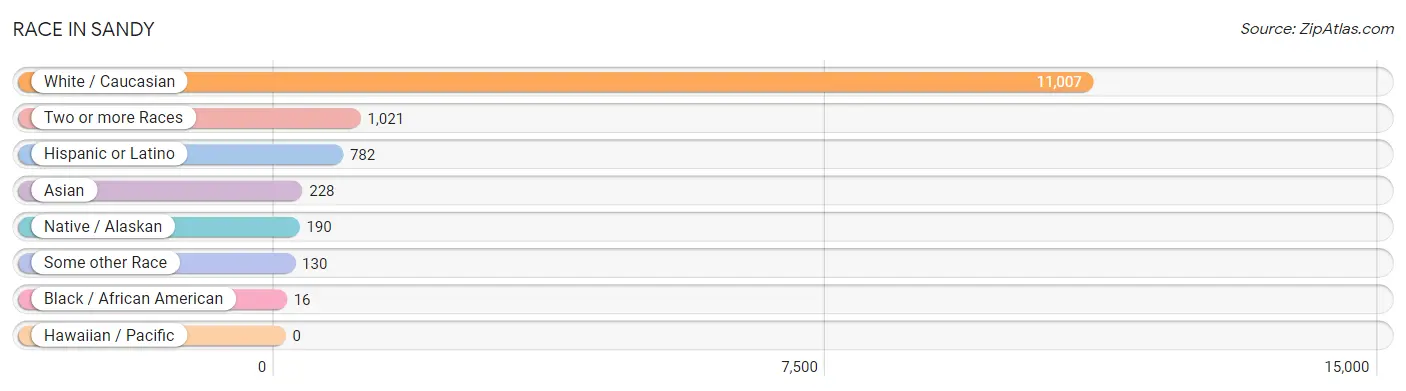
| Race | # Population | % Population |
| Asian | 228 | 1.8% |
| Black / African American | 16 | 0.1% |
| Hawaiian / Pacific | 0 | 0.0% |
| Hispanic or Latino | 782 | 6.2% |
| Native / Alaskan | 190 | 1.5% |
| White / Caucasian | 11,007 | 87.4% |
| Two or more Races | 1,021 | 8.1% |
| Some other Race | 130 | 1.0% |
| Total | 12,592 | 100.0% |
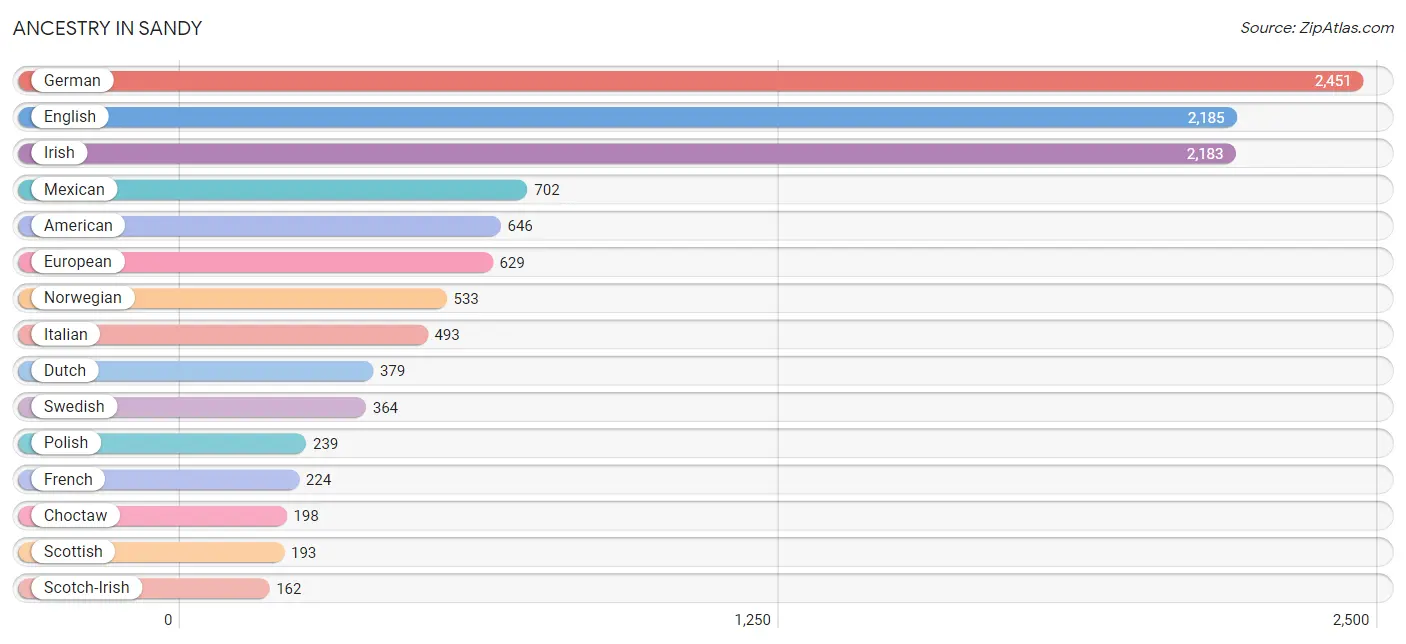
Ancestry in Sandy
The most populous ancestries reported in Sandy are German (2,451 | 19.5%), English (2,185 | 17.3%), Irish (2,183 | 17.3%), Mexican (702 | 5.6%), and American (646 | 5.1%), together accounting for 64.8% of all Sandy residents.
| Ancestry | # Population | % Population |
| American | 646 | 5.1% |
| Armenian | 16 | 0.1% |
| Belgian | 45 | 0.4% |
| Bhutanese | 84 | 0.7% |
| British | 138 | 1.1% |
| Canadian | 60 | 0.5% |
| Central American | 54 | 0.4% |
| Choctaw | 198 | 1.6% |
| Cuban | 3 | 0.0% |
| Danish | 54 | 0.4% |
| Dutch | 379 | 3.0% |
| English | 2,185 | 17.3% |
| European | 629 | 5.0% |
| Finnish | 22 | 0.2% |
| French | 224 | 1.8% |
| French Canadian | 82 | 0.6% |
| German | 2,451 | 19.5% |
| Honduran | 46 | 0.4% |
| Hungarian | 23 | 0.2% |
| Indian (Asian) | 31 | 0.3% |
| Indonesian | 136 | 1.1% |
| Irish | 2,183 | 17.3% |
| Italian | 493 | 3.9% |
| Korean | 11 | 0.1% |
| Laotian | 41 | 0.3% |
| Maltese | 37 | 0.3% |
| Mexican | 702 | 5.6% |
| Mexican American Indian | 2 | 0.0% |
| Northern European | 25 | 0.2% |
| Norwegian | 533 | 4.2% |
| Osage | 37 | 0.3% |
| Polish | 239 | 1.9% |
| Portuguese | 79 | 0.6% |
| Puerto Rican | 14 | 0.1% |
| Russian | 33 | 0.3% |
| Salvadoran | 8 | 0.1% |
| Scandinavian | 16 | 0.1% |
| Scotch-Irish | 162 | 1.3% |
| Scottish | 193 | 1.5% |
| Spanish | 9 | 0.1% |
| Sri Lankan | 21 | 0.2% |
| Swedish | 364 | 2.9% |
| Swiss | 111 | 0.9% |
| Ukrainian | 91 | 0.7% |
| Welsh | 63 | 0.5% | View All 45 Rows |
Immigrants in Sandy
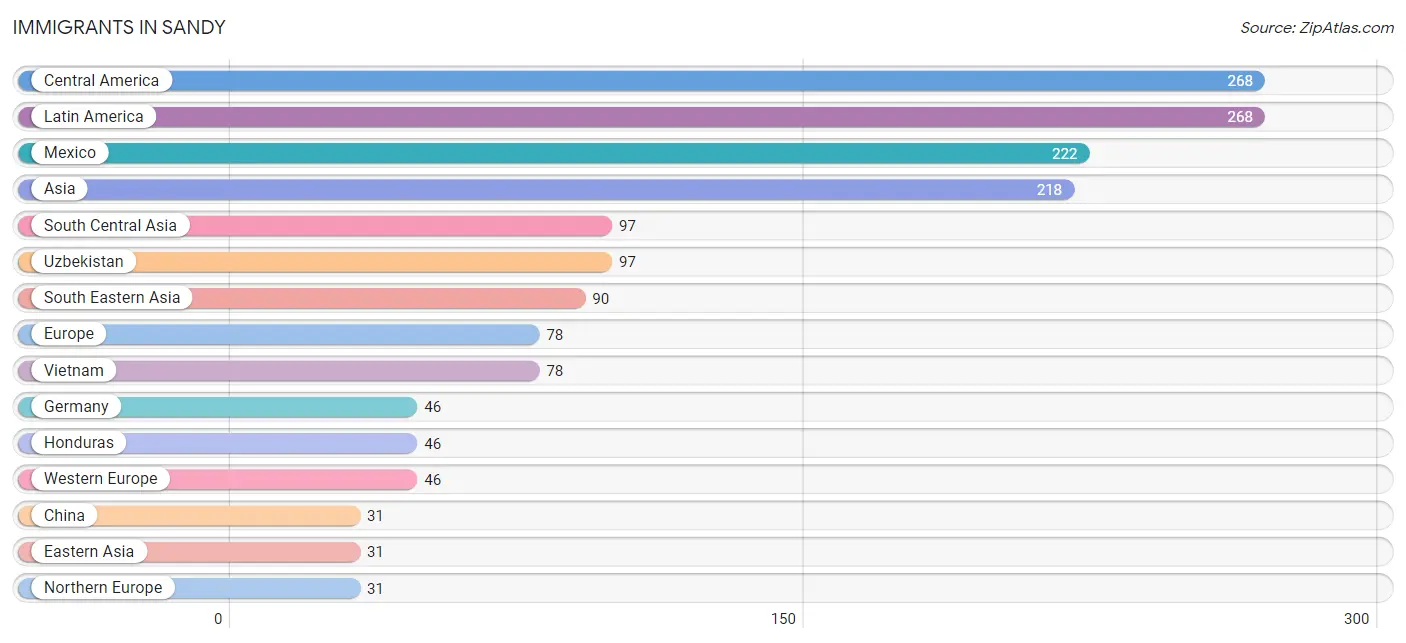
The most numerous immigrant groups reported in Sandy came from Central America (268 | 2.1%), Latin America (268 | 2.1%), Mexico (222 | 1.8%), Asia (218 | 1.7%), and South Central Asia (97 | 0.8%), together accounting for 8.5% of all Sandy residents.
| Immigration Origin | # Population | % Population |
| Asia | 218 | 1.7% |
| Canada | 23 | 0.2% |
| Central America | 268 | 2.1% |
| China | 31 | 0.3% |
| Eastern Asia | 31 | 0.3% |
| England | 19 | 0.2% |
| Europe | 78 | 0.6% |
| Germany | 46 | 0.4% |
| Honduras | 46 | 0.4% |
| Italy | 1 | 0.0% |
| Latin America | 268 | 2.1% |
| Mexico | 222 | 1.8% |
| Northern Europe | 31 | 0.3% |
| Norway | 12 | 0.1% |
| South Central Asia | 97 | 0.8% |
| South Eastern Asia | 90 | 0.7% |
| Southern Europe | 1 | 0.0% |
| Uzbekistan | 97 | 0.8% |
| Vietnam | 78 | 0.6% |
| Western Europe | 46 | 0.4% | View All 20 Rows |
Sex and Age in Sandy
Sex and Age in Sandy
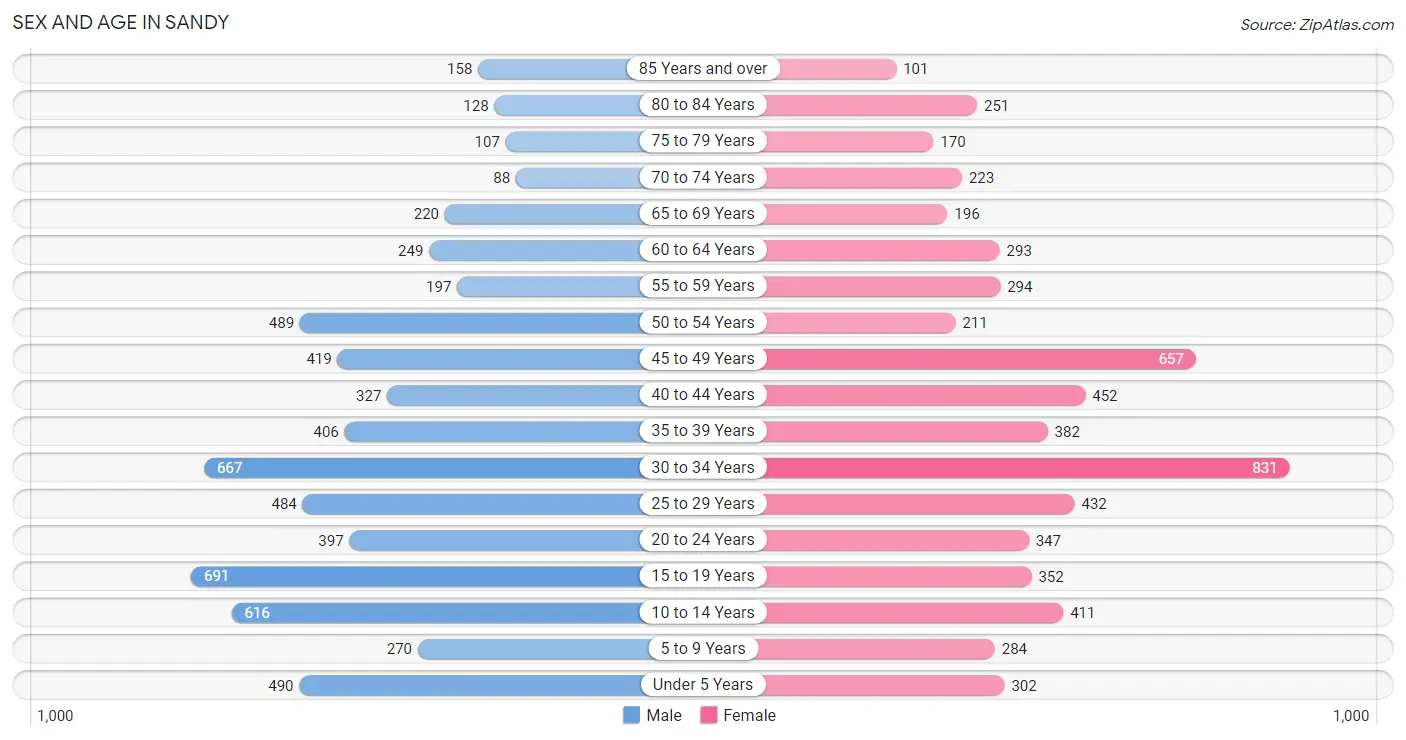
The most populous age groups in Sandy are 15 to 19 Years (691 | 10.8%) for men and 30 to 34 Years (831 | 13.4%) for women.
| Age Bracket | Male | Female |
| Under 5 Years | 490 (7.6%) | 302 (4.9%) |
| 5 to 9 Years | 270 (4.2%) | 284 (4.6%) |
| 10 to 14 Years | 616 (9.6%) | 411 (6.6%) |
| 15 to 19 Years | 691 (10.8%) | 352 (5.7%) |
| 20 to 24 Years | 397 (6.2%) | 347 (5.6%) |
| 25 to 29 Years | 484 (7.6%) | 432 (7.0%) |
| 30 to 34 Years | 667 (10.4%) | 831 (13.4%) |
| 35 to 39 Years | 406 (6.3%) | 382 (6.2%) |
| 40 to 44 Years | 327 (5.1%) | 452 (7.3%) |
| 45 to 49 Years | 419 (6.5%) | 657 (10.6%) |
| 50 to 54 Years | 489 (7.6%) | 211 (3.4%) |
| 55 to 59 Years | 197 (3.1%) | 294 (4.8%) |
| 60 to 64 Years | 249 (3.9%) | 293 (4.7%) |
| 65 to 69 Years | 220 (3.4%) | 196 (3.2%) |
| 70 to 74 Years | 88 (1.4%) | 223 (3.6%) |
| 75 to 79 Years | 107 (1.7%) | 170 (2.8%) |
| 80 to 84 Years | 128 (2.0%) | 251 (4.1%) |
| 85 Years and over | 158 (2.5%) | 101 (1.6%) |
| Total | 6,403 (100.0%) | 6,189 (100.0%) |
Families and Households in Sandy
Median Family Size in Sandy
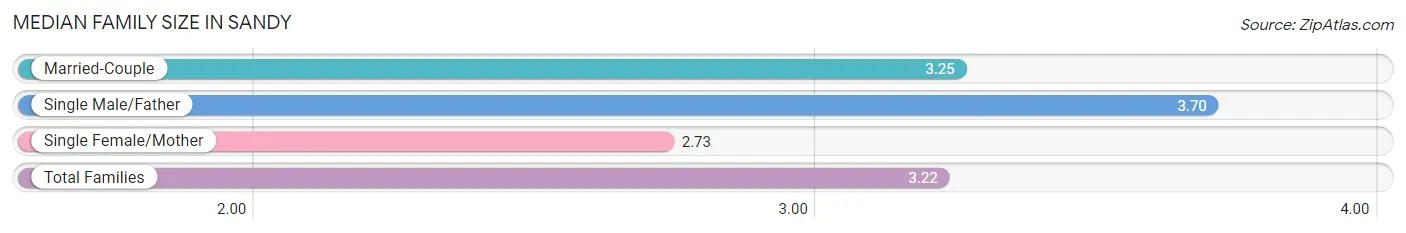
The median family size in Sandy is 3.22 persons per family, with single male/father families (200 | 5.9%) accounting for the largest median family size of 3.7 persons per family. On the other hand, single female/mother families (417 | 12.4%) represent the smallest median family size with 2.73 persons per family.
| Family Type | # Families | Family Size |
| Married-Couple | 2,750 (81.7%) | 3.25 |
| Single Male/Father | 200 (5.9%) | 3.70 |
| Single Female/Mother | 417 (12.4%) | 2.73 |
| Total Families | 3,367 (100.0%) | 3.22 |
Median Household Size in Sandy
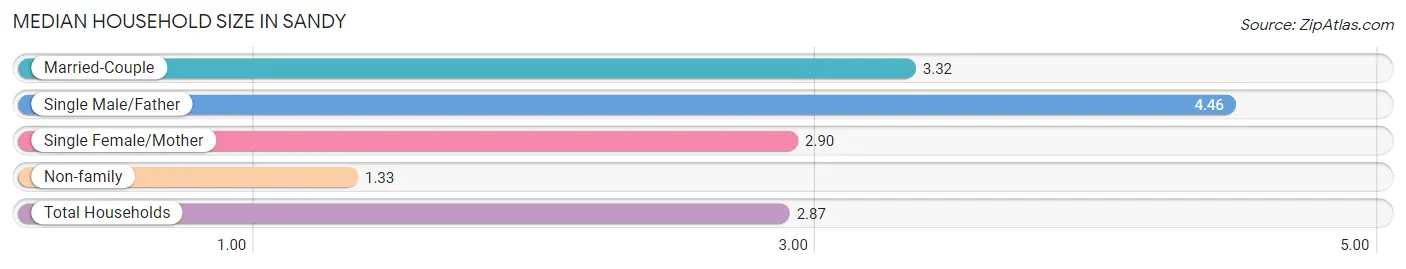
The median household size in Sandy is 2.87 persons per household, with single male/father households (200 | 4.6%) accounting for the largest median household size of 4.46 persons per household. non-family households (1,020 | 23.3%) represent the smallest median household size with 1.33 persons per household.
| Household Type | # Households | Household Size |
| Married-Couple | 2,750 (62.7%) | 3.32 |
| Single Male/Father | 200 (4.6%) | 4.46 |
| Single Female/Mother | 417 (9.5%) | 2.90 |
| Non-family | 1,020 (23.3%) | 1.33 |
| Total Households | 4,387 (100.0%) | 2.87 |
Household Size by Marriage Status in Sandy
Out of a total of 4,387 households in Sandy, 3,367 (76.7%) are family households, while 1,020 (23.3%) are nonfamily households. The most numerous type of family households are 2-person households, comprising 1,022, and the most common type of nonfamily households are 1-person households, comprising 792.
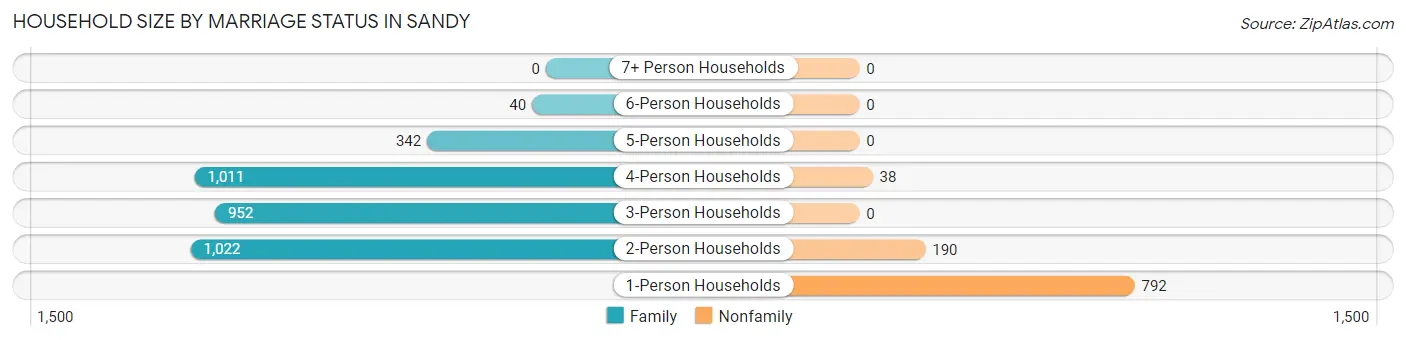
| Household Size | Family Households | Nonfamily Households |
| 1-Person Households | - | 792 (18.0%) |
| 2-Person Households | 1,022 (23.3%) | 190 (4.3%) |
| 3-Person Households | 952 (21.7%) | 0 (0.0%) |
| 4-Person Households | 1,011 (23.1%) | 38 (0.9%) |
| 5-Person Households | 342 (7.8%) | 0 (0.0%) |
| 6-Person Households | 40 (0.9%) | 0 (0.0%) |
| 7+ Person Households | 0 (0.0%) | 0 (0.0%) |
| Total | 3,367 (76.7%) | 1,020 (23.3%) |
Female Fertility in Sandy
Fertility by Age in Sandy
Average fertility rate in Sandy is 118.0 births per 1,000 women. Women in the age bracket of 20 to 34 years have the highest fertility rate with 242.0 births per 1,000 women. Women in the age bracket of 20 to 34 years acount for 93.1% of all women with births.
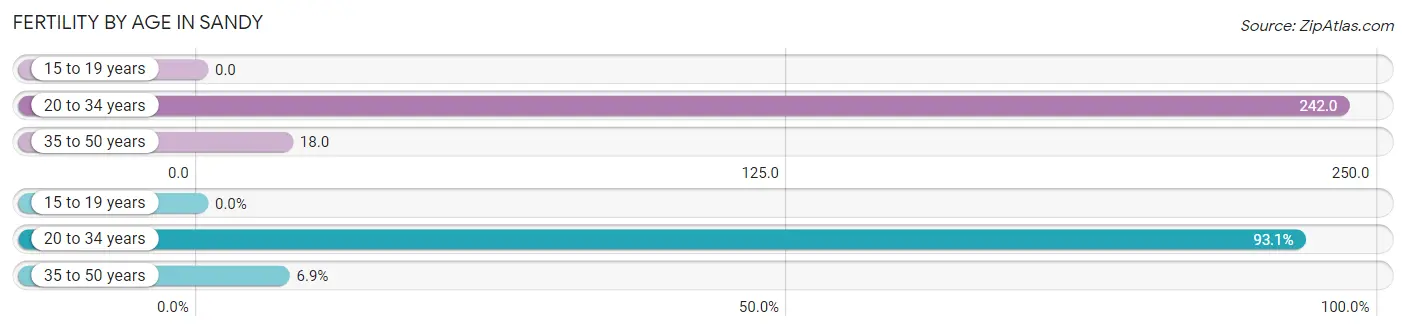
| Age Bracket | Women with Births | Births / 1,000 Women |
| 15 to 19 years | 0 (0.0%) | 0.0 |
| 20 to 34 years | 390 (93.1%) | 242.0 |
| 35 to 50 years | 29 (6.9%) | 18.0 |
| Total | 419 (100.0%) | 118.0 |
Fertility by Age by Marriage Status in Sandy
93.1% of women with births (419) in Sandy are married. The highest percentage of unmarried women with births falls into 35 to 50 years age bracket with 100.0% of them unmarried at the time of birth, while the lowest percentage of unmarried women with births belong to 20 to 34 years age bracket with 0.0% of them unmarried.
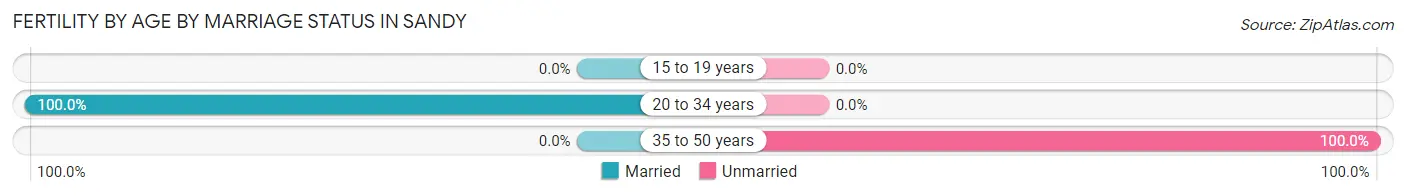
| Age Bracket | Married | Unmarried |
| 15 to 19 years | 0 (0.0%) | 0 (0.0%) |
| 20 to 34 years | 390 (100.0%) | 0 (0.0%) |
| 35 to 50 years | 0 (0.0%) | 29 (100.0%) |
| Total | 390 (93.1%) | 29 (6.9%) |
Fertility by Education in Sandy
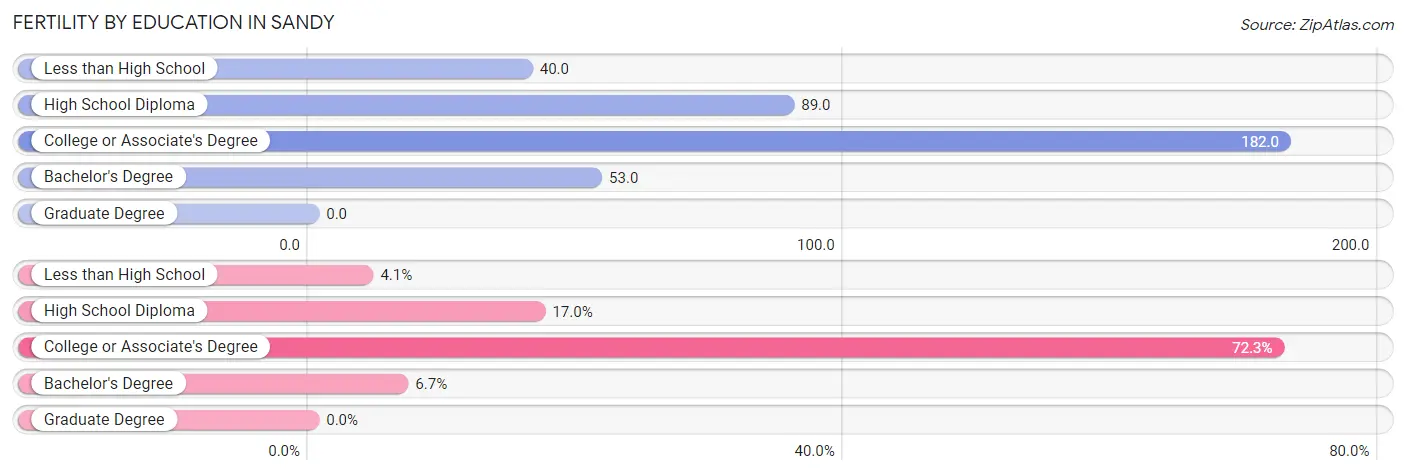
| Educational Attainment | Women with Births | Births / 1,000 Women |
| Less than High School | 17 (4.1%) | 40.0 |
| High School Diploma | 71 (17.0%) | 89.0 |
| College or Associate's Degree | 303 (72.3%) | 182.0 |
| Bachelor's Degree | 28 (6.7%) | 53.0 |
| Graduate Degree | 0 (0.0%) | 0.0 |
| Total | 419 (100.0%) | 118.0 |
Fertility by Education by Marriage Status in Sandy
6.9% of women with births in Sandy are unmarried. Women with the educational attainment of less than high school are most likely to be married with 100.0% of them married at childbirth, while women with the educational attainment of college or associate's degree are least likely to be married with 9.6% of them unmarried at childbirth.
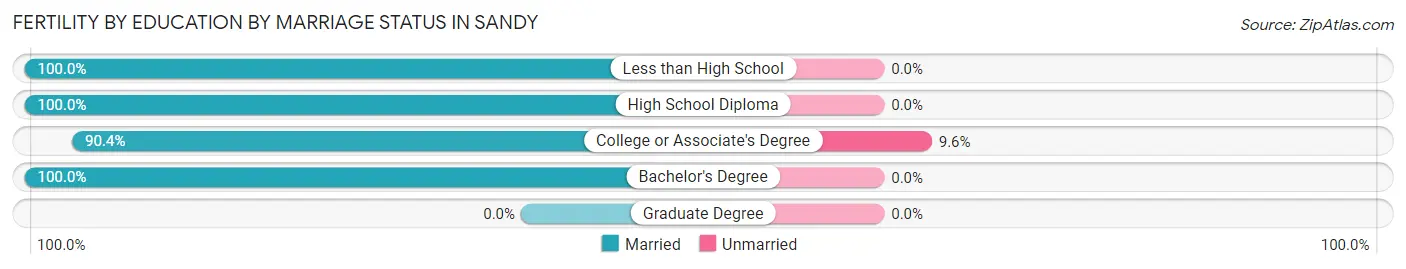
| Educational Attainment | Married | Unmarried |
| Less than High School | 17 (100.0%) | 0 (0.0%) |
| High School Diploma | 71 (100.0%) | 0 (0.0%) |
| College or Associate's Degree | 274 (90.4%) | 29 (9.6%) |
| Bachelor's Degree | 28 (100.0%) | 0 (0.0%) |
| Graduate Degree | 0 (0.0%) | 0 (0.0%) |
| Total | 390 (93.1%) | 29 (6.9%) |
Employment Characteristics in Sandy
Employment by Class of Employer in Sandy
Among the 6,073 employed individuals in Sandy, private company employees (4,353 | 71.7%), not-for-profit organizations (456 | 7.5%), and local government employees (378 | 6.2%) make up the most common classes of employment.
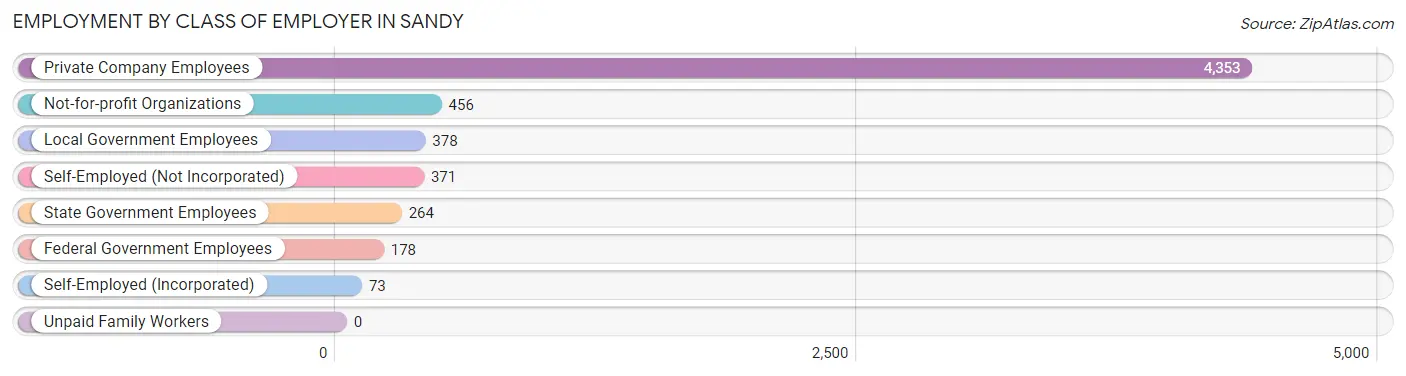
| Employer Class | # Employees | % Employees |
| Private Company Employees | 4,353 | 71.7% |
| Self-Employed (Incorporated) | 73 | 1.2% |
| Self-Employed (Not Incorporated) | 371 | 6.1% |
| Not-for-profit Organizations | 456 | 7.5% |
| Local Government Employees | 378 | 6.2% |
| State Government Employees | 264 | 4.3% |
| Federal Government Employees | 178 | 2.9% |
| Unpaid Family Workers | 0 | 0.0% |
| Total | 6,073 | 100.0% |
Employment Status by Age in Sandy
According to the labor force statistics for Sandy, out of the total population over 16 years of age (10,076), 67.4% or 6,791 individuals are in the labor force, with 4.8% or 326 of them unemployed. The age group with the highest labor force participation rate is 20 to 24 years, with 95.2% or 708 individuals in the labor force. Within the labor force, the 55 to 59 years age range has the highest percentage of unemployed individuals, with 11.9% or 41 of them being unemployed.
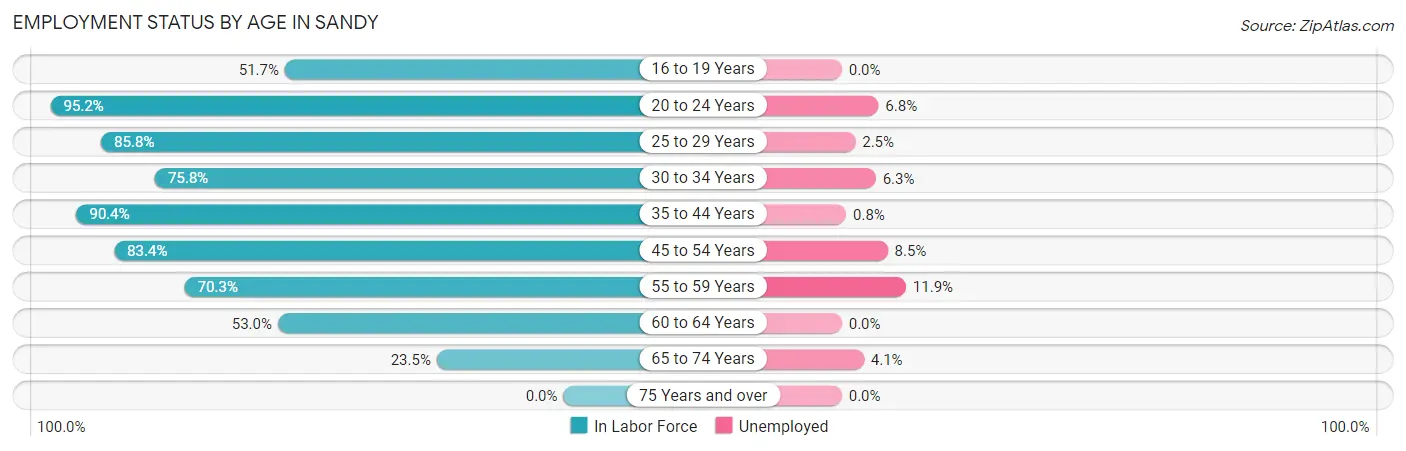
| Age Bracket | In Labor Force | Unemployed |
| 16 to 19 Years | 465 (51.7%) | 0 (0.0%) |
| 20 to 24 Years | 708 (95.2%) | 48 (6.8%) |
| 25 to 29 Years | 786 (85.8%) | 20 (2.5%) |
| 30 to 34 Years | 1,135 (75.8%) | 72 (6.3%) |
| 35 to 44 Years | 1,417 (90.4%) | 11 (0.8%) |
| 45 to 54 Years | 1,481 (83.4%) | 126 (8.5%) |
| 55 to 59 Years | 345 (70.3%) | 41 (11.9%) |
| 60 to 64 Years | 287 (53.0%) | 0 (0.0%) |
| 65 to 74 Years | 171 (23.5%) | 7 (4.1%) |
| 75 Years and over | 0 (0.0%) | 0 (0.0%) |
| Total | 6,791 (67.4%) | 326 (4.8%) |
Employment Status by Educational Attainment in Sandy
According to labor force statistics for Sandy, 80.3% of individuals (5,452) out of the total population between 25 and 64 years of age (6,790) are in the labor force, with 4.9% or 267 of them being unemployed. The group with the highest labor force participation rate are those with the educational attainment of bachelor's degree or higher, with 88.6% or 1,360 individuals in the labor force. Within the labor force, individuals with bachelor's degree or higher education have the highest percentage of unemployment, with 6.7% or 91 of them being unemployed.
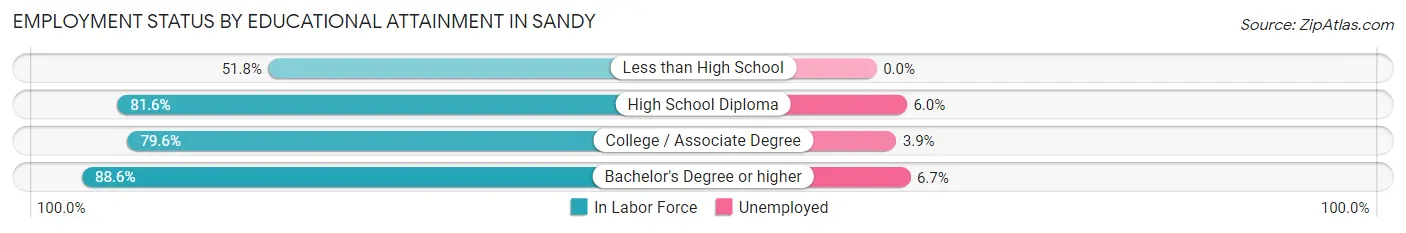
| Educational Attainment | In Labor Force | Unemployed |
| Less than High School | 232 (51.8%) | 0 (0.0%) |
| High School Diploma | 1,357 (81.6%) | 100 (6.0%) |
| College / Associate Degree | 2,503 (79.6%) | 123 (3.9%) |
| Bachelor's Degree or higher | 1,360 (88.6%) | 103 (6.7%) |
| Total | 5,452 (80.3%) | 333 (4.9%) |
Employment Occupations by Sex in Sandy
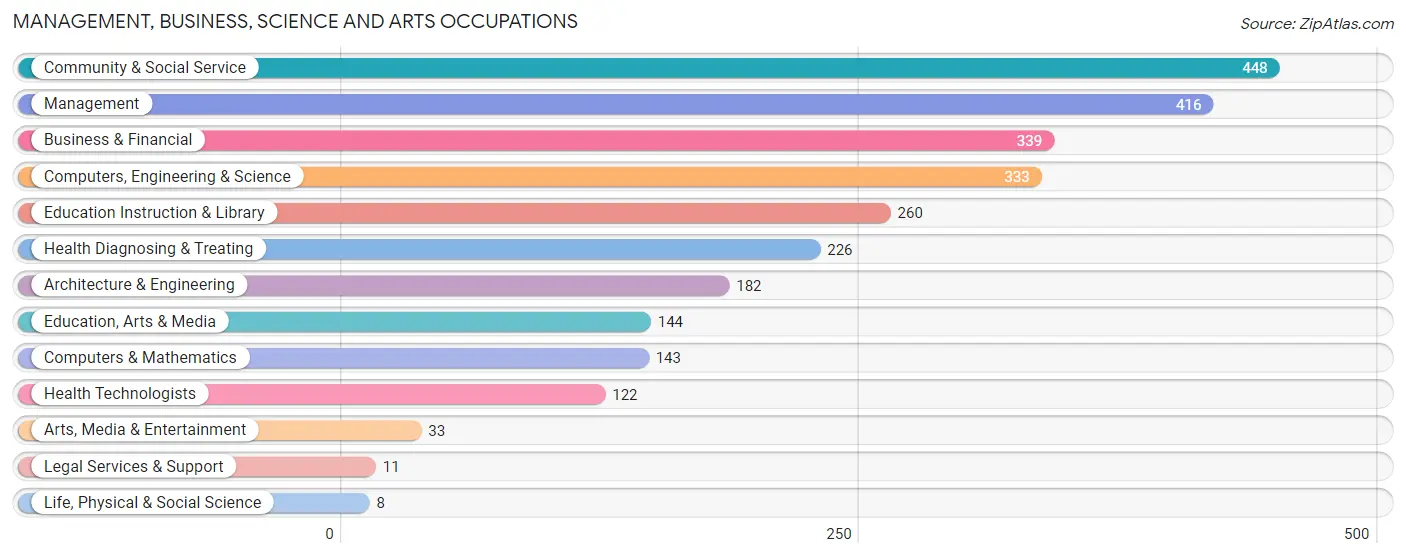
Management, Business, Science and Arts Occupations
The most common Management, Business, Science and Arts occupations in Sandy are Community & Social Service (448 | 6.9%), Management (416 | 6.5%), Business & Financial (339 | 5.2%), Computers, Engineering & Science (333 | 5.2%), and Education Instruction & Library (260 | 4.0%).
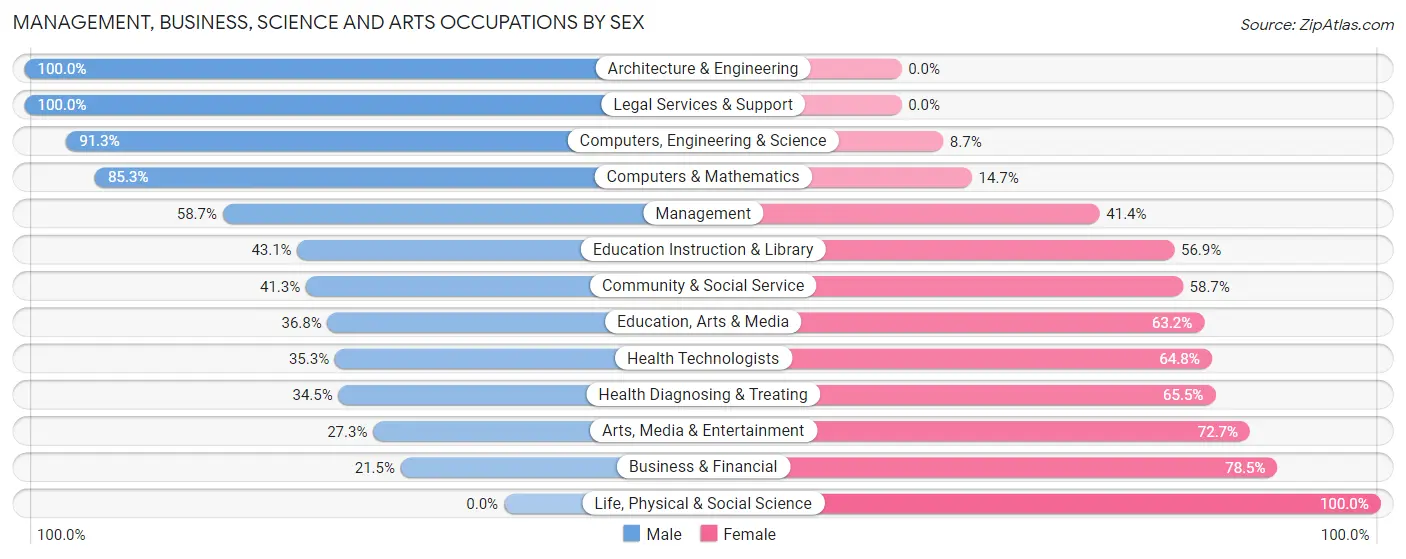
Management, Business, Science and Arts Occupations by Sex
Within the Management, Business, Science and Arts occupations in Sandy, the most male-oriented occupations are Architecture & Engineering (100.0%), Legal Services & Support (100.0%), and Computers, Engineering & Science (91.3%), while the most female-oriented occupations are Life, Physical & Social Science (100.0%), Business & Financial (78.5%), and Arts, Media & Entertainment (72.7%).
| Occupation | Male | Female |
| Management | 244 (58.7%) | 172 (41.3%) |
| Business & Financial | 73 (21.5%) | 266 (78.5%) |
| Computers, Engineering & Science | 304 (91.3%) | 29 (8.7%) |
| Computers & Mathematics | 122 (85.3%) | 21 (14.7%) |
| Architecture & Engineering | 182 (100.0%) | 0 (0.0%) |
| Life, Physical & Social Science | 0 (0.0%) | 8 (100.0%) |
| Community & Social Service | 185 (41.3%) | 263 (58.7%) |
| Education, Arts & Media | 53 (36.8%) | 91 (63.2%) |
| Legal Services & Support | 11 (100.0%) | 0 (0.0%) |
| Education Instruction & Library | 112 (43.1%) | 148 (56.9%) |
| Arts, Media & Entertainment | 9 (27.3%) | 24 (72.7%) |
| Health Diagnosing & Treating | 78 (34.5%) | 148 (65.5%) |
| Health Technologists | 43 (35.2%) | 79 (64.7%) |
| Total (Category) | 884 (50.2%) | 878 (49.8%) |
| Total (Overall) | 3,449 (53.5%) | 3,003 (46.5%) |
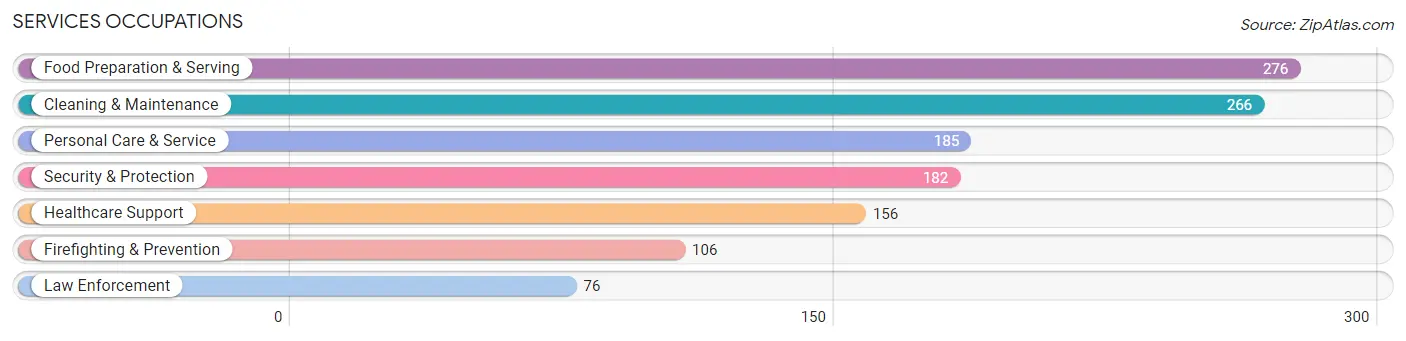
Services Occupations
The most common Services occupations in Sandy are Food Preparation & Serving (276 | 4.3%), Cleaning & Maintenance (266 | 4.1%), Personal Care & Service (185 | 2.9%), Security & Protection (182 | 2.8%), and Healthcare Support (156 | 2.4%).
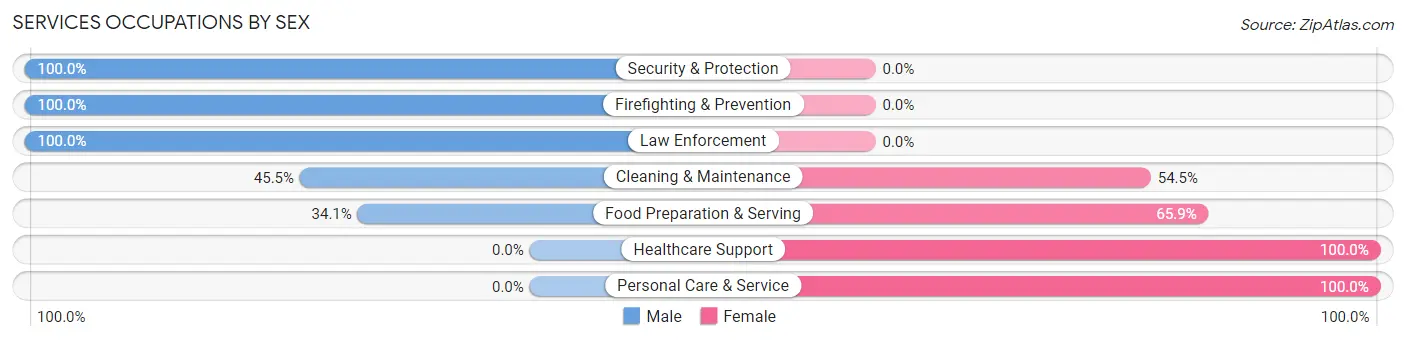
Services Occupations by Sex
Within the Services occupations in Sandy, the most male-oriented occupations are Security & Protection (100.0%), Firefighting & Prevention (100.0%), and Law Enforcement (100.0%), while the most female-oriented occupations are Healthcare Support (100.0%), Personal Care & Service (100.0%), and Food Preparation & Serving (65.9%).
| Occupation | Male | Female |
| Healthcare Support | 0 (0.0%) | 156 (100.0%) |
| Security & Protection | 182 (100.0%) | 0 (0.0%) |
| Firefighting & Prevention | 106 (100.0%) | 0 (0.0%) |
| Law Enforcement | 76 (100.0%) | 0 (0.0%) |
| Food Preparation & Serving | 94 (34.1%) | 182 (65.9%) |
| Cleaning & Maintenance | 121 (45.5%) | 145 (54.5%) |
| Personal Care & Service | 0 (0.0%) | 185 (100.0%) |
| Total (Category) | 397 (37.3%) | 668 (62.7%) |
| Total (Overall) | 3,449 (53.5%) | 3,003 (46.5%) |
Sales and Office Occupations
The most common Sales and Office occupations in Sandy are Office & Administration (1,016 | 15.8%), and Sales & Related (464 | 7.2%).
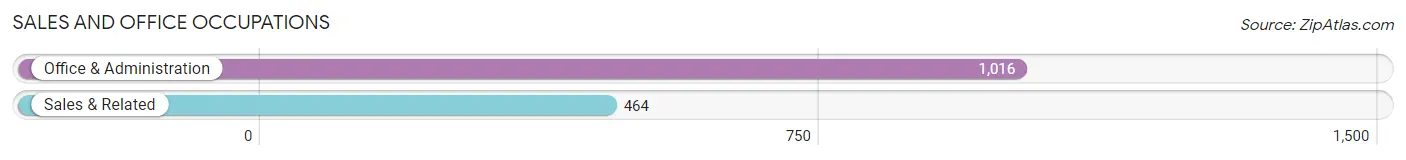
Sales and Office Occupations by Sex
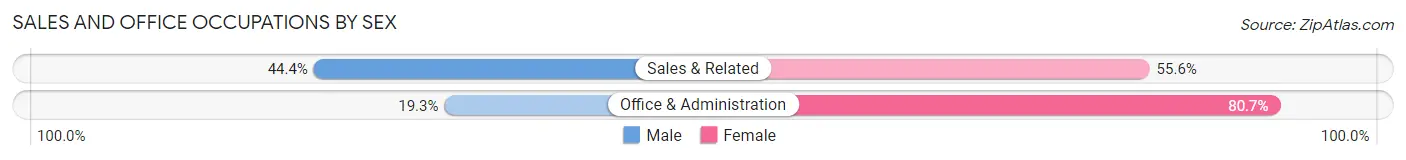
| Occupation | Male | Female |
| Sales & Related | 206 (44.4%) | 258 (55.6%) |
| Office & Administration | 196 (19.3%) | 820 (80.7%) |
| Total (Category) | 402 (27.2%) | 1,078 (72.8%) |
| Total (Overall) | 3,449 (53.5%) | 3,003 (46.5%) |
Natural Resources, Construction and Maintenance Occupations
The most common Natural Resources, Construction and Maintenance occupations in Sandy are Installation, Maintenance & Repair (363 | 5.6%), and Construction & Extraction (333 | 5.2%).
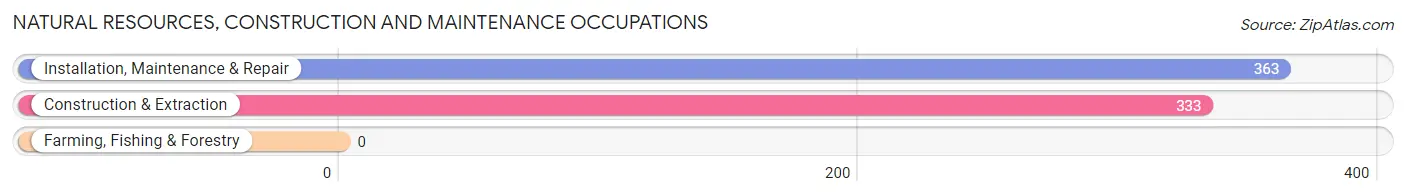
Natural Resources, Construction and Maintenance Occupations by Sex
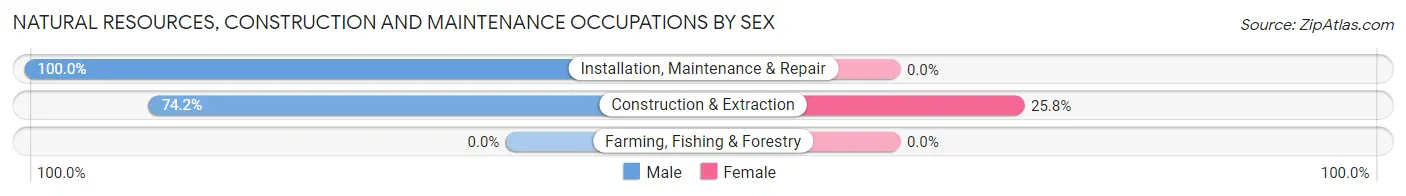
| Occupation | Male | Female |
| Farming, Fishing & Forestry | 0 (0.0%) | 0 (0.0%) |
| Construction & Extraction | 247 (74.2%) | 86 (25.8%) |
| Installation, Maintenance & Repair | 363 (100.0%) | 0 (0.0%) |
| Total (Category) | 610 (87.6%) | 86 (12.4%) |
| Total (Overall) | 3,449 (53.5%) | 3,003 (46.5%) |
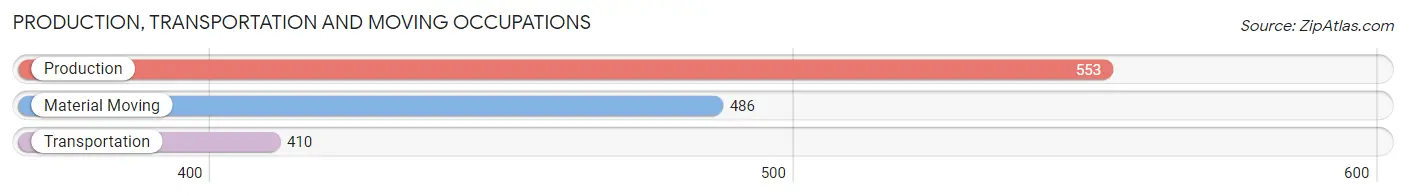
Production, Transportation and Moving Occupations
The most common Production, Transportation and Moving occupations in Sandy are Production (553 | 8.6%), Material Moving (486 | 7.5%), and Transportation (410 | 6.4%).
Production, Transportation and Moving Occupations by Sex
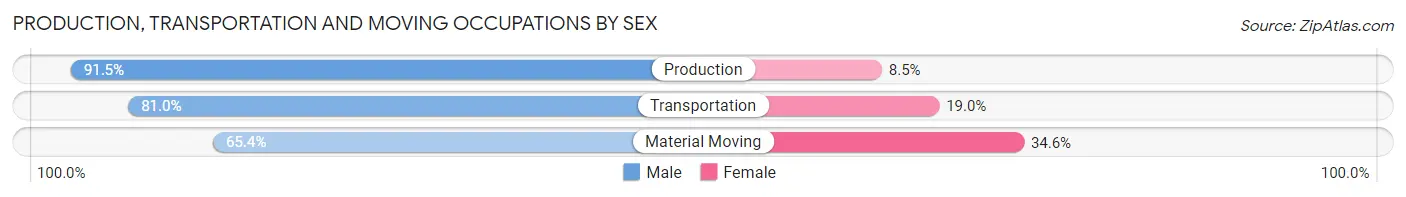
| Occupation | Male | Female |
| Production | 506 (91.5%) | 47 (8.5%) |
| Transportation | 332 (81.0%) | 78 (19.0%) |
| Material Moving | 318 (65.4%) | 168 (34.6%) |
| Total (Category) | 1,156 (79.8%) | 293 (20.2%) |
| Total (Overall) | 3,449 (53.5%) | 3,003 (46.5%) |
Employment Industries by Sex in Sandy
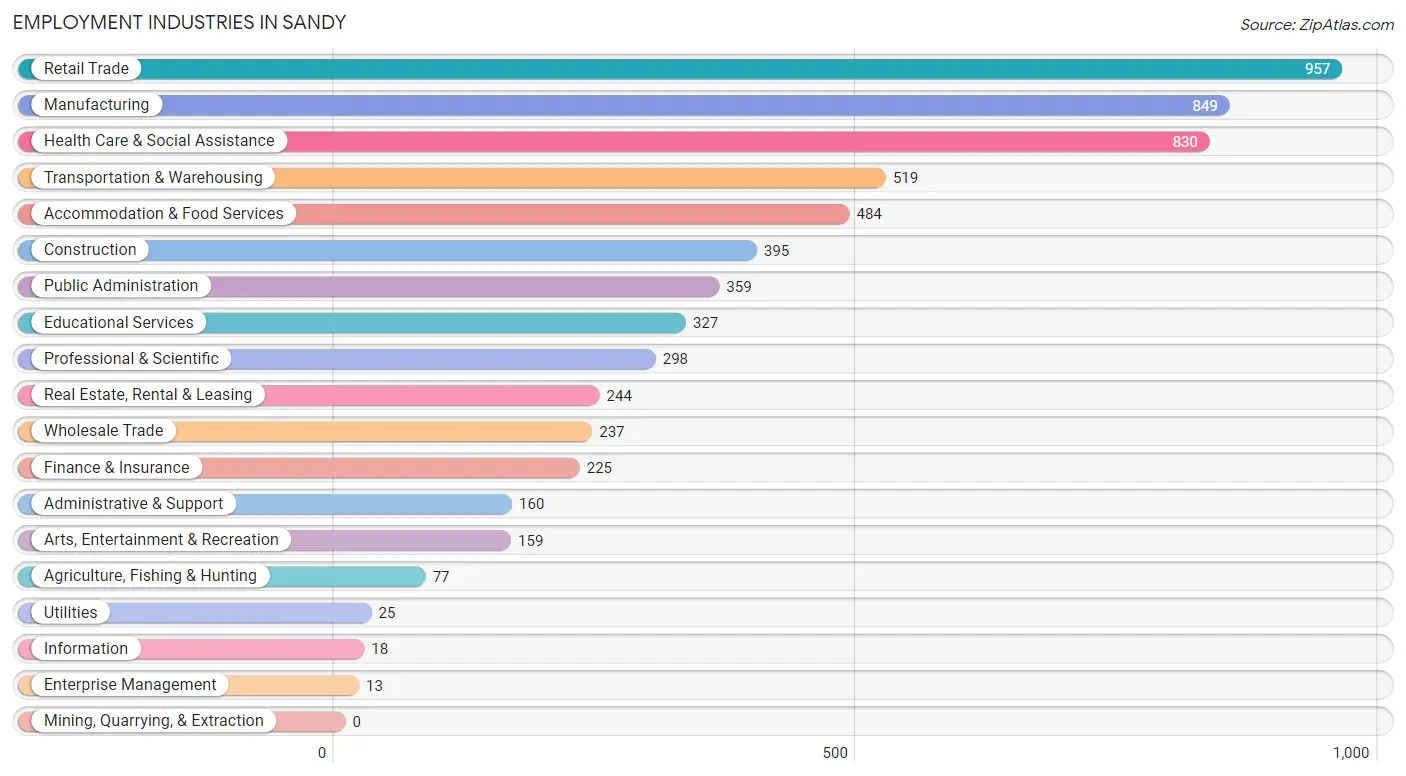
Employment Industries in Sandy
The major employment industries in Sandy include Retail Trade (957 | 14.8%), Manufacturing (849 | 13.2%), Health Care & Social Assistance (830 | 12.9%), Transportation & Warehousing (519 | 8.0%), and Accommodation & Food Services (484 | 7.5%).
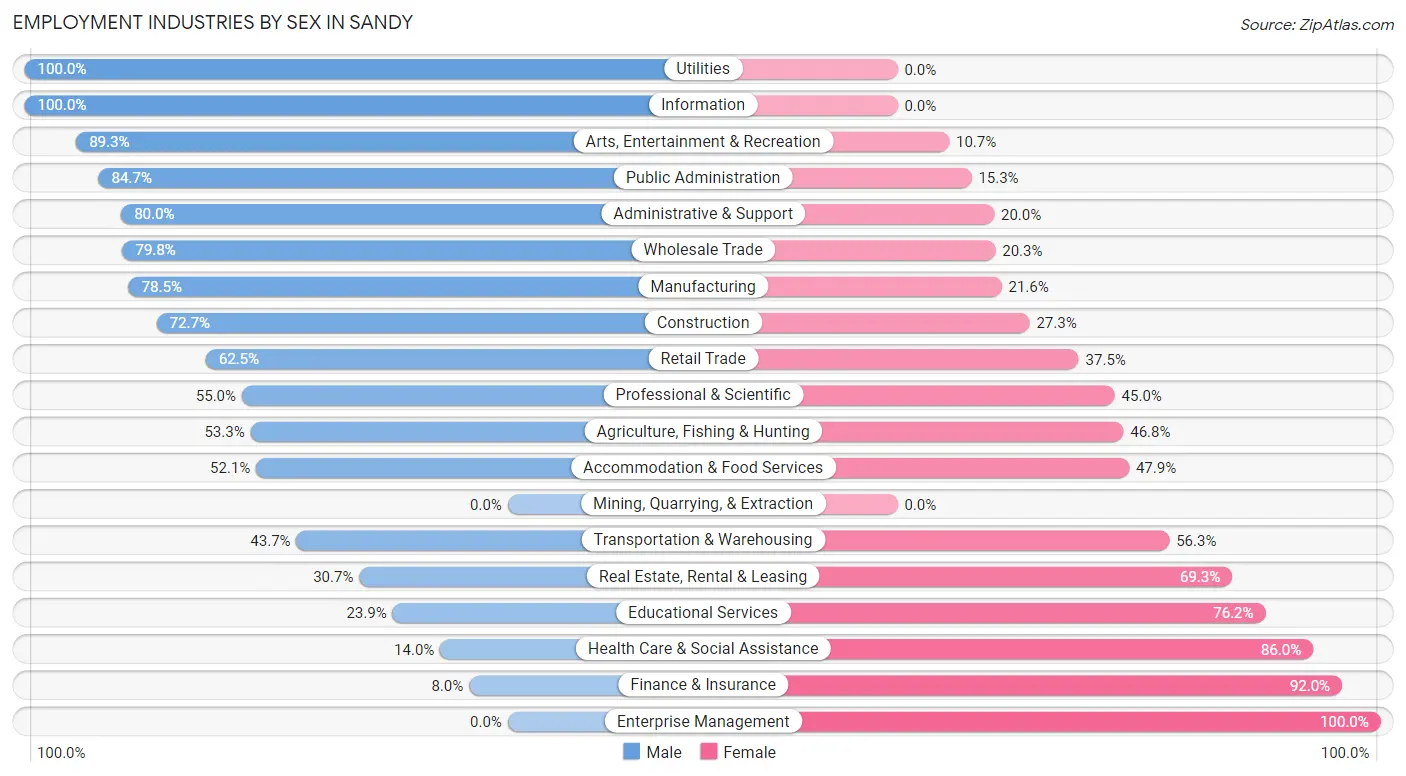
Employment Industries by Sex in Sandy
The Sandy industries that see more men than women are Utilities (100.0%), Information (100.0%), and Arts, Entertainment & Recreation (89.3%), whereas the industries that tend to have a higher number of women are Enterprise Management (100.0%), Finance & Insurance (92.0%), and Health Care & Social Assistance (86.0%).
| Industry | Male | Female |
| Agriculture, Fishing & Hunting | 41 (53.2%) | 36 (46.8%) |
| Mining, Quarrying, & Extraction | 0 (0.0%) | 0 (0.0%) |
| Construction | 287 (72.7%) | 108 (27.3%) |
| Manufacturing | 666 (78.4%) | 183 (21.5%) |
| Wholesale Trade | 189 (79.7%) | 48 (20.3%) |
| Retail Trade | 598 (62.5%) | 359 (37.5%) |
| Transportation & Warehousing | 227 (43.7%) | 292 (56.3%) |
| Utilities | 25 (100.0%) | 0 (0.0%) |
| Information | 18 (100.0%) | 0 (0.0%) |
| Finance & Insurance | 18 (8.0%) | 207 (92.0%) |
| Real Estate, Rental & Leasing | 75 (30.7%) | 169 (69.3%) |
| Professional & Scientific | 164 (55.0%) | 134 (45.0%) |
| Enterprise Management | 0 (0.0%) | 13 (100.0%) |
| Administrative & Support | 128 (80.0%) | 32 (20.0%) |
| Educational Services | 78 (23.8%) | 249 (76.1%) |
| Health Care & Social Assistance | 116 (14.0%) | 714 (86.0%) |
| Arts, Entertainment & Recreation | 142 (89.3%) | 17 (10.7%) |
| Accommodation & Food Services | 252 (52.1%) | 232 (47.9%) |
| Public Administration | 304 (84.7%) | 55 (15.3%) |
| Total | 3,449 (53.5%) | 3,003 (46.5%) |
Education in Sandy
School Enrollment in Sandy
The most common levels of schooling among the 2,809 students in Sandy are high school (932 | 33.2%), middle school (682 | 24.3%), and elementary school (625 | 22.3%).
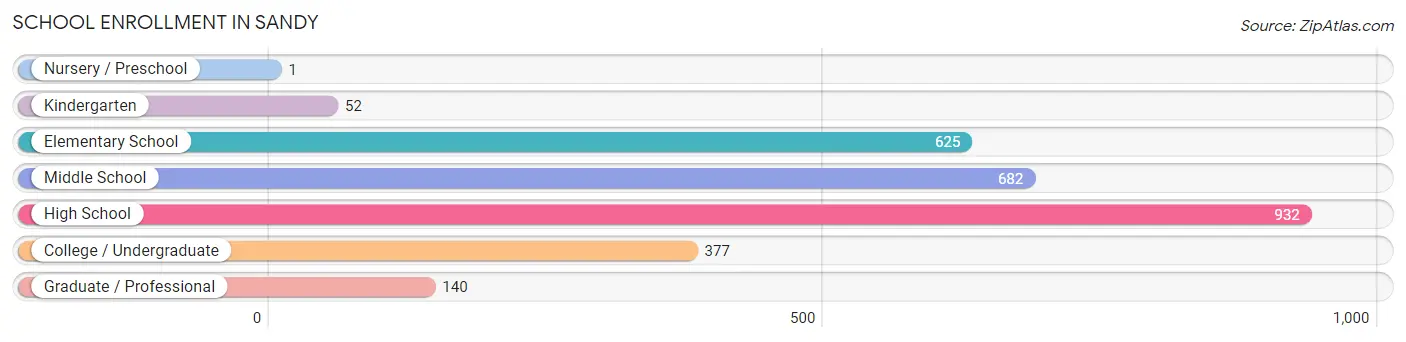
| School Level | # Students | % Students |
| Nursery / Preschool | 1 | 0.0% |
| Kindergarten | 52 | 1.8% |
| Elementary School | 625 | 22.3% |
| Middle School | 682 | 24.3% |
| High School | 932 | 33.2% |
| College / Undergraduate | 377 | 13.4% |
| Graduate / Professional | 140 | 5.0% |
| Total | 2,809 | 100.0% |
School Enrollment by Age by Funding Source in Sandy
Out of a total of 2,809 students who are enrolled in schools in Sandy, 427 (15.2%) attend a private institution, while the remaining 2,382 (84.8%) are enrolled in public schools. The age group of 3 to 4 year olds has the highest likelihood of being enrolled in private schools, with 1 (100.0% in the age bracket) enrolled. Conversely, the age group of 18 to 19 year olds has the lowest likelihood of being enrolled in a private school, with 297 (100.0% in the age bracket) attending a public institution.
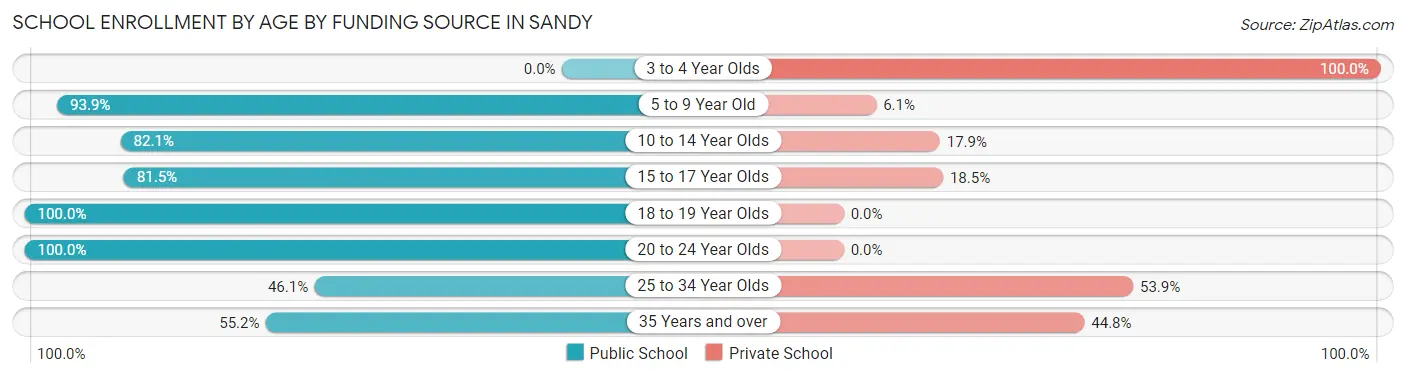
| Age Bracket | Public School | Private School |
| 3 to 4 Year Olds | 0 (0.0%) | 1 (100.0%) |
| 5 to 9 Year Old | 465 (93.9%) | 30 (6.1%) |
| 10 to 14 Year Olds | 789 (82.1%) | 172 (17.9%) |
| 15 to 17 Year Olds | 445 (81.5%) | 101 (18.5%) |
| 18 to 19 Year Olds | 297 (100.0%) | 0 (0.0%) |
| 20 to 24 Year Olds | 268 (100.0%) | 0 (0.0%) |
| 25 to 34 Year Olds | 71 (46.1%) | 83 (53.9%) |
| 35 Years and over | 48 (55.2%) | 39 (44.8%) |
| Total | 2,382 (84.8%) | 427 (15.2%) |
Educational Attainment by Field of Study in Sandy
Business (305 | 15.3%), arts & humanities (259 | 13.0%), science & technology (234 | 11.7%), engineering (220 | 11.0%), and literature & languages (150 | 7.5%) are the most common fields of study among 1,999 individuals in Sandy who have obtained a bachelor's degree or higher.
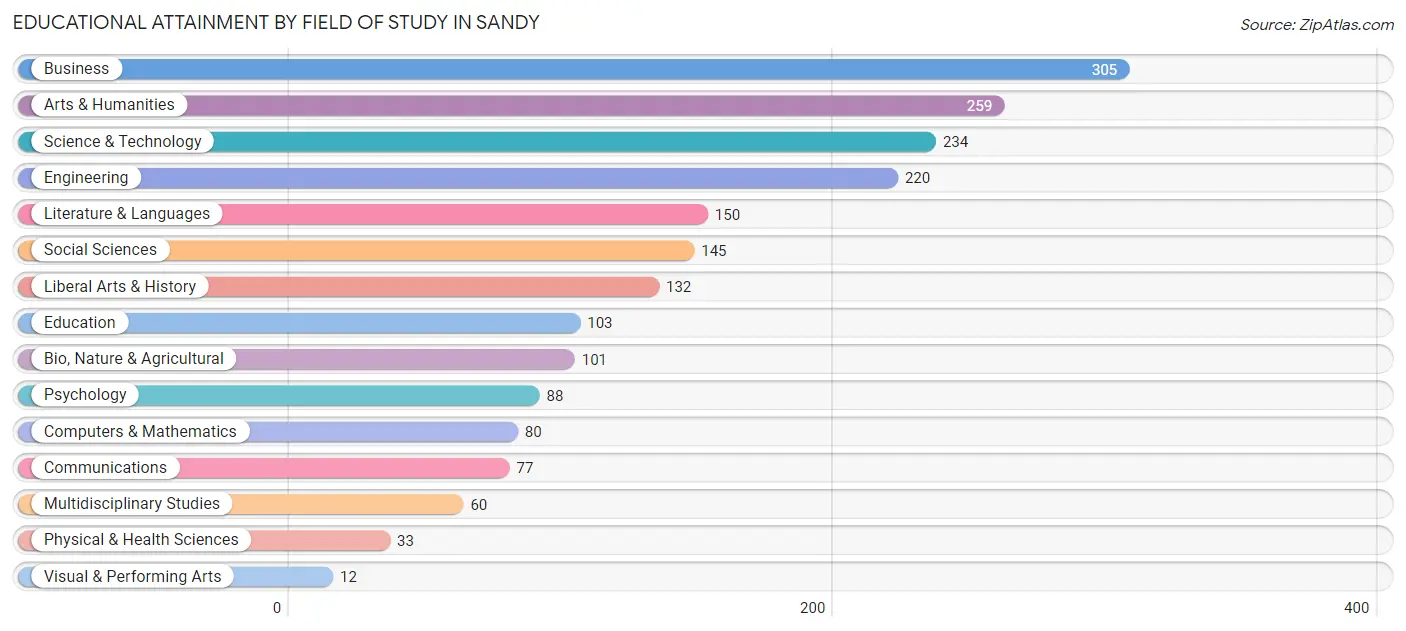
| Field of Study | # Graduates | % Graduates |
| Computers & Mathematics | 80 | 4.0% |
| Bio, Nature & Agricultural | 101 | 5.1% |
| Physical & Health Sciences | 33 | 1.7% |
| Psychology | 88 | 4.4% |
| Social Sciences | 145 | 7.2% |
| Engineering | 220 | 11.0% |
| Multidisciplinary Studies | 60 | 3.0% |
| Science & Technology | 234 | 11.7% |
| Business | 305 | 15.3% |
| Education | 103 | 5.1% |
| Literature & Languages | 150 | 7.5% |
| Liberal Arts & History | 132 | 6.6% |
| Visual & Performing Arts | 12 | 0.6% |
| Communications | 77 | 3.8% |
| Arts & Humanities | 259 | 13.0% |
| Total | 1,999 | 100.0% |
Transportation & Commute in Sandy
Vehicle Availability by Sex in Sandy
The most prevalent vehicle ownership categories in Sandy are males with 2 vehicles (1,316, accounting for 41.4%) and females with 2 vehicles (1,241, making up 45.5%).
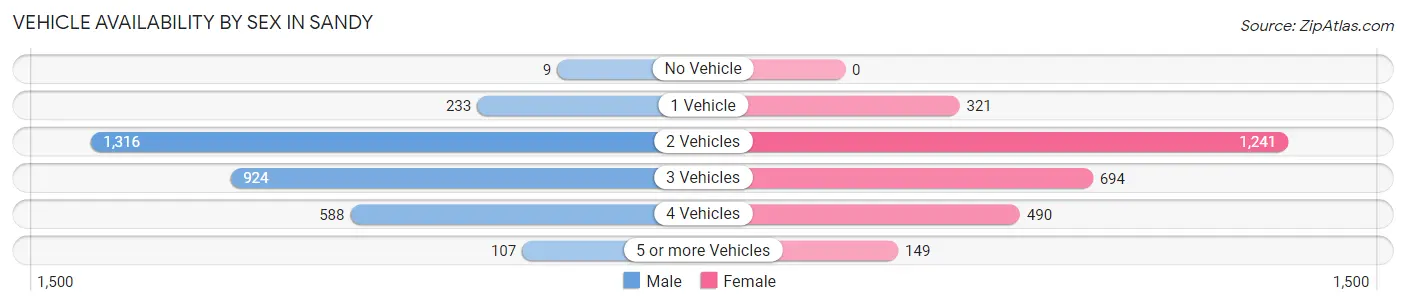
| Vehicles Available | Male | Female |
| No Vehicle | 9 (0.3%) | 0 (0.0%) |
| 1 Vehicle | 233 (7.3%) | 321 (11.1%) |
| 2 Vehicles | 1,316 (41.4%) | 1,241 (42.9%) |
| 3 Vehicles | 924 (29.1%) | 694 (24.0%) |
| 4 Vehicles | 588 (18.5%) | 490 (16.9%) |
| 5 or more Vehicles | 107 (3.4%) | 149 (5.1%) |
| Total | 3,177 (100.0%) | 2,895 (100.0%) |
Commute Time in Sandy
The most frequently occuring commute durations in Sandy are 20 to 24 minutes (866 commuters, 16.2%), 60 to 89 minutes (716 commuters, 13.4%), and 30 to 34 minutes (670 commuters, 12.6%).
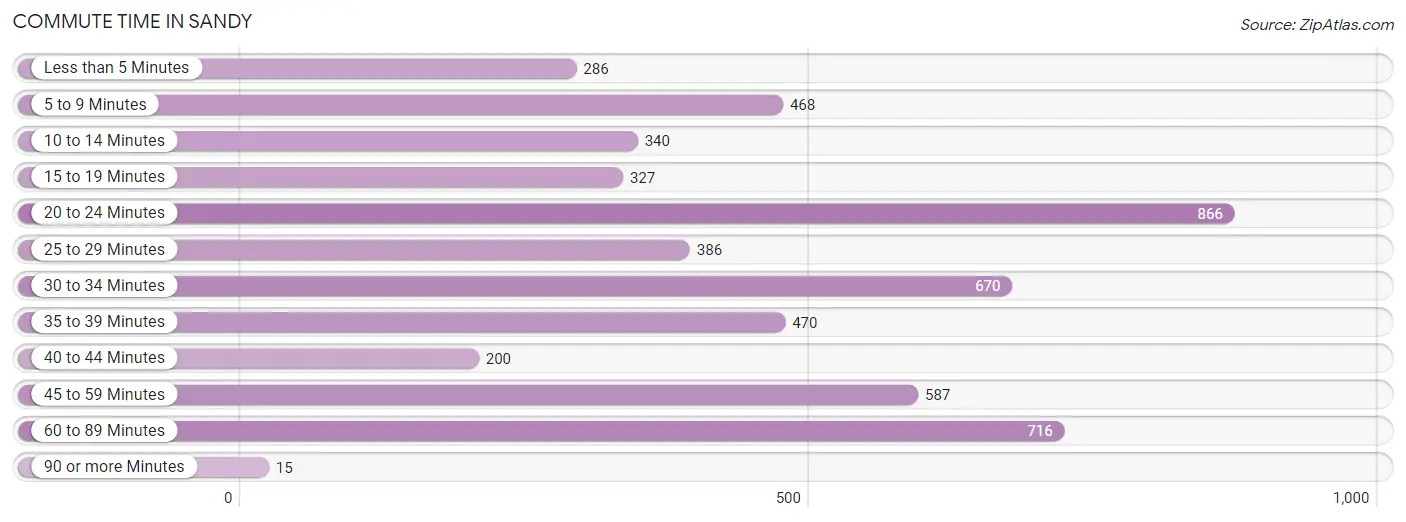
| Commute Time | # Commuters | % Commuters |
| Less than 5 Minutes | 286 | 5.4% |
| 5 to 9 Minutes | 468 | 8.8% |
| 10 to 14 Minutes | 340 | 6.4% |
| 15 to 19 Minutes | 327 | 6.1% |
| 20 to 24 Minutes | 866 | 16.2% |
| 25 to 29 Minutes | 386 | 7.2% |
| 30 to 34 Minutes | 670 | 12.6% |
| 35 to 39 Minutes | 470 | 8.8% |
| 40 to 44 Minutes | 200 | 3.7% |
| 45 to 59 Minutes | 587 | 11.0% |
| 60 to 89 Minutes | 716 | 13.4% |
| 90 or more Minutes | 15 | 0.3% |
Commute Time by Sex in Sandy
The most common commute times in Sandy are 20 to 24 minutes (569 commuters, 19.9%) for males and 45 to 59 minutes (352 commuters, 14.2%) for females.
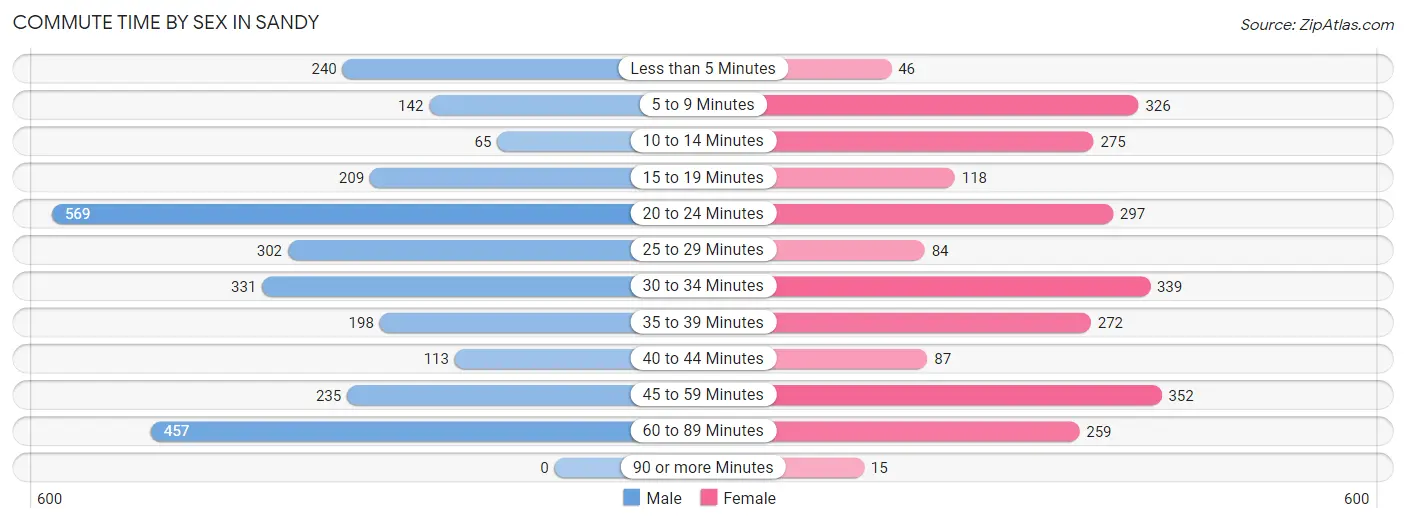
| Commute Time | Male | Female |
| Less than 5 Minutes | 240 (8.4%) | 46 (1.9%) |
| 5 to 9 Minutes | 142 (5.0%) | 326 (13.2%) |
| 10 to 14 Minutes | 65 (2.3%) | 275 (11.1%) |
| 15 to 19 Minutes | 209 (7.3%) | 118 (4.8%) |
| 20 to 24 Minutes | 569 (19.9%) | 297 (12.0%) |
| 25 to 29 Minutes | 302 (10.6%) | 84 (3.4%) |
| 30 to 34 Minutes | 331 (11.6%) | 339 (13.7%) |
| 35 to 39 Minutes | 198 (6.9%) | 272 (11.0%) |
| 40 to 44 Minutes | 113 (4.0%) | 87 (3.5%) |
| 45 to 59 Minutes | 235 (8.2%) | 352 (14.2%) |
| 60 to 89 Minutes | 457 (16.0%) | 259 (10.5%) |
| 90 or more Minutes | 0 (0.0%) | 15 (0.6%) |
Time of Departure to Work by Sex in Sandy
The most frequent times of departure to work in Sandy are 12:00 AM to 4:59 AM (682, 23.8%) for males and 7:00 AM to 7:29 AM (400, 16.2%) for females.
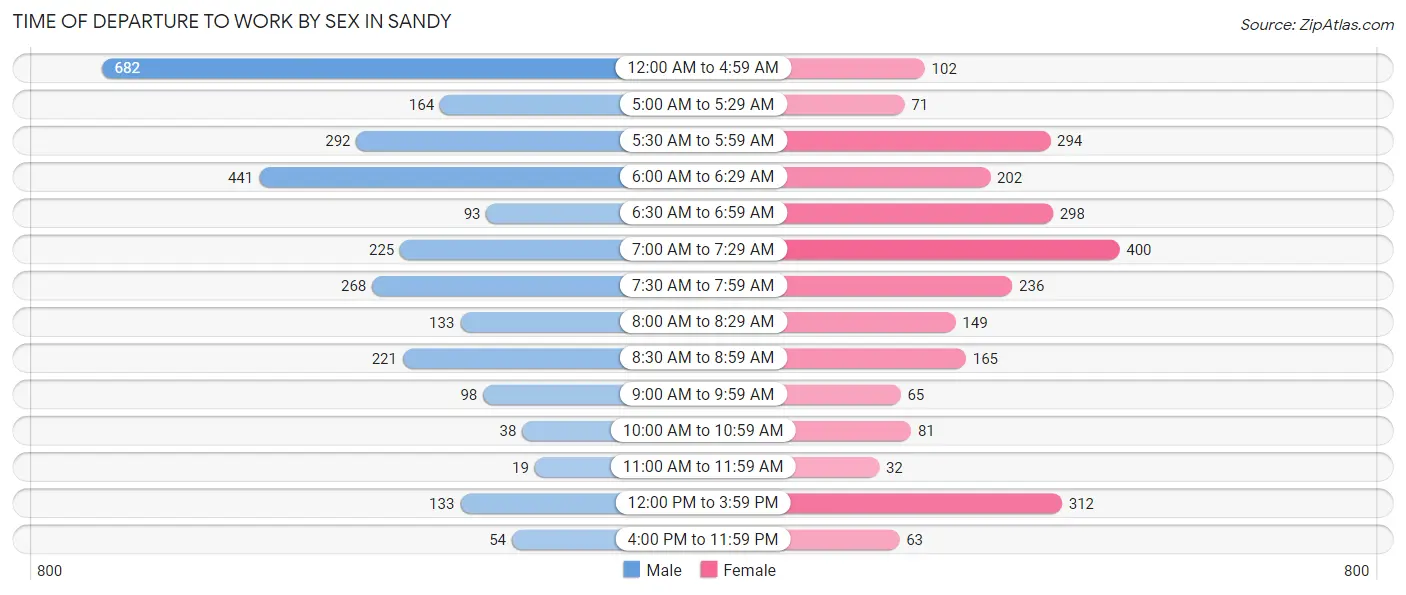
| Time of Departure | Male | Female |
| 12:00 AM to 4:59 AM | 682 (23.8%) | 102 (4.1%) |
| 5:00 AM to 5:29 AM | 164 (5.7%) | 71 (2.9%) |
| 5:30 AM to 5:59 AM | 292 (10.2%) | 294 (11.9%) |
| 6:00 AM to 6:29 AM | 441 (15.4%) | 202 (8.2%) |
| 6:30 AM to 6:59 AM | 93 (3.3%) | 298 (12.1%) |
| 7:00 AM to 7:29 AM | 225 (7.9%) | 400 (16.2%) |
| 7:30 AM to 7:59 AM | 268 (9.4%) | 236 (9.6%) |
| 8:00 AM to 8:29 AM | 133 (4.6%) | 149 (6.0%) |
| 8:30 AM to 8:59 AM | 221 (7.7%) | 165 (6.7%) |
| 9:00 AM to 9:59 AM | 98 (3.4%) | 65 (2.6%) |
| 10:00 AM to 10:59 AM | 38 (1.3%) | 81 (3.3%) |
| 11:00 AM to 11:59 AM | 19 (0.7%) | 32 (1.3%) |
| 12:00 PM to 3:59 PM | 133 (4.6%) | 312 (12.6%) |
| 4:00 PM to 11:59 PM | 54 (1.9%) | 63 (2.5%) |
| Total | 2,861 (100.0%) | 2,470 (100.0%) |
Housing Occupancy in Sandy
Occupancy by Ownership in Sandy
Of the total 4,387 dwellings in Sandy, owner-occupied units account for 3,363 (76.7%), while renter-occupied units make up 1,024 (23.3%).
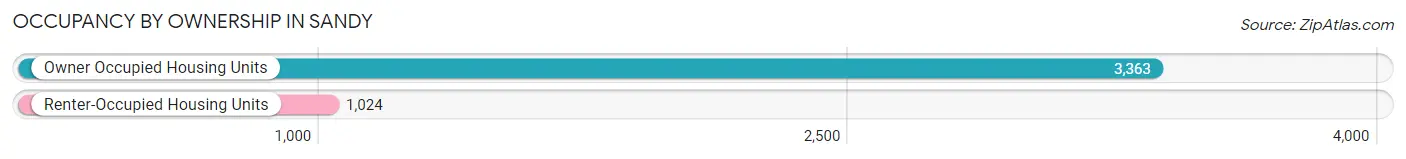
| Occupancy | # Housing Units | % Housing Units |
| Owner Occupied Housing Units | 3,363 | 76.7% |
| Renter-Occupied Housing Units | 1,024 | 23.3% |
| Total Occupied Housing Units | 4,387 | 100.0% |
Occupancy by Household Size in Sandy
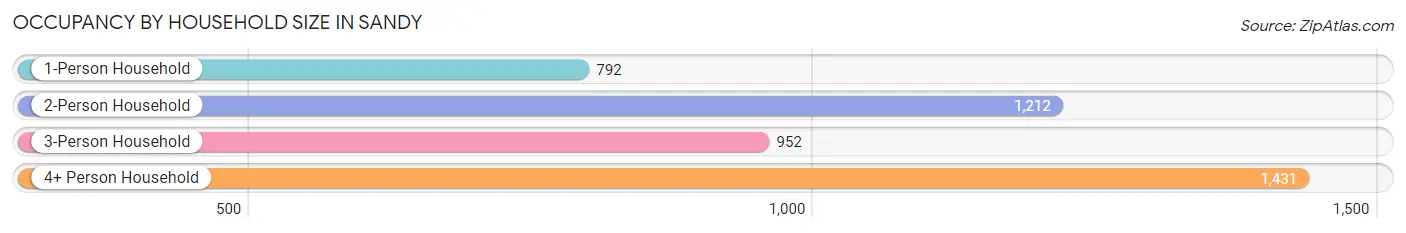
| Household Size | # Housing Units | % Housing Units |
| 1-Person Household | 792 | 18.0% |
| 2-Person Household | 1,212 | 27.6% |
| 3-Person Household | 952 | 21.7% |
| 4+ Person Household | 1,431 | 32.6% |
| Total Housing Units | 4,387 | 100.0% |
Occupancy by Ownership by Household Size in Sandy
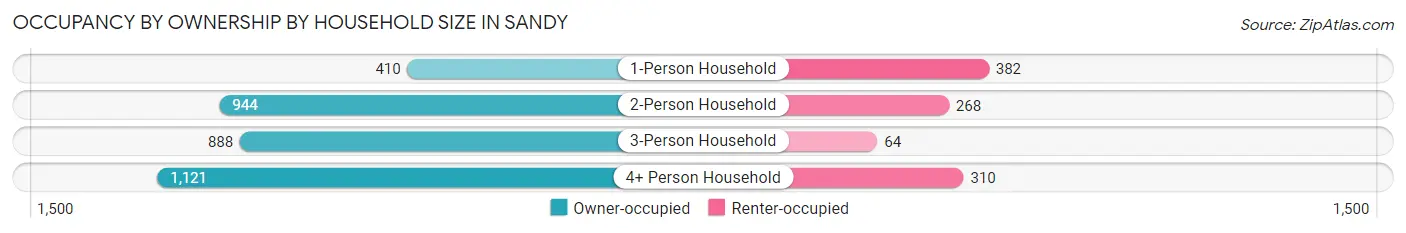
| Household Size | Owner-occupied | Renter-occupied |
| 1-Person Household | 410 (51.8%) | 382 (48.2%) |
| 2-Person Household | 944 (77.9%) | 268 (22.1%) |
| 3-Person Household | 888 (93.3%) | 64 (6.7%) |
| 4+ Person Household | 1,121 (78.3%) | 310 (21.7%) |
| Total Housing Units | 3,363 (76.7%) | 1,024 (23.3%) |
Occupancy by Educational Attainment in Sandy
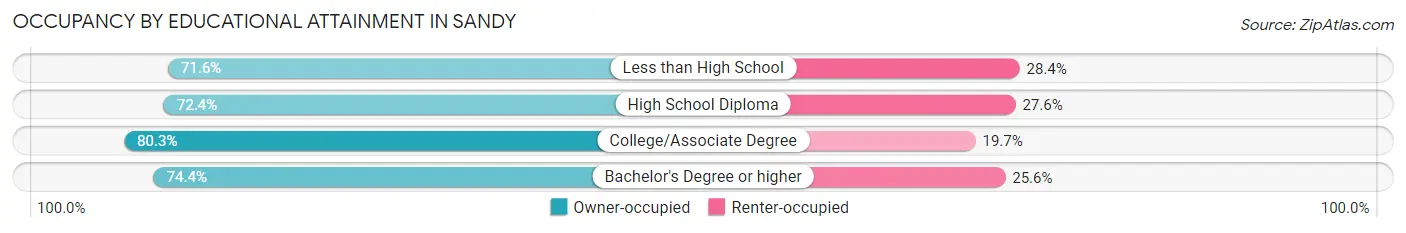
| Household Size | Owner-occupied | Renter-occupied |
| Less than High School | 131 (71.6%) | 52 (28.4%) |
| High School Diploma | 684 (72.4%) | 261 (27.6%) |
| College/Associate Degree | 1,682 (80.3%) | 413 (19.7%) |
| Bachelor's Degree or higher | 866 (74.4%) | 298 (25.6%) |
Occupancy by Age of Householder in Sandy
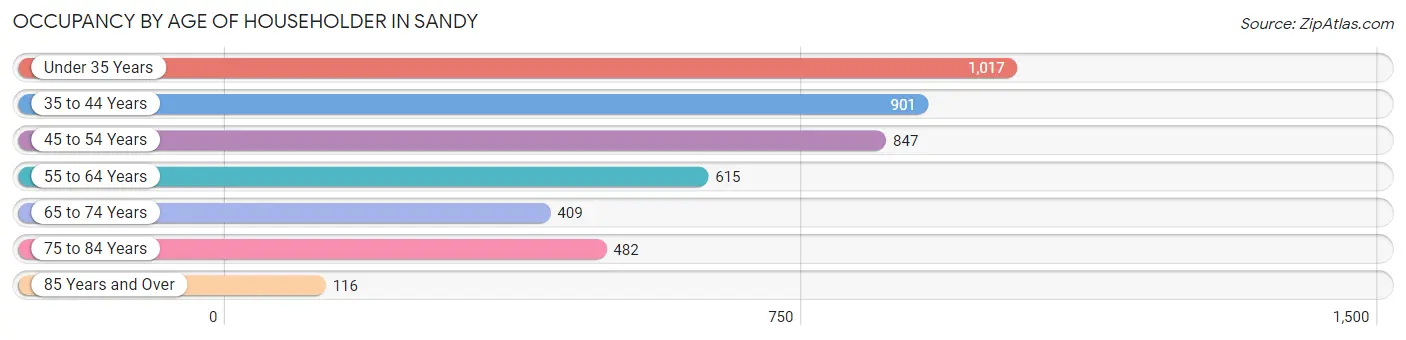
| Age Bracket | # Households | % Households |
| Under 35 Years | 1,017 | 23.2% |
| 35 to 44 Years | 901 | 20.5% |
| 45 to 54 Years | 847 | 19.3% |
| 55 to 64 Years | 615 | 14.0% |
| 65 to 74 Years | 409 | 9.3% |
| 75 to 84 Years | 482 | 11.0% |
| 85 Years and Over | 116 | 2.6% |
| Total | 4,387 | 100.0% |
Housing Finances in Sandy
Median Income by Occupancy in Sandy
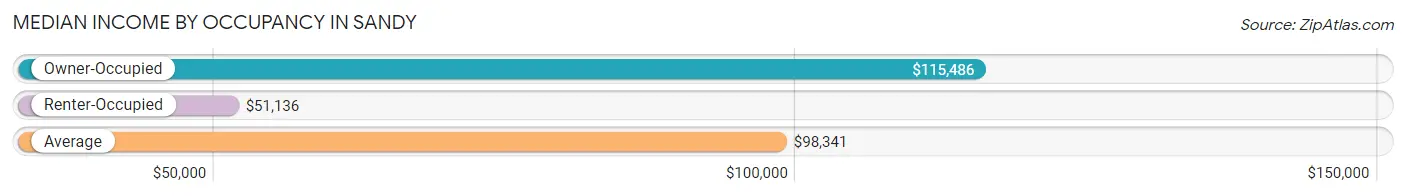
| Occupancy Type | # Households | Median Income |
| Owner-Occupied | 3,363 (76.7%) | $115,486 |
| Renter-Occupied | 1,024 (23.3%) | $51,136 |
| Average | 4,387 (100.0%) | $98,341 |
Occupancy by Householder Income Bracket in Sandy
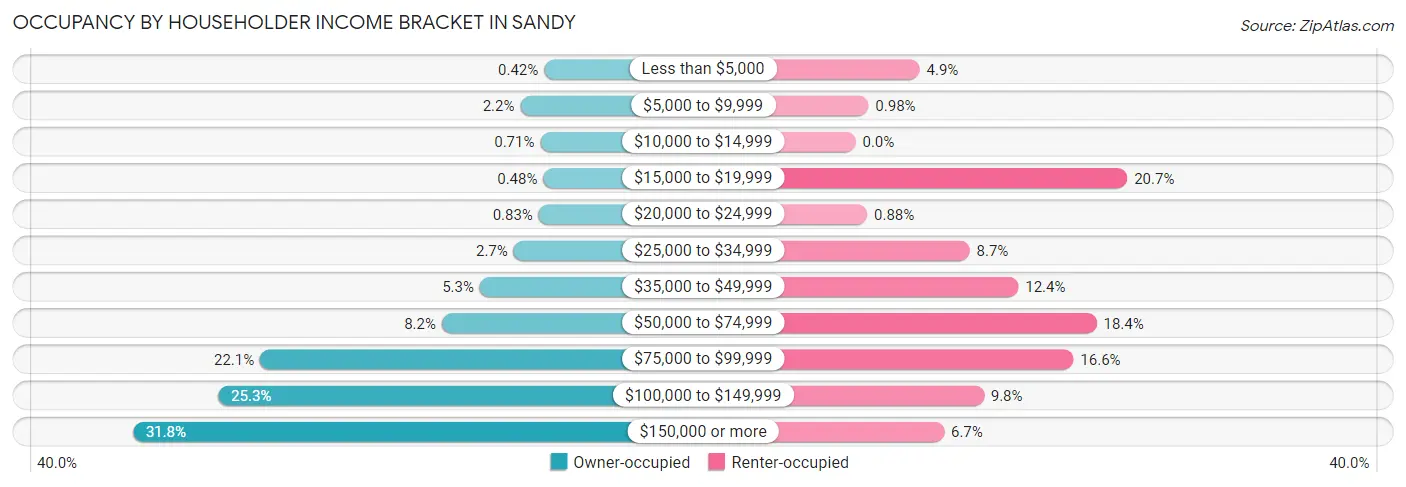
| Income Bracket | Owner-occupied | Renter-occupied |
| Less than $5,000 | 14 (0.4%) | 50 (4.9%) |
| $5,000 to $9,999 | 75 (2.2%) | 10 (1.0%) |
| $10,000 to $14,999 | 24 (0.7%) | 0 (0.0%) |
| $15,000 to $19,999 | 16 (0.5%) | 212 (20.7%) |
| $20,000 to $24,999 | 28 (0.8%) | 9 (0.9%) |
| $25,000 to $34,999 | 92 (2.7%) | 89 (8.7%) |
| $35,000 to $49,999 | 179 (5.3%) | 127 (12.4%) |
| $50,000 to $74,999 | 276 (8.2%) | 188 (18.4%) |
| $75,000 to $99,999 | 742 (22.1%) | 170 (16.6%) |
| $100,000 to $149,999 | 849 (25.3%) | 100 (9.8%) |
| $150,000 or more | 1,068 (31.8%) | 69 (6.7%) |
| Total | 3,363 (100.0%) | 1,024 (100.0%) |
Monthly Housing Cost Tiers in Sandy
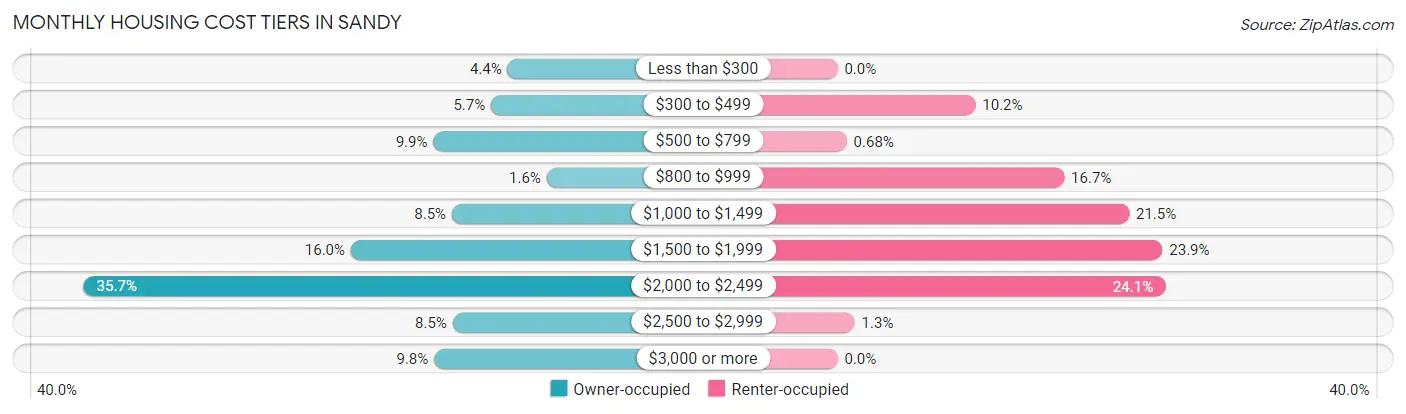
| Monthly Cost | Owner-occupied | Renter-occupied |
| Less than $300 | 149 (4.4%) | 0 (0.0%) |
| $300 to $499 | 190 (5.7%) | 104 (10.2%) |
| $500 to $799 | 333 (9.9%) | 7 (0.7%) |
| $800 to $999 | 52 (1.5%) | 171 (16.7%) |
| $1,000 to $1,499 | 287 (8.5%) | 220 (21.5%) |
| $1,500 to $1,999 | 537 (16.0%) | 245 (23.9%) |
| $2,000 to $2,499 | 1,199 (35.6%) | 247 (24.1%) |
| $2,500 to $2,999 | 285 (8.5%) | 13 (1.3%) |
| $3,000 or more | 331 (9.8%) | 0 (0.0%) |
| Total | 3,363 (100.0%) | 1,024 (100.0%) |
Physical Housing Characteristics in Sandy
Housing Structures in Sandy
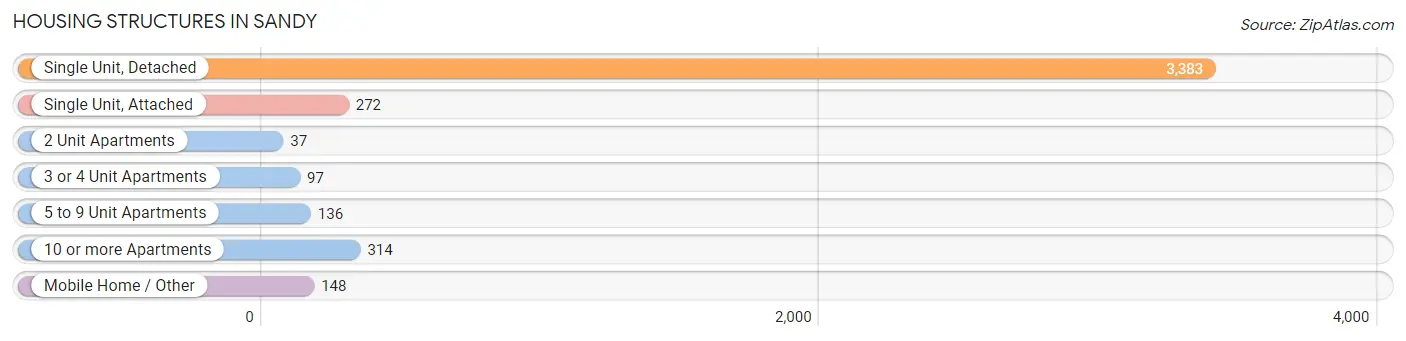
| Structure Type | # Housing Units | % Housing Units |
| Single Unit, Detached | 3,383 | 77.1% |
| Single Unit, Attached | 272 | 6.2% |
| 2 Unit Apartments | 37 | 0.8% |
| 3 or 4 Unit Apartments | 97 | 2.2% |
| 5 to 9 Unit Apartments | 136 | 3.1% |
| 10 or more Apartments | 314 | 7.2% |
| Mobile Home / Other | 148 | 3.4% |
| Total | 4,387 | 100.0% |
Housing Structures by Occupancy in Sandy
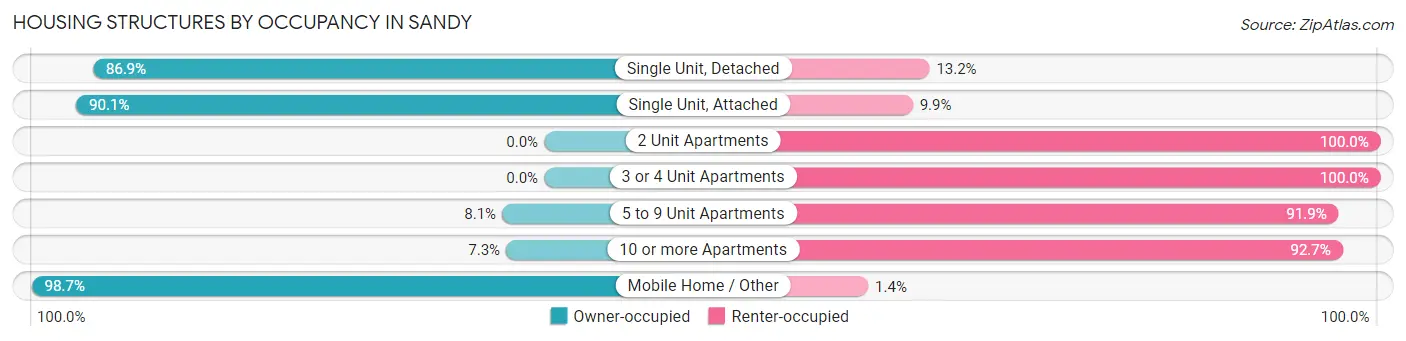
| Structure Type | Owner-occupied | Renter-occupied |
| Single Unit, Detached | 2,938 (86.9%) | 445 (13.2%) |
| Single Unit, Attached | 245 (90.1%) | 27 (9.9%) |
| 2 Unit Apartments | 0 (0.0%) | 37 (100.0%) |
| 3 or 4 Unit Apartments | 0 (0.0%) | 97 (100.0%) |
| 5 to 9 Unit Apartments | 11 (8.1%) | 125 (91.9%) |
| 10 or more Apartments | 23 (7.3%) | 291 (92.7%) |
| Mobile Home / Other | 146 (98.7%) | 2 (1.3%) |
| Total | 3,363 (76.7%) | 1,024 (23.3%) |
Housing Structures by Number of Rooms in Sandy
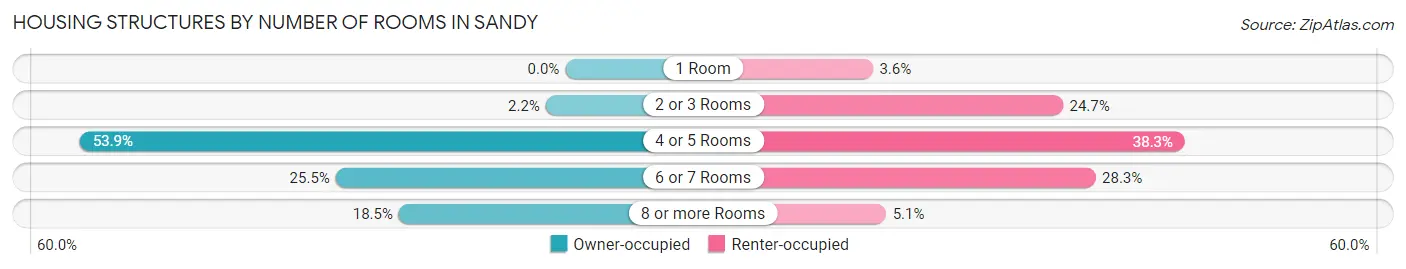
| Number of Rooms | Owner-occupied | Renter-occupied |
| 1 Room | 0 (0.0%) | 37 (3.6%) |
| 2 or 3 Rooms | 73 (2.2%) | 253 (24.7%) |
| 4 or 5 Rooms | 1,812 (53.9%) | 392 (38.3%) |
| 6 or 7 Rooms | 857 (25.5%) | 290 (28.3%) |
| 8 or more Rooms | 621 (18.5%) | 52 (5.1%) |
| Total | 3,363 (100.0%) | 1,024 (100.0%) |
Housing Structure by Heating Type in Sandy
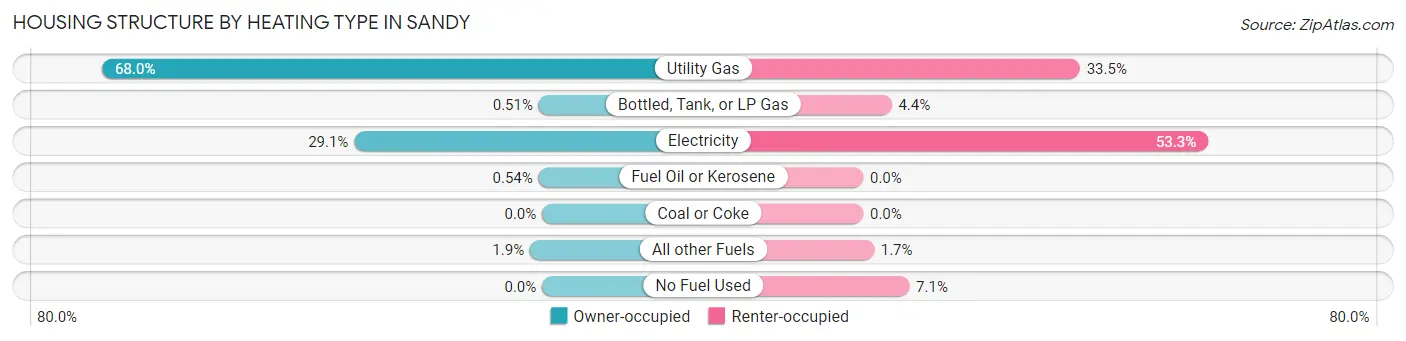
| Heating Type | Owner-occupied | Renter-occupied |
| Utility Gas | 2,288 (68.0%) | 343 (33.5%) |
| Bottled, Tank, or LP Gas | 17 (0.5%) | 45 (4.4%) |
| Electricity | 977 (29.0%) | 546 (53.3%) |
| Fuel Oil or Kerosene | 18 (0.5%) | 0 (0.0%) |
| Coal or Coke | 0 (0.0%) | 0 (0.0%) |
| All other Fuels | 63 (1.9%) | 17 (1.7%) |
| No Fuel Used | 0 (0.0%) | 73 (7.1%) |
| Total | 3,363 (100.0%) | 1,024 (100.0%) |
Household Vehicle Usage in Sandy
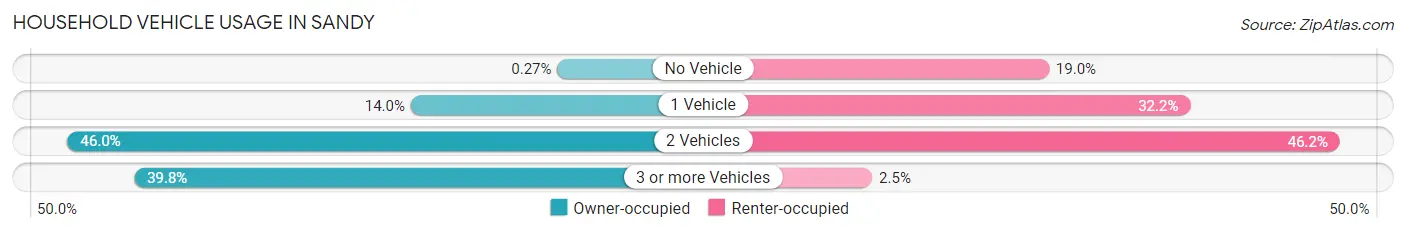
| Vehicles per Household | Owner-occupied | Renter-occupied |
| No Vehicle | 9 (0.3%) | 195 (19.0%) |
| 1 Vehicle | 469 (14.0%) | 330 (32.2%) |
| 2 Vehicles | 1,547 (46.0%) | 473 (46.2%) |
| 3 or more Vehicles | 1,338 (39.8%) | 26 (2.5%) |
| Total | 3,363 (100.0%) | 1,024 (100.0%) |
Real Estate & Mortgages in Sandy
Real Estate and Mortgage Overview in Sandy
| Characteristic | Without Mortgage | With Mortgage |
| Housing Units | 759 | 2,604 |
| Median Property Value | $395,000 | $440,500 |
| Median Household Income | $87,716 | $1,014 |
| Monthly Housing Costs | $545 | $331 |
| Real Estate Taxes | $3,296 | $191 |
Property Value by Mortgage Status in Sandy
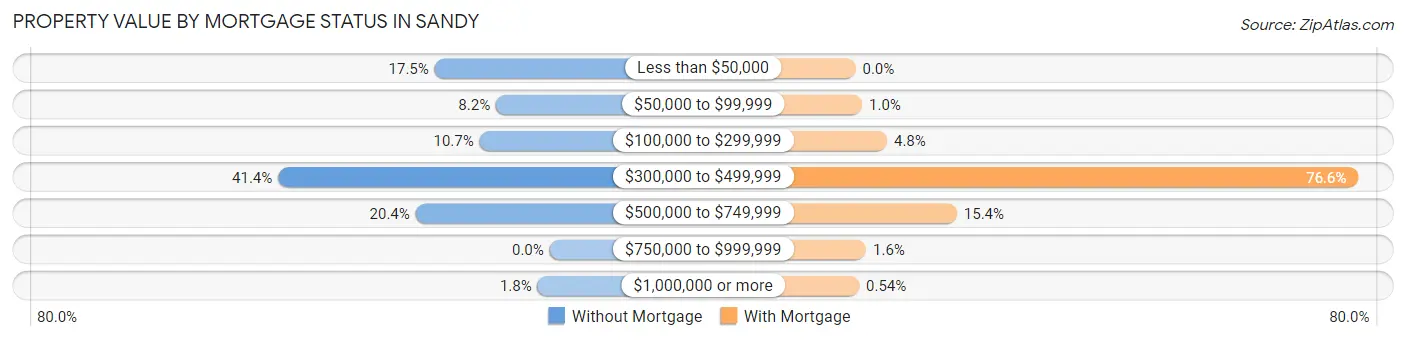
| Property Value | Without Mortgage | With Mortgage |
| Less than $50,000 | 133 (17.5%) | 0 (0.0%) |
| $50,000 to $99,999 | 62 (8.2%) | 26 (1.0%) |
| $100,000 to $299,999 | 81 (10.7%) | 125 (4.8%) |
| $300,000 to $499,999 | 314 (41.4%) | 1,995 (76.6%) |
| $500,000 to $749,999 | 155 (20.4%) | 402 (15.4%) |
| $750,000 to $999,999 | 0 (0.0%) | 42 (1.6%) |
| $1,000,000 or more | 14 (1.8%) | 14 (0.5%) |
| Total | 759 (100.0%) | 2,604 (100.0%) |
Household Income by Mortgage Status in Sandy
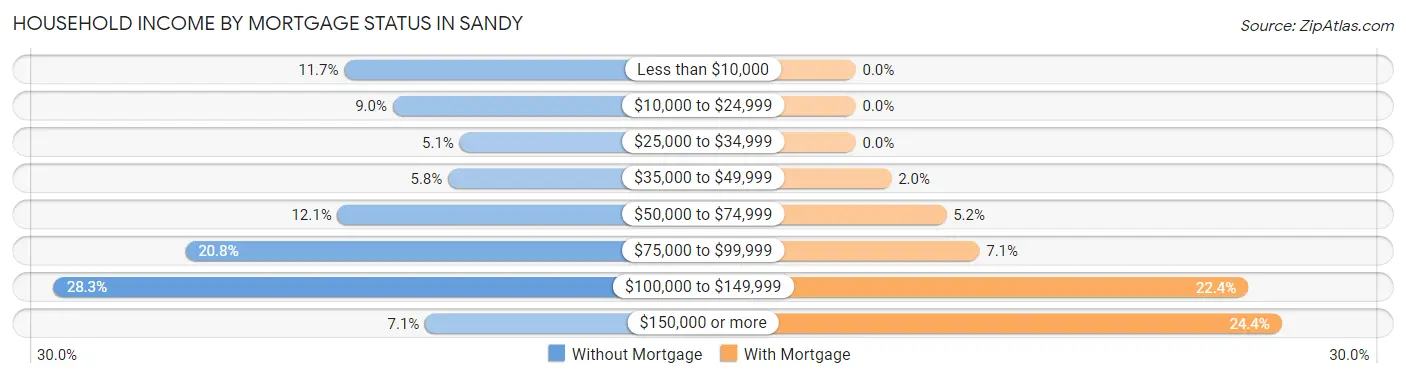
| Household Income | Without Mortgage | With Mortgage |
| Less than $10,000 | 89 (11.7%) | 0 (0.0%) |
| $10,000 to $24,999 | 68 (9.0%) | 0 (0.0%) |
| $25,000 to $34,999 | 39 (5.1%) | 0 (0.0%) |
| $35,000 to $49,999 | 44 (5.8%) | 53 (2.0%) |
| $50,000 to $74,999 | 92 (12.1%) | 135 (5.2%) |
| $75,000 to $99,999 | 158 (20.8%) | 184 (7.1%) |
| $100,000 to $149,999 | 215 (28.3%) | 584 (22.4%) |
| $150,000 or more | 54 (7.1%) | 634 (24.3%) |
| Total | 759 (100.0%) | 2,604 (100.0%) |
Property Value to Household Income Ratio in Sandy
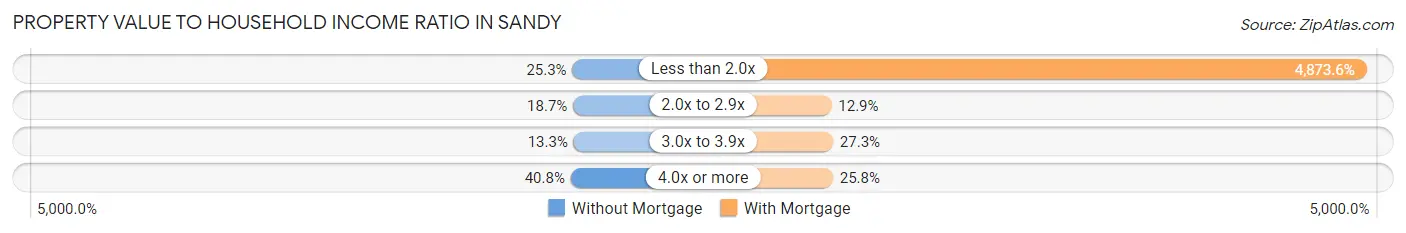
| Value-to-Income Ratio | Without Mortgage | With Mortgage |
| Less than 2.0x | 192 (25.3%) | 126,909 (4,873.6%) |
| 2.0x to 2.9x | 142 (18.7%) | 335 (12.9%) |
| 3.0x to 3.9x | 101 (13.3%) | 710 (27.3%) |
| 4.0x or more | 310 (40.8%) | 673 (25.8%) |
| Total | 759 (100.0%) | 2,604 (100.0%) |
Real Estate Taxes by Mortgage Status in Sandy
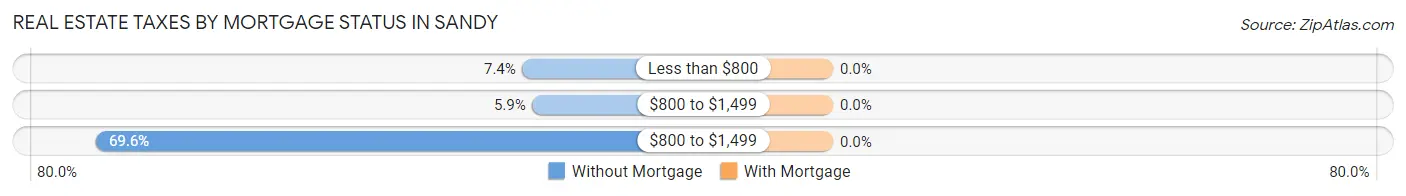
| Property Taxes | Without Mortgage | With Mortgage |
| Less than $800 | 56 (7.4%) | 0 (0.0%) |
| $800 to $1,499 | 45 (5.9%) | 0 (0.0%) |
| $800 to $1,499 | 528 (69.6%) | 0 (0.0%) |
| Total | 759 (100.0%) | 2,604 (100.0%) |
Health & Disability in Sandy
Health Insurance Coverage by Age in Sandy
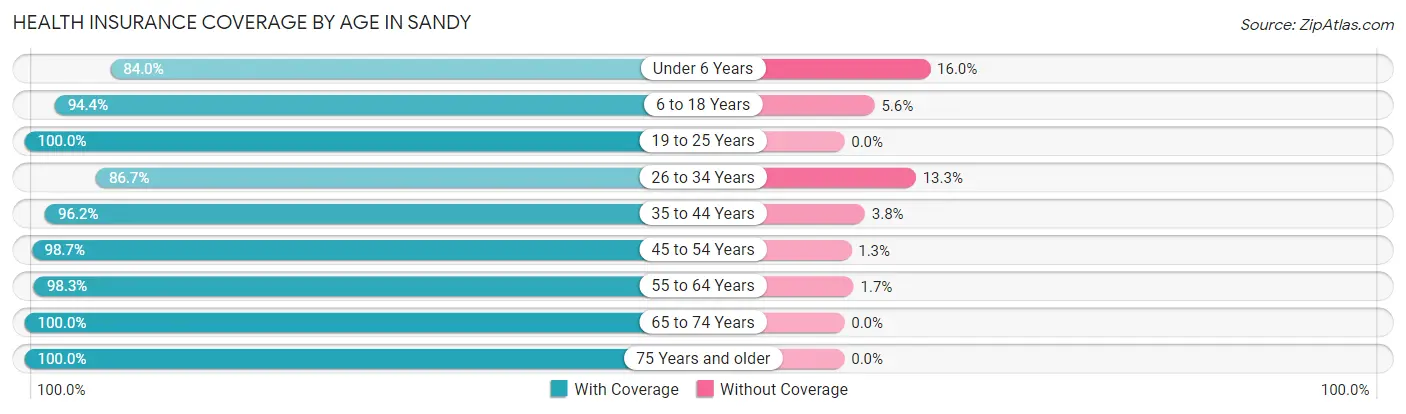
| Age Bracket | With Coverage | Without Coverage |
| Under 6 Years | 730 (84.0%) | 139 (16.0%) |
| 6 to 18 Years | 2,111 (94.4%) | 126 (5.6%) |
| 19 to 25 Years | 1,249 (100.0%) | 0 (0.0%) |
| 26 to 34 Years | 1,906 (86.7%) | 293 (13.3%) |
| 35 to 44 Years | 1,507 (96.2%) | 60 (3.8%) |
| 45 to 54 Years | 1,753 (98.7%) | 23 (1.3%) |
| 55 to 64 Years | 1,015 (98.3%) | 18 (1.7%) |
| 65 to 74 Years | 727 (100.0%) | 0 (0.0%) |
| 75 Years and older | 915 (100.0%) | 0 (0.0%) |
| Total | 11,913 (94.8%) | 659 (5.2%) |
Health Insurance Coverage by Citizenship Status in Sandy
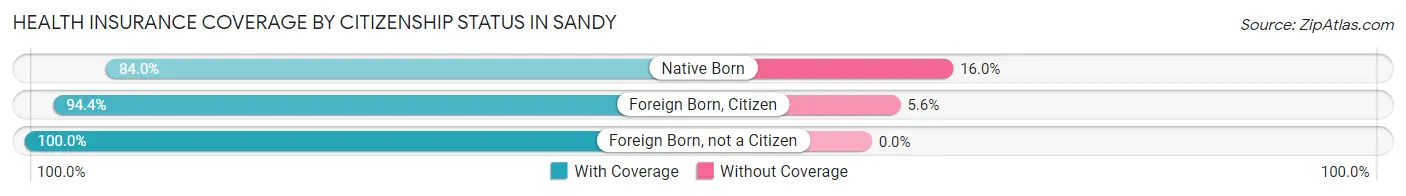
| Citizenship Status | With Coverage | Without Coverage |
| Native Born | 730 (84.0%) | 139 (16.0%) |
| Foreign Born, Citizen | 2,111 (94.4%) | 126 (5.6%) |
| Foreign Born, not a Citizen | 1,249 (100.0%) | 0 (0.0%) |
Health Insurance Coverage by Household Income in Sandy
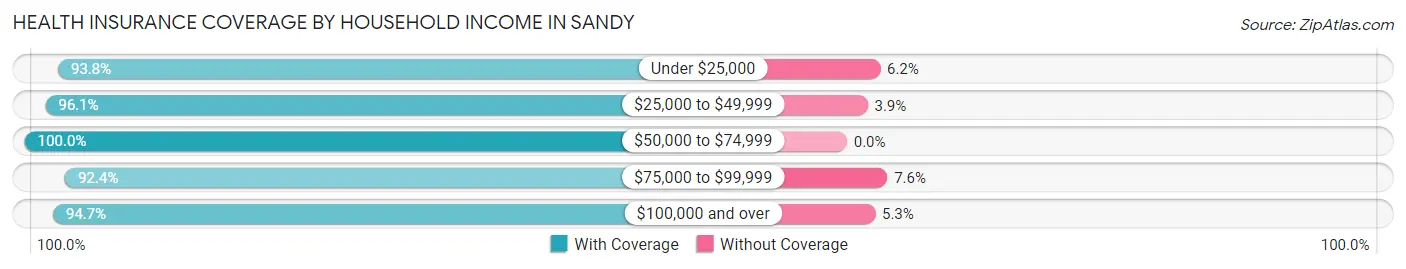
| Household Income | With Coverage | Without Coverage |
| Under $25,000 | 647 (93.8%) | 43 (6.2%) |
| $25,000 to $49,999 | 941 (96.1%) | 38 (3.9%) |
| $50,000 to $74,999 | 1,173 (100.0%) | 0 (0.0%) |
| $75,000 to $99,999 | 2,602 (92.4%) | 213 (7.6%) |
| $100,000 and over | 6,541 (94.7%) | 365 (5.3%) |
Public vs Private Health Insurance Coverage by Age in Sandy
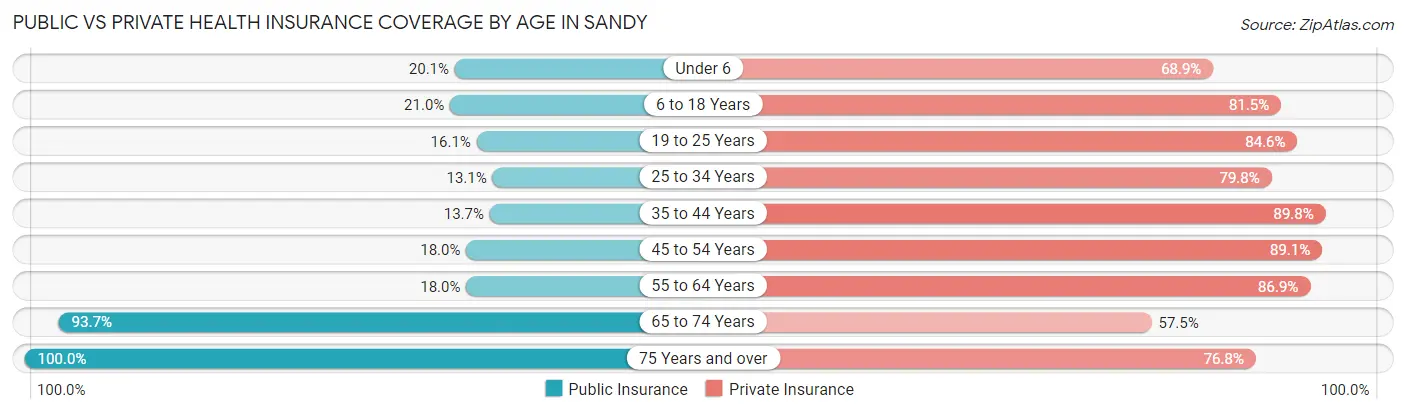
| Age Bracket | Public Insurance | Private Insurance |
| Under 6 | 175 (20.1%) | 599 (68.9%) |
| 6 to 18 Years | 470 (21.0%) | 1,824 (81.5%) |
| 19 to 25 Years | 201 (16.1%) | 1,056 (84.6%) |
| 25 to 34 Years | 289 (13.1%) | 1,754 (79.8%) |
| 35 to 44 Years | 214 (13.7%) | 1,407 (89.8%) |
| 45 to 54 Years | 320 (18.0%) | 1,583 (89.1%) |
| 55 to 64 Years | 186 (18.0%) | 898 (86.9%) |
| 65 to 74 Years | 681 (93.7%) | 418 (57.5%) |
| 75 Years and over | 915 (100.0%) | 703 (76.8%) |
| Total | 3,451 (27.5%) | 10,242 (81.5%) |
Disability Status by Sex by Age in Sandy
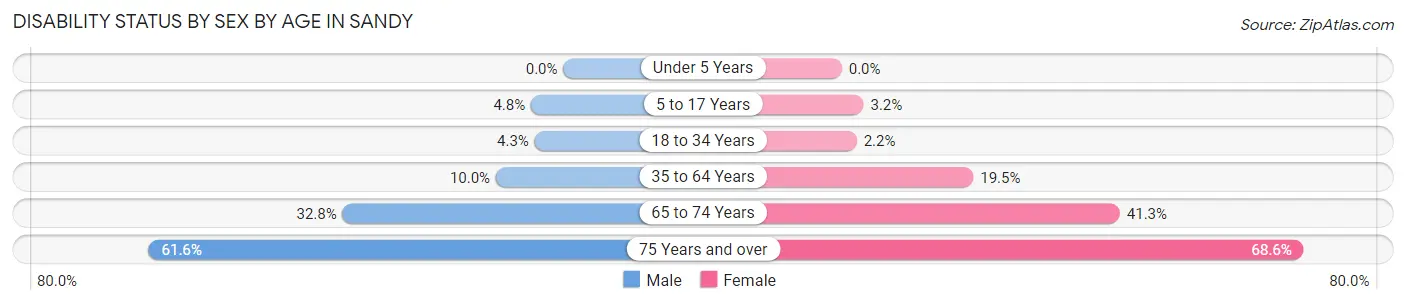
| Age Bracket | Male | Female |
| Under 5 Years | 0 (0.0%) | 0 (0.0%) |
| 5 to 17 Years | 60 (4.8%) | 29 (3.2%) |
| 18 to 34 Years | 79 (4.3%) | 39 (2.2%) |
| 35 to 64 Years | 209 (10.0%) | 447 (19.5%) |
| 65 to 74 Years | 101 (32.8%) | 173 (41.3%) |
| 75 Years and over | 242 (61.6%) | 358 (68.6%) |
Disability Class by Sex by Age in Sandy
Disability Class: Hearing Difficulty
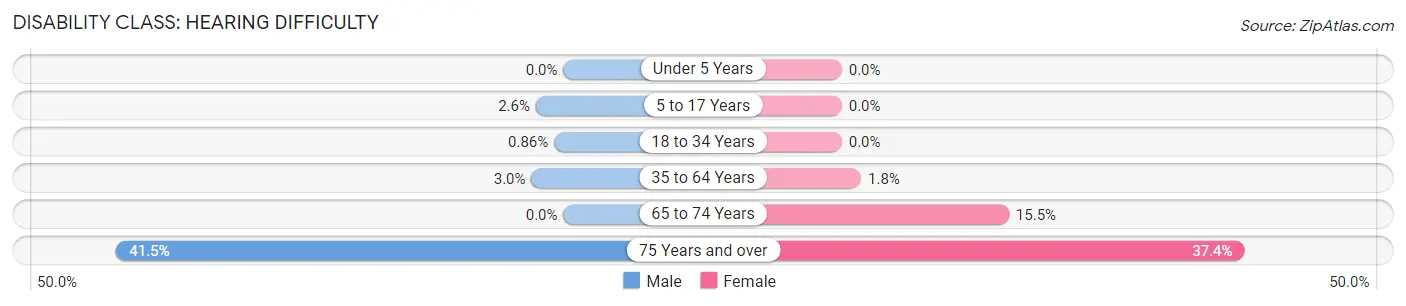
| Age Bracket | Male | Female |
| Under 5 Years | 0 (0.0%) | 0 (0.0%) |
| 5 to 17 Years | 32 (2.6%) | 0 (0.0%) |
| 18 to 34 Years | 16 (0.9%) | 0 (0.0%) |
| 35 to 64 Years | 62 (3.0%) | 41 (1.8%) |
| 65 to 74 Years | 0 (0.0%) | 65 (15.5%) |
| 75 Years and over | 163 (41.5%) | 195 (37.4%) |
Disability Class: Vision Difficulty
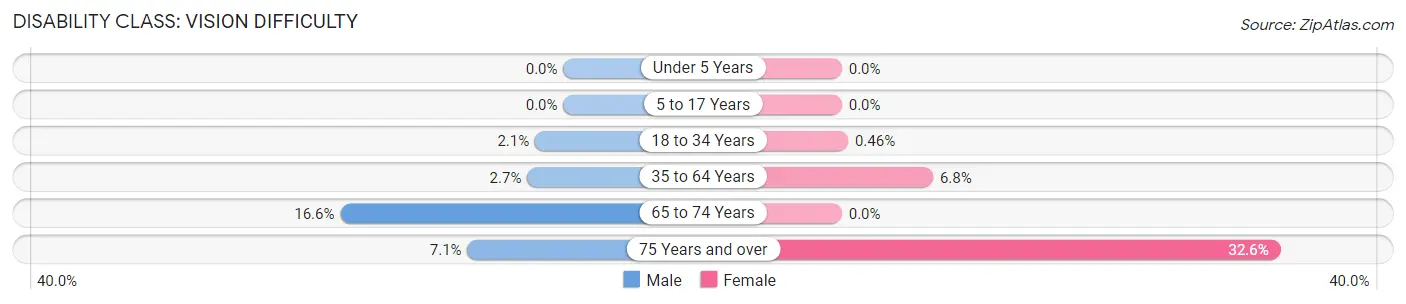
| Age Bracket | Male | Female |
| Under 5 Years | 0 (0.0%) | 0 (0.0%) |
| 5 to 17 Years | 0 (0.0%) | 0 (0.0%) |
| 18 to 34 Years | 39 (2.1%) | 8 (0.5%) |
| 35 to 64 Years | 56 (2.7%) | 155 (6.8%) |
| 65 to 74 Years | 51 (16.6%) | 0 (0.0%) |
| 75 Years and over | 28 (7.1%) | 170 (32.6%) |
Disability Class: Cognitive Difficulty
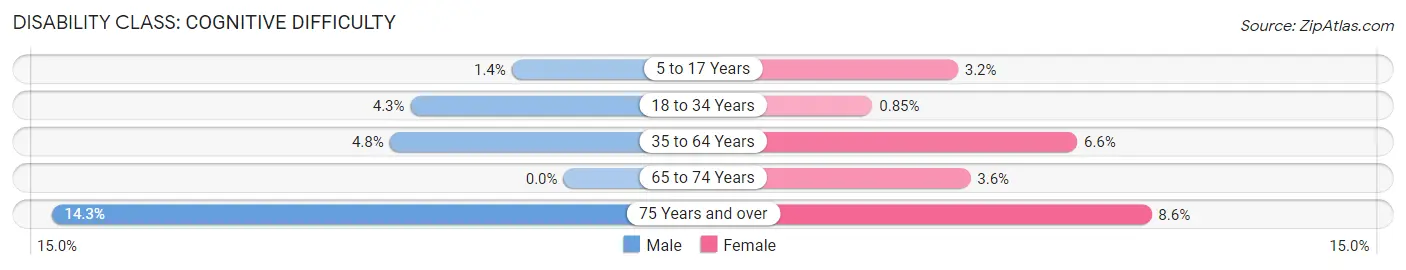
| Age Bracket | Male | Female |
| 5 to 17 Years | 18 (1.4%) | 29 (3.2%) |
| 18 to 34 Years | 79 (4.3%) | 15 (0.9%) |
| 35 to 64 Years | 101 (4.8%) | 150 (6.6%) |
| 65 to 74 Years | 0 (0.0%) | 15 (3.6%) |
| 75 Years and over | 56 (14.2%) | 45 (8.6%) |
Disability Class: Ambulatory Difficulty
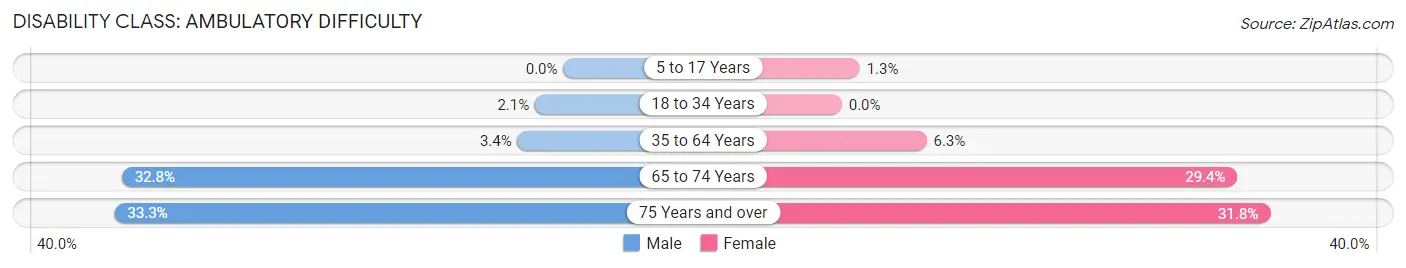
| Age Bracket | Male | Female |
| 5 to 17 Years | 0 (0.0%) | 12 (1.3%) |
| 18 to 34 Years | 39 (2.1%) | 0 (0.0%) |
| 35 to 64 Years | 71 (3.4%) | 144 (6.3%) |
| 65 to 74 Years | 101 (32.8%) | 123 (29.4%) |
| 75 Years and over | 131 (33.3%) | 166 (31.8%) |
Disability Class: Self-Care Difficulty
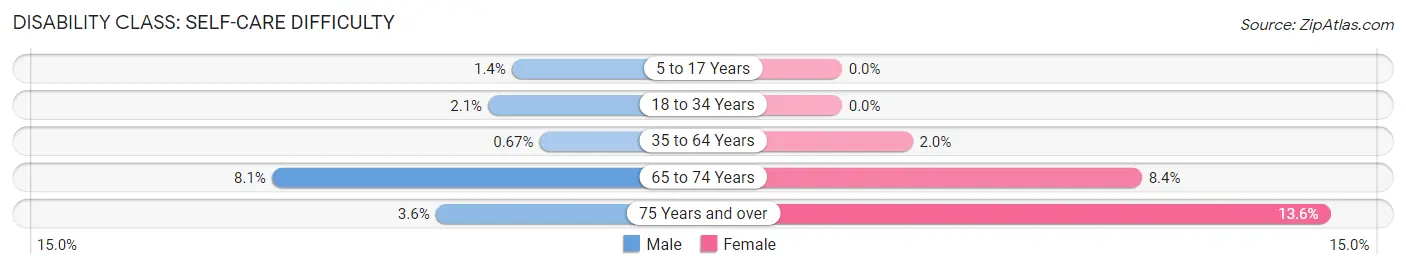
| Age Bracket | Male | Female |
| 5 to 17 Years | 18 (1.4%) | 0 (0.0%) |
| 18 to 34 Years | 39 (2.1%) | 0 (0.0%) |
| 35 to 64 Years | 14 (0.7%) | 45 (2.0%) |
| 65 to 74 Years | 25 (8.1%) | 35 (8.4%) |
| 75 Years and over | 14 (3.6%) | 71 (13.6%) |
Technology Access in Sandy
Computing Device Access in Sandy
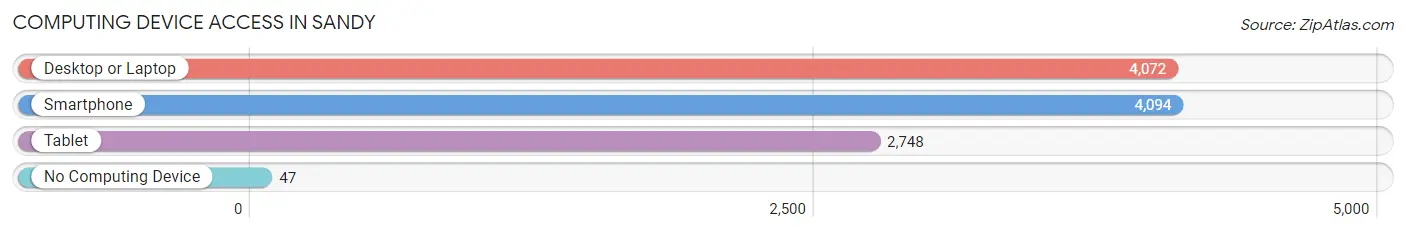
| Device Type | # Households | % Households |
| Desktop or Laptop | 4,072 | 92.8% |
| Smartphone | 4,094 | 93.3% |
| Tablet | 2,748 | 62.6% |
| No Computing Device | 47 | 1.1% |
| Total | 4,387 | 100.0% |
Internet Access in Sandy
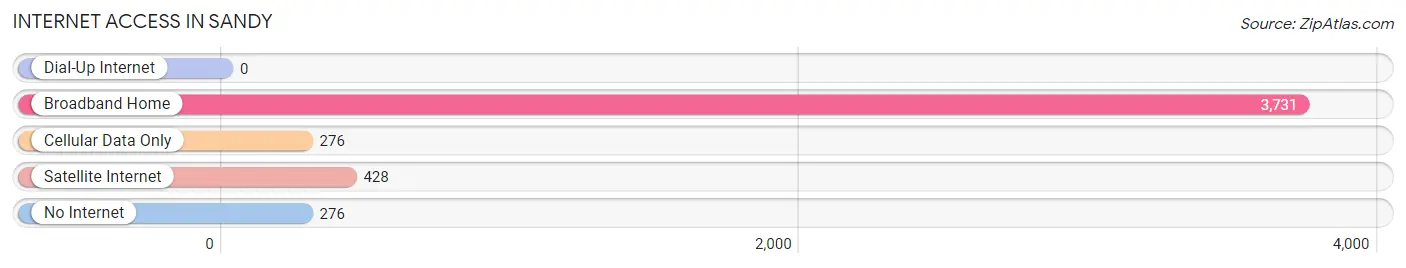
| Internet Type | # Households | % Households |
| Dial-Up Internet | 0 | 0.0% |
| Broadband Home | 3,731 | 85.1% |
| Cellular Data Only | 276 | 6.3% |
| Satellite Internet | 428 | 9.8% |
| No Internet | 276 | 6.3% |
| Total | 4,387 | 100.0% |
Sandy Summary
Sandy, Oregon is a small city located in Clackamas County, Oregon, United States. It is situated in the foothills of the Cascade Mountains, approximately 25 miles southeast of Portland. The city is home to a population of approximately 10,000 people, and is known for its rural atmosphere and outdoor recreation opportunities.
Geography
Sandy is located in the foothills of the Cascade Mountains, at an elevation of approximately 500 feet. The city is situated on the banks of the Sandy River, which flows through the city and is a popular destination for fishing and rafting. The city is surrounded by forests and mountains, and is home to several parks and trails. The city is also located near several ski resorts, including Mt. Hood Meadows and Timberline Lodge.
Climate
Sandy has a temperate climate, with warm summers and mild winters. The average high temperature in the summer is around 80 degrees Fahrenheit, and the average low temperature in the winter is around 30 degrees Fahrenheit. The city receives an average of 40 inches of precipitation per year, with most of it falling in the winter months.
Economy
Sandy’s economy is largely based on tourism and outdoor recreation. The city is home to several ski resorts, as well as numerous parks and trails. The city is also home to several businesses, including restaurants, retail stores, and professional services.
Demographics
As of the 2010 census, the population of Sandy was 10,068. The racial makeup of the city was 91.3% White, 1.2% African American, 0.7% Native American, 1.3% Asian, 0.2% Pacific Islander, 2.2% from other races, and 3.3% from two or more races. Hispanic or Latino of any race were 5.3% of the population.
The median household income in Sandy was $50,945, and the median family income was $60,945. The per capita income for the city was $25,945. About 8.3% of families and 11.2% of the population were below the poverty line, including 15.2% of those under age 18 and 6.2% of those age 65 or over.
Conclusion
Sandy, Oregon is a small city located in Clackamas County, Oregon, United States. It is situated in the foothills of the Cascade Mountains, approximately 25 miles southeast of Portland. The city is home to a population of approximately 10,000 people, and is known for its rural atmosphere and outdoor recreation opportunities. The city’s economy is largely based on tourism and outdoor recreation, and the city is home to several ski resorts, as well as numerous parks and trails. The racial makeup of the city is predominantly White, with a small percentage of African American, Native American, Asian, and Pacific Islander residents. The median household income in Sandy is $50,945, and the per capita income for the city is $25,945.
Common Questions
What is Per Capita Income in Sandy?
Per Capita income in Sandy is $40,271.
What is the Median Family Income in Sandy?
Median Family Income in Sandy is $107,654.
What is the Median Household income in Sandy?
Median Household Income in Sandy is $98,341.
What is Income or Wage Gap in Sandy?
Income or Wage Gap in Sandy is 27.4%.
Women in Sandy earn 72.6 cents for every dollar earned by a man.
What is Family Income Deficit in Sandy?
Family Income Deficit in Sandy is $7,463.
Families that are below poverty line in Sandy earn $7,463 less on average than the poverty threshold level.
What is Inequality or Gini Index in Sandy?
Inequality or Gini Index in Sandy is 0.35.
What is the Total Population of Sandy?
Total Population of Sandy is 12,592.
What is the Total Male Population of Sandy?
Total Male Population of Sandy is 6,403.
What is the Total Female Population of Sandy?
Total Female Population of Sandy is 6,189.
What is the Ratio of Males per 100 Females in Sandy?
There are 103.46 Males per 100 Females in Sandy.
What is the Ratio of Females per 100 Males in Sandy?
There are 96.66 Females per 100 Males in Sandy.
What is the Median Population Age in Sandy?
Median Population Age in Sandy is 34.5 Years.
What is the Average Family Size in Sandy
Average Family Size in Sandy is 3.2 People.
What is the Average Household Size in Sandy
Average Household Size in Sandy is 2.9 People.
How Large is the Labor Force in Sandy?
There are 6,791 People in the Labor Forcein in Sandy.
What is the Percentage of People in the Labor Force in Sandy?
67.4% of People are in the Labor Force in Sandy.
What is the Unemployment Rate in Sandy?
Unemployment Rate in Sandy is 4.8%.