Monument, OR Map & Demographics
Monument Map
Monument Overview
$35,173
PER CAPITA INCOME
$36,675
AVG HOUSEHOLD INCOME
0.27
INEQUALITY / GINI INDEX
154
TOTAL POPULATION
72
MALE POPULATION
82
FEMALE POPULATION
87.80
MALES / 100 FEMALES
113.89
FEMALES / 100 MALES
66.4
MEDIAN AGE
2.0
AVG FAMILY SIZE
1.2
AVG HOUSEHOLD SIZE
66
LABOR FORCE [ PEOPLE ]
44.9%
PERCENT IN LABOR FORCE
7.6%
UNEMPLOYMENT RATE
Monument Zip Codes
Monument Area Codes
Income in Monument
Income Overview in Monument
| Characteristic | Number | Measure |
| Per Capita Income | 154 | $35,173 |
| Median Family Income | 20 | $0 |
| Mean Family Income | 20 | $50,775 |
| Median Household Income | 129 | $36,675 |
| Mean Household Income | 129 | $42,650 |
| Income Deficit | 20 | $0 |
| Wage / Income Gap (%) | 154 | 0.00% |
| Wage / Income Gap ($) | 154 | 100.00¢ per $1 |
| Gini / Inequality Index | 154 | 0.27 |
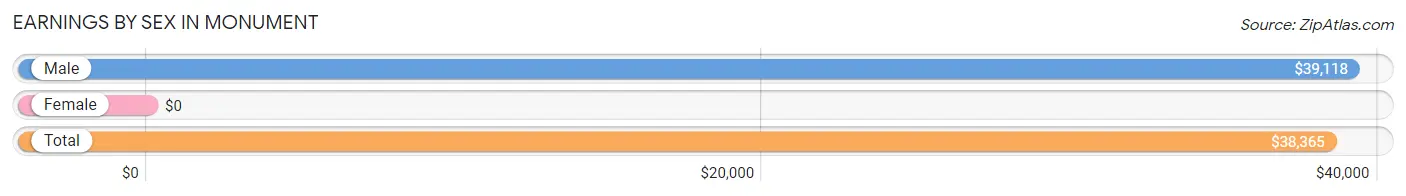
Earnings by Sex in Monument
| Sex | Number | Average Earnings |
| Male | 44 (66.7%) | $39,118 |
| Female | 22 (33.3%) | $0 |
| Total | 66 (100.0%) | $38,365 |
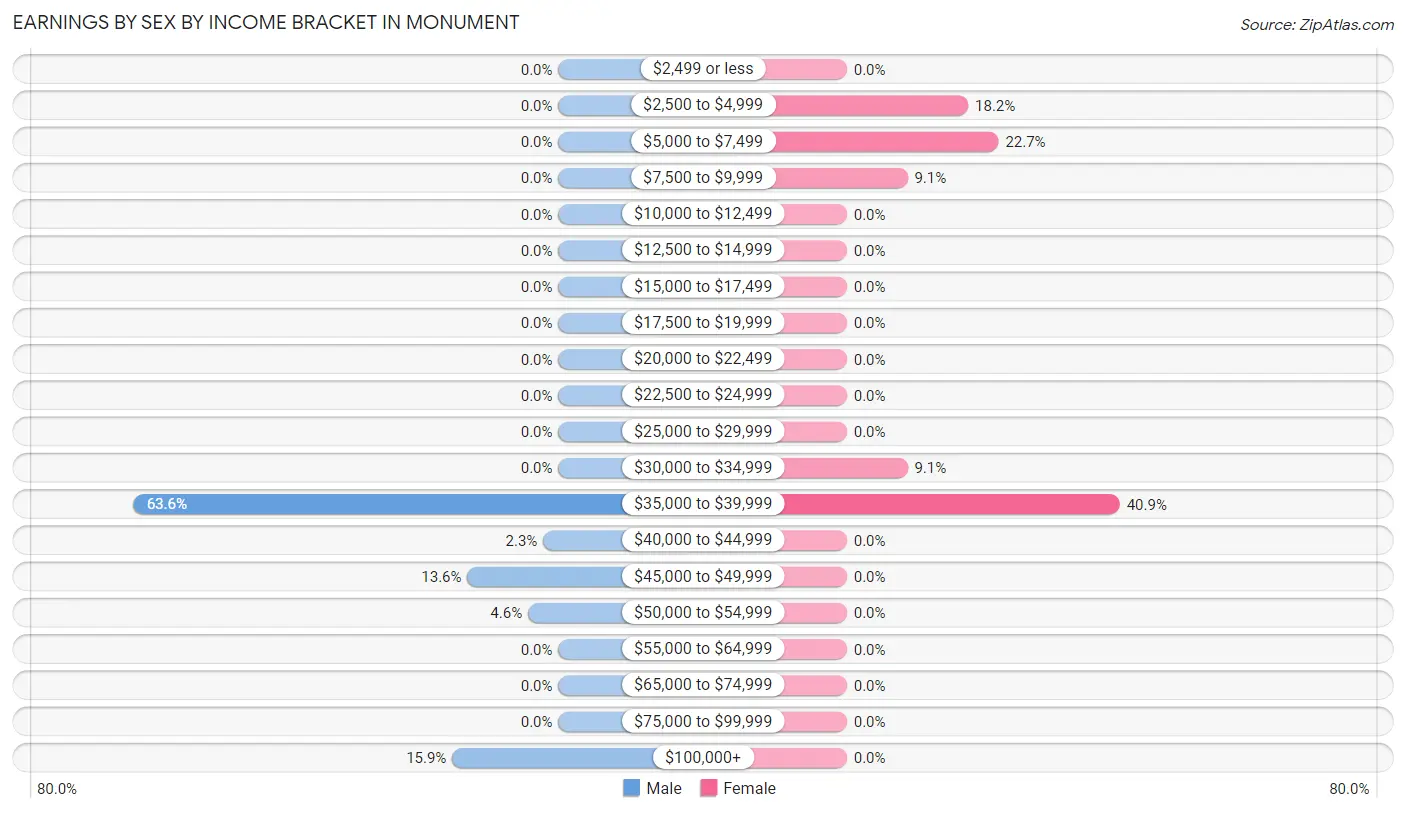
Earnings by Sex by Income Bracket in Monument
The most common earnings brackets in Monument are $35,000 to $39,999 for men (28 | 63.6%) and $35,000 to $39,999 for women (9 | 40.9%).
| Income | Male | Female |
| $2,499 or less | 0 (0.0%) | 0 (0.0%) |
| $2,500 to $4,999 | 0 (0.0%) | 4 (18.2%) |
| $5,000 to $7,499 | 0 (0.0%) | 5 (22.7%) |
| $7,500 to $9,999 | 0 (0.0%) | 2 (9.1%) |
| $10,000 to $12,499 | 0 (0.0%) | 0 (0.0%) |
| $12,500 to $14,999 | 0 (0.0%) | 0 (0.0%) |
| $15,000 to $17,499 | 0 (0.0%) | 0 (0.0%) |
| $17,500 to $19,999 | 0 (0.0%) | 0 (0.0%) |
| $20,000 to $22,499 | 0 (0.0%) | 0 (0.0%) |
| $22,500 to $24,999 | 0 (0.0%) | 0 (0.0%) |
| $25,000 to $29,999 | 0 (0.0%) | 0 (0.0%) |
| $30,000 to $34,999 | 0 (0.0%) | 2 (9.1%) |
| $35,000 to $39,999 | 28 (63.6%) | 9 (40.9%) |
| $40,000 to $44,999 | 1 (2.3%) | 0 (0.0%) |
| $45,000 to $49,999 | 6 (13.6%) | 0 (0.0%) |
| $50,000 to $54,999 | 2 (4.5%) | 0 (0.0%) |
| $55,000 to $64,999 | 0 (0.0%) | 0 (0.0%) |
| $65,000 to $74,999 | 0 (0.0%) | 0 (0.0%) |
| $75,000 to $99,999 | 0 (0.0%) | 0 (0.0%) |
| $100,000+ | 7 (15.9%) | 0 (0.0%) |
| Total | 44 (100.0%) | 22 (100.0%) |
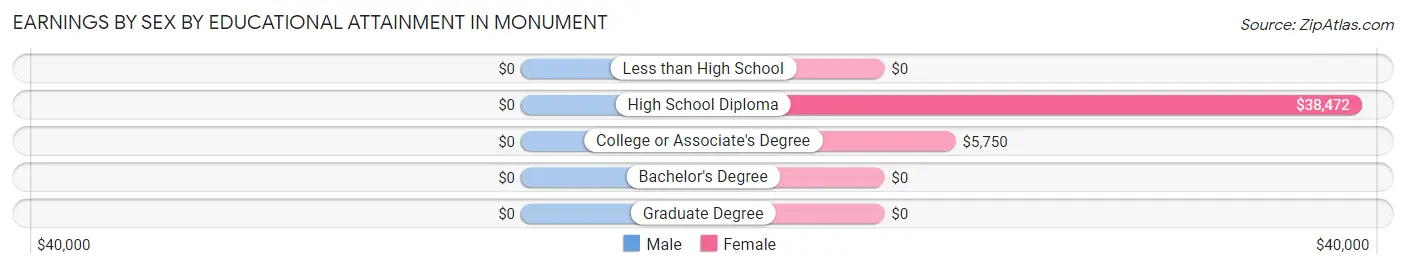
Earnings by Sex by Educational Attainment in Monument
| Educational Attainment | Male Income | Female Income |
| Less than High School | - | - |
| High School Diploma | - | - |
| College or Associate's Degree | - | - |
| Bachelor's Degree | - | - |
| Graduate Degree | - | - |
| Total | $38,603 | $0 |
Family Income in Monument
Family Income Brackets in Monument
According to the Monument family income data, there are 8 families falling into the $25,000 to $34,999 income range, which is the most common income bracket and makes up 40.0% of all families.
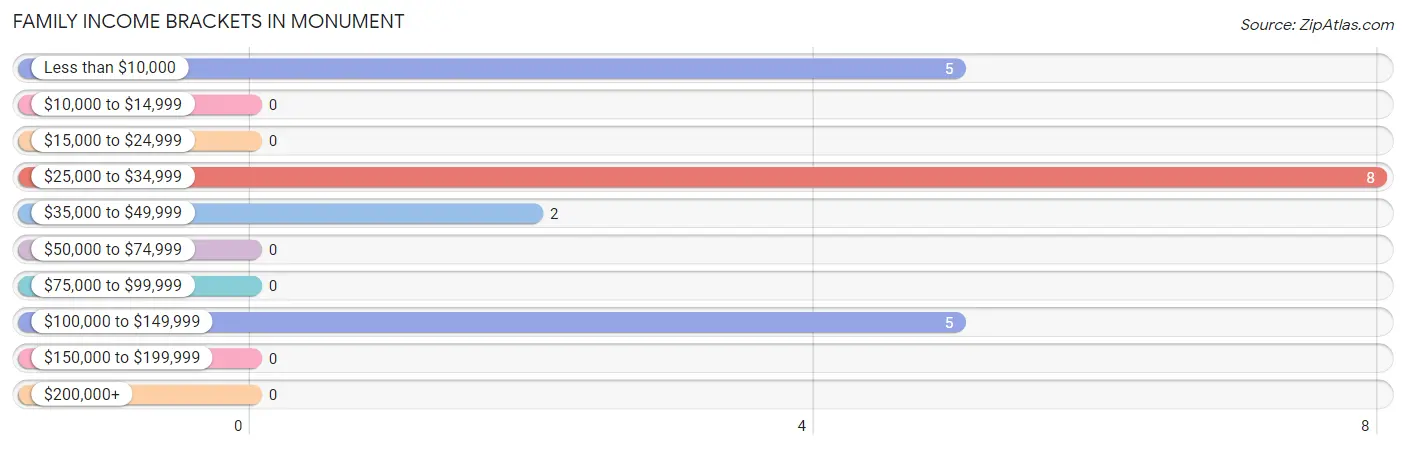
| Income Bracket | # Families | % Families |
| Less than $10,000 | 5 | 25.0% |
| $10,000 to $14,999 | 0 | 0.0% |
| $15,000 to $24,999 | 0 | 0.0% |
| $25,000 to $34,999 | 8 | 40.0% |
| $35,000 to $49,999 | 2 | 10.0% |
| $50,000 to $74,999 | 0 | 0.0% |
| $75,000 to $99,999 | 0 | 0.0% |
| $100,000 to $149,999 | 5 | 25.0% |
| $150,000 to $199,999 | 0 | 0.0% |
| $200,000+ | 0 | 0.0% |
Family Income by Famaliy Size in Monument
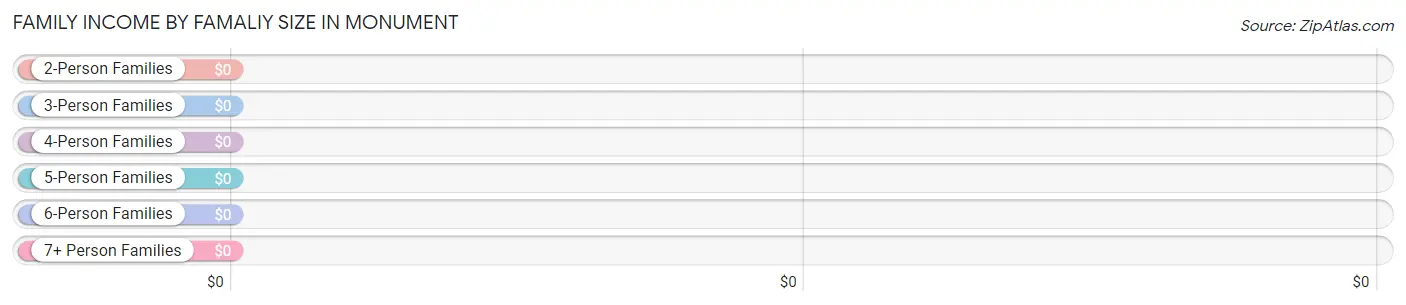
| Income Bracket | # Families | Median Income |
| 2-Person Families | 15 (75.0%) | $0 |
| 3-Person Families | 5 (25.0%) | $0 |
| 4-Person Families | 0 (0.0%) | $0 |
| 5-Person Families | 0 (0.0%) | $0 |
| 6-Person Families | 0 (0.0%) | $0 |
| 7+ Person Families | 0 (0.0%) | $0 |
| Total | 20 (100.0%) | $0 |
Family Income by Number of Earners in Monument
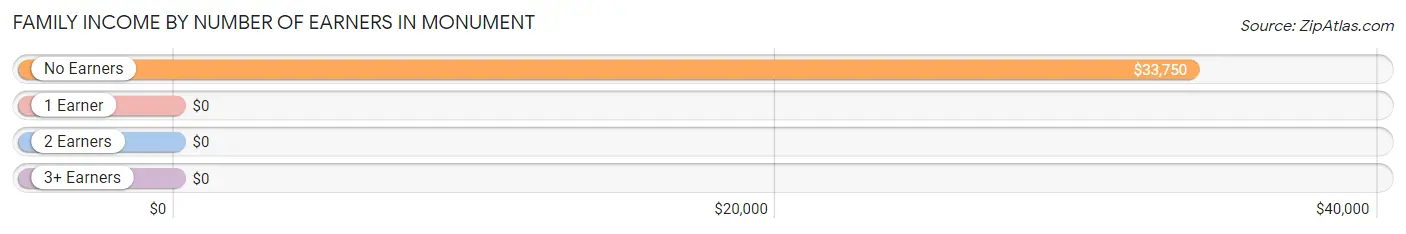
| Number of Earners | # Families | Median Income |
| No Earners | 10 (50.0%) | $33,750 |
| 1 Earner | 5 (25.0%) | $0 |
| 2 Earners | 5 (25.0%) | $0 |
| 3+ Earners | 0 (0.0%) | $0 |
| Total | 20 (100.0%) | $0 |
Household Income in Monument
Household Income Brackets in Monument
With 89 households falling in the category, the $35,000 to $49,999 income range is the most frequent in Monument, accounting for 69.0% of all households.
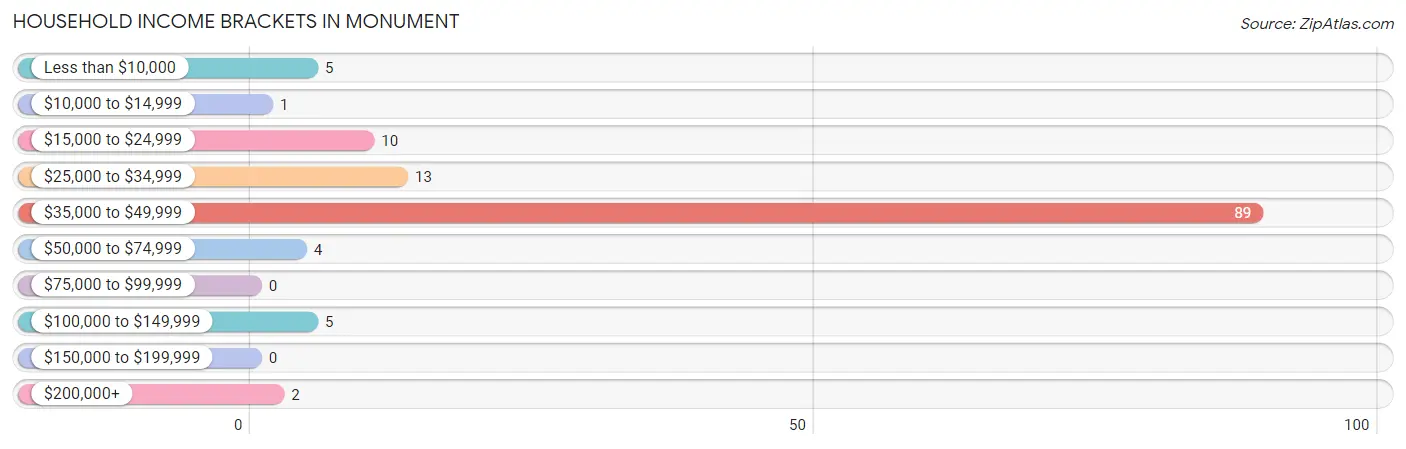
| Income Bracket | # Households | % Households |
| Less than $10,000 | 5 | 3.9% |
| $10,000 to $14,999 | 1 | 0.8% |
| $15,000 to $24,999 | 10 | 7.8% |
| $25,000 to $34,999 | 13 | 10.1% |
| $35,000 to $49,999 | 89 | 69.0% |
| $50,000 to $74,999 | 4 | 3.1% |
| $75,000 to $99,999 | 0 | 0.0% |
| $100,000 to $149,999 | 5 | 3.9% |
| $150,000 to $199,999 | 0 | 0.0% |
| $200,000+ | 2 | 1.6% |
Household Income by Householder Age in Monument
The median household income in Monument is $36,675, with the highest median household income of $39,861 found in the 45 to 64 years age bracket for the primary householder. A total of 49 households (38.0%) fall into this category. Meanwhile, the 15 to 24 years age bracket for the primary householder has the lowest median household income of $0, with 7 households (5.4%) in this group.
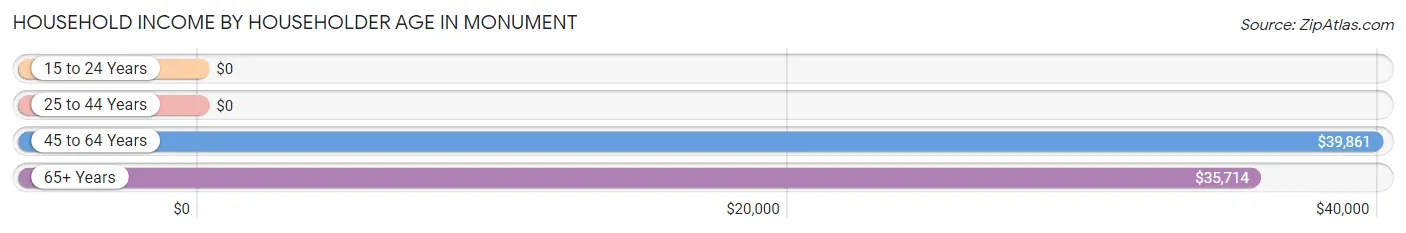
| Income Bracket | # Households | Median Income |
| 15 to 24 Years | 7 (5.4%) | $0 |
| 25 to 44 Years | 3 (2.3%) | $0 |
| 45 to 64 Years | 49 (38.0%) | $39,861 |
| 65+ Years | 70 (54.3%) | $35,714 |
| Total | 129 (100.0%) | $36,675 |
Poverty in Monument
Income Below Poverty by Sex and Age in Monument
With 12.5% poverty level for males and 11.0% for females among the residents of Monument, 6 to 11 year old males and 45 to 54 year old females are the most vulnerable to poverty, with 7 males (100.0%) and 7 females (43.8%) in their respective age groups living below the poverty level.
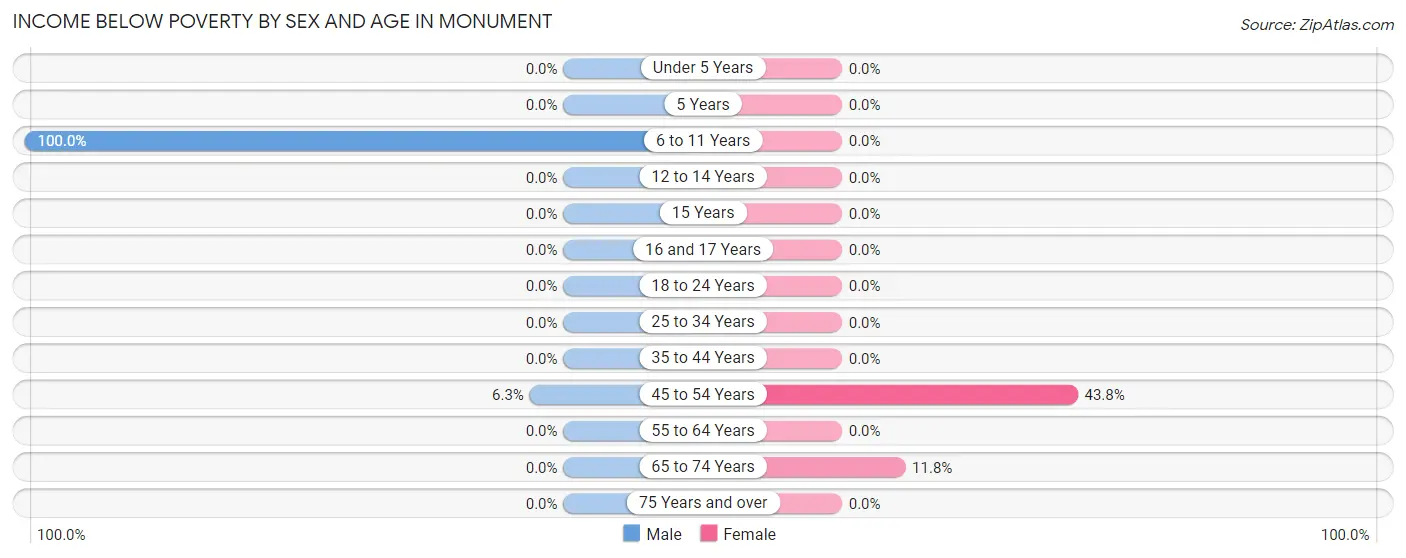
| Age Bracket | Male | Female |
| Under 5 Years | 0 (0.0%) | 0 (0.0%) |
| 5 Years | 0 (0.0%) | 0 (0.0%) |
| 6 to 11 Years | 7 (100.0%) | 0 (0.0%) |
| 12 to 14 Years | 0 (0.0%) | 0 (0.0%) |
| 15 Years | 0 (0.0%) | 0 (0.0%) |
| 16 and 17 Years | 0 (0.0%) | 0 (0.0%) |
| 18 to 24 Years | 0 (0.0%) | 0 (0.0%) |
| 25 to 34 Years | 0 (0.0%) | 0 (0.0%) |
| 35 to 44 Years | 0 (0.0%) | 0 (0.0%) |
| 45 to 54 Years | 2 (6.2%) | 7 (43.8%) |
| 55 to 64 Years | 0 (0.0%) | 0 (0.0%) |
| 65 to 74 Years | 0 (0.0%) | 2 (11.8%) |
| 75 Years and over | 0 (0.0%) | 0 (0.0%) |
| Total | 9 (12.5%) | 9 (11.0%) |
Income Above Poverty by Sex and Age in Monument
According to the poverty statistics in Monument, males aged 18 to 24 years and females aged 25 to 34 years are the age groups that are most secure financially, with 100.0% of males and 100.0% of females in these age groups living above the poverty line.
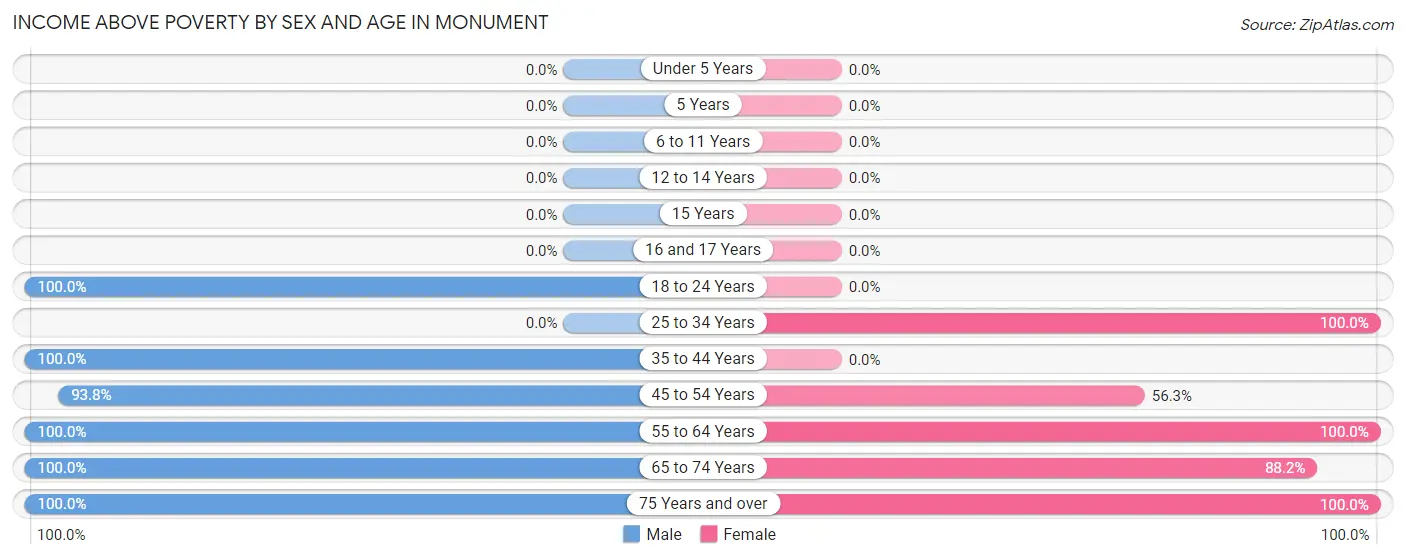
| Age Bracket | Male | Female |
| Under 5 Years | 0 (0.0%) | 0 (0.0%) |
| 5 Years | 0 (0.0%) | 0 (0.0%) |
| 6 to 11 Years | 0 (0.0%) | 0 (0.0%) |
| 12 to 14 Years | 0 (0.0%) | 0 (0.0%) |
| 15 Years | 0 (0.0%) | 0 (0.0%) |
| 16 and 17 Years | 0 (0.0%) | 0 (0.0%) |
| 18 to 24 Years | 7 (100.0%) | 0 (0.0%) |
| 25 to 34 Years | 0 (0.0%) | 1 (100.0%) |
| 35 to 44 Years | 2 (100.0%) | 0 (0.0%) |
| 45 to 54 Years | 30 (93.8%) | 9 (56.2%) |
| 55 to 64 Years | 5 (100.0%) | 4 (100.0%) |
| 65 to 74 Years | 9 (100.0%) | 15 (88.2%) |
| 75 Years and over | 10 (100.0%) | 44 (100.0%) |
| Total | 63 (87.5%) | 73 (89.0%) |
Income Below Poverty Among Married-Couple Families in Monument
The poverty statistics for married-couple families in Monument show that 25.0% or 5 of the total 20 families live below the poverty line. Families with 1 or 2 children have the highest poverty rate of 100.0%, comprising of 5 families. On the other hand, families with no children have the lowest poverty rate of 0.0%, which includes 0 families.
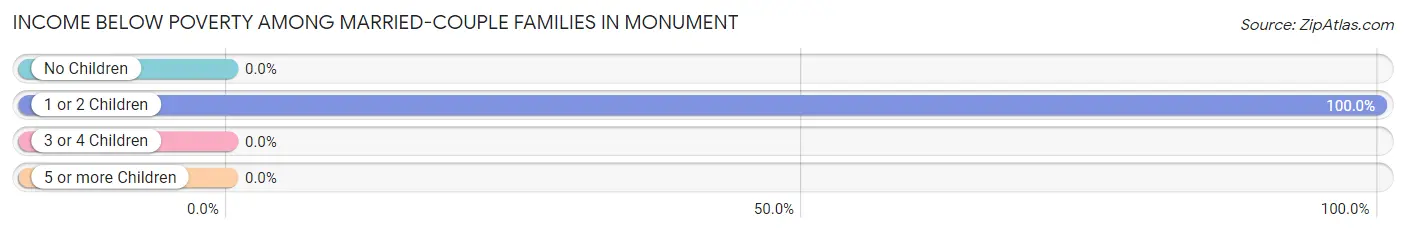
| Children | Above Poverty | Below Poverty |
| No Children | 15 (100.0%) | 0 (0.0%) |
| 1 or 2 Children | 0 (0.0%) | 5 (100.0%) |
| 3 or 4 Children | 0 (0.0%) | 0 (0.0%) |
| 5 or more Children | 0 (0.0%) | 0 (0.0%) |
| Total | 15 (75.0%) | 5 (25.0%) |
Income Below Poverty Among Single-Parent Households in Monument
| Children | Single Father | Single Mother |
| No Children | 0 (0.0%) | 0 (0.0%) |
| 1 or 2 Children | 0 (0.0%) | 0 (0.0%) |
| 3 or 4 Children | 0 (0.0%) | 0 (0.0%) |
| 5 or more Children | 0 (0.0%) | 0 (0.0%) |
| Total | 0 (0.0%) | 0 (0.0%) |
Income Below Poverty Among Married-Couple vs Single-Parent Households in Monument

| Children | Married-Couple Families | Single-Parent Households |
| No Children | 0 (0.0%) | 0 (0.0%) |
| 1 or 2 Children | 5 (100.0%) | 0 (0.0%) |
| 3 or 4 Children | 0 (0.0%) | 0 (0.0%) |
| 5 or more Children | 0 (0.0%) | 0 (0.0%) |
| Total | 5 (25.0%) | 0 (0.0%) |
Race in Monument
The most populous races in Monument are White / Caucasian (109 | 70.8%), Hispanic or Latino (59 | 38.3%), and Two or more Races (43 | 27.9%).
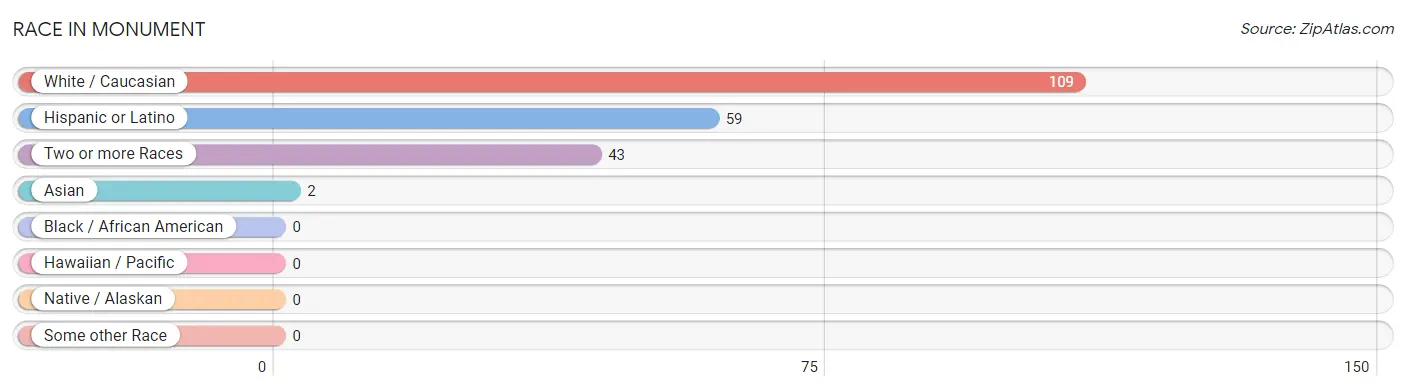
| Race | # Population | % Population |
| Asian | 2 | 1.3% |
| Black / African American | 0 | 0.0% |
| Hawaiian / Pacific | 0 | 0.0% |
| Hispanic or Latino | 59 | 38.3% |
| Native / Alaskan | 0 | 0.0% |
| White / Caucasian | 109 | 70.8% |
| Two or more Races | 43 | 27.9% |
| Some other Race | 0 | 0.0% |
| Total | 154 | 100.0% |
Ancestry in Monument
The most populous ancestries reported in Monument are Spanish (42 | 27.3%), German (40 | 26.0%), English (25 | 16.2%), Mexican (17 | 11.0%), and Irish (13 | 8.4%), together accounting for 88.9% of all Monument residents.
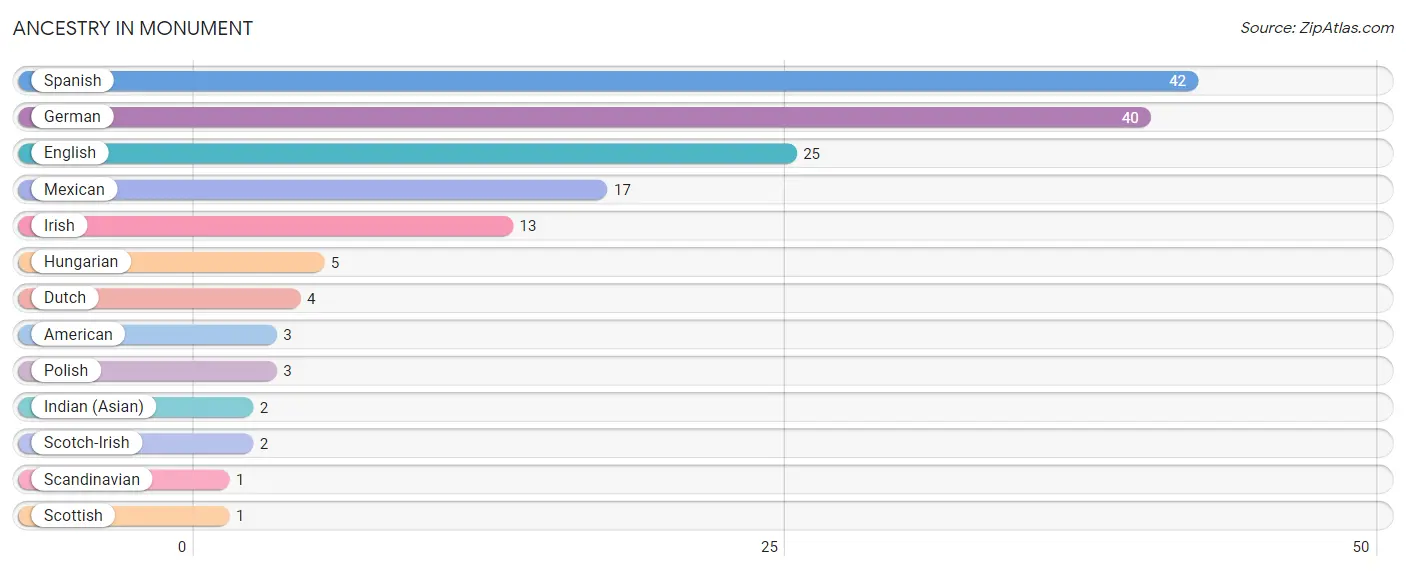
| Ancestry | # Population | % Population |
| American | 3 | 1.9% |
| Dutch | 4 | 2.6% |
| English | 25 | 16.2% |
| German | 40 | 26.0% |
| Hungarian | 5 | 3.3% |
| Indian (Asian) | 2 | 1.3% |
| Irish | 13 | 8.4% |
| Mexican | 17 | 11.0% |
| Polish | 3 | 1.9% |
| Scandinavian | 1 | 0.6% |
| Scotch-Irish | 2 | 1.3% |
| Scottish | 1 | 0.6% |
| Spanish | 42 | 27.3% | View All 13 Rows |
Immigrants in Monument
The most numerous immigrant groups reported in Monument came from Central America (17 | 11.0%), Latin America (17 | 11.0%), Mexico (17 | 11.0%), Asia (2 | 1.3%), and China (2 | 1.3%), together accounting for 35.7% of all Monument residents.
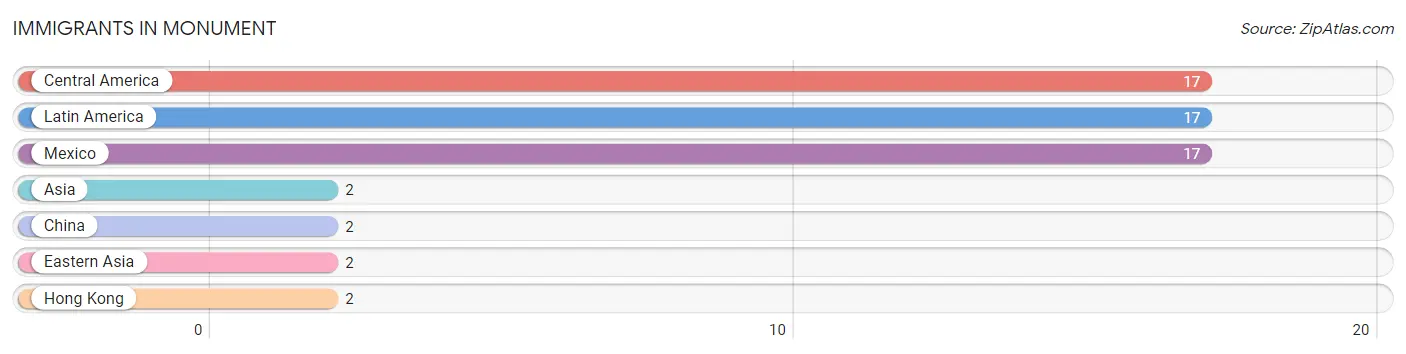
| Immigration Origin | # Population | % Population |
| Asia | 2 | 1.3% |
| Central America | 17 | 11.0% |
| China | 2 | 1.3% |
| Eastern Asia | 2 | 1.3% |
| Hong Kong | 2 | 1.3% |
| Latin America | 17 | 11.0% |
| Mexico | 17 | 11.0% | View All 7 Rows |
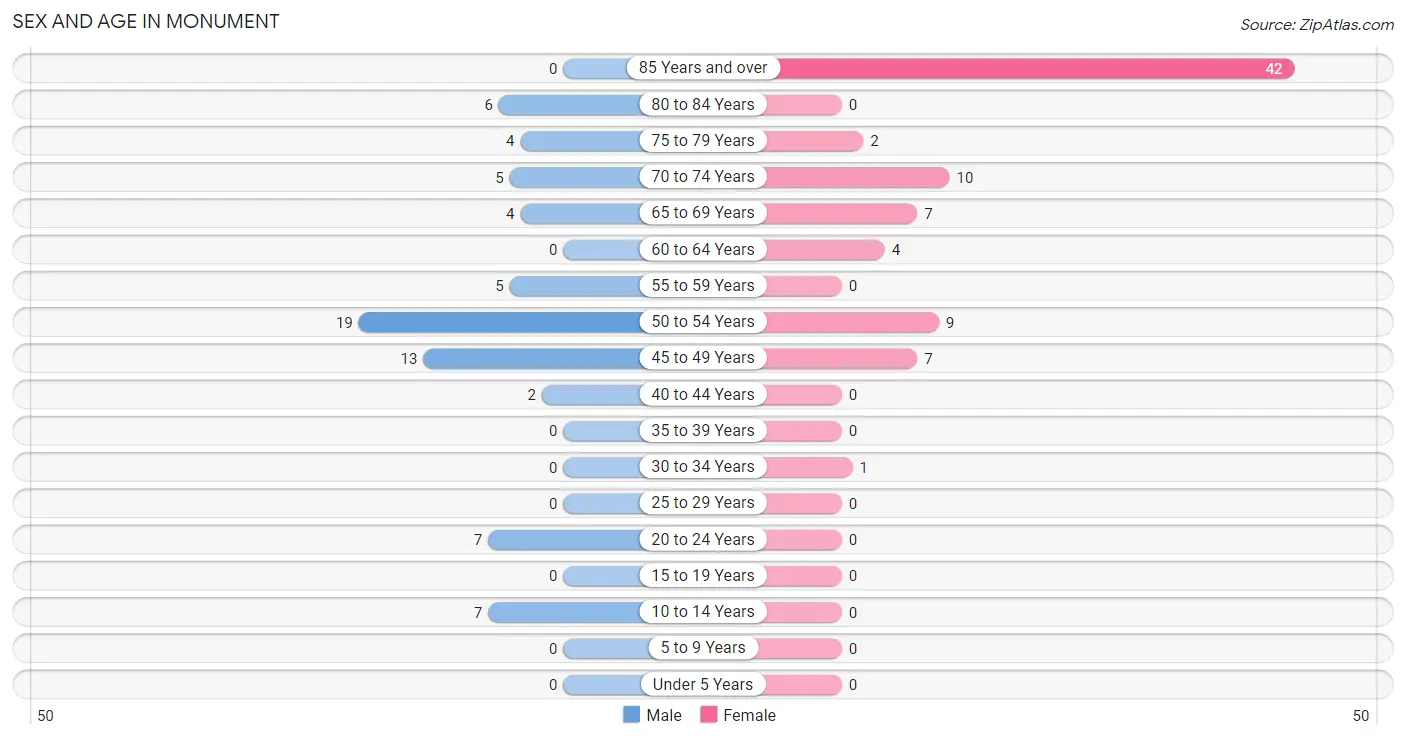
Sex and Age in Monument
Sex and Age in Monument
The most populous age groups in Monument are 50 to 54 Years (19 | 26.4%) for men and 85 Years and over (42 | 51.2%) for women.
| Age Bracket | Male | Female |
| Under 5 Years | 0 (0.0%) | 0 (0.0%) |
| 5 to 9 Years | 0 (0.0%) | 0 (0.0%) |
| 10 to 14 Years | 7 (9.7%) | 0 (0.0%) |
| 15 to 19 Years | 0 (0.0%) | 0 (0.0%) |
| 20 to 24 Years | 7 (9.7%) | 0 (0.0%) |
| 25 to 29 Years | 0 (0.0%) | 0 (0.0%) |
| 30 to 34 Years | 0 (0.0%) | 1 (1.2%) |
| 35 to 39 Years | 0 (0.0%) | 0 (0.0%) |
| 40 to 44 Years | 2 (2.8%) | 0 (0.0%) |
| 45 to 49 Years | 13 (18.1%) | 7 (8.5%) |
| 50 to 54 Years | 19 (26.4%) | 9 (11.0%) |
| 55 to 59 Years | 5 (6.9%) | 0 (0.0%) |
| 60 to 64 Years | 0 (0.0%) | 4 (4.9%) |
| 65 to 69 Years | 4 (5.6%) | 7 (8.5%) |
| 70 to 74 Years | 5 (6.9%) | 10 (12.2%) |
| 75 to 79 Years | 4 (5.6%) | 2 (2.4%) |
| 80 to 84 Years | 6 (8.3%) | 0 (0.0%) |
| 85 Years and over | 0 (0.0%) | 42 (51.2%) |
| Total | 72 (100.0%) | 82 (100.0%) |
Families and Households in Monument
Median Family Size in Monument
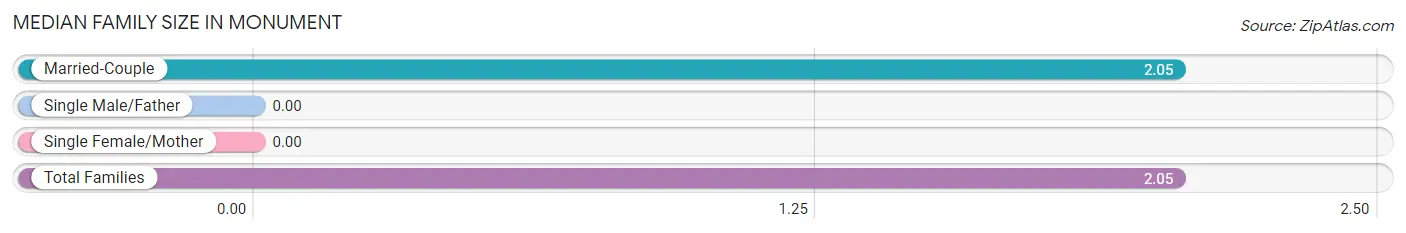
| Family Type | # Families | Family Size |
| Married-Couple | 20 (100.0%) | 2.05 |
| Single Male/Father | 0 (0.0%) | - |
| Single Female/Mother | 0 (0.0%) | - |
| Total Families | 20 (100.0%) | 2.05 |
Median Household Size in Monument
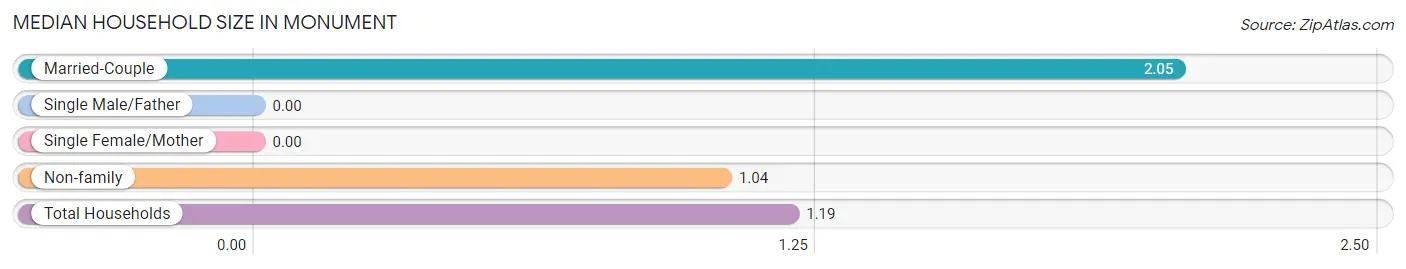
| Household Type | # Households | Household Size |
| Married-Couple | 20 (15.5%) | 2.05 |
| Single Male/Father | 0 (0.0%) | - |
| Single Female/Mother | 0 (0.0%) | - |
| Non-family | 109 (84.5%) | 1.04 |
| Total Households | 129 (100.0%) | 1.19 |
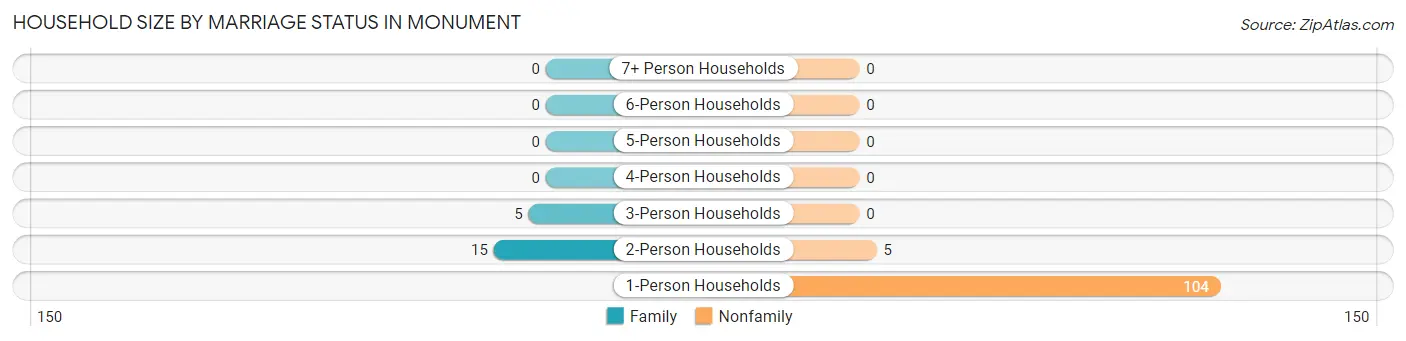
Household Size by Marriage Status in Monument
Out of a total of 129 households in Monument, 20 (15.5%) are family households, while 109 (84.5%) are nonfamily households. The most numerous type of family households are 2-person households, comprising 15, and the most common type of nonfamily households are 1-person households, comprising 104.
| Household Size | Family Households | Nonfamily Households |
| 1-Person Households | - | 104 (80.6%) |
| 2-Person Households | 15 (11.6%) | 5 (3.9%) |
| 3-Person Households | 5 (3.9%) | 0 (0.0%) |
| 4-Person Households | 0 (0.0%) | 0 (0.0%) |
| 5-Person Households | 0 (0.0%) | 0 (0.0%) |
| 6-Person Households | 0 (0.0%) | 0 (0.0%) |
| 7+ Person Households | 0 (0.0%) | 0 (0.0%) |
| Total | 20 (15.5%) | 109 (84.5%) |
Female Fertility in Monument
Fertility by Age in Monument
| Age Bracket | Women with Births | Births / 1,000 Women |
| 15 to 19 years | 0 (0.0%) | 0.0 |
| 20 to 34 years | 0 (0.0%) | 0.0 |
| 35 to 50 years | 0 (0.0%) | 0.0 |
| Total | 0 (0.0%) | 0.0 |
Fertility by Age by Marriage Status in Monument
| Age Bracket | Married | Unmarried |
| 15 to 19 years | 0 (0.0%) | 0 (0.0%) |
| 20 to 34 years | 0 (0.0%) | 0 (0.0%) |
| 35 to 50 years | 0 (0.0%) | 0 (0.0%) |
| Total | 0 (0.0%) | 0 (0.0%) |
Fertility by Education in Monument
| Educational Attainment | Women with Births | Births / 1,000 Women |
| Less than High School | 0 (0.0%) | 0.0 |
| High School Diploma | 0 (0.0%) | 0.0 |
| College or Associate's Degree | 0 (0.0%) | 0.0 |
| Bachelor's Degree | 0 (0.0%) | 0.0 |
| Graduate Degree | 0 (0.0%) | 0.0 |
| Total | 0 (0.0%) | 0.0 |
Fertility by Education by Marriage Status in Monument
| Educational Attainment | Married | Unmarried |
| Less than High School | 0 (0.0%) | 0 (0.0%) |
| High School Diploma | 0 (0.0%) | 0 (0.0%) |
| College or Associate's Degree | 0 (0.0%) | 0 (0.0%) |
| Bachelor's Degree | 0 (0.0%) | 0 (0.0%) |
| Graduate Degree | 0 (0.0%) | 0 (0.0%) |
| Total | 0 (0.0%) | 0 (0.0%) |
Employment Characteristics in Monument
Employment by Class of Employer in Monument
Among the 61 employed individuals in Monument, private company employees (54 | 88.5%), federal government employees (4 | 6.6%), and local government employees (3 | 4.9%) make up the most common classes of employment.
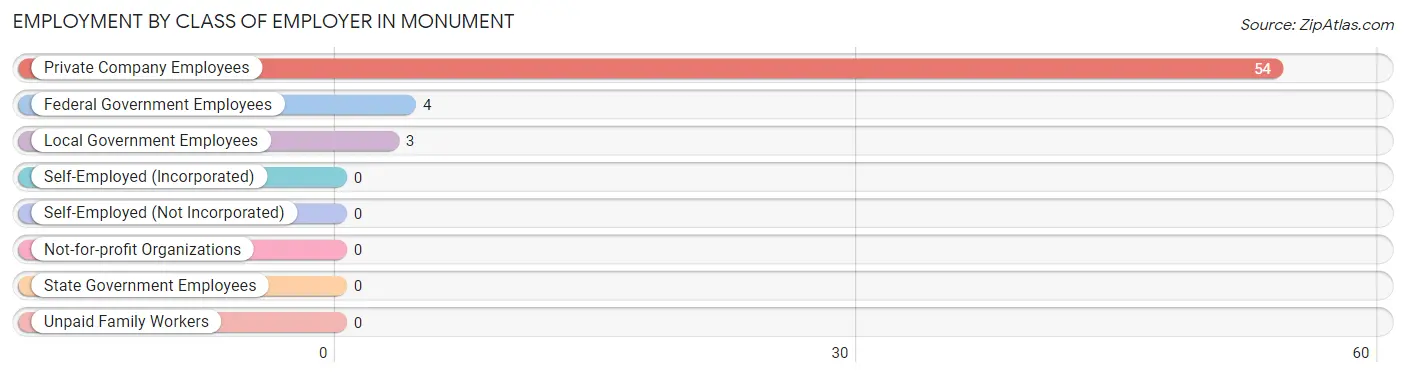
| Employer Class | # Employees | % Employees |
| Private Company Employees | 54 | 88.5% |
| Self-Employed (Incorporated) | 0 | 0.0% |
| Self-Employed (Not Incorporated) | 0 | 0.0% |
| Not-for-profit Organizations | 0 | 0.0% |
| Local Government Employees | 3 | 4.9% |
| State Government Employees | 0 | 0.0% |
| Federal Government Employees | 4 | 6.6% |
| Unpaid Family Workers | 0 | 0.0% |
| Total | 61 | 100.0% |
Employment Status by Age in Monument
According to the labor force statistics for Monument, out of the total population over 16 years of age (147), 44.9% or 66 individuals are in the labor force, with 7.6% or 5 of them unemployed. The age group with the highest labor force participation rate is 20 to 24 years, with 100.0% or 7 individuals in the labor force. Within the labor force, the 45 to 54 years age range has the highest percentage of unemployed individuals, with 10.9% or 5 of them being unemployed.
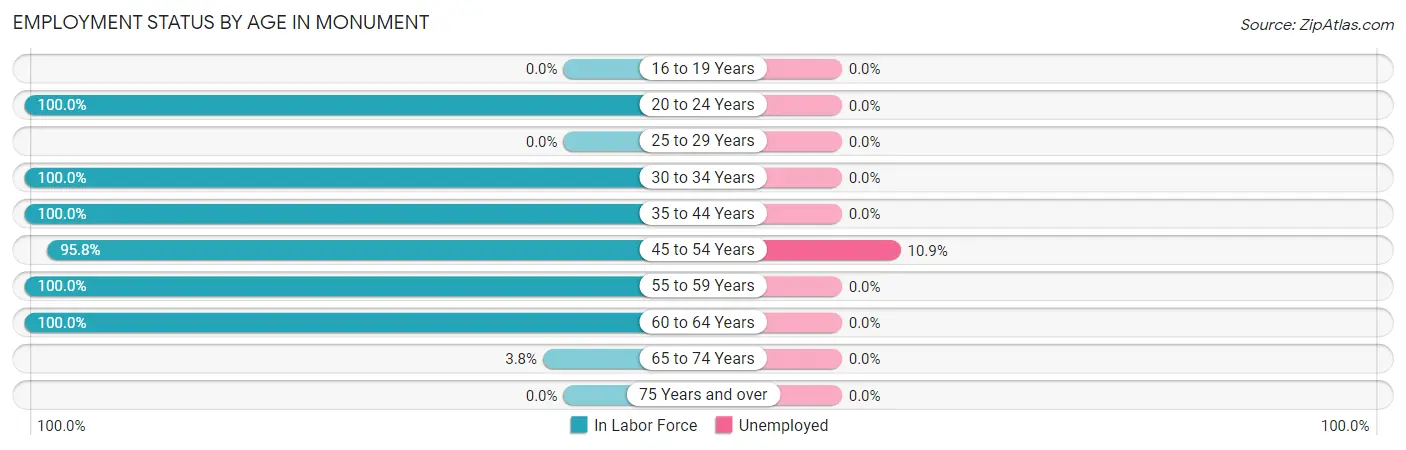
| Age Bracket | In Labor Force | Unemployed |
| 16 to 19 Years | 0 (0.0%) | 0 (0.0%) |
| 20 to 24 Years | 7 (100.0%) | 0 (0.0%) |
| 25 to 29 Years | 0 (0.0%) | 0 (0.0%) |
| 30 to 34 Years | 1 (100.0%) | 0 (0.0%) |
| 35 to 44 Years | 2 (100.0%) | 0 (0.0%) |
| 45 to 54 Years | 46 (95.8%) | 5 (10.9%) |
| 55 to 59 Years | 5 (100.0%) | 0 (0.0%) |
| 60 to 64 Years | 4 (100.0%) | 0 (0.0%) |
| 65 to 74 Years | 1 (3.8%) | 0 (0.0%) |
| 75 Years and over | 0 (0.0%) | 0 (0.0%) |
| Total | 66 (44.9%) | 5 (7.6%) |
Employment Status by Educational Attainment in Monument
According to labor force statistics for Monument, 96.7% of individuals (58) out of the total population between 25 and 64 years of age (60) are in the labor force, with 8.6% or 5 of them being unemployed. The group with the highest labor force participation rate are those with the educational attainment of high school diploma, with 100.0% or 10 individuals in the labor force. Within the labor force, individuals with college / associate degree education have the highest percentage of unemployment, with 17.2% or 5 of them being unemployed.
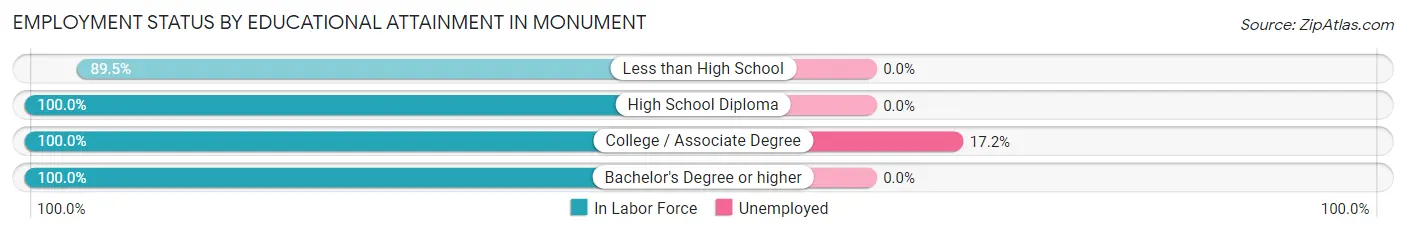
| Educational Attainment | In Labor Force | Unemployed |
| Less than High School | 17 (89.5%) | 0 (0.0%) |
| High School Diploma | 10 (100.0%) | 0 (0.0%) |
| College / Associate Degree | 29 (100.0%) | 5 (17.2%) |
| Bachelor's Degree or higher | 2 (100.0%) | 0 (0.0%) |
| Total | 58 (96.7%) | 5 (8.6%) |
Employment Occupations by Sex in Monument
Management, Business, Science and Arts Occupations
The most common Management, Business, Science and Arts occupations in Monument are Management (7 | 11.5%), Community & Social Service (3 | 4.9%), and Education Instruction & Library (3 | 4.9%).
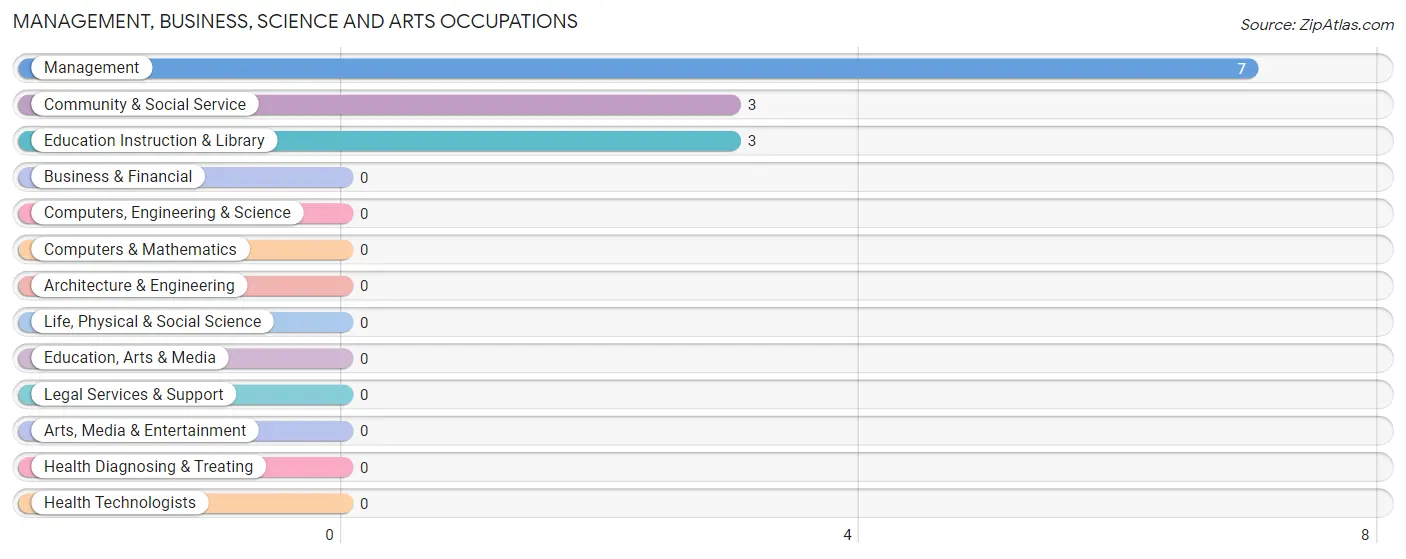
Management, Business, Science and Arts Occupations by Sex
Within the Management, Business, Science and Arts occupations in Monument, the most male-oriented occupations are Community & Social Service (66.7%), Education Instruction & Library (66.7%), and Management (28.6%), while the most female-oriented occupations are Management (71.4%), Community & Social Service (33.3%), and Education Instruction & Library (33.3%).
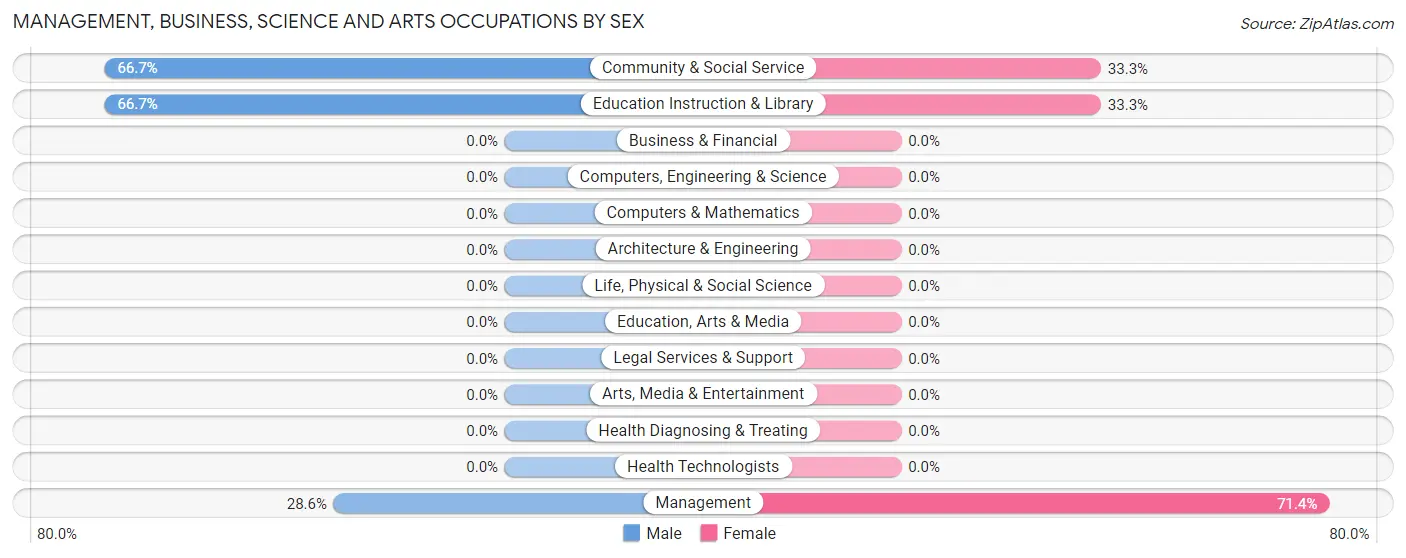
| Occupation | Male | Female |
| Management | 2 (28.6%) | 5 (71.4%) |
| Business & Financial | 0 (0.0%) | 0 (0.0%) |
| Computers, Engineering & Science | 0 (0.0%) | 0 (0.0%) |
| Computers & Mathematics | 0 (0.0%) | 0 (0.0%) |
| Architecture & Engineering | 0 (0.0%) | 0 (0.0%) |
| Life, Physical & Social Science | 0 (0.0%) | 0 (0.0%) |
| Community & Social Service | 2 (66.7%) | 1 (33.3%) |
| Education, Arts & Media | 0 (0.0%) | 0 (0.0%) |
| Legal Services & Support | 0 (0.0%) | 0 (0.0%) |
| Education Instruction & Library | 2 (66.7%) | 1 (33.3%) |
| Arts, Media & Entertainment | 0 (0.0%) | 0 (0.0%) |
| Health Diagnosing & Treating | 0 (0.0%) | 0 (0.0%) |
| Health Technologists | 0 (0.0%) | 0 (0.0%) |
| Total (Category) | 4 (40.0%) | 6 (60.0%) |
| Total (Overall) | 44 (72.1%) | 17 (27.9%) |
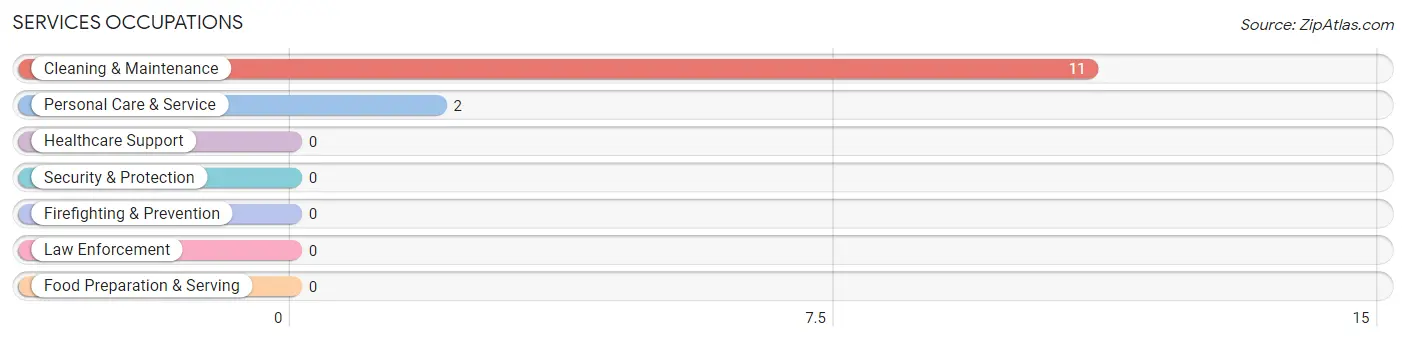
Services Occupations
The most common Services occupations in Monument are Cleaning & Maintenance (11 | 18.0%), and Personal Care & Service (2 | 3.3%).
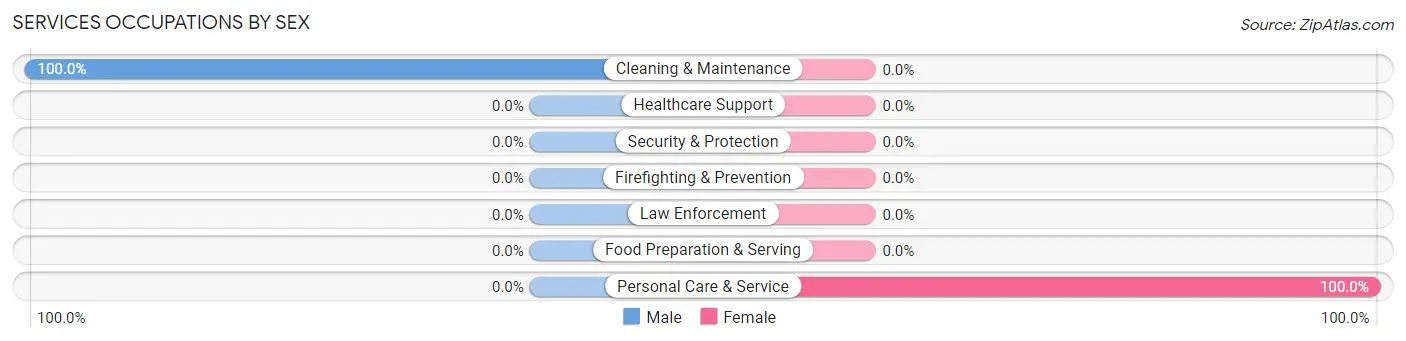
Services Occupations by Sex
| Occupation | Male | Female |
| Healthcare Support | 0 (0.0%) | 0 (0.0%) |
| Security & Protection | 0 (0.0%) | 0 (0.0%) |
| Firefighting & Prevention | 0 (0.0%) | 0 (0.0%) |
| Law Enforcement | 0 (0.0%) | 0 (0.0%) |
| Food Preparation & Serving | 0 (0.0%) | 0 (0.0%) |
| Cleaning & Maintenance | 11 (100.0%) | 0 (0.0%) |
| Personal Care & Service | 0 (0.0%) | 2 (100.0%) |
| Total (Category) | 11 (84.6%) | 2 (15.4%) |
| Total (Overall) | 44 (72.1%) | 17 (27.9%) |
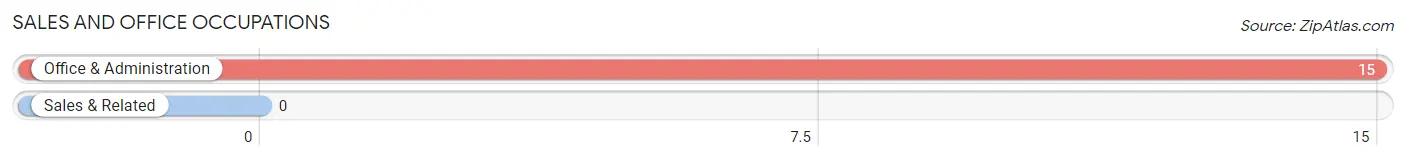
Sales and Office Occupations
The most common Sales and Office occupations in Monument are , and Office & Administration (15 | 24.6%).
Sales and Office Occupations by Sex
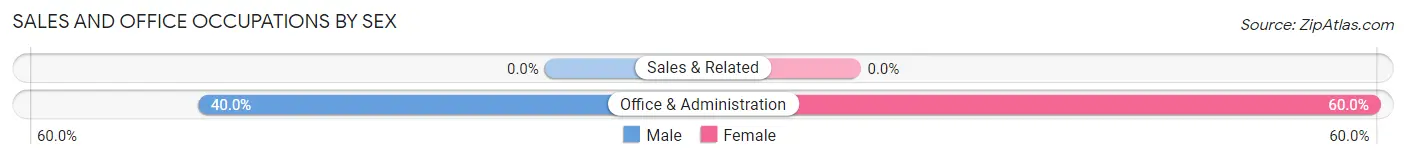
| Occupation | Male | Female |
| Sales & Related | 0 (0.0%) | 0 (0.0%) |
| Office & Administration | 6 (40.0%) | 9 (60.0%) |
| Total (Category) | 6 (40.0%) | 9 (60.0%) |
| Total (Overall) | 44 (72.1%) | 17 (27.9%) |
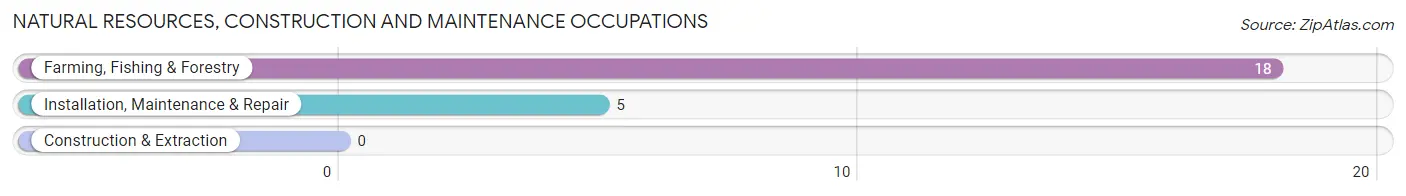
Natural Resources, Construction and Maintenance Occupations
The most common Natural Resources, Construction and Maintenance occupations in Monument are Farming, Fishing & Forestry (18 | 29.5%), and Installation, Maintenance & Repair (5 | 8.2%).
Natural Resources, Construction and Maintenance Occupations by Sex
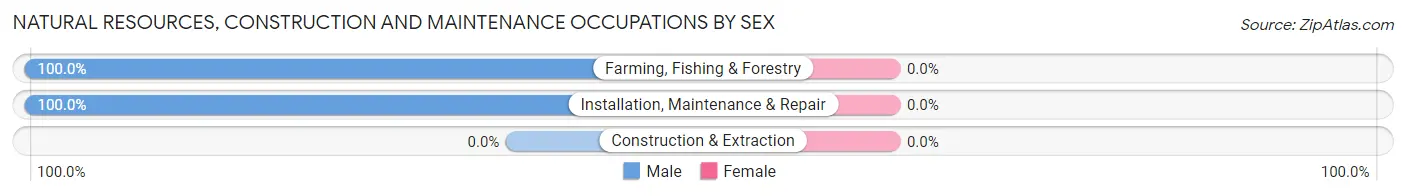
| Occupation | Male | Female |
| Farming, Fishing & Forestry | 18 (100.0%) | 0 (0.0%) |
| Construction & Extraction | 0 (0.0%) | 0 (0.0%) |
| Installation, Maintenance & Repair | 5 (100.0%) | 0 (0.0%) |
| Total (Category) | 23 (100.0%) | 0 (0.0%) |
| Total (Overall) | 44 (72.1%) | 17 (27.9%) |
Production, Transportation and Moving Occupations
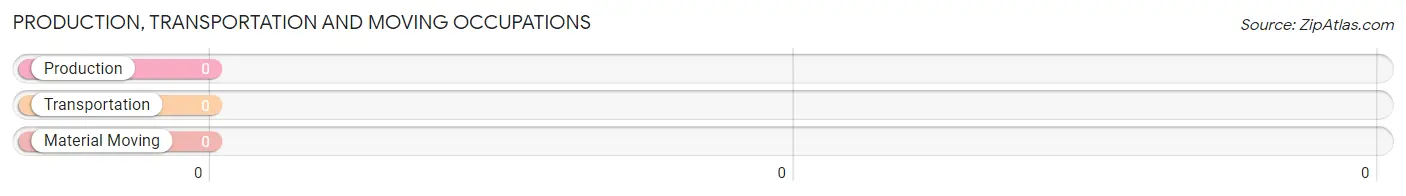
Production, Transportation and Moving Occupations by Sex
| Occupation | Male | Female |
| Production | 0 (0.0%) | 0 (0.0%) |
| Transportation | 0 (0.0%) | 0 (0.0%) |
| Material Moving | 0 (0.0%) | 0 (0.0%) |
| Total (Category) | 0 (0.0%) | 0 (0.0%) |
| Total (Overall) | 44 (72.1%) | 17 (27.9%) |
Employment Industries by Sex in Monument
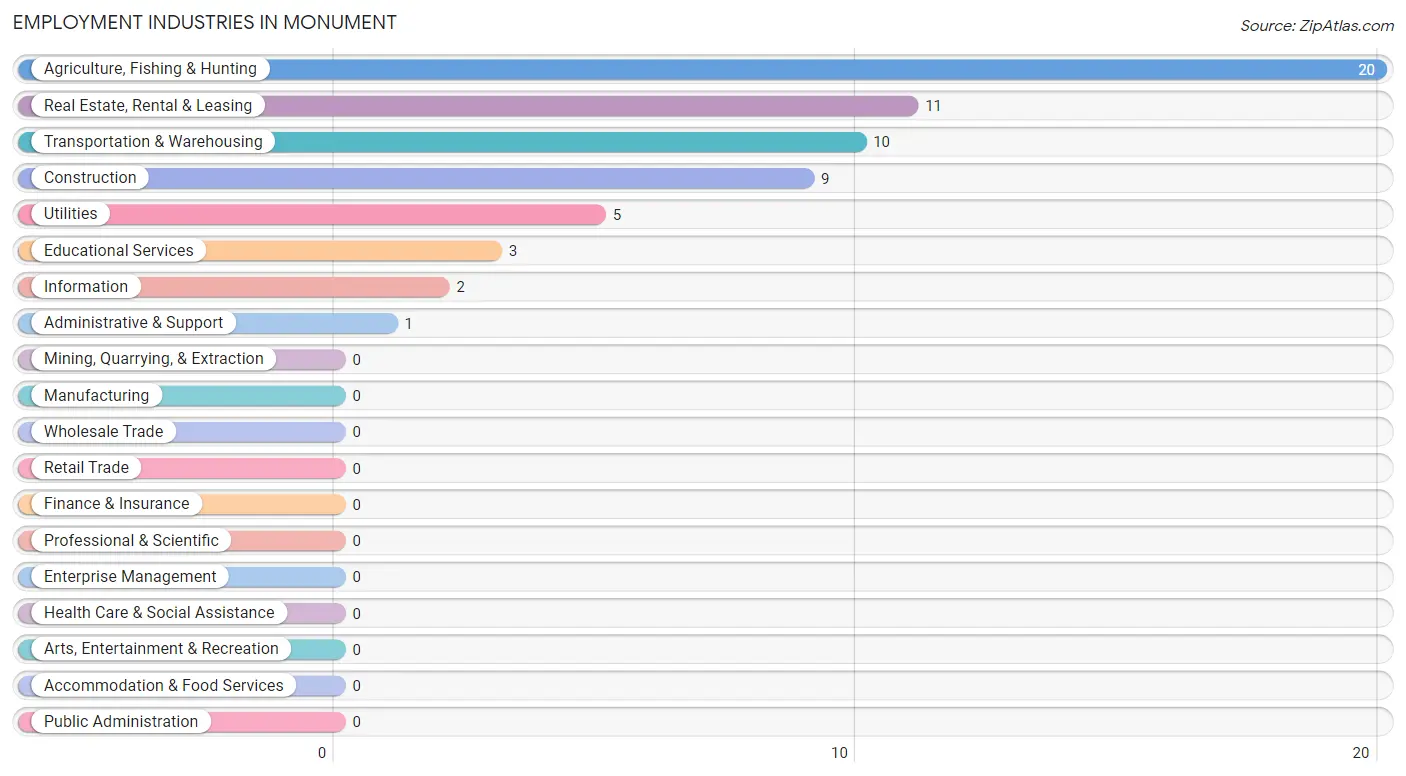
Employment Industries in Monument
The major employment industries in Monument include Agriculture, Fishing & Hunting (20 | 32.8%), Real Estate, Rental & Leasing (11 | 18.0%), Transportation & Warehousing (10 | 16.4%), Construction (9 | 14.7%), and Utilities (5 | 8.2%).
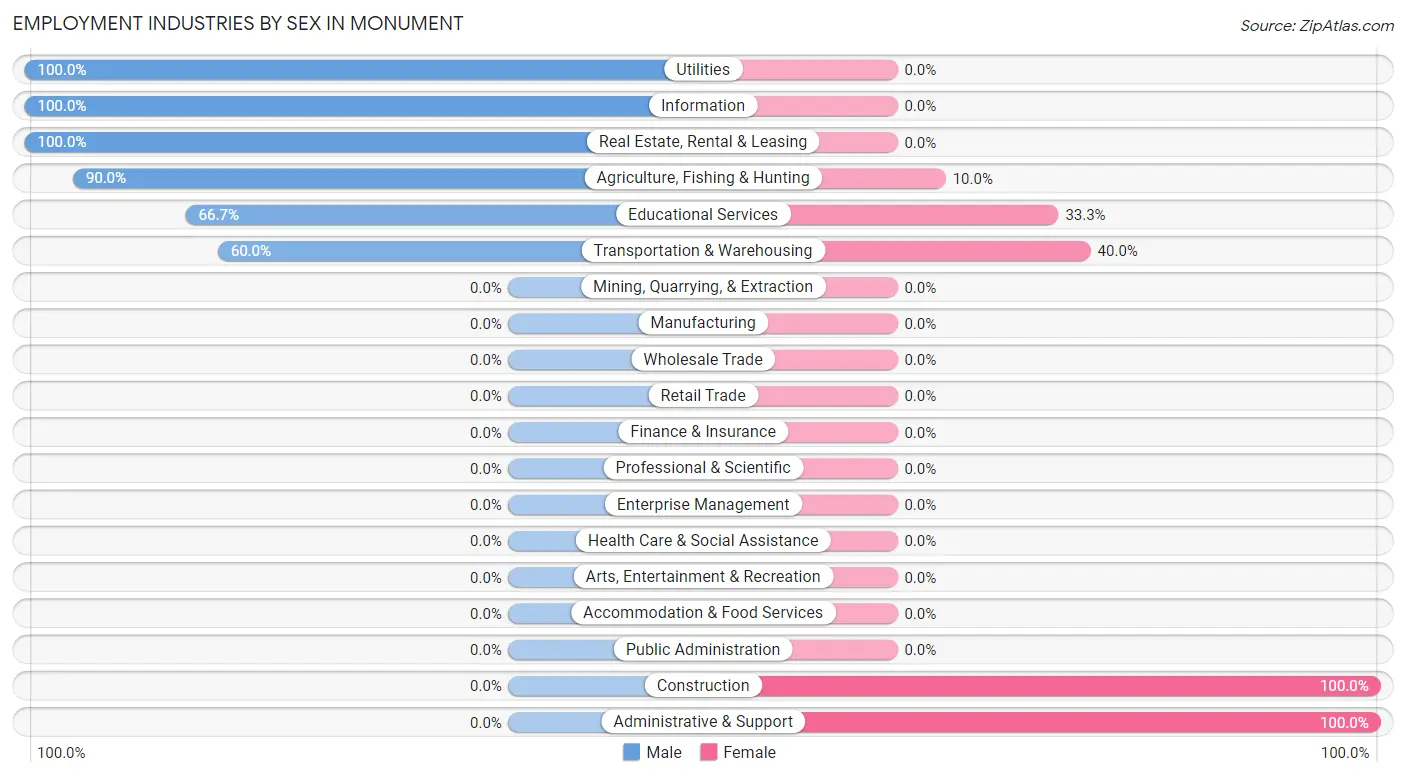
Employment Industries by Sex in Monument
The Monument industries that see more men than women are Utilities (100.0%), Information (100.0%), and Real Estate, Rental & Leasing (100.0%), whereas the industries that tend to have a higher number of women are Construction (100.0%), Administrative & Support (100.0%), and Transportation & Warehousing (40.0%).
| Industry | Male | Female |
| Agriculture, Fishing & Hunting | 18 (90.0%) | 2 (10.0%) |
| Mining, Quarrying, & Extraction | 0 (0.0%) | 0 (0.0%) |
| Construction | 0 (0.0%) | 9 (100.0%) |
| Manufacturing | 0 (0.0%) | 0 (0.0%) |
| Wholesale Trade | 0 (0.0%) | 0 (0.0%) |
| Retail Trade | 0 (0.0%) | 0 (0.0%) |
| Transportation & Warehousing | 6 (60.0%) | 4 (40.0%) |
| Utilities | 5 (100.0%) | 0 (0.0%) |
| Information | 2 (100.0%) | 0 (0.0%) |
| Finance & Insurance | 0 (0.0%) | 0 (0.0%) |
| Real Estate, Rental & Leasing | 11 (100.0%) | 0 (0.0%) |
| Professional & Scientific | 0 (0.0%) | 0 (0.0%) |
| Enterprise Management | 0 (0.0%) | 0 (0.0%) |
| Administrative & Support | 0 (0.0%) | 1 (100.0%) |
| Educational Services | 2 (66.7%) | 1 (33.3%) |
| Health Care & Social Assistance | 0 (0.0%) | 0 (0.0%) |
| Arts, Entertainment & Recreation | 0 (0.0%) | 0 (0.0%) |
| Accommodation & Food Services | 0 (0.0%) | 0 (0.0%) |
| Public Administration | 0 (0.0%) | 0 (0.0%) |
| Total | 44 (72.1%) | 17 (27.9%) |
Education in Monument
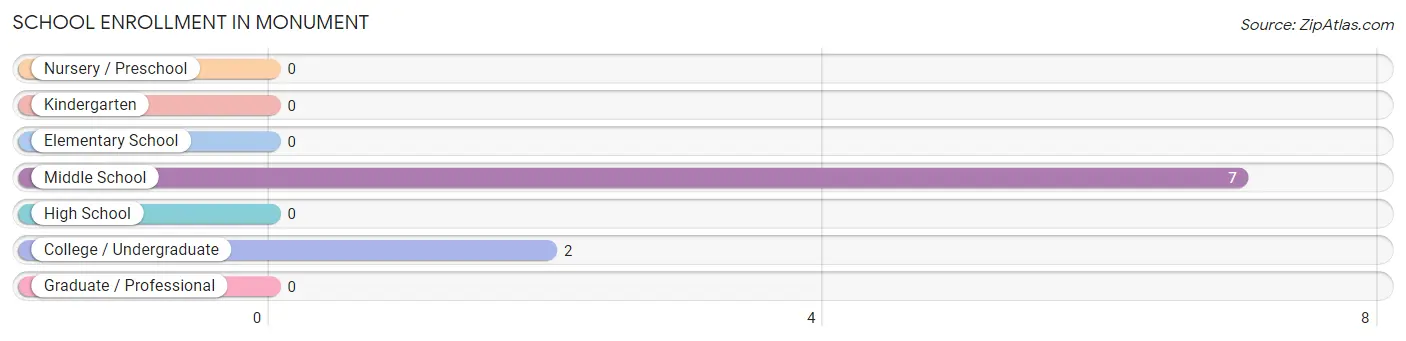
School Enrollment in Monument
The most common levels of schooling among the 9 students in Monument are middle school (7 | 77.8%), and college / undergraduate (2 | 22.2%).
| School Level | # Students | % Students |
| Nursery / Preschool | 0 | 0.0% |
| Kindergarten | 0 | 0.0% |
| Elementary School | 0 | 0.0% |
| Middle School | 7 | 77.8% |
| High School | 0 | 0.0% |
| College / Undergraduate | 2 | 22.2% |
| Graduate / Professional | 0 | 0.0% |
| Total | 9 | 100.0% |
School Enrollment by Age by Funding Source in Monument
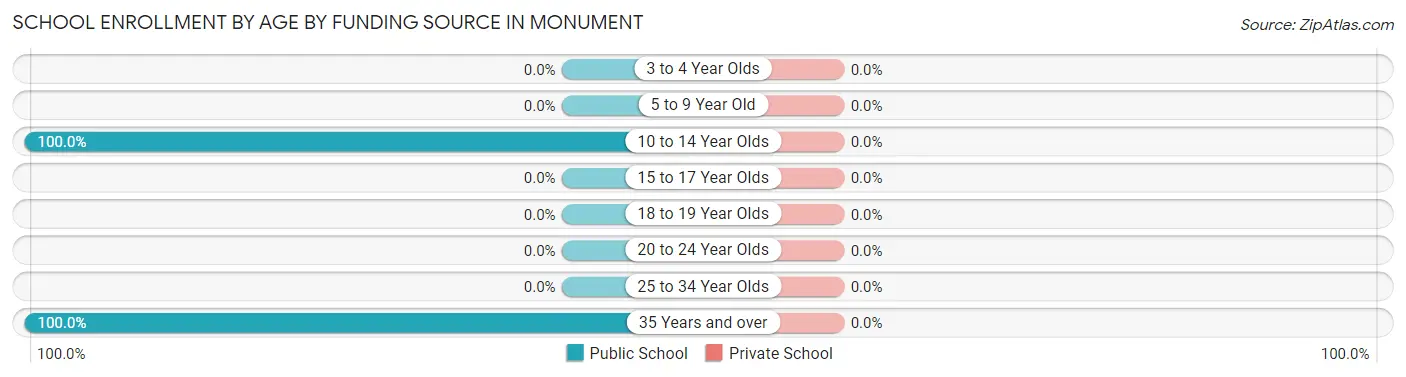
| Age Bracket | Public School | Private School |
| 3 to 4 Year Olds | 0 (0.0%) | 0 (0.0%) |
| 5 to 9 Year Old | 0 (0.0%) | 0 (0.0%) |
| 10 to 14 Year Olds | 7 (100.0%) | 0 (0.0%) |
| 15 to 17 Year Olds | 0 (0.0%) | 0 (0.0%) |
| 18 to 19 Year Olds | 0 (0.0%) | 0 (0.0%) |
| 20 to 24 Year Olds | 0 (0.0%) | 0 (0.0%) |
| 25 to 34 Year Olds | 0 (0.0%) | 0 (0.0%) |
| 35 Years and over | 2 (100.0%) | 0 (0.0%) |
| Total | 9 (100.0%) | 0 (0.0%) |
Educational Attainment by Field of Study in Monument
, and liberal arts & history (2 | 100.0%) are the most common fields of study among 2 individuals in Monument who have obtained a bachelor's degree or higher.

| Field of Study | # Graduates | % Graduates |
| Computers & Mathematics | 0 | 0.0% |
| Bio, Nature & Agricultural | 0 | 0.0% |
| Physical & Health Sciences | 0 | 0.0% |
| Psychology | 0 | 0.0% |
| Social Sciences | 0 | 0.0% |
| Engineering | 0 | 0.0% |
| Multidisciplinary Studies | 0 | 0.0% |
| Science & Technology | 0 | 0.0% |
| Business | 0 | 0.0% |
| Education | 0 | 0.0% |
| Literature & Languages | 0 | 0.0% |
| Liberal Arts & History | 2 | 100.0% |
| Visual & Performing Arts | 0 | 0.0% |
| Communications | 0 | 0.0% |
| Arts & Humanities | 0 | 0.0% |
| Total | 2 | 100.0% |
Transportation & Commute in Monument
Vehicle Availability by Sex in Monument
The most prevalent vehicle ownership categories in Monument are males with 2 vehicles (26, accounting for 59.1%) and females with 2 vehicles (6, making up 152.9%).
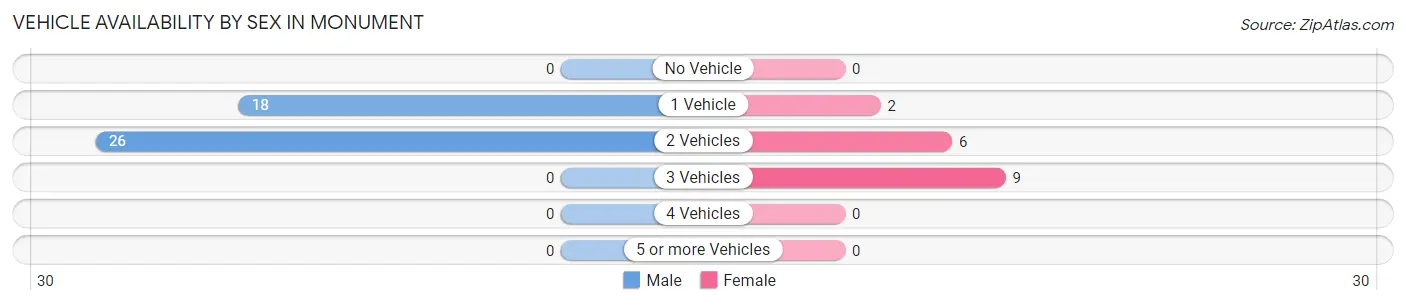
| Vehicles Available | Male | Female |
| No Vehicle | 0 (0.0%) | 0 (0.0%) |
| 1 Vehicle | 18 (40.9%) | 2 (11.8%) |
| 2 Vehicles | 26 (59.1%) | 6 (35.3%) |
| 3 Vehicles | 0 (0.0%) | 9 (52.9%) |
| 4 Vehicles | 0 (0.0%) | 0 (0.0%) |
| 5 or more Vehicles | 0 (0.0%) | 0 (0.0%) |
| Total | 44 (100.0%) | 17 (100.0%) |
Commute Time in Monument
The most frequently occuring commute durations in Monument are less than 5 minutes (19 commuters, 34.5%), 10 to 14 minutes (11 commuters, 20.0%), and 60 to 89 minutes (9 commuters, 16.4%).
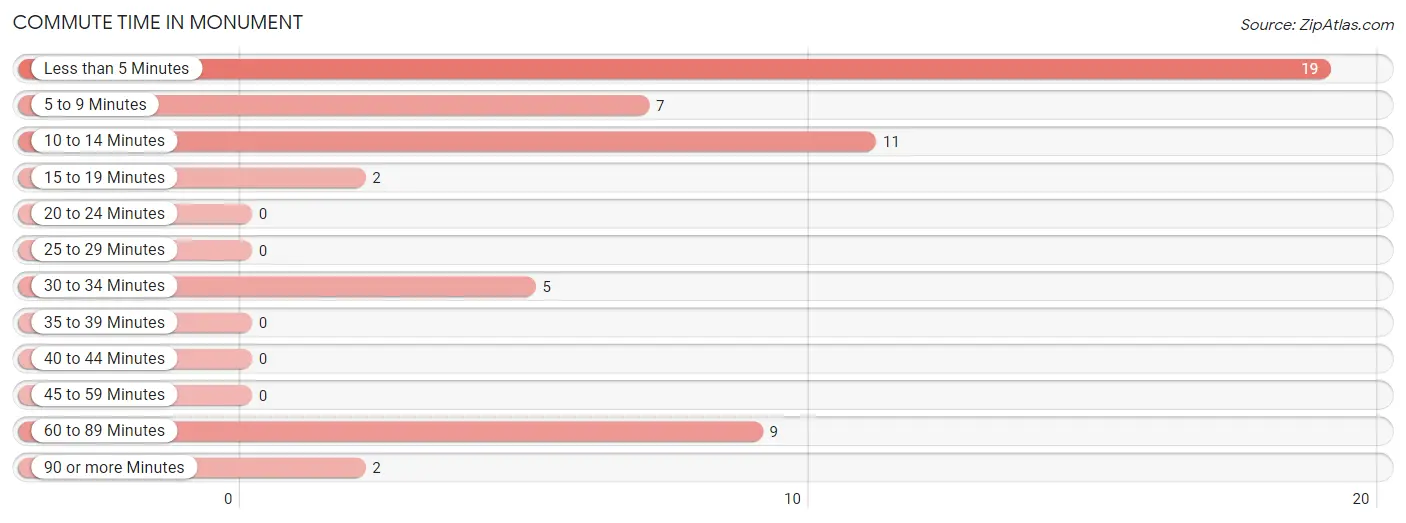
| Commute Time | # Commuters | % Commuters |
| Less than 5 Minutes | 19 | 34.5% |
| 5 to 9 Minutes | 7 | 12.7% |
| 10 to 14 Minutes | 11 | 20.0% |
| 15 to 19 Minutes | 2 | 3.6% |
| 20 to 24 Minutes | 0 | 0.0% |
| 25 to 29 Minutes | 0 | 0.0% |
| 30 to 34 Minutes | 5 | 9.1% |
| 35 to 39 Minutes | 0 | 0.0% |
| 40 to 44 Minutes | 0 | 0.0% |
| 45 to 59 Minutes | 0 | 0.0% |
| 60 to 89 Minutes | 9 | 16.4% |
| 90 or more Minutes | 2 | 3.6% |
Commute Time by Sex in Monument
The most common commute times in Monument are less than 5 minutes (17 commuters, 44.7%) for males and 60 to 89 minutes (9 commuters, 52.9%) for females.
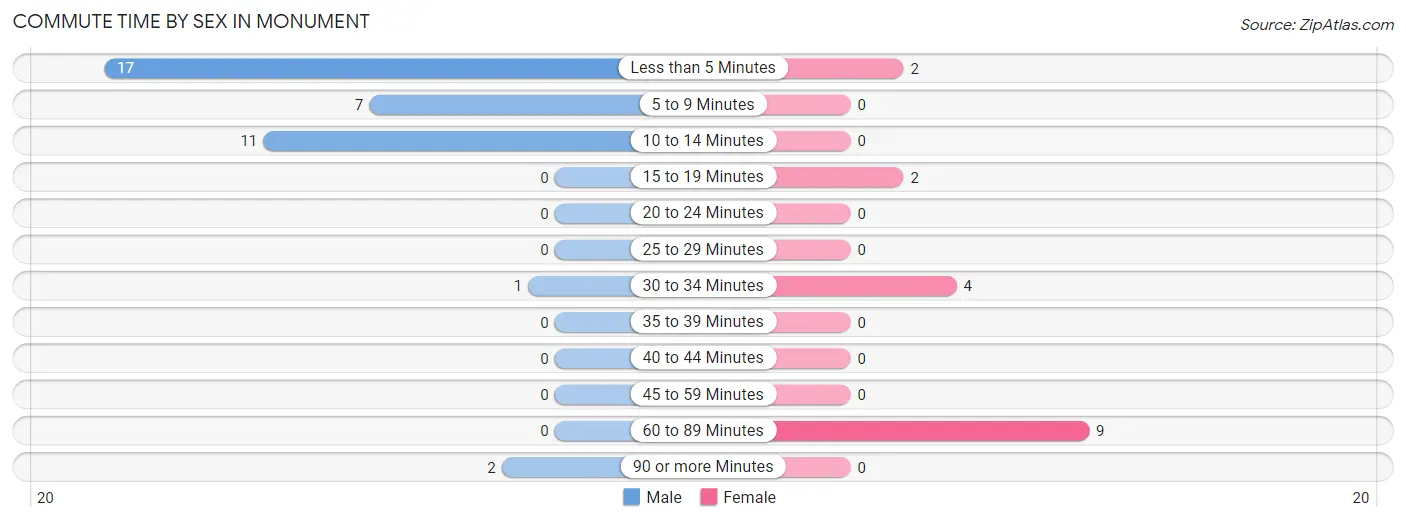
| Commute Time | Male | Female |
| Less than 5 Minutes | 17 (44.7%) | 2 (11.8%) |
| 5 to 9 Minutes | 7 (18.4%) | 0 (0.0%) |
| 10 to 14 Minutes | 11 (28.9%) | 0 (0.0%) |
| 15 to 19 Minutes | 0 (0.0%) | 2 (11.8%) |
| 20 to 24 Minutes | 0 (0.0%) | 0 (0.0%) |
| 25 to 29 Minutes | 0 (0.0%) | 0 (0.0%) |
| 30 to 34 Minutes | 1 (2.6%) | 4 (23.5%) |
| 35 to 39 Minutes | 0 (0.0%) | 0 (0.0%) |
| 40 to 44 Minutes | 0 (0.0%) | 0 (0.0%) |
| 45 to 59 Minutes | 0 (0.0%) | 0 (0.0%) |
| 60 to 89 Minutes | 0 (0.0%) | 9 (52.9%) |
| 90 or more Minutes | 2 (5.3%) | 0 (0.0%) |
Time of Departure to Work by Sex in Monument
The most frequent times of departure to work in Monument are 6:30 AM to 6:59 AM (17, 44.7%) for males and 5:30 AM to 5:59 AM (9, 52.9%) for females.
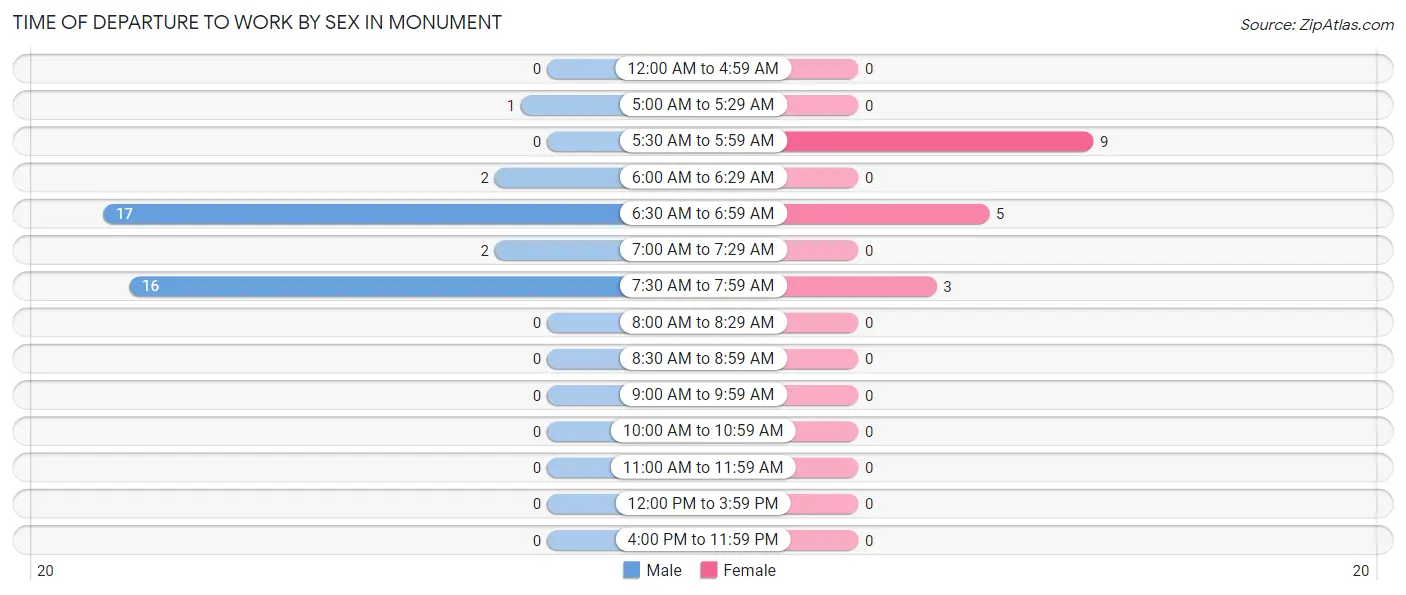
| Time of Departure | Male | Female |
| 12:00 AM to 4:59 AM | 0 (0.0%) | 0 (0.0%) |
| 5:00 AM to 5:29 AM | 1 (2.6%) | 0 (0.0%) |
| 5:30 AM to 5:59 AM | 0 (0.0%) | 9 (52.9%) |
| 6:00 AM to 6:29 AM | 2 (5.3%) | 0 (0.0%) |
| 6:30 AM to 6:59 AM | 17 (44.7%) | 5 (29.4%) |
| 7:00 AM to 7:29 AM | 2 (5.3%) | 0 (0.0%) |
| 7:30 AM to 7:59 AM | 16 (42.1%) | 3 (17.6%) |
| 8:00 AM to 8:29 AM | 0 (0.0%) | 0 (0.0%) |
| 8:30 AM to 8:59 AM | 0 (0.0%) | 0 (0.0%) |
| 9:00 AM to 9:59 AM | 0 (0.0%) | 0 (0.0%) |
| 10:00 AM to 10:59 AM | 0 (0.0%) | 0 (0.0%) |
| 11:00 AM to 11:59 AM | 0 (0.0%) | 0 (0.0%) |
| 12:00 PM to 3:59 PM | 0 (0.0%) | 0 (0.0%) |
| 4:00 PM to 11:59 PM | 0 (0.0%) | 0 (0.0%) |
| Total | 38 (100.0%) | 17 (100.0%) |
Housing Occupancy in Monument
Occupancy by Ownership in Monument
Of the total 129 dwellings in Monument, owner-occupied units account for 102 (79.1%), while renter-occupied units make up 27 (20.9%).
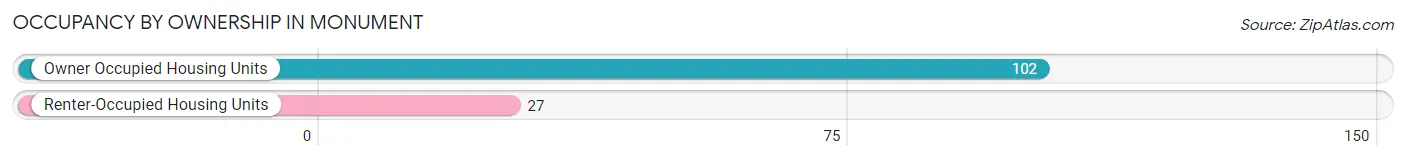
| Occupancy | # Housing Units | % Housing Units |
| Owner Occupied Housing Units | 102 | 79.1% |
| Renter-Occupied Housing Units | 27 | 20.9% |
| Total Occupied Housing Units | 129 | 100.0% |
Occupancy by Household Size in Monument
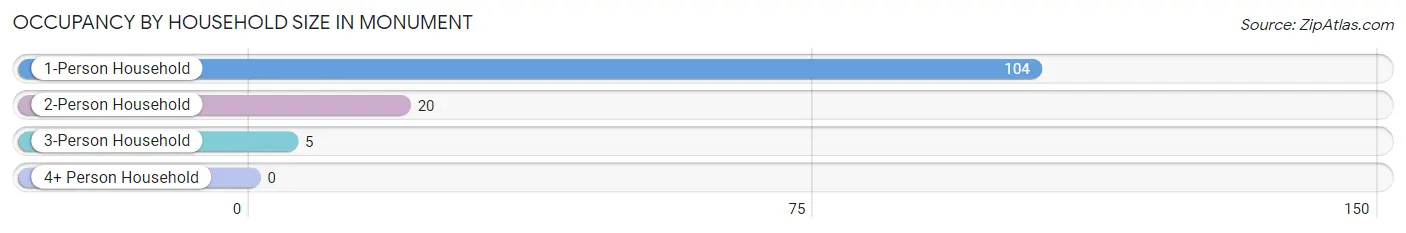
| Household Size | # Housing Units | % Housing Units |
| 1-Person Household | 104 | 80.6% |
| 2-Person Household | 20 | 15.5% |
| 3-Person Household | 5 | 3.9% |
| 4+ Person Household | 0 | 0.0% |
| Total Housing Units | 129 | 100.0% |
Occupancy by Ownership by Household Size in Monument
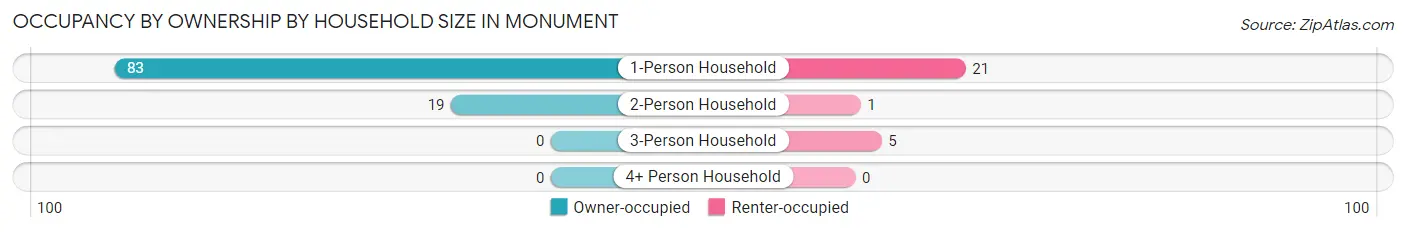
| Household Size | Owner-occupied | Renter-occupied |
| 1-Person Household | 83 (79.8%) | 21 (20.2%) |
| 2-Person Household | 19 (95.0%) | 1 (5.0%) |
| 3-Person Household | 0 (0.0%) | 5 (100.0%) |
| 4+ Person Household | 0 (0.0%) | 0 (0.0%) |
| Total Housing Units | 102 (79.1%) | 27 (20.9%) |
Occupancy by Educational Attainment in Monument
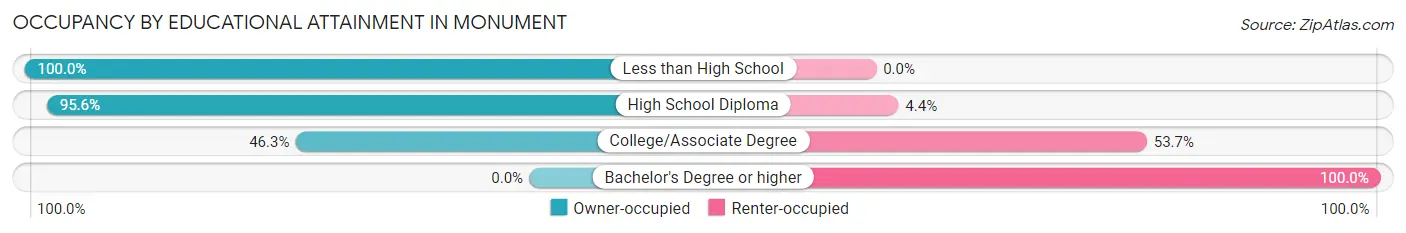
| Household Size | Owner-occupied | Renter-occupied |
| Less than High School | 18 (100.0%) | 0 (0.0%) |
| High School Diploma | 65 (95.6%) | 3 (4.4%) |
| College/Associate Degree | 19 (46.3%) | 22 (53.7%) |
| Bachelor's Degree or higher | 0 (0.0%) | 2 (100.0%) |
Occupancy by Age of Householder in Monument
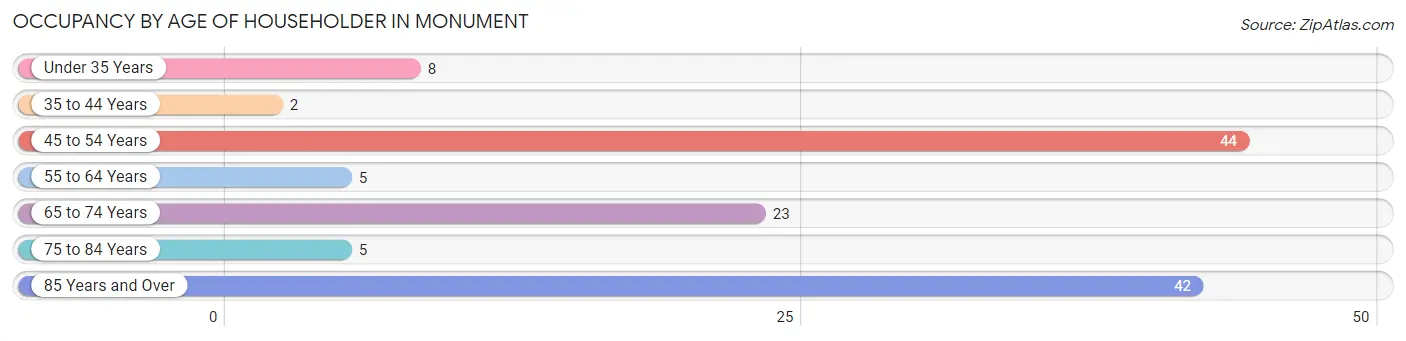
| Age Bracket | # Households | % Households |
| Under 35 Years | 8 | 6.2% |
| 35 to 44 Years | 2 | 1.5% |
| 45 to 54 Years | 44 | 34.1% |
| 55 to 64 Years | 5 | 3.9% |
| 65 to 74 Years | 23 | 17.8% |
| 75 to 84 Years | 5 | 3.9% |
| 85 Years and Over | 42 | 32.6% |
| Total | 129 | 100.0% |
Housing Finances in Monument
Median Income by Occupancy in Monument
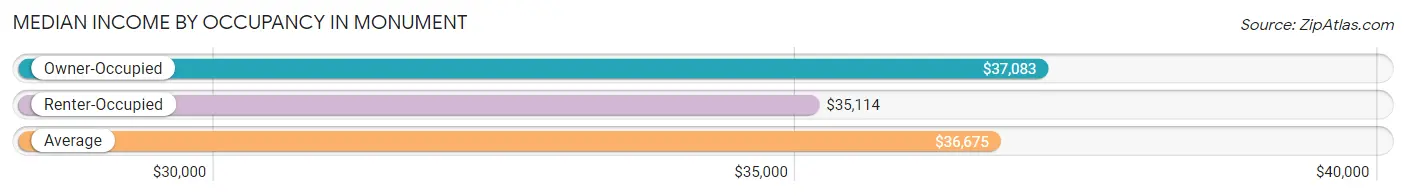
| Occupancy Type | # Households | Median Income |
| Owner-Occupied | 102 (79.1%) | $37,083 |
| Renter-Occupied | 27 (20.9%) | $35,114 |
| Average | 129 (100.0%) | $36,675 |
Occupancy by Householder Income Bracket in Monument
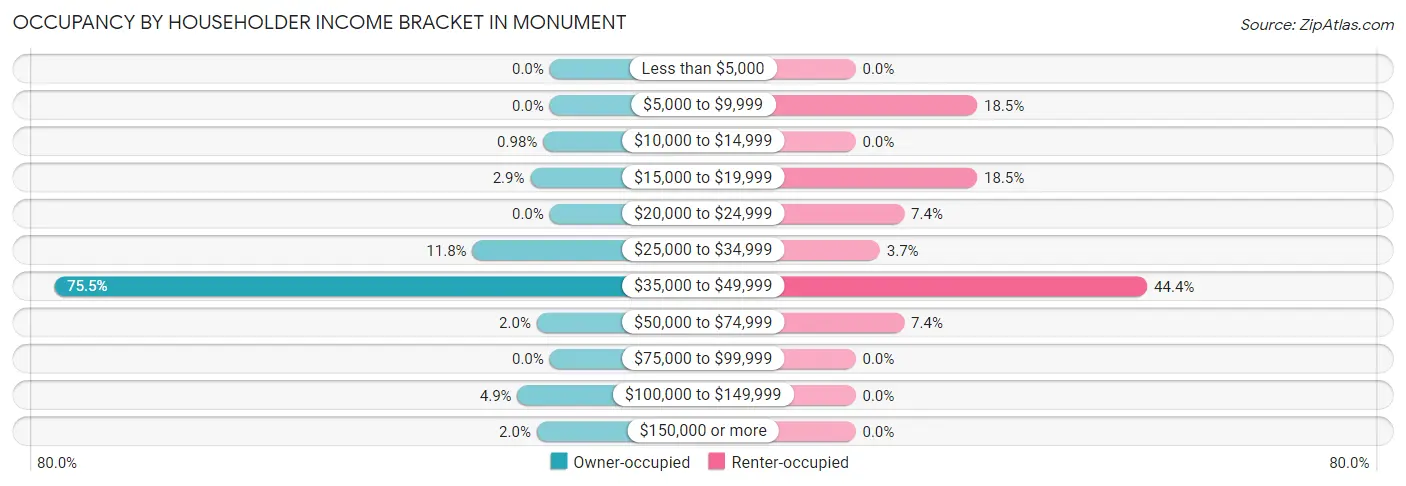
| Income Bracket | Owner-occupied | Renter-occupied |
| Less than $5,000 | 0 (0.0%) | 0 (0.0%) |
| $5,000 to $9,999 | 0 (0.0%) | 5 (18.5%) |
| $10,000 to $14,999 | 1 (1.0%) | 0 (0.0%) |
| $15,000 to $19,999 | 3 (2.9%) | 5 (18.5%) |
| $20,000 to $24,999 | 0 (0.0%) | 2 (7.4%) |
| $25,000 to $34,999 | 12 (11.8%) | 1 (3.7%) |
| $35,000 to $49,999 | 77 (75.5%) | 12 (44.4%) |
| $50,000 to $74,999 | 2 (2.0%) | 2 (7.4%) |
| $75,000 to $99,999 | 0 (0.0%) | 0 (0.0%) |
| $100,000 to $149,999 | 5 (4.9%) | 0 (0.0%) |
| $150,000 or more | 2 (2.0%) | 0 (0.0%) |
| Total | 102 (100.0%) | 27 (100.0%) |
Monthly Housing Cost Tiers in Monument
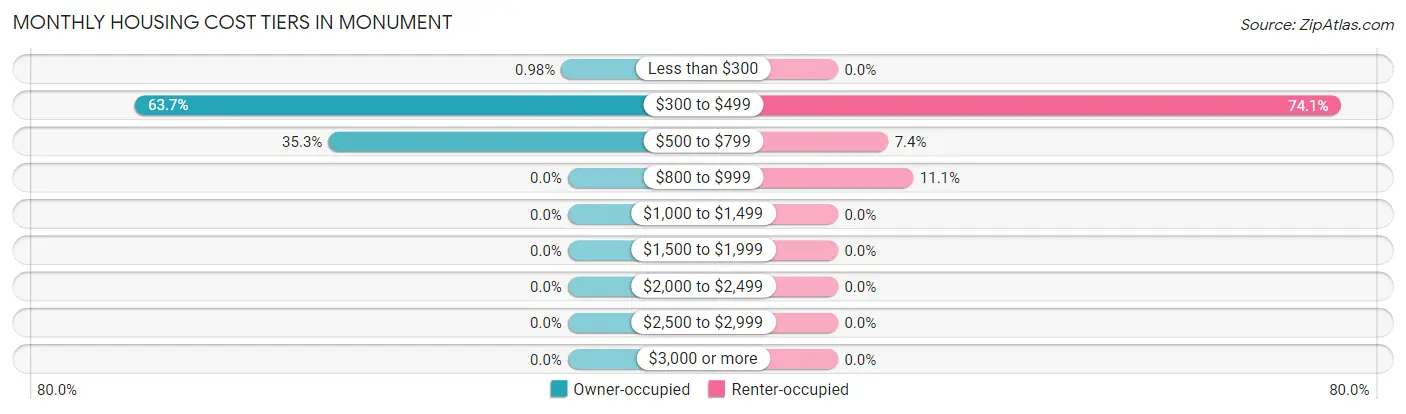
| Monthly Cost | Owner-occupied | Renter-occupied |
| Less than $300 | 1 (1.0%) | 0 (0.0%) |
| $300 to $499 | 65 (63.7%) | 20 (74.1%) |
| $500 to $799 | 36 (35.3%) | 2 (7.4%) |
| $800 to $999 | 0 (0.0%) | 3 (11.1%) |
| $1,000 to $1,499 | 0 (0.0%) | 0 (0.0%) |
| $1,500 to $1,999 | 0 (0.0%) | 0 (0.0%) |
| $2,000 to $2,499 | 0 (0.0%) | 0 (0.0%) |
| $2,500 to $2,999 | 0 (0.0%) | 0 (0.0%) |
| $3,000 or more | 0 (0.0%) | 0 (0.0%) |
| Total | 102 (100.0%) | 27 (100.0%) |
Physical Housing Characteristics in Monument
Housing Structures in Monument
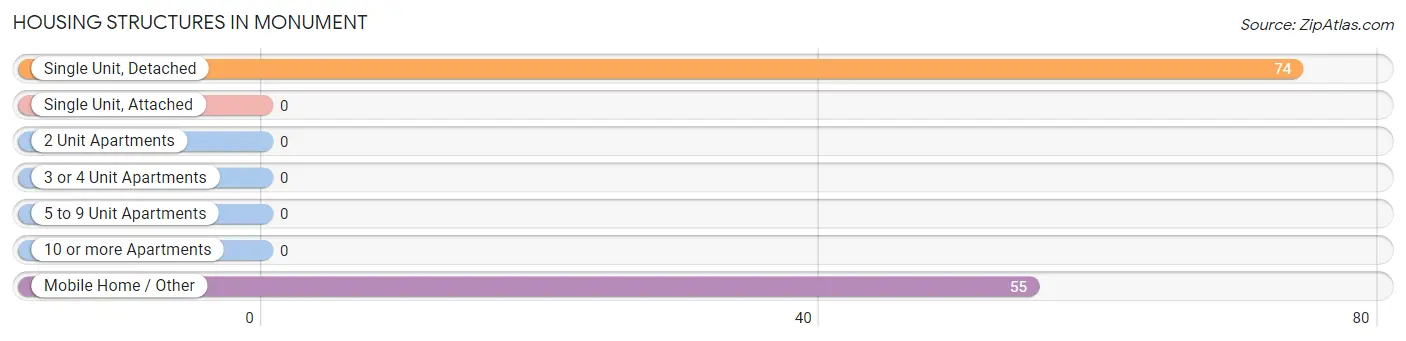
| Structure Type | # Housing Units | % Housing Units |
| Single Unit, Detached | 74 | 57.4% |
| Single Unit, Attached | 0 | 0.0% |
| 2 Unit Apartments | 0 | 0.0% |
| 3 or 4 Unit Apartments | 0 | 0.0% |
| 5 to 9 Unit Apartments | 0 | 0.0% |
| 10 or more Apartments | 0 | 0.0% |
| Mobile Home / Other | 55 | 42.6% |
| Total | 129 | 100.0% |
Housing Structures by Occupancy in Monument
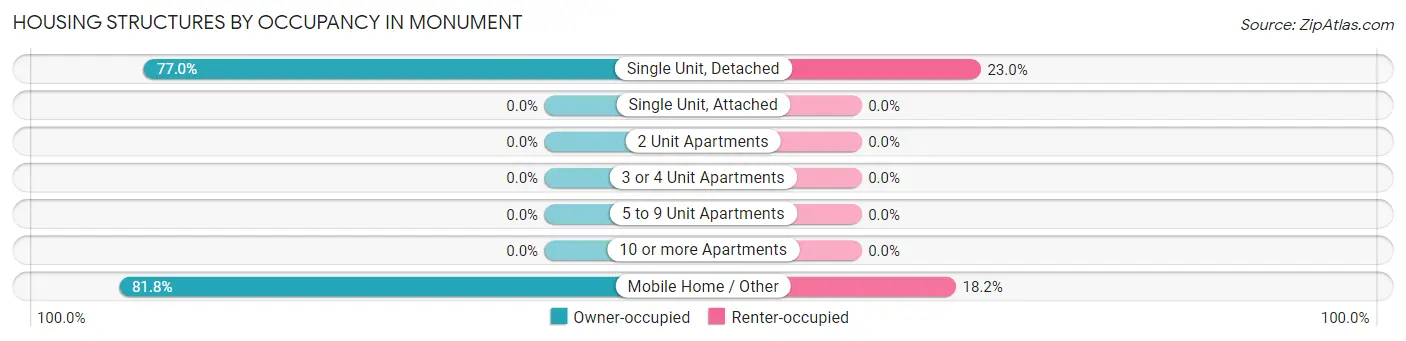
| Structure Type | Owner-occupied | Renter-occupied |
| Single Unit, Detached | 57 (77.0%) | 17 (23.0%) |
| Single Unit, Attached | 0 (0.0%) | 0 (0.0%) |
| 2 Unit Apartments | 0 (0.0%) | 0 (0.0%) |
| 3 or 4 Unit Apartments | 0 (0.0%) | 0 (0.0%) |
| 5 to 9 Unit Apartments | 0 (0.0%) | 0 (0.0%) |
| 10 or more Apartments | 0 (0.0%) | 0 (0.0%) |
| Mobile Home / Other | 45 (81.8%) | 10 (18.2%) |
| Total | 102 (79.1%) | 27 (20.9%) |
Housing Structures by Number of Rooms in Monument
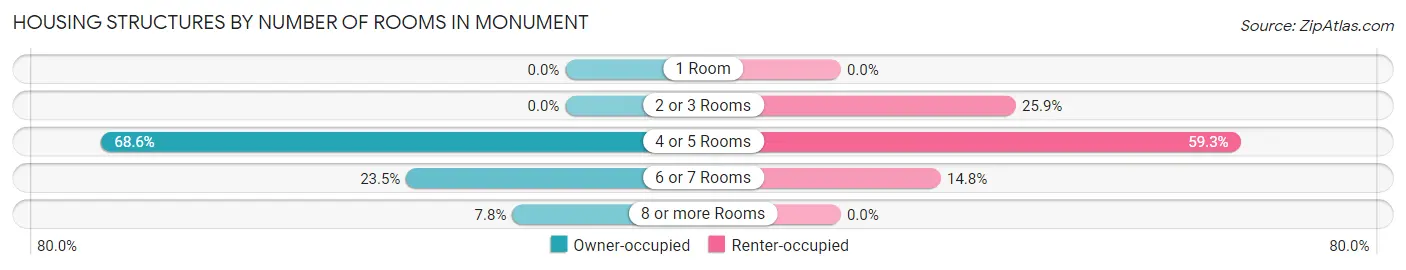
| Number of Rooms | Owner-occupied | Renter-occupied |
| 1 Room | 0 (0.0%) | 0 (0.0%) |
| 2 or 3 Rooms | 0 (0.0%) | 7 (25.9%) |
| 4 or 5 Rooms | 70 (68.6%) | 16 (59.3%) |
| 6 or 7 Rooms | 24 (23.5%) | 4 (14.8%) |
| 8 or more Rooms | 8 (7.8%) | 0 (0.0%) |
| Total | 102 (100.0%) | 27 (100.0%) |
Housing Structure by Heating Type in Monument
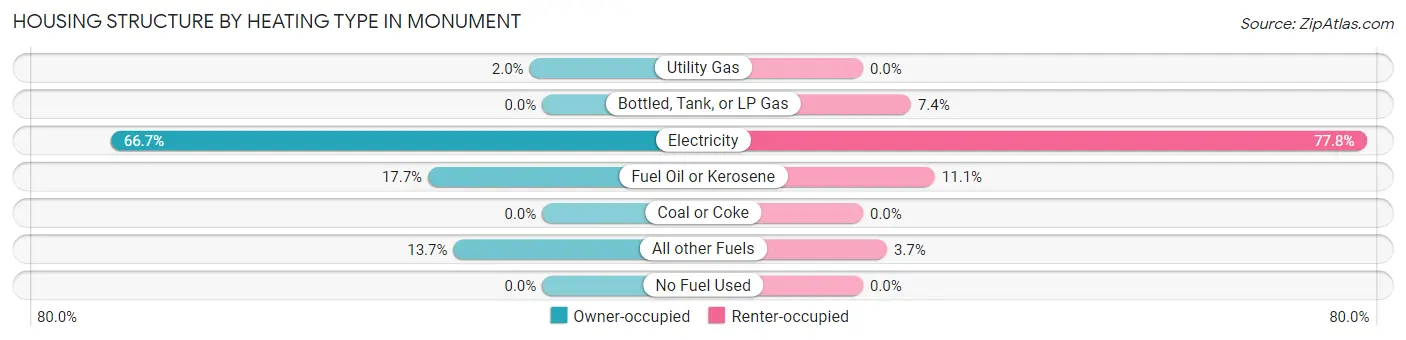
| Heating Type | Owner-occupied | Renter-occupied |
| Utility Gas | 2 (2.0%) | 0 (0.0%) |
| Bottled, Tank, or LP Gas | 0 (0.0%) | 2 (7.4%) |
| Electricity | 68 (66.7%) | 21 (77.8%) |
| Fuel Oil or Kerosene | 18 (17.6%) | 3 (11.1%) |
| Coal or Coke | 0 (0.0%) | 0 (0.0%) |
| All other Fuels | 14 (13.7%) | 1 (3.7%) |
| No Fuel Used | 0 (0.0%) | 0 (0.0%) |
| Total | 102 (100.0%) | 27 (100.0%) |
Household Vehicle Usage in Monument
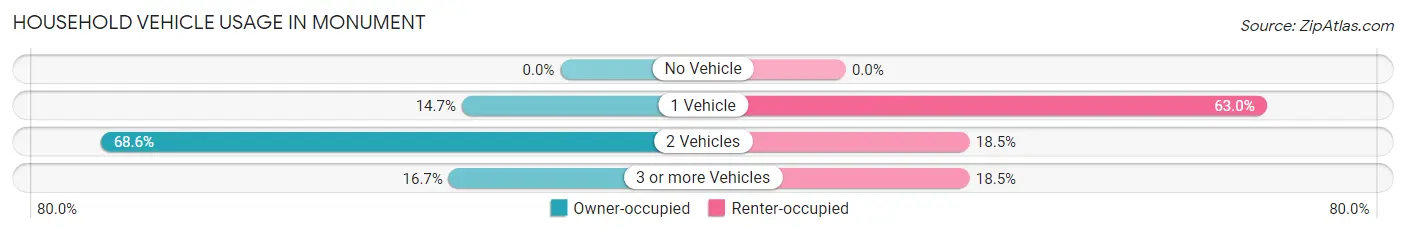
| Vehicles per Household | Owner-occupied | Renter-occupied |
| No Vehicle | 0 (0.0%) | 0 (0.0%) |
| 1 Vehicle | 15 (14.7%) | 17 (63.0%) |
| 2 Vehicles | 70 (68.6%) | 5 (18.5%) |
| 3 or more Vehicles | 17 (16.7%) | 5 (18.5%) |
| Total | 102 (100.0%) | 27 (100.0%) |
Real Estate & Mortgages in Monument
Real Estate and Mortgage Overview in Monument
| Characteristic | Without Mortgage | With Mortgage |
| Housing Units | 102 | 0 |
| Median Property Value | - | - |
| Median Household Income | $37,083 | $0 |
| Monthly Housing Costs | $390 | $0 |
| Real Estate Taxes | $886 | $0 |
Property Value by Mortgage Status in Monument
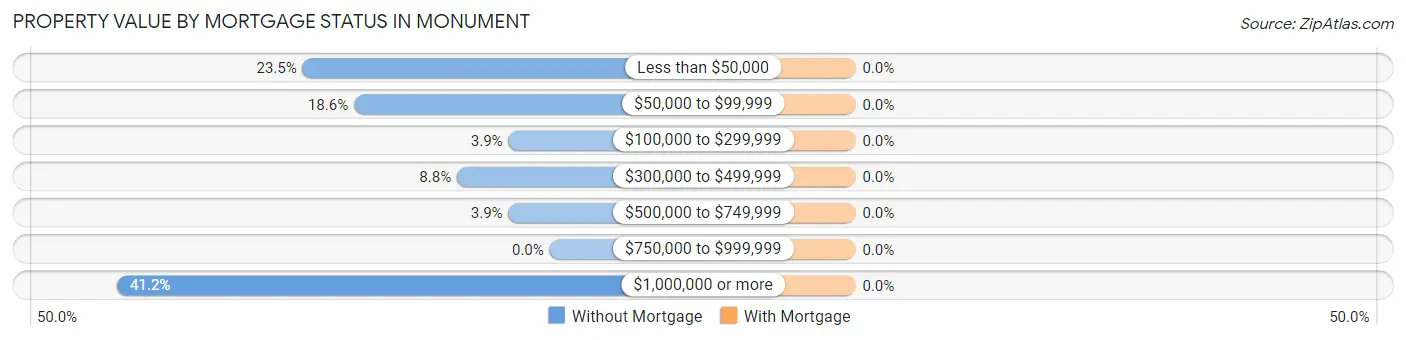
| Property Value | Without Mortgage | With Mortgage |
| Less than $50,000 | 24 (23.5%) | 0 (0.0%) |
| $50,000 to $99,999 | 19 (18.6%) | 0 (0.0%) |
| $100,000 to $299,999 | 4 (3.9%) | 0 (0.0%) |
| $300,000 to $499,999 | 9 (8.8%) | 0 (0.0%) |
| $500,000 to $749,999 | 4 (3.9%) | 0 (0.0%) |
| $750,000 to $999,999 | 0 (0.0%) | 0 (0.0%) |
| $1,000,000 or more | 42 (41.2%) | 0 (0.0%) |
| Total | 102 (100.0%) | 0 (0.0%) |
Household Income by Mortgage Status in Monument
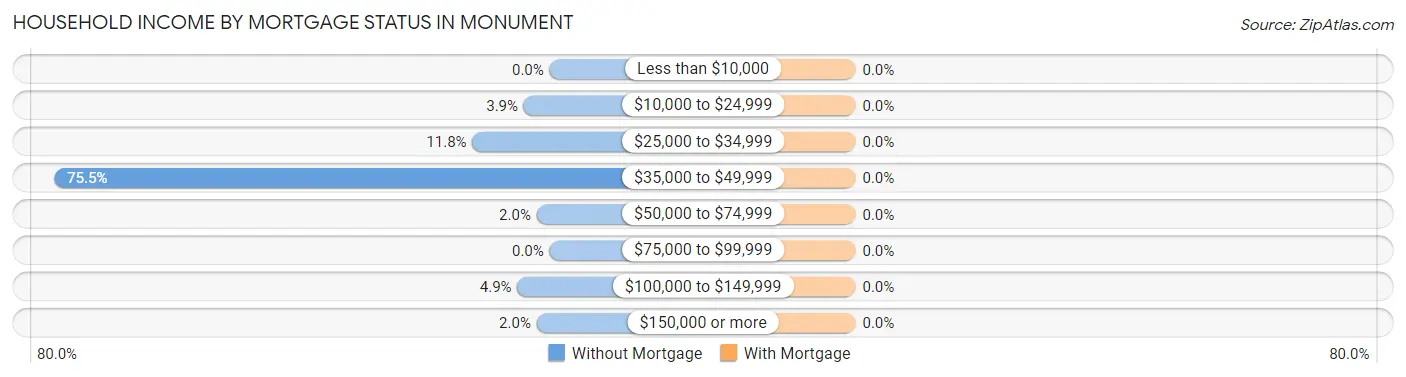
| Household Income | Without Mortgage | With Mortgage |
| Less than $10,000 | 0 (0.0%) | 0 (0.0%) |
| $10,000 to $24,999 | 4 (3.9%) | 0 (0.0%) |
| $25,000 to $34,999 | 12 (11.8%) | 0 (0.0%) |
| $35,000 to $49,999 | 77 (75.5%) | 0 (0.0%) |
| $50,000 to $74,999 | 2 (2.0%) | 0 (0.0%) |
| $75,000 to $99,999 | 0 (0.0%) | 0 (0.0%) |
| $100,000 to $149,999 | 5 (4.9%) | 0 (0.0%) |
| $150,000 or more | 2 (2.0%) | 0 (0.0%) |
| Total | 102 (100.0%) | 0 (0.0%) |
Property Value to Household Income Ratio in Monument
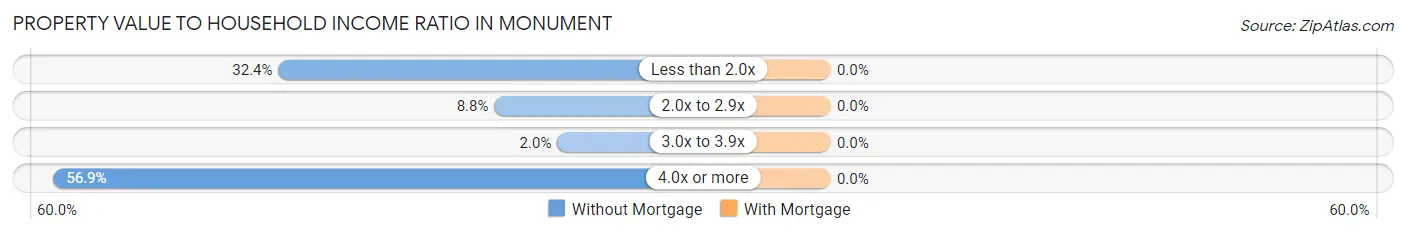
| Value-to-Income Ratio | Without Mortgage | With Mortgage |
| Less than 2.0x | 33 (32.4%) | 0 (0.0%) |
| 2.0x to 2.9x | 9 (8.8%) | 0 (0.0%) |
| 3.0x to 3.9x | 2 (2.0%) | 0 (0.0%) |
| 4.0x or more | 58 (56.9%) | 0 (0.0%) |
| Total | 102 (100.0%) | 0 (0.0%) |
Real Estate Taxes by Mortgage Status in Monument
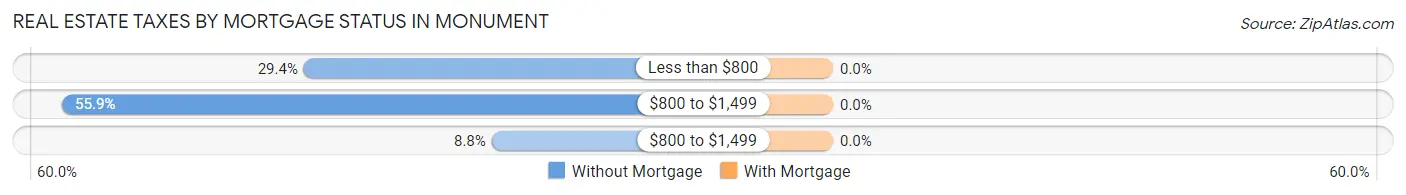
| Property Taxes | Without Mortgage | With Mortgage |
| Less than $800 | 30 (29.4%) | 0 (0.0%) |
| $800 to $1,499 | 57 (55.9%) | 0 (0.0%) |
| $800 to $1,499 | 9 (8.8%) | 0 (0.0%) |
| Total | 102 (100.0%) | 0 (0.0%) |
Health & Disability in Monument
Health Insurance Coverage by Age in Monument
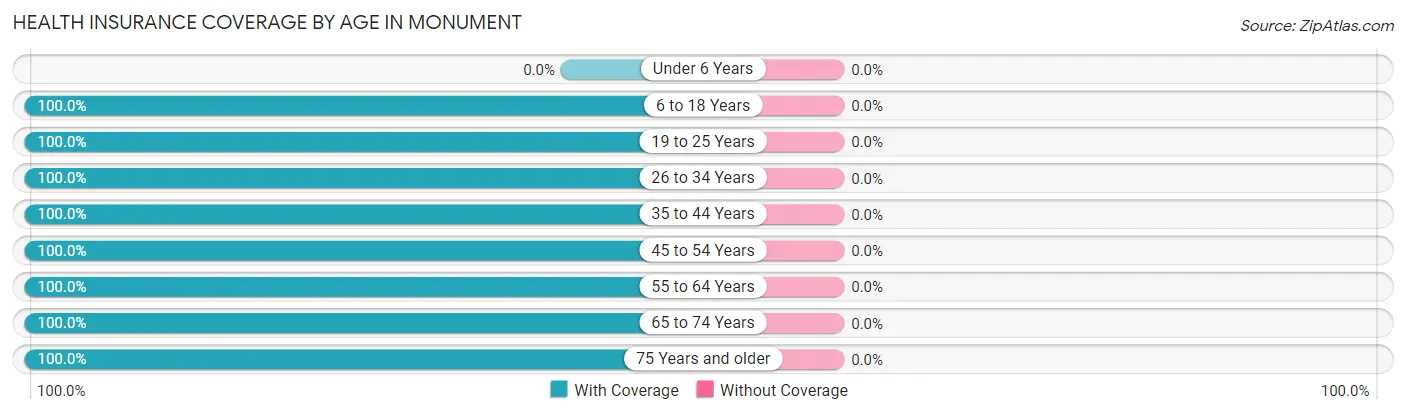
| Age Bracket | With Coverage | Without Coverage |
| Under 6 Years | 0 (0.0%) | 0 (0.0%) |
| 6 to 18 Years | 7 (100.0%) | 0 (0.0%) |
| 19 to 25 Years | 7 (100.0%) | 0 (0.0%) |
| 26 to 34 Years | 1 (100.0%) | 0 (0.0%) |
| 35 to 44 Years | 2 (100.0%) | 0 (0.0%) |
| 45 to 54 Years | 48 (100.0%) | 0 (0.0%) |
| 55 to 64 Years | 9 (100.0%) | 0 (0.0%) |
| 65 to 74 Years | 26 (100.0%) | 0 (0.0%) |
| 75 Years and older | 54 (100.0%) | 0 (0.0%) |
| Total | 154 (100.0%) | 0 (0.0%) |
Health Insurance Coverage by Citizenship Status in Monument
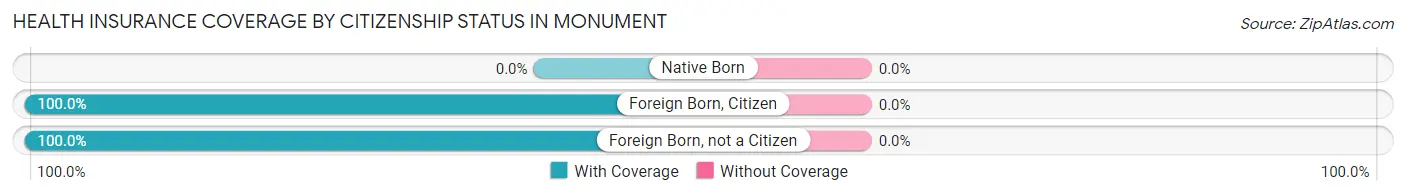
| Citizenship Status | With Coverage | Without Coverage |
| Native Born | 0 (0.0%) | 0 (0.0%) |
| Foreign Born, Citizen | 7 (100.0%) | 0 (0.0%) |
| Foreign Born, not a Citizen | 7 (100.0%) | 0 (0.0%) |
Health Insurance Coverage by Household Income in Monument
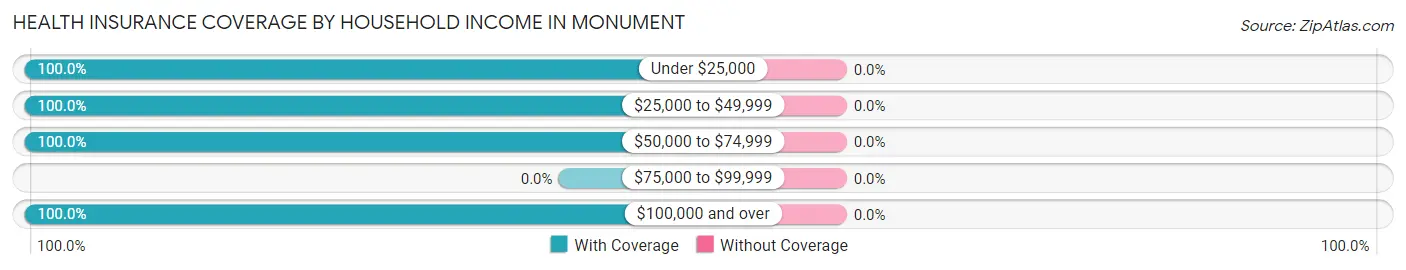
| Household Income | With Coverage | Without Coverage |
| Under $25,000 | 25 (100.0%) | 0 (0.0%) |
| $25,000 to $49,999 | 111 (100.0%) | 0 (0.0%) |
| $50,000 to $74,999 | 5 (100.0%) | 0 (0.0%) |
| $75,000 to $99,999 | 0 (0.0%) | 0 (0.0%) |
| $100,000 and over | 13 (100.0%) | 0 (0.0%) |
Public vs Private Health Insurance Coverage by Age in Monument
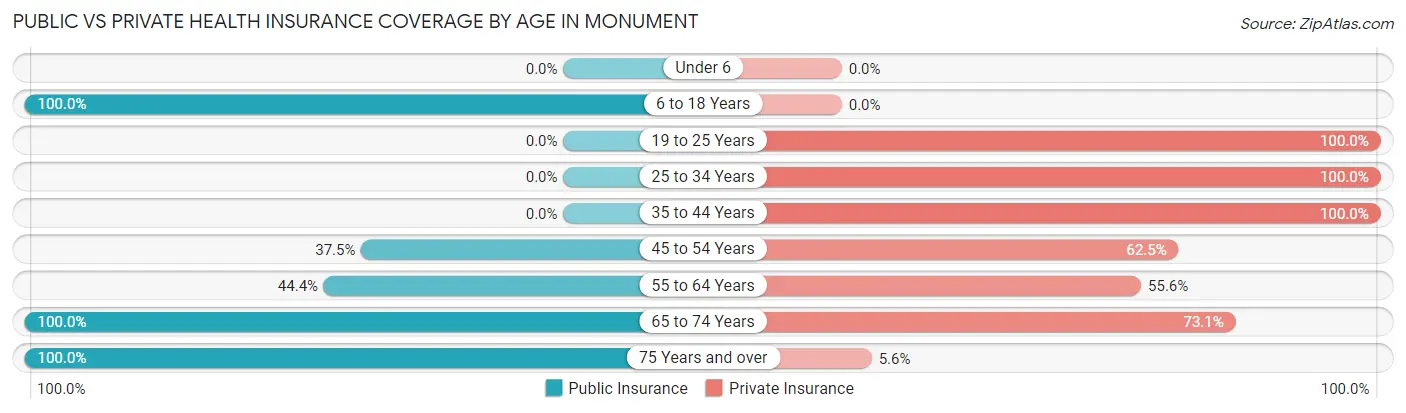
| Age Bracket | Public Insurance | Private Insurance |
| Under 6 | 0 (0.0%) | 0 (0.0%) |
| 6 to 18 Years | 7 (100.0%) | 0 (0.0%) |
| 19 to 25 Years | 0 (0.0%) | 7 (100.0%) |
| 25 to 34 Years | 0 (0.0%) | 1 (100.0%) |
| 35 to 44 Years | 0 (0.0%) | 2 (100.0%) |
| 45 to 54 Years | 18 (37.5%) | 30 (62.5%) |
| 55 to 64 Years | 4 (44.4%) | 5 (55.6%) |
| 65 to 74 Years | 26 (100.0%) | 19 (73.1%) |
| 75 Years and over | 54 (100.0%) | 3 (5.6%) |
| Total | 109 (70.8%) | 67 (43.5%) |
Disability Status by Sex by Age in Monument
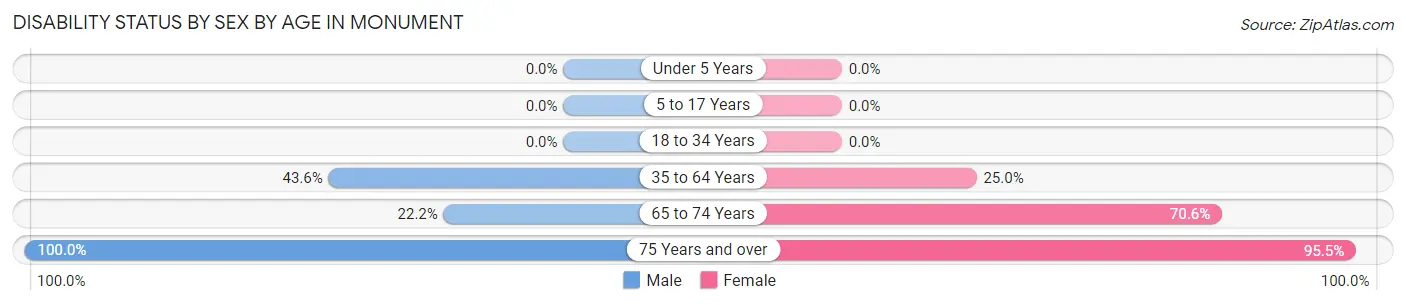
| Age Bracket | Male | Female |
| Under 5 Years | 0 (0.0%) | 0 (0.0%) |
| 5 to 17 Years | 0 (0.0%) | 0 (0.0%) |
| 18 to 34 Years | 0 (0.0%) | 0 (0.0%) |
| 35 to 64 Years | 17 (43.6%) | 5 (25.0%) |
| 65 to 74 Years | 2 (22.2%) | 12 (70.6%) |
| 75 Years and over | 10 (100.0%) | 42 (95.5%) |
Disability Class by Sex by Age in Monument
Disability Class: Hearing Difficulty
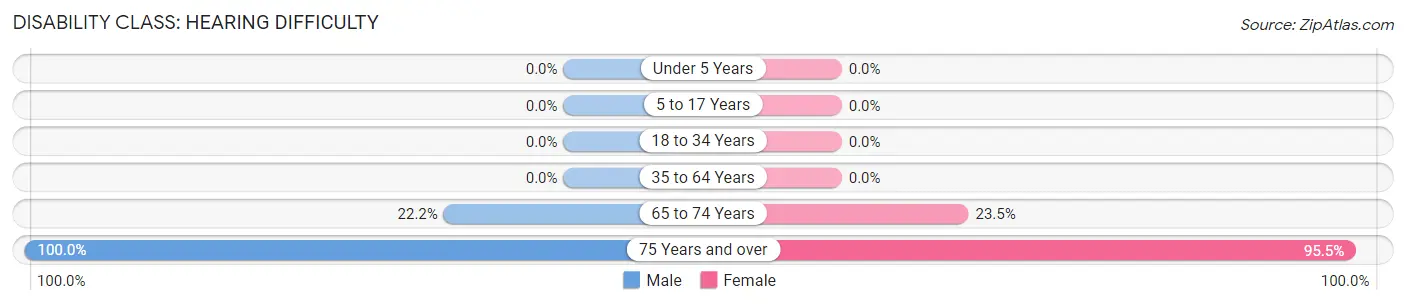
| Age Bracket | Male | Female |
| Under 5 Years | 0 (0.0%) | 0 (0.0%) |
| 5 to 17 Years | 0 (0.0%) | 0 (0.0%) |
| 18 to 34 Years | 0 (0.0%) | 0 (0.0%) |
| 35 to 64 Years | 0 (0.0%) | 0 (0.0%) |
| 65 to 74 Years | 2 (22.2%) | 4 (23.5%) |
| 75 Years and over | 10 (100.0%) | 42 (95.5%) |
Disability Class: Vision Difficulty
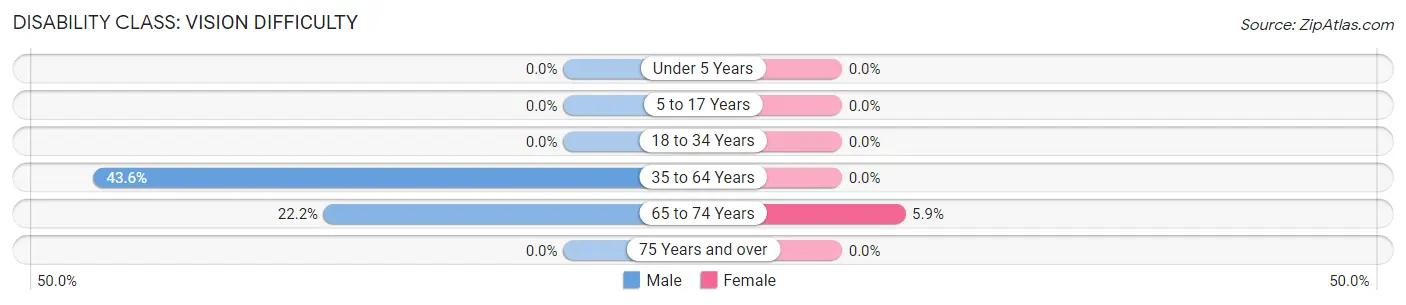
| Age Bracket | Male | Female |
| Under 5 Years | 0 (0.0%) | 0 (0.0%) |
| 5 to 17 Years | 0 (0.0%) | 0 (0.0%) |
| 18 to 34 Years | 0 (0.0%) | 0 (0.0%) |
| 35 to 64 Years | 17 (43.6%) | 0 (0.0%) |
| 65 to 74 Years | 2 (22.2%) | 1 (5.9%) |
| 75 Years and over | 0 (0.0%) | 0 (0.0%) |
Disability Class: Cognitive Difficulty
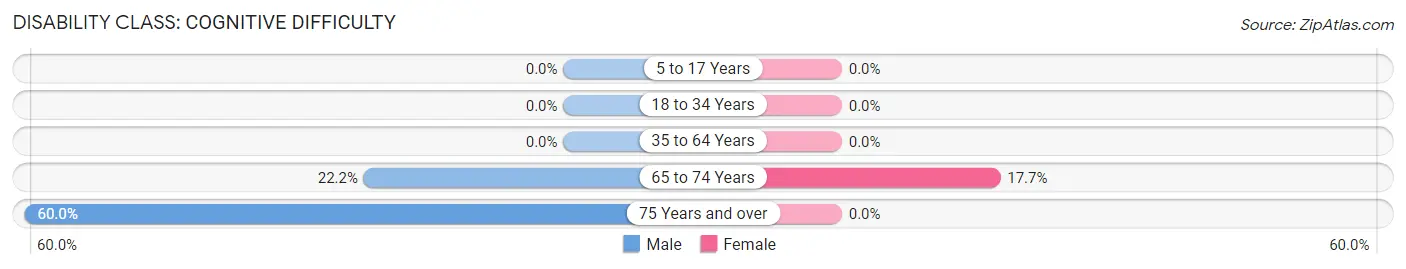
| Age Bracket | Male | Female |
| 5 to 17 Years | 0 (0.0%) | 0 (0.0%) |
| 18 to 34 Years | 0 (0.0%) | 0 (0.0%) |
| 35 to 64 Years | 0 (0.0%) | 0 (0.0%) |
| 65 to 74 Years | 2 (22.2%) | 3 (17.6%) |
| 75 Years and over | 6 (60.0%) | 0 (0.0%) |
Disability Class: Ambulatory Difficulty
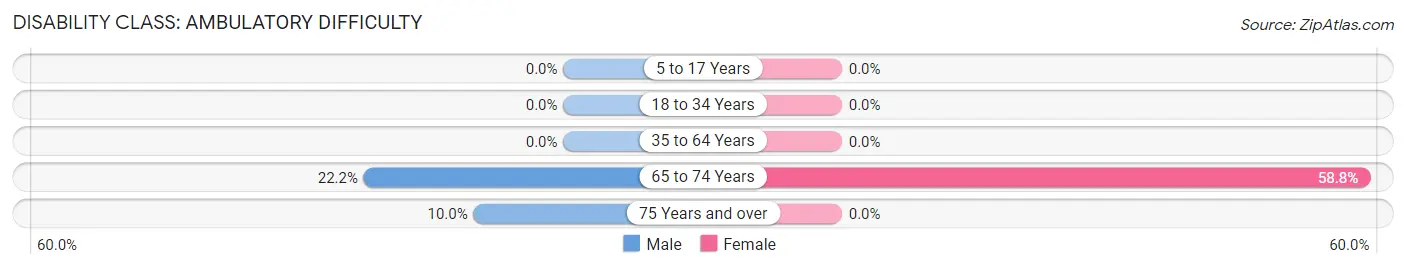
| Age Bracket | Male | Female |
| 5 to 17 Years | 0 (0.0%) | 0 (0.0%) |
| 18 to 34 Years | 0 (0.0%) | 0 (0.0%) |
| 35 to 64 Years | 0 (0.0%) | 0 (0.0%) |
| 65 to 74 Years | 2 (22.2%) | 10 (58.8%) |
| 75 Years and over | 1 (10.0%) | 0 (0.0%) |
Disability Class: Self-Care Difficulty
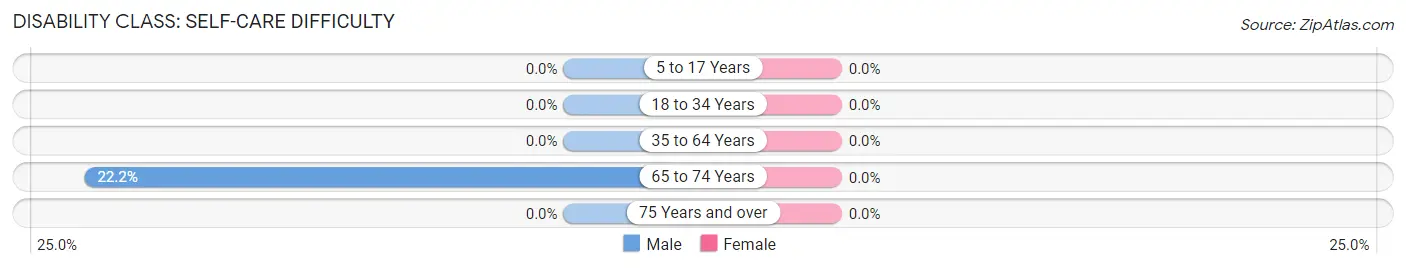
| Age Bracket | Male | Female |
| 5 to 17 Years | 0 (0.0%) | 0 (0.0%) |
| 18 to 34 Years | 0 (0.0%) | 0 (0.0%) |
| 35 to 64 Years | 0 (0.0%) | 0 (0.0%) |
| 65 to 74 Years | 2 (22.2%) | 0 (0.0%) |
| 75 Years and over | 0 (0.0%) | 0 (0.0%) |
Technology Access in Monument
Computing Device Access in Monument
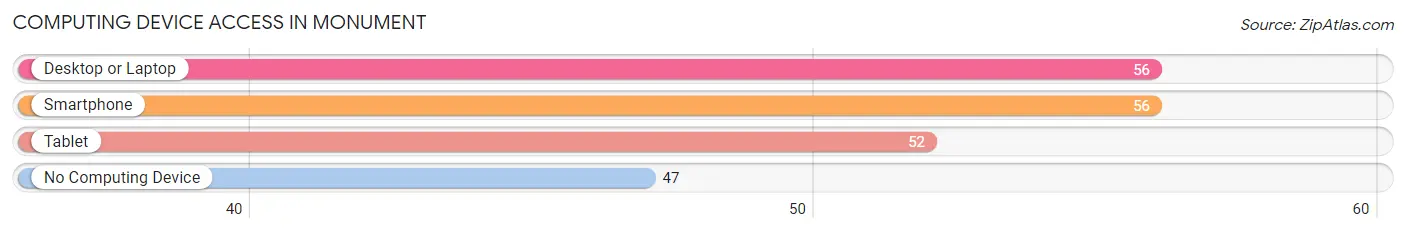
| Device Type | # Households | % Households |
| Desktop or Laptop | 56 | 43.4% |
| Smartphone | 56 | 43.4% |
| Tablet | 52 | 40.3% |
| No Computing Device | 47 | 36.4% |
| Total | 129 | 100.0% |
Internet Access in Monument
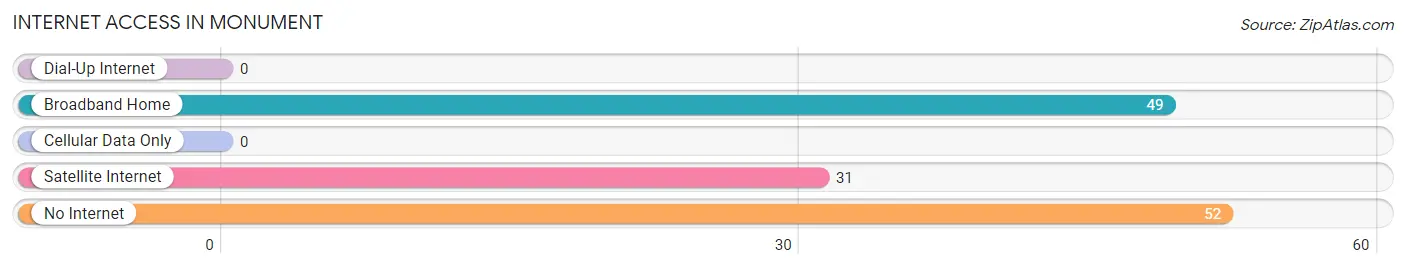
| Internet Type | # Households | % Households |
| Dial-Up Internet | 0 | 0.0% |
| Broadband Home | 49 | 38.0% |
| Cellular Data Only | 0 | 0.0% |
| Satellite Internet | 31 | 24.0% |
| No Internet | 52 | 40.3% |
| Total | 129 | 100.0% |
Monument Summary
Monument is a small town located in Grant County, Oregon, United States. It is situated in the Blue Mountains, at the confluence of the John Day and Deschutes Rivers. The town was founded in 1882 and incorporated in 1891. As of the 2010 census, the population of Monument was 545.
Geography
Monument is located at the intersection of the John Day and Deschutes Rivers, in the Blue Mountains of eastern Oregon. The town is situated at an elevation of 2,845 feet (867 m). The surrounding area is characterized by rolling hills, sagebrush, and juniper trees. The nearest major city is Pendleton, which is located about 40 miles (64 km) to the west.
Climate
Monument has a semi-arid climate, with hot summers and cold winters. The average high temperature in July is 90°F (32°C), and the average low temperature in January is 22°F (-6°C). The average annual precipitation is 11.5 inches (29 cm).
History
Monument was founded in 1882 by a group of settlers from the nearby town of John Day. The town was named after a nearby rock formation, which was said to resemble a monument. The town was incorporated in 1891.
In the early 1900s, Monument was a thriving community, with a population of over 1,000. The town was home to several businesses, including a hotel, a bank, a general store, and a sawmill.
Economy
Today, Monument’s economy is largely based on agriculture and tourism. The town is home to several farms, which produce hay, wheat, and other crops. The nearby John Day River is a popular destination for fishing and rafting.
Demographics
As of the 2010 census, the population of Monument was 545. The racial makeup of the town was 94.2% White, 0.2% African American, 0.7% Native American, 0.2% Asian, 0.2% Pacific Islander, 0.7% from other races, and 3.8% from two or more races. Hispanic or Latino of any race were 2.2% of the population.
The median household income in Monument was $35,000, and the median family income was $41,000. The per capita income was $17,000. About 11.2% of families and 14.2% of the population were below the poverty line.
Monument is served by the Grant County School District. The town is home to Monument Elementary School, which serves students in grades K-8. High school students attend Grant Union High School in nearby John Day.
Monument is home to several churches, including the First Baptist Church, the Church of Jesus Christ of Latter-day Saints, and the United Methodist Church. The town also has a public library, a post office, and a volunteer fire department.
Conclusion
Monument is a small town located in Grant County, Oregon. It is situated in the Blue Mountains, at the confluence of the John Day and Deschutes Rivers. The town was founded in 1882 and incorporated in 1891. Today, Monument’s economy is largely based on agriculture and tourism. As of the 2010 census, the population of Monument was 545. The town is home to several churches, a public library, a post office, and a volunteer fire department.
Common Questions
What is Per Capita Income in Monument?
Per Capita income in Monument is $35,173.
What is the Median Household income in Monument?
Median Household Income in Monument is $36,675.
What is Inequality or Gini Index in Monument?
Inequality or Gini Index in Monument is 0.27.
What is the Total Population of Monument?
Total Population of Monument is 154.
What is the Total Male Population of Monument?
Total Male Population of Monument is 72.
What is the Total Female Population of Monument?
Total Female Population of Monument is 82.
What is the Ratio of Males per 100 Females in Monument?
There are 87.80 Males per 100 Females in Monument.
What is the Ratio of Females per 100 Males in Monument?
There are 113.89 Females per 100 Males in Monument.
What is the Median Population Age in Monument?
Median Population Age in Monument is 66.4 Years.
What is the Average Family Size in Monument
Average Family Size in Monument is 2.0 People.
What is the Average Household Size in Monument
Average Household Size in Monument is 1.2 People.
How Large is the Labor Force in Monument?
There are 66 People in the Labor Forcein in Monument.
What is the Percentage of People in the Labor Force in Monument?
44.9% of People are in the Labor Force in Monument.
What is the Unemployment Rate in Monument?
Unemployment Rate in Monument is 7.6%.