Monmouth, OR Map & Demographics
Monmouth Map
Monmouth Overview
$25,277
PER CAPITA INCOME
$77,933
AVG FAMILY INCOME
$61,282
AVG HOUSEHOLD INCOME
39.5%
WAGE / INCOME GAP [ % ]
60.5¢/ $1
WAGE / INCOME GAP [ $ ]
0.45
INEQUALITY / GINI INDEX
11,054
TOTAL POPULATION
5,530
MALE POPULATION
5,524
FEMALE POPULATION
100.11
MALES / 100 FEMALES
99.89
FEMALES / 100 MALES
25.2
MEDIAN AGE
3.5
AVG FAMILY SIZE
2.9
AVG HOUSEHOLD SIZE
5,496
LABOR FORCE [ PEOPLE ]
61.3%
PERCENT IN LABOR FORCE
4.9%
UNEMPLOYMENT RATE
Monmouth Zip Codes
Income in Monmouth
Income Overview in Monmouth
Per Capita Income in Monmouth is $25,277, while median incomes of families and households are $77,933 and $61,282 respectively.
| Characteristic | Number | Measure |
| Per Capita Income | 11,054 | $25,277 |
| Median Family Income | 2,137 | $77,933 |
| Mean Family Income | 2,137 | $89,748 |
| Median Household Income | 3,356 | $61,282 |
| Mean Household Income | 3,356 | $76,072 |
| Income Deficit | 2,137 | $0 |
| Wage / Income Gap (%) | 11,054 | 39.55% |
| Wage / Income Gap ($) | 11,054 | 60.45¢ per $1 |
| Gini / Inequality Index | 11,054 | 0.45 |
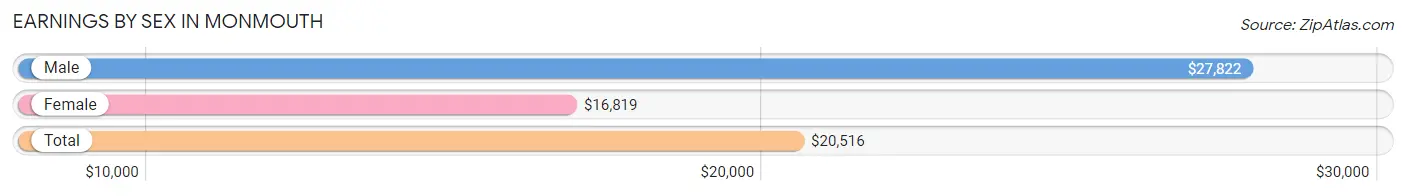
Earnings by Sex in Monmouth
Average Earnings in Monmouth are $20,516, $27,822 for men and $16,819 for women, a difference of 39.6%.
| Sex | Number | Average Earnings |
| Male | 3,067 (47.9%) | $27,822 |
| Female | 3,333 (52.1%) | $16,819 |
| Total | 6,400 (100.0%) | $20,516 |
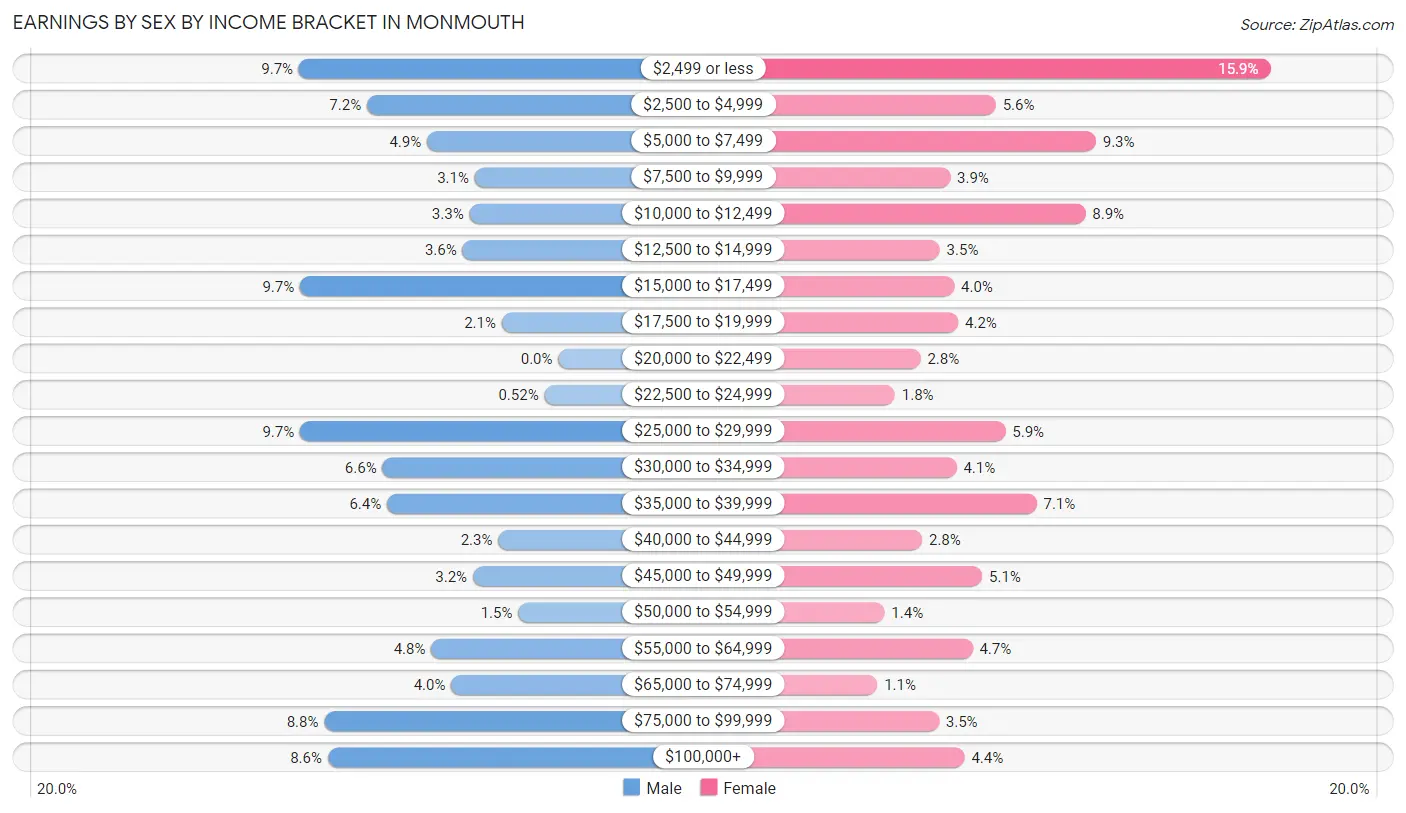
Earnings by Sex by Income Bracket in Monmouth
The most common earnings brackets in Monmouth are $2,499 or less for men (298 | 9.7%) and $2,499 or less for women (529 | 15.9%).
| Income | Male | Female |
| $2,499 or less | 298 (9.7%) | 529 (15.9%) |
| $2,500 to $4,999 | 220 (7.2%) | 186 (5.6%) |
| $5,000 to $7,499 | 151 (4.9%) | 311 (9.3%) |
| $7,500 to $9,999 | 96 (3.1%) | 129 (3.9%) |
| $10,000 to $12,499 | 102 (3.3%) | 298 (8.9%) |
| $12,500 to $14,999 | 110 (3.6%) | 116 (3.5%) |
| $15,000 to $17,499 | 297 (9.7%) | 134 (4.0%) |
| $17,500 to $19,999 | 65 (2.1%) | 139 (4.2%) |
| $20,000 to $22,499 | 0 (0.0%) | 92 (2.8%) |
| $22,500 to $24,999 | 16 (0.5%) | 60 (1.8%) |
| $25,000 to $29,999 | 297 (9.7%) | 198 (5.9%) |
| $30,000 to $34,999 | 202 (6.6%) | 137 (4.1%) |
| $35,000 to $39,999 | 197 (6.4%) | 237 (7.1%) |
| $40,000 to $44,999 | 69 (2.2%) | 94 (2.8%) |
| $45,000 to $49,999 | 98 (3.2%) | 169 (5.1%) |
| $50,000 to $54,999 | 46 (1.5%) | 47 (1.4%) |
| $55,000 to $64,999 | 146 (4.8%) | 157 (4.7%) |
| $65,000 to $74,999 | 123 (4.0%) | 38 (1.1%) |
| $75,000 to $99,999 | 269 (8.8%) | 115 (3.5%) |
| $100,000+ | 265 (8.6%) | 147 (4.4%) |
| Total | 3,067 (100.0%) | 3,333 (100.0%) |
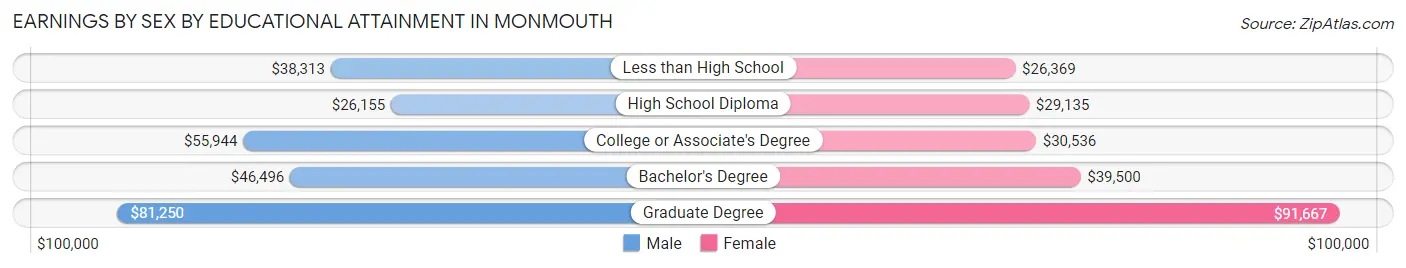
Earnings by Sex by Educational Attainment in Monmouth
Average earnings in Monmouth are $38,481 for men and $36,899 for women, a difference of 4.1%. Men with an educational attainment of graduate degree enjoy the highest average annual earnings of $81,250, while those with high school diploma education earn the least with $26,155. Women with an educational attainment of graduate degree earn the most with the average annual earnings of $91,667, while those with less than high school education have the smallest earnings of $26,369.
| Educational Attainment | Male Income | Female Income |
| Less than High School | $38,313 | $26,369 |
| High School Diploma | $26,155 | $29,135 |
| College or Associate's Degree | $55,944 | $30,536 |
| Bachelor's Degree | $46,496 | $39,500 |
| Graduate Degree | $81,250 | $91,667 |
| Total | $38,481 | $36,899 |
Family Income in Monmouth
Family Income Brackets in Monmouth
According to the Monmouth family income data, there are 553 families falling into the $50,000 to $74,999 income range, which is the most common income bracket and makes up 25.9% of all families.
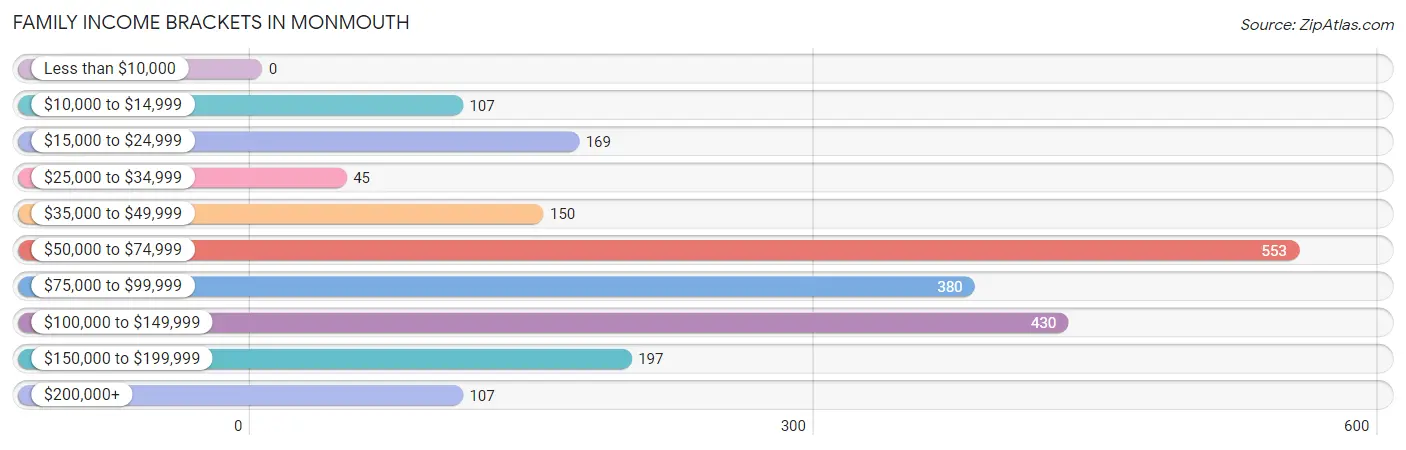
| Income Bracket | # Families | % Families |
| Less than $10,000 | 0 | 0.0% |
| $10,000 to $14,999 | 107 | 5.0% |
| $15,000 to $24,999 | 169 | 7.9% |
| $25,000 to $34,999 | 45 | 2.1% |
| $35,000 to $49,999 | 150 | 7.0% |
| $50,000 to $74,999 | 553 | 25.9% |
| $75,000 to $99,999 | 380 | 17.8% |
| $100,000 to $149,999 | 430 | 20.1% |
| $150,000 to $199,999 | 197 | 9.2% |
| $200,000+ | 107 | 5.0% |
Family Income by Famaliy Size in Monmouth
4-person families (438 | 20.5%) account for the highest median family income in Monmouth with $115,096 per family, while 2-person families (843 | 39.5%) have the highest median income of $31,709 per family member.
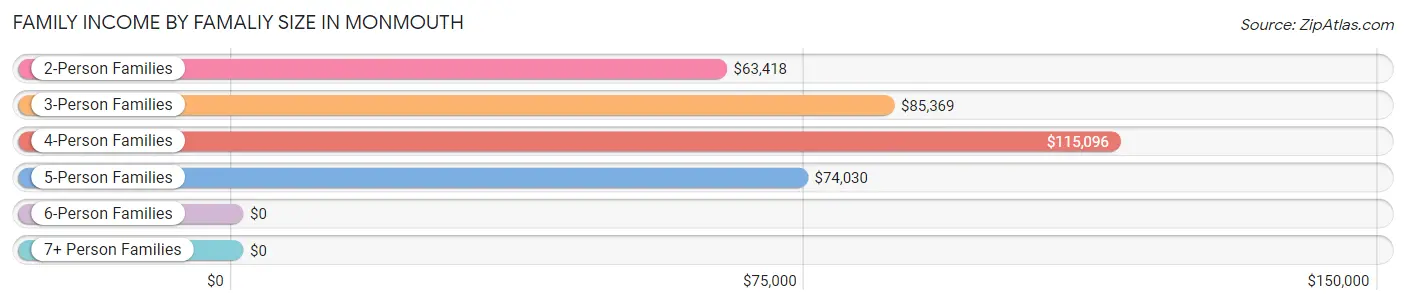
| Income Bracket | # Families | Median Income |
| 2-Person Families | 843 (39.5%) | $63,418 |
| 3-Person Families | 575 (26.9%) | $85,369 |
| 4-Person Families | 438 (20.5%) | $115,096 |
| 5-Person Families | 113 (5.3%) | $74,030 |
| 6-Person Families | 17 (0.8%) | $0 |
| 7+ Person Families | 151 (7.1%) | $0 |
| Total | 2,137 (100.0%) | $77,933 |
Family Income by Number of Earners in Monmouth
The median family income in Monmouth is $77,933, with families comprising 3+ earners (392) having the highest median family income of $135,600, while families with 1 earner (750) have the lowest median family income of $56,823, accounting for 18.3% and 35.1% of families, respectively.
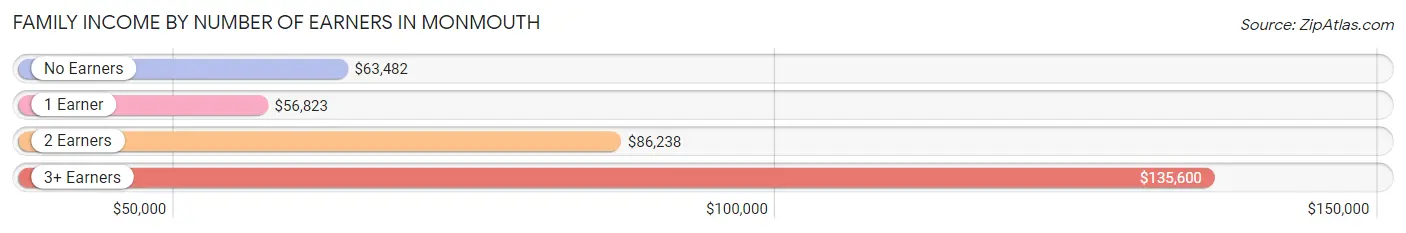
| Number of Earners | # Families | Median Income |
| No Earners | 231 (10.8%) | $63,482 |
| 1 Earner | 750 (35.1%) | $56,823 |
| 2 Earners | 764 (35.7%) | $86,238 |
| 3+ Earners | 392 (18.3%) | $135,600 |
| Total | 2,137 (100.0%) | $77,933 |
Household Income in Monmouth
Household Income Brackets in Monmouth
With 644 households falling in the category, the $50,000 to $74,999 income range is the most frequent in Monmouth, accounting for 19.2% of all households. In contrast, only 175 households (5.2%) fall into the $200,000+ income bracket, making it the least populous group.
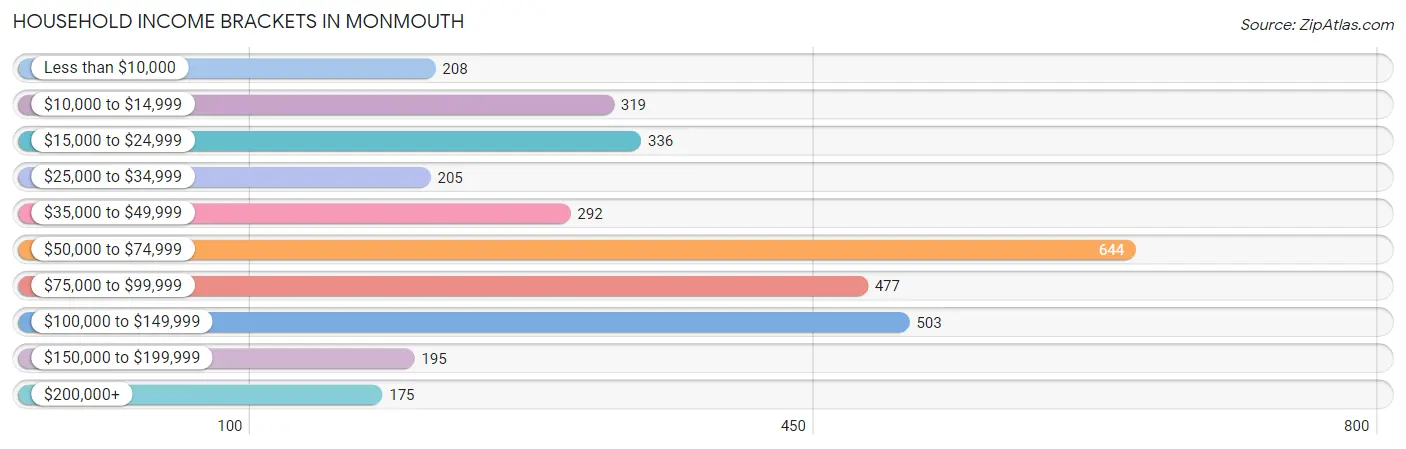
| Income Bracket | # Households | % Households |
| Less than $10,000 | 208 | 6.2% |
| $10,000 to $14,999 | 319 | 9.5% |
| $15,000 to $24,999 | 336 | 10.0% |
| $25,000 to $34,999 | 205 | 6.1% |
| $35,000 to $49,999 | 292 | 8.7% |
| $50,000 to $74,999 | 644 | 19.2% |
| $75,000 to $99,999 | 477 | 14.2% |
| $100,000 to $149,999 | 503 | 15.0% |
| $150,000 to $199,999 | 195 | 5.8% |
| $200,000+ | 175 | 5.2% |
Household Income by Householder Age in Monmouth
The median household income in Monmouth is $61,282, with the highest median household income of $86,905 found in the 45 to 64 years age bracket for the primary householder. A total of 968 households (28.8%) fall into this category. Meanwhile, the 15 to 24 years age bracket for the primary householder has the lowest median household income of $25,145, with 620 households (18.5%) in this group.
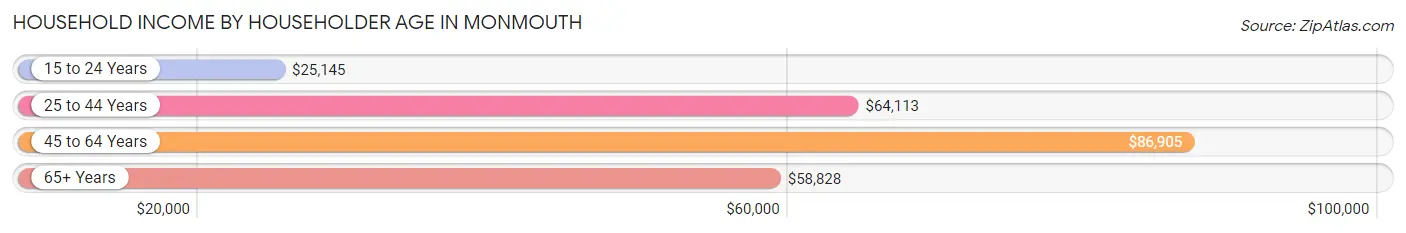
| Income Bracket | # Households | Median Income |
| 15 to 24 Years | 620 (18.5%) | $25,145 |
| 25 to 44 Years | 1,148 (34.2%) | $64,113 |
| 45 to 64 Years | 968 (28.8%) | $86,905 |
| 65+ Years | 620 (18.5%) | $58,828 |
| Total | 3,356 (100.0%) | $61,282 |
Poverty in Monmouth
Income Below Poverty by Sex and Age in Monmouth
With 20.3% poverty level for males and 21.9% for females among the residents of Monmouth, under 5 year old males and 18 to 24 year old females are the most vulnerable to poverty, with 103 males (45.8%) and 447 females (47.5%) in their respective age groups living below the poverty level.
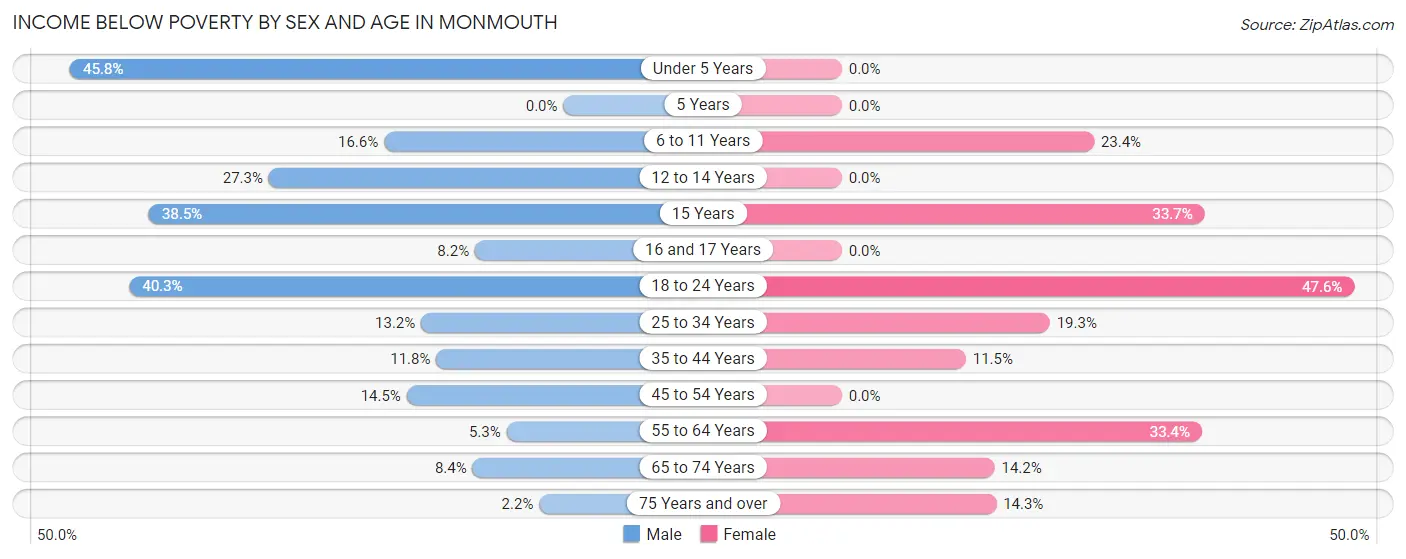
| Age Bracket | Male | Female |
| Under 5 Years | 103 (45.8%) | 0 (0.0%) |
| 5 Years | 0 (0.0%) | 0 (0.0%) |
| 6 to 11 Years | 109 (16.6%) | 95 (23.4%) |
| 12 to 14 Years | 73 (27.3%) | 0 (0.0%) |
| 15 Years | 15 (38.5%) | 34 (33.7%) |
| 16 and 17 Years | 10 (8.2%) | 0 (0.0%) |
| 18 to 24 Years | 466 (40.3%) | 447 (47.5%) |
| 25 to 34 Years | 108 (13.2%) | 161 (19.3%) |
| 35 to 44 Years | 46 (11.8%) | 55 (11.5%) |
| 45 to 54 Years | 74 (14.5%) | 0 (0.0%) |
| 55 to 64 Years | 26 (5.3%) | 151 (33.4%) |
| 65 to 74 Years | 15 (8.4%) | 40 (14.2%) |
| 75 Years and over | 6 (2.2%) | 46 (14.3%) |
| Total | 1,051 (20.3%) | 1,029 (21.9%) |
Income Above Poverty by Sex and Age in Monmouth
According to the poverty statistics in Monmouth, males aged 5 years and females aged under 5 years are the age groups that are most secure financially, with 100.0% of males and 100.0% of females in these age groups living above the poverty line.
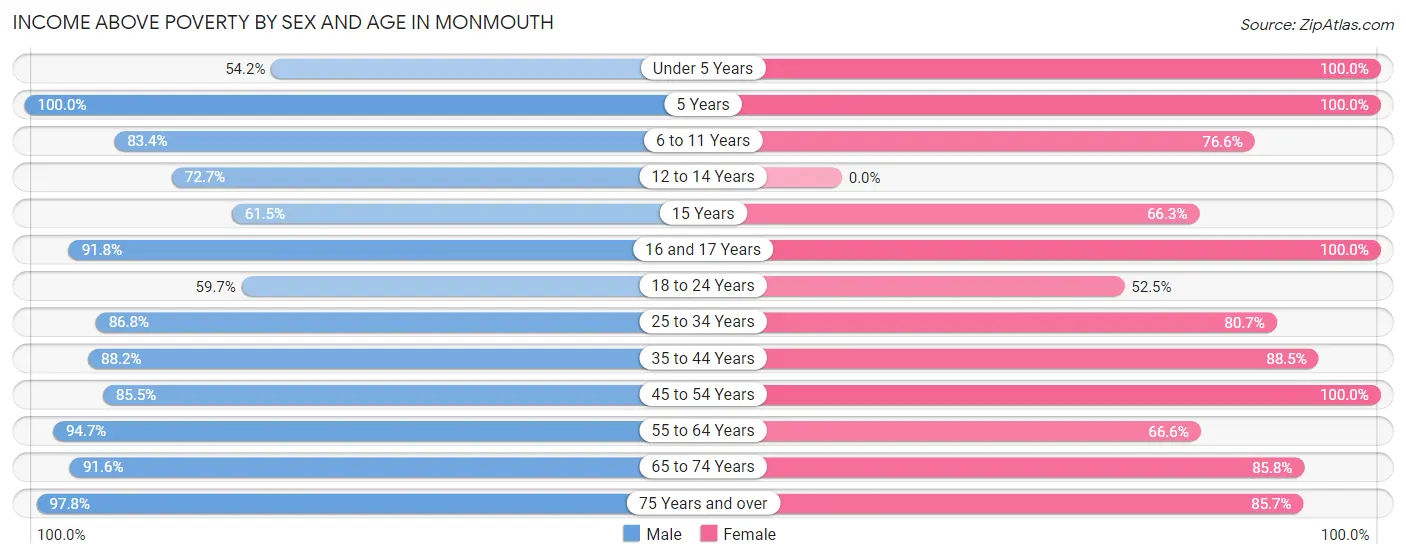
| Age Bracket | Male | Female |
| Under 5 Years | 122 (54.2%) | 203 (100.0%) |
| 5 Years | 51 (100.0%) | 70 (100.0%) |
| 6 to 11 Years | 546 (83.4%) | 311 (76.6%) |
| 12 to 14 Years | 194 (72.7%) | 0 (0.0%) |
| 15 Years | 24 (61.5%) | 67 (66.3%) |
| 16 and 17 Years | 112 (91.8%) | 179 (100.0%) |
| 18 to 24 Years | 691 (59.7%) | 493 (52.4%) |
| 25 to 34 Years | 710 (86.8%) | 673 (80.7%) |
| 35 to 44 Years | 344 (88.2%) | 423 (88.5%) |
| 45 to 54 Years | 435 (85.5%) | 435 (100.0%) |
| 55 to 64 Years | 467 (94.7%) | 301 (66.6%) |
| 65 to 74 Years | 163 (91.6%) | 242 (85.8%) |
| 75 Years and over | 262 (97.8%) | 275 (85.7%) |
| Total | 4,121 (79.7%) | 3,672 (78.1%) |
Income Below Poverty Among Married-Couple Families in Monmouth
The poverty statistics for married-couple families in Monmouth show that 1.9% or 29 of the total 1,517 families live below the poverty line. Families with 1 or 2 children have the highest poverty rate of 3.7%, comprising of 20 families. On the other hand, families with 3 or 4 children have the lowest poverty rate of 0.0%, which includes 0 families.
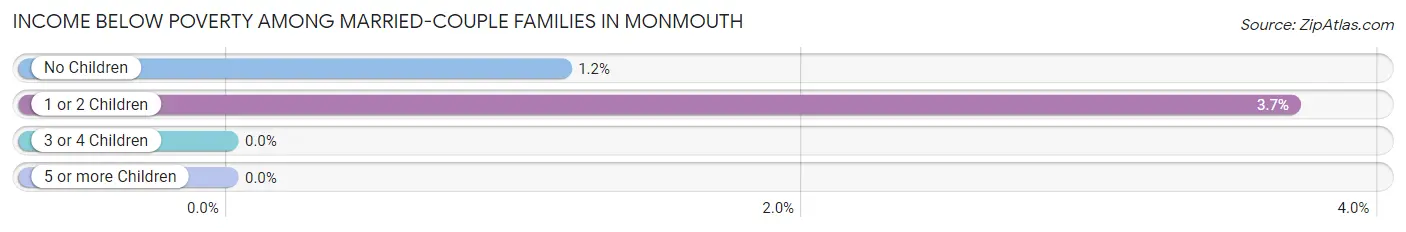
| Children | Above Poverty | Below Poverty |
| No Children | 770 (98.8%) | 9 (1.2%) |
| 1 or 2 Children | 521 (96.3%) | 20 (3.7%) |
| 3 or 4 Children | 191 (100.0%) | 0 (0.0%) |
| 5 or more Children | 6 (100.0%) | 0 (0.0%) |
| Total | 1,488 (98.1%) | 29 (1.9%) |
Income Below Poverty Among Single-Parent Households in Monmouth
According to the poverty data in Monmouth, 45.9% or 73 single-father households and 23.6% or 109 single-mother households are living below the poverty line. Among single-father households, those with 1 or 2 children have the highest poverty rate, with 73 households (70.9%) experiencing poverty. Likewise, among single-mother households, those with 1 or 2 children have the highest poverty rate, with 109 households (76.8%) falling below the poverty line.
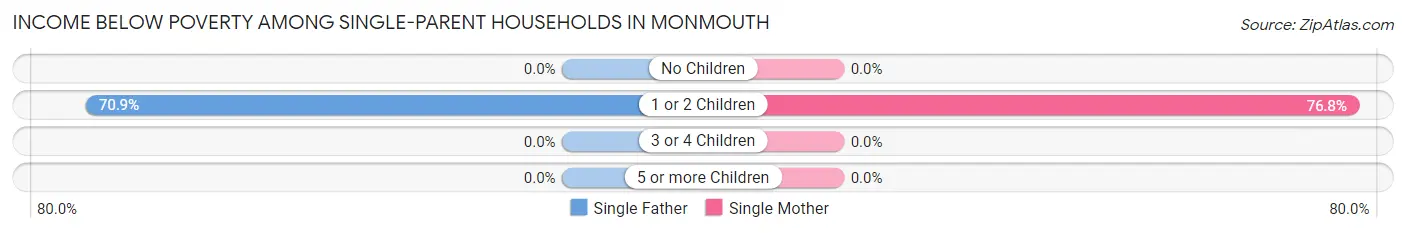
| Children | Single Father | Single Mother |
| No Children | 0 (0.0%) | 0 (0.0%) |
| 1 or 2 Children | 73 (70.9%) | 109 (76.8%) |
| 3 or 4 Children | 0 (0.0%) | 0 (0.0%) |
| 5 or more Children | 0 (0.0%) | 0 (0.0%) |
| Total | 73 (45.9%) | 109 (23.6%) |
Income Below Poverty Among Married-Couple vs Single-Parent Households in Monmouth
The poverty data for Monmouth shows that 29 of the married-couple family households (1.9%) and 182 of the single-parent households (29.3%) are living below the poverty level. Within the married-couple family households, those with 1 or 2 children have the highest poverty rate, with 20 households (3.7%) falling below the poverty line. Among the single-parent households, those with 1 or 2 children have the highest poverty rate, with 182 household (74.3%) living below poverty.
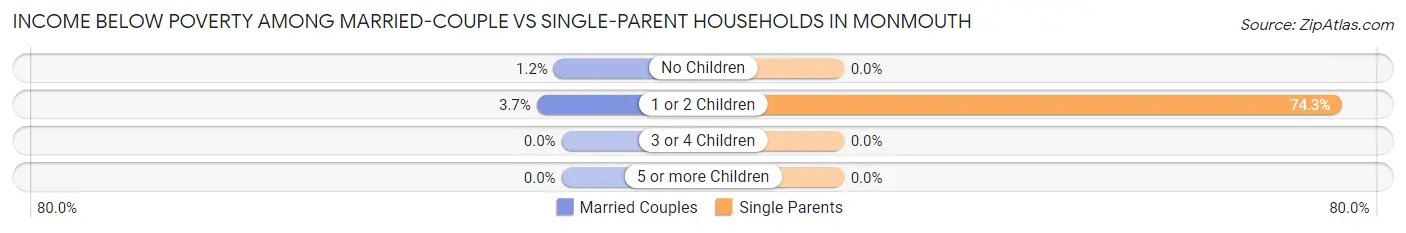
| Children | Married-Couple Families | Single-Parent Households |
| No Children | 9 (1.2%) | 0 (0.0%) |
| 1 or 2 Children | 20 (3.7%) | 182 (74.3%) |
| 3 or 4 Children | 0 (0.0%) | 0 (0.0%) |
| 5 or more Children | 0 (0.0%) | 0 (0.0%) |
| Total | 29 (1.9%) | 182 (29.3%) |
Race in Monmouth
The most populous races in Monmouth are White / Caucasian (8,619 | 78.0%), Hispanic or Latino (1,962 | 17.7%), and Two or more Races (1,385 | 12.5%).
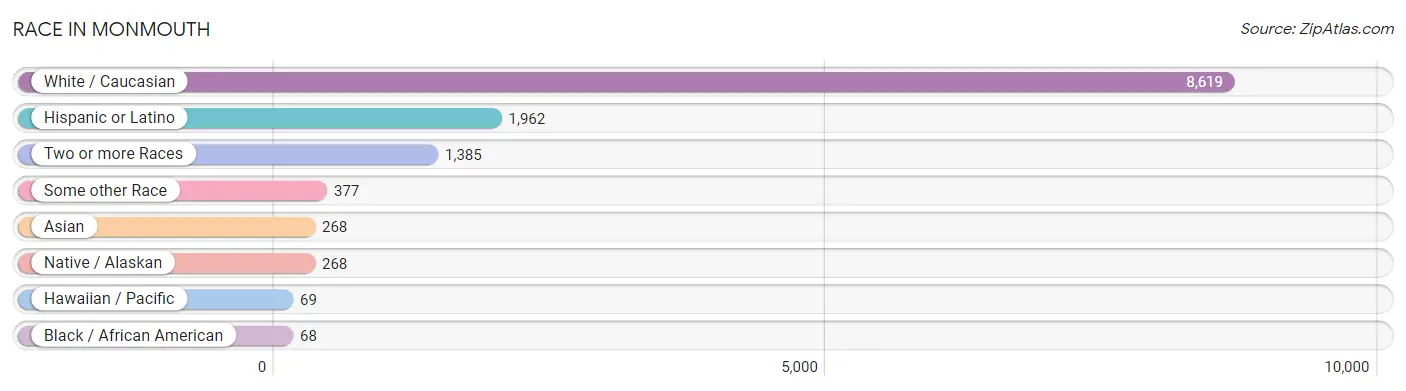
| Race | # Population | % Population |
| Asian | 268 | 2.4% |
| Black / African American | 68 | 0.6% |
| Hawaiian / Pacific | 69 | 0.6% |
| Hispanic or Latino | 1,962 | 17.7% |
| Native / Alaskan | 268 | 2.4% |
| White / Caucasian | 8,619 | 78.0% |
| Two or more Races | 1,385 | 12.5% |
| Some other Race | 377 | 3.4% |
| Total | 11,054 | 100.0% |
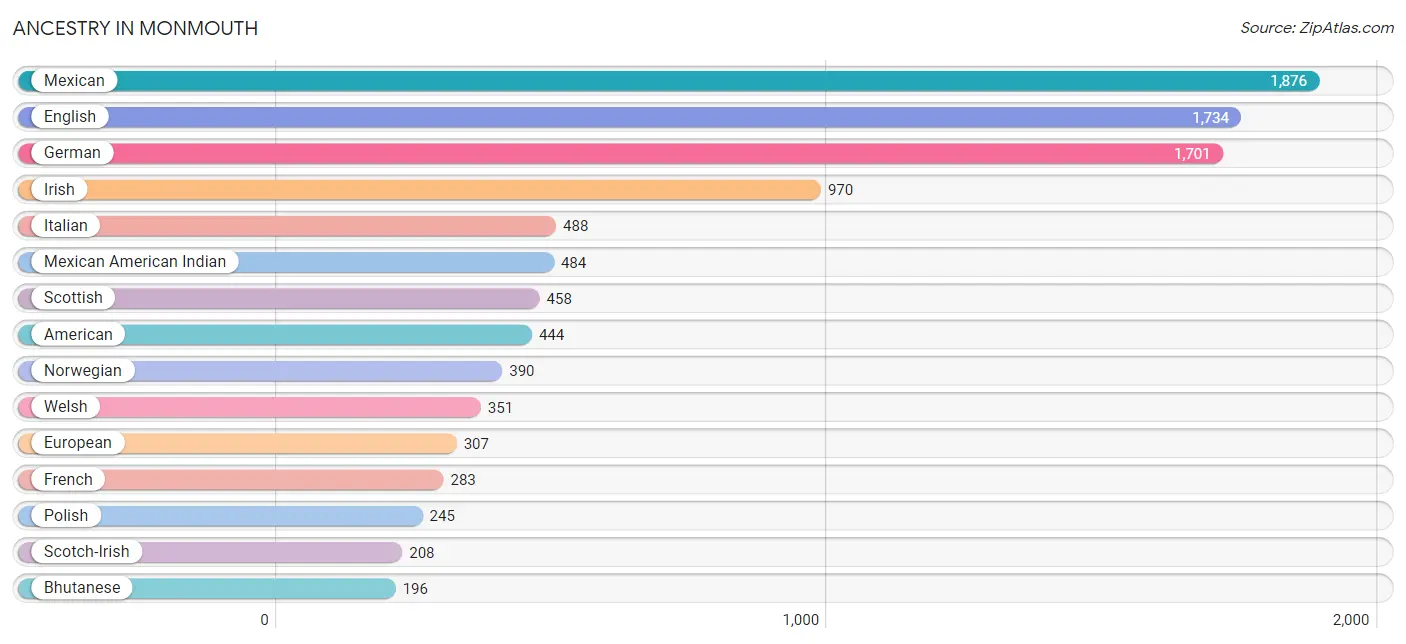
Ancestry in Monmouth
The most populous ancestries reported in Monmouth are Mexican (1,876 | 17.0%), English (1,734 | 15.7%), German (1,701 | 15.4%), Irish (970 | 8.8%), and Italian (488 | 4.4%), together accounting for 61.2% of all Monmouth residents.
| Ancestry | # Population | % Population |
| American | 444 | 4.0% |
| Apache | 4 | 0.0% |
| Arab | 29 | 0.3% |
| Australian | 4 | 0.0% |
| Austrian | 63 | 0.6% |
| Basque | 29 | 0.3% |
| Belgian | 4 | 0.0% |
| Bhutanese | 196 | 1.8% |
| British | 39 | 0.4% |
| Burmese | 46 | 0.4% |
| Canadian | 25 | 0.2% |
| Central American | 16 | 0.1% |
| Cherokee | 57 | 0.5% |
| Czech | 47 | 0.4% |
| Danish | 39 | 0.4% |
| Dutch | 97 | 0.9% |
| Eastern European | 15 | 0.1% |
| English | 1,734 | 15.7% |
| European | 307 | 2.8% |
| Finnish | 35 | 0.3% |
| French | 283 | 2.6% |
| French Canadian | 79 | 0.7% |
| German | 1,701 | 15.4% |
| Greek | 4 | 0.0% |
| Guamanian / Chamorro | 15 | 0.1% |
| Guatemalan | 16 | 0.1% |
| Hungarian | 27 | 0.2% |
| Indian (Asian) | 44 | 0.4% |
| Irish | 970 | 8.8% |
| Italian | 488 | 4.4% |
| Korean | 103 | 0.9% |
| Latvian | 4 | 0.0% |
| Lebanese | 29 | 0.3% |
| Lithuanian | 36 | 0.3% |
| Malaysian | 20 | 0.2% |
| Mexican | 1,876 | 17.0% |
| Mexican American Indian | 484 | 4.4% |
| Native Hawaiian | 47 | 0.4% |
| Navajo | 14 | 0.1% |
| New Zealander | 38 | 0.3% |
| Northern European | 13 | 0.1% |
| Norwegian | 390 | 3.5% |
| Pakistani | 20 | 0.2% |
| Polish | 245 | 2.2% |
| Portuguese | 13 | 0.1% |
| Puerto Rican | 26 | 0.2% |
| Romanian | 113 | 1.0% |
| Russian | 69 | 0.6% |
| Samoan | 9 | 0.1% |
| Scandinavian | 25 | 0.2% |
| Scotch-Irish | 208 | 1.9% |
| Scottish | 458 | 4.1% |
| Slovene | 19 | 0.2% |
| Sri Lankan | 8 | 0.1% |
| Swedish | 173 | 1.6% |
| Swiss | 33 | 0.3% |
| Ukrainian | 18 | 0.2% |
| Welsh | 351 | 3.2% | View All 58 Rows |
Immigrants in Monmouth
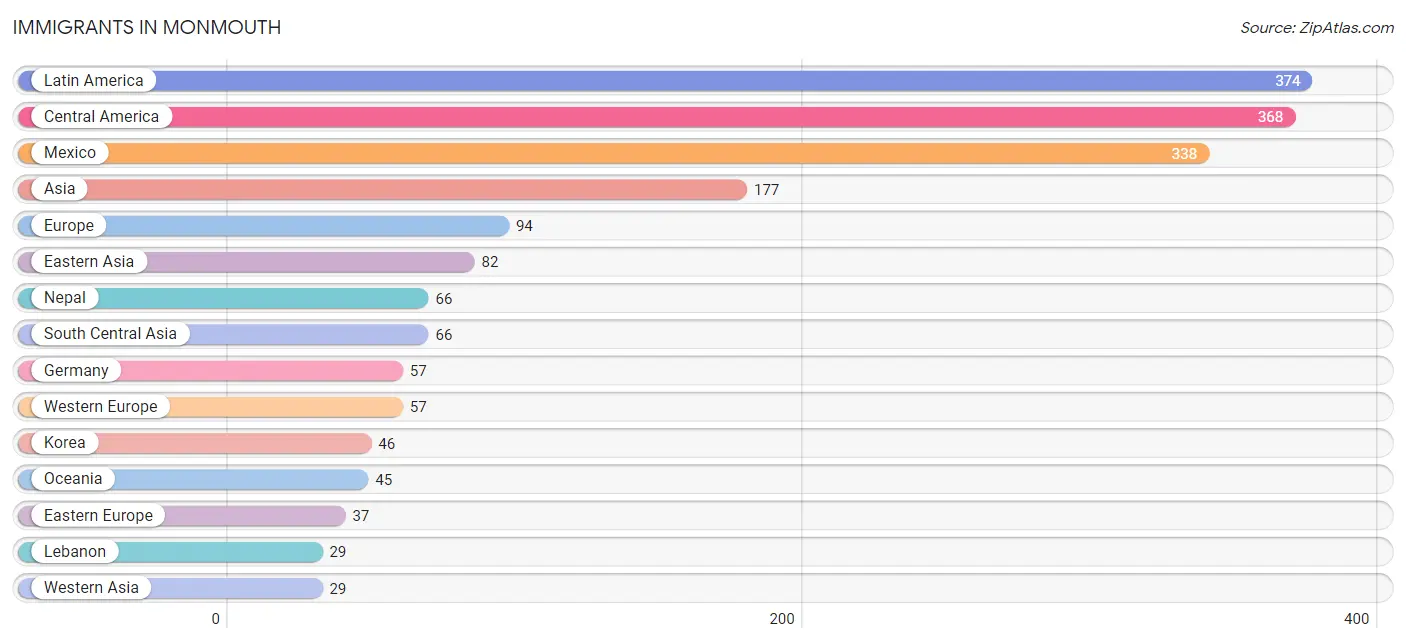
The most numerous immigrant groups reported in Monmouth came from Latin America (374 | 3.4%), Central America (368 | 3.3%), Mexico (338 | 3.1%), Asia (177 | 1.6%), and Europe (94 | 0.9%), together accounting for 12.2% of all Monmouth residents.
| Immigration Origin | # Population | % Population |
| Asia | 177 | 1.6% |
| Australia | 3 | 0.0% |
| Canada | 19 | 0.2% |
| Central America | 368 | 3.3% |
| China | 23 | 0.2% |
| Eastern Asia | 82 | 0.7% |
| Eastern Europe | 37 | 0.3% |
| Europe | 94 | 0.9% |
| Germany | 57 | 0.5% |
| Guatemala | 6 | 0.1% |
| Hungary | 27 | 0.2% |
| Japan | 13 | 0.1% |
| Korea | 46 | 0.4% |
| Latin America | 374 | 3.4% |
| Lebanon | 29 | 0.3% |
| Mexico | 338 | 3.1% |
| Nepal | 66 | 0.6% |
| Oceania | 45 | 0.4% |
| Panama | 24 | 0.2% |
| South America | 6 | 0.1% |
| South Central Asia | 66 | 0.6% |
| Ukraine | 10 | 0.1% |
| Western Asia | 29 | 0.3% |
| Western Europe | 57 | 0.5% | View All 24 Rows |
Sex and Age in Monmouth
Sex and Age in Monmouth
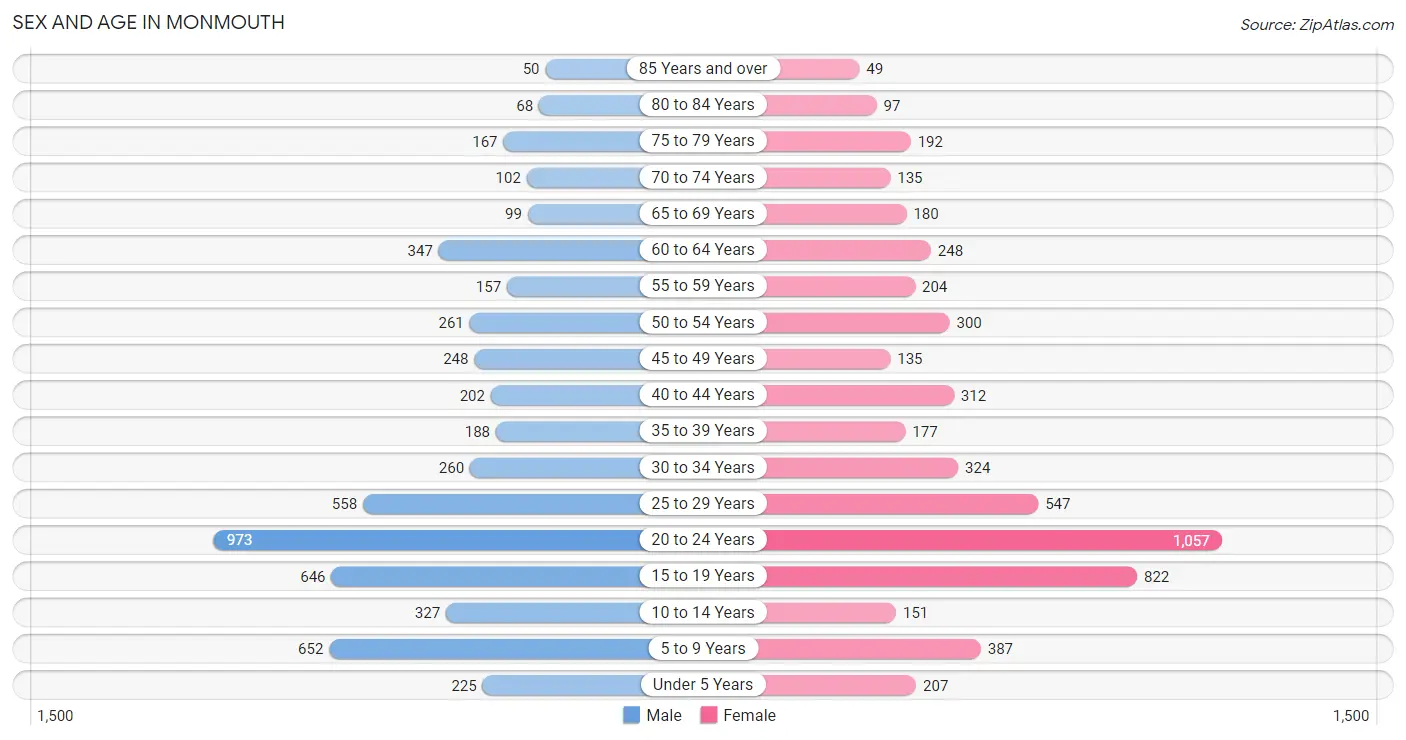
The most populous age groups in Monmouth are 20 to 24 Years (973 | 17.6%) for men and 20 to 24 Years (1,057 | 19.1%) for women.
| Age Bracket | Male | Female |
| Under 5 Years | 225 (4.1%) | 207 (3.7%) |
| 5 to 9 Years | 652 (11.8%) | 387 (7.0%) |
| 10 to 14 Years | 327 (5.9%) | 151 (2.7%) |
| 15 to 19 Years | 646 (11.7%) | 822 (14.9%) |
| 20 to 24 Years | 973 (17.6%) | 1,057 (19.1%) |
| 25 to 29 Years | 558 (10.1%) | 547 (9.9%) |
| 30 to 34 Years | 260 (4.7%) | 324 (5.9%) |
| 35 to 39 Years | 188 (3.4%) | 177 (3.2%) |
| 40 to 44 Years | 202 (3.6%) | 312 (5.7%) |
| 45 to 49 Years | 248 (4.5%) | 135 (2.4%) |
| 50 to 54 Years | 261 (4.7%) | 300 (5.4%) |
| 55 to 59 Years | 157 (2.8%) | 204 (3.7%) |
| 60 to 64 Years | 347 (6.3%) | 248 (4.5%) |
| 65 to 69 Years | 99 (1.8%) | 180 (3.3%) |
| 70 to 74 Years | 102 (1.8%) | 135 (2.4%) |
| 75 to 79 Years | 167 (3.0%) | 192 (3.5%) |
| 80 to 84 Years | 68 (1.2%) | 97 (1.8%) |
| 85 Years and over | 50 (0.9%) | 49 (0.9%) |
| Total | 5,530 (100.0%) | 5,524 (100.0%) |
Families and Households in Monmouth
Median Family Size in Monmouth
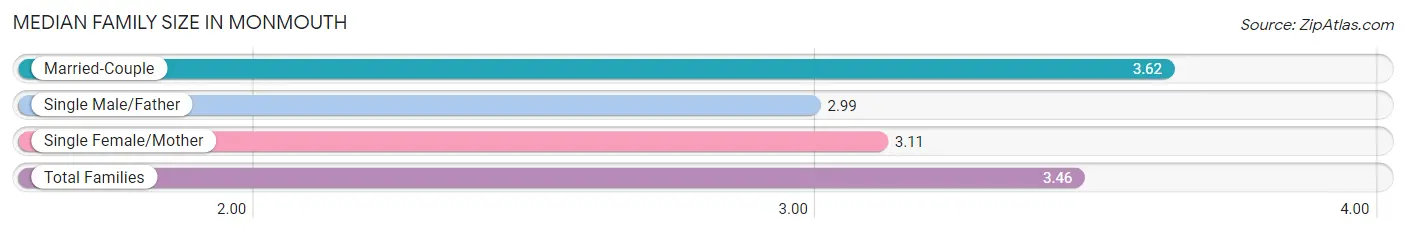
The median family size in Monmouth is 3.46 persons per family, with married-couple families (1,517 | 71.0%) accounting for the largest median family size of 3.62 persons per family. On the other hand, single male/father families (159 | 7.4%) represent the smallest median family size with 2.99 persons per family.
| Family Type | # Families | Family Size |
| Married-Couple | 1,517 (71.0%) | 3.62 |
| Single Male/Father | 159 (7.4%) | 2.99 |
| Single Female/Mother | 461 (21.6%) | 3.11 |
| Total Families | 2,137 (100.0%) | 3.46 |
Median Household Size in Monmouth
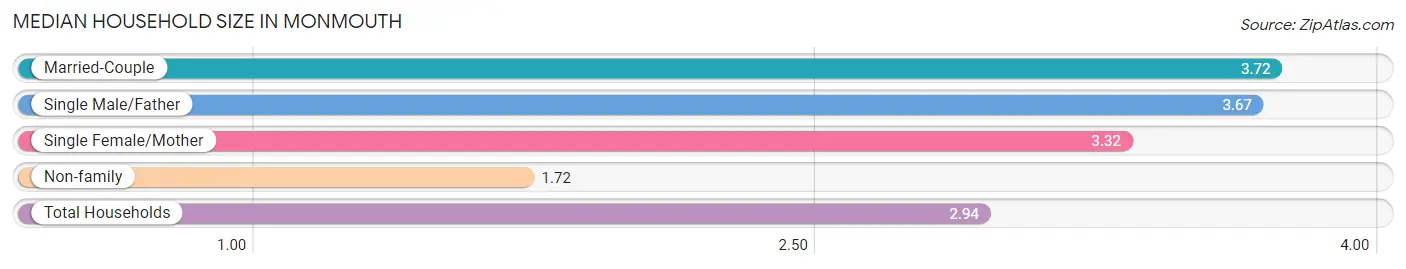
The median household size in Monmouth is 2.94 persons per household, with married-couple households (1,517 | 45.2%) accounting for the largest median household size of 3.72 persons per household. non-family households (1,219 | 36.3%) represent the smallest median household size with 1.72 persons per household.
| Household Type | # Households | Household Size |
| Married-Couple | 1,517 (45.2%) | 3.72 |
| Single Male/Father | 159 (4.7%) | 3.67 |
| Single Female/Mother | 461 (13.7%) | 3.32 |
| Non-family | 1,219 (36.3%) | 1.72 |
| Total Households | 3,356 (100.0%) | 2.94 |
Household Size by Marriage Status in Monmouth
Out of a total of 3,356 households in Monmouth, 2,137 (63.7%) are family households, while 1,219 (36.3%) are nonfamily households. The most numerous type of family households are 2-person households, comprising 695, and the most common type of nonfamily households are 1-person households, comprising 720.
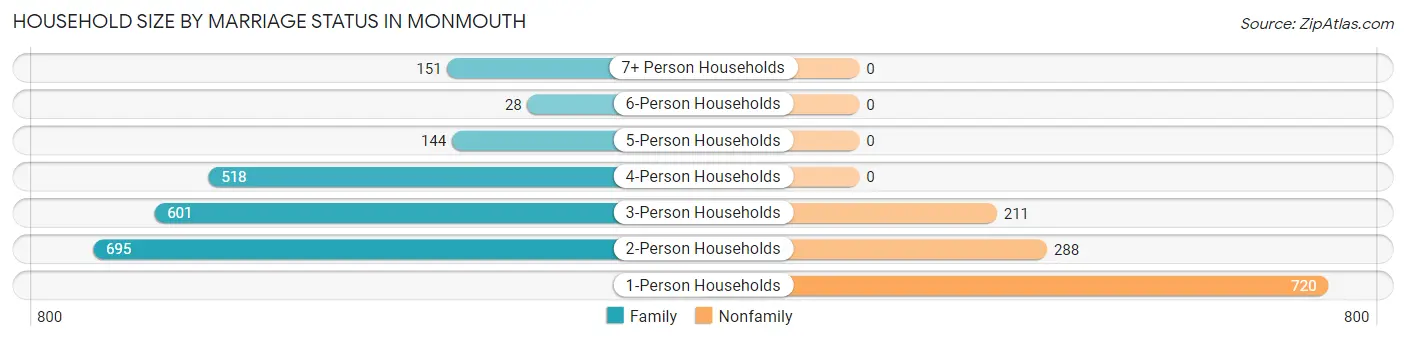
| Household Size | Family Households | Nonfamily Households |
| 1-Person Households | - | 720 (21.4%) |
| 2-Person Households | 695 (20.7%) | 288 (8.6%) |
| 3-Person Households | 601 (17.9%) | 211 (6.3%) |
| 4-Person Households | 518 (15.4%) | 0 (0.0%) |
| 5-Person Households | 144 (4.3%) | 0 (0.0%) |
| 6-Person Households | 28 (0.8%) | 0 (0.0%) |
| 7+ Person Households | 151 (4.5%) | 0 (0.0%) |
| Total | 2,137 (63.7%) | 1,219 (36.3%) |
Female Fertility in Monmouth
Fertility by Age in Monmouth
Average fertility rate in Monmouth is 45.0 births per 1,000 women. Women in the age bracket of 20 to 34 years have the highest fertility rate with 75.0 births per 1,000 women. Women in the age bracket of 20 to 34 years acount for 92.4% of all women with births.
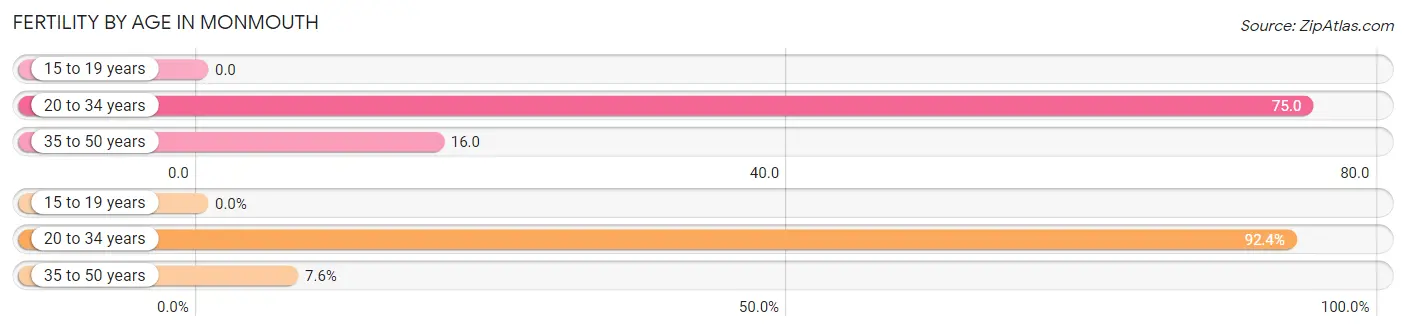
| Age Bracket | Women with Births | Births / 1,000 Women |
| 15 to 19 years | 0 (0.0%) | 0.0 |
| 20 to 34 years | 145 (92.4%) | 75.0 |
| 35 to 50 years | 12 (7.6%) | 16.0 |
| Total | 157 (100.0%) | 45.0 |
Fertility by Age by Marriage Status in Monmouth
80.9% of women with births (157) in Monmouth are married. The highest percentage of unmarried women with births falls into 20 to 34 years age bracket with 20.7% of them unmarried at the time of birth, while the lowest percentage of unmarried women with births belong to 35 to 50 years age bracket with 0.0% of them unmarried.
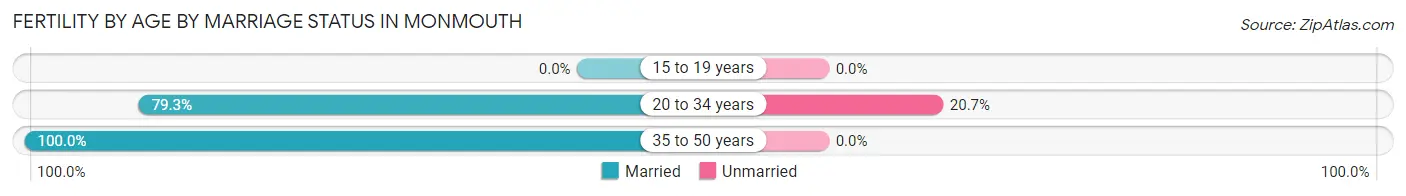
| Age Bracket | Married | Unmarried |
| 15 to 19 years | 0 (0.0%) | 0 (0.0%) |
| 20 to 34 years | 115 (79.3%) | 30 (20.7%) |
| 35 to 50 years | 12 (100.0%) | 0 (0.0%) |
| Total | 127 (80.9%) | 30 (19.1%) |
Fertility by Education in Monmouth
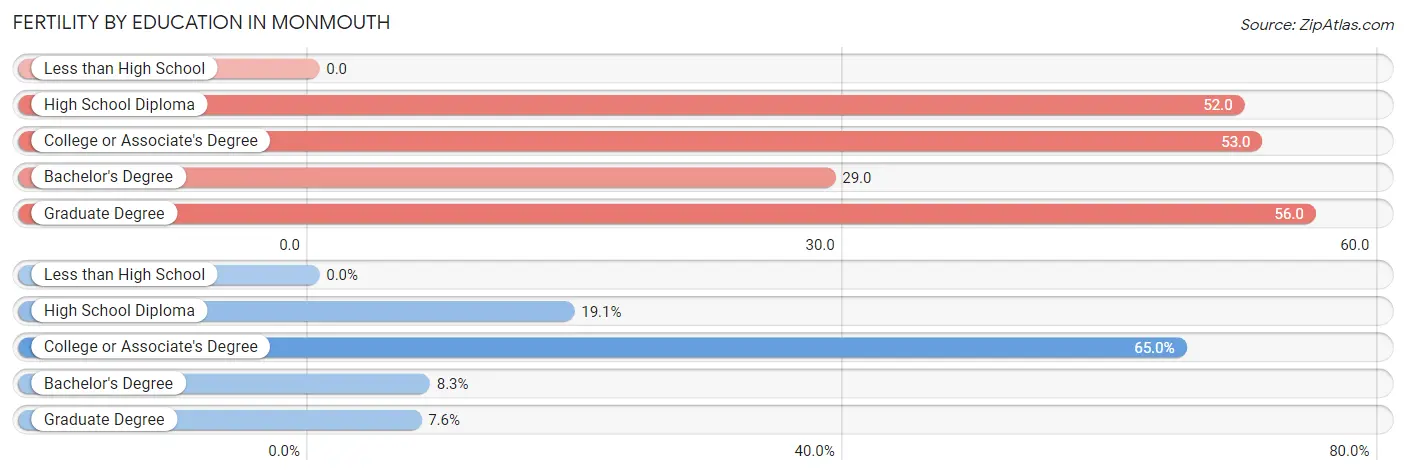
| Educational Attainment | Women with Births | Births / 1,000 Women |
| Less than High School | 0 (0.0%) | 0.0 |
| High School Diploma | 30 (19.1%) | 52.0 |
| College or Associate's Degree | 102 (65.0%) | 53.0 |
| Bachelor's Degree | 13 (8.3%) | 29.0 |
| Graduate Degree | 12 (7.6%) | 56.0 |
| Total | 157 (100.0%) | 45.0 |
Fertility by Education by Marriage Status in Monmouth
19.1% of women with births in Monmouth are unmarried. Women with the educational attainment of college or associate's degree are most likely to be married with 100.0% of them married at childbirth, while women with the educational attainment of high school diploma are least likely to be married with 100.0% of them unmarried at childbirth.
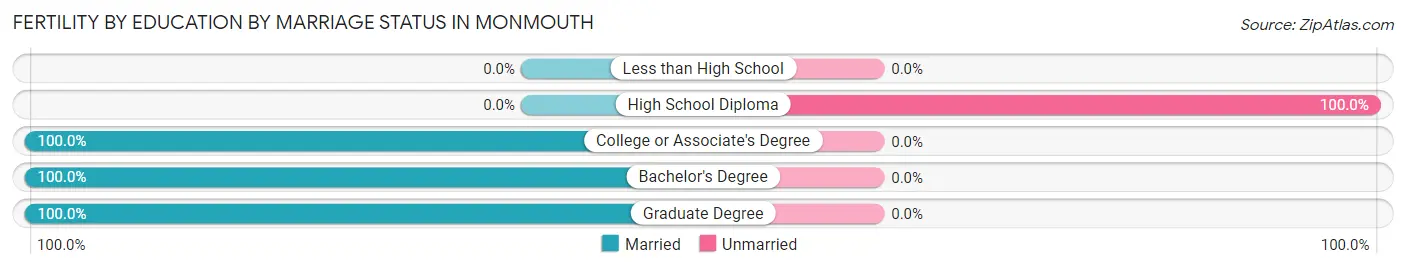
| Educational Attainment | Married | Unmarried |
| Less than High School | 0 (0.0%) | 0 (0.0%) |
| High School Diploma | 0 (0.0%) | 30 (100.0%) |
| College or Associate's Degree | 102 (100.0%) | 0 (0.0%) |
| Bachelor's Degree | 13 (100.0%) | 0 (0.0%) |
| Graduate Degree | 12 (100.0%) | 0 (0.0%) |
| Total | 127 (80.9%) | 30 (19.1%) |
Employment Characteristics in Monmouth
Employment by Class of Employer in Monmouth
Among the 5,096 employed individuals in Monmouth, private company employees (3,069 | 60.2%), state government employees (806 | 15.8%), and not-for-profit organizations (476 | 9.3%) make up the most common classes of employment.
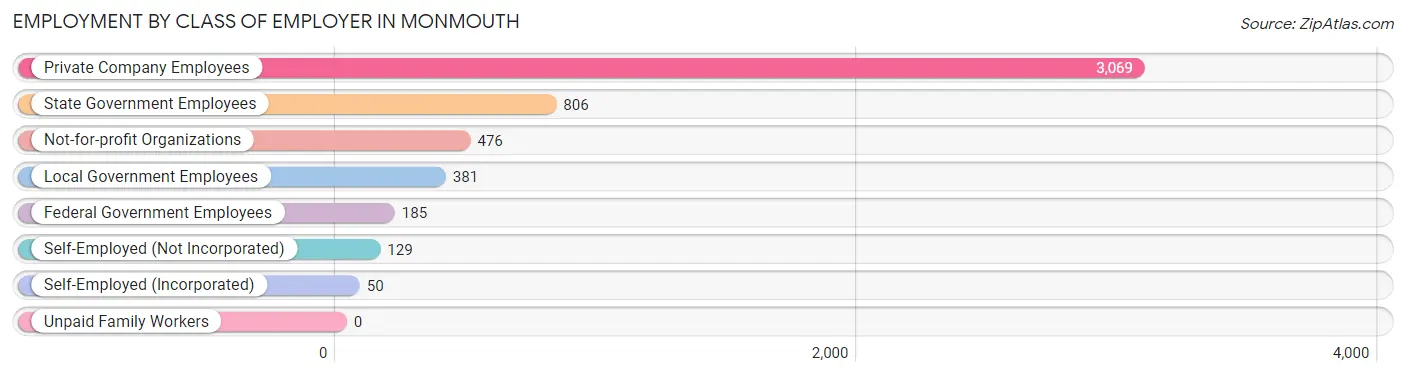
| Employer Class | # Employees | % Employees |
| Private Company Employees | 3,069 | 60.2% |
| Self-Employed (Incorporated) | 50 | 1.0% |
| Self-Employed (Not Incorporated) | 129 | 2.5% |
| Not-for-profit Organizations | 476 | 9.3% |
| Local Government Employees | 381 | 7.5% |
| State Government Employees | 806 | 15.8% |
| Federal Government Employees | 185 | 3.6% |
| Unpaid Family Workers | 0 | 0.0% |
| Total | 5,096 | 100.0% |
Employment Status by Age in Monmouth
According to the labor force statistics for Monmouth, out of the total population over 16 years of age (8,965), 61.3% or 5,496 individuals are in the labor force, with 4.9% or 269 of them unemployed. The age group with the highest labor force participation rate is 35 to 44 years, with 89.0% or 782 individuals in the labor force. Within the labor force, the 16 to 19 years age range has the highest percentage of unemployed individuals, with 27.3% or 114 of them being unemployed.
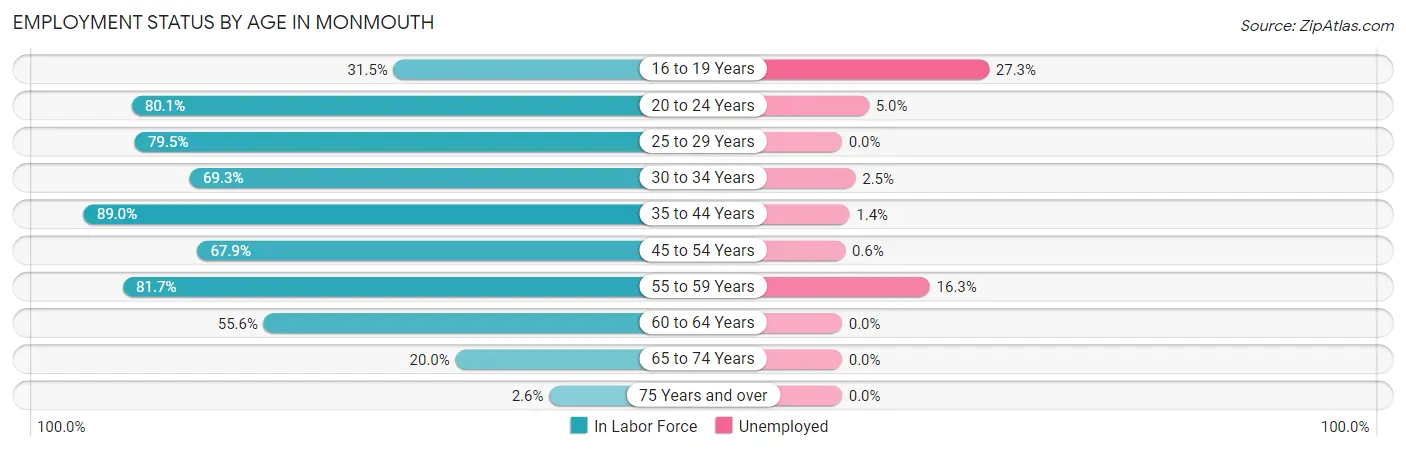
| Age Bracket | In Labor Force | Unemployed |
| 16 to 19 Years | 418 (31.5%) | 114 (27.3%) |
| 20 to 24 Years | 1,626 (80.1%) | 81 (5.0%) |
| 25 to 29 Years | 878 (79.5%) | 0 (0.0%) |
| 30 to 34 Years | 405 (69.3%) | 10 (2.5%) |
| 35 to 44 Years | 782 (89.0%) | 11 (1.4%) |
| 45 to 54 Years | 641 (67.9%) | 4 (0.6%) |
| 55 to 59 Years | 295 (81.7%) | 48 (16.3%) |
| 60 to 64 Years | 331 (55.6%) | 0 (0.0%) |
| 65 to 74 Years | 103 (20.0%) | 0 (0.0%) |
| 75 Years and over | 16 (2.6%) | 0 (0.0%) |
| Total | 5,496 (61.3%) | 269 (4.9%) |
Employment Status by Educational Attainment in Monmouth
According to labor force statistics for Monmouth, 74.6% of individuals (3,333) out of the total population between 25 and 64 years of age (4,468) are in the labor force, with 2.2% or 73 of them being unemployed. The group with the highest labor force participation rate are those with the educational attainment of bachelor's degree or higher, with 85.1% or 1,134 individuals in the labor force. Within the labor force, individuals with bachelor's degree or higher education have the highest percentage of unemployment, with 4.7% or 53 of them being unemployed.
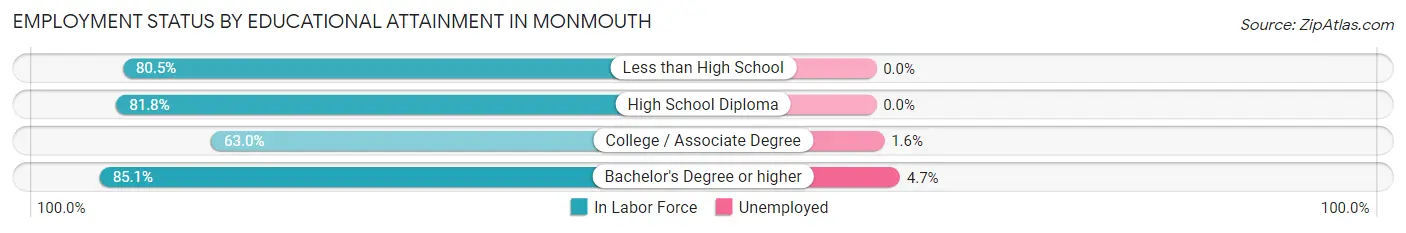
| Educational Attainment | In Labor Force | Unemployed |
| Less than High School | 178 (80.5%) | 0 (0.0%) |
| High School Diploma | 802 (81.8%) | 0 (0.0%) |
| College / Associate Degree | 1,218 (63.0%) | 31 (1.6%) |
| Bachelor's Degree or higher | 1,134 (85.1%) | 63 (4.7%) |
| Total | 3,333 (74.6%) | 98 (2.2%) |
Employment Occupations by Sex in Monmouth
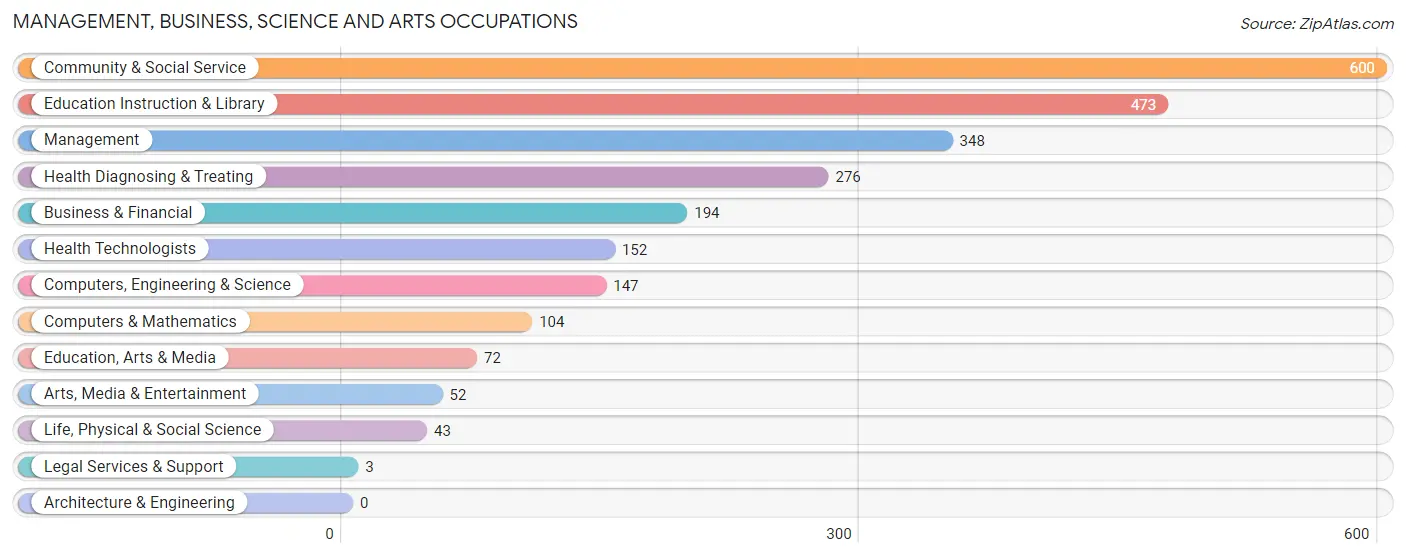
Management, Business, Science and Arts Occupations
The most common Management, Business, Science and Arts occupations in Monmouth are Community & Social Service (600 | 11.5%), Education Instruction & Library (473 | 9.0%), Management (348 | 6.7%), Health Diagnosing & Treating (276 | 5.3%), and Business & Financial (194 | 3.7%).
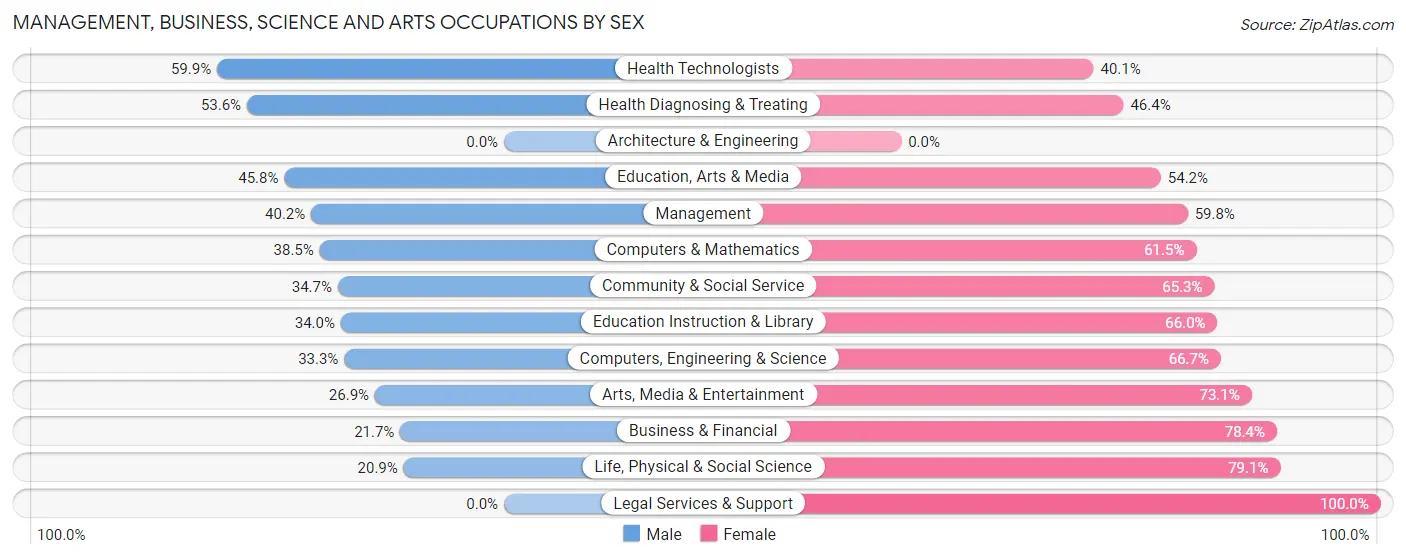
Management, Business, Science and Arts Occupations by Sex
Within the Management, Business, Science and Arts occupations in Monmouth, the most male-oriented occupations are Health Technologists (59.9%), Health Diagnosing & Treating (53.6%), and Education, Arts & Media (45.8%), while the most female-oriented occupations are Legal Services & Support (100.0%), Life, Physical & Social Science (79.1%), and Business & Financial (78.3%).
| Occupation | Male | Female |
| Management | 140 (40.2%) | 208 (59.8%) |
| Business & Financial | 42 (21.6%) | 152 (78.3%) |
| Computers, Engineering & Science | 49 (33.3%) | 98 (66.7%) |
| Computers & Mathematics | 40 (38.5%) | 64 (61.5%) |
| Architecture & Engineering | 0 (0.0%) | 0 (0.0%) |
| Life, Physical & Social Science | 9 (20.9%) | 34 (79.1%) |
| Community & Social Service | 208 (34.7%) | 392 (65.3%) |
| Education, Arts & Media | 33 (45.8%) | 39 (54.2%) |
| Legal Services & Support | 0 (0.0%) | 3 (100.0%) |
| Education Instruction & Library | 161 (34.0%) | 312 (66.0%) |
| Arts, Media & Entertainment | 14 (26.9%) | 38 (73.1%) |
| Health Diagnosing & Treating | 148 (53.6%) | 128 (46.4%) |
| Health Technologists | 91 (59.9%) | 61 (40.1%) |
| Total (Category) | 587 (37.5%) | 978 (62.5%) |
| Total (Overall) | 2,516 (48.1%) | 2,712 (51.9%) |
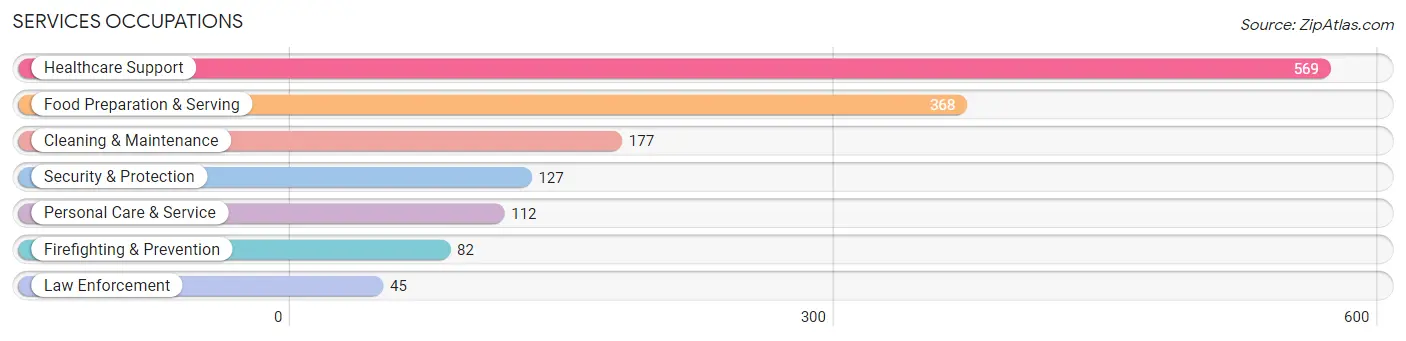
Services Occupations
The most common Services occupations in Monmouth are Healthcare Support (569 | 10.9%), Food Preparation & Serving (368 | 7.0%), Cleaning & Maintenance (177 | 3.4%), Security & Protection (127 | 2.4%), and Personal Care & Service (112 | 2.1%).
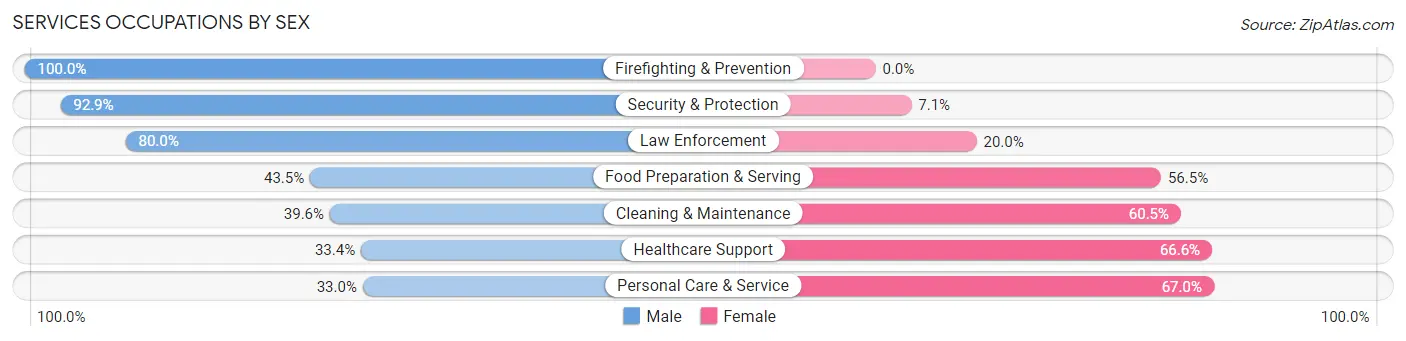
Services Occupations by Sex
Within the Services occupations in Monmouth, the most male-oriented occupations are Firefighting & Prevention (100.0%), Security & Protection (92.9%), and Law Enforcement (80.0%), while the most female-oriented occupations are Personal Care & Service (67.0%), Healthcare Support (66.6%), and Cleaning & Maintenance (60.5%).
| Occupation | Male | Female |
| Healthcare Support | 190 (33.4%) | 379 (66.6%) |
| Security & Protection | 118 (92.9%) | 9 (7.1%) |
| Firefighting & Prevention | 82 (100.0%) | 0 (0.0%) |
| Law Enforcement | 36 (80.0%) | 9 (20.0%) |
| Food Preparation & Serving | 160 (43.5%) | 208 (56.5%) |
| Cleaning & Maintenance | 70 (39.6%) | 107 (60.5%) |
| Personal Care & Service | 37 (33.0%) | 75 (67.0%) |
| Total (Category) | 575 (42.5%) | 778 (57.5%) |
| Total (Overall) | 2,516 (48.1%) | 2,712 (51.9%) |
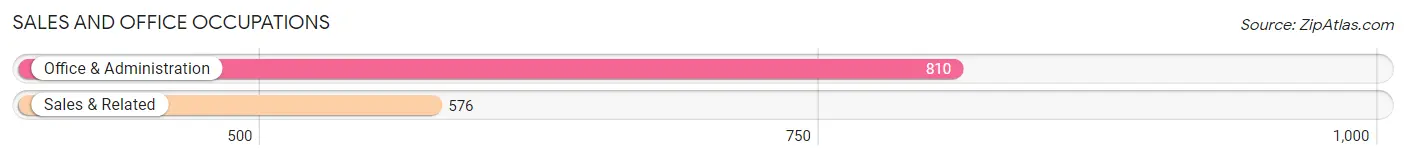
Sales and Office Occupations
The most common Sales and Office occupations in Monmouth are Office & Administration (810 | 15.5%), and Sales & Related (576 | 11.0%).
Sales and Office Occupations by Sex
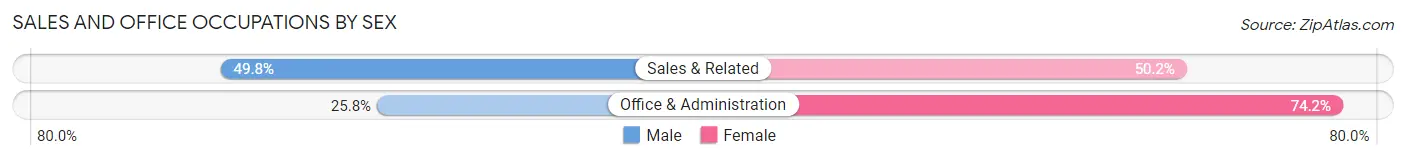
| Occupation | Male | Female |
| Sales & Related | 287 (49.8%) | 289 (50.2%) |
| Office & Administration | 209 (25.8%) | 601 (74.2%) |
| Total (Category) | 496 (35.8%) | 890 (64.2%) |
| Total (Overall) | 2,516 (48.1%) | 2,712 (51.9%) |
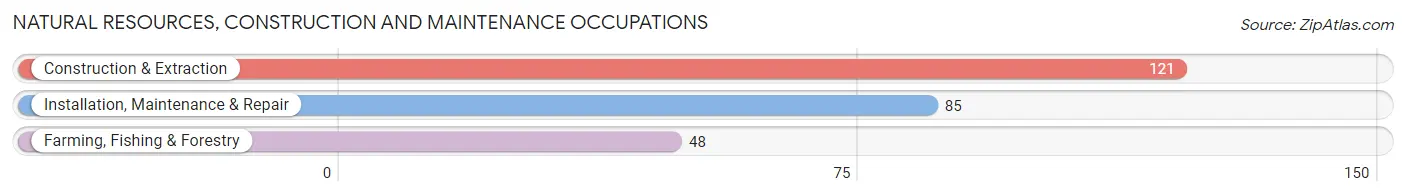
Natural Resources, Construction and Maintenance Occupations
The most common Natural Resources, Construction and Maintenance occupations in Monmouth are Construction & Extraction (121 | 2.3%), Installation, Maintenance & Repair (85 | 1.6%), and Farming, Fishing & Forestry (48 | 0.9%).
Natural Resources, Construction and Maintenance Occupations by Sex
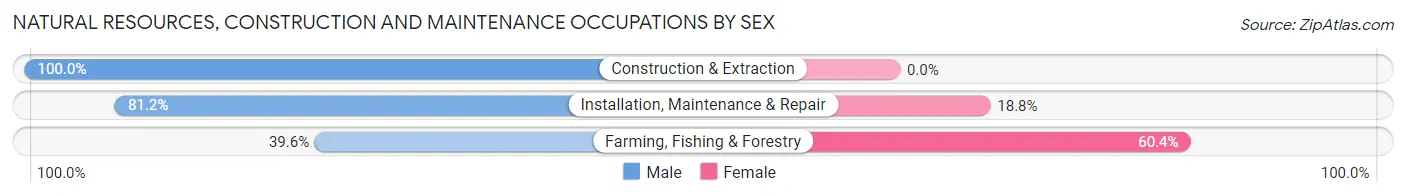
| Occupation | Male | Female |
| Farming, Fishing & Forestry | 19 (39.6%) | 29 (60.4%) |
| Construction & Extraction | 121 (100.0%) | 0 (0.0%) |
| Installation, Maintenance & Repair | 69 (81.2%) | 16 (18.8%) |
| Total (Category) | 209 (82.3%) | 45 (17.7%) |
| Total (Overall) | 2,516 (48.1%) | 2,712 (51.9%) |
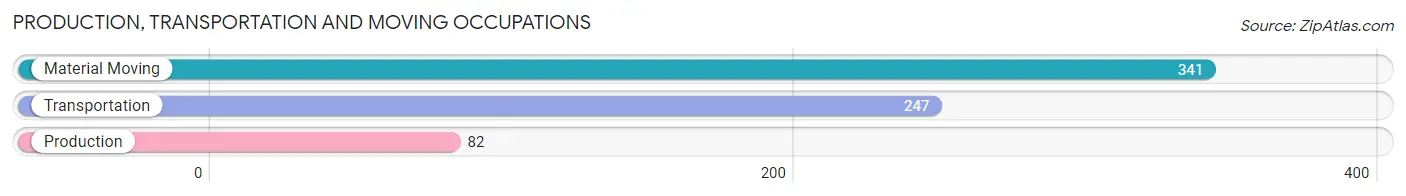
Production, Transportation and Moving Occupations
The most common Production, Transportation and Moving occupations in Monmouth are Material Moving (341 | 6.5%), Transportation (247 | 4.7%), and Production (82 | 1.6%).
Production, Transportation and Moving Occupations by Sex
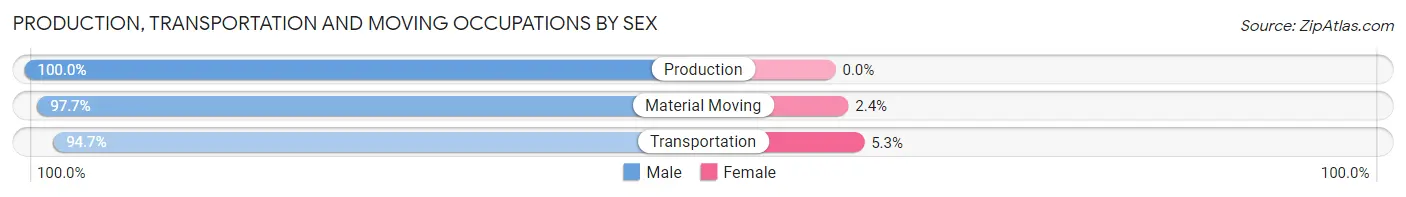
| Occupation | Male | Female |
| Production | 82 (100.0%) | 0 (0.0%) |
| Transportation | 234 (94.7%) | 13 (5.3%) |
| Material Moving | 333 (97.7%) | 8 (2.4%) |
| Total (Category) | 649 (96.9%) | 21 (3.1%) |
| Total (Overall) | 2,516 (48.1%) | 2,712 (51.9%) |
Employment Industries by Sex in Monmouth
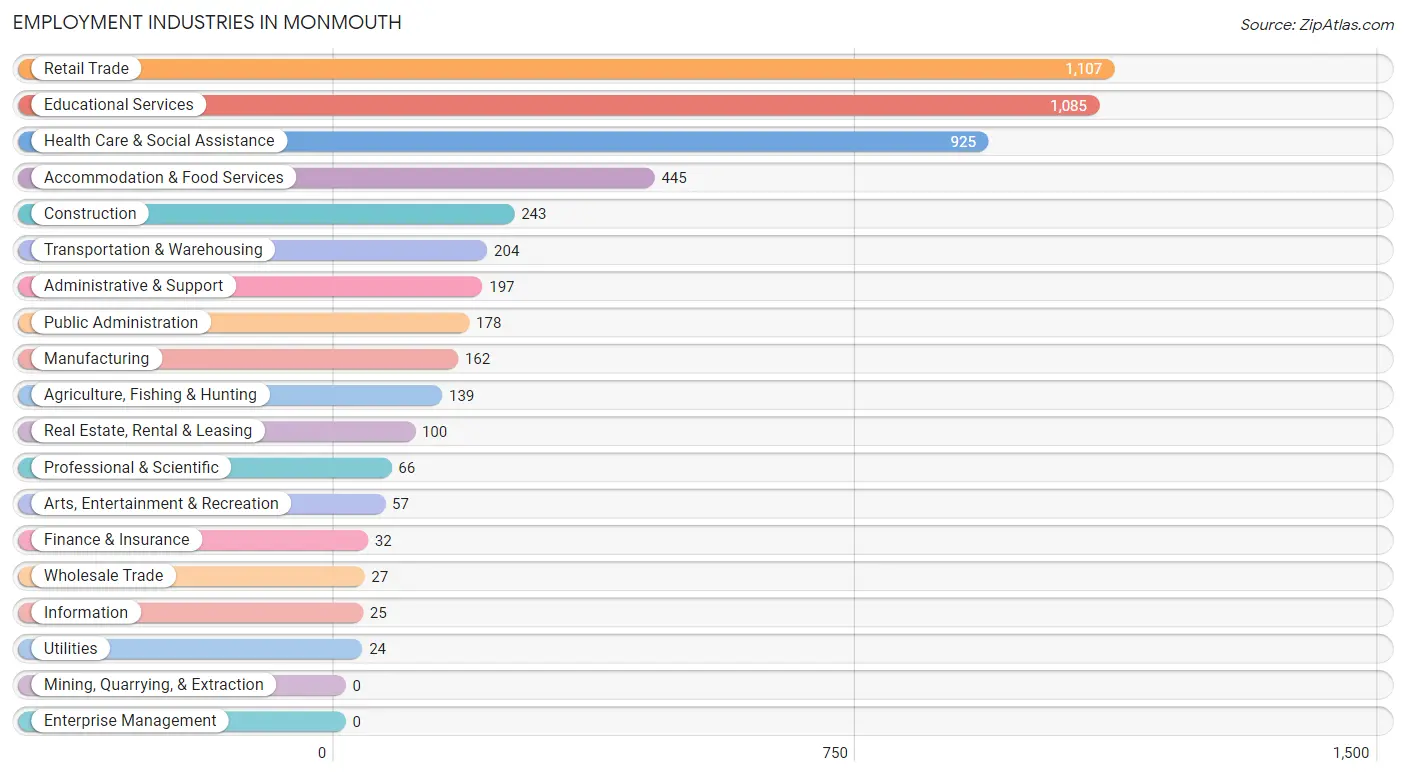
Employment Industries in Monmouth
The major employment industries in Monmouth include Retail Trade (1,107 | 21.2%), Educational Services (1,085 | 20.7%), Health Care & Social Assistance (925 | 17.7%), Accommodation & Food Services (445 | 8.5%), and Construction (243 | 4.6%).
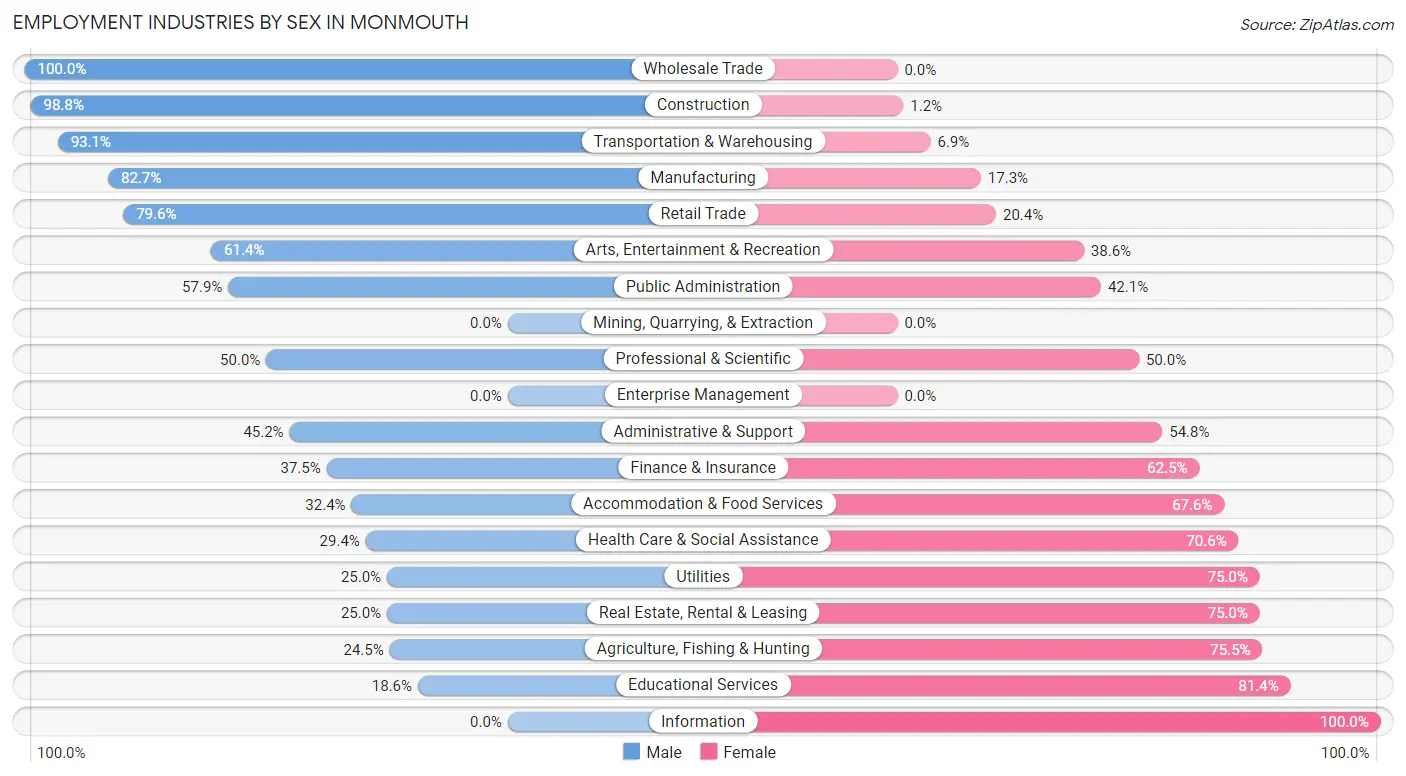
Employment Industries by Sex in Monmouth
The Monmouth industries that see more men than women are Wholesale Trade (100.0%), Construction (98.8%), and Transportation & Warehousing (93.1%), whereas the industries that tend to have a higher number of women are Information (100.0%), Educational Services (81.4%), and Agriculture, Fishing & Hunting (75.5%).
| Industry | Male | Female |
| Agriculture, Fishing & Hunting | 34 (24.5%) | 105 (75.5%) |
| Mining, Quarrying, & Extraction | 0 (0.0%) | 0 (0.0%) |
| Construction | 240 (98.8%) | 3 (1.2%) |
| Manufacturing | 134 (82.7%) | 28 (17.3%) |
| Wholesale Trade | 27 (100.0%) | 0 (0.0%) |
| Retail Trade | 881 (79.6%) | 226 (20.4%) |
| Transportation & Warehousing | 190 (93.1%) | 14 (6.9%) |
| Utilities | 6 (25.0%) | 18 (75.0%) |
| Information | 0 (0.0%) | 25 (100.0%) |
| Finance & Insurance | 12 (37.5%) | 20 (62.5%) |
| Real Estate, Rental & Leasing | 25 (25.0%) | 75 (75.0%) |
| Professional & Scientific | 33 (50.0%) | 33 (50.0%) |
| Enterprise Management | 0 (0.0%) | 0 (0.0%) |
| Administrative & Support | 89 (45.2%) | 108 (54.8%) |
| Educational Services | 202 (18.6%) | 883 (81.4%) |
| Health Care & Social Assistance | 272 (29.4%) | 653 (70.6%) |
| Arts, Entertainment & Recreation | 35 (61.4%) | 22 (38.6%) |
| Accommodation & Food Services | 144 (32.4%) | 301 (67.6%) |
| Public Administration | 103 (57.9%) | 75 (42.1%) |
| Total | 2,516 (48.1%) | 2,712 (51.9%) |
Education in Monmouth
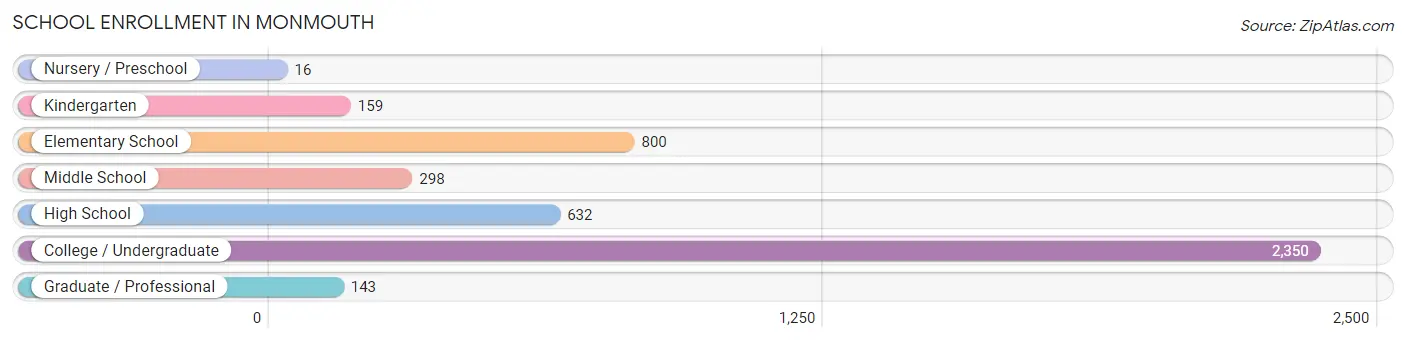
School Enrollment in Monmouth
The most common levels of schooling among the 4,398 students in Monmouth are college / undergraduate (2,350 | 53.4%), elementary school (800 | 18.2%), and high school (632 | 14.4%).
| School Level | # Students | % Students |
| Nursery / Preschool | 16 | 0.4% |
| Kindergarten | 159 | 3.6% |
| Elementary School | 800 | 18.2% |
| Middle School | 298 | 6.8% |
| High School | 632 | 14.4% |
| College / Undergraduate | 2,350 | 53.4% |
| Graduate / Professional | 143 | 3.3% |
| Total | 4,398 | 100.0% |
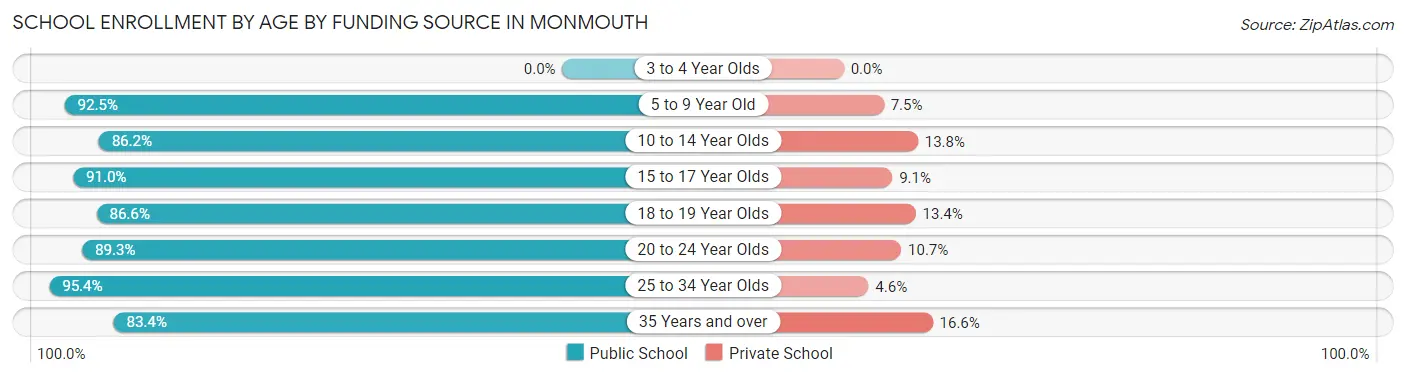
School Enrollment by Age by Funding Source in Monmouth
Out of a total of 4,398 students who are enrolled in schools in Monmouth, 475 (10.8%) attend a private institution, while the remaining 3,923 (89.2%) are enrolled in public schools. The age group of 35 years and over has the highest likelihood of being enrolled in private schools, with 29 (16.6% in the age bracket) enrolled. Conversely, the age group of 25 to 34 year olds has the lowest likelihood of being enrolled in a private school, with 207 (95.4% in the age bracket) attending a public institution.
| Age Bracket | Public School | Private School |
| 3 to 4 Year Olds | 0 (0.0%) | 0 (0.0%) |
| 5 to 9 Year Old | 781 (92.5%) | 63 (7.5%) |
| 10 to 14 Year Olds | 412 (86.2%) | 66 (13.8%) |
| 15 to 17 Year Olds | 422 (90.9%) | 42 (9.0%) |
| 18 to 19 Year Olds | 814 (86.6%) | 126 (13.4%) |
| 20 to 24 Year Olds | 1,143 (89.3%) | 137 (10.7%) |
| 25 to 34 Year Olds | 207 (95.4%) | 10 (4.6%) |
| 35 Years and over | 146 (83.4%) | 29 (16.6%) |
| Total | 3,923 (89.2%) | 475 (10.8%) |
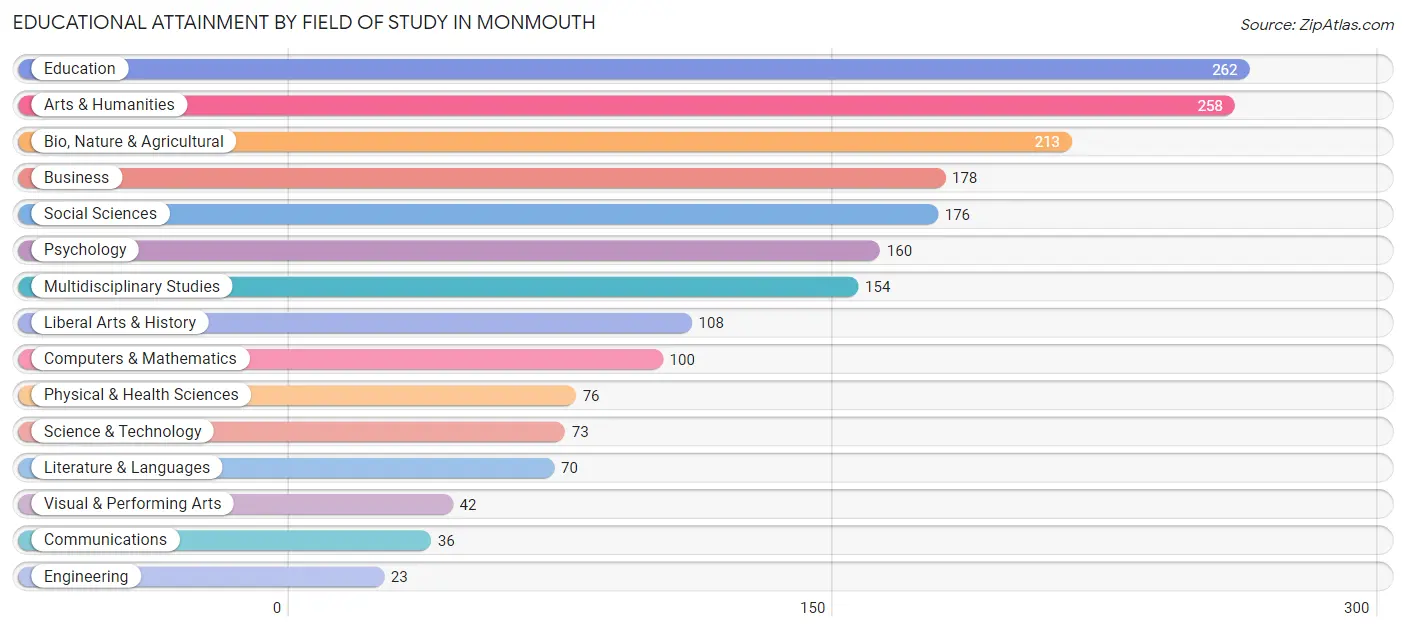
Educational Attainment by Field of Study in Monmouth
Education (262 | 13.6%), arts & humanities (258 | 13.4%), bio, nature & agricultural (213 | 11.0%), business (178 | 9.2%), and social sciences (176 | 9.1%) are the most common fields of study among 1,929 individuals in Monmouth who have obtained a bachelor's degree or higher.
| Field of Study | # Graduates | % Graduates |
| Computers & Mathematics | 100 | 5.2% |
| Bio, Nature & Agricultural | 213 | 11.0% |
| Physical & Health Sciences | 76 | 3.9% |
| Psychology | 160 | 8.3% |
| Social Sciences | 176 | 9.1% |
| Engineering | 23 | 1.2% |
| Multidisciplinary Studies | 154 | 8.0% |
| Science & Technology | 73 | 3.8% |
| Business | 178 | 9.2% |
| Education | 262 | 13.6% |
| Literature & Languages | 70 | 3.6% |
| Liberal Arts & History | 108 | 5.6% |
| Visual & Performing Arts | 42 | 2.2% |
| Communications | 36 | 1.9% |
| Arts & Humanities | 258 | 13.4% |
| Total | 1,929 | 100.0% |
Transportation & Commute in Monmouth
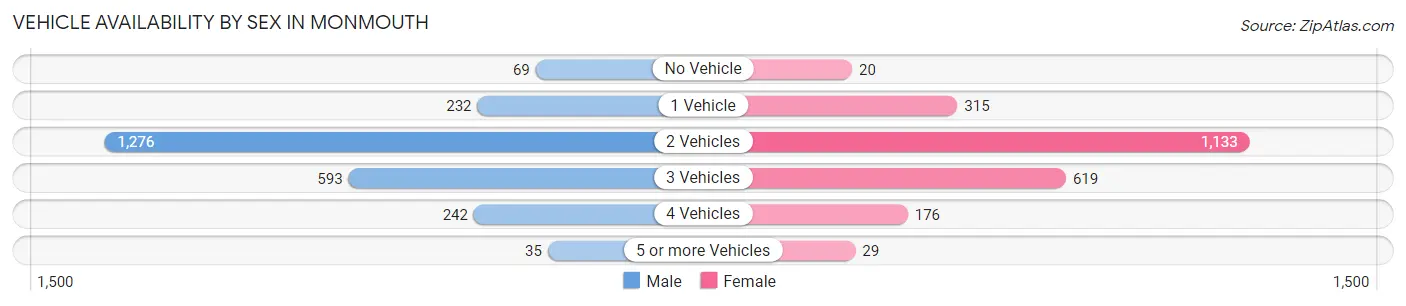
Vehicle Availability by Sex in Monmouth
The most prevalent vehicle ownership categories in Monmouth are males with 2 vehicles (1,276, accounting for 52.1%) and females with 2 vehicles (1,133, making up 55.7%).
| Vehicles Available | Male | Female |
| No Vehicle | 69 (2.8%) | 20 (0.9%) |
| 1 Vehicle | 232 (9.5%) | 315 (13.7%) |
| 2 Vehicles | 1,276 (52.1%) | 1,133 (49.4%) |
| 3 Vehicles | 593 (24.2%) | 619 (27.0%) |
| 4 Vehicles | 242 (9.9%) | 176 (7.7%) |
| 5 or more Vehicles | 35 (1.4%) | 29 (1.3%) |
| Total | 2,447 (100.0%) | 2,292 (100.0%) |
Commute Time in Monmouth
The most frequently occuring commute durations in Monmouth are 30 to 34 minutes (841 commuters, 18.1%), 10 to 14 minutes (767 commuters, 16.5%), and 5 to 9 minutes (742 commuters, 16.0%).
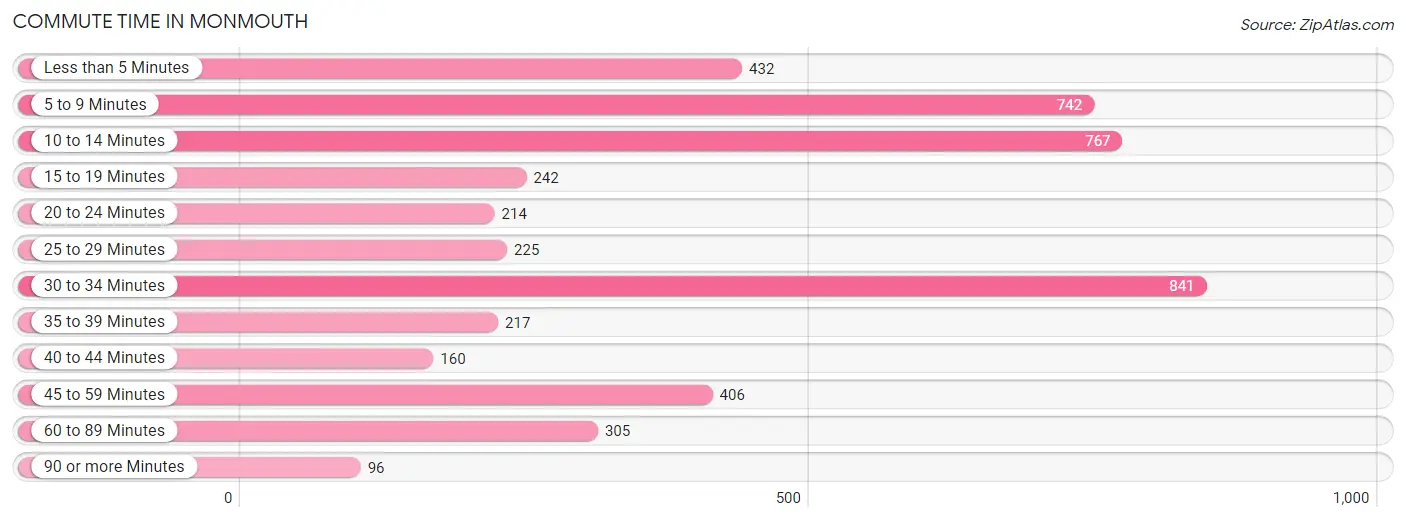
| Commute Time | # Commuters | % Commuters |
| Less than 5 Minutes | 432 | 9.3% |
| 5 to 9 Minutes | 742 | 16.0% |
| 10 to 14 Minutes | 767 | 16.5% |
| 15 to 19 Minutes | 242 | 5.2% |
| 20 to 24 Minutes | 214 | 4.6% |
| 25 to 29 Minutes | 225 | 4.8% |
| 30 to 34 Minutes | 841 | 18.1% |
| 35 to 39 Minutes | 217 | 4.7% |
| 40 to 44 Minutes | 160 | 3.4% |
| 45 to 59 Minutes | 406 | 8.7% |
| 60 to 89 Minutes | 305 | 6.6% |
| 90 or more Minutes | 96 | 2.1% |
Commute Time by Sex in Monmouth
The most common commute times in Monmouth are 30 to 34 minutes (578 commuters, 23.8%) for males and 5 to 9 minutes (554 commuters, 25.0%) for females.
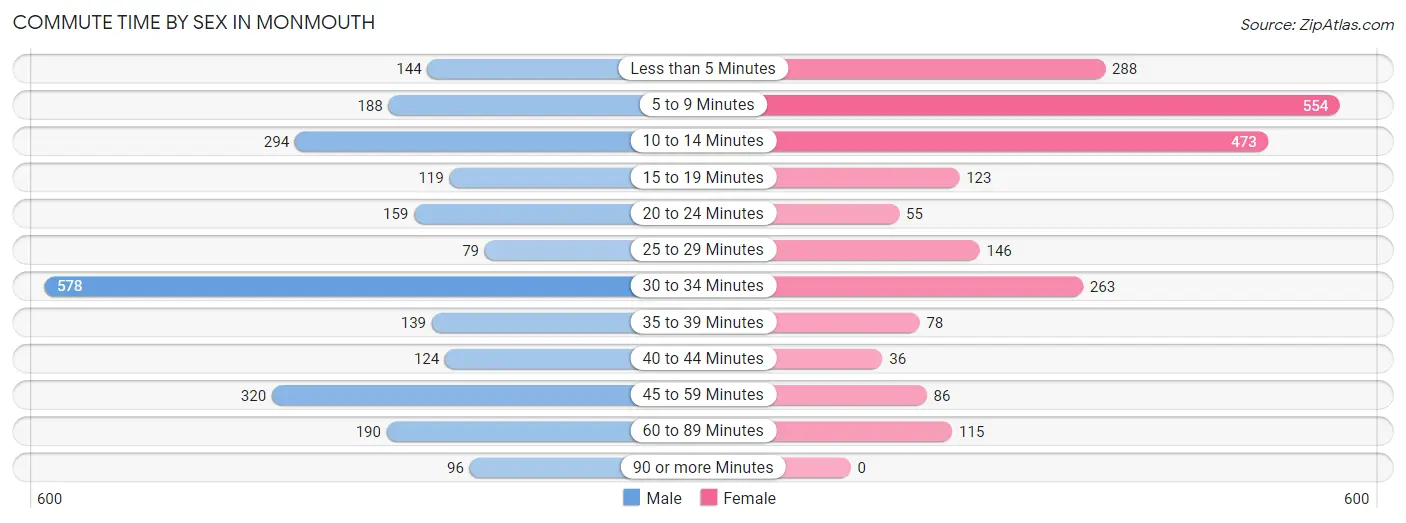
| Commute Time | Male | Female |
| Less than 5 Minutes | 144 (5.9%) | 288 (13.0%) |
| 5 to 9 Minutes | 188 (7.7%) | 554 (25.0%) |
| 10 to 14 Minutes | 294 (12.1%) | 473 (21.3%) |
| 15 to 19 Minutes | 119 (4.9%) | 123 (5.6%) |
| 20 to 24 Minutes | 159 (6.5%) | 55 (2.5%) |
| 25 to 29 Minutes | 79 (3.3%) | 146 (6.6%) |
| 30 to 34 Minutes | 578 (23.8%) | 263 (11.9%) |
| 35 to 39 Minutes | 139 (5.7%) | 78 (3.5%) |
| 40 to 44 Minutes | 124 (5.1%) | 36 (1.6%) |
| 45 to 59 Minutes | 320 (13.2%) | 86 (3.9%) |
| 60 to 89 Minutes | 190 (7.8%) | 115 (5.2%) |
| 90 or more Minutes | 96 (4.0%) | 0 (0.0%) |
Time of Departure to Work by Sex in Monmouth
The most frequent times of departure to work in Monmouth are 12:00 PM to 3:59 PM (402, 16.5%) for males and 7:00 AM to 7:29 AM (391, 17.6%) for females.
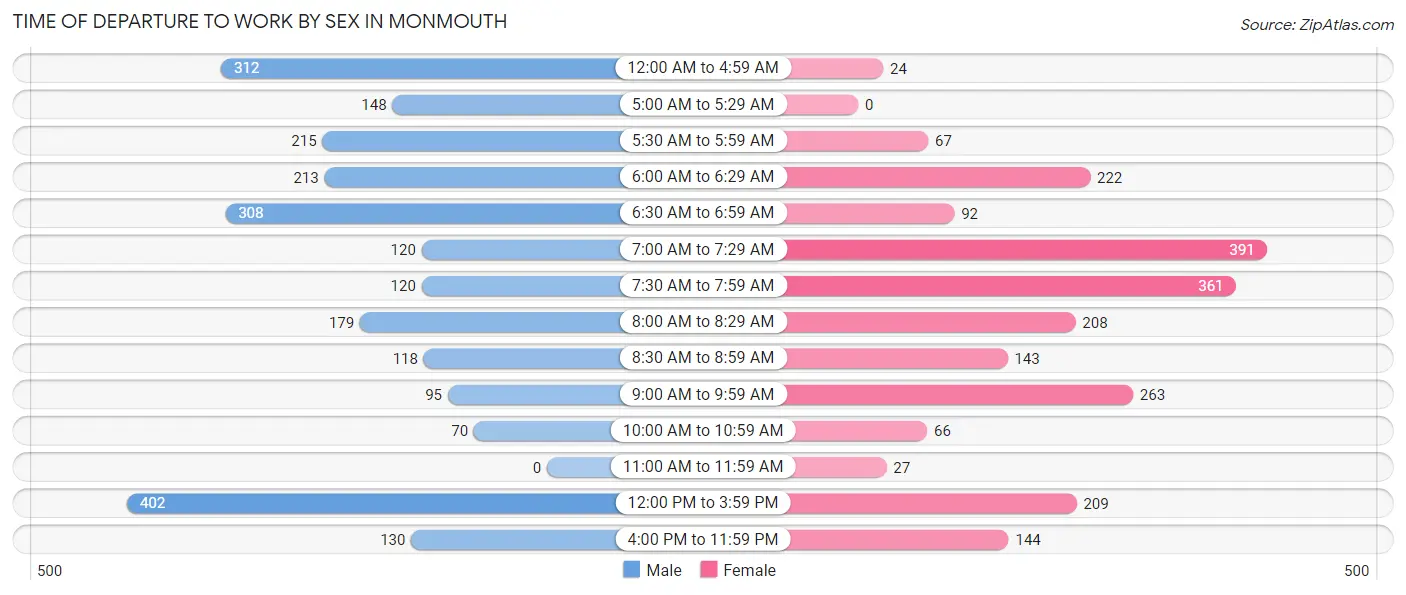
| Time of Departure | Male | Female |
| 12:00 AM to 4:59 AM | 312 (12.8%) | 24 (1.1%) |
| 5:00 AM to 5:29 AM | 148 (6.1%) | 0 (0.0%) |
| 5:30 AM to 5:59 AM | 215 (8.8%) | 67 (3.0%) |
| 6:00 AM to 6:29 AM | 213 (8.8%) | 222 (10.0%) |
| 6:30 AM to 6:59 AM | 308 (12.7%) | 92 (4.2%) |
| 7:00 AM to 7:29 AM | 120 (4.9%) | 391 (17.6%) |
| 7:30 AM to 7:59 AM | 120 (4.9%) | 361 (16.3%) |
| 8:00 AM to 8:29 AM | 179 (7.4%) | 208 (9.4%) |
| 8:30 AM to 8:59 AM | 118 (4.9%) | 143 (6.5%) |
| 9:00 AM to 9:59 AM | 95 (3.9%) | 263 (11.9%) |
| 10:00 AM to 10:59 AM | 70 (2.9%) | 66 (3.0%) |
| 11:00 AM to 11:59 AM | 0 (0.0%) | 27 (1.2%) |
| 12:00 PM to 3:59 PM | 402 (16.5%) | 209 (9.4%) |
| 4:00 PM to 11:59 PM | 130 (5.3%) | 144 (6.5%) |
| Total | 2,430 (100.0%) | 2,217 (100.0%) |
Housing Occupancy in Monmouth
Occupancy by Ownership in Monmouth
Of the total 3,356 dwellings in Monmouth, owner-occupied units account for 1,475 (44.0%), while renter-occupied units make up 1,881 (56.0%).
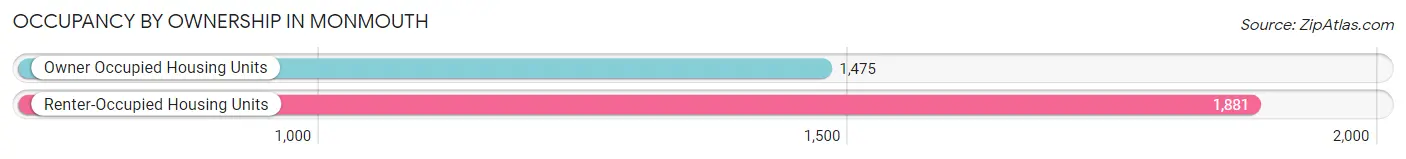
| Occupancy | # Housing Units | % Housing Units |
| Owner Occupied Housing Units | 1,475 | 44.0% |
| Renter-Occupied Housing Units | 1,881 | 56.0% |
| Total Occupied Housing Units | 3,356 | 100.0% |
Occupancy by Household Size in Monmouth
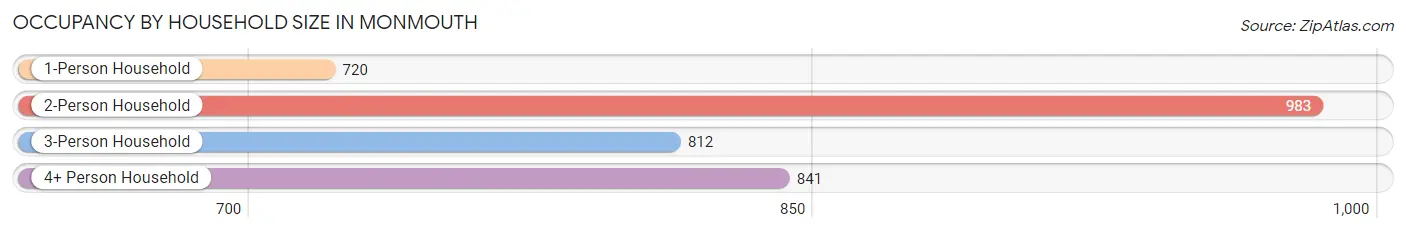
| Household Size | # Housing Units | % Housing Units |
| 1-Person Household | 720 | 21.4% |
| 2-Person Household | 983 | 29.3% |
| 3-Person Household | 812 | 24.2% |
| 4+ Person Household | 841 | 25.1% |
| Total Housing Units | 3,356 | 100.0% |
Occupancy by Ownership by Household Size in Monmouth
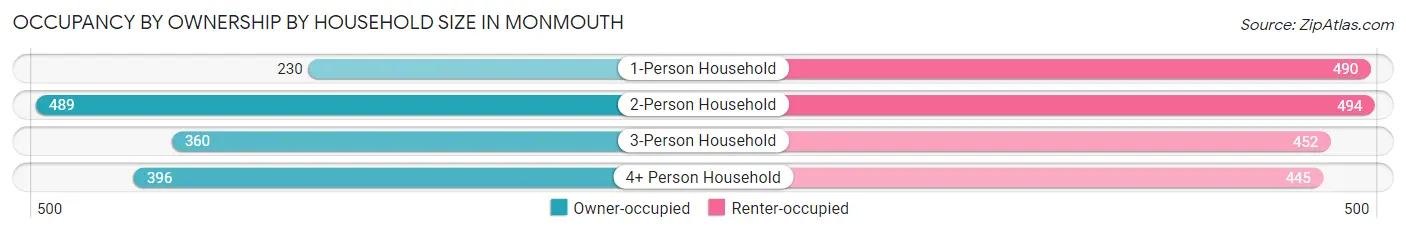
| Household Size | Owner-occupied | Renter-occupied |
| 1-Person Household | 230 (31.9%) | 490 (68.1%) |
| 2-Person Household | 489 (49.7%) | 494 (50.2%) |
| 3-Person Household | 360 (44.3%) | 452 (55.7%) |
| 4+ Person Household | 396 (47.1%) | 445 (52.9%) |
| Total Housing Units | 1,475 (44.0%) | 1,881 (56.0%) |
Occupancy by Educational Attainment in Monmouth
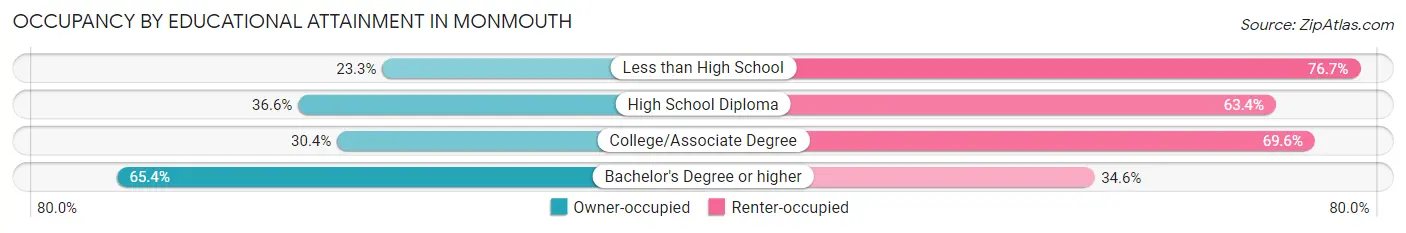
| Household Size | Owner-occupied | Renter-occupied |
| Less than High School | 40 (23.3%) | 132 (76.7%) |
| High School Diploma | 160 (36.6%) | 277 (63.4%) |
| College/Associate Degree | 454 (30.4%) | 1,038 (69.6%) |
| Bachelor's Degree or higher | 821 (65.4%) | 434 (34.6%) |
Occupancy by Age of Householder in Monmouth
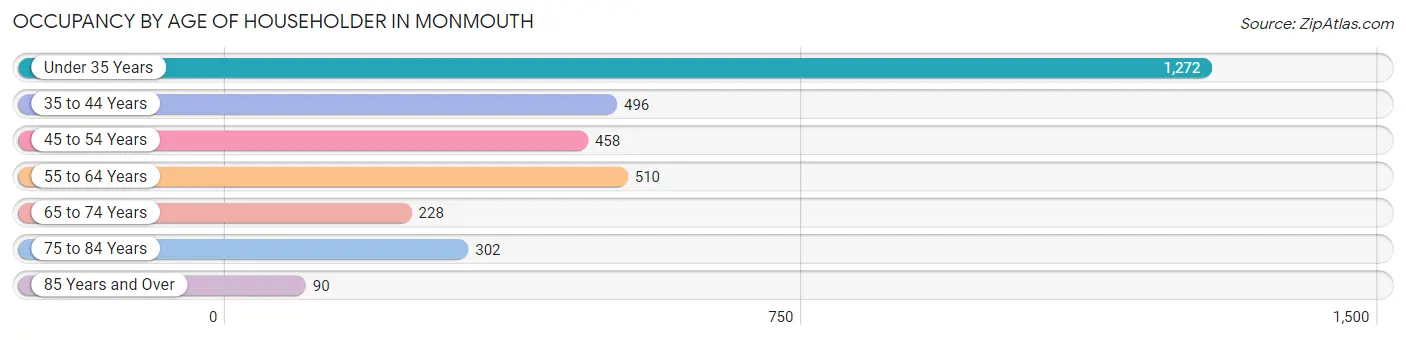
| Age Bracket | # Households | % Households |
| Under 35 Years | 1,272 | 37.9% |
| 35 to 44 Years | 496 | 14.8% |
| 45 to 54 Years | 458 | 13.7% |
| 55 to 64 Years | 510 | 15.2% |
| 65 to 74 Years | 228 | 6.8% |
| 75 to 84 Years | 302 | 9.0% |
| 85 Years and Over | 90 | 2.7% |
| Total | 3,356 | 100.0% |
Housing Finances in Monmouth
Median Income by Occupancy in Monmouth
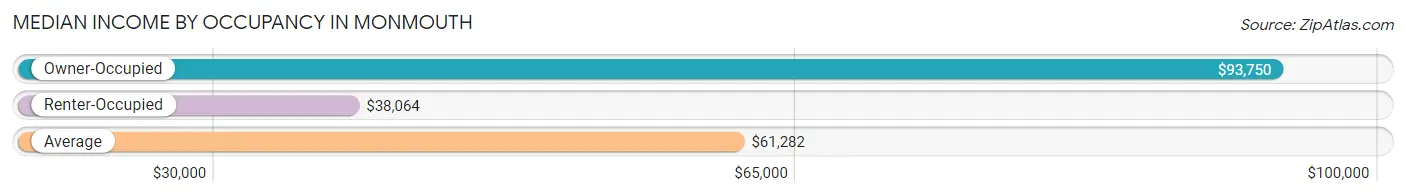
| Occupancy Type | # Households | Median Income |
| Owner-Occupied | 1,475 (44.0%) | $93,750 |
| Renter-Occupied | 1,881 (56.0%) | $38,064 |
| Average | 3,356 (100.0%) | $61,282 |
Occupancy by Householder Income Bracket in Monmouth
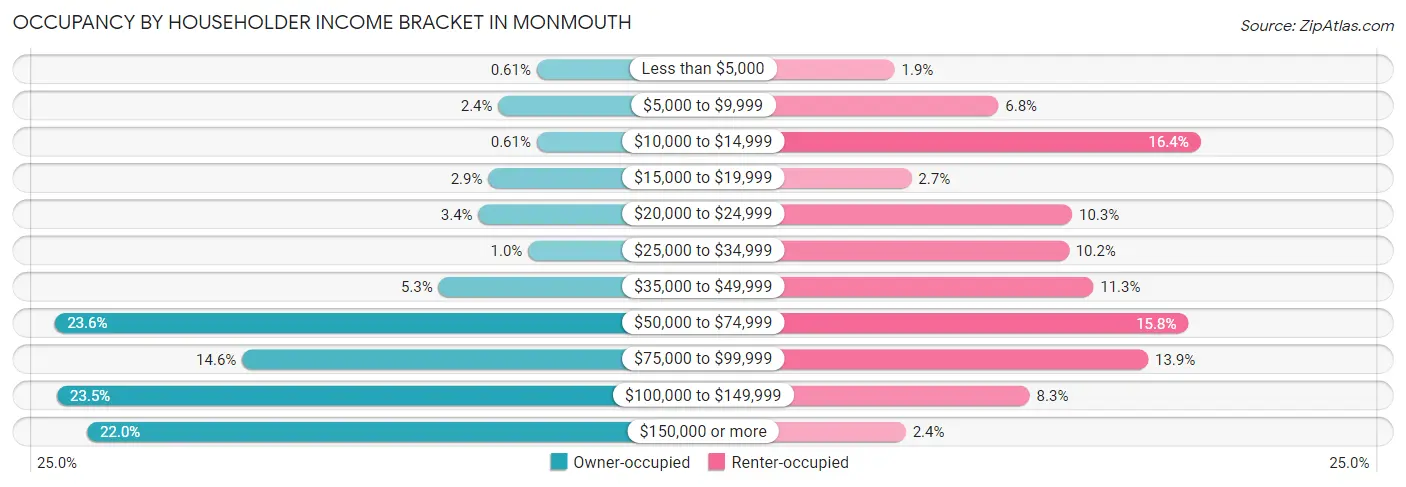
| Income Bracket | Owner-occupied | Renter-occupied |
| Less than $5,000 | 9 (0.6%) | 35 (1.9%) |
| $5,000 to $9,999 | 36 (2.4%) | 128 (6.8%) |
| $10,000 to $14,999 | 9 (0.6%) | 309 (16.4%) |
| $15,000 to $19,999 | 43 (2.9%) | 50 (2.7%) |
| $20,000 to $24,999 | 50 (3.4%) | 194 (10.3%) |
| $25,000 to $34,999 | 15 (1.0%) | 191 (10.2%) |
| $35,000 to $49,999 | 78 (5.3%) | 213 (11.3%) |
| $50,000 to $74,999 | 348 (23.6%) | 298 (15.8%) |
| $75,000 to $99,999 | 216 (14.6%) | 262 (13.9%) |
| $100,000 to $149,999 | 346 (23.5%) | 156 (8.3%) |
| $150,000 or more | 325 (22.0%) | 45 (2.4%) |
| Total | 1,475 (100.0%) | 1,881 (100.0%) |
Monthly Housing Cost Tiers in Monmouth
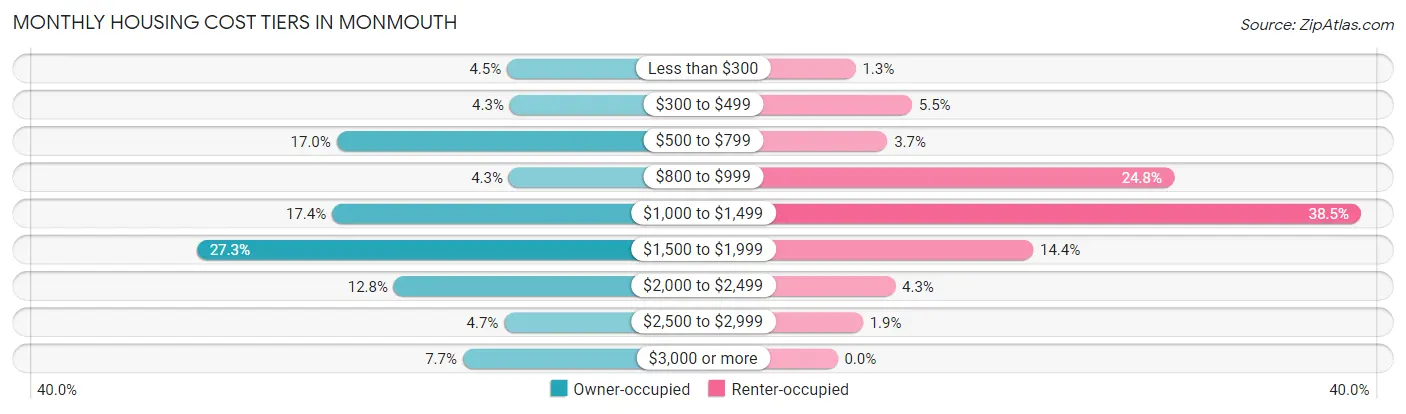
| Monthly Cost | Owner-occupied | Renter-occupied |
| Less than $300 | 66 (4.5%) | 25 (1.3%) |
| $300 to $499 | 63 (4.3%) | 103 (5.5%) |
| $500 to $799 | 251 (17.0%) | 69 (3.7%) |
| $800 to $999 | 64 (4.3%) | 466 (24.8%) |
| $1,000 to $1,499 | 256 (17.4%) | 725 (38.5%) |
| $1,500 to $1,999 | 403 (27.3%) | 271 (14.4%) |
| $2,000 to $2,499 | 189 (12.8%) | 80 (4.3%) |
| $2,500 to $2,999 | 69 (4.7%) | 35 (1.9%) |
| $3,000 or more | 114 (7.7%) | 0 (0.0%) |
| Total | 1,475 (100.0%) | 1,881 (100.0%) |
Physical Housing Characteristics in Monmouth
Housing Structures in Monmouth
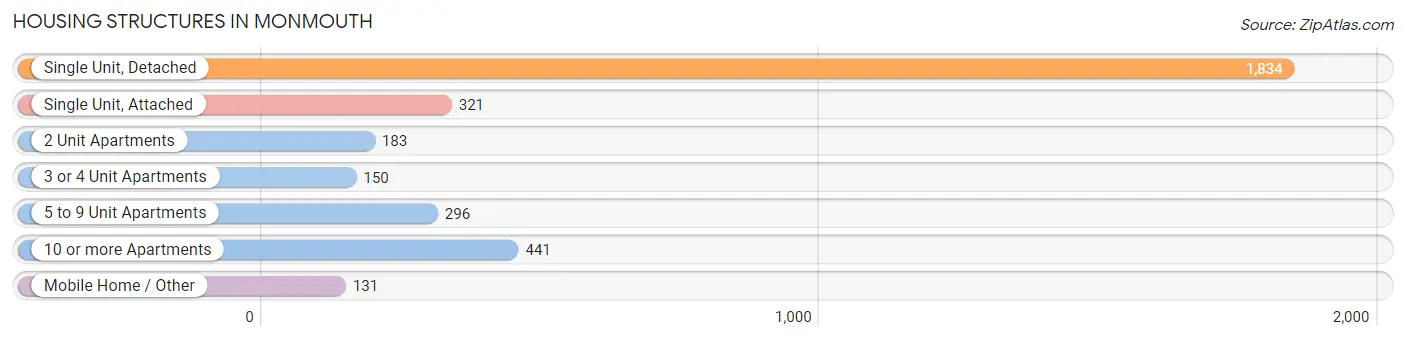
| Structure Type | # Housing Units | % Housing Units |
| Single Unit, Detached | 1,834 | 54.6% |
| Single Unit, Attached | 321 | 9.6% |
| 2 Unit Apartments | 183 | 5.4% |
| 3 or 4 Unit Apartments | 150 | 4.5% |
| 5 to 9 Unit Apartments | 296 | 8.8% |
| 10 or more Apartments | 441 | 13.1% |
| Mobile Home / Other | 131 | 3.9% |
| Total | 3,356 | 100.0% |
Housing Structures by Occupancy in Monmouth
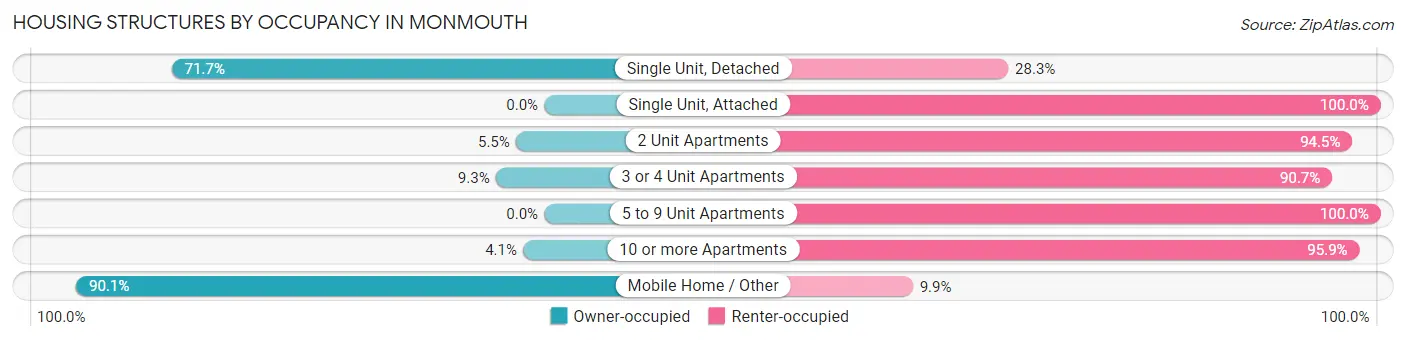
| Structure Type | Owner-occupied | Renter-occupied |
| Single Unit, Detached | 1,315 (71.7%) | 519 (28.3%) |
| Single Unit, Attached | 0 (0.0%) | 321 (100.0%) |
| 2 Unit Apartments | 10 (5.5%) | 173 (94.5%) |
| 3 or 4 Unit Apartments | 14 (9.3%) | 136 (90.7%) |
| 5 to 9 Unit Apartments | 0 (0.0%) | 296 (100.0%) |
| 10 or more Apartments | 18 (4.1%) | 423 (95.9%) |
| Mobile Home / Other | 118 (90.1%) | 13 (9.9%) |
| Total | 1,475 (44.0%) | 1,881 (56.0%) |
Housing Structures by Number of Rooms in Monmouth
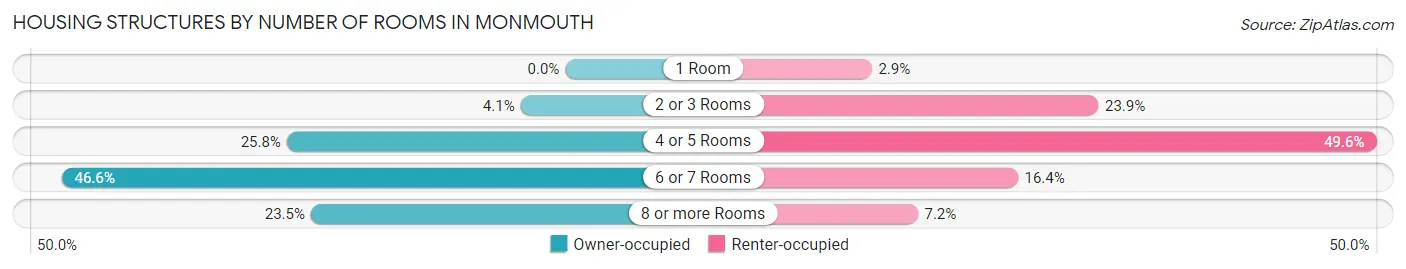
| Number of Rooms | Owner-occupied | Renter-occupied |
| 1 Room | 0 (0.0%) | 55 (2.9%) |
| 2 or 3 Rooms | 61 (4.1%) | 449 (23.9%) |
| 4 or 5 Rooms | 380 (25.8%) | 933 (49.6%) |
| 6 or 7 Rooms | 687 (46.6%) | 309 (16.4%) |
| 8 or more Rooms | 347 (23.5%) | 135 (7.2%) |
| Total | 1,475 (100.0%) | 1,881 (100.0%) |
Housing Structure by Heating Type in Monmouth
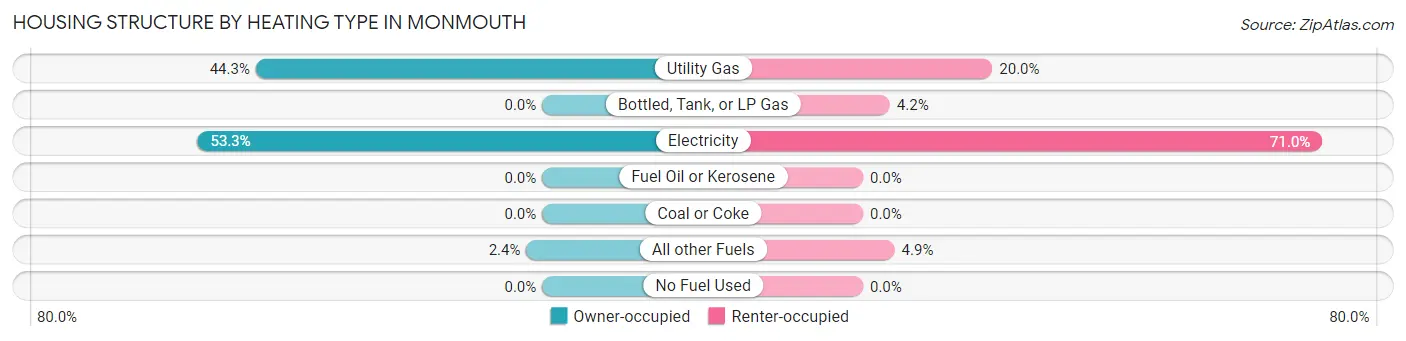
| Heating Type | Owner-occupied | Renter-occupied |
| Utility Gas | 653 (44.3%) | 376 (20.0%) |
| Bottled, Tank, or LP Gas | 0 (0.0%) | 78 (4.2%) |
| Electricity | 786 (53.3%) | 1,335 (71.0%) |
| Fuel Oil or Kerosene | 0 (0.0%) | 0 (0.0%) |
| Coal or Coke | 0 (0.0%) | 0 (0.0%) |
| All other Fuels | 36 (2.4%) | 92 (4.9%) |
| No Fuel Used | 0 (0.0%) | 0 (0.0%) |
| Total | 1,475 (100.0%) | 1,881 (100.0%) |
Household Vehicle Usage in Monmouth
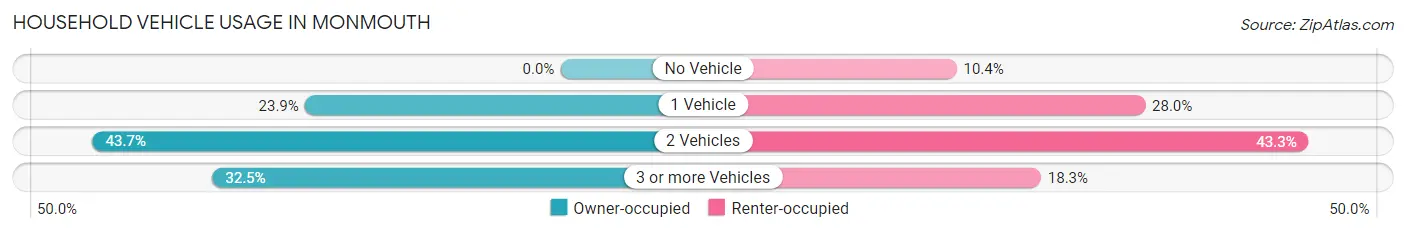
| Vehicles per Household | Owner-occupied | Renter-occupied |
| No Vehicle | 0 (0.0%) | 196 (10.4%) |
| 1 Vehicle | 352 (23.9%) | 527 (28.0%) |
| 2 Vehicles | 644 (43.7%) | 814 (43.3%) |
| 3 or more Vehicles | 479 (32.5%) | 344 (18.3%) |
| Total | 1,475 (100.0%) | 1,881 (100.0%) |
Real Estate & Mortgages in Monmouth
Real Estate and Mortgage Overview in Monmouth
| Characteristic | Without Mortgage | With Mortgage |
| Housing Units | 416 | 1,059 |
| Median Property Value | $305,100 | $361,300 |
| Median Household Income | $57,361 | $282 |
| Monthly Housing Costs | $580 | $114 |
| Real Estate Taxes | $3,302 | $21 |
Property Value by Mortgage Status in Monmouth
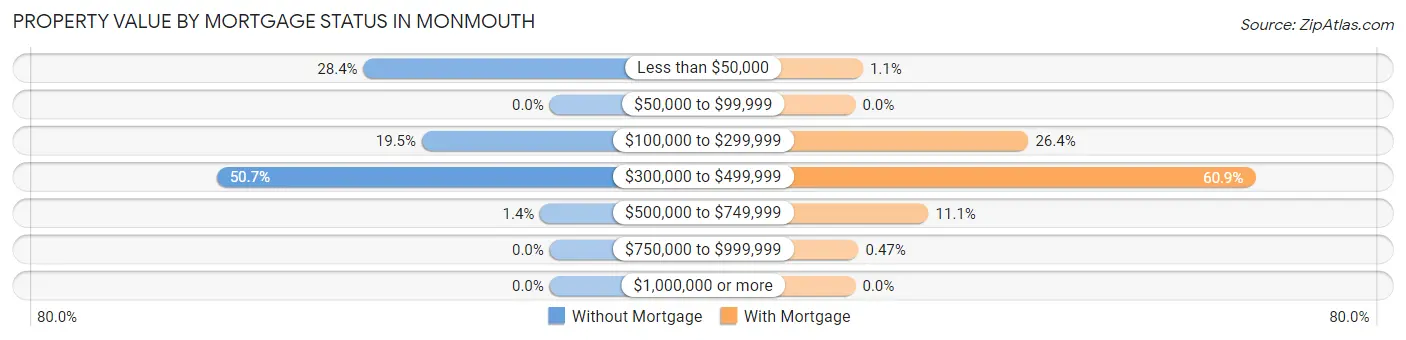
| Property Value | Without Mortgage | With Mortgage |
| Less than $50,000 | 118 (28.4%) | 12 (1.1%) |
| $50,000 to $99,999 | 0 (0.0%) | 0 (0.0%) |
| $100,000 to $299,999 | 81 (19.5%) | 279 (26.4%) |
| $300,000 to $499,999 | 211 (50.7%) | 645 (60.9%) |
| $500,000 to $749,999 | 6 (1.4%) | 118 (11.1%) |
| $750,000 to $999,999 | 0 (0.0%) | 5 (0.5%) |
| $1,000,000 or more | 0 (0.0%) | 0 (0.0%) |
| Total | 416 (100.0%) | 1,059 (100.0%) |
Household Income by Mortgage Status in Monmouth
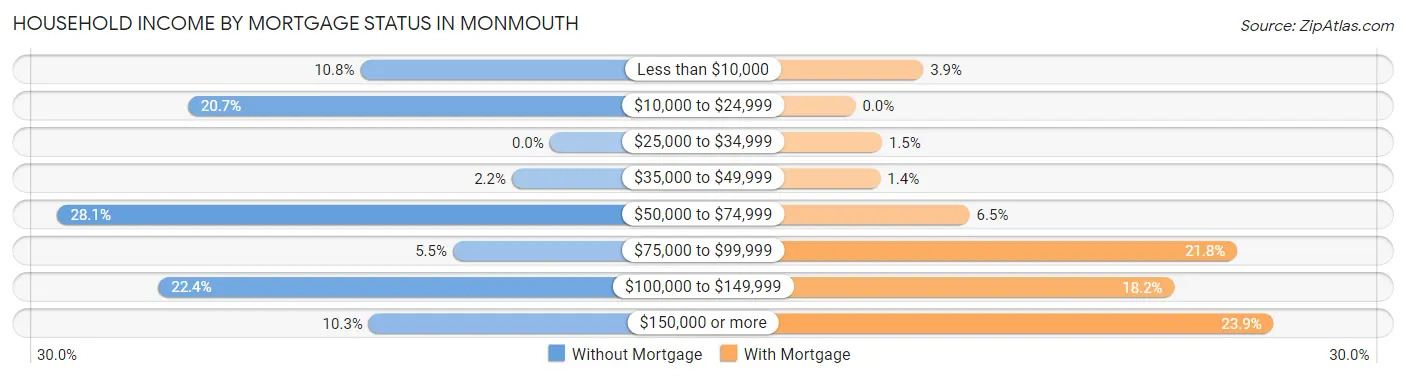
| Household Income | Without Mortgage | With Mortgage |
| Less than $10,000 | 45 (10.8%) | 41 (3.9%) |
| $10,000 to $24,999 | 86 (20.7%) | 0 (0.0%) |
| $25,000 to $34,999 | 0 (0.0%) | 16 (1.5%) |
| $35,000 to $49,999 | 9 (2.2%) | 15 (1.4%) |
| $50,000 to $74,999 | 117 (28.1%) | 69 (6.5%) |
| $75,000 to $99,999 | 23 (5.5%) | 231 (21.8%) |
| $100,000 to $149,999 | 93 (22.4%) | 193 (18.2%) |
| $150,000 or more | 43 (10.3%) | 253 (23.9%) |
| Total | 416 (100.0%) | 1,059 (100.0%) |
Property Value to Household Income Ratio in Monmouth
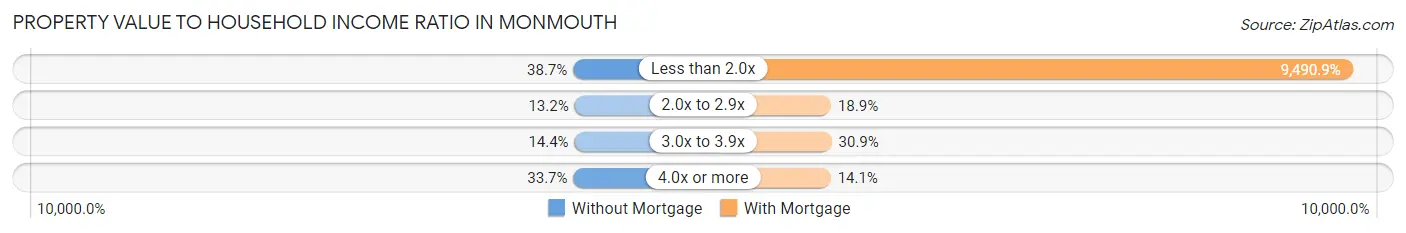
| Value-to-Income Ratio | Without Mortgage | With Mortgage |
| Less than 2.0x | 161 (38.7%) | 100,509 (9,490.9%) |
| 2.0x to 2.9x | 55 (13.2%) | 200 (18.9%) |
| 3.0x to 3.9x | 60 (14.4%) | 327 (30.9%) |
| 4.0x or more | 140 (33.7%) | 149 (14.1%) |
| Total | 416 (100.0%) | 1,059 (100.0%) |
Real Estate Taxes by Mortgage Status in Monmouth
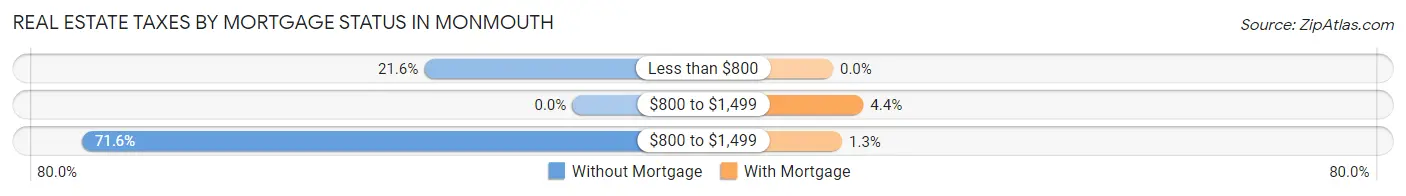
| Property Taxes | Without Mortgage | With Mortgage |
| Less than $800 | 90 (21.6%) | 0 (0.0%) |
| $800 to $1,499 | 0 (0.0%) | 47 (4.4%) |
| $800 to $1,499 | 298 (71.6%) | 14 (1.3%) |
| Total | 416 (100.0%) | 1,059 (100.0%) |
Health & Disability in Monmouth
Health Insurance Coverage by Age in Monmouth
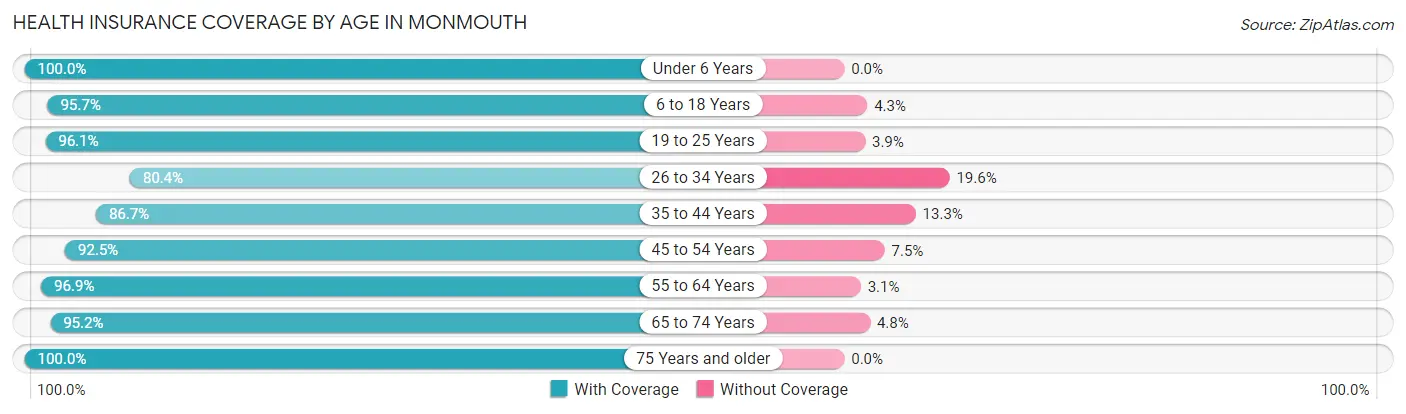
| Age Bracket | With Coverage | Without Coverage |
| Under 6 Years | 558 (100.0%) | 0 (0.0%) |
| 6 to 18 Years | 2,308 (95.7%) | 103 (4.3%) |
| 19 to 25 Years | 2,732 (96.1%) | 110 (3.9%) |
| 26 to 34 Years | 1,061 (80.4%) | 259 (19.6%) |
| 35 to 44 Years | 762 (86.7%) | 117 (13.3%) |
| 45 to 54 Years | 873 (92.5%) | 71 (7.5%) |
| 55 to 64 Years | 916 (96.9%) | 29 (3.1%) |
| 65 to 74 Years | 438 (95.2%) | 22 (4.8%) |
| 75 Years and older | 589 (100.0%) | 0 (0.0%) |
| Total | 10,237 (93.5%) | 711 (6.5%) |
Health Insurance Coverage by Citizenship Status in Monmouth
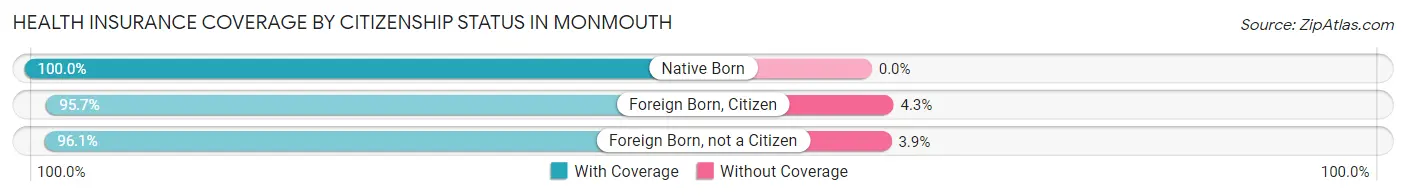
| Citizenship Status | With Coverage | Without Coverage |
| Native Born | 558 (100.0%) | 0 (0.0%) |
| Foreign Born, Citizen | 2,308 (95.7%) | 103 (4.3%) |
| Foreign Born, not a Citizen | 2,732 (96.1%) | 110 (3.9%) |
Health Insurance Coverage by Household Income in Monmouth
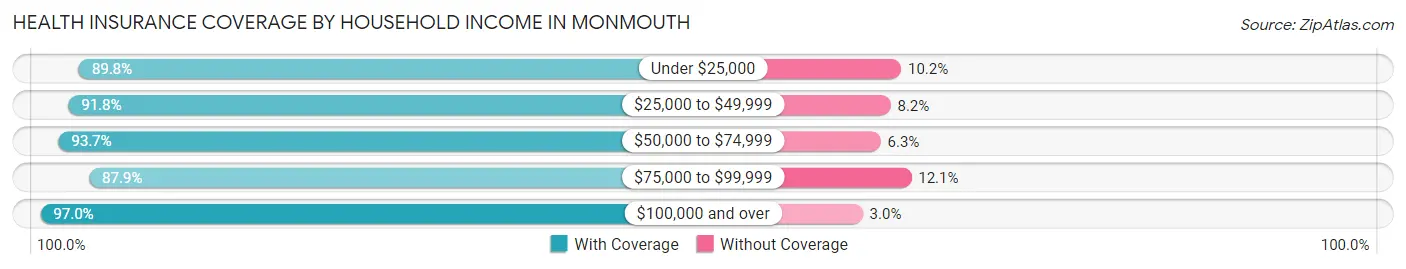
| Household Income | With Coverage | Without Coverage |
| Under $25,000 | 1,651 (89.8%) | 187 (10.2%) |
| $25,000 to $49,999 | 963 (91.8%) | 86 (8.2%) |
| $50,000 to $74,999 | 2,100 (93.7%) | 142 (6.3%) |
| $75,000 to $99,999 | 1,229 (87.9%) | 169 (12.1%) |
| $100,000 and over | 3,231 (97.0%) | 99 (3.0%) |
Public vs Private Health Insurance Coverage by Age in Monmouth
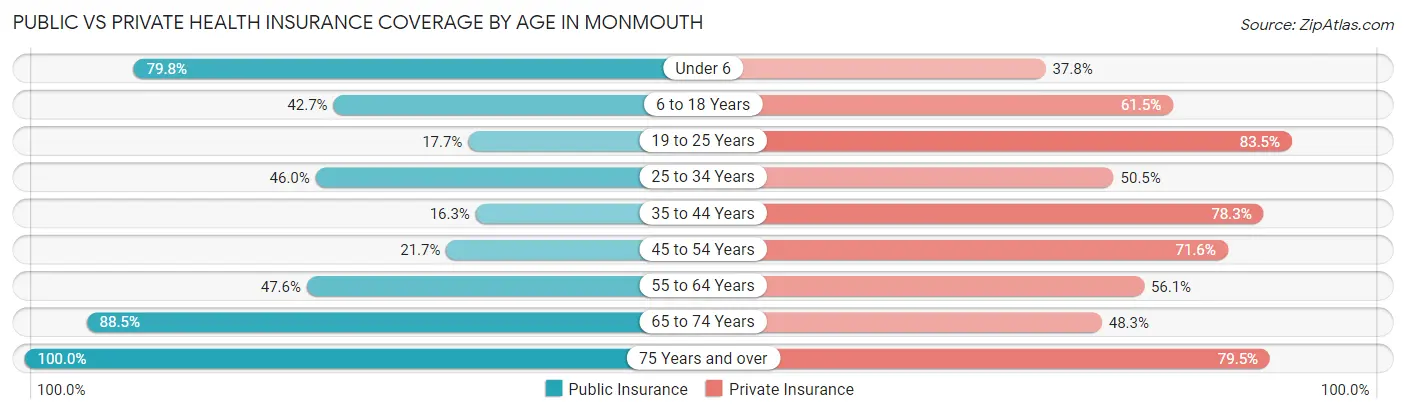
| Age Bracket | Public Insurance | Private Insurance |
| Under 6 | 445 (79.7%) | 211 (37.8%) |
| 6 to 18 Years | 1,029 (42.7%) | 1,482 (61.5%) |
| 19 to 25 Years | 502 (17.7%) | 2,374 (83.5%) |
| 25 to 34 Years | 607 (46.0%) | 666 (50.4%) |
| 35 to 44 Years | 143 (16.3%) | 688 (78.3%) |
| 45 to 54 Years | 205 (21.7%) | 676 (71.6%) |
| 55 to 64 Years | 450 (47.6%) | 530 (56.1%) |
| 65 to 74 Years | 407 (88.5%) | 222 (48.3%) |
| 75 Years and over | 589 (100.0%) | 468 (79.5%) |
| Total | 4,377 (40.0%) | 7,317 (66.8%) |
Disability Status by Sex by Age in Monmouth
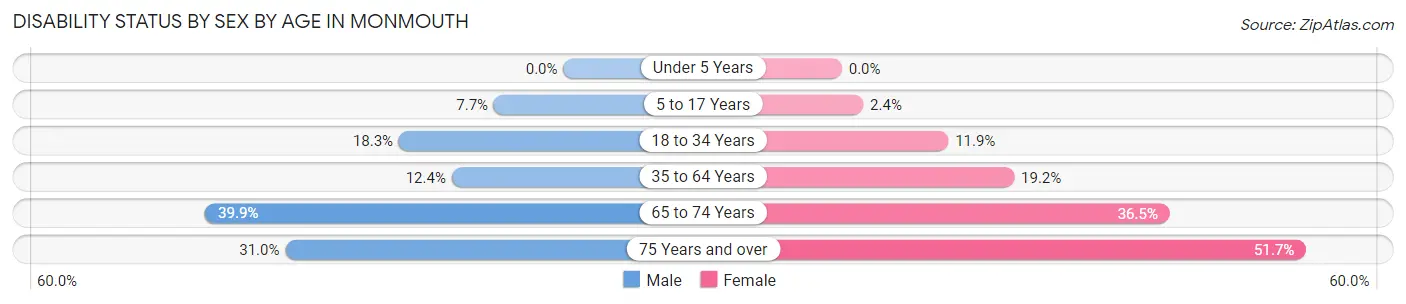
| Age Bracket | Male | Female |
| Under 5 Years | 0 (0.0%) | 0 (0.0%) |
| 5 to 17 Years | 88 (7.7%) | 20 (2.4%) |
| 18 to 34 Years | 416 (18.3%) | 290 (11.8%) |
| 35 to 64 Years | 173 (12.4%) | 264 (19.2%) |
| 65 to 74 Years | 71 (39.9%) | 103 (36.5%) |
| 75 Years and over | 83 (31.0%) | 166 (51.7%) |
Disability Class by Sex by Age in Monmouth
Disability Class: Hearing Difficulty
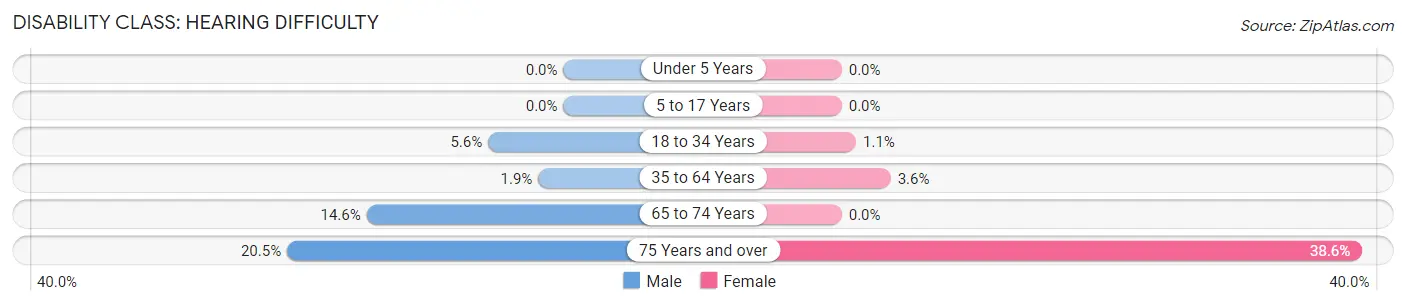
| Age Bracket | Male | Female |
| Under 5 Years | 0 (0.0%) | 0 (0.0%) |
| 5 to 17 Years | 0 (0.0%) | 0 (0.0%) |
| 18 to 34 Years | 127 (5.6%) | 26 (1.1%) |
| 35 to 64 Years | 26 (1.9%) | 50 (3.6%) |
| 65 to 74 Years | 26 (14.6%) | 0 (0.0%) |
| 75 Years and over | 55 (20.5%) | 124 (38.6%) |
Disability Class: Vision Difficulty
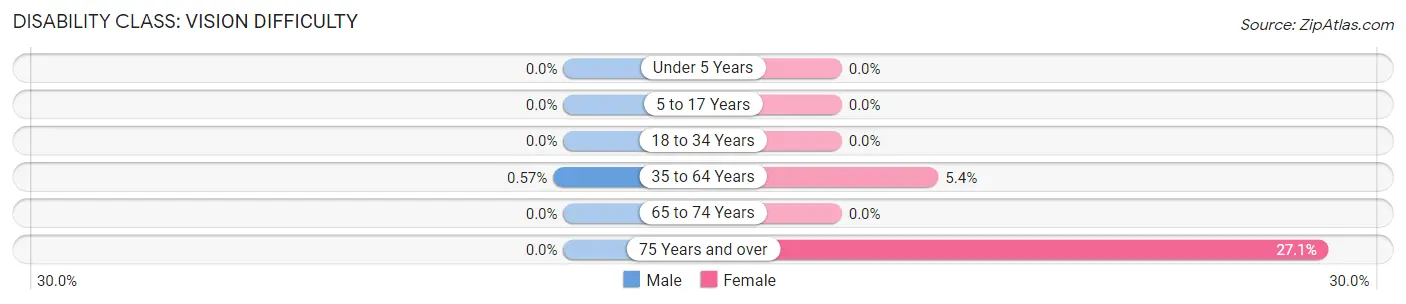
| Age Bracket | Male | Female |
| Under 5 Years | 0 (0.0%) | 0 (0.0%) |
| 5 to 17 Years | 0 (0.0%) | 0 (0.0%) |
| 18 to 34 Years | 0 (0.0%) | 0 (0.0%) |
| 35 to 64 Years | 8 (0.6%) | 74 (5.4%) |
| 65 to 74 Years | 0 (0.0%) | 0 (0.0%) |
| 75 Years and over | 0 (0.0%) | 87 (27.1%) |
Disability Class: Cognitive Difficulty
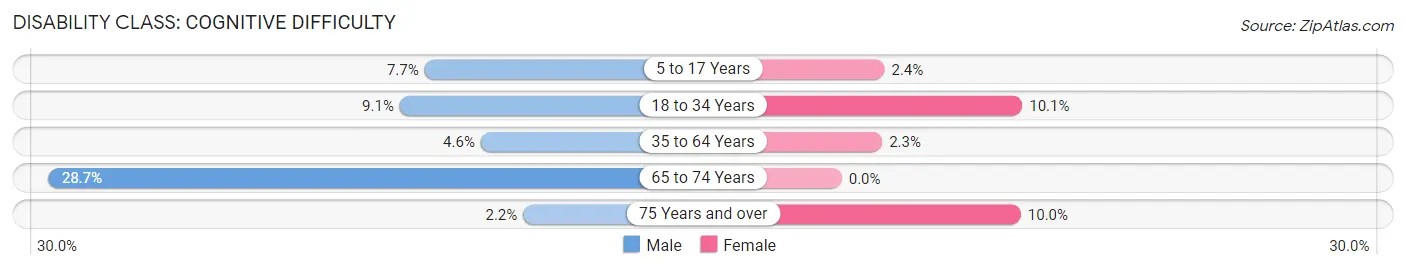
| Age Bracket | Male | Female |
| 5 to 17 Years | 88 (7.7%) | 20 (2.4%) |
| 18 to 34 Years | 207 (9.1%) | 246 (10.1%) |
| 35 to 64 Years | 64 (4.6%) | 31 (2.2%) |
| 65 to 74 Years | 51 (28.6%) | 0 (0.0%) |
| 75 Years and over | 6 (2.2%) | 32 (10.0%) |
Disability Class: Ambulatory Difficulty
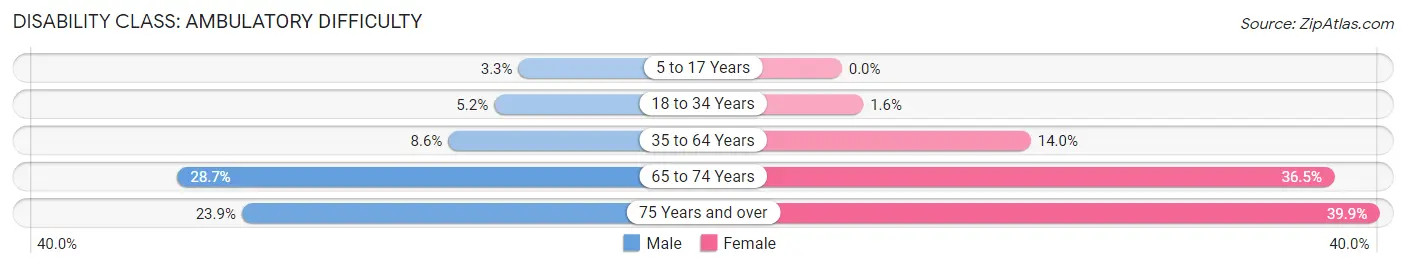
| Age Bracket | Male | Female |
| 5 to 17 Years | 38 (3.3%) | 0 (0.0%) |
| 18 to 34 Years | 117 (5.1%) | 39 (1.6%) |
| 35 to 64 Years | 119 (8.6%) | 193 (14.0%) |
| 65 to 74 Years | 51 (28.6%) | 103 (36.5%) |
| 75 Years and over | 64 (23.9%) | 128 (39.9%) |
Disability Class: Self-Care Difficulty
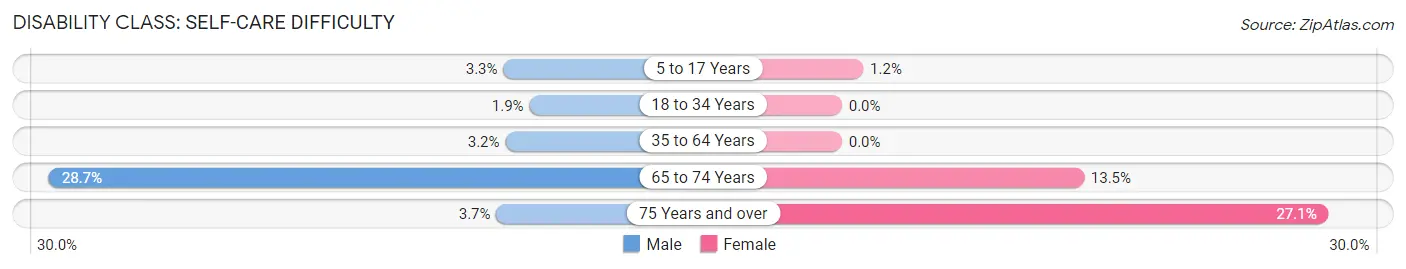
| Age Bracket | Male | Female |
| 5 to 17 Years | 38 (3.3%) | 10 (1.2%) |
| 18 to 34 Years | 43 (1.9%) | 0 (0.0%) |
| 35 to 64 Years | 45 (3.2%) | 0 (0.0%) |
| 65 to 74 Years | 51 (28.6%) | 38 (13.5%) |
| 75 Years and over | 10 (3.7%) | 87 (27.1%) |
Technology Access in Monmouth
Computing Device Access in Monmouth
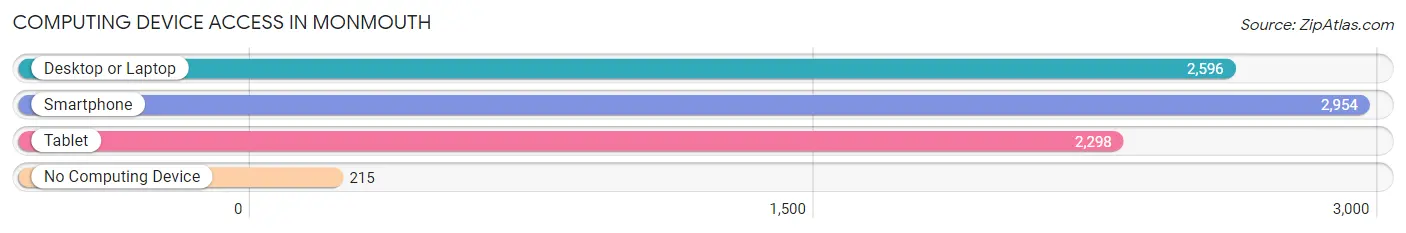
| Device Type | # Households | % Households |
| Desktop or Laptop | 2,596 | 77.3% |
| Smartphone | 2,954 | 88.0% |
| Tablet | 2,298 | 68.5% |
| No Computing Device | 215 | 6.4% |
| Total | 3,356 | 100.0% |
Internet Access in Monmouth
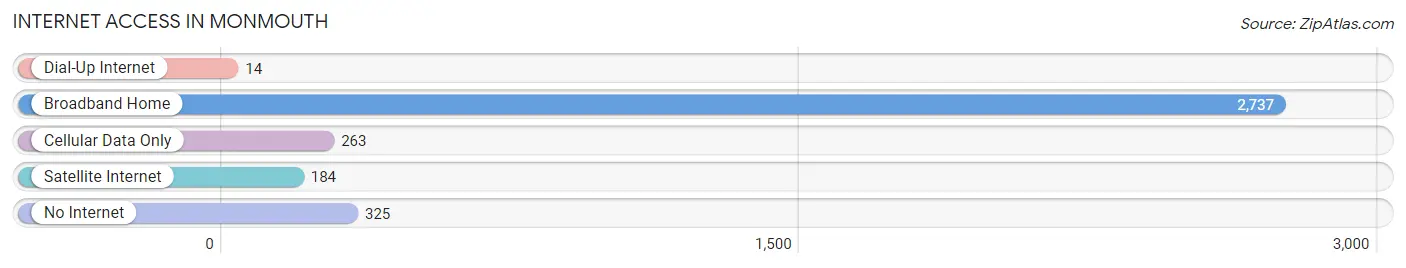
| Internet Type | # Households | % Households |
| Dial-Up Internet | 14 | 0.4% |
| Broadband Home | 2,737 | 81.6% |
| Cellular Data Only | 263 | 7.8% |
| Satellite Internet | 184 | 5.5% |
| No Internet | 325 | 9.7% |
| Total | 3,356 | 100.0% |
Monmouth Summary
Monmouth, Oregon is a small city located in the Willamette Valley of the Pacific Northwest. It is situated in Polk County, approximately 8 miles east of the state capital of Salem. The city has a population of approximately 10,000 people and is home to Western Oregon University.
History
Monmouth was founded in 1856 by a group of settlers from the Oregon Trail. The city was named after Monmouth, Illinois, the hometown of one of the settlers. The city was incorporated in 1882 and has since grown to become a thriving community.
The city was originally a farming community, but in the late 19th century, it became a center for the timber industry. The city was also home to a number of sawmills and lumber mills. In the early 20th century, the city began to diversify its economy and become a center for education and culture.
Geography
Monmouth is located in the Willamette Valley of the Pacific Northwest. The city is situated in Polk County, approximately 8 miles east of the state capital of Salem. The city is located on the banks of the Willamette River and is surrounded by rolling hills and lush forests. The city has a total area of 4.2 square miles and is located at an elevation of approximately 200 feet.
Economy
Monmouth’s economy is largely based on education, healthcare, and retail. Western Oregon University is the largest employer in the city, providing jobs for over 2,000 people. The city is also home to a number of healthcare facilities, including the Willamette Valley Medical Center and the Monmouth Medical Center. Retail is also an important part of the city’s economy, with a number of stores and restaurants located in the downtown area.
Demographics
As of the 2010 census, Monmouth had a population of 9,521 people. The racial makeup of the city was 87.3% White, 4.2% Hispanic or Latino, 2.2% Asian, 1.7% African American, and 0.7% Native American. The median household income was $41,945 and the median family income was $50,945. The per capita income was $20,945.
Monmouth is a diverse and vibrant city with a rich history and a bright future. The city is home to a number of educational and cultural institutions, as well as a thriving economy. The city is also home to a number of parks and recreational areas, making it a great place to live and work.
Common Questions
What is Per Capita Income in Monmouth?
Per Capita income in Monmouth is $25,277.
What is the Median Family Income in Monmouth?
Median Family Income in Monmouth is $77,933.
What is the Median Household income in Monmouth?
Median Household Income in Monmouth is $61,282.
What is Income or Wage Gap in Monmouth?
Income or Wage Gap in Monmouth is 39.5%.
Women in Monmouth earn 60.5 cents for every dollar earned by a man.
What is Inequality or Gini Index in Monmouth?
Inequality or Gini Index in Monmouth is 0.45.
What is the Total Population of Monmouth?
Total Population of Monmouth is 11,054.
What is the Total Male Population of Monmouth?
Total Male Population of Monmouth is 5,530.
What is the Total Female Population of Monmouth?
Total Female Population of Monmouth is 5,524.
What is the Ratio of Males per 100 Females in Monmouth?
There are 100.11 Males per 100 Females in Monmouth.
What is the Ratio of Females per 100 Males in Monmouth?
There are 99.89 Females per 100 Males in Monmouth.
What is the Median Population Age in Monmouth?
Median Population Age in Monmouth is 25.2 Years.
What is the Average Family Size in Monmouth
Average Family Size in Monmouth is 3.5 People.
What is the Average Household Size in Monmouth
Average Household Size in Monmouth is 2.9 People.
How Large is the Labor Force in Monmouth?
There are 5,496 People in the Labor Forcein in Monmouth.
What is the Percentage of People in the Labor Force in Monmouth?
61.3% of People are in the Labor Force in Monmouth.
What is the Unemployment Rate in Monmouth?
Unemployment Rate in Monmouth is 4.9%.