Manzanita, OR Map & Demographics
Manzanita Map
Manzanita Overview
$73,079
PER CAPITA INCOME
$94,107
AVG FAMILY INCOME
$77,650
AVG HOUSEHOLD INCOME
45.4%
WAGE / INCOME GAP [ % ]
54.6¢/ $1
WAGE / INCOME GAP [ $ ]
0.54
INEQUALITY / GINI INDEX
538
TOTAL POPULATION
280
MALE POPULATION
258
FEMALE POPULATION
108.53
MALES / 100 FEMALES
92.14
FEMALES / 100 MALES
64.5
MEDIAN AGE
2.2
AVG FAMILY SIZE
1.8
AVG HOUSEHOLD SIZE
171
LABOR FORCE [ PEOPLE ]
32.7%
PERCENT IN LABOR FORCE
12.3%
UNEMPLOYMENT RATE
Manzanita Zip Codes
Manzanita Area Codes
Income in Manzanita
Income Overview in Manzanita
Per Capita Income in Manzanita is $73,079, while median incomes of families and households are $94,107 and $77,650 respectively.
| Characteristic | Number | Measure |
| Per Capita Income | 538 | $73,079 |
| Median Family Income | 179 | $94,107 |
| Mean Family Income | 179 | $168,269 |
| Median Household Income | 295 | $77,650 |
| Mean Household Income | 295 | $128,603 |
| Income Deficit | 179 | $0 |
| Wage / Income Gap (%) | 538 | 45.38% |
| Wage / Income Gap ($) | 538 | 54.62¢ per $1 |
| Gini / Inequality Index | 538 | 0.54 |
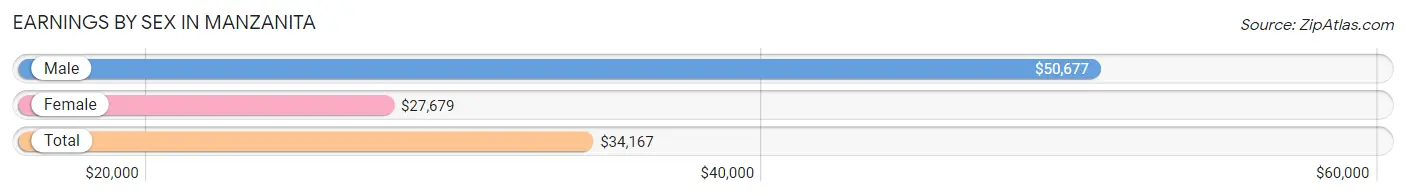
Earnings by Sex in Manzanita
Average Earnings in Manzanita are $34,167, $50,677 for men and $27,679 for women, a difference of 45.4%.
| Sex | Number | Average Earnings |
| Male | 129 (58.1%) | $50,677 |
| Female | 93 (41.9%) | $27,679 |
| Total | 222 (100.0%) | $34,167 |
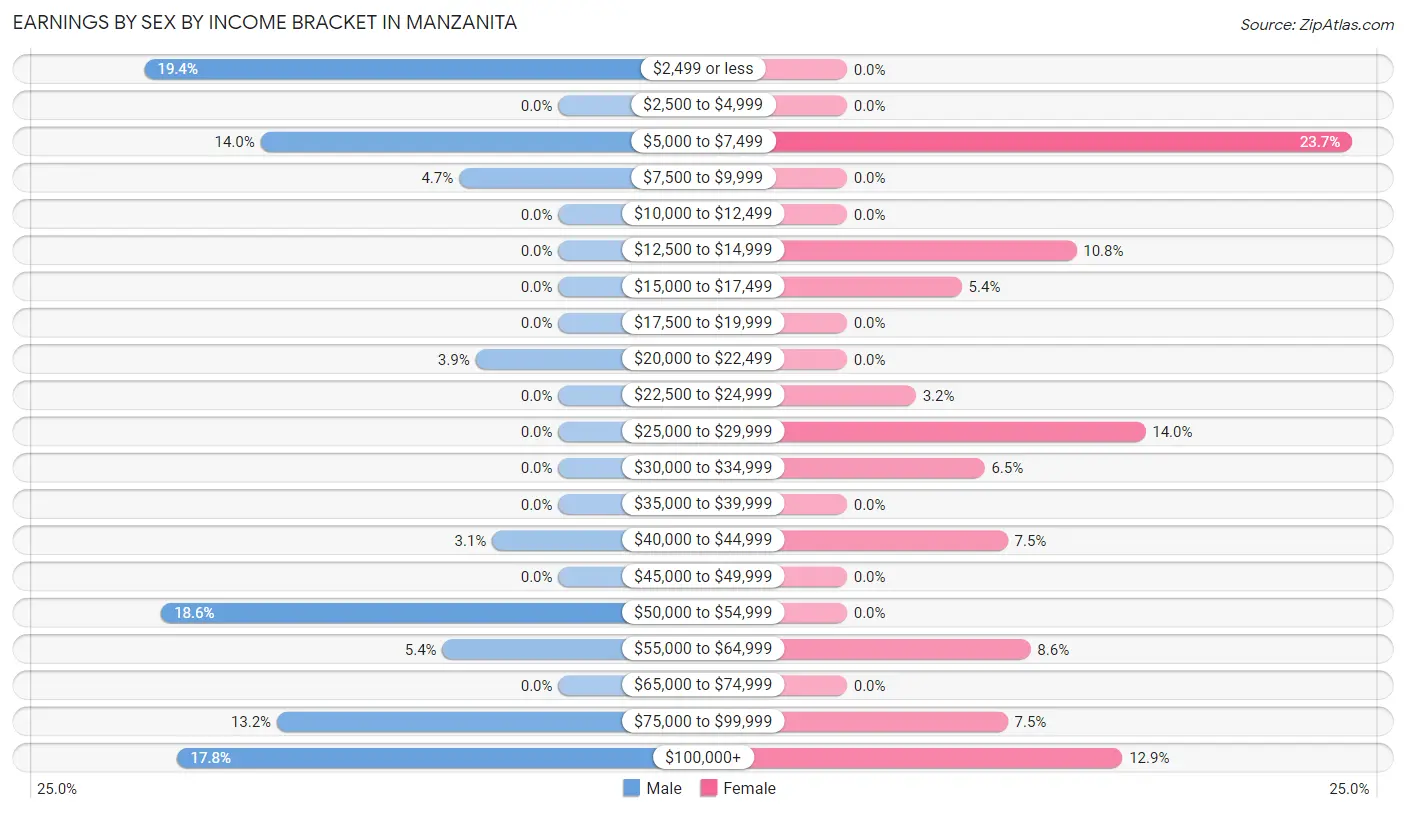
Earnings by Sex by Income Bracket in Manzanita
The most common earnings brackets in Manzanita are $2,499 or less for men (25 | 19.4%) and $5,000 to $7,499 for women (22 | 23.7%).
| Income | Male | Female |
| $2,499 or less | 25 (19.4%) | 0 (0.0%) |
| $2,500 to $4,999 | 0 (0.0%) | 0 (0.0%) |
| $5,000 to $7,499 | 18 (14.0%) | 22 (23.7%) |
| $7,500 to $9,999 | 6 (4.6%) | 0 (0.0%) |
| $10,000 to $12,499 | 0 (0.0%) | 0 (0.0%) |
| $12,500 to $14,999 | 0 (0.0%) | 10 (10.7%) |
| $15,000 to $17,499 | 0 (0.0%) | 5 (5.4%) |
| $17,500 to $19,999 | 0 (0.0%) | 0 (0.0%) |
| $20,000 to $22,499 | 5 (3.9%) | 0 (0.0%) |
| $22,500 to $24,999 | 0 (0.0%) | 3 (3.2%) |
| $25,000 to $29,999 | 0 (0.0%) | 13 (14.0%) |
| $30,000 to $34,999 | 0 (0.0%) | 6 (6.5%) |
| $35,000 to $39,999 | 0 (0.0%) | 0 (0.0%) |
| $40,000 to $44,999 | 4 (3.1%) | 7 (7.5%) |
| $45,000 to $49,999 | 0 (0.0%) | 0 (0.0%) |
| $50,000 to $54,999 | 24 (18.6%) | 0 (0.0%) |
| $55,000 to $64,999 | 7 (5.4%) | 8 (8.6%) |
| $65,000 to $74,999 | 0 (0.0%) | 0 (0.0%) |
| $75,000 to $99,999 | 17 (13.2%) | 7 (7.5%) |
| $100,000+ | 23 (17.8%) | 12 (12.9%) |
| Total | 129 (100.0%) | 93 (100.0%) |
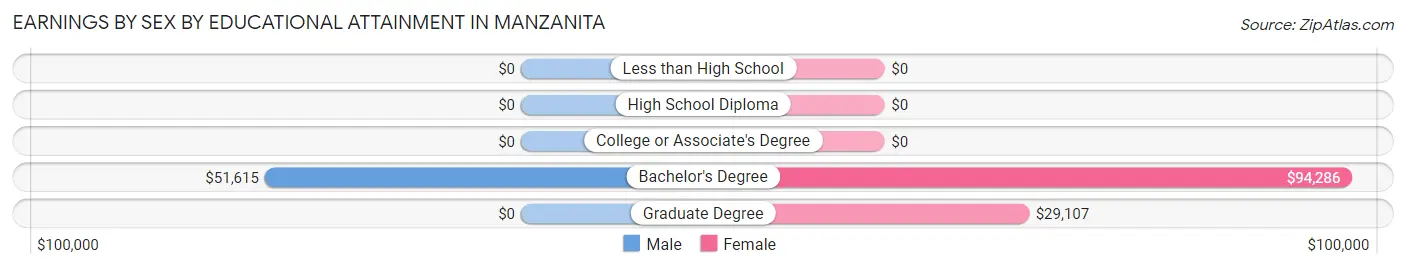
Earnings by Sex by Educational Attainment in Manzanita
Average earnings in Manzanita are $50,677 for men and $27,679 for women, a difference of 45.4%. Men with an educational attainment of bachelor's degree enjoy the highest average annual earnings of $51,615, while those with bachelor's degree education earn the least with $51,615. Women with an educational attainment of bachelor's degree earn the most with the average annual earnings of $94,286, while those with graduate degree education have the smallest earnings of $29,107.
| Educational Attainment | Male Income | Female Income |
| Less than High School | - | - |
| High School Diploma | - | - |
| College or Associate's Degree | - | - |
| Bachelor's Degree | $51,615 | $94,286 |
| Graduate Degree | - | - |
| Total | $50,677 | $27,679 |
Family Income in Manzanita
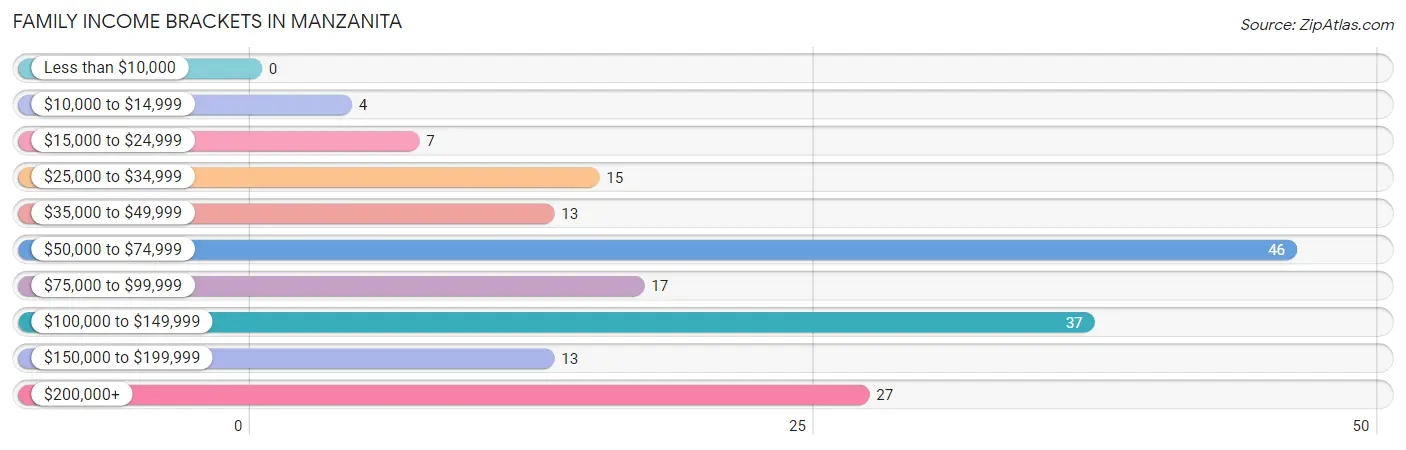
Family Income Brackets in Manzanita
According to the Manzanita family income data, there are 46 families falling into the $50,000 to $74,999 income range, which is the most common income bracket and makes up 25.7% of all families.
| Income Bracket | # Families | % Families |
| Less than $10,000 | 0 | 0.0% |
| $10,000 to $14,999 | 4 | 2.2% |
| $15,000 to $24,999 | 7 | 3.9% |
| $25,000 to $34,999 | 15 | 8.4% |
| $35,000 to $49,999 | 13 | 7.3% |
| $50,000 to $74,999 | 46 | 25.7% |
| $75,000 to $99,999 | 17 | 9.5% |
| $100,000 to $149,999 | 37 | 20.7% |
| $150,000 to $199,999 | 13 | 7.3% |
| $200,000+ | 27 | 15.1% |
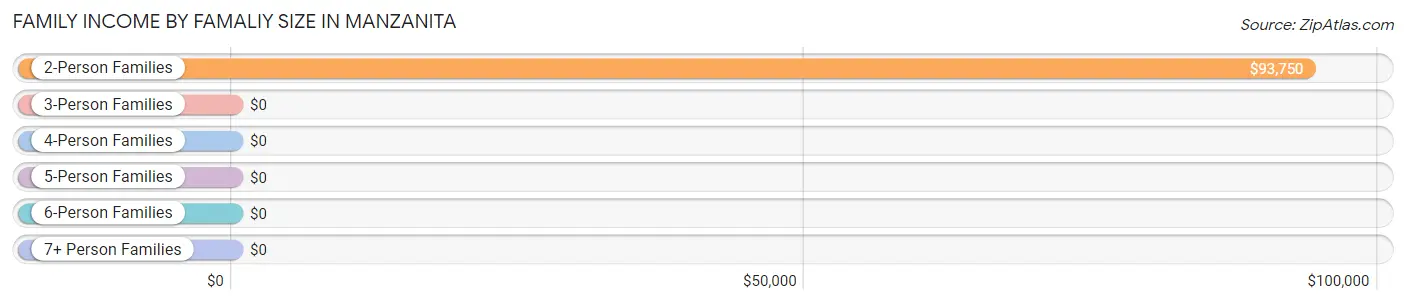
Family Income by Famaliy Size in Manzanita
2-person families (164 | 91.6%) account for the highest median family income in Manzanita with $93,750 per family, while 2-person families (164 | 91.6%) have the highest median income of $46,875 per family member.
| Income Bracket | # Families | Median Income |
| 2-Person Families | 164 (91.6%) | $93,750 |
| 3-Person Families | 15 (8.4%) | $0 |
| 4-Person Families | 0 (0.0%) | $0 |
| 5-Person Families | 0 (0.0%) | $0 |
| 6-Person Families | 0 (0.0%) | $0 |
| 7+ Person Families | 0 (0.0%) | $0 |
| Total | 179 (100.0%) | $94,107 |
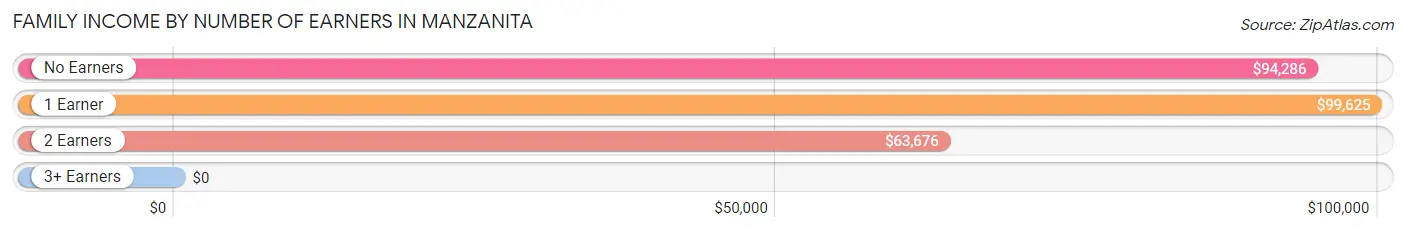
Family Income by Number of Earners in Manzanita
| Number of Earners | # Families | Median Income |
| No Earners | 98 (54.7%) | $94,286 |
| 1 Earner | 33 (18.4%) | $99,625 |
| 2 Earners | 48 (26.8%) | $63,676 |
| 3+ Earners | 0 (0.0%) | $0 |
| Total | 179 (100.0%) | $94,107 |
Household Income in Manzanita
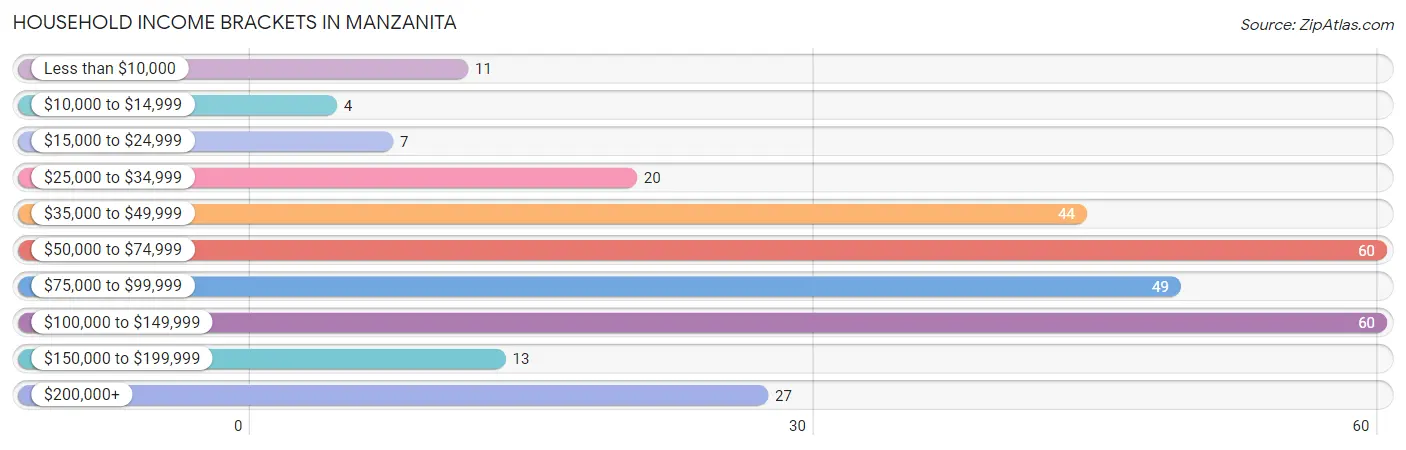
Household Income Brackets in Manzanita
With 60 households falling in the category, the $50,000 to $74,999 income range is the most frequent in Manzanita, accounting for 20.3% of all households. In contrast, only 4 households (1.4%) fall into the $10,000 to $14,999 income bracket, making it the least populous group.
| Income Bracket | # Households | % Households |
| Less than $10,000 | 11 | 3.7% |
| $10,000 to $14,999 | 4 | 1.4% |
| $15,000 to $24,999 | 7 | 2.4% |
| $25,000 to $34,999 | 20 | 6.8% |
| $35,000 to $49,999 | 44 | 14.9% |
| $50,000 to $74,999 | 60 | 20.3% |
| $75,000 to $99,999 | 49 | 16.6% |
| $100,000 to $149,999 | 60 | 20.3% |
| $150,000 to $199,999 | 13 | 4.4% |
| $200,000+ | 27 | 9.2% |
Household Income by Householder Age in Manzanita
The median household income in Manzanita is $77,650, with the highest median household income of $99,706 found in the 45 to 64 years age bracket for the primary householder. A total of 110 households (37.3%) fall into this category.
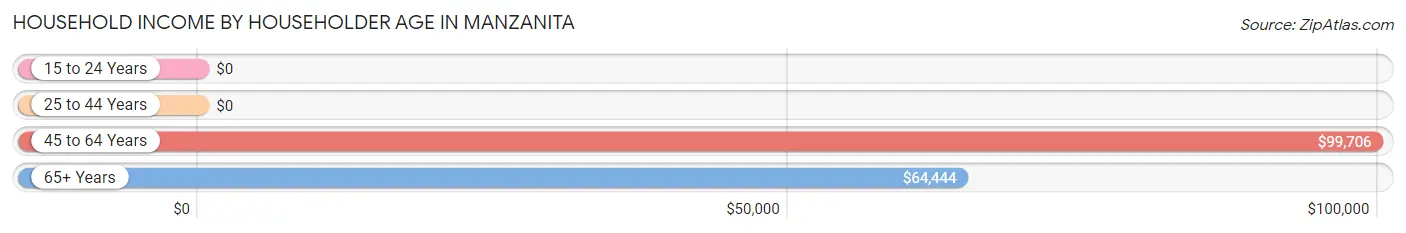
| Income Bracket | # Households | Median Income |
| 15 to 24 Years | 0 (0.0%) | $0 |
| 25 to 44 Years | 17 (5.8%) | $0 |
| 45 to 64 Years | 110 (37.3%) | $99,706 |
| 65+ Years | 168 (57.0%) | $64,444 |
| Total | 295 (100.0%) | $77,650 |
Poverty in Manzanita
Income Below Poverty by Sex and Age in Manzanita
With 14.3% poverty level for males and 4.3% for females among the residents of Manzanita, 12 to 14 year old males and 55 to 64 year old females are the most vulnerable to poverty, with 7 males (100.0%) and 9 females (13.2%) in their respective age groups living below the poverty level.
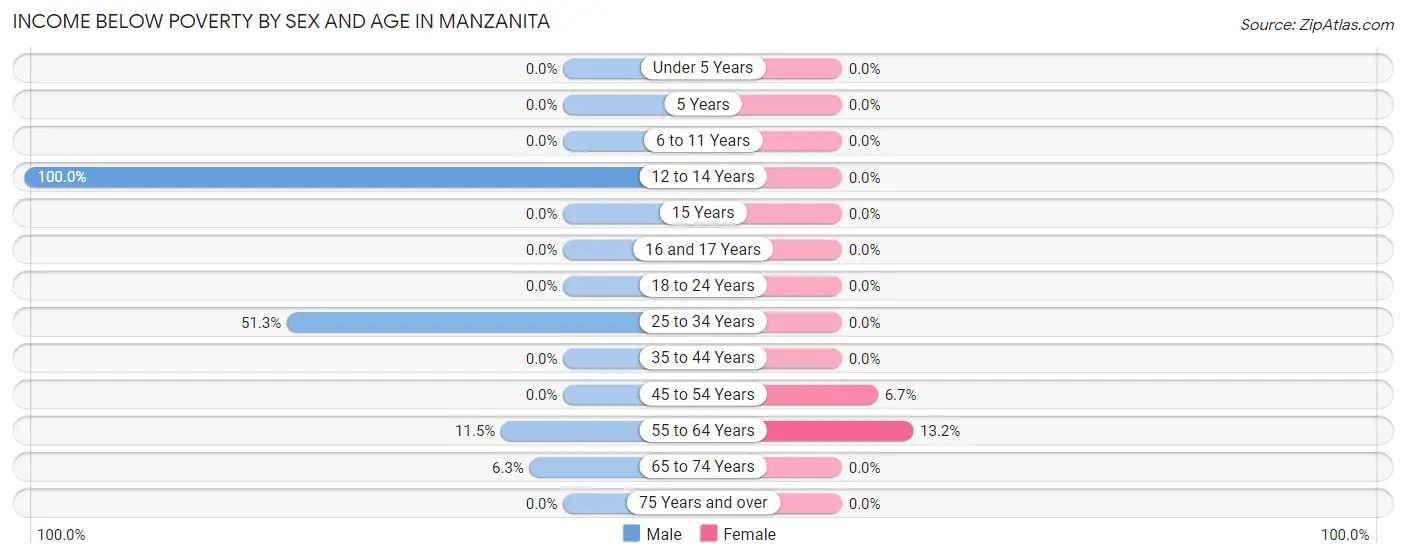
| Age Bracket | Male | Female |
| Under 5 Years | 0 (0.0%) | 0 (0.0%) |
| 5 Years | 0 (0.0%) | 0 (0.0%) |
| 6 to 11 Years | 0 (0.0%) | 0 (0.0%) |
| 12 to 14 Years | 7 (100.0%) | 0 (0.0%) |
| 15 Years | 0 (0.0%) | 0 (0.0%) |
| 16 and 17 Years | 0 (0.0%) | 0 (0.0%) |
| 18 to 24 Years | 0 (0.0%) | 0 (0.0%) |
| 25 to 34 Years | 20 (51.3%) | 0 (0.0%) |
| 35 to 44 Years | 0 (0.0%) | 0 (0.0%) |
| 45 to 54 Years | 0 (0.0%) | 2 (6.7%) |
| 55 to 64 Years | 9 (11.5%) | 9 (13.2%) |
| 65 to 74 Years | 4 (6.2%) | 0 (0.0%) |
| 75 Years and over | 0 (0.0%) | 0 (0.0%) |
| Total | 40 (14.3%) | 11 (4.3%) |
Income Above Poverty by Sex and Age in Manzanita
According to the poverty statistics in Manzanita, males aged 45 to 54 years and females aged 5 years are the age groups that are most secure financially, with 100.0% of males and 100.0% of females in these age groups living above the poverty line.
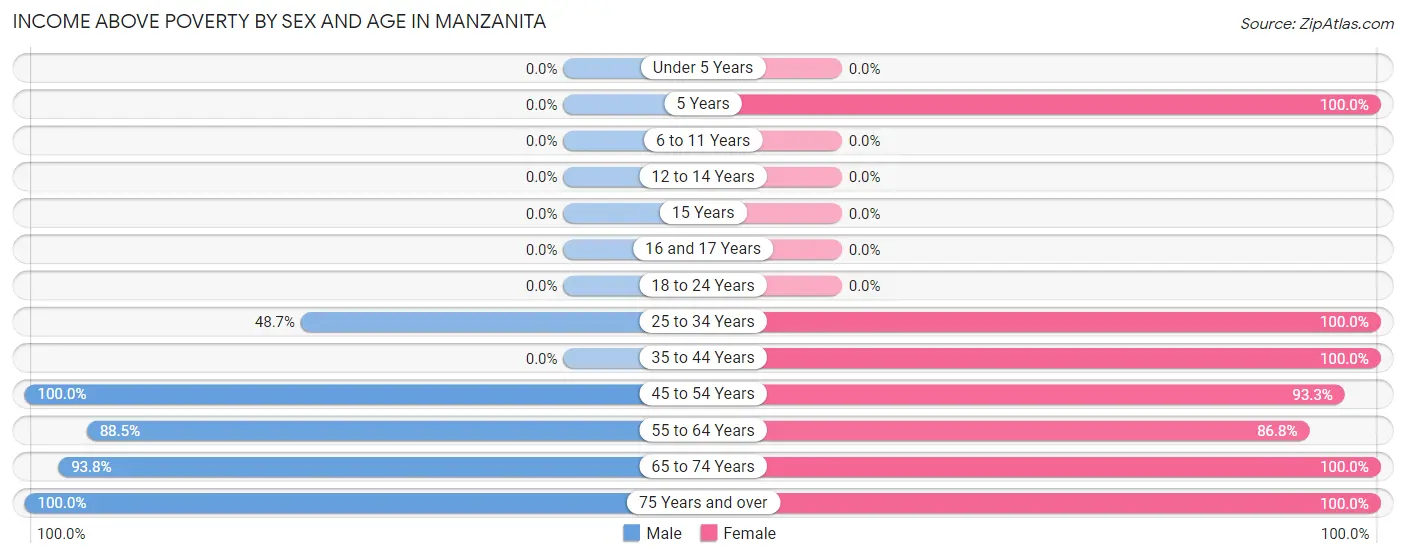
| Age Bracket | Male | Female |
| Under 5 Years | 0 (0.0%) | 0 (0.0%) |
| 5 Years | 0 (0.0%) | 8 (100.0%) |
| 6 to 11 Years | 0 (0.0%) | 0 (0.0%) |
| 12 to 14 Years | 0 (0.0%) | 0 (0.0%) |
| 15 Years | 0 (0.0%) | 0 (0.0%) |
| 16 and 17 Years | 0 (0.0%) | 0 (0.0%) |
| 18 to 24 Years | 0 (0.0%) | 0 (0.0%) |
| 25 to 34 Years | 19 (48.7%) | 12 (100.0%) |
| 35 to 44 Years | 0 (0.0%) | 14 (100.0%) |
| 45 to 54 Years | 19 (100.0%) | 28 (93.3%) |
| 55 to 64 Years | 69 (88.5%) | 59 (86.8%) |
| 65 to 74 Years | 60 (93.8%) | 61 (100.0%) |
| 75 Years and over | 73 (100.0%) | 65 (100.0%) |
| Total | 240 (85.7%) | 247 (95.7%) |
Income Below Poverty Among Married-Couple Families in Manzanita
The poverty statistics for married-couple families in Manzanita show that 2.5% or 4 of the total 162 families live below the poverty line. Families with 1 or 2 children have the highest poverty rate of 100.0%, comprising of 4 families. On the other hand, families with no children have the lowest poverty rate of 0.0%, which includes 0 families.
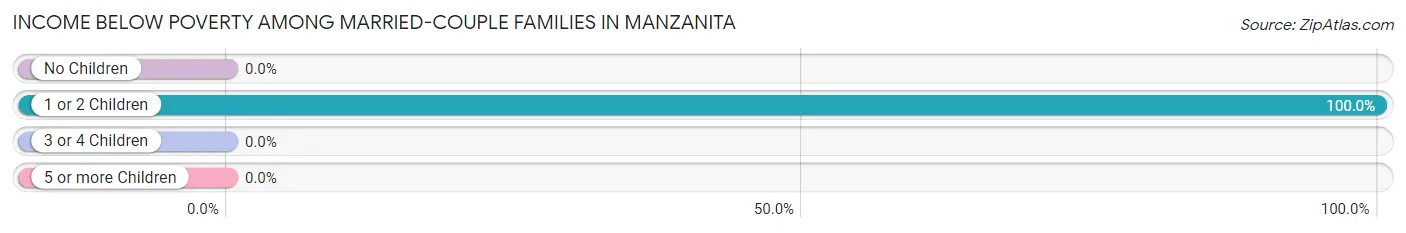
| Children | Above Poverty | Below Poverty |
| No Children | 158 (100.0%) | 0 (0.0%) |
| 1 or 2 Children | 0 (0.0%) | 4 (100.0%) |
| 3 or 4 Children | 0 (0.0%) | 0 (0.0%) |
| 5 or more Children | 0 (0.0%) | 0 (0.0%) |
| Total | 158 (97.5%) | 4 (2.5%) |
Income Below Poverty Among Single-Parent Households in Manzanita
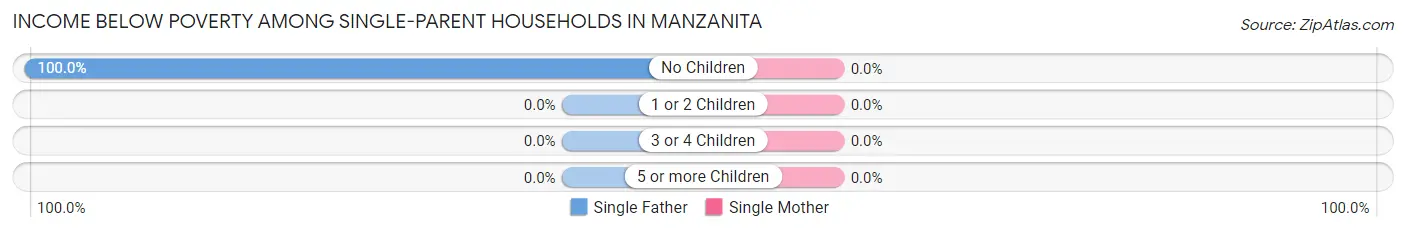
| Children | Single Father | Single Mother |
| No Children | 7 (100.0%) | 0 (0.0%) |
| 1 or 2 Children | 0 (0.0%) | 0 (0.0%) |
| 3 or 4 Children | 0 (0.0%) | 0 (0.0%) |
| 5 or more Children | 0 (0.0%) | 0 (0.0%) |
| Total | 7 (41.2%) | 0 (0.0%) |
Income Below Poverty Among Married-Couple vs Single-Parent Households in Manzanita
The poverty data for Manzanita shows that 4 of the married-couple family households (2.5%) and 7 of the single-parent households (41.2%) are living below the poverty level. Within the married-couple family households, those with 1 or 2 children have the highest poverty rate, with 4 households (100.0%) falling below the poverty line. Among the single-parent households, those with no children have the highest poverty rate, with 7 household (100.0%) living below poverty.
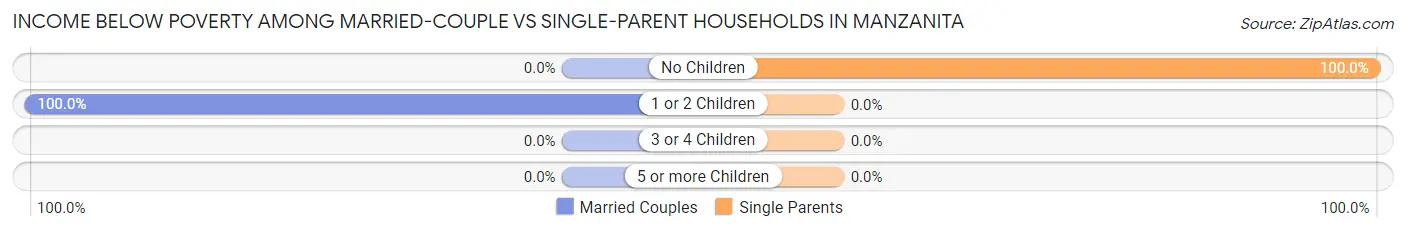
| Children | Married-Couple Families | Single-Parent Households |
| No Children | 0 (0.0%) | 7 (100.0%) |
| 1 or 2 Children | 4 (100.0%) | 0 (0.0%) |
| 3 or 4 Children | 0 (0.0%) | 0 (0.0%) |
| 5 or more Children | 0 (0.0%) | 0 (0.0%) |
| Total | 4 (2.5%) | 7 (41.2%) |
Race in Manzanita
The most populous races in Manzanita are White / Caucasian (514 | 95.5%), Two or more Races (17 | 3.2%), and Asian (7 | 1.3%).
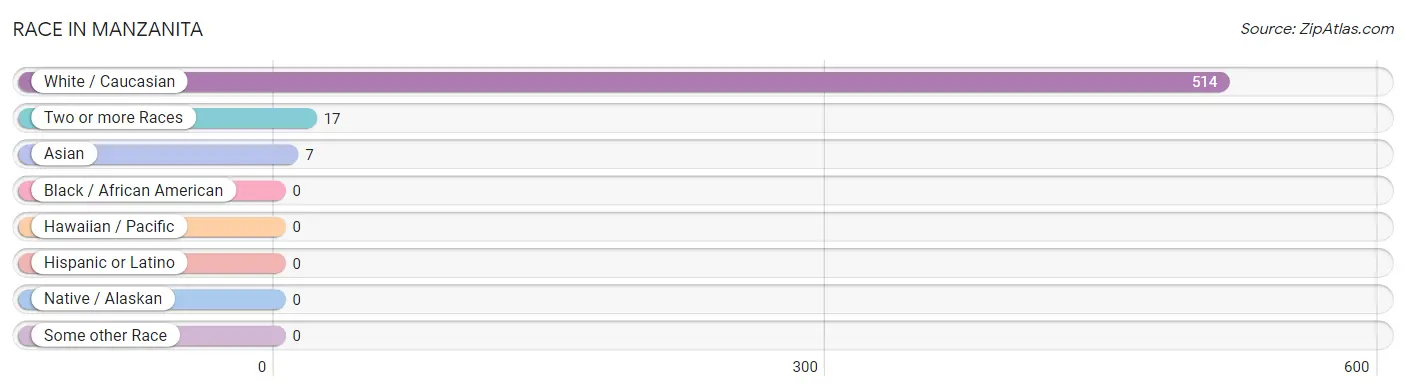
| Race | # Population | % Population |
| Asian | 7 | 1.3% |
| Black / African American | 0 | 0.0% |
| Hawaiian / Pacific | 0 | 0.0% |
| Hispanic or Latino | 0 | 0.0% |
| Native / Alaskan | 0 | 0.0% |
| White / Caucasian | 514 | 95.5% |
| Two or more Races | 17 | 3.2% |
| Some other Race | 0 | 0.0% |
| Total | 538 | 100.0% |
Ancestry in Manzanita
The most populous ancestries reported in Manzanita are English (127 | 23.6%), German (92 | 17.1%), Irish (78 | 14.5%), Swedish (23 | 4.3%), and Scandinavian (22 | 4.1%), together accounting for 63.6% of all Manzanita residents.
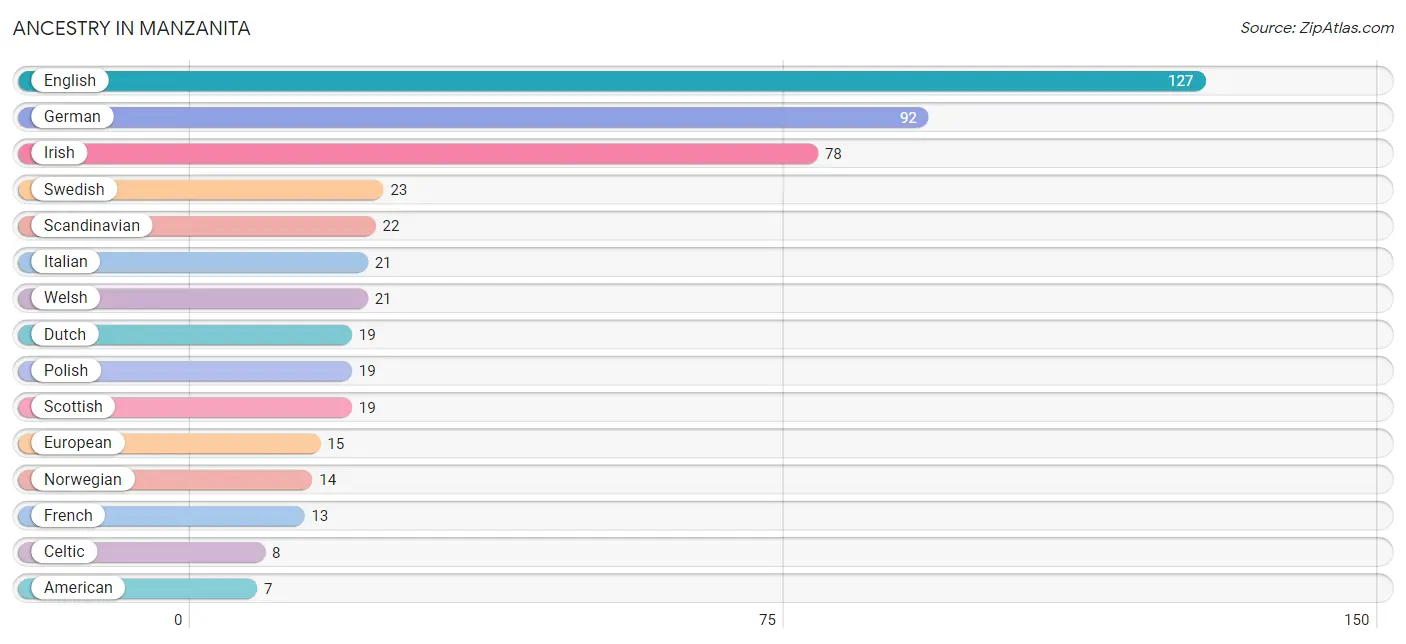
| Ancestry | # Population | % Population |
| American | 7 | 1.3% |
| Arab | 6 | 1.1% |
| British | 7 | 1.3% |
| Celtic | 8 | 1.5% |
| Danish | 5 | 0.9% |
| Dutch | 19 | 3.5% |
| Eastern European | 7 | 1.3% |
| English | 127 | 23.6% |
| European | 15 | 2.8% |
| French | 13 | 2.4% |
| German | 92 | 17.1% |
| Icelander | 7 | 1.3% |
| Irish | 78 | 14.5% |
| Italian | 21 | 3.9% |
| Korean | 7 | 1.3% |
| Lebanese | 6 | 1.1% |
| Norwegian | 14 | 2.6% |
| Polish | 19 | 3.5% |
| Portuguese | 5 | 0.9% |
| Scandinavian | 22 | 4.1% |
| Scotch-Irish | 5 | 0.9% |
| Scottish | 19 | 3.5% |
| Slovak | 7 | 1.3% |
| Swedish | 23 | 4.3% |
| Swiss | 7 | 1.3% |
| Welsh | 21 | 3.9% | View All 26 Rows |
Immigrants in Manzanita
The most numerous immigrant groups reported in Manzanita came from Europe (32 | 5.9%), Northern Europe (19 | 3.5%), England (16 | 3.0%), Western Europe (13 | 2.4%), and Asia (7 | 1.3%), together accounting for 16.2% of all Manzanita residents.
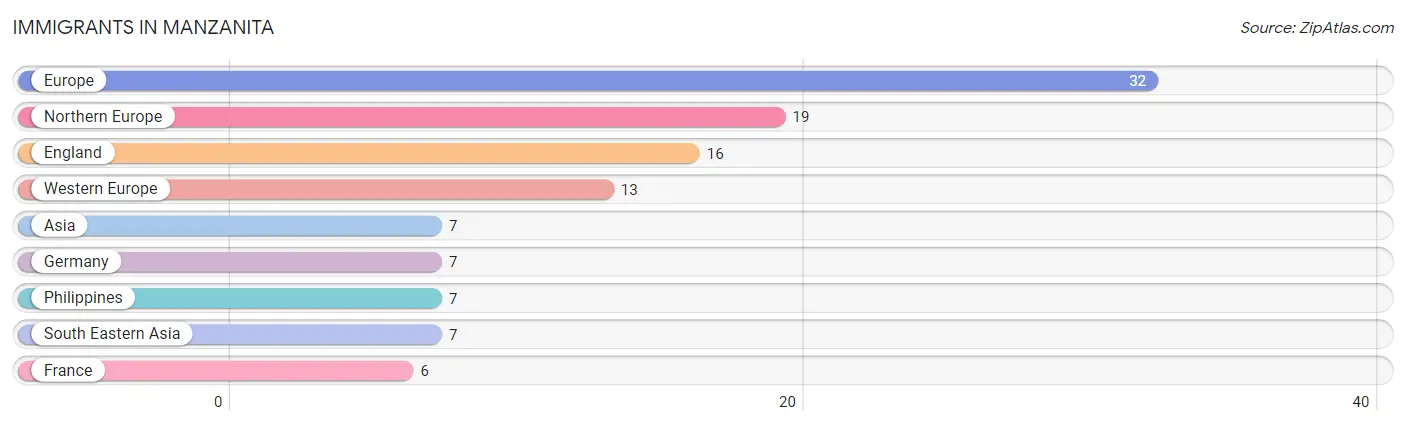
| Immigration Origin | # Population | % Population |
| Asia | 7 | 1.3% |
| England | 16 | 3.0% |
| Europe | 32 | 5.9% |
| France | 6 | 1.1% |
| Germany | 7 | 1.3% |
| Northern Europe | 19 | 3.5% |
| Philippines | 7 | 1.3% |
| South Eastern Asia | 7 | 1.3% |
| Western Europe | 13 | 2.4% | View All 9 Rows |
Sex and Age in Manzanita
Sex and Age in Manzanita
The most populous age groups in Manzanita are 60 to 64 Years (52 | 18.6%) for men and 65 to 69 Years (55 | 21.3%) for women.
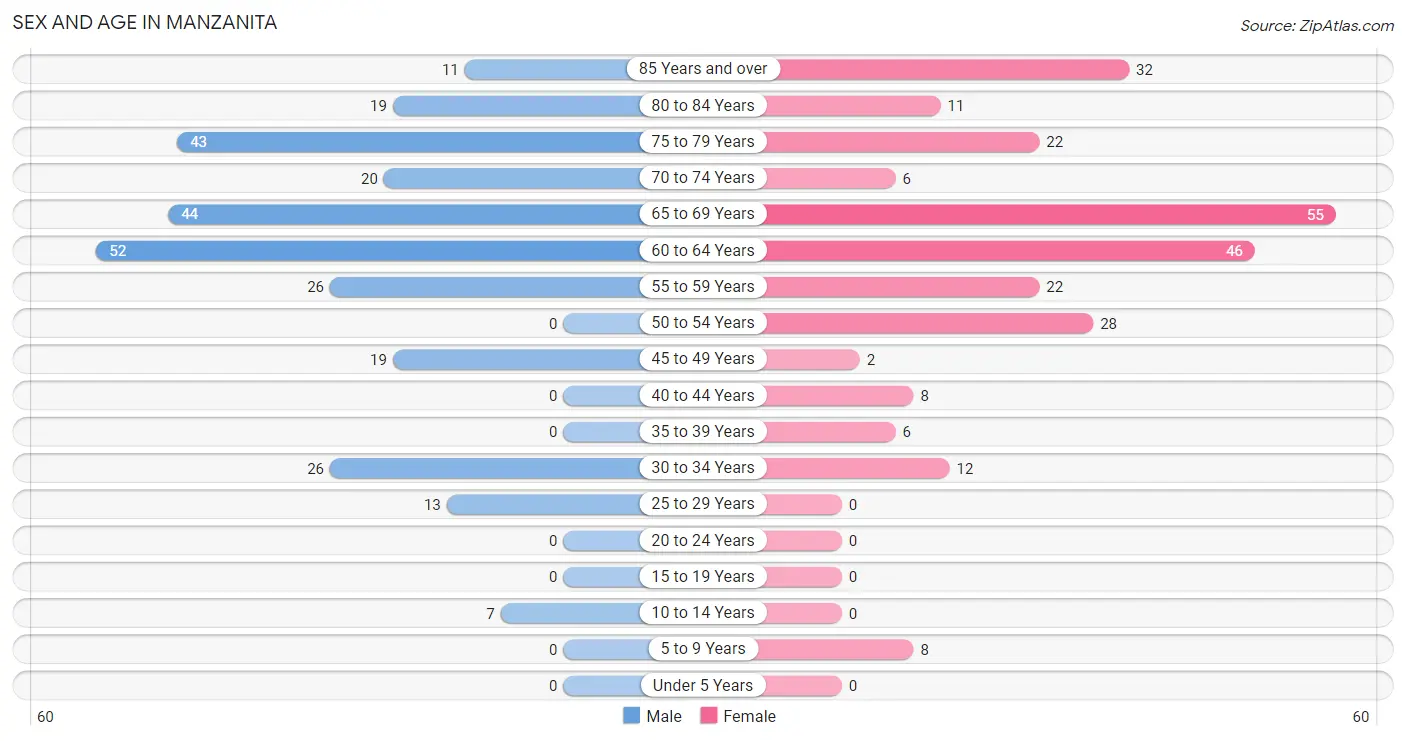
| Age Bracket | Male | Female |
| Under 5 Years | 0 (0.0%) | 0 (0.0%) |
| 5 to 9 Years | 0 (0.0%) | 8 (3.1%) |
| 10 to 14 Years | 7 (2.5%) | 0 (0.0%) |
| 15 to 19 Years | 0 (0.0%) | 0 (0.0%) |
| 20 to 24 Years | 0 (0.0%) | 0 (0.0%) |
| 25 to 29 Years | 13 (4.6%) | 0 (0.0%) |
| 30 to 34 Years | 26 (9.3%) | 12 (4.6%) |
| 35 to 39 Years | 0 (0.0%) | 6 (2.3%) |
| 40 to 44 Years | 0 (0.0%) | 8 (3.1%) |
| 45 to 49 Years | 19 (6.8%) | 2 (0.8%) |
| 50 to 54 Years | 0 (0.0%) | 28 (10.8%) |
| 55 to 59 Years | 26 (9.3%) | 22 (8.5%) |
| 60 to 64 Years | 52 (18.6%) | 46 (17.8%) |
| 65 to 69 Years | 44 (15.7%) | 55 (21.3%) |
| 70 to 74 Years | 20 (7.1%) | 6 (2.3%) |
| 75 to 79 Years | 43 (15.4%) | 22 (8.5%) |
| 80 to 84 Years | 19 (6.8%) | 11 (4.3%) |
| 85 Years and over | 11 (3.9%) | 32 (12.4%) |
| Total | 280 (100.0%) | 258 (100.0%) |
Families and Households in Manzanita
Median Family Size in Manzanita
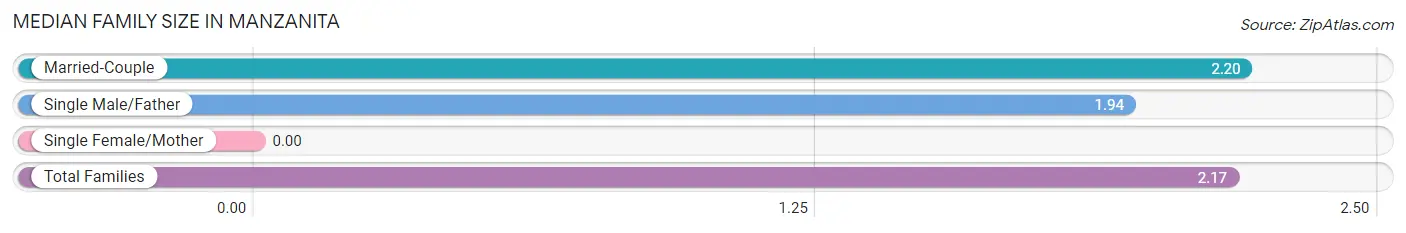
| Family Type | # Families | Family Size |
| Married-Couple | 162 (90.5%) | 2.20 |
| Single Male/Father | 17 (9.5%) | 1.94 |
| Single Female/Mother | 0 (0.0%) | - |
| Total Families | 179 (100.0%) | 2.17 |
Median Household Size in Manzanita
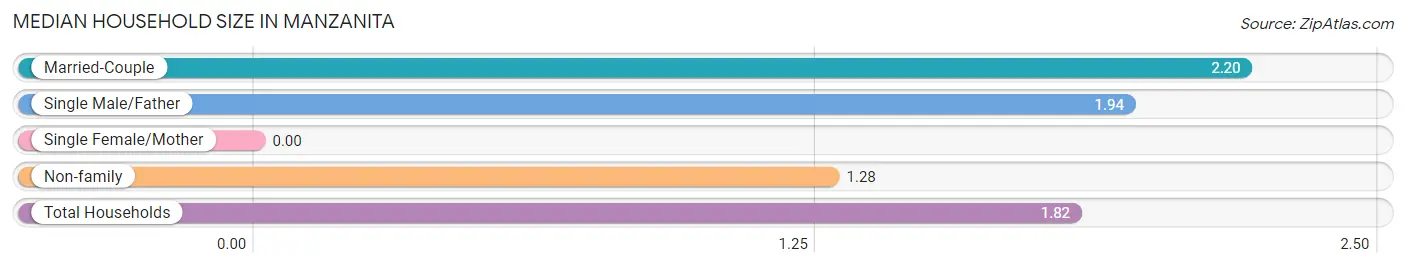
| Household Type | # Households | Household Size |
| Married-Couple | 162 (54.9%) | 2.20 |
| Single Male/Father | 17 (5.8%) | 1.94 |
| Single Female/Mother | 0 (0.0%) | - |
| Non-family | 116 (39.3%) | 1.28 |
| Total Households | 295 (100.0%) | 1.82 |
Household Size by Marriage Status in Manzanita
Out of a total of 295 households in Manzanita, 179 (60.7%) are family households, while 116 (39.3%) are nonfamily households. The most numerous type of family households are 2-person households, comprising 164, and the most common type of nonfamily households are 1-person households, comprising 93.
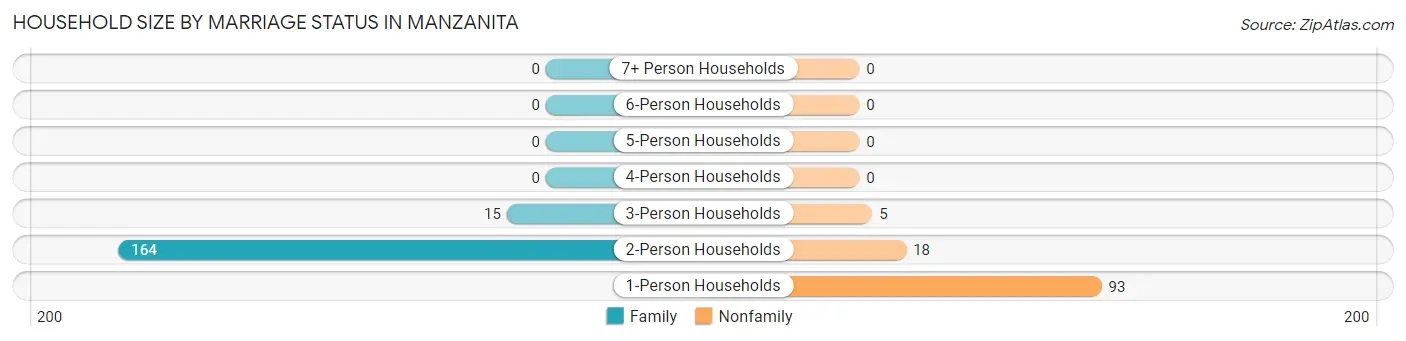
| Household Size | Family Households | Nonfamily Households |
| 1-Person Households | - | 93 (31.5%) |
| 2-Person Households | 164 (55.6%) | 18 (6.1%) |
| 3-Person Households | 15 (5.1%) | 5 (1.7%) |
| 4-Person Households | 0 (0.0%) | 0 (0.0%) |
| 5-Person Households | 0 (0.0%) | 0 (0.0%) |
| 6-Person Households | 0 (0.0%) | 0 (0.0%) |
| 7+ Person Households | 0 (0.0%) | 0 (0.0%) |
| Total | 179 (60.7%) | 116 (39.3%) |
Female Fertility in Manzanita
Fertility by Age in Manzanita
| Age Bracket | Women with Births | Births / 1,000 Women |
| 15 to 19 years | 0 (0.0%) | 0.0 |
| 20 to 34 years | 0 (0.0%) | 0.0 |
| 35 to 50 years | 0 (0.0%) | 0.0 |
| Total | 0 (0.0%) | 0.0 |
Fertility by Age by Marriage Status in Manzanita
| Age Bracket | Married | Unmarried |
| 15 to 19 years | 0 (0.0%) | 0 (0.0%) |
| 20 to 34 years | 0 (0.0%) | 0 (0.0%) |
| 35 to 50 years | 0 (0.0%) | 0 (0.0%) |
| Total | 0 (0.0%) | 0 (0.0%) |
Fertility by Education in Manzanita
| Educational Attainment | Women with Births | Births / 1,000 Women |
| Less than High School | 0 (0.0%) | 0.0 |
| High School Diploma | 0 (0.0%) | 0.0 |
| College or Associate's Degree | 0 (0.0%) | 0.0 |
| Bachelor's Degree | 0 (0.0%) | 0.0 |
| Graduate Degree | 0 (0.0%) | 0.0 |
| Total | 0 (0.0%) | 0.0 |
Fertility by Education by Marriage Status in Manzanita
| Educational Attainment | Married | Unmarried |
| Less than High School | 0 (0.0%) | 0 (0.0%) |
| High School Diploma | 0 (0.0%) | 0 (0.0%) |
| College or Associate's Degree | 0 (0.0%) | 0 (0.0%) |
| Bachelor's Degree | 0 (0.0%) | 0 (0.0%) |
| Graduate Degree | 0 (0.0%) | 0 (0.0%) |
| Total | 0 (0.0%) | 0 (0.0%) |
Employment Characteristics in Manzanita
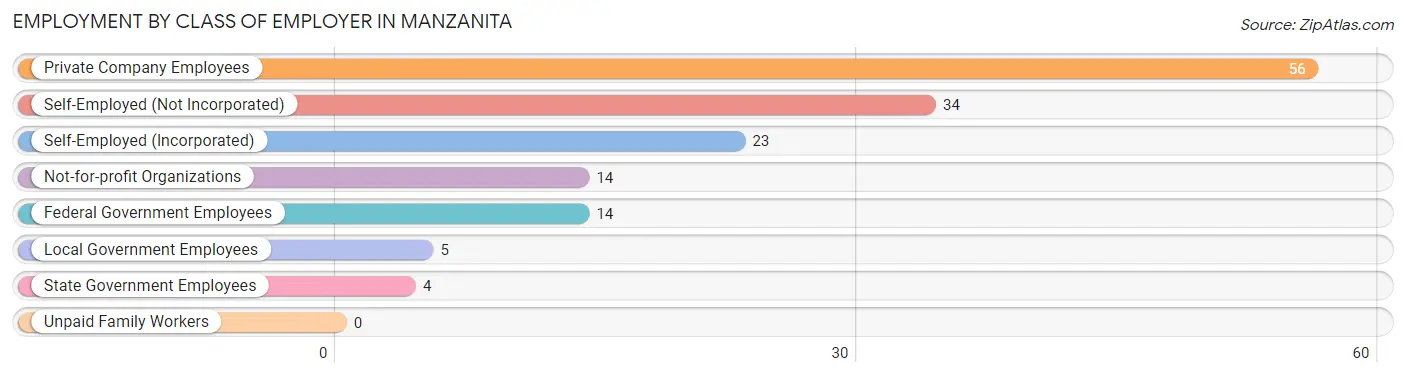
Employment by Class of Employer in Manzanita
Among the 150 employed individuals in Manzanita, private company employees (56 | 37.3%), self-employed (not incorporated) (34 | 22.7%), and self-employed (incorporated) (23 | 15.3%) make up the most common classes of employment.
| Employer Class | # Employees | % Employees |
| Private Company Employees | 56 | 37.3% |
| Self-Employed (Incorporated) | 23 | 15.3% |
| Self-Employed (Not Incorporated) | 34 | 22.7% |
| Not-for-profit Organizations | 14 | 9.3% |
| Local Government Employees | 5 | 3.3% |
| State Government Employees | 4 | 2.7% |
| Federal Government Employees | 14 | 9.3% |
| Unpaid Family Workers | 0 | 0.0% |
| Total | 150 | 100.0% |
Employment Status by Age in Manzanita
According to the labor force statistics for Manzanita, out of the total population over 16 years of age (523), 32.7% or 171 individuals are in the labor force, with 12.3% or 21 of them unemployed. The age group with the highest labor force participation rate is 25 to 29 years, with 100.0% or 13 individuals in the labor force. Within the labor force, the 25 to 29 years age range has the highest percentage of unemployed individuals, with 61.5% or 8 of them being unemployed.
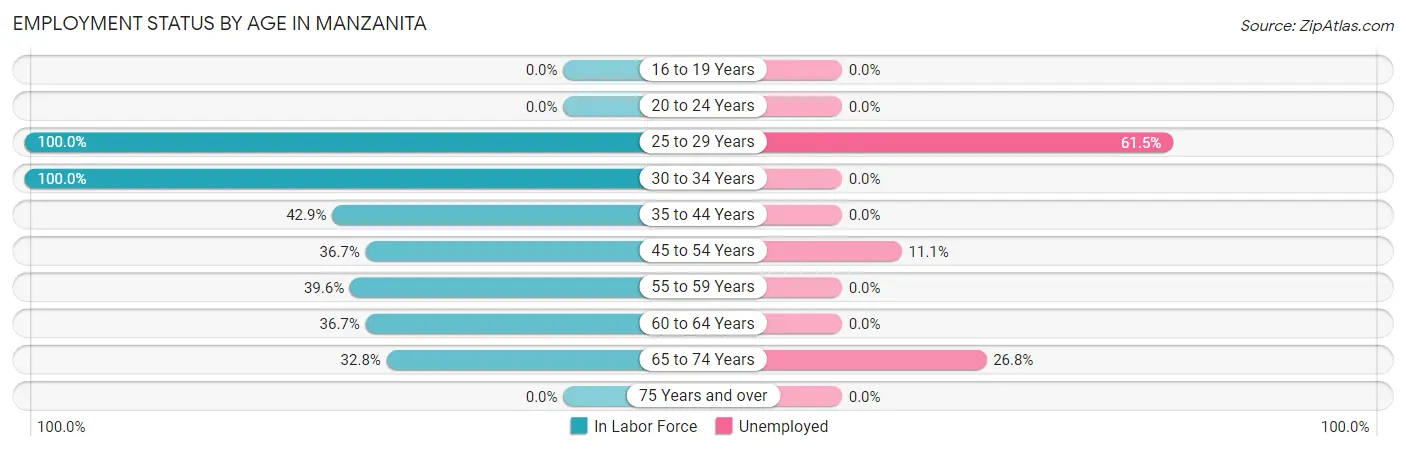
| Age Bracket | In Labor Force | Unemployed |
| 16 to 19 Years | 0 (0.0%) | 0 (0.0%) |
| 20 to 24 Years | 0 (0.0%) | 0 (0.0%) |
| 25 to 29 Years | 13 (100.0%) | 8 (61.5%) |
| 30 to 34 Years | 38 (100.0%) | 0 (0.0%) |
| 35 to 44 Years | 6 (42.9%) | 0 (0.0%) |
| 45 to 54 Years | 18 (36.7%) | 2 (11.1%) |
| 55 to 59 Years | 19 (39.6%) | 0 (0.0%) |
| 60 to 64 Years | 36 (36.7%) | 0 (0.0%) |
| 65 to 74 Years | 41 (32.8%) | 11 (26.8%) |
| 75 Years and over | 0 (0.0%) | 0 (0.0%) |
| Total | 171 (32.7%) | 21 (12.3%) |
Employment Status by Educational Attainment in Manzanita
According to labor force statistics for Manzanita, 50.0% of individuals (130) out of the total population between 25 and 64 years of age (260) are in the labor force, with 7.7% or 10 of them being unemployed. The group with the highest labor force participation rate are those with the educational attainment of high school diploma, with 54.3% or 19 individuals in the labor force. Within the labor force, individuals with high school diploma education have the highest percentage of unemployment, with 52.6% or 10 of them being unemployed.
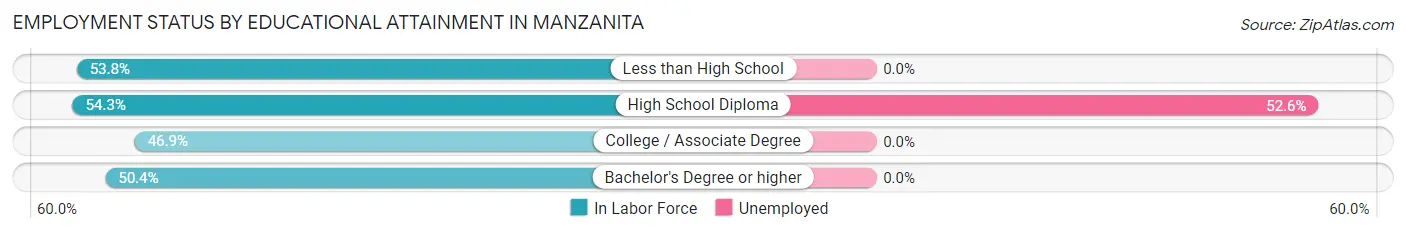
| Educational Attainment | In Labor Force | Unemployed |
| Less than High School | 7 (53.8%) | 0 (0.0%) |
| High School Diploma | 19 (54.3%) | 18 (52.6%) |
| College / Associate Degree | 38 (46.9%) | 0 (0.0%) |
| Bachelor's Degree or higher | 66 (50.4%) | 0 (0.0%) |
| Total | 130 (50.0%) | 20 (7.7%) |
Employment Occupations by Sex in Manzanita
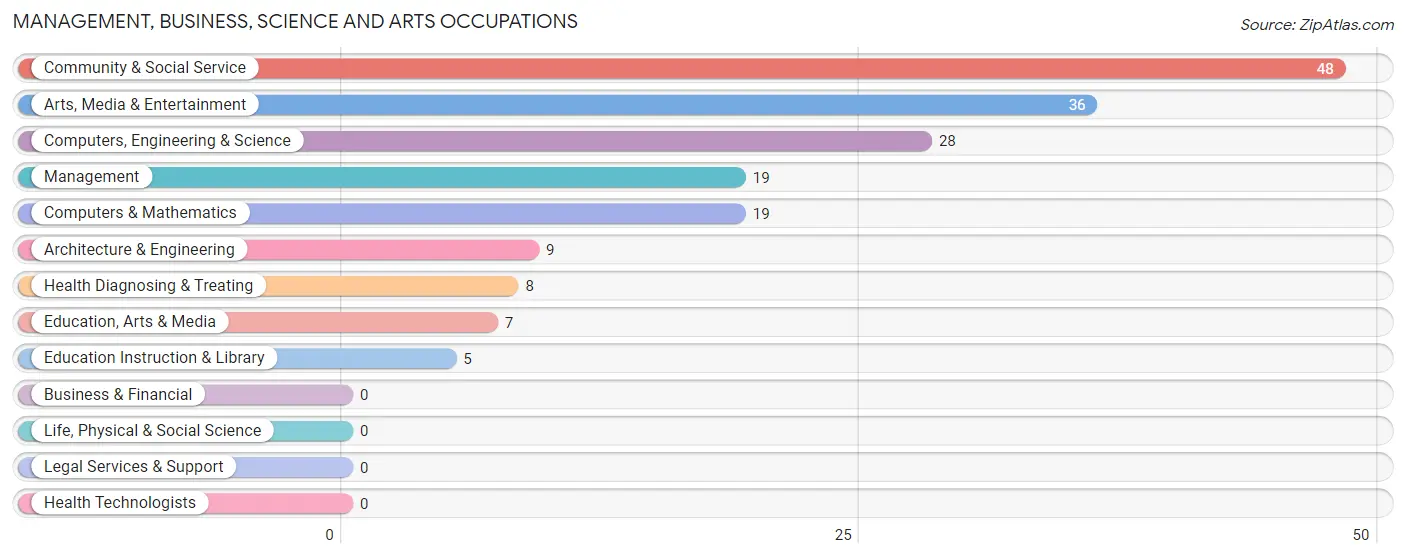
Management, Business, Science and Arts Occupations
The most common Management, Business, Science and Arts occupations in Manzanita are Community & Social Service (48 | 32.0%), Arts, Media & Entertainment (36 | 24.0%), Computers, Engineering & Science (28 | 18.7%), Management (19 | 12.7%), and Computers & Mathematics (19 | 12.7%).
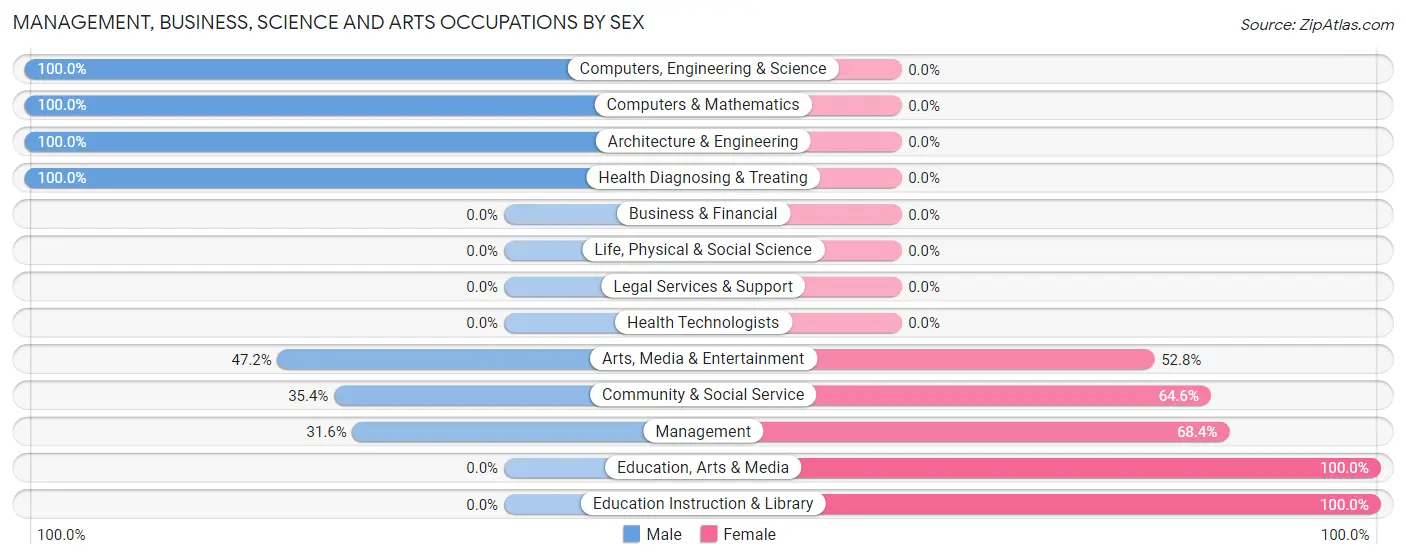
Management, Business, Science and Arts Occupations by Sex
Within the Management, Business, Science and Arts occupations in Manzanita, the most male-oriented occupations are Computers, Engineering & Science (100.0%), Computers & Mathematics (100.0%), and Architecture & Engineering (100.0%), while the most female-oriented occupations are Education, Arts & Media (100.0%), Education Instruction & Library (100.0%), and Management (68.4%).
| Occupation | Male | Female |
| Management | 6 (31.6%) | 13 (68.4%) |
| Business & Financial | 0 (0.0%) | 0 (0.0%) |
| Computers, Engineering & Science | 28 (100.0%) | 0 (0.0%) |
| Computers & Mathematics | 19 (100.0%) | 0 (0.0%) |
| Architecture & Engineering | 9 (100.0%) | 0 (0.0%) |
| Life, Physical & Social Science | 0 (0.0%) | 0 (0.0%) |
| Community & Social Service | 17 (35.4%) | 31 (64.6%) |
| Education, Arts & Media | 0 (0.0%) | 7 (100.0%) |
| Legal Services & Support | 0 (0.0%) | 0 (0.0%) |
| Education Instruction & Library | 0 (0.0%) | 5 (100.0%) |
| Arts, Media & Entertainment | 17 (47.2%) | 19 (52.8%) |
| Health Diagnosing & Treating | 8 (100.0%) | 0 (0.0%) |
| Health Technologists | 0 (0.0%) | 0 (0.0%) |
| Total (Category) | 59 (57.3%) | 44 (42.7%) |
| Total (Overall) | 89 (59.3%) | 61 (40.7%) |
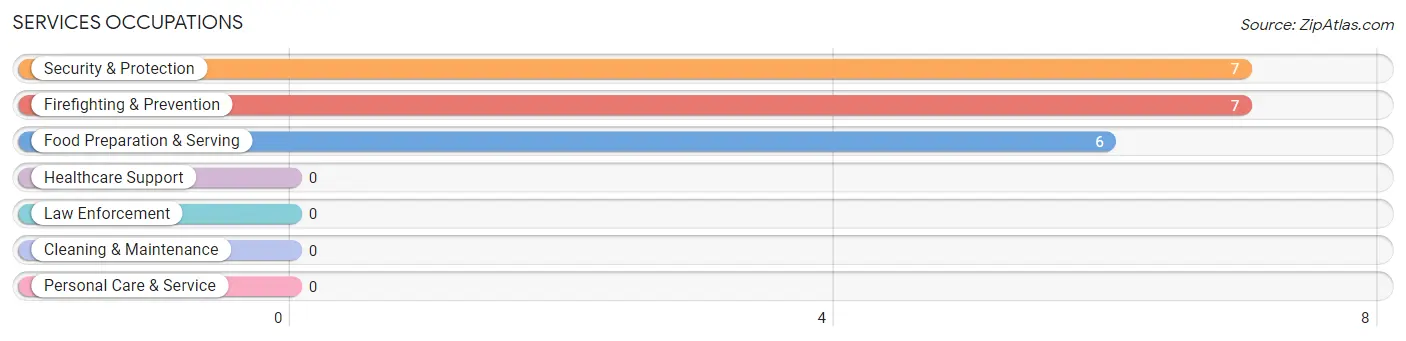
Services Occupations
The most common Services occupations in Manzanita are Security & Protection (7 | 4.7%), Firefighting & Prevention (7 | 4.7%), and Food Preparation & Serving (6 | 4.0%).
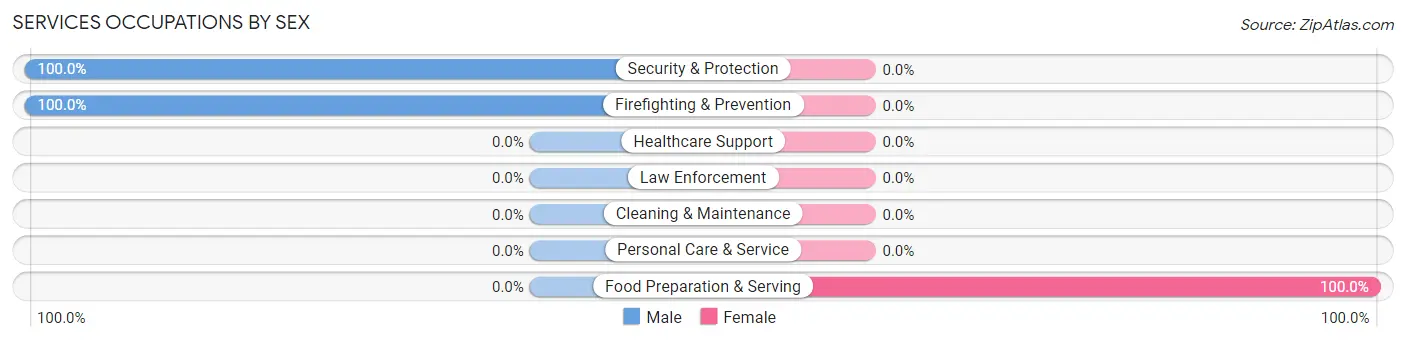
Services Occupations by Sex
| Occupation | Male | Female |
| Healthcare Support | 0 (0.0%) | 0 (0.0%) |
| Security & Protection | 7 (100.0%) | 0 (0.0%) |
| Firefighting & Prevention | 7 (100.0%) | 0 (0.0%) |
| Law Enforcement | 0 (0.0%) | 0 (0.0%) |
| Food Preparation & Serving | 0 (0.0%) | 6 (100.0%) |
| Cleaning & Maintenance | 0 (0.0%) | 0 (0.0%) |
| Personal Care & Service | 0 (0.0%) | 0 (0.0%) |
| Total (Category) | 7 (53.8%) | 6 (46.2%) |
| Total (Overall) | 89 (59.3%) | 61 (40.7%) |
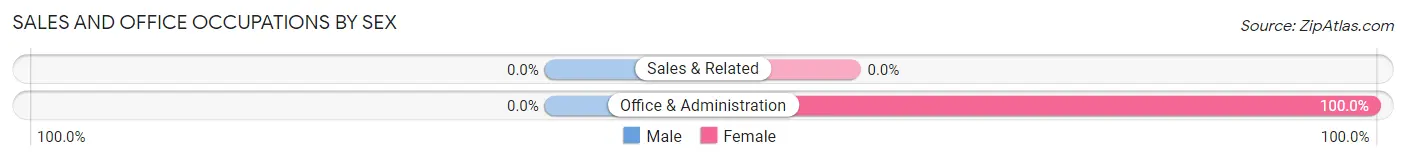
Sales and Office Occupations
The most common Sales and Office occupations in Manzanita are , and Office & Administration (11 | 7.3%).
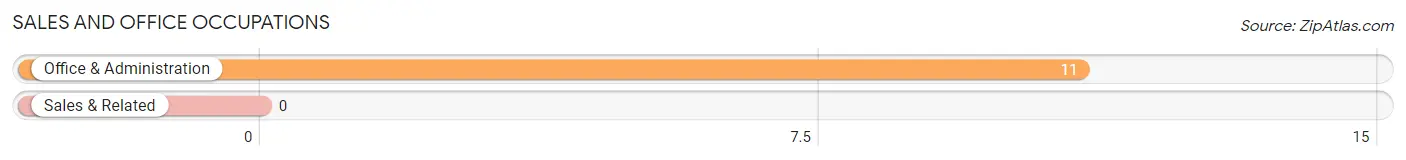
Sales and Office Occupations by Sex
| Occupation | Male | Female |
| Sales & Related | 0 (0.0%) | 0 (0.0%) |
| Office & Administration | 0 (0.0%) | 11 (100.0%) |
| Total (Category) | 0 (0.0%) | 11 (100.0%) |
| Total (Overall) | 89 (59.3%) | 61 (40.7%) |
Natural Resources, Construction and Maintenance Occupations
The most common Natural Resources, Construction and Maintenance occupations in Manzanita are Farming, Fishing & Forestry (7 | 4.7%), and Installation, Maintenance & Repair (7 | 4.7%).
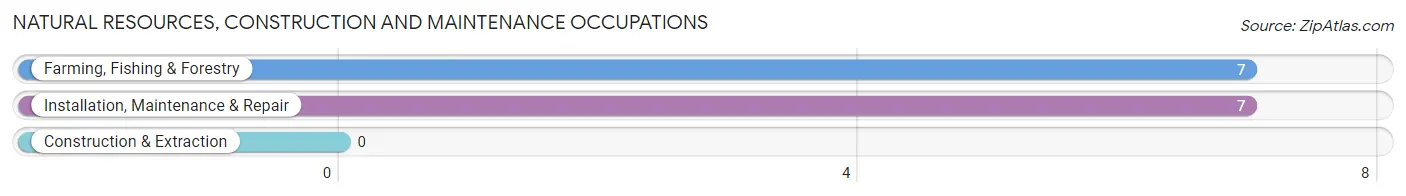
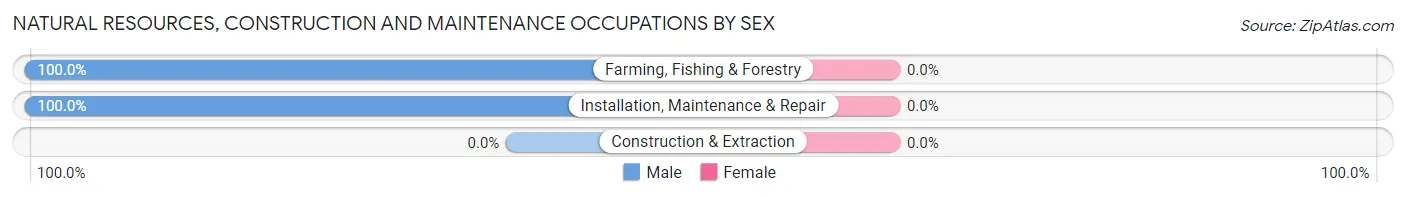
Natural Resources, Construction and Maintenance Occupations by Sex
| Occupation | Male | Female |
| Farming, Fishing & Forestry | 7 (100.0%) | 0 (0.0%) |
| Construction & Extraction | 0 (0.0%) | 0 (0.0%) |
| Installation, Maintenance & Repair | 7 (100.0%) | 0 (0.0%) |
| Total (Category) | 14 (100.0%) | 0 (0.0%) |
| Total (Overall) | 89 (59.3%) | 61 (40.7%) |
Production, Transportation and Moving Occupations
The most common Production, Transportation and Moving occupations in Manzanita are Transportation (5 | 3.3%), and Material Moving (4 | 2.7%).
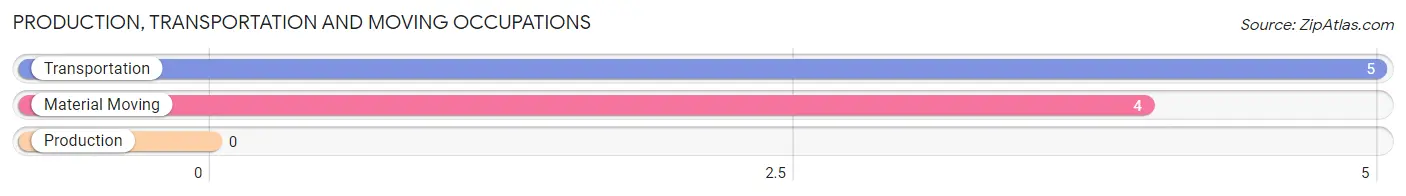
Production, Transportation and Moving Occupations by Sex
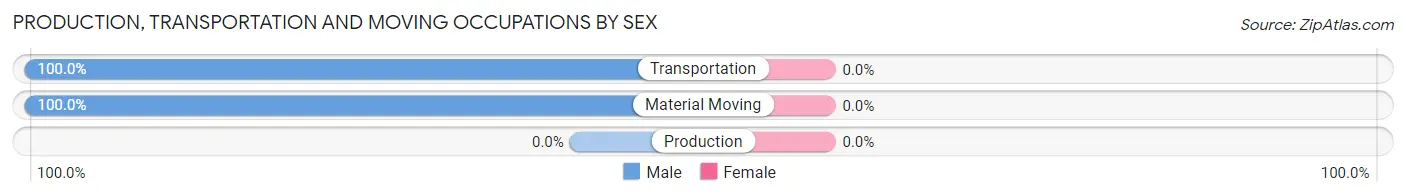
| Occupation | Male | Female |
| Production | 0 (0.0%) | 0 (0.0%) |
| Transportation | 5 (100.0%) | 0 (0.0%) |
| Material Moving | 4 (100.0%) | 0 (0.0%) |
| Total (Category) | 9 (100.0%) | 0 (0.0%) |
| Total (Overall) | 89 (59.3%) | 61 (40.7%) |
Employment Industries by Sex in Manzanita
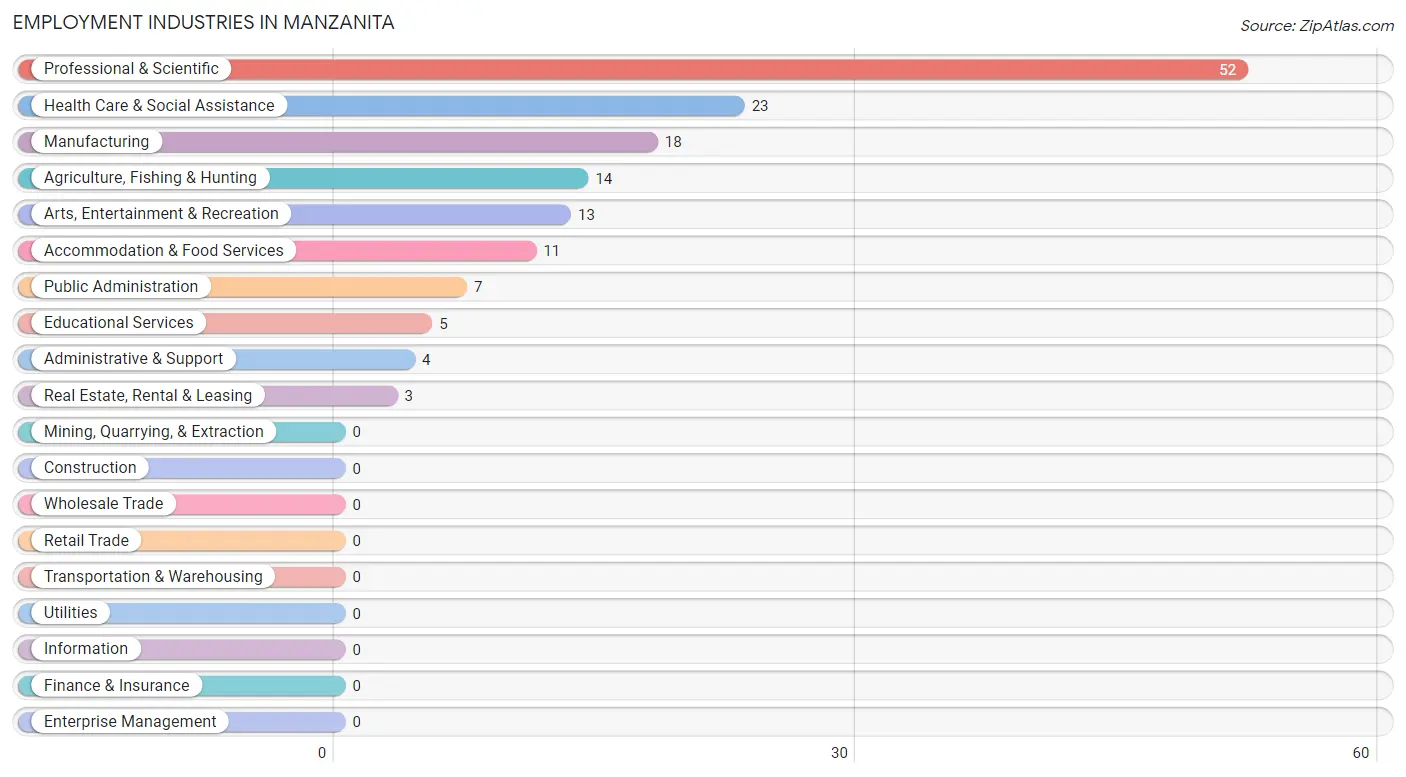
Employment Industries in Manzanita
The major employment industries in Manzanita include Professional & Scientific (52 | 34.7%), Health Care & Social Assistance (23 | 15.3%), Manufacturing (18 | 12.0%), Agriculture, Fishing & Hunting (14 | 9.3%), and Arts, Entertainment & Recreation (13 | 8.7%).
Employment Industries by Sex in Manzanita
The Manzanita industries that see more men than women are Agriculture, Fishing & Hunting (100.0%), Administrative & Support (100.0%), and Public Administration (100.0%), whereas the industries that tend to have a higher number of women are Real Estate, Rental & Leasing (100.0%), Educational Services (100.0%), and Arts, Entertainment & Recreation (100.0%).
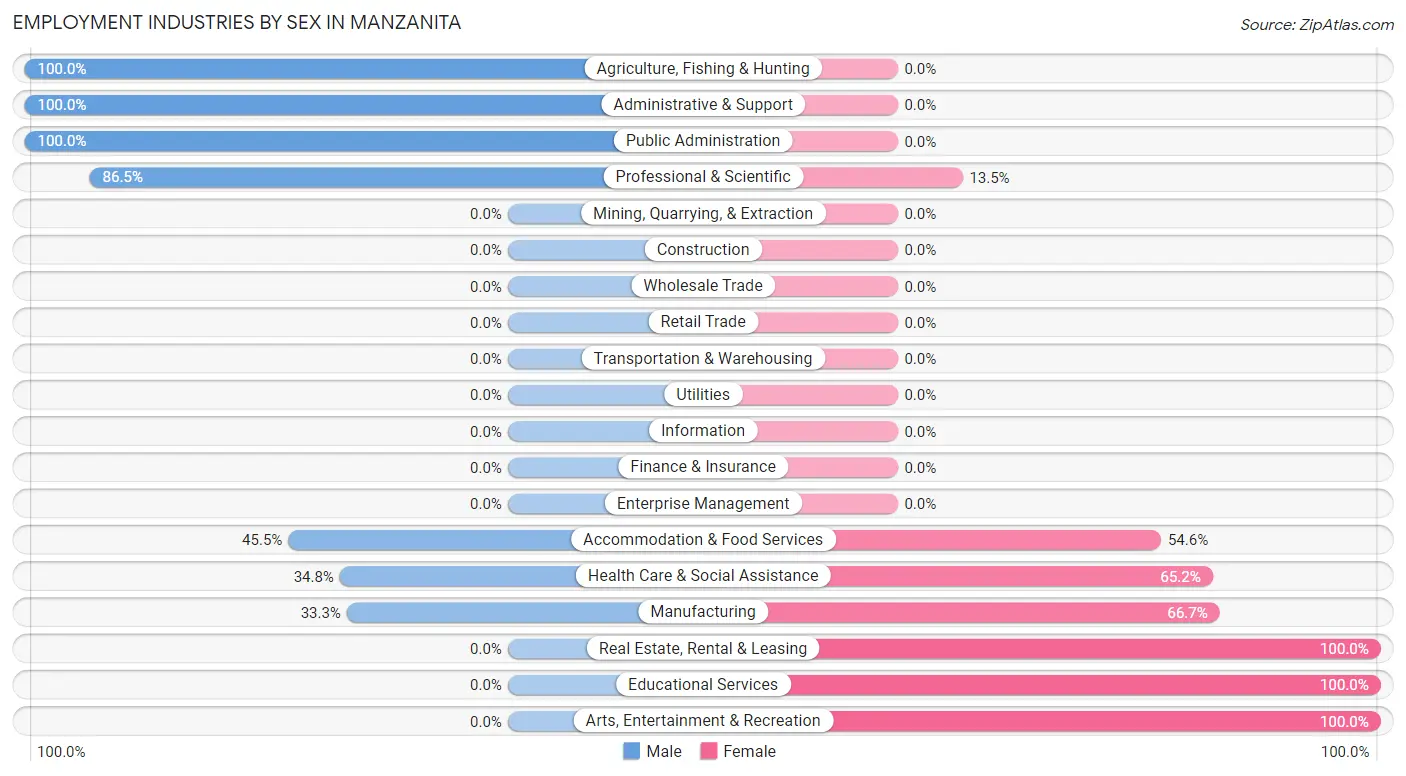
| Industry | Male | Female |
| Agriculture, Fishing & Hunting | 14 (100.0%) | 0 (0.0%) |
| Mining, Quarrying, & Extraction | 0 (0.0%) | 0 (0.0%) |
| Construction | 0 (0.0%) | 0 (0.0%) |
| Manufacturing | 6 (33.3%) | 12 (66.7%) |
| Wholesale Trade | 0 (0.0%) | 0 (0.0%) |
| Retail Trade | 0 (0.0%) | 0 (0.0%) |
| Transportation & Warehousing | 0 (0.0%) | 0 (0.0%) |
| Utilities | 0 (0.0%) | 0 (0.0%) |
| Information | 0 (0.0%) | 0 (0.0%) |
| Finance & Insurance | 0 (0.0%) | 0 (0.0%) |
| Real Estate, Rental & Leasing | 0 (0.0%) | 3 (100.0%) |
| Professional & Scientific | 45 (86.5%) | 7 (13.5%) |
| Enterprise Management | 0 (0.0%) | 0 (0.0%) |
| Administrative & Support | 4 (100.0%) | 0 (0.0%) |
| Educational Services | 0 (0.0%) | 5 (100.0%) |
| Health Care & Social Assistance | 8 (34.8%) | 15 (65.2%) |
| Arts, Entertainment & Recreation | 0 (0.0%) | 13 (100.0%) |
| Accommodation & Food Services | 5 (45.5%) | 6 (54.5%) |
| Public Administration | 7 (100.0%) | 0 (0.0%) |
| Total | 89 (59.3%) | 61 (40.7%) |
Education in Manzanita
School Enrollment in Manzanita
The most common levels of schooling among the 21 students in Manzanita are nursery / preschool (8 | 38.1%), high school (7 | 33.3%), and college / undergraduate (6 | 28.6%).
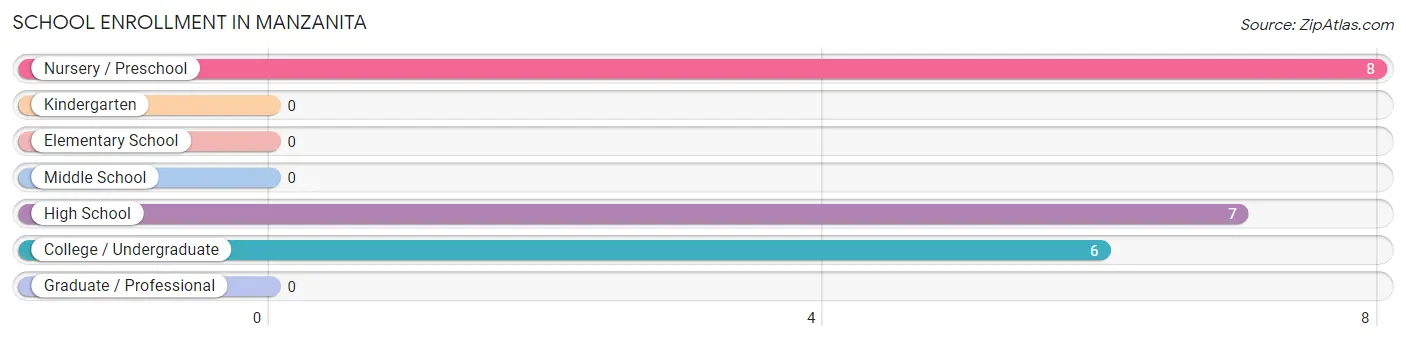
| School Level | # Students | % Students |
| Nursery / Preschool | 8 | 38.1% |
| Kindergarten | 0 | 0.0% |
| Elementary School | 0 | 0.0% |
| Middle School | 0 | 0.0% |
| High School | 7 | 33.3% |
| College / Undergraduate | 6 | 28.6% |
| Graduate / Professional | 0 | 0.0% |
| Total | 21 | 100.0% |
School Enrollment by Age by Funding Source in Manzanita
Out of a total of 21 students who are enrolled in schools in Manzanita, 8 (38.1%) attend a private institution, while the remaining 13 (61.9%) are enrolled in public schools. The age group of 5 to 9 year old has the highest likelihood of being enrolled in private schools, with 8 (100.0% in the age bracket) enrolled. Conversely, the age group of 10 to 14 year olds has the lowest likelihood of being enrolled in a private school, with 7 (100.0% in the age bracket) attending a public institution.
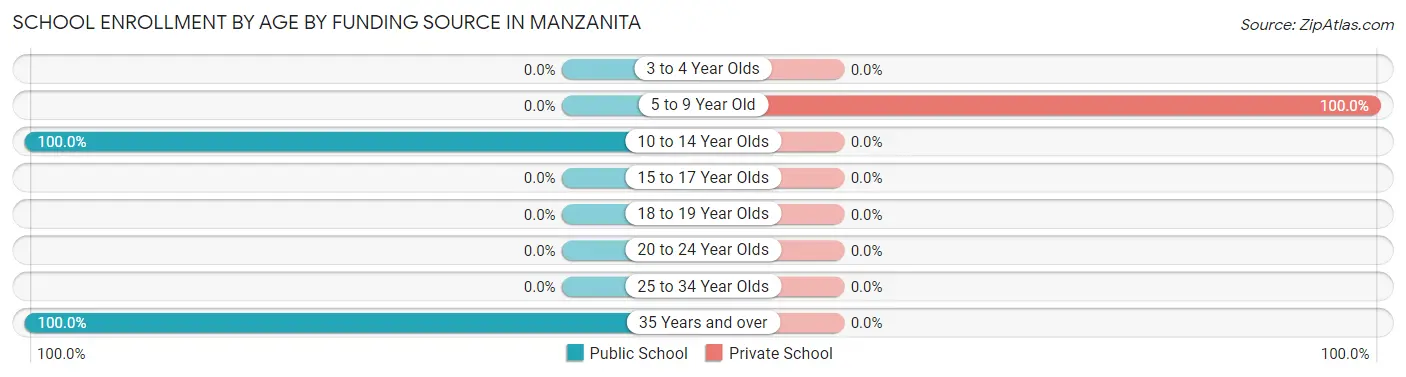
| Age Bracket | Public School | Private School |
| 3 to 4 Year Olds | 0 (0.0%) | 0 (0.0%) |
| 5 to 9 Year Old | 0 (0.0%) | 8 (100.0%) |
| 10 to 14 Year Olds | 7 (100.0%) | 0 (0.0%) |
| 15 to 17 Year Olds | 0 (0.0%) | 0 (0.0%) |
| 18 to 19 Year Olds | 0 (0.0%) | 0 (0.0%) |
| 20 to 24 Year Olds | 0 (0.0%) | 0 (0.0%) |
| 25 to 34 Year Olds | 0 (0.0%) | 0 (0.0%) |
| 35 Years and over | 6 (100.0%) | 0 (0.0%) |
| Total | 13 (61.9%) | 8 (38.1%) |
Educational Attainment by Field of Study in Manzanita
Education (45 | 14.6%), liberal arts & history (37 | 12.0%), communications (34 | 11.0%), science & technology (29 | 9.4%), and social sciences (27 | 8.7%) are the most common fields of study among 309 individuals in Manzanita who have obtained a bachelor's degree or higher.
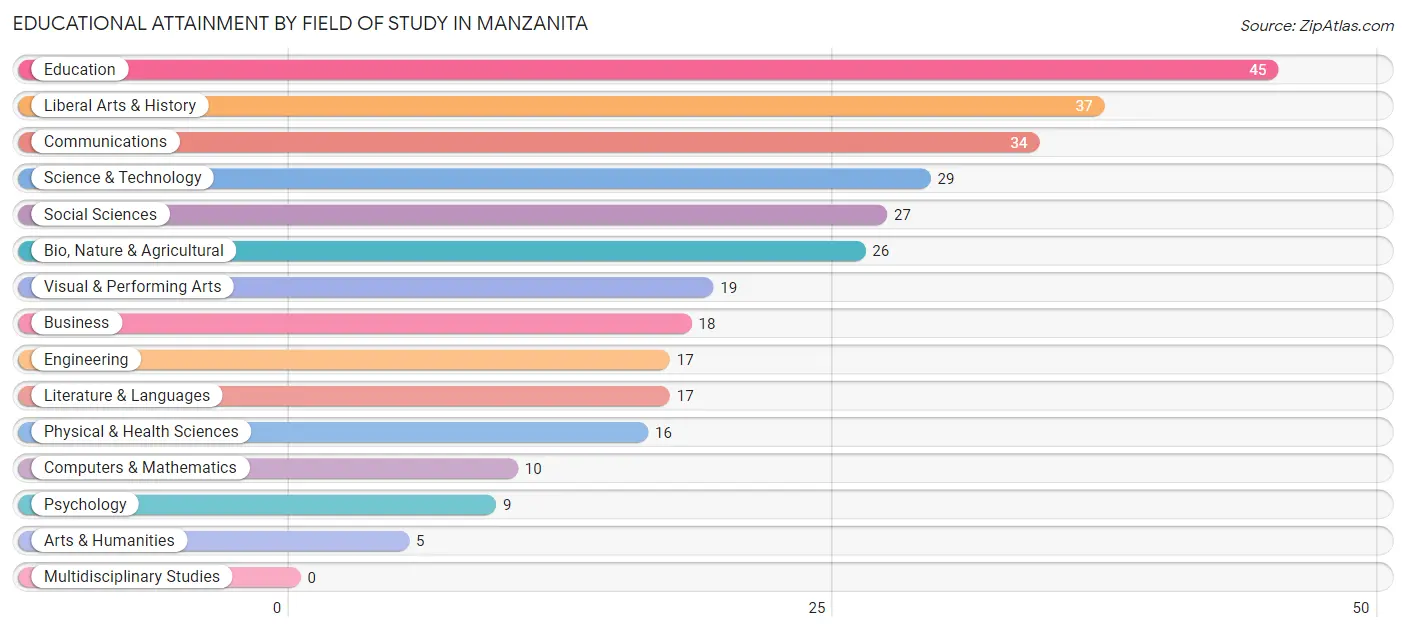
| Field of Study | # Graduates | % Graduates |
| Computers & Mathematics | 10 | 3.2% |
| Bio, Nature & Agricultural | 26 | 8.4% |
| Physical & Health Sciences | 16 | 5.2% |
| Psychology | 9 | 2.9% |
| Social Sciences | 27 | 8.7% |
| Engineering | 17 | 5.5% |
| Multidisciplinary Studies | 0 | 0.0% |
| Science & Technology | 29 | 9.4% |
| Business | 18 | 5.8% |
| Education | 45 | 14.6% |
| Literature & Languages | 17 | 5.5% |
| Liberal Arts & History | 37 | 12.0% |
| Visual & Performing Arts | 19 | 6.1% |
| Communications | 34 | 11.0% |
| Arts & Humanities | 5 | 1.6% |
| Total | 309 | 100.0% |
Transportation & Commute in Manzanita
Vehicle Availability by Sex in Manzanita
The most prevalent vehicle ownership categories in Manzanita are males with 2 vehicles (30, accounting for 33.7%) and females with 2 vehicles (15, making up 49.2%).
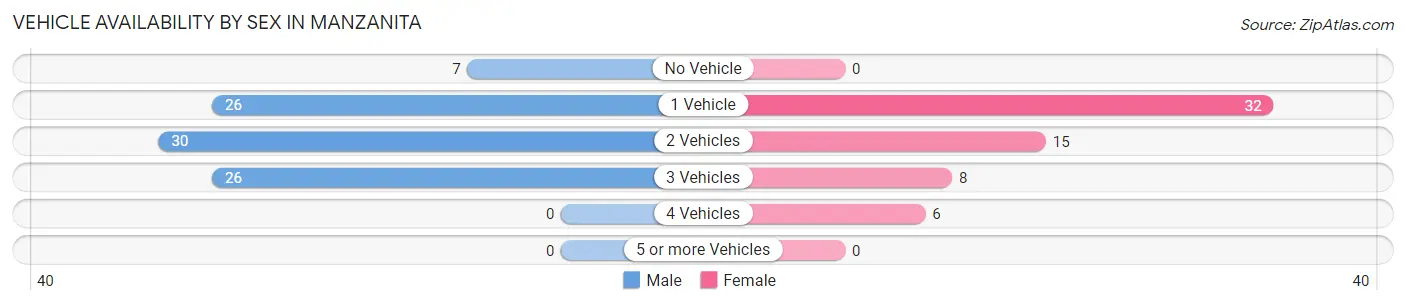
| Vehicles Available | Male | Female |
| No Vehicle | 7 (7.9%) | 0 (0.0%) |
| 1 Vehicle | 26 (29.2%) | 32 (52.5%) |
| 2 Vehicles | 30 (33.7%) | 15 (24.6%) |
| 3 Vehicles | 26 (29.2%) | 8 (13.1%) |
| 4 Vehicles | 0 (0.0%) | 6 (9.8%) |
| 5 or more Vehicles | 0 (0.0%) | 0 (0.0%) |
| Total | 89 (100.0%) | 61 (100.0%) |
Commute Time in Manzanita
The most frequently occuring commute durations in Manzanita are 5 to 9 minutes (36 commuters, 30.2%), less than 5 minutes (31 commuters, 26.1%), and 30 to 34 minutes (26 commuters, 21.8%).
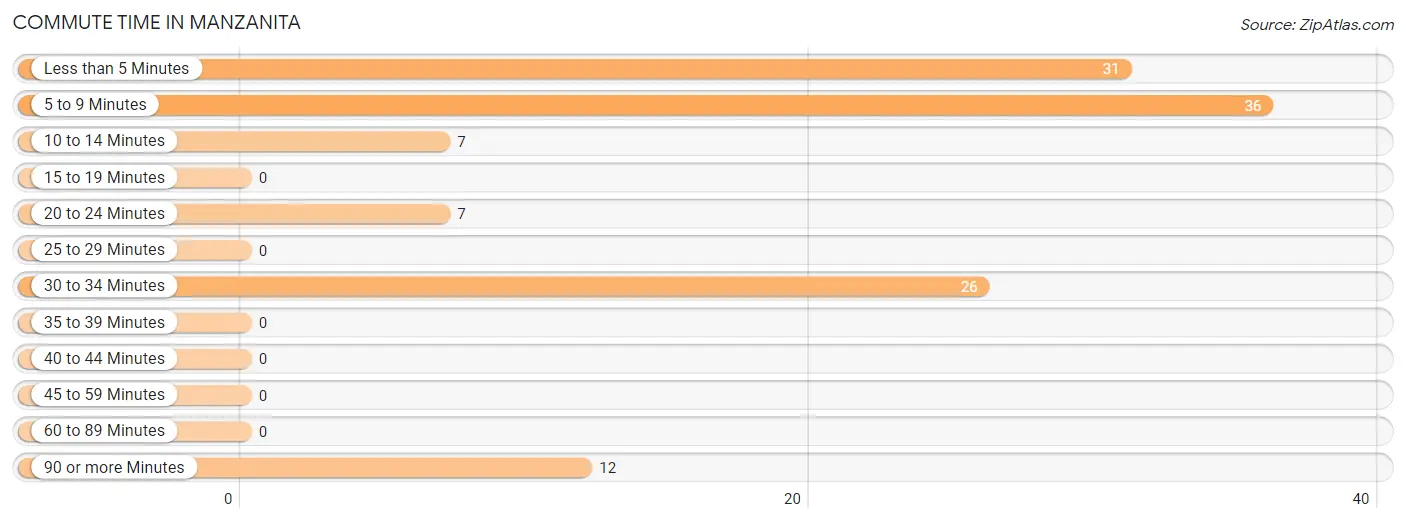
| Commute Time | # Commuters | % Commuters |
| Less than 5 Minutes | 31 | 26.1% |
| 5 to 9 Minutes | 36 | 30.2% |
| 10 to 14 Minutes | 7 | 5.9% |
| 15 to 19 Minutes | 0 | 0.0% |
| 20 to 24 Minutes | 7 | 5.9% |
| 25 to 29 Minutes | 0 | 0.0% |
| 30 to 34 Minutes | 26 | 21.8% |
| 35 to 39 Minutes | 0 | 0.0% |
| 40 to 44 Minutes | 0 | 0.0% |
| 45 to 59 Minutes | 0 | 0.0% |
| 60 to 89 Minutes | 0 | 0.0% |
| 90 or more Minutes | 12 | 10.1% |
Commute Time by Sex in Manzanita
The most common commute times in Manzanita are 30 to 34 minutes (26 commuters, 40.0%) for males and 5 to 9 minutes (32 commuters, 59.3%) for females.
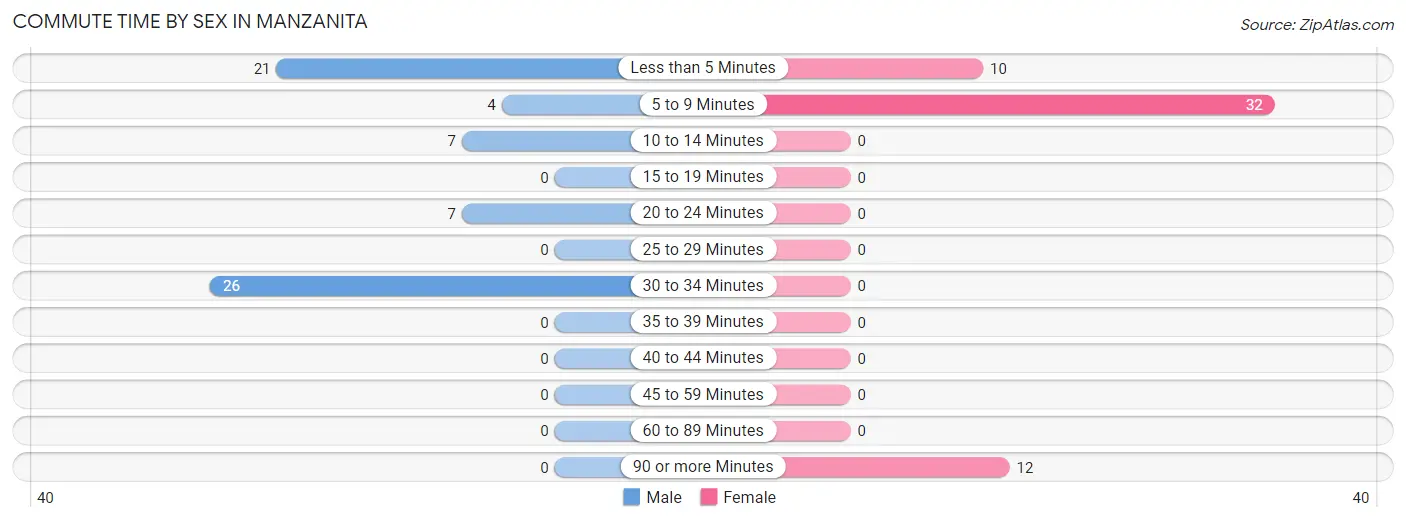
| Commute Time | Male | Female |
| Less than 5 Minutes | 21 (32.3%) | 10 (18.5%) |
| 5 to 9 Minutes | 4 (6.1%) | 32 (59.3%) |
| 10 to 14 Minutes | 7 (10.8%) | 0 (0.0%) |
| 15 to 19 Minutes | 0 (0.0%) | 0 (0.0%) |
| 20 to 24 Minutes | 7 (10.8%) | 0 (0.0%) |
| 25 to 29 Minutes | 0 (0.0%) | 0 (0.0%) |
| 30 to 34 Minutes | 26 (40.0%) | 0 (0.0%) |
| 35 to 39 Minutes | 0 (0.0%) | 0 (0.0%) |
| 40 to 44 Minutes | 0 (0.0%) | 0 (0.0%) |
| 45 to 59 Minutes | 0 (0.0%) | 0 (0.0%) |
| 60 to 89 Minutes | 0 (0.0%) | 0 (0.0%) |
| 90 or more Minutes | 0 (0.0%) | 12 (22.2%) |
Time of Departure to Work by Sex in Manzanita
The most frequent times of departure to work in Manzanita are 9:00 AM to 9:59 AM (37, 56.9%) for males and 7:00 AM to 7:29 AM (12, 22.2%) for females.
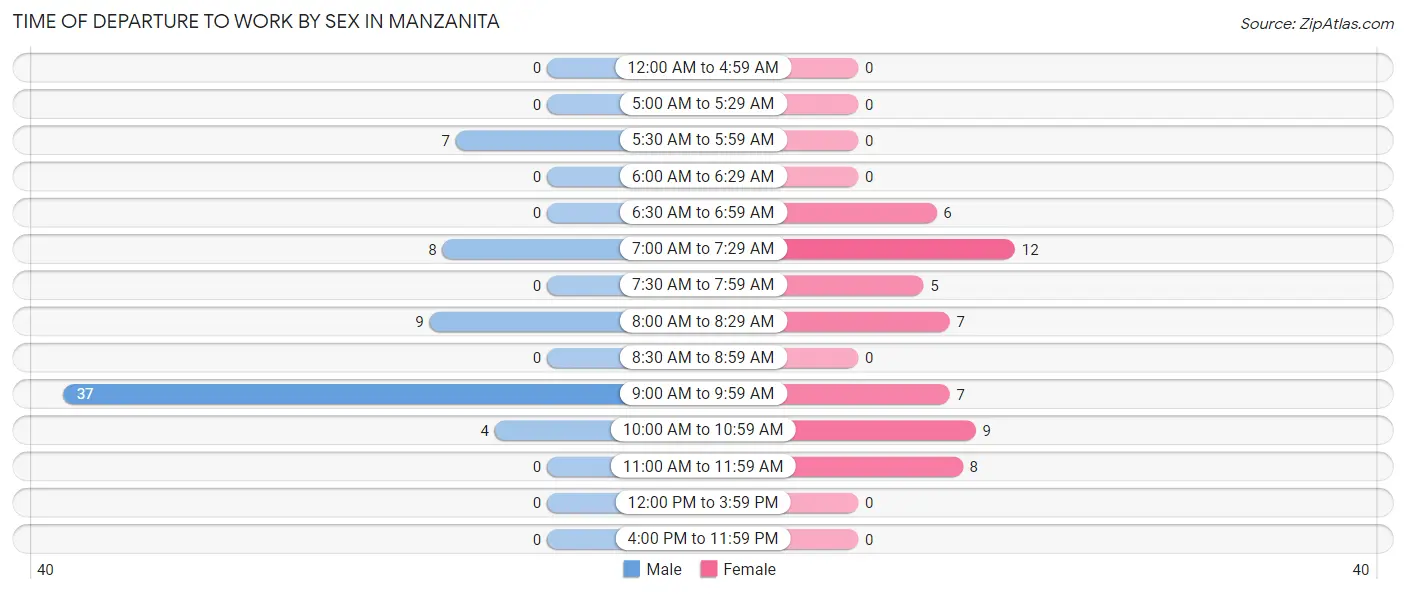
| Time of Departure | Male | Female |
| 12:00 AM to 4:59 AM | 0 (0.0%) | 0 (0.0%) |
| 5:00 AM to 5:29 AM | 0 (0.0%) | 0 (0.0%) |
| 5:30 AM to 5:59 AM | 7 (10.8%) | 0 (0.0%) |
| 6:00 AM to 6:29 AM | 0 (0.0%) | 0 (0.0%) |
| 6:30 AM to 6:59 AM | 0 (0.0%) | 6 (11.1%) |
| 7:00 AM to 7:29 AM | 8 (12.3%) | 12 (22.2%) |
| 7:30 AM to 7:59 AM | 0 (0.0%) | 5 (9.3%) |
| 8:00 AM to 8:29 AM | 9 (13.9%) | 7 (13.0%) |
| 8:30 AM to 8:59 AM | 0 (0.0%) | 0 (0.0%) |
| 9:00 AM to 9:59 AM | 37 (56.9%) | 7 (13.0%) |
| 10:00 AM to 10:59 AM | 4 (6.1%) | 9 (16.7%) |
| 11:00 AM to 11:59 AM | 0 (0.0%) | 8 (14.8%) |
| 12:00 PM to 3:59 PM | 0 (0.0%) | 0 (0.0%) |
| 4:00 PM to 11:59 PM | 0 (0.0%) | 0 (0.0%) |
| Total | 65 (100.0%) | 54 (100.0%) |
Housing Occupancy in Manzanita
Occupancy by Ownership in Manzanita
Of the total 295 dwellings in Manzanita, owner-occupied units account for 241 (81.7%), while renter-occupied units make up 54 (18.3%).
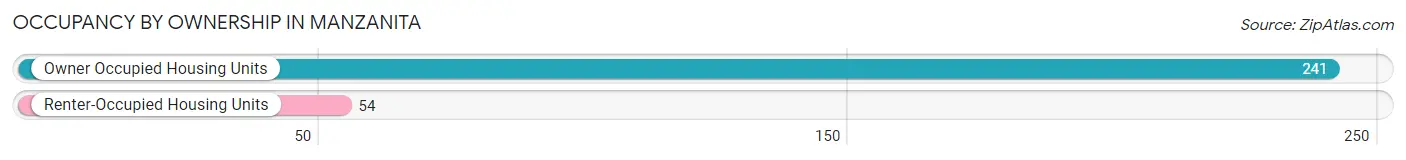
| Occupancy | # Housing Units | % Housing Units |
| Owner Occupied Housing Units | 241 | 81.7% |
| Renter-Occupied Housing Units | 54 | 18.3% |
| Total Occupied Housing Units | 295 | 100.0% |
Occupancy by Household Size in Manzanita
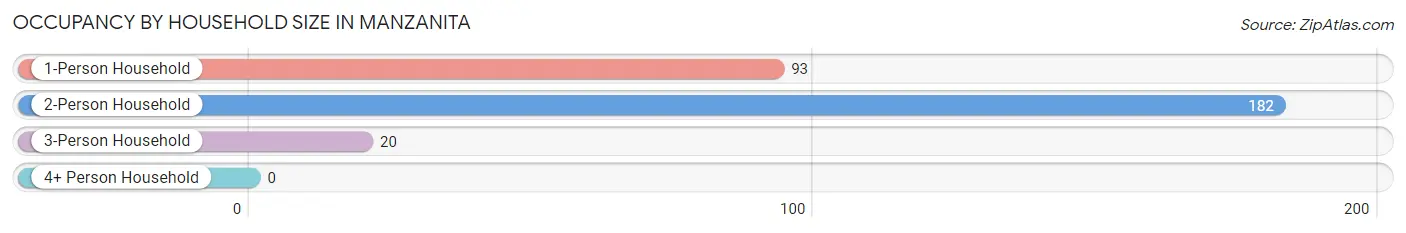
| Household Size | # Housing Units | % Housing Units |
| 1-Person Household | 93 | 31.5% |
| 2-Person Household | 182 | 61.7% |
| 3-Person Household | 20 | 6.8% |
| 4+ Person Household | 0 | 0.0% |
| Total Housing Units | 295 | 100.0% |
Occupancy by Ownership by Household Size in Manzanita
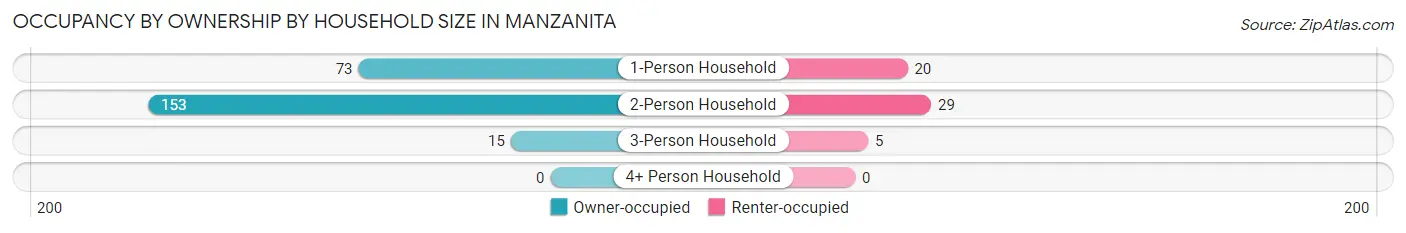
| Household Size | Owner-occupied | Renter-occupied |
| 1-Person Household | 73 (78.5%) | 20 (21.5%) |
| 2-Person Household | 153 (84.1%) | 29 (15.9%) |
| 3-Person Household | 15 (75.0%) | 5 (25.0%) |
| 4+ Person Household | 0 (0.0%) | 0 (0.0%) |
| Total Housing Units | 241 (81.7%) | 54 (18.3%) |
Occupancy by Educational Attainment in Manzanita
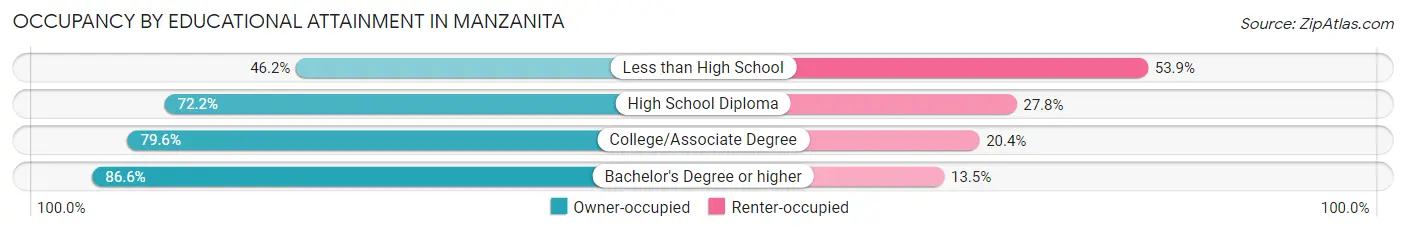
| Household Size | Owner-occupied | Renter-occupied |
| Less than High School | 6 (46.2%) | 7 (53.8%) |
| High School Diploma | 13 (72.2%) | 5 (27.8%) |
| College/Associate Degree | 74 (79.6%) | 19 (20.4%) |
| Bachelor's Degree or higher | 148 (86.6%) | 23 (13.5%) |
Occupancy by Age of Householder in Manzanita
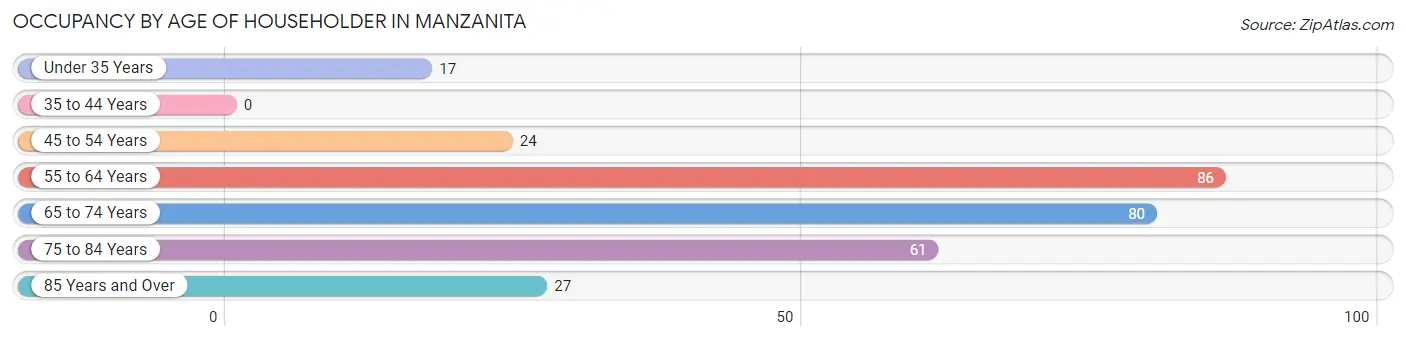
| Age Bracket | # Households | % Households |
| Under 35 Years | 17 | 5.8% |
| 35 to 44 Years | 0 | 0.0% |
| 45 to 54 Years | 24 | 8.1% |
| 55 to 64 Years | 86 | 29.1% |
| 65 to 74 Years | 80 | 27.1% |
| 75 to 84 Years | 61 | 20.7% |
| 85 Years and Over | 27 | 9.1% |
| Total | 295 | 100.0% |
Housing Finances in Manzanita
Median Income by Occupancy in Manzanita
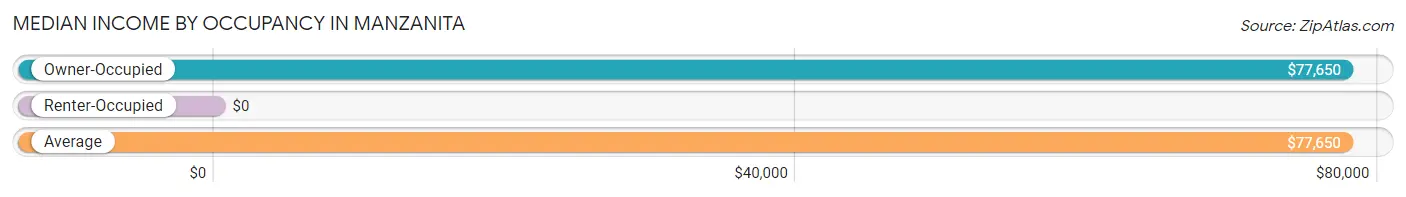
| Occupancy Type | # Households | Median Income |
| Owner-Occupied | 241 (81.7%) | $77,650 |
| Renter-Occupied | 54 (18.3%) | $0 |
| Average | 295 (100.0%) | $77,650 |
Occupancy by Householder Income Bracket in Manzanita
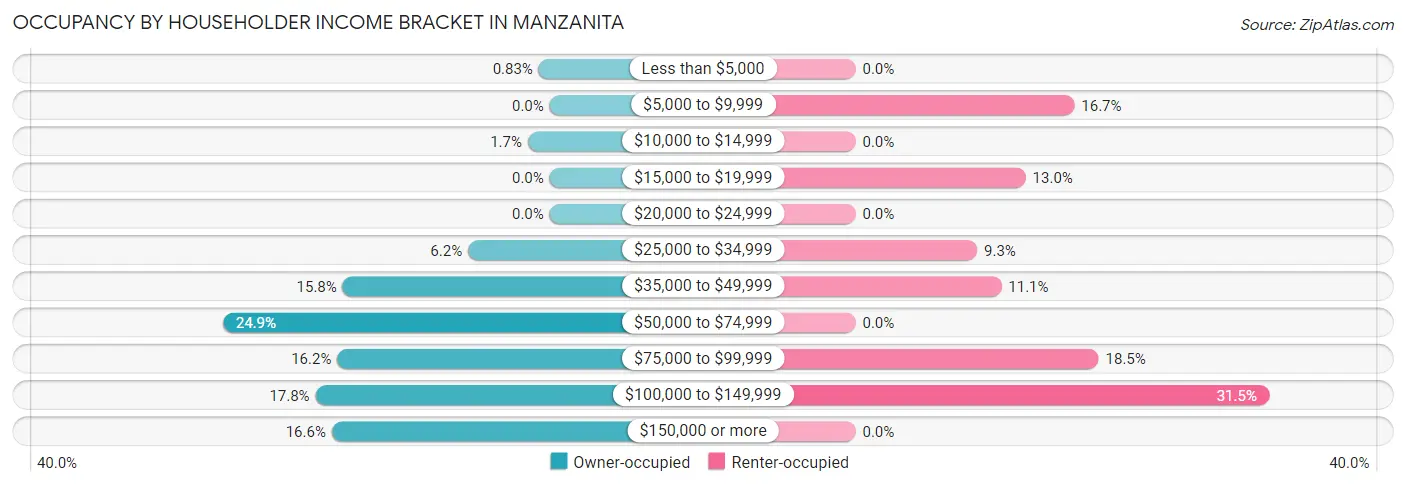
| Income Bracket | Owner-occupied | Renter-occupied |
| Less than $5,000 | 2 (0.8%) | 0 (0.0%) |
| $5,000 to $9,999 | 0 (0.0%) | 9 (16.7%) |
| $10,000 to $14,999 | 4 (1.7%) | 0 (0.0%) |
| $15,000 to $19,999 | 0 (0.0%) | 7 (13.0%) |
| $20,000 to $24,999 | 0 (0.0%) | 0 (0.0%) |
| $25,000 to $34,999 | 15 (6.2%) | 5 (9.3%) |
| $35,000 to $49,999 | 38 (15.8%) | 6 (11.1%) |
| $50,000 to $74,999 | 60 (24.9%) | 0 (0.0%) |
| $75,000 to $99,999 | 39 (16.2%) | 10 (18.5%) |
| $100,000 to $149,999 | 43 (17.8%) | 17 (31.5%) |
| $150,000 or more | 40 (16.6%) | 0 (0.0%) |
| Total | 241 (100.0%) | 54 (100.0%) |
Monthly Housing Cost Tiers in Manzanita
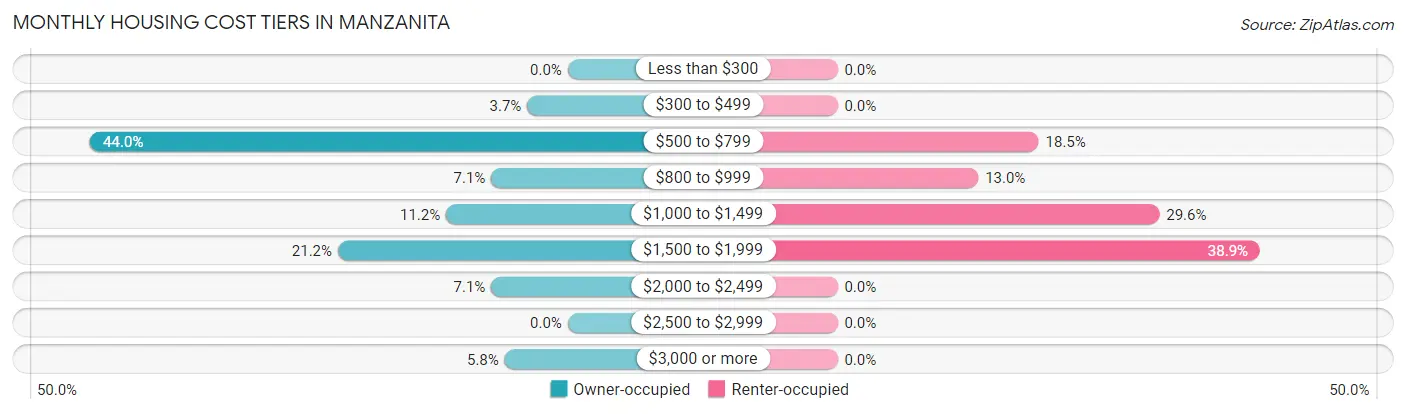
| Monthly Cost | Owner-occupied | Renter-occupied |
| Less than $300 | 0 (0.0%) | 0 (0.0%) |
| $300 to $499 | 9 (3.7%) | 0 (0.0%) |
| $500 to $799 | 106 (44.0%) | 10 (18.5%) |
| $800 to $999 | 17 (7.0%) | 7 (13.0%) |
| $1,000 to $1,499 | 27 (11.2%) | 16 (29.6%) |
| $1,500 to $1,999 | 51 (21.2%) | 21 (38.9%) |
| $2,000 to $2,499 | 17 (7.0%) | 0 (0.0%) |
| $2,500 to $2,999 | 0 (0.0%) | 0 (0.0%) |
| $3,000 or more | 14 (5.8%) | 0 (0.0%) |
| Total | 241 (100.0%) | 54 (100.0%) |
Physical Housing Characteristics in Manzanita
Housing Structures in Manzanita
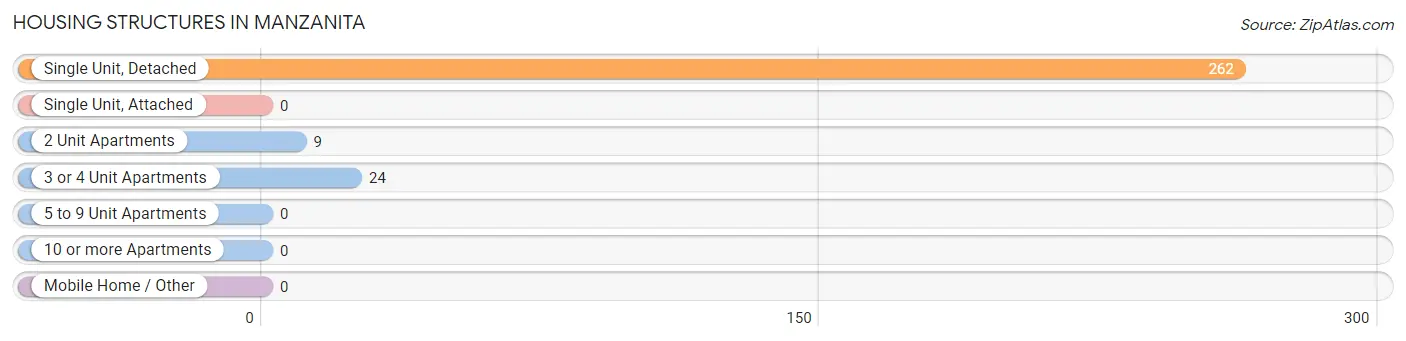
| Structure Type | # Housing Units | % Housing Units |
| Single Unit, Detached | 262 | 88.8% |
| Single Unit, Attached | 0 | 0.0% |
| 2 Unit Apartments | 9 | 3.0% |
| 3 or 4 Unit Apartments | 24 | 8.1% |
| 5 to 9 Unit Apartments | 0 | 0.0% |
| 10 or more Apartments | 0 | 0.0% |
| Mobile Home / Other | 0 | 0.0% |
| Total | 295 | 100.0% |
Housing Structures by Occupancy in Manzanita
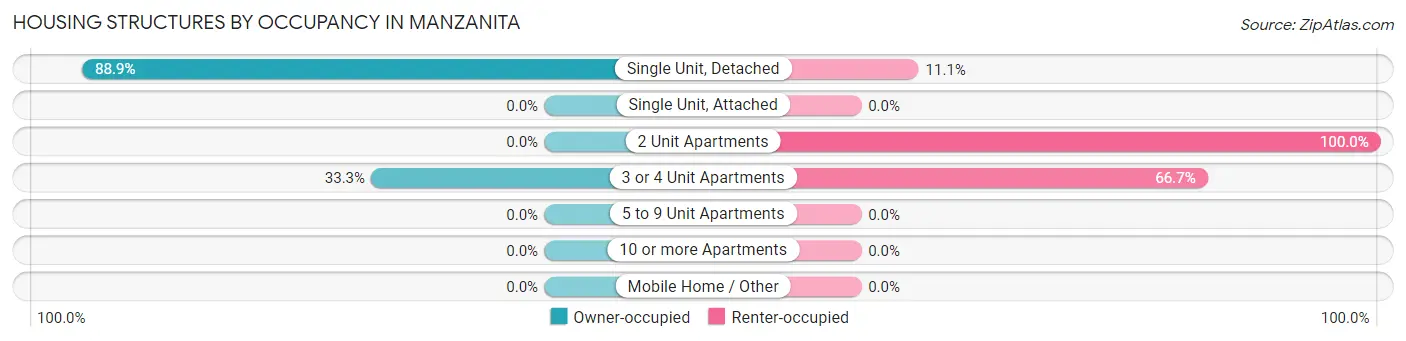
| Structure Type | Owner-occupied | Renter-occupied |
| Single Unit, Detached | 233 (88.9%) | 29 (11.1%) |
| Single Unit, Attached | 0 (0.0%) | 0 (0.0%) |
| 2 Unit Apartments | 0 (0.0%) | 9 (100.0%) |
| 3 or 4 Unit Apartments | 8 (33.3%) | 16 (66.7%) |
| 5 to 9 Unit Apartments | 0 (0.0%) | 0 (0.0%) |
| 10 or more Apartments | 0 (0.0%) | 0 (0.0%) |
| Mobile Home / Other | 0 (0.0%) | 0 (0.0%) |
| Total | 241 (81.7%) | 54 (18.3%) |
Housing Structures by Number of Rooms in Manzanita
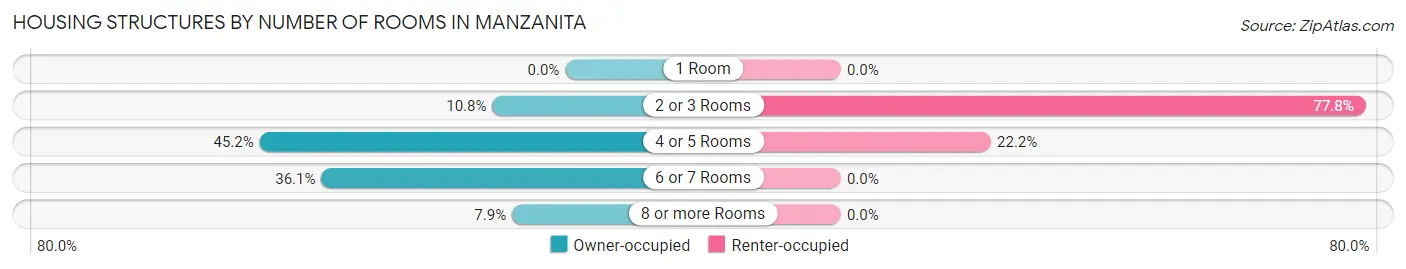
| Number of Rooms | Owner-occupied | Renter-occupied |
| 1 Room | 0 (0.0%) | 0 (0.0%) |
| 2 or 3 Rooms | 26 (10.8%) | 42 (77.8%) |
| 4 or 5 Rooms | 109 (45.2%) | 12 (22.2%) |
| 6 or 7 Rooms | 87 (36.1%) | 0 (0.0%) |
| 8 or more Rooms | 19 (7.9%) | 0 (0.0%) |
| Total | 241 (100.0%) | 54 (100.0%) |
Housing Structure by Heating Type in Manzanita
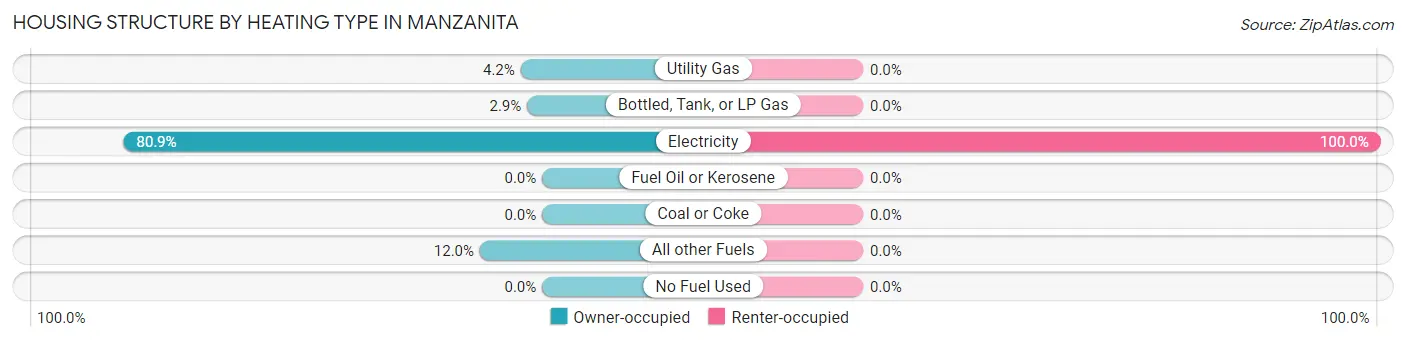
| Heating Type | Owner-occupied | Renter-occupied |
| Utility Gas | 10 (4.2%) | 0 (0.0%) |
| Bottled, Tank, or LP Gas | 7 (2.9%) | 0 (0.0%) |
| Electricity | 195 (80.9%) | 54 (100.0%) |
| Fuel Oil or Kerosene | 0 (0.0%) | 0 (0.0%) |
| Coal or Coke | 0 (0.0%) | 0 (0.0%) |
| All other Fuels | 29 (12.0%) | 0 (0.0%) |
| No Fuel Used | 0 (0.0%) | 0 (0.0%) |
| Total | 241 (100.0%) | 54 (100.0%) |
Household Vehicle Usage in Manzanita
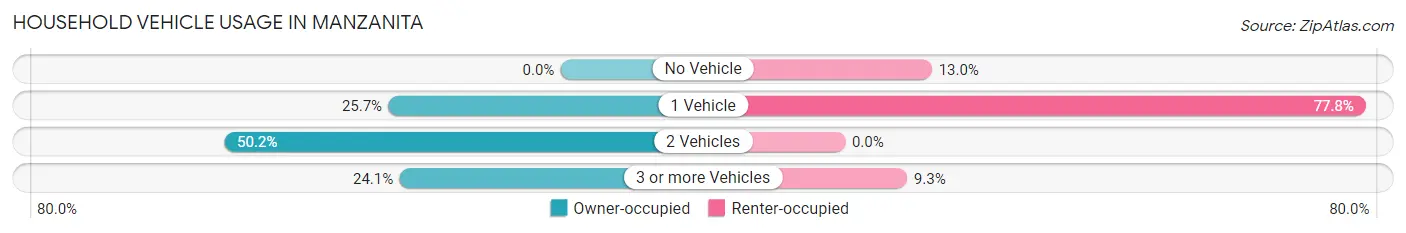
| Vehicles per Household | Owner-occupied | Renter-occupied |
| No Vehicle | 0 (0.0%) | 7 (13.0%) |
| 1 Vehicle | 62 (25.7%) | 42 (77.8%) |
| 2 Vehicles | 121 (50.2%) | 0 (0.0%) |
| 3 or more Vehicles | 58 (24.1%) | 5 (9.3%) |
| Total | 241 (100.0%) | 54 (100.0%) |
Real Estate & Mortgages in Manzanita
Real Estate and Mortgage Overview in Manzanita
| Characteristic | Without Mortgage | With Mortgage |
| Housing Units | 121 | 120 |
| Median Property Value | $615,600 | $567,500 |
| Median Household Income | $64,350 | $27 |
| Monthly Housing Costs | $663 | $14 |
| Real Estate Taxes | $3,520 | $0 |
Property Value by Mortgage Status in Manzanita
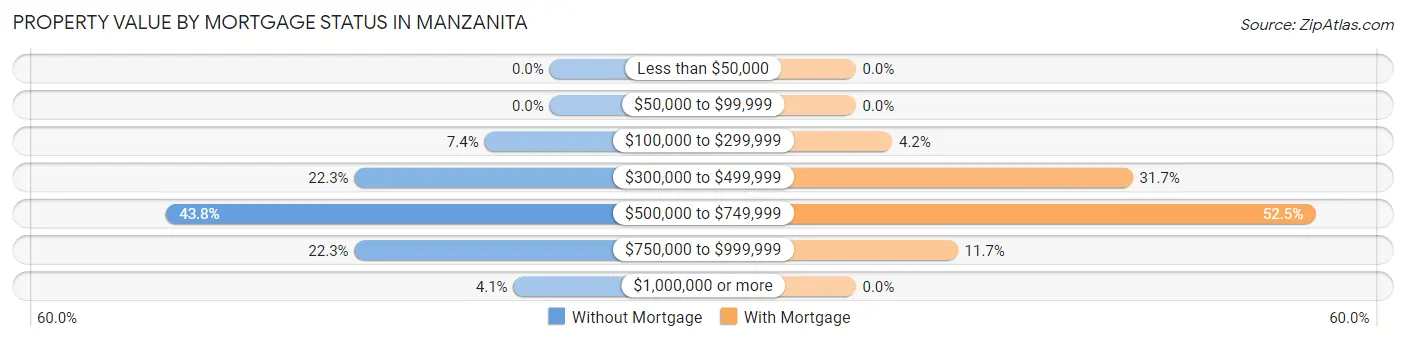
| Property Value | Without Mortgage | With Mortgage |
| Less than $50,000 | 0 (0.0%) | 0 (0.0%) |
| $50,000 to $99,999 | 0 (0.0%) | 0 (0.0%) |
| $100,000 to $299,999 | 9 (7.4%) | 5 (4.2%) |
| $300,000 to $499,999 | 27 (22.3%) | 38 (31.7%) |
| $500,000 to $749,999 | 53 (43.8%) | 63 (52.5%) |
| $750,000 to $999,999 | 27 (22.3%) | 14 (11.7%) |
| $1,000,000 or more | 5 (4.1%) | 0 (0.0%) |
| Total | 121 (100.0%) | 120 (100.0%) |
Household Income by Mortgage Status in Manzanita
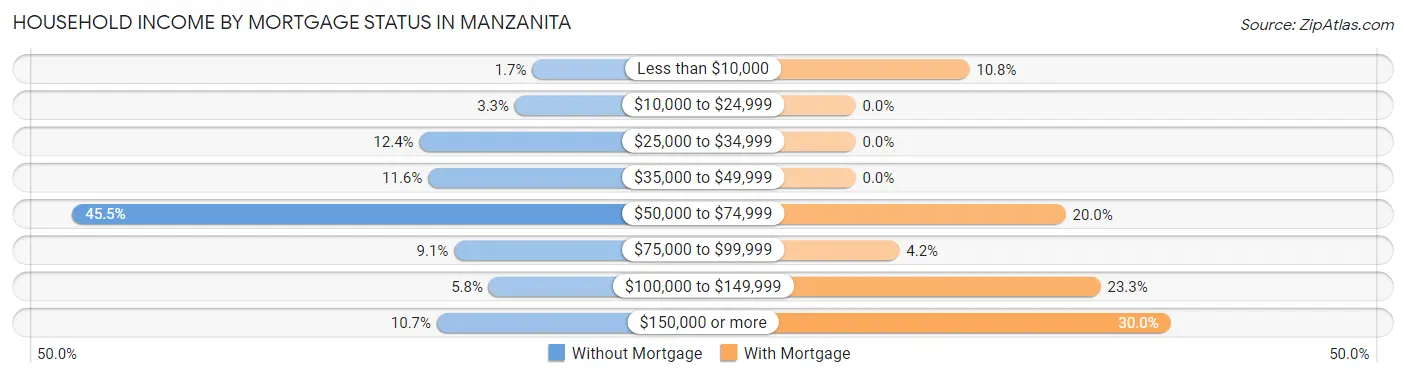
| Household Income | Without Mortgage | With Mortgage |
| Less than $10,000 | 2 (1.7%) | 13 (10.8%) |
| $10,000 to $24,999 | 4 (3.3%) | 0 (0.0%) |
| $25,000 to $34,999 | 15 (12.4%) | 0 (0.0%) |
| $35,000 to $49,999 | 14 (11.6%) | 0 (0.0%) |
| $50,000 to $74,999 | 55 (45.5%) | 24 (20.0%) |
| $75,000 to $99,999 | 11 (9.1%) | 5 (4.2%) |
| $100,000 to $149,999 | 7 (5.8%) | 28 (23.3%) |
| $150,000 or more | 13 (10.7%) | 36 (30.0%) |
| Total | 121 (100.0%) | 120 (100.0%) |
Property Value to Household Income Ratio in Manzanita
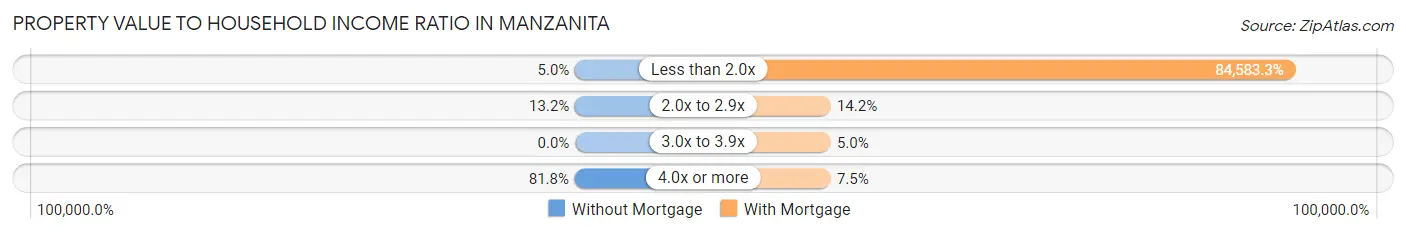
| Value-to-Income Ratio | Without Mortgage | With Mortgage |
| Less than 2.0x | 6 (5.0%) | 101,500 (84,583.3%) |
| 2.0x to 2.9x | 16 (13.2%) | 17 (14.2%) |
| 3.0x to 3.9x | 0 (0.0%) | 6 (5.0%) |
| 4.0x or more | 99 (81.8%) | 9 (7.5%) |
| Total | 121 (100.0%) | 120 (100.0%) |
Real Estate Taxes by Mortgage Status in Manzanita
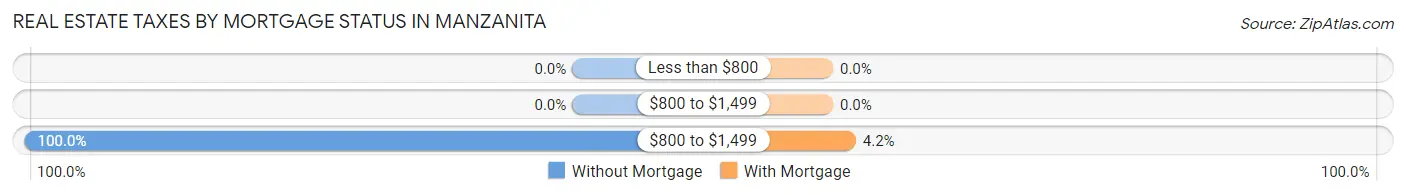
| Property Taxes | Without Mortgage | With Mortgage |
| Less than $800 | 0 (0.0%) | 0 (0.0%) |
| $800 to $1,499 | 0 (0.0%) | 0 (0.0%) |
| $800 to $1,499 | 121 (100.0%) | 5 (4.2%) |
| Total | 121 (100.0%) | 120 (100.0%) |
Health & Disability in Manzanita
Health Insurance Coverage by Age in Manzanita
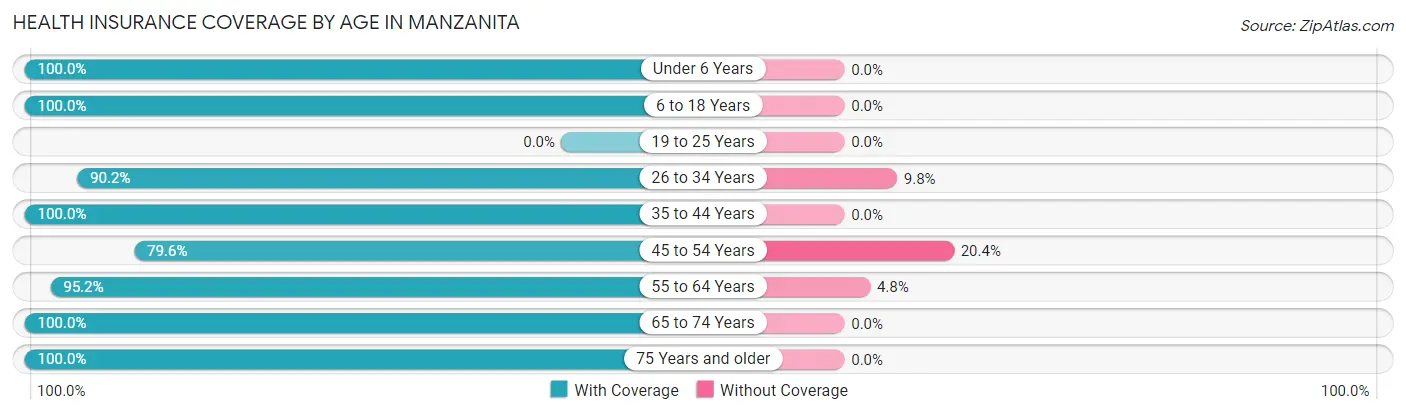
| Age Bracket | With Coverage | Without Coverage |
| Under 6 Years | 8 (100.0%) | 0 (0.0%) |
| 6 to 18 Years | 7 (100.0%) | 0 (0.0%) |
| 19 to 25 Years | 0 (0.0%) | 0 (0.0%) |
| 26 to 34 Years | 46 (90.2%) | 5 (9.8%) |
| 35 to 44 Years | 14 (100.0%) | 0 (0.0%) |
| 45 to 54 Years | 39 (79.6%) | 10 (20.4%) |
| 55 to 64 Years | 139 (95.2%) | 7 (4.8%) |
| 65 to 74 Years | 125 (100.0%) | 0 (0.0%) |
| 75 Years and older | 138 (100.0%) | 0 (0.0%) |
| Total | 516 (95.9%) | 22 (4.1%) |
Health Insurance Coverage by Citizenship Status in Manzanita
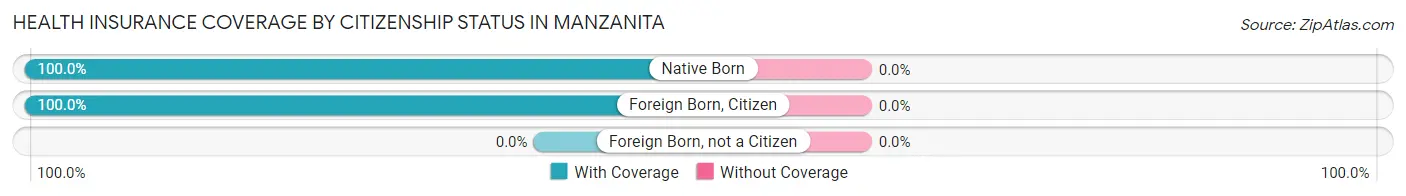
| Citizenship Status | With Coverage | Without Coverage |
| Native Born | 8 (100.0%) | 0 (0.0%) |
| Foreign Born, Citizen | 7 (100.0%) | 0 (0.0%) |
| Foreign Born, not a Citizen | 0 (0.0%) | 0 (0.0%) |
Health Insurance Coverage by Household Income in Manzanita
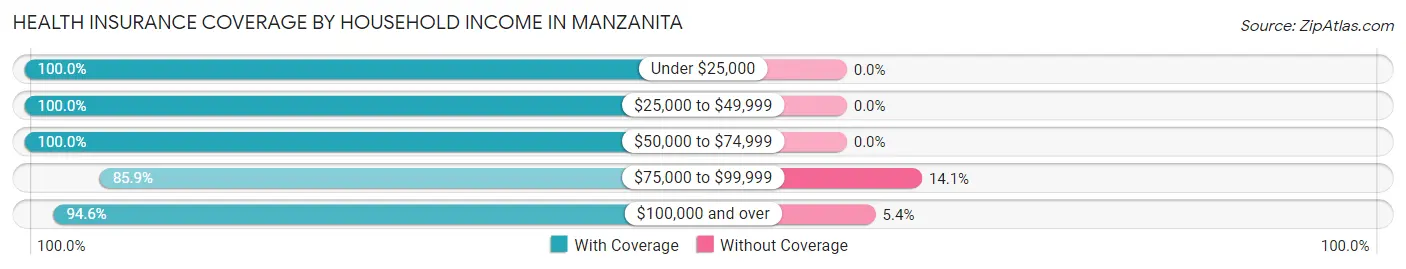
| Household Income | With Coverage | Without Coverage |
| Under $25,000 | 39 (100.0%) | 0 (0.0%) |
| $25,000 to $49,999 | 91 (100.0%) | 0 (0.0%) |
| $50,000 to $74,999 | 115 (100.0%) | 0 (0.0%) |
| $75,000 to $99,999 | 61 (85.9%) | 10 (14.1%) |
| $100,000 and over | 210 (94.6%) | 12 (5.4%) |
Public vs Private Health Insurance Coverage by Age in Manzanita
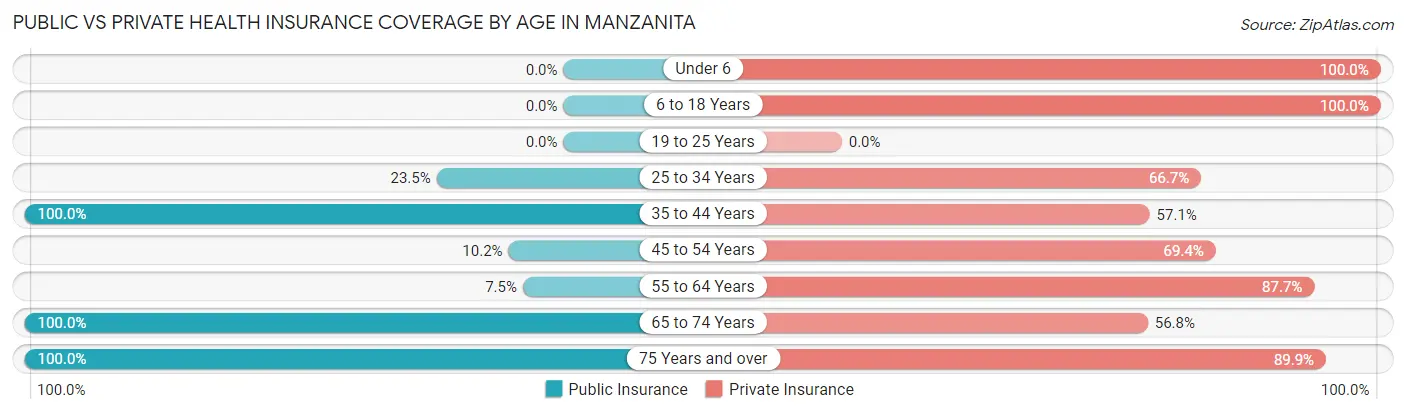
| Age Bracket | Public Insurance | Private Insurance |
| Under 6 | 0 (0.0%) | 8 (100.0%) |
| 6 to 18 Years | 0 (0.0%) | 7 (100.0%) |
| 19 to 25 Years | 0 (0.0%) | 0 (0.0%) |
| 25 to 34 Years | 12 (23.5%) | 34 (66.7%) |
| 35 to 44 Years | 14 (100.0%) | 8 (57.1%) |
| 45 to 54 Years | 5 (10.2%) | 34 (69.4%) |
| 55 to 64 Years | 11 (7.5%) | 128 (87.7%) |
| 65 to 74 Years | 125 (100.0%) | 71 (56.8%) |
| 75 Years and over | 138 (100.0%) | 124 (89.9%) |
| Total | 305 (56.7%) | 414 (76.9%) |
Disability Status by Sex by Age in Manzanita
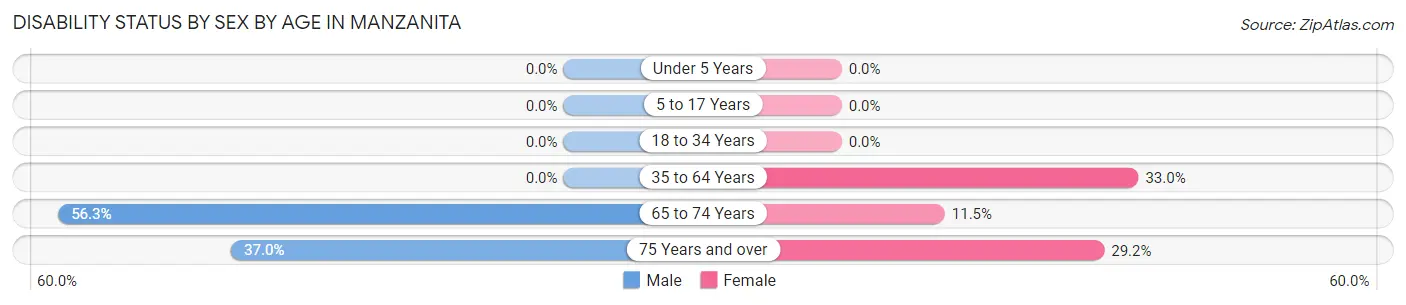
| Age Bracket | Male | Female |
| Under 5 Years | 0 (0.0%) | 0 (0.0%) |
| 5 to 17 Years | 0 (0.0%) | 0 (0.0%) |
| 18 to 34 Years | 0 (0.0%) | 0 (0.0%) |
| 35 to 64 Years | 0 (0.0%) | 37 (33.0%) |
| 65 to 74 Years | 36 (56.2%) | 7 (11.5%) |
| 75 Years and over | 27 (37.0%) | 19 (29.2%) |
Disability Class by Sex by Age in Manzanita
Disability Class: Hearing Difficulty
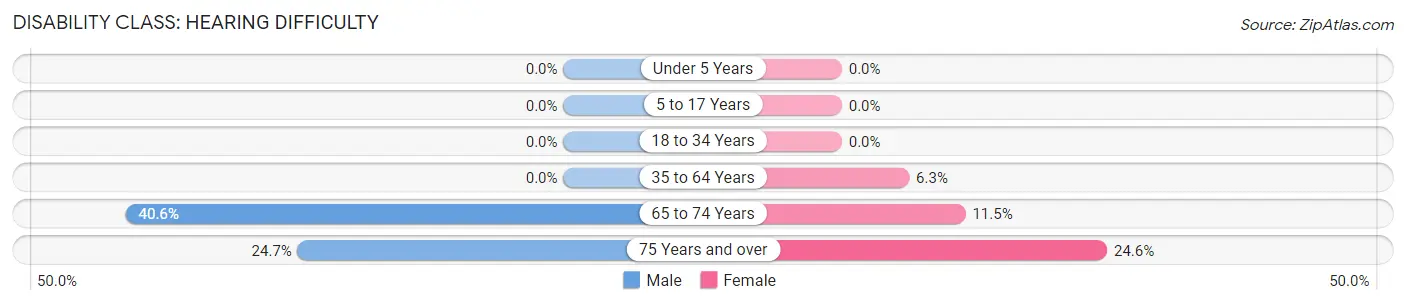
| Age Bracket | Male | Female |
| Under 5 Years | 0 (0.0%) | 0 (0.0%) |
| 5 to 17 Years | 0 (0.0%) | 0 (0.0%) |
| 18 to 34 Years | 0 (0.0%) | 0 (0.0%) |
| 35 to 64 Years | 0 (0.0%) | 7 (6.2%) |
| 65 to 74 Years | 26 (40.6%) | 7 (11.5%) |
| 75 Years and over | 18 (24.7%) | 16 (24.6%) |
Disability Class: Vision Difficulty
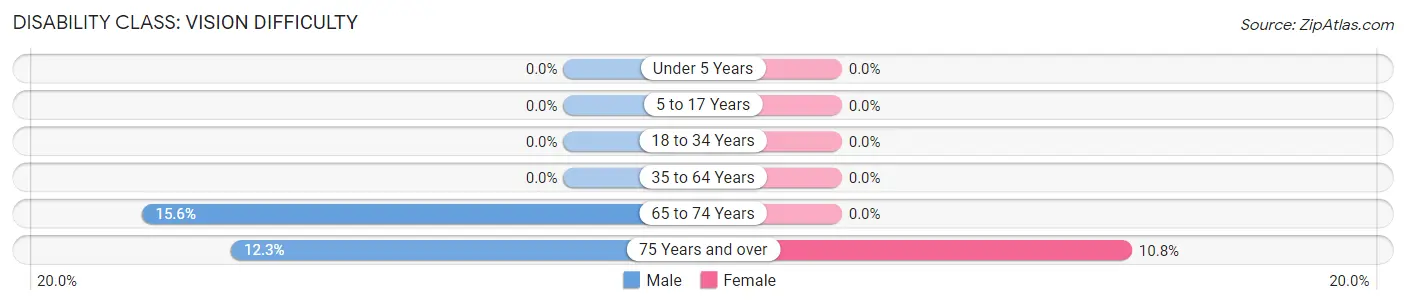
| Age Bracket | Male | Female |
| Under 5 Years | 0 (0.0%) | 0 (0.0%) |
| 5 to 17 Years | 0 (0.0%) | 0 (0.0%) |
| 18 to 34 Years | 0 (0.0%) | 0 (0.0%) |
| 35 to 64 Years | 0 (0.0%) | 0 (0.0%) |
| 65 to 74 Years | 10 (15.6%) | 0 (0.0%) |
| 75 Years and over | 9 (12.3%) | 7 (10.8%) |
Disability Class: Cognitive Difficulty
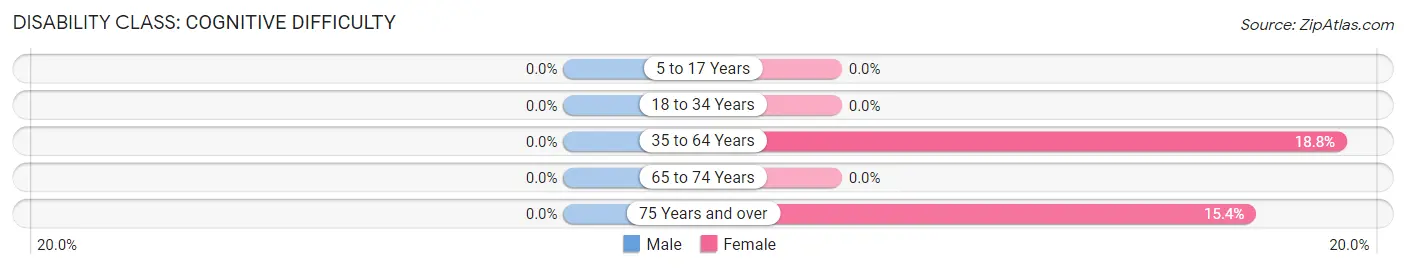
| Age Bracket | Male | Female |
| 5 to 17 Years | 0 (0.0%) | 0 (0.0%) |
| 18 to 34 Years | 0 (0.0%) | 0 (0.0%) |
| 35 to 64 Years | 0 (0.0%) | 21 (18.8%) |
| 65 to 74 Years | 0 (0.0%) | 0 (0.0%) |
| 75 Years and over | 0 (0.0%) | 10 (15.4%) |
Disability Class: Ambulatory Difficulty
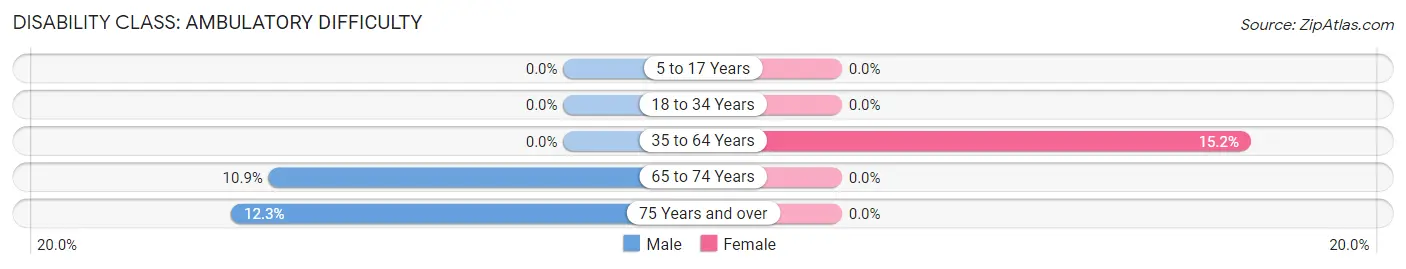
| Age Bracket | Male | Female |
| 5 to 17 Years | 0 (0.0%) | 0 (0.0%) |
| 18 to 34 Years | 0 (0.0%) | 0 (0.0%) |
| 35 to 64 Years | 0 (0.0%) | 17 (15.2%) |
| 65 to 74 Years | 7 (10.9%) | 0 (0.0%) |
| 75 Years and over | 9 (12.3%) | 0 (0.0%) |
Disability Class: Self-Care Difficulty
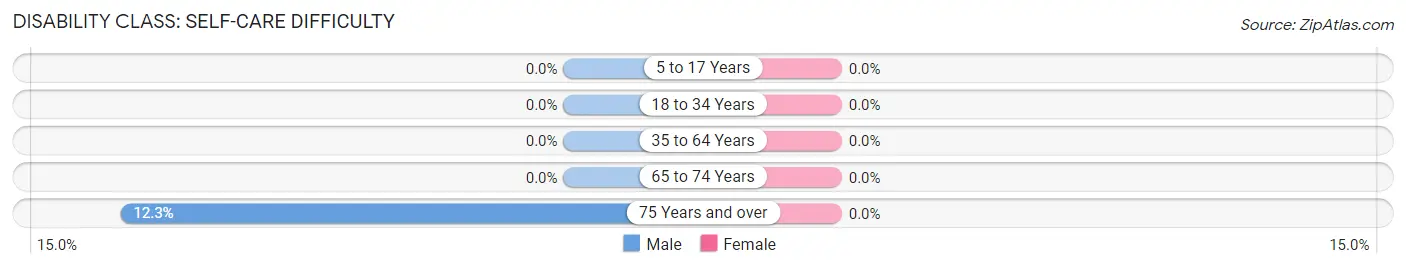
| Age Bracket | Male | Female |
| 5 to 17 Years | 0 (0.0%) | 0 (0.0%) |
| 18 to 34 Years | 0 (0.0%) | 0 (0.0%) |
| 35 to 64 Years | 0 (0.0%) | 0 (0.0%) |
| 65 to 74 Years | 0 (0.0%) | 0 (0.0%) |
| 75 Years and over | 9 (12.3%) | 0 (0.0%) |
Technology Access in Manzanita
Computing Device Access in Manzanita
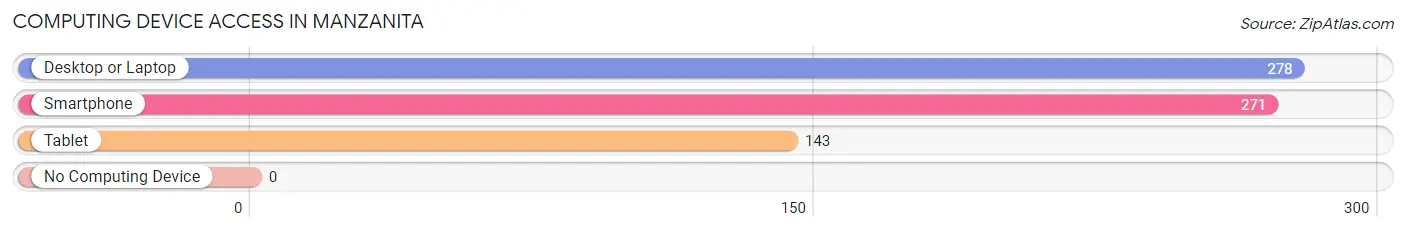
| Device Type | # Households | % Households |
| Desktop or Laptop | 278 | 94.2% |
| Smartphone | 271 | 91.9% |
| Tablet | 143 | 48.5% |
| No Computing Device | 0 | 0.0% |
| Total | 295 | 100.0% |
Internet Access in Manzanita
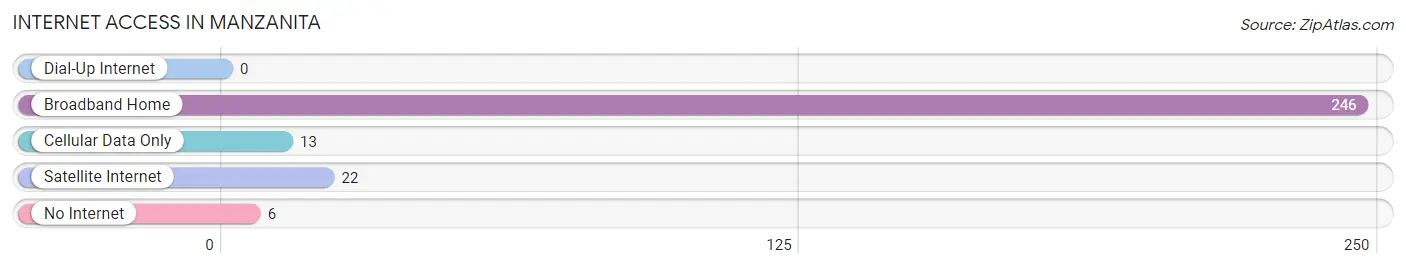
| Internet Type | # Households | % Households |
| Dial-Up Internet | 0 | 0.0% |
| Broadband Home | 246 | 83.4% |
| Cellular Data Only | 13 | 4.4% |
| Satellite Internet | 22 | 7.5% |
| No Internet | 6 | 2.0% |
| Total | 295 | 100.0% |
Manzanita Summary
Manzanita, Oregon is a small coastal town located in Tillamook County, Oregon. It is situated on the northern Oregon Coast, approximately 90 miles west of Portland. The town is known for its stunning views of the Pacific Ocean, its quaint downtown area, and its laid-back atmosphere.
History
Manzanita was first settled in the late 1800s by a group of settlers from the Midwest. The town was originally called Neahkahnie, after the nearby Neahkahnie Mountain. The name was changed to Manzanita in 1891, after the manzanita shrubs that grew in the area.
The town was incorporated in 1911 and quickly became a popular tourist destination. The town was home to several hotels, restaurants, and shops, and was a popular spot for fishing and beach activities.
In the 1950s, the town began to decline as tourists began to flock to other coastal towns. The decline continued until the 1970s, when the town began to experience a resurgence. The town was revitalized with the opening of the Manzanita Beach State Park in 1975.
Geography
Manzanita is located on the northern Oregon Coast, approximately 90 miles west of Portland. The town is situated on a small peninsula, surrounded by the Pacific Ocean to the west and Nehalem Bay to the east. The town is bordered by the cities of Nehalem to the north and Wheeler to the south.
The town is situated on a flat coastal plain, with the Neahkahnie Mountain range to the east. The climate in Manzanita is mild, with temperatures rarely dropping below freezing. The town receives an average of 40 inches of rain per year.
Economy
The economy of Manzanita is largely based on tourism. The town is home to several hotels, restaurants, and shops, as well as a variety of outdoor activities. The town is also home to several art galleries and studios, as well as a number of small businesses.
The town is also home to a number of fishing and seafood processing businesses. The seafood industry is a major employer in the town, with many of the local businesses relying on the seafood industry for their livelihood.
Demographics
As of the 2010 census, the population of Manzanita was 1,072. The town is predominantly white, with a small Hispanic population. The median household income in Manzanita is $45,000, and the median home value is $310,000.
Manzanita is a small, close-knit community. The town is known for its laid-back atmosphere and its stunning views of the Pacific Ocean. The town is home to a variety of outdoor activities, as well as a number of art galleries and studios. Manzanita is a popular tourist destination, and is a great place to visit for those looking for a relaxing getaway.
Common Questions
What is Per Capita Income in Manzanita?
Per Capita income in Manzanita is $73,079.
What is the Median Family Income in Manzanita?
Median Family Income in Manzanita is $94,107.
What is the Median Household income in Manzanita?
Median Household Income in Manzanita is $77,650.
What is Income or Wage Gap in Manzanita?
Income or Wage Gap in Manzanita is 45.4%.
Women in Manzanita earn 54.6 cents for every dollar earned by a man.
What is Inequality or Gini Index in Manzanita?
Inequality or Gini Index in Manzanita is 0.54.
What is the Total Population of Manzanita?
Total Population of Manzanita is 538.
What is the Total Male Population of Manzanita?
Total Male Population of Manzanita is 280.
What is the Total Female Population of Manzanita?
Total Female Population of Manzanita is 258.
What is the Ratio of Males per 100 Females in Manzanita?
There are 108.53 Males per 100 Females in Manzanita.
What is the Ratio of Females per 100 Males in Manzanita?
There are 92.14 Females per 100 Males in Manzanita.
What is the Median Population Age in Manzanita?
Median Population Age in Manzanita is 64.5 Years.
What is the Average Family Size in Manzanita
Average Family Size in Manzanita is 2.2 People.
What is the Average Household Size in Manzanita
Average Household Size in Manzanita is 1.8 People.
How Large is the Labor Force in Manzanita?
There are 171 People in the Labor Forcein in Manzanita.
What is the Percentage of People in the Labor Force in Manzanita?
32.7% of People are in the Labor Force in Manzanita.
What is the Unemployment Rate in Manzanita?
Unemployment Rate in Manzanita is 12.3%.