Lostine, OR Map & Demographics
Lostine Map
Lostine Overview
$25,199
PER CAPITA INCOME
$75,750
AVG FAMILY INCOME
$63,750
AVG HOUSEHOLD INCOME
48.4%
WAGE / INCOME GAP [ % ]
51.6¢/ $1
WAGE / INCOME GAP [ $ ]
0.40
INEQUALITY / GINI INDEX
381
TOTAL POPULATION
189
MALE POPULATION
192
FEMALE POPULATION
98.44
MALES / 100 FEMALES
101.59
FEMALES / 100 MALES
43.1
MEDIAN AGE
3.3
AVG FAMILY SIZE
2.9
AVG HOUSEHOLD SIZE
169
LABOR FORCE [ PEOPLE ]
58.9%
PERCENT IN LABOR FORCE
12.4%
UNEMPLOYMENT RATE
Lostine Zip Codes
Lostine Area Codes
Income in Lostine
Income Overview in Lostine
Per Capita Income in Lostine is $25,199, while median incomes of families and households are $75,750 and $63,750 respectively.
| Characteristic | Number | Measure |
| Per Capita Income | 381 | $25,199 |
| Median Family Income | 96 | $75,750 |
| Mean Family Income | 96 | $80,803 |
| Median Household Income | 132 | $63,750 |
| Mean Household Income | 132 | $73,071 |
| Income Deficit | 96 | $0 |
| Wage / Income Gap (%) | 381 | 48.37% |
| Wage / Income Gap ($) | 381 | 51.63¢ per $1 |
| Gini / Inequality Index | 381 | 0.40 |
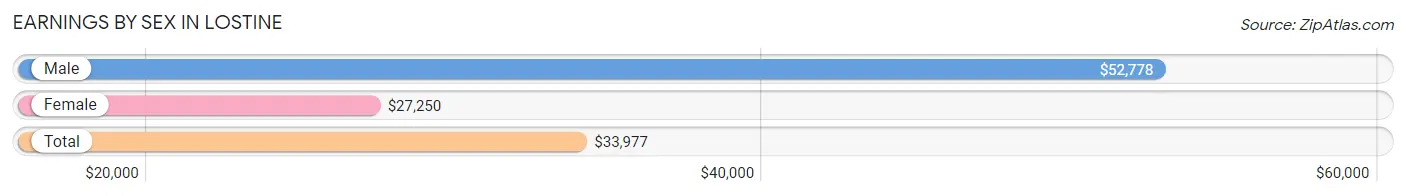
Earnings by Sex in Lostine
Average Earnings in Lostine are $33,977, $52,778 for men and $27,250 for women, a difference of 48.4%.
| Sex | Number | Average Earnings |
| Male | 62 (38.0%) | $52,778 |
| Female | 101 (62.0%) | $27,250 |
| Total | 163 (100.0%) | $33,977 |
Earnings by Sex by Income Bracket in Lostine
The most common earnings brackets in Lostine are $50,000 to $54,999 for men (11 | 17.7%) and $40,000 to $44,999 for women (23 | 22.8%).
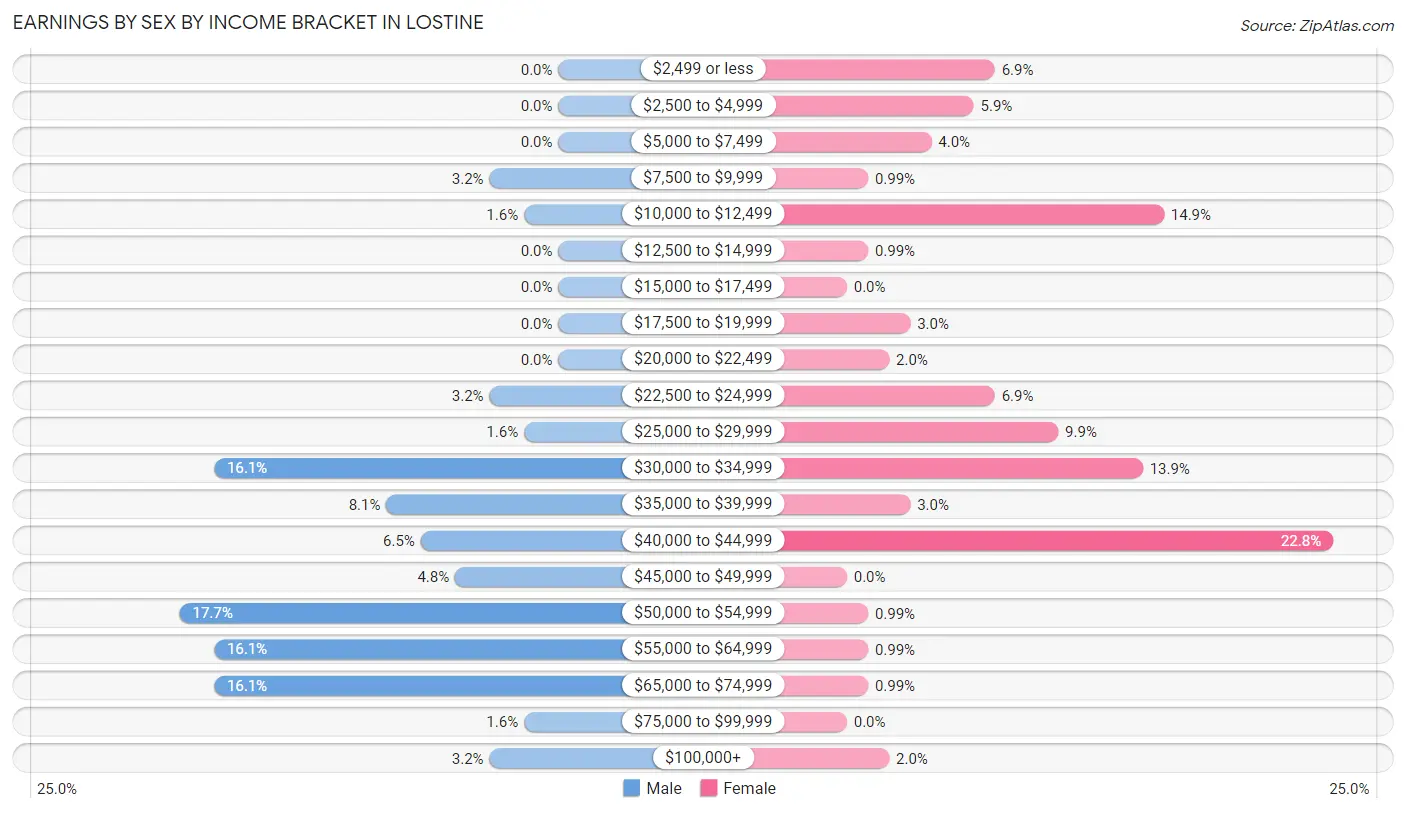
| Income | Male | Female |
| $2,499 or less | 0 (0.0%) | 7 (6.9%) |
| $2,500 to $4,999 | 0 (0.0%) | 6 (5.9%) |
| $5,000 to $7,499 | 0 (0.0%) | 4 (4.0%) |
| $7,500 to $9,999 | 2 (3.2%) | 1 (1.0%) |
| $10,000 to $12,499 | 1 (1.6%) | 15 (14.8%) |
| $12,500 to $14,999 | 0 (0.0%) | 1 (1.0%) |
| $15,000 to $17,499 | 0 (0.0%) | 0 (0.0%) |
| $17,500 to $19,999 | 0 (0.0%) | 3 (3.0%) |
| $20,000 to $22,499 | 0 (0.0%) | 2 (2.0%) |
| $22,500 to $24,999 | 2 (3.2%) | 7 (6.9%) |
| $25,000 to $29,999 | 1 (1.6%) | 10 (9.9%) |
| $30,000 to $34,999 | 10 (16.1%) | 14 (13.9%) |
| $35,000 to $39,999 | 5 (8.1%) | 3 (3.0%) |
| $40,000 to $44,999 | 4 (6.5%) | 23 (22.8%) |
| $45,000 to $49,999 | 3 (4.8%) | 0 (0.0%) |
| $50,000 to $54,999 | 11 (17.7%) | 1 (1.0%) |
| $55,000 to $64,999 | 10 (16.1%) | 1 (1.0%) |
| $65,000 to $74,999 | 10 (16.1%) | 1 (1.0%) |
| $75,000 to $99,999 | 1 (1.6%) | 0 (0.0%) |
| $100,000+ | 2 (3.2%) | 2 (2.0%) |
| Total | 62 (100.0%) | 101 (100.0%) |
Earnings by Sex by Educational Attainment in Lostine
Average earnings in Lostine are $52,778 for men and $27,750 for women, a difference of 47.4%. Men with an educational attainment of college or associate's degree enjoy the highest average annual earnings of $53,542, while those with high school diploma education earn the least with $52,500. Women with an educational attainment of high school diploma earn the most with the average annual earnings of $31,071, while those with less than high school education have the smallest earnings of $26,500.
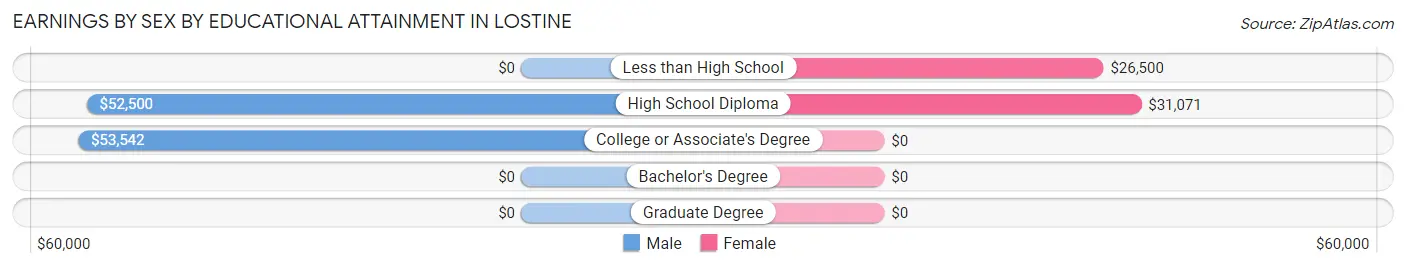
| Educational Attainment | Male Income | Female Income |
| Less than High School | - | - |
| High School Diploma | $52,500 | $31,071 |
| College or Associate's Degree | $53,542 | $0 |
| Bachelor's Degree | - | - |
| Graduate Degree | - | - |
| Total | $52,778 | $27,750 |
Family Income in Lostine
Family Income Brackets in Lostine
According to the Lostine family income data, there are 30 families falling into the $100,000 to $149,999 income range, which is the most common income bracket and makes up 31.2% of all families.
| Income Bracket | # Families | % Families |
| Less than $10,000 | 0 | 0.0% |
| $10,000 to $14,999 | 0 | 0.0% |
| $15,000 to $24,999 | 14 | 14.6% |
| $25,000 to $34,999 | 9 | 9.4% |
| $35,000 to $49,999 | 8 | 8.3% |
| $50,000 to $74,999 | 14 | 14.6% |
| $75,000 to $99,999 | 15 | 15.6% |
| $100,000 to $149,999 | 30 | 31.3% |
| $150,000 to $199,999 | 6 | 6.3% |
| $200,000+ | 0 | 0.0% |
Family Income by Famaliy Size in Lostine
4-person families (14 | 14.6%) account for the highest median family income in Lostine with $95,833 per family, while 2-person families (50 | 52.1%) have the highest median income of $31,875 per family member.
| Income Bracket | # Families | Median Income |
| 2-Person Families | 50 (52.1%) | $63,750 |
| 3-Person Families | 16 (16.7%) | $0 |
| 4-Person Families | 14 (14.6%) | $95,833 |
| 5-Person Families | 4 (4.2%) | $0 |
| 6-Person Families | 12 (12.5%) | $0 |
| 7+ Person Families | 0 (0.0%) | $0 |
| Total | 96 (100.0%) | $75,750 |
Family Income by Number of Earners in Lostine
The median family income in Lostine is $75,750, with families comprising 3+ earners (7) having the highest median family income of $121,875, while families with no earners (12) have the lowest median family income of $21,667, accounting for 7.3% and 12.5% of families, respectively.
| Number of Earners | # Families | Median Income |
| No Earners | 12 (12.5%) | $21,667 |
| 1 Earner | 46 (47.9%) | $76,944 |
| 2 Earners | 31 (32.3%) | $72,250 |
| 3+ Earners | 7 (7.3%) | $121,875 |
| Total | 96 (100.0%) | $75,750 |
Household Income in Lostine
Household Income Brackets in Lostine
With 27 households falling in the category, the $50,000 to $74,999 income range is the most frequent in Lostine, accounting for 20.4% of all households.
| Income Bracket | # Households | % Households |
| Less than $10,000 | 12 | 9.1% |
| $10,000 to $14,999 | 1 | 0.8% |
| $15,000 to $24,999 | 18 | 13.6% |
| $25,000 to $34,999 | 10 | 7.6% |
| $35,000 to $49,999 | 11 | 8.3% |
| $50,000 to $74,999 | 27 | 20.5% |
| $75,000 to $99,999 | 16 | 12.1% |
| $100,000 to $149,999 | 11 | 8.3% |
| $150,000 to $199,999 | 26 | 19.7% |
| $200,000+ | 0 | 0.0% |
Household Income by Householder Age in Lostine
The median household income in Lostine is $63,750, with the highest median household income of $72,250 found in the 25 to 44 years age bracket for the primary householder. A total of 33 households (25.0%) fall into this category.

| Income Bracket | # Households | Median Income |
| 15 to 24 Years | 0 (0.0%) | $0 |
| 25 to 44 Years | 33 (25.0%) | $72,250 |
| 45 to 64 Years | 29 (22.0%) | $0 |
| 65+ Years | 70 (53.0%) | $66,250 |
| Total | 132 (100.0%) | $63,750 |
Poverty in Lostine
Income Below Poverty by Sex and Age in Lostine
With 6.6% poverty level for males and 10.9% for females among the residents of Lostine, under 5 year old males and 25 to 34 year old females are the most vulnerable to poverty, with 9 males (39.1%) and 11 females (45.8%) in their respective age groups living below the poverty level.
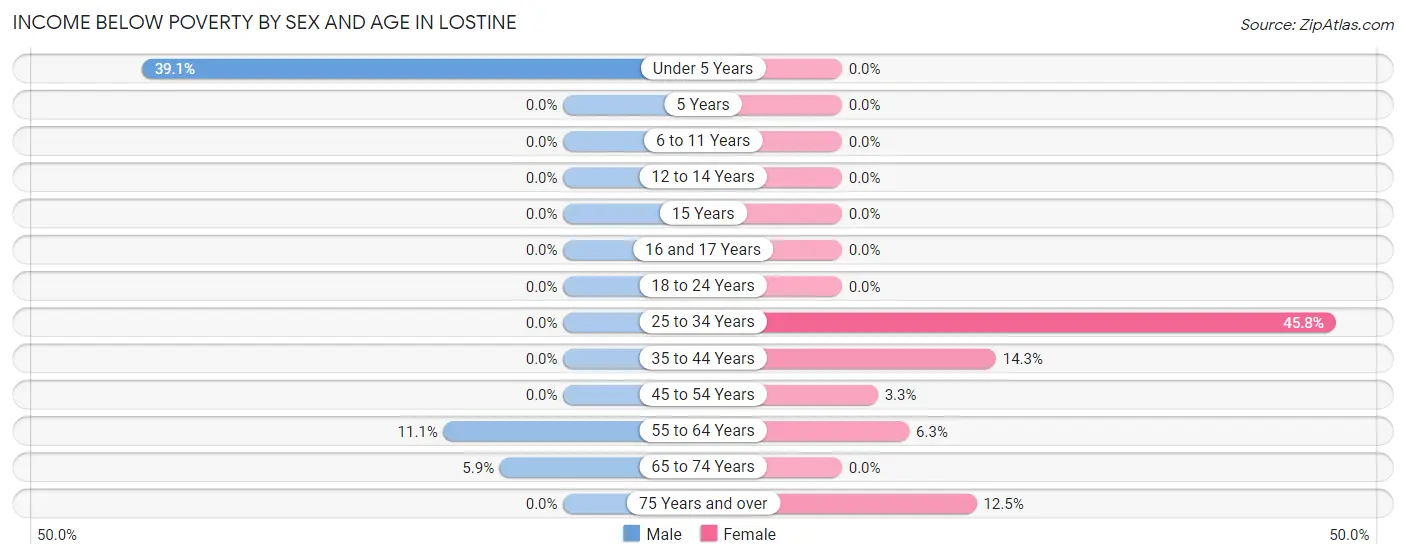
| Age Bracket | Male | Female |
| Under 5 Years | 9 (39.1%) | 0 (0.0%) |
| 5 Years | 0 (0.0%) | 0 (0.0%) |
| 6 to 11 Years | 0 (0.0%) | 0 (0.0%) |
| 12 to 14 Years | 0 (0.0%) | 0 (0.0%) |
| 15 Years | 0 (0.0%) | 0 (0.0%) |
| 16 and 17 Years | 0 (0.0%) | 0 (0.0%) |
| 18 to 24 Years | 0 (0.0%) | 0 (0.0%) |
| 25 to 34 Years | 0 (0.0%) | 11 (45.8%) |
| 35 to 44 Years | 0 (0.0%) | 2 (14.3%) |
| 45 to 54 Years | 0 (0.0%) | 1 (3.3%) |
| 55 to 64 Years | 2 (11.1%) | 1 (6.2%) |
| 65 to 74 Years | 1 (5.9%) | 0 (0.0%) |
| 75 Years and over | 0 (0.0%) | 6 (12.5%) |
| Total | 12 (6.6%) | 21 (10.9%) |
Income Above Poverty by Sex and Age in Lostine
According to the poverty statistics in Lostine, males aged 6 to 11 years and females aged under 5 years are the age groups that are most secure financially, with 100.0% of males and 100.0% of females in these age groups living above the poverty line.
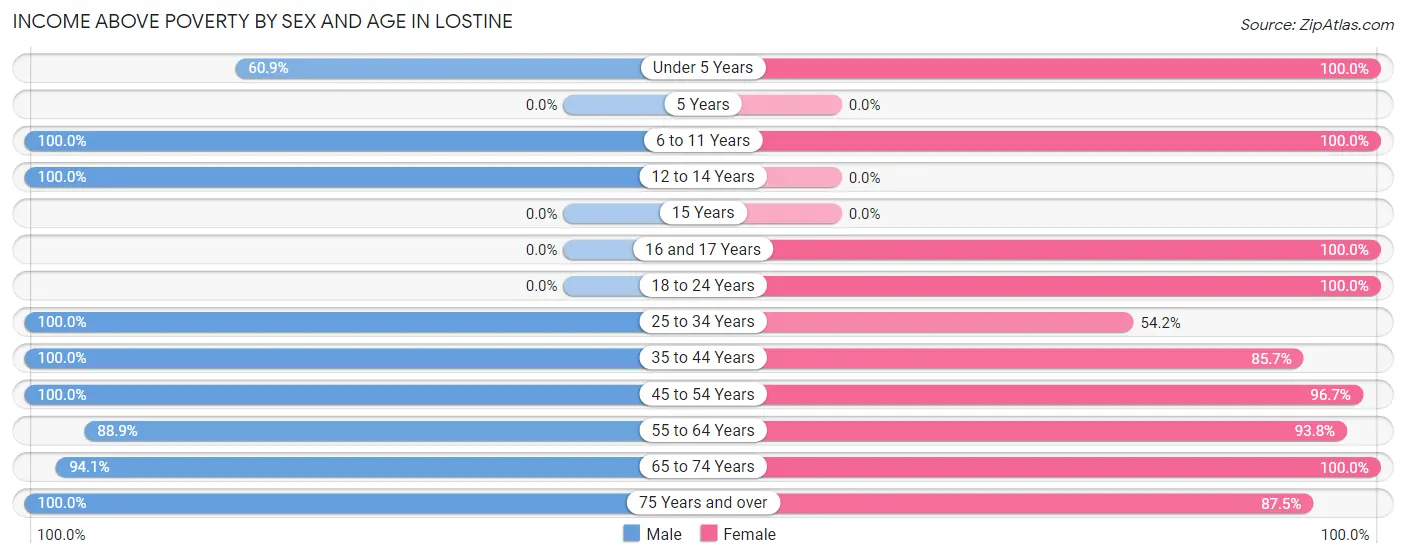
| Age Bracket | Male | Female |
| Under 5 Years | 14 (60.9%) | 17 (100.0%) |
| 5 Years | 0 (0.0%) | 0 (0.0%) |
| 6 to 11 Years | 5 (100.0%) | 14 (100.0%) |
| 12 to 14 Years | 27 (100.0%) | 0 (0.0%) |
| 15 Years | 0 (0.0%) | 0 (0.0%) |
| 16 and 17 Years | 0 (0.0%) | 9 (100.0%) |
| 18 to 24 Years | 0 (0.0%) | 6 (100.0%) |
| 25 to 34 Years | 36 (100.0%) | 13 (54.2%) |
| 35 to 44 Years | 11 (100.0%) | 12 (85.7%) |
| 45 to 54 Years | 14 (100.0%) | 29 (96.7%) |
| 55 to 64 Years | 16 (88.9%) | 15 (93.8%) |
| 65 to 74 Years | 16 (94.1%) | 14 (100.0%) |
| 75 Years and over | 30 (100.0%) | 42 (87.5%) |
| Total | 169 (93.4%) | 171 (89.1%) |
Income Below Poverty Among Married-Couple Families in Lostine
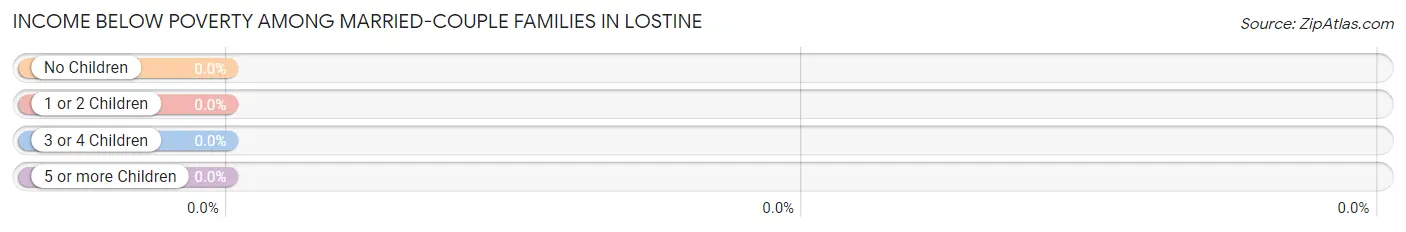
| Children | Above Poverty | Below Poverty |
| No Children | 24 (100.0%) | 0 (0.0%) |
| 1 or 2 Children | 30 (100.0%) | 0 (0.0%) |
| 3 or 4 Children | 4 (100.0%) | 0 (0.0%) |
| 5 or more Children | 0 (0.0%) | 0 (0.0%) |
| Total | 58 (100.0%) | 0 (0.0%) |
Income Below Poverty Among Single-Parent Households in Lostine
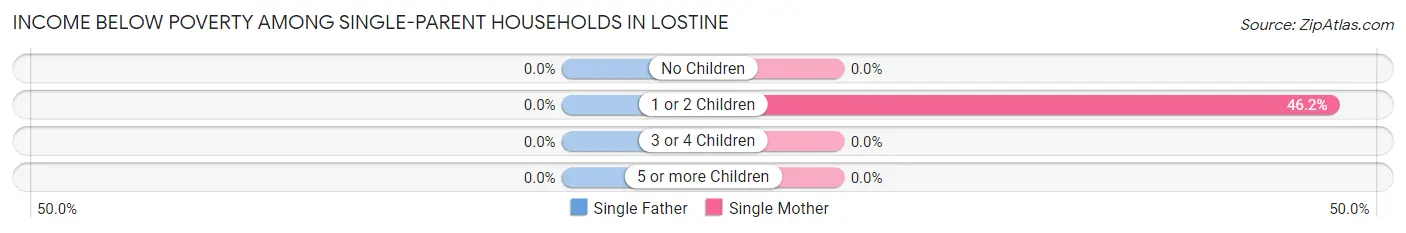
| Children | Single Father | Single Mother |
| No Children | 0 (0.0%) | 0 (0.0%) |
| 1 or 2 Children | 0 (0.0%) | 6 (46.2%) |
| 3 or 4 Children | 0 (0.0%) | 0 (0.0%) |
| 5 or more Children | 0 (0.0%) | 0 (0.0%) |
| Total | 0 (0.0%) | 6 (25.0%) |
Income Below Poverty Among Married-Couple vs Single-Parent Households in Lostine
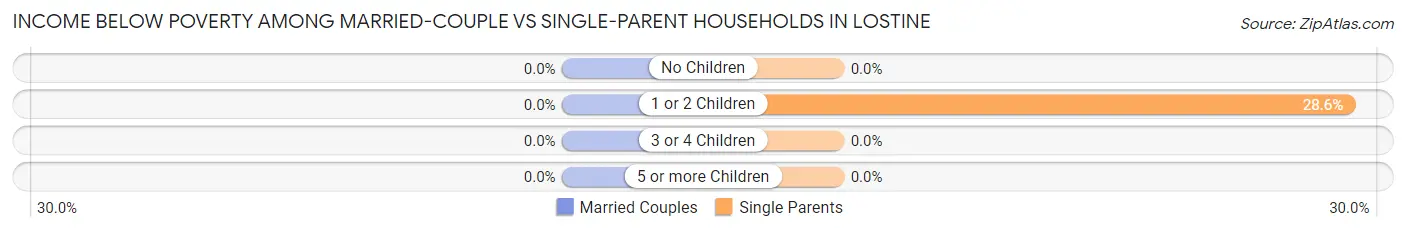
| Children | Married-Couple Families | Single-Parent Households |
| No Children | 0 (0.0%) | 0 (0.0%) |
| 1 or 2 Children | 0 (0.0%) | 6 (28.6%) |
| 3 or 4 Children | 0 (0.0%) | 0 (0.0%) |
| 5 or more Children | 0 (0.0%) | 0 (0.0%) |
| Total | 0 (0.0%) | 6 (15.8%) |
Race in Lostine
The most populous races in Lostine are White / Caucasian (376 | 98.7%), Hispanic or Latino (12 | 3.2%), and Two or more Races (3 | 0.8%).
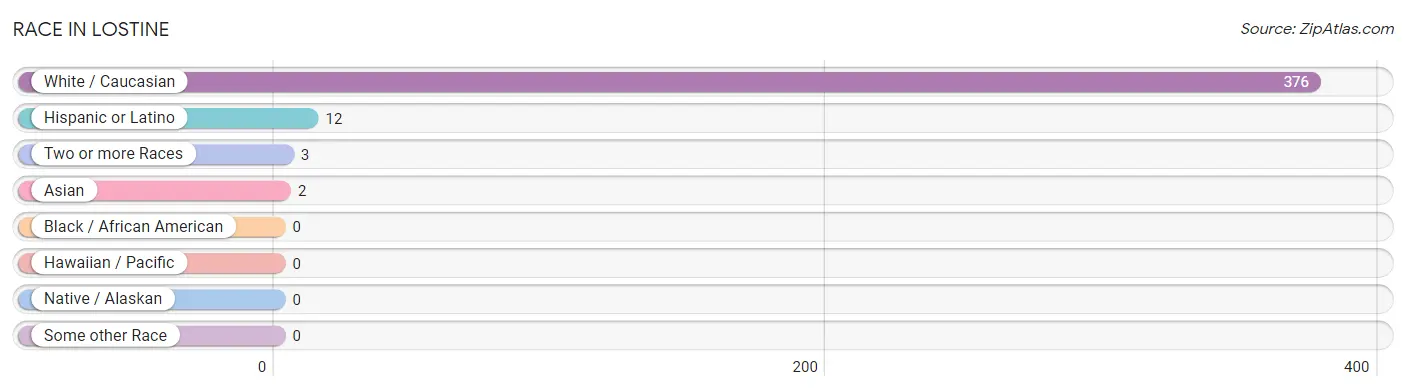
| Race | # Population | % Population |
| Asian | 2 | 0.5% |
| Black / African American | 0 | 0.0% |
| Hawaiian / Pacific | 0 | 0.0% |
| Hispanic or Latino | 12 | 3.2% |
| Native / Alaskan | 0 | 0.0% |
| White / Caucasian | 376 | 98.7% |
| Two or more Races | 3 | 0.8% |
| Some other Race | 0 | 0.0% |
| Total | 381 | 100.0% |
Ancestry in Lostine
The most populous ancestries reported in Lostine are German (72 | 18.9%), Irish (47 | 12.3%), American (26 | 6.8%), Scottish (21 | 5.5%), and Finnish (12 | 3.2%), together accounting for 46.7% of all Lostine residents.
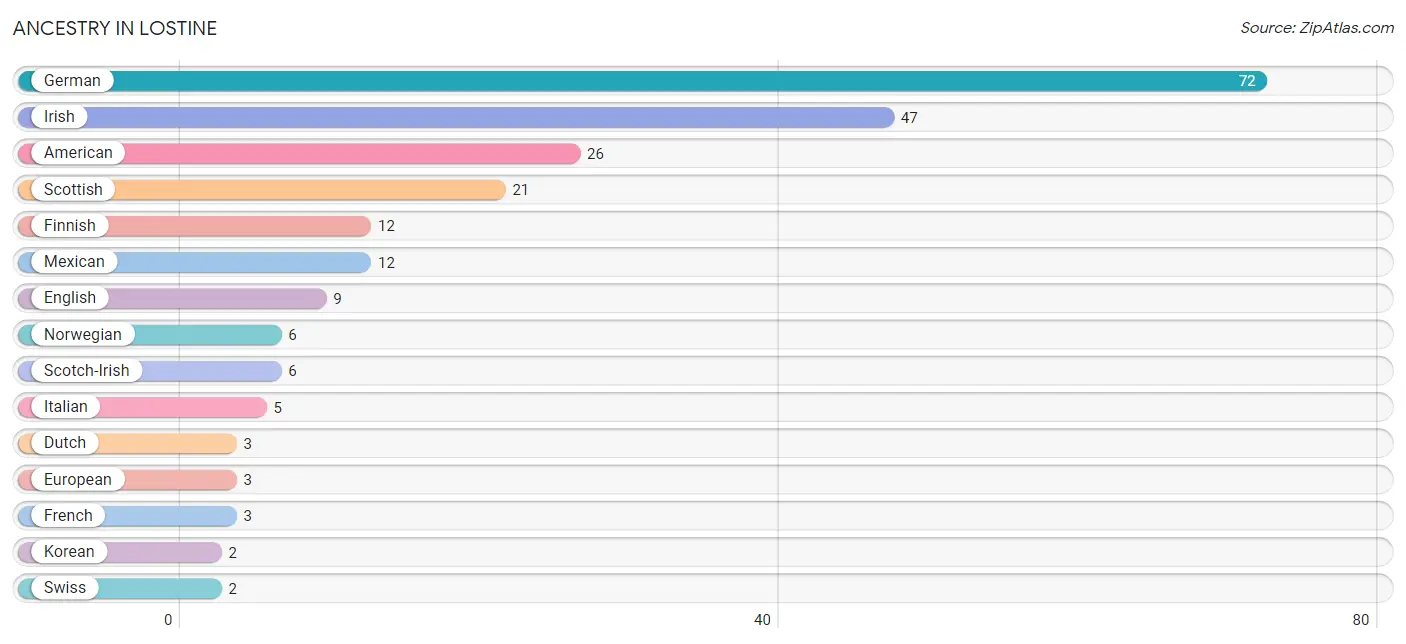
| Ancestry | # Population | % Population |
| American | 26 | 6.8% |
| Dutch | 3 | 0.8% |
| English | 9 | 2.4% |
| European | 3 | 0.8% |
| Finnish | 12 | 3.2% |
| French | 3 | 0.8% |
| German | 72 | 18.9% |
| Irish | 47 | 12.3% |
| Italian | 5 | 1.3% |
| Korean | 2 | 0.5% |
| Mexican | 12 | 3.2% |
| Norwegian | 6 | 1.6% |
| Scotch-Irish | 6 | 1.6% |
| Scottish | 21 | 5.5% |
| Swiss | 2 | 0.5% |
| Welsh | 2 | 0.5% | View All 16 Rows |
Immigrants in Lostine
The most numerous immigrant groups reported in Lostine came from Europe (4 | 1.1%), Germany (4 | 1.1%), Western Europe (4 | 1.1%), Asia (2 | 0.5%), and Philippines (2 | 0.5%), together accounting for 4.2% of all Lostine residents.
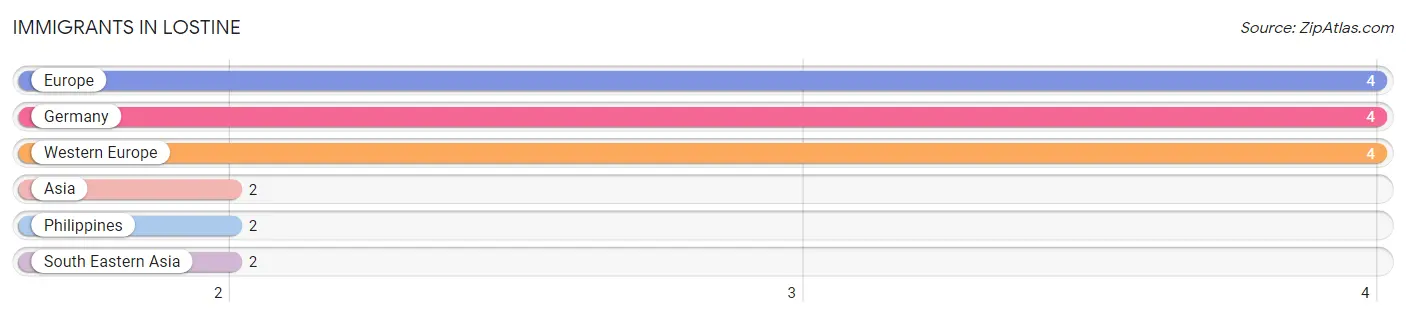
| Immigration Origin | # Population | % Population |
| Asia | 2 | 0.5% |
| Europe | 4 | 1.1% |
| Germany | 4 | 1.1% |
| Philippines | 2 | 0.5% |
| South Eastern Asia | 2 | 0.5% |
| Western Europe | 4 | 1.1% | View All 6 Rows |
Sex and Age in Lostine
Sex and Age in Lostine
The most populous age groups in Lostine are 10 to 14 Years (30 | 15.9%) for men and 85 Years and over (26 | 13.5%) for women.
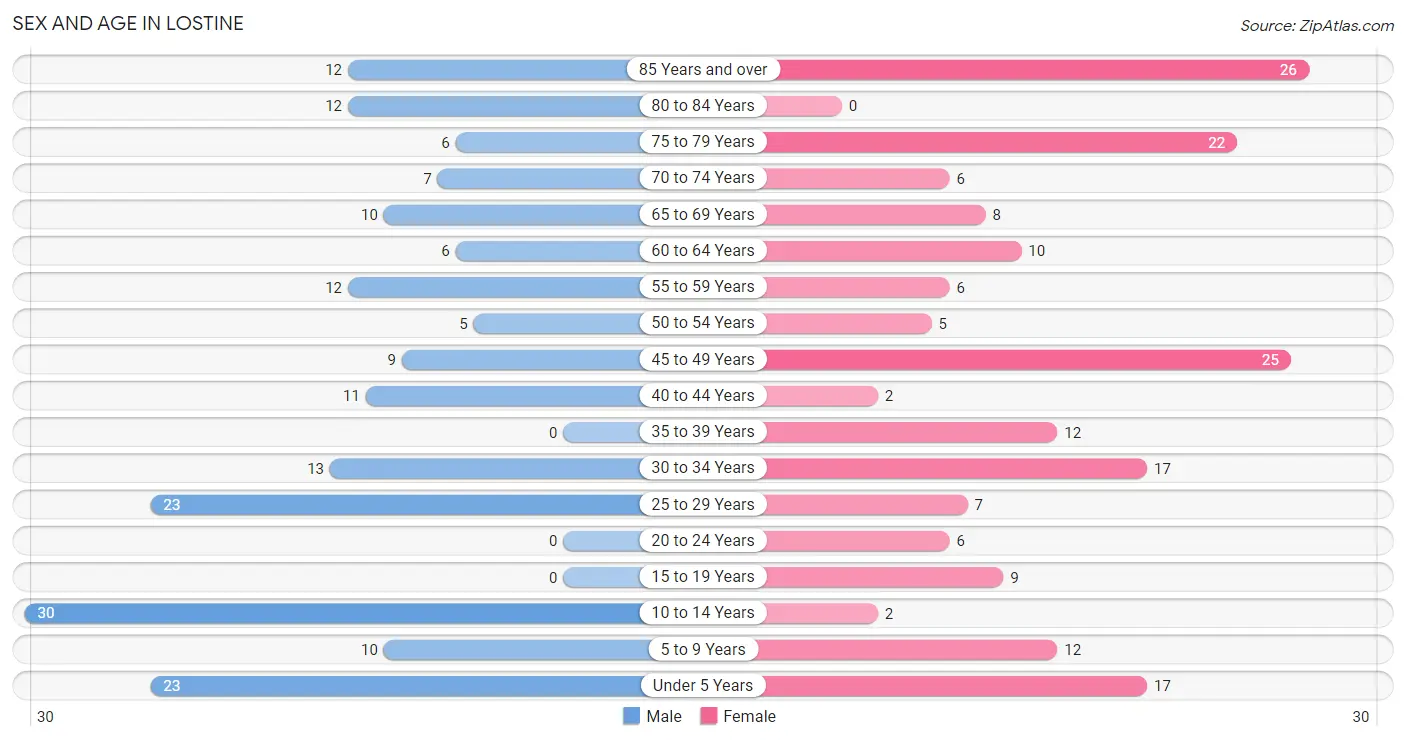
| Age Bracket | Male | Female |
| Under 5 Years | 23 (12.2%) | 17 (8.8%) |
| 5 to 9 Years | 10 (5.3%) | 12 (6.2%) |
| 10 to 14 Years | 30 (15.9%) | 2 (1.0%) |
| 15 to 19 Years | 0 (0.0%) | 9 (4.7%) |
| 20 to 24 Years | 0 (0.0%) | 6 (3.1%) |
| 25 to 29 Years | 23 (12.2%) | 7 (3.6%) |
| 30 to 34 Years | 13 (6.9%) | 17 (8.8%) |
| 35 to 39 Years | 0 (0.0%) | 12 (6.2%) |
| 40 to 44 Years | 11 (5.8%) | 2 (1.0%) |
| 45 to 49 Years | 9 (4.8%) | 25 (13.0%) |
| 50 to 54 Years | 5 (2.6%) | 5 (2.6%) |
| 55 to 59 Years | 12 (6.4%) | 6 (3.1%) |
| 60 to 64 Years | 6 (3.2%) | 10 (5.2%) |
| 65 to 69 Years | 10 (5.3%) | 8 (4.2%) |
| 70 to 74 Years | 7 (3.7%) | 6 (3.1%) |
| 75 to 79 Years | 6 (3.2%) | 22 (11.5%) |
| 80 to 84 Years | 12 (6.4%) | 0 (0.0%) |
| 85 Years and over | 12 (6.4%) | 26 (13.5%) |
| Total | 189 (100.0%) | 192 (100.0%) |
Families and Households in Lostine
Median Family Size in Lostine
The median family size in Lostine is 3.26 persons per family, with married-couple families (58 | 60.4%) accounting for the largest median family size of 3.97 persons per family. On the other hand, single male/father families (14 | 14.6%) represent the smallest median family size with 2.00 persons per family.
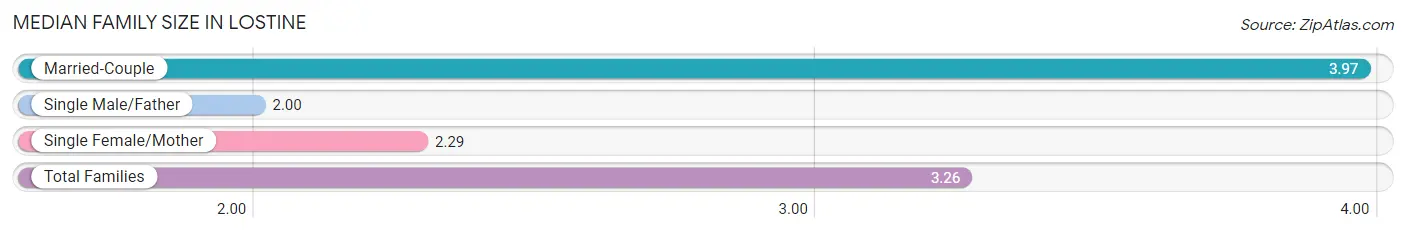
| Family Type | # Families | Family Size |
| Married-Couple | 58 (60.4%) | 3.97 |
| Single Male/Father | 14 (14.6%) | 2.00 |
| Single Female/Mother | 24 (25.0%) | 2.29 |
| Total Families | 96 (100.0%) | 3.26 |
Median Household Size in Lostine
The median household size in Lostine is 2.89 persons per household, with married-couple households (58 | 43.9%) accounting for the largest median household size of 4.12 persons per household. non-family households (36 | 27.3%) represent the smallest median household size with 1.08 persons per household.
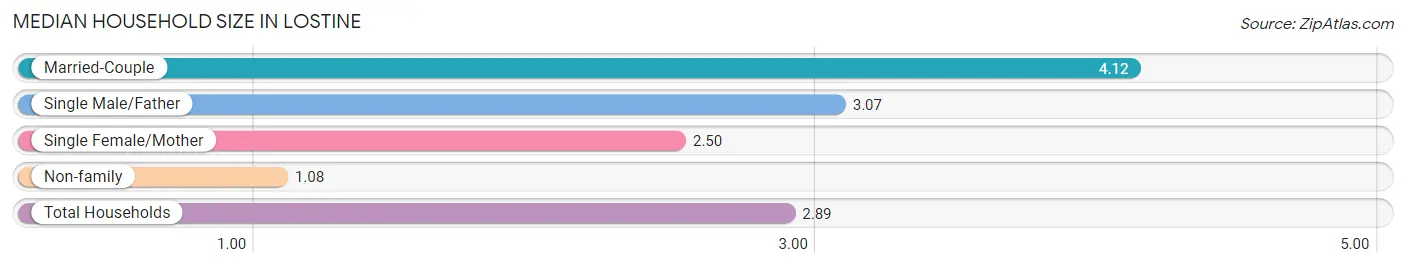
| Household Type | # Households | Household Size |
| Married-Couple | 58 (43.9%) | 4.12 |
| Single Male/Father | 14 (10.6%) | 3.07 |
| Single Female/Mother | 24 (18.2%) | 2.50 |
| Non-family | 36 (27.3%) | 1.08 |
| Total Households | 132 (100.0%) | 2.89 |
Household Size by Marriage Status in Lostine
Out of a total of 132 households in Lostine, 96 (72.7%) are family households, while 36 (27.3%) are nonfamily households. The most numerous type of family households are 2-person households, comprising 36, and the most common type of nonfamily households are 1-person households, comprising 35.
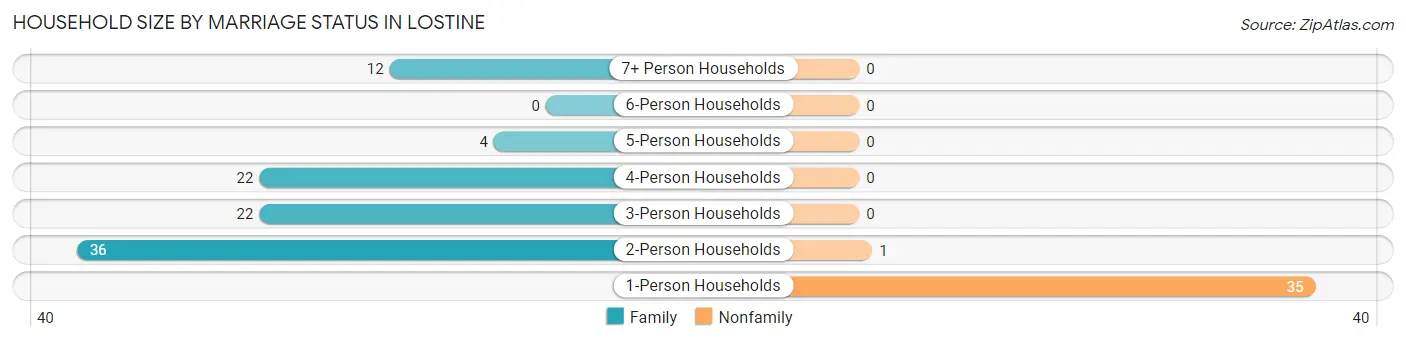
| Household Size | Family Households | Nonfamily Households |
| 1-Person Households | - | 35 (26.5%) |
| 2-Person Households | 36 (27.3%) | 1 (0.8%) |
| 3-Person Households | 22 (16.7%) | 0 (0.0%) |
| 4-Person Households | 22 (16.7%) | 0 (0.0%) |
| 5-Person Households | 4 (3.0%) | 0 (0.0%) |
| 6-Person Households | 0 (0.0%) | 0 (0.0%) |
| 7+ Person Households | 12 (9.1%) | 0 (0.0%) |
| Total | 96 (72.7%) | 36 (27.3%) |
Female Fertility in Lostine
Fertility by Age in Lostine
Average fertility rate in Lostine is 101.0 births per 1,000 women. Women in the age bracket of 20 to 34 years have the highest fertility rate with 267.0 births per 1,000 women. Women in the age bracket of 20 to 34 years acount for 100.0% of all women with births.
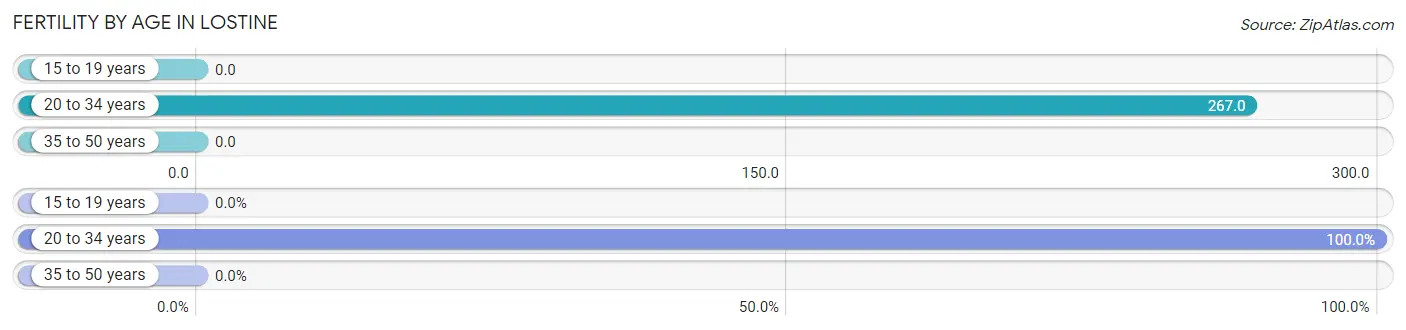
| Age Bracket | Women with Births | Births / 1,000 Women |
| 15 to 19 years | 0 (0.0%) | 0.0 |
| 20 to 34 years | 8 (100.0%) | 267.0 |
| 35 to 50 years | 0 (0.0%) | 0.0 |
| Total | 8 (100.0%) | 101.0 |
Fertility by Age by Marriage Status in Lostine
75.0% of women with births (8) in Lostine are married. The highest percentage of unmarried women with births falls into 20 to 34 years age bracket with 25.0% of them unmarried at the time of birth, while the lowest percentage of unmarried women with births belong to 20 to 34 years age bracket with 25.0% of them unmarried.
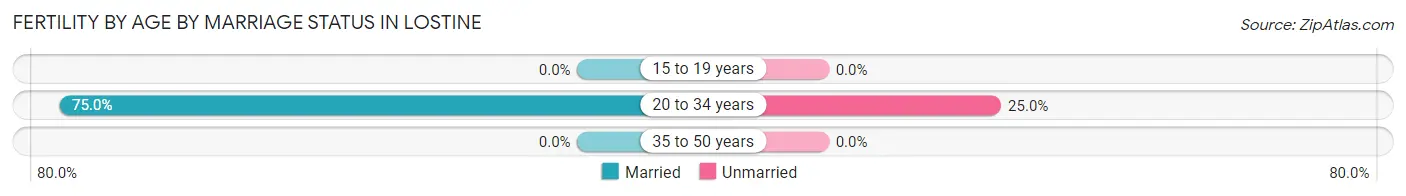
| Age Bracket | Married | Unmarried |
| 15 to 19 years | 0 (0.0%) | 0 (0.0%) |
| 20 to 34 years | 6 (75.0%) | 2 (25.0%) |
| 35 to 50 years | 0 (0.0%) | 0 (0.0%) |
| Total | 6 (75.0%) | 2 (25.0%) |
Fertility by Education in Lostine
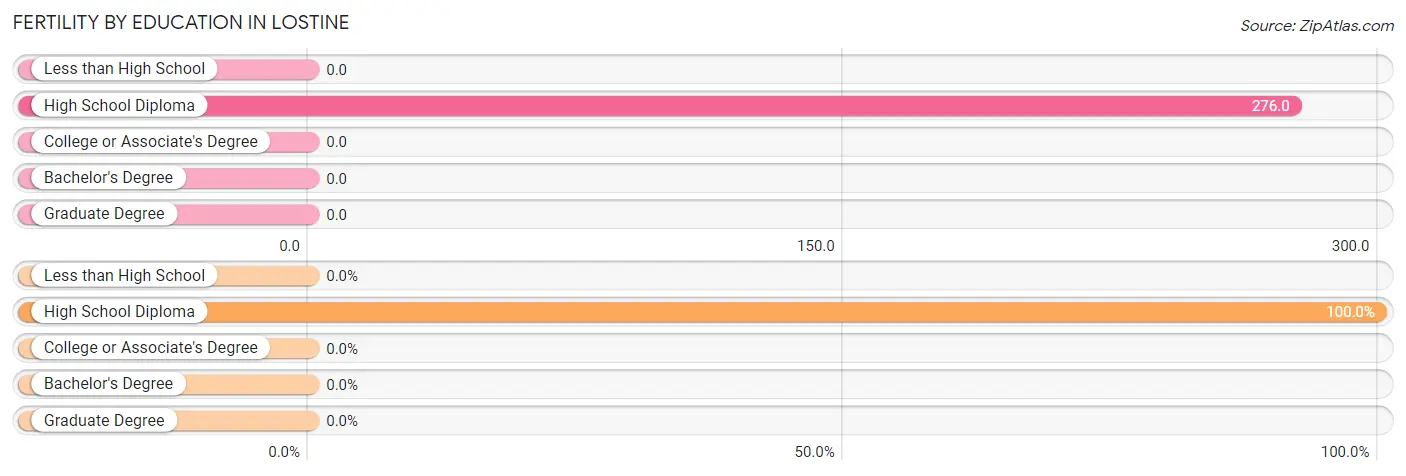
| Educational Attainment | Women with Births | Births / 1,000 Women |
| Less than High School | 0 (0.0%) | 0.0 |
| High School Diploma | 8 (100.0%) | 276.0 |
| College or Associate's Degree | 0 (0.0%) | 0.0 |
| Bachelor's Degree | 0 (0.0%) | 0.0 |
| Graduate Degree | 0 (0.0%) | 0.0 |
| Total | 8 (100.0%) | 101.0 |
Fertility by Education by Marriage Status in Lostine
25.0% of women with births in Lostine are unmarried. Women with the educational attainment of high school diploma are most likely to be married with 75.0% of them married at childbirth, while women with the educational attainment of high school diploma are least likely to be married with 25.0% of them unmarried at childbirth.
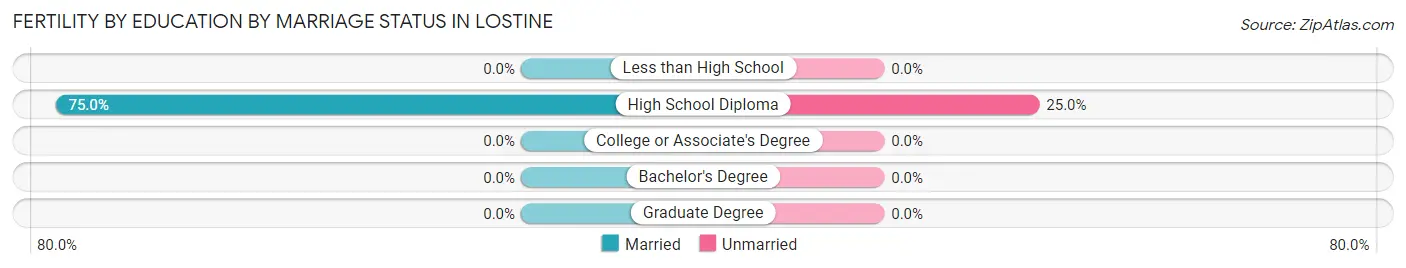
| Educational Attainment | Married | Unmarried |
| Less than High School | 0 (0.0%) | 0 (0.0%) |
| High School Diploma | 6 (75.0%) | 2 (25.0%) |
| College or Associate's Degree | 0 (0.0%) | 0 (0.0%) |
| Bachelor's Degree | 0 (0.0%) | 0 (0.0%) |
| Graduate Degree | 0 (0.0%) | 0 (0.0%) |
| Total | 6 (75.0%) | 2 (25.0%) |
Employment Characteristics in Lostine
Employment by Class of Employer in Lostine
Among the 145 employed individuals in Lostine, private company employees (98 | 67.6%), self-employed (incorporated) (13 | 9.0%), and local government employees (10 | 6.9%) make up the most common classes of employment.
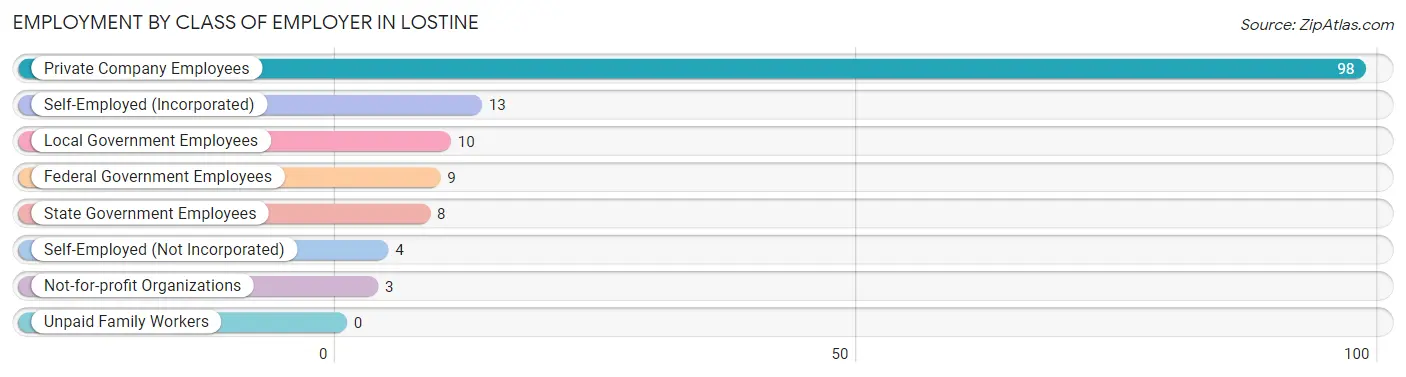
| Employer Class | # Employees | % Employees |
| Private Company Employees | 98 | 67.6% |
| Self-Employed (Incorporated) | 13 | 9.0% |
| Self-Employed (Not Incorporated) | 4 | 2.8% |
| Not-for-profit Organizations | 3 | 2.1% |
| Local Government Employees | 10 | 6.9% |
| State Government Employees | 8 | 5.5% |
| Federal Government Employees | 9 | 6.2% |
| Unpaid Family Workers | 0 | 0.0% |
| Total | 145 | 100.0% |
Employment Status by Age in Lostine
According to the labor force statistics for Lostine, out of the total population over 16 years of age (287), 58.9% or 169 individuals are in the labor force, with 12.4% or 21 of them unemployed. The age group with the highest labor force participation rate is 20 to 24 years, with 100.0% or 6 individuals in the labor force. Within the labor force, the 25 to 29 years age range has the highest percentage of unemployed individuals, with 43.3% or 13 of them being unemployed.
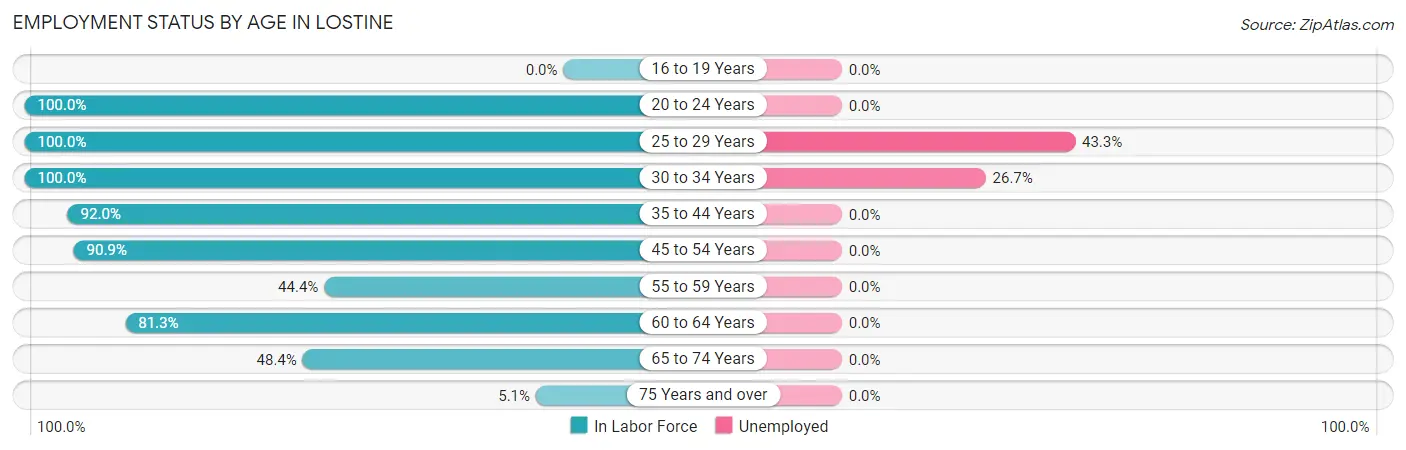
| Age Bracket | In Labor Force | Unemployed |
| 16 to 19 Years | 0 (0.0%) | 0 (0.0%) |
| 20 to 24 Years | 6 (100.0%) | 0 (0.0%) |
| 25 to 29 Years | 30 (100.0%) | 13 (43.3%) |
| 30 to 34 Years | 30 (100.0%) | 8 (26.7%) |
| 35 to 44 Years | 23 (92.0%) | 0 (0.0%) |
| 45 to 54 Years | 40 (90.9%) | 0 (0.0%) |
| 55 to 59 Years | 8 (44.4%) | 0 (0.0%) |
| 60 to 64 Years | 13 (81.3%) | 0 (0.0%) |
| 65 to 74 Years | 15 (48.4%) | 0 (0.0%) |
| 75 Years and over | 4 (5.1%) | 0 (0.0%) |
| Total | 169 (58.9%) | 21 (12.4%) |
Employment Status by Educational Attainment in Lostine
According to labor force statistics for Lostine, 88.3% of individuals (144) out of the total population between 25 and 64 years of age (163) are in the labor force, with 14.6% or 21 of them being unemployed. The group with the highest labor force participation rate are those with the educational attainment of less than high school, with 100.0% or 3 individuals in the labor force. Within the labor force, individuals with bachelor's degree or higher education have the highest percentage of unemployment, with 72.7% or 8 of them being unemployed.
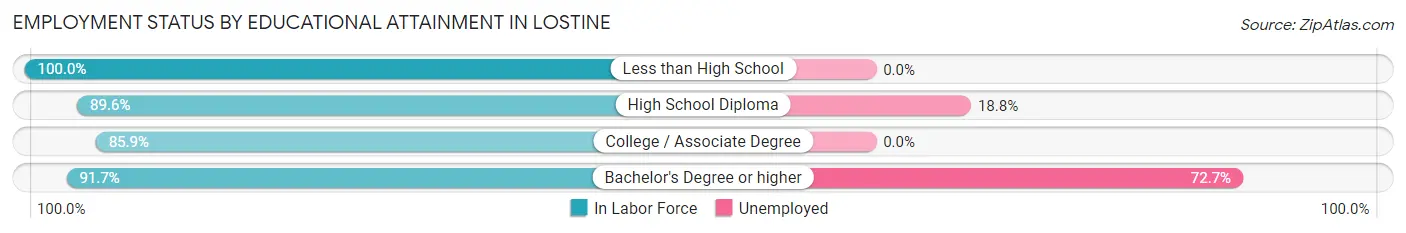
| Educational Attainment | In Labor Force | Unemployed |
| Less than High School | 3 (100.0%) | 0 (0.0%) |
| High School Diploma | 69 (89.6%) | 14 (18.8%) |
| College / Associate Degree | 61 (85.9%) | 0 (0.0%) |
| Bachelor's Degree or higher | 11 (91.7%) | 9 (72.7%) |
| Total | 144 (88.3%) | 24 (14.6%) |
Employment Occupations by Sex in Lostine
Management, Business, Science and Arts Occupations
The most common Management, Business, Science and Arts occupations in Lostine are Business & Financial (15 | 10.1%), Community & Social Service (9 | 6.1%), Management (7 | 4.7%), Legal Services & Support (6 | 4.1%), and Computers, Engineering & Science (3 | 2.0%).
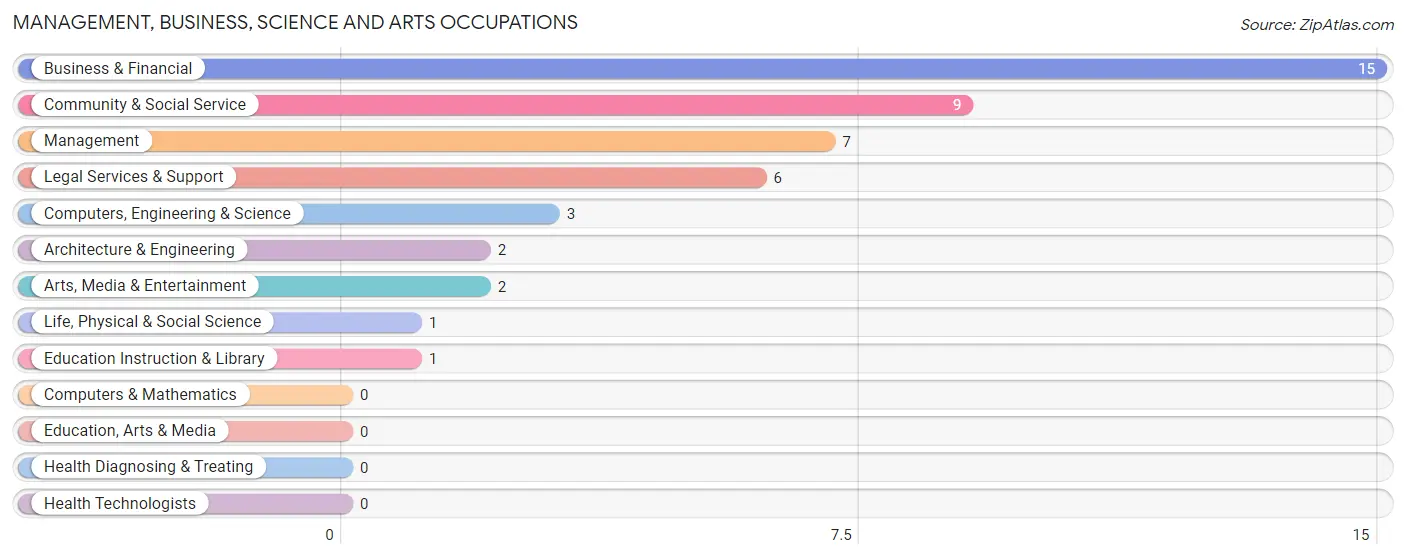
Management, Business, Science and Arts Occupations by Sex
Within the Management, Business, Science and Arts occupations in Lostine, the most male-oriented occupations are Computers, Engineering & Science (100.0%), Architecture & Engineering (100.0%), and Life, Physical & Social Science (100.0%), while the most female-oriented occupations are Business & Financial (100.0%), Community & Social Service (100.0%), and Legal Services & Support (100.0%).
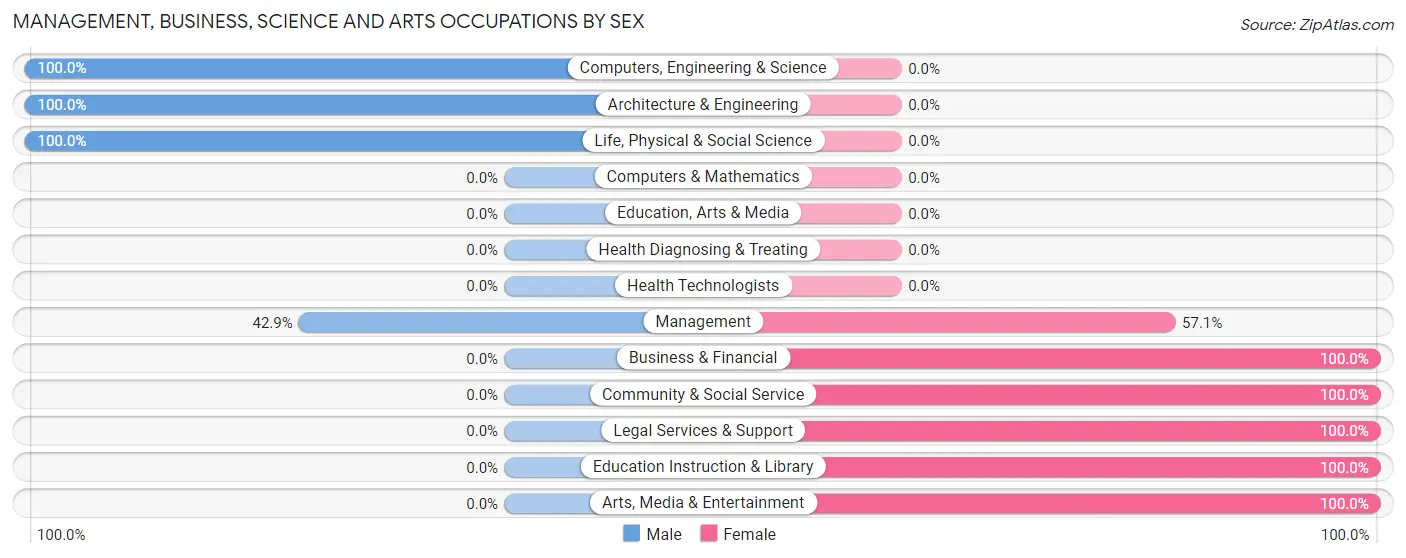
| Occupation | Male | Female |
| Management | 3 (42.9%) | 4 (57.1%) |
| Business & Financial | 0 (0.0%) | 15 (100.0%) |
| Computers, Engineering & Science | 3 (100.0%) | 0 (0.0%) |
| Computers & Mathematics | 0 (0.0%) | 0 (0.0%) |
| Architecture & Engineering | 2 (100.0%) | 0 (0.0%) |
| Life, Physical & Social Science | 1 (100.0%) | 0 (0.0%) |
| Community & Social Service | 0 (0.0%) | 9 (100.0%) |
| Education, Arts & Media | 0 (0.0%) | 0 (0.0%) |
| Legal Services & Support | 0 (0.0%) | 6 (100.0%) |
| Education Instruction & Library | 0 (0.0%) | 1 (100.0%) |
| Arts, Media & Entertainment | 0 (0.0%) | 2 (100.0%) |
| Health Diagnosing & Treating | 0 (0.0%) | 0 (0.0%) |
| Health Technologists | 0 (0.0%) | 0 (0.0%) |
| Total (Category) | 6 (17.6%) | 28 (82.4%) |
| Total (Overall) | 58 (39.2%) | 90 (60.8%) |
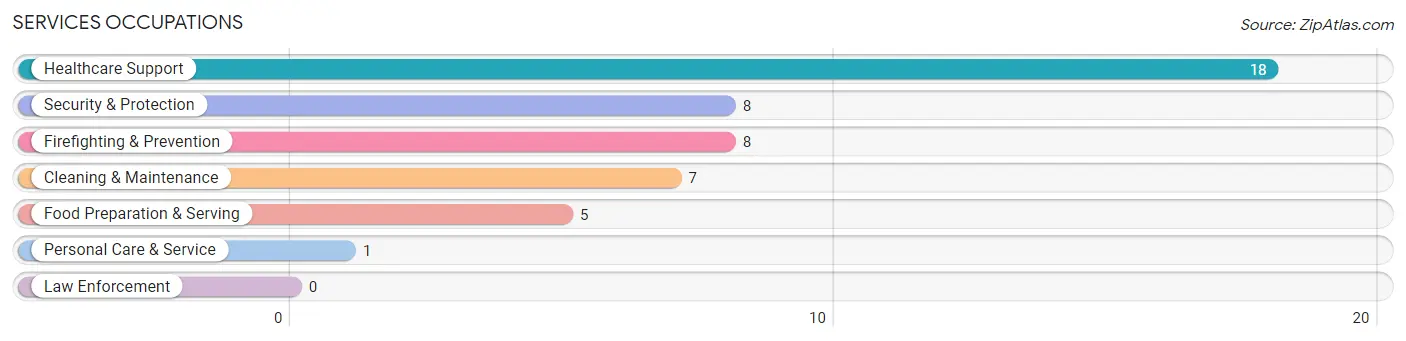
Services Occupations
The most common Services occupations in Lostine are Healthcare Support (18 | 12.2%), Security & Protection (8 | 5.4%), Firefighting & Prevention (8 | 5.4%), Cleaning & Maintenance (7 | 4.7%), and Food Preparation & Serving (5 | 3.4%).
Services Occupations by Sex
Within the Services occupations in Lostine, the most male-oriented occupations are Security & Protection (100.0%), Firefighting & Prevention (100.0%), and Cleaning & Maintenance (85.7%), while the most female-oriented occupations are Food Preparation & Serving (100.0%), Personal Care & Service (100.0%), and Healthcare Support (94.4%).
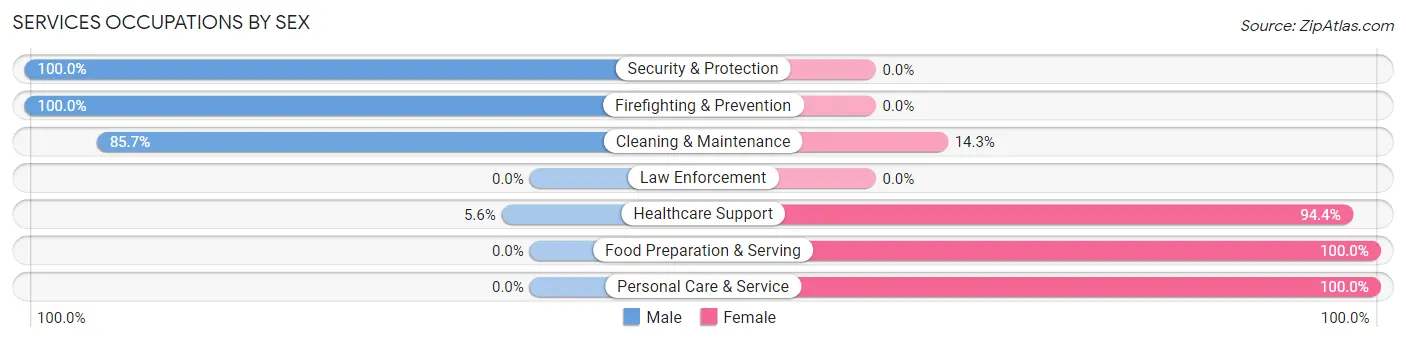
| Occupation | Male | Female |
| Healthcare Support | 1 (5.6%) | 17 (94.4%) |
| Security & Protection | 8 (100.0%) | 0 (0.0%) |
| Firefighting & Prevention | 8 (100.0%) | 0 (0.0%) |
| Law Enforcement | 0 (0.0%) | 0 (0.0%) |
| Food Preparation & Serving | 0 (0.0%) | 5 (100.0%) |
| Cleaning & Maintenance | 6 (85.7%) | 1 (14.3%) |
| Personal Care & Service | 0 (0.0%) | 1 (100.0%) |
| Total (Category) | 15 (38.5%) | 24 (61.5%) |
| Total (Overall) | 58 (39.2%) | 90 (60.8%) |
Sales and Office Occupations
The most common Sales and Office occupations in Lostine are Office & Administration (23 | 15.5%), and Sales & Related (15 | 10.1%).
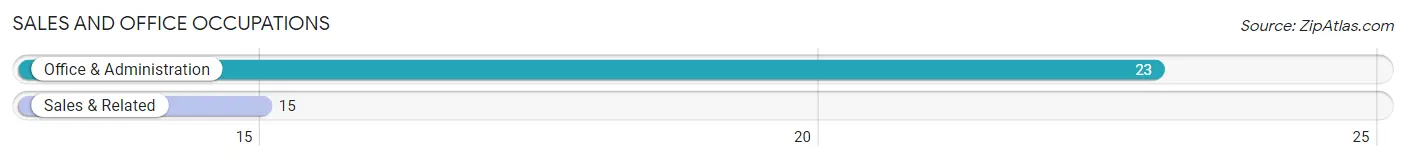
Sales and Office Occupations by Sex
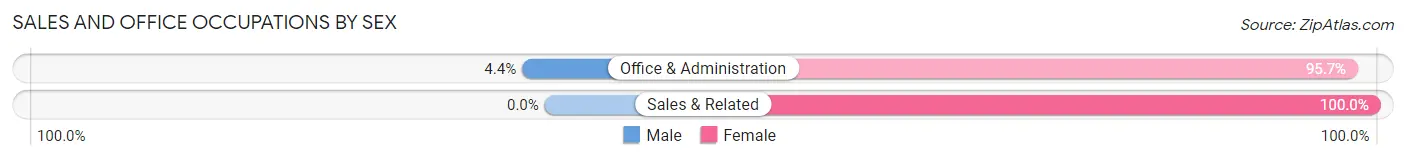
| Occupation | Male | Female |
| Sales & Related | 0 (0.0%) | 15 (100.0%) |
| Office & Administration | 1 (4.3%) | 22 (95.7%) |
| Total (Category) | 1 (2.6%) | 37 (97.4%) |
| Total (Overall) | 58 (39.2%) | 90 (60.8%) |
Natural Resources, Construction and Maintenance Occupations
The most common Natural Resources, Construction and Maintenance occupations in Lostine are Farming, Fishing & Forestry (11 | 7.4%), Construction & Extraction (6 | 4.1%), and Installation, Maintenance & Repair (2 | 1.3%).
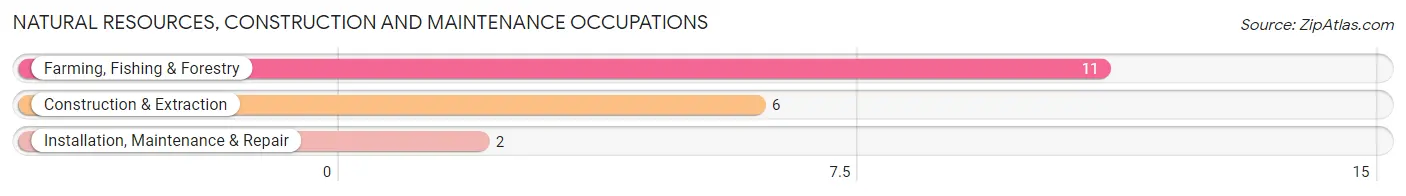
Natural Resources, Construction and Maintenance Occupations by Sex
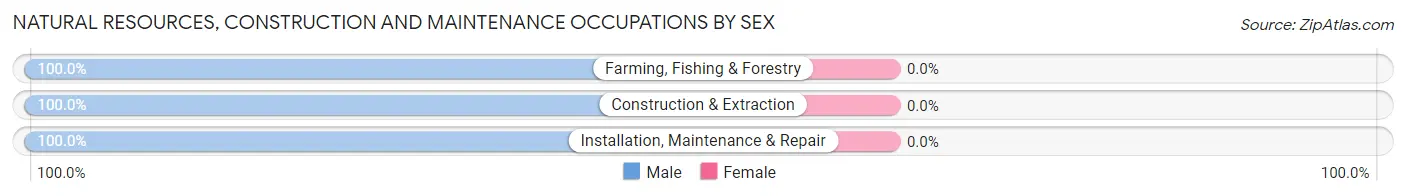
| Occupation | Male | Female |
| Farming, Fishing & Forestry | 11 (100.0%) | 0 (0.0%) |
| Construction & Extraction | 6 (100.0%) | 0 (0.0%) |
| Installation, Maintenance & Repair | 2 (100.0%) | 0 (0.0%) |
| Total (Category) | 19 (100.0%) | 0 (0.0%) |
| Total (Overall) | 58 (39.2%) | 90 (60.8%) |
Production, Transportation and Moving Occupations
The most common Production, Transportation and Moving occupations in Lostine are Transportation (14 | 9.5%), and Production (4 | 2.7%).
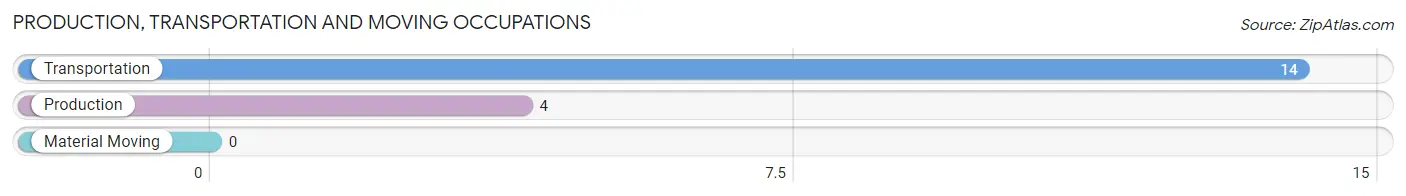
Production, Transportation and Moving Occupations by Sex
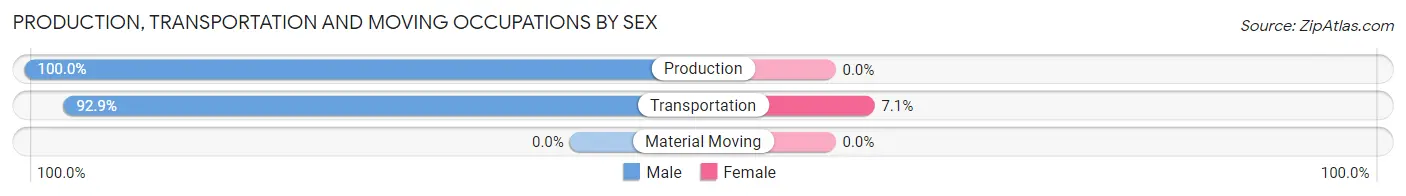
| Occupation | Male | Female |
| Production | 4 (100.0%) | 0 (0.0%) |
| Transportation | 13 (92.9%) | 1 (7.1%) |
| Material Moving | 0 (0.0%) | 0 (0.0%) |
| Total (Category) | 17 (94.4%) | 1 (5.6%) |
| Total (Overall) | 58 (39.2%) | 90 (60.8%) |
Employment Industries by Sex in Lostine
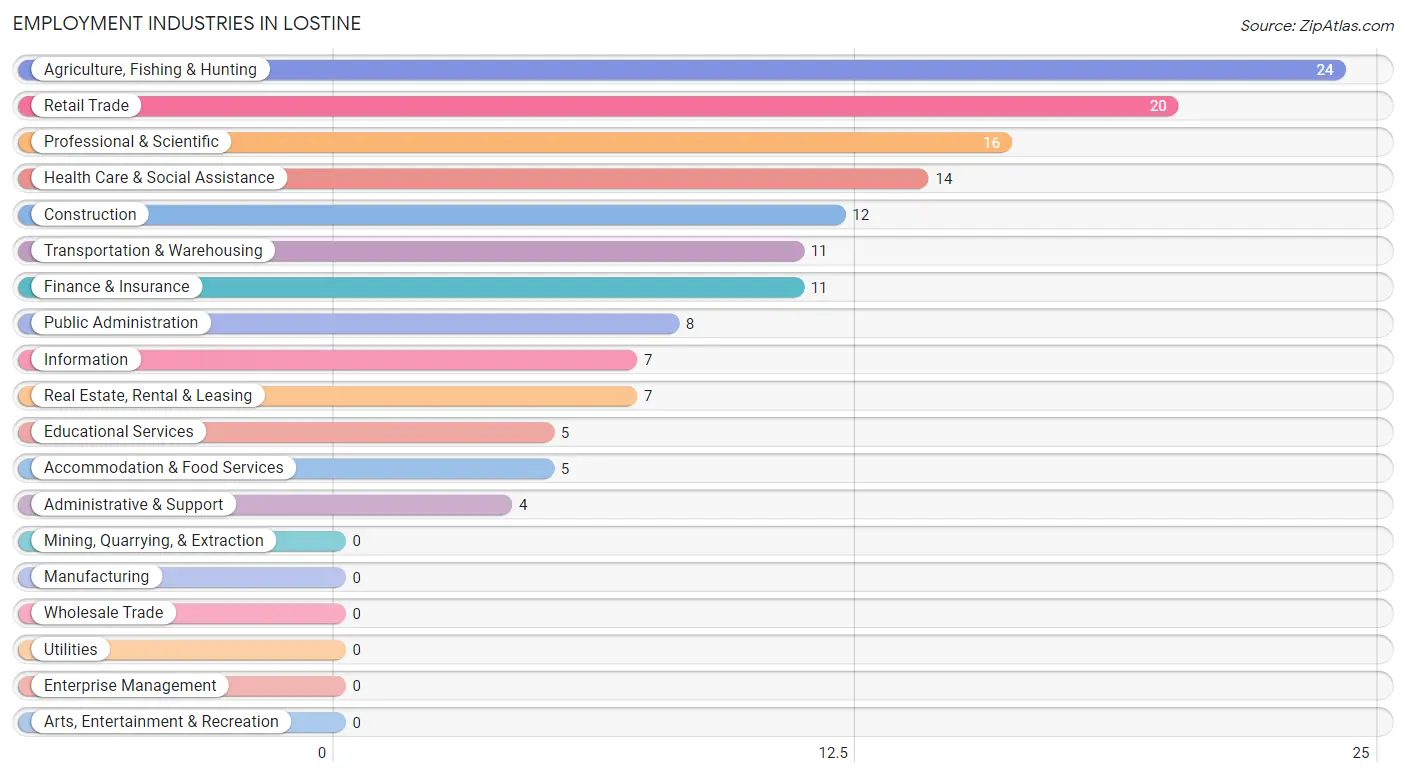
Employment Industries in Lostine
The major employment industries in Lostine include Agriculture, Fishing & Hunting (24 | 16.2%), Retail Trade (20 | 13.5%), Professional & Scientific (16 | 10.8%), Health Care & Social Assistance (14 | 9.5%), and Construction (12 | 8.1%).
Employment Industries by Sex in Lostine
The Lostine industries that see more men than women are Agriculture, Fishing & Hunting (100.0%), Transportation & Warehousing (90.9%), and Construction (75.0%), whereas the industries that tend to have a higher number of women are Information (100.0%), Real Estate, Rental & Leasing (100.0%), and Accommodation & Food Services (100.0%).
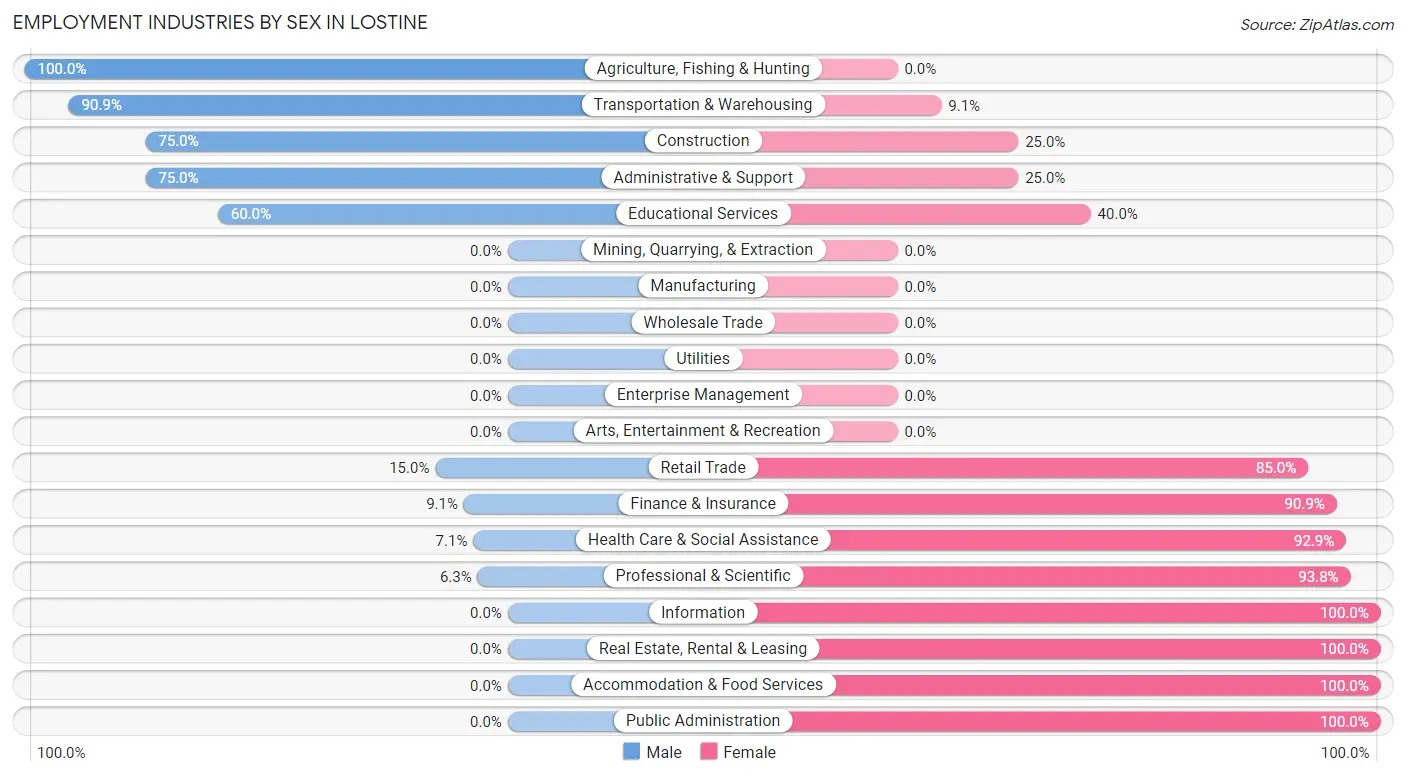
| Industry | Male | Female |
| Agriculture, Fishing & Hunting | 24 (100.0%) | 0 (0.0%) |
| Mining, Quarrying, & Extraction | 0 (0.0%) | 0 (0.0%) |
| Construction | 9 (75.0%) | 3 (25.0%) |
| Manufacturing | 0 (0.0%) | 0 (0.0%) |
| Wholesale Trade | 0 (0.0%) | 0 (0.0%) |
| Retail Trade | 3 (15.0%) | 17 (85.0%) |
| Transportation & Warehousing | 10 (90.9%) | 1 (9.1%) |
| Utilities | 0 (0.0%) | 0 (0.0%) |
| Information | 0 (0.0%) | 7 (100.0%) |
| Finance & Insurance | 1 (9.1%) | 10 (90.9%) |
| Real Estate, Rental & Leasing | 0 (0.0%) | 7 (100.0%) |
| Professional & Scientific | 1 (6.2%) | 15 (93.8%) |
| Enterprise Management | 0 (0.0%) | 0 (0.0%) |
| Administrative & Support | 3 (75.0%) | 1 (25.0%) |
| Educational Services | 3 (60.0%) | 2 (40.0%) |
| Health Care & Social Assistance | 1 (7.1%) | 13 (92.9%) |
| Arts, Entertainment & Recreation | 0 (0.0%) | 0 (0.0%) |
| Accommodation & Food Services | 0 (0.0%) | 5 (100.0%) |
| Public Administration | 0 (0.0%) | 8 (100.0%) |
| Total | 58 (39.2%) | 90 (60.8%) |
Education in Lostine
School Enrollment in Lostine
The most common levels of schooling among the 61 students in Lostine are elementary school (25 | 41.0%), high school (18 | 29.5%), and middle school (15 | 24.6%).
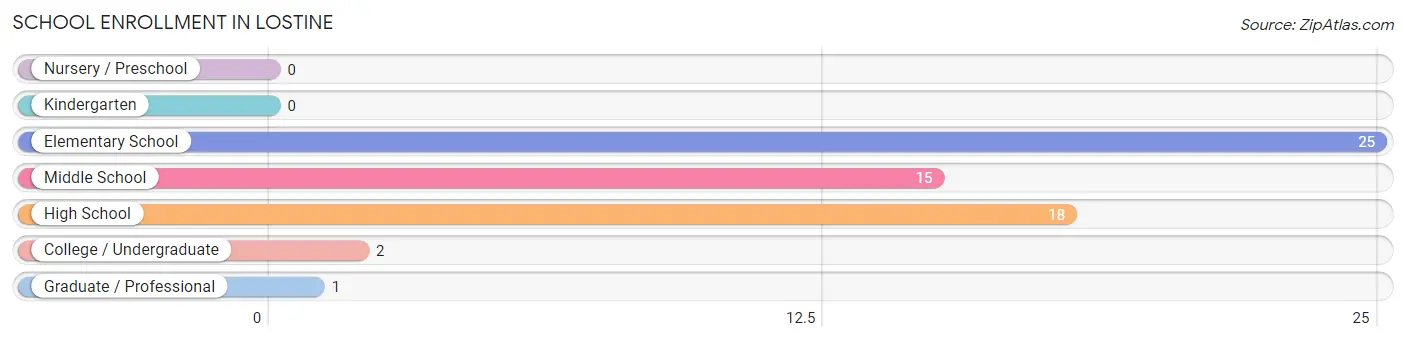
| School Level | # Students | % Students |
| Nursery / Preschool | 0 | 0.0% |
| Kindergarten | 0 | 0.0% |
| Elementary School | 25 | 41.0% |
| Middle School | 15 | 24.6% |
| High School | 18 | 29.5% |
| College / Undergraduate | 2 | 3.3% |
| Graduate / Professional | 1 | 1.6% |
| Total | 61 | 100.0% |
School Enrollment by Age by Funding Source in Lostine
Out of a total of 61 students who are enrolled in schools in Lostine, 6 (9.8%) attend a private institution, while the remaining 55 (90.2%) are enrolled in public schools. The age group of 35 years and over has the highest likelihood of being enrolled in private schools, with 1 (33.3% in the age bracket) enrolled. Conversely, the age group of 10 to 14 year olds has the lowest likelihood of being enrolled in a private school, with 27 (100.0% in the age bracket) attending a public institution.
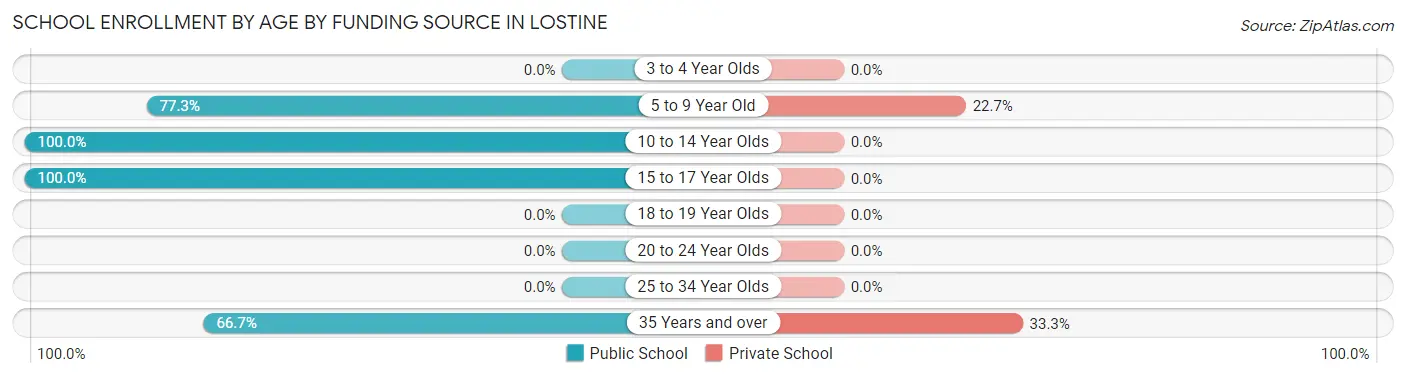
| Age Bracket | Public School | Private School |
| 3 to 4 Year Olds | 0 (0.0%) | 0 (0.0%) |
| 5 to 9 Year Old | 17 (77.3%) | 5 (22.7%) |
| 10 to 14 Year Olds | 27 (100.0%) | 0 (0.0%) |
| 15 to 17 Year Olds | 9 (100.0%) | 0 (0.0%) |
| 18 to 19 Year Olds | 0 (0.0%) | 0 (0.0%) |
| 20 to 24 Year Olds | 0 (0.0%) | 0 (0.0%) |
| 25 to 34 Year Olds | 0 (0.0%) | 0 (0.0%) |
| 35 Years and over | 2 (66.7%) | 1 (33.3%) |
| Total | 55 (90.2%) | 6 (9.8%) |
Educational Attainment by Field of Study in Lostine
Education (5 | 22.7%), literature & languages (5 | 22.7%), visual & performing arts (3 | 13.6%), social sciences (2 | 9.1%), and business (2 | 9.1%) are the most common fields of study among 22 individuals in Lostine who have obtained a bachelor's degree or higher.
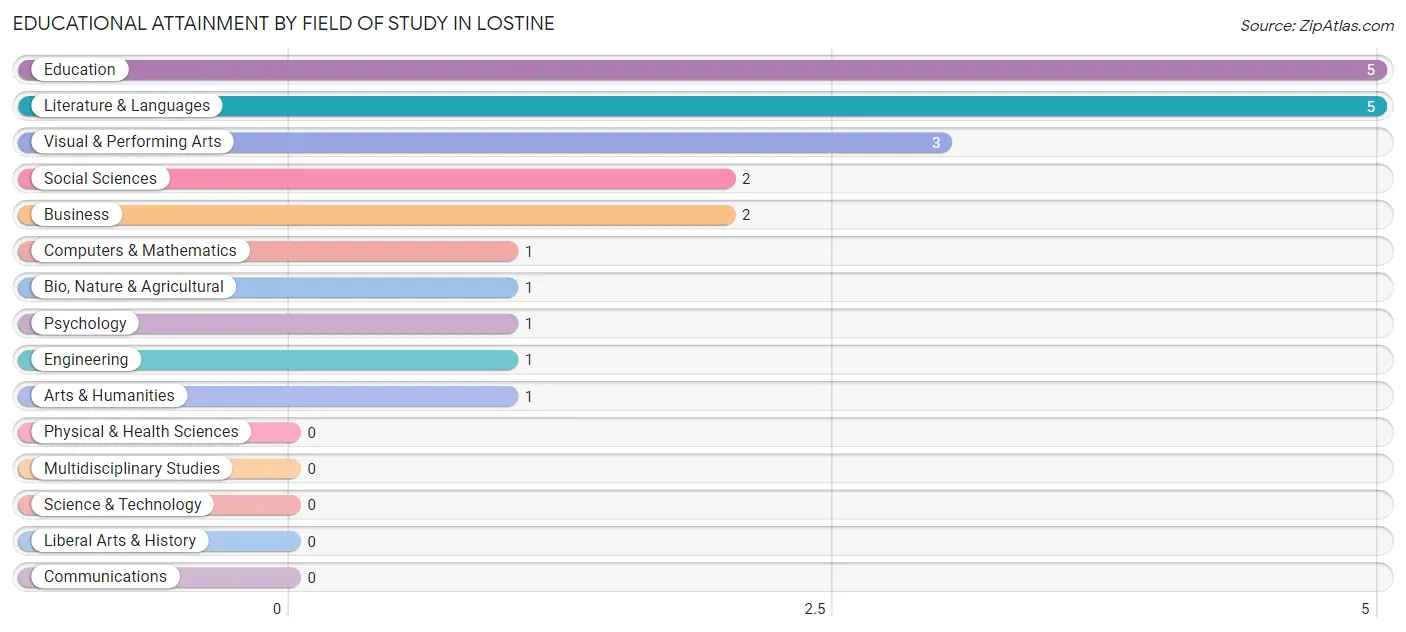
| Field of Study | # Graduates | % Graduates |
| Computers & Mathematics | 1 | 4.5% |
| Bio, Nature & Agricultural | 1 | 4.5% |
| Physical & Health Sciences | 0 | 0.0% |
| Psychology | 1 | 4.5% |
| Social Sciences | 2 | 9.1% |
| Engineering | 1 | 4.5% |
| Multidisciplinary Studies | 0 | 0.0% |
| Science & Technology | 0 | 0.0% |
| Business | 2 | 9.1% |
| Education | 5 | 22.7% |
| Literature & Languages | 5 | 22.7% |
| Liberal Arts & History | 0 | 0.0% |
| Visual & Performing Arts | 3 | 13.6% |
| Communications | 0 | 0.0% |
| Arts & Humanities | 1 | 4.5% |
| Total | 22 | 100.0% |
Transportation & Commute in Lostine
Vehicle Availability by Sex in Lostine
The most prevalent vehicle ownership categories in Lostine are males with 3 vehicles (30, accounting for 52.6%) and females with 3 vehicles (21, making up 34.1%).
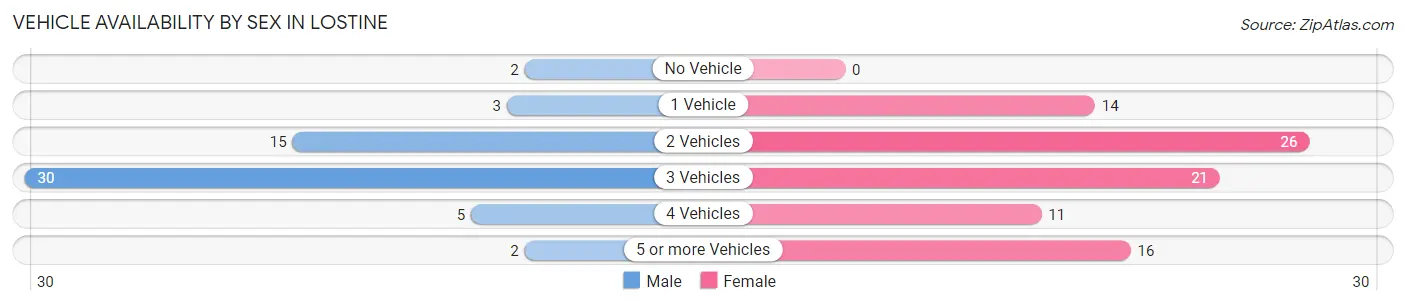
| Vehicles Available | Male | Female |
| No Vehicle | 2 (3.5%) | 0 (0.0%) |
| 1 Vehicle | 3 (5.3%) | 14 (15.9%) |
| 2 Vehicles | 15 (26.3%) | 26 (29.5%) |
| 3 Vehicles | 30 (52.6%) | 21 (23.9%) |
| 4 Vehicles | 5 (8.8%) | 11 (12.5%) |
| 5 or more Vehicles | 2 (3.5%) | 16 (18.2%) |
| Total | 57 (100.0%) | 88 (100.0%) |
Commute Time in Lostine
The most frequently occuring commute durations in Lostine are 15 to 19 minutes (41 commuters, 30.6%), less than 5 minutes (24 commuters, 17.9%), and 60 to 89 minutes (21 commuters, 15.7%).
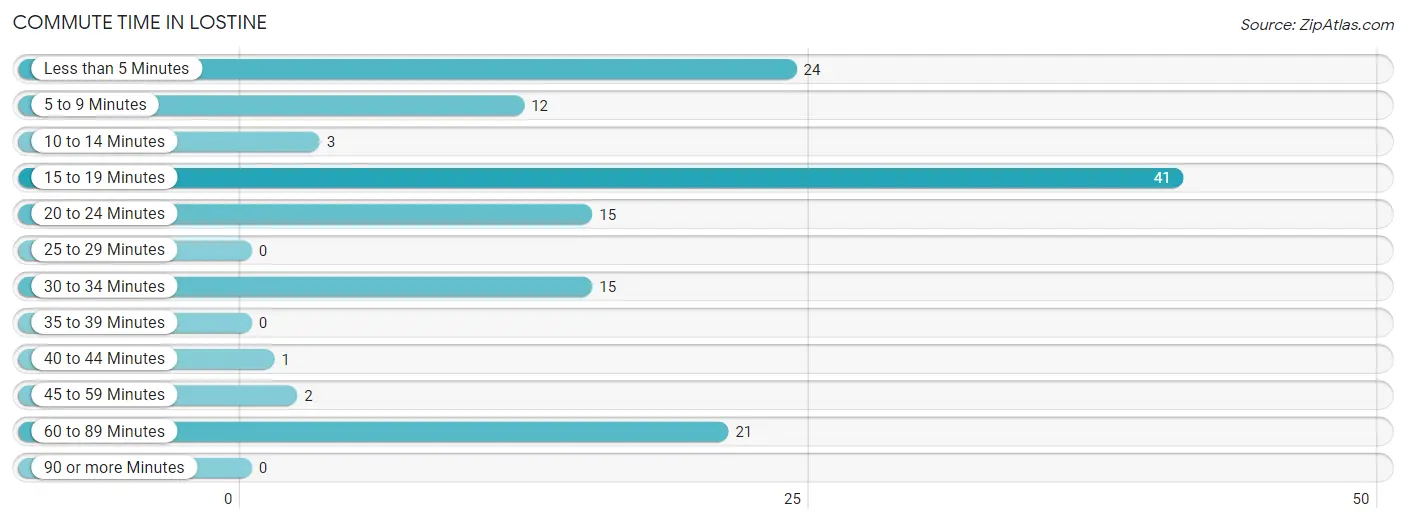
| Commute Time | # Commuters | % Commuters |
| Less than 5 Minutes | 24 | 17.9% |
| 5 to 9 Minutes | 12 | 9.0% |
| 10 to 14 Minutes | 3 | 2.2% |
| 15 to 19 Minutes | 41 | 30.6% |
| 20 to 24 Minutes | 15 | 11.2% |
| 25 to 29 Minutes | 0 | 0.0% |
| 30 to 34 Minutes | 15 | 11.2% |
| 35 to 39 Minutes | 0 | 0.0% |
| 40 to 44 Minutes | 1 | 0.7% |
| 45 to 59 Minutes | 2 | 1.5% |
| 60 to 89 Minutes | 21 | 15.7% |
| 90 or more Minutes | 0 | 0.0% |
Commute Time by Sex in Lostine
The most common commute times in Lostine are 30 to 34 minutes (11 commuters, 23.4%) for males and 15 to 19 minutes (33 commuters, 37.9%) for females.
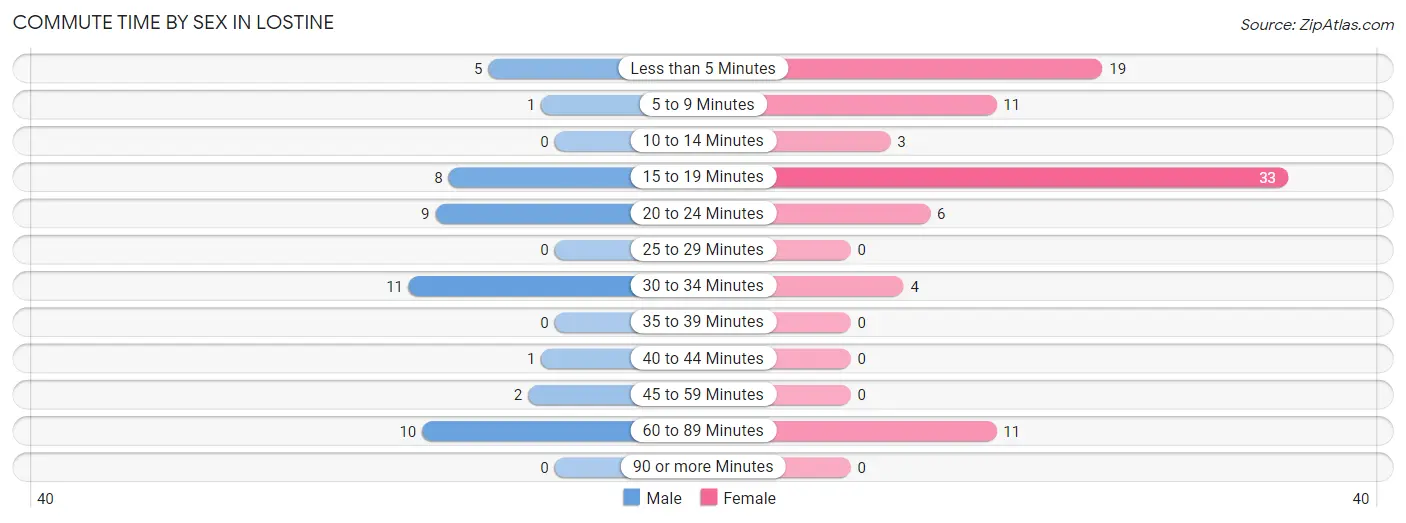
| Commute Time | Male | Female |
| Less than 5 Minutes | 5 (10.6%) | 19 (21.8%) |
| 5 to 9 Minutes | 1 (2.1%) | 11 (12.6%) |
| 10 to 14 Minutes | 0 (0.0%) | 3 (3.5%) |
| 15 to 19 Minutes | 8 (17.0%) | 33 (37.9%) |
| 20 to 24 Minutes | 9 (19.2%) | 6 (6.9%) |
| 25 to 29 Minutes | 0 (0.0%) | 0 (0.0%) |
| 30 to 34 Minutes | 11 (23.4%) | 4 (4.6%) |
| 35 to 39 Minutes | 0 (0.0%) | 0 (0.0%) |
| 40 to 44 Minutes | 1 (2.1%) | 0 (0.0%) |
| 45 to 59 Minutes | 2 (4.3%) | 0 (0.0%) |
| 60 to 89 Minutes | 10 (21.3%) | 11 (12.6%) |
| 90 or more Minutes | 0 (0.0%) | 0 (0.0%) |
Time of Departure to Work by Sex in Lostine
The most frequent times of departure to work in Lostine are 7:00 AM to 7:29 AM (20, 42.5%) for males and 7:30 AM to 7:59 AM (19, 21.8%) for females.
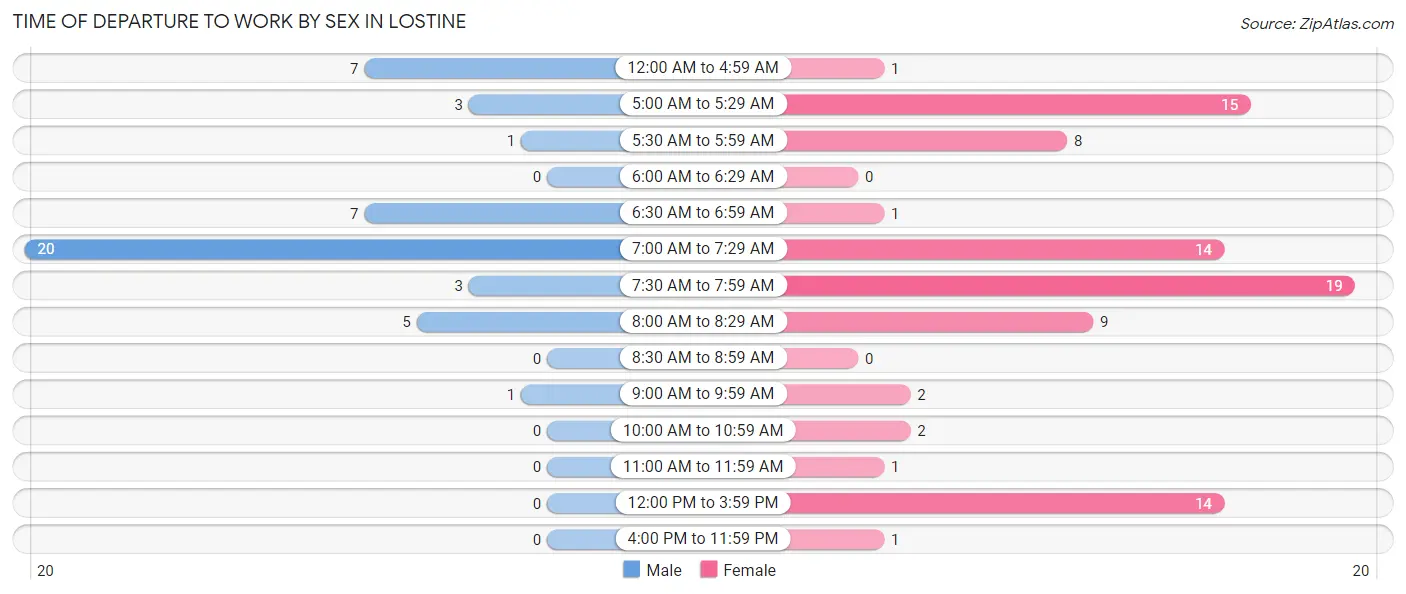
| Time of Departure | Male | Female |
| 12:00 AM to 4:59 AM | 7 (14.9%) | 1 (1.1%) |
| 5:00 AM to 5:29 AM | 3 (6.4%) | 15 (17.2%) |
| 5:30 AM to 5:59 AM | 1 (2.1%) | 8 (9.2%) |
| 6:00 AM to 6:29 AM | 0 (0.0%) | 0 (0.0%) |
| 6:30 AM to 6:59 AM | 7 (14.9%) | 1 (1.1%) |
| 7:00 AM to 7:29 AM | 20 (42.5%) | 14 (16.1%) |
| 7:30 AM to 7:59 AM | 3 (6.4%) | 19 (21.8%) |
| 8:00 AM to 8:29 AM | 5 (10.6%) | 9 (10.3%) |
| 8:30 AM to 8:59 AM | 0 (0.0%) | 0 (0.0%) |
| 9:00 AM to 9:59 AM | 1 (2.1%) | 2 (2.3%) |
| 10:00 AM to 10:59 AM | 0 (0.0%) | 2 (2.3%) |
| 11:00 AM to 11:59 AM | 0 (0.0%) | 1 (1.1%) |
| 12:00 PM to 3:59 PM | 0 (0.0%) | 14 (16.1%) |
| 4:00 PM to 11:59 PM | 0 (0.0%) | 1 (1.1%) |
| Total | 47 (100.0%) | 87 (100.0%) |
Housing Occupancy in Lostine
Occupancy by Ownership in Lostine
Of the total 132 dwellings in Lostine, owner-occupied units account for 94 (71.2%), while renter-occupied units make up 38 (28.8%).
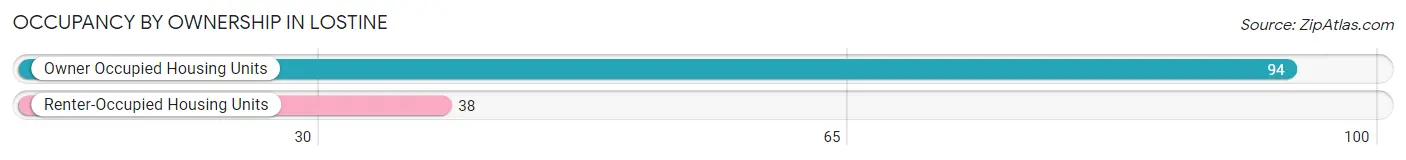
| Occupancy | # Housing Units | % Housing Units |
| Owner Occupied Housing Units | 94 | 71.2% |
| Renter-Occupied Housing Units | 38 | 28.8% |
| Total Occupied Housing Units | 132 | 100.0% |
Occupancy by Household Size in Lostine
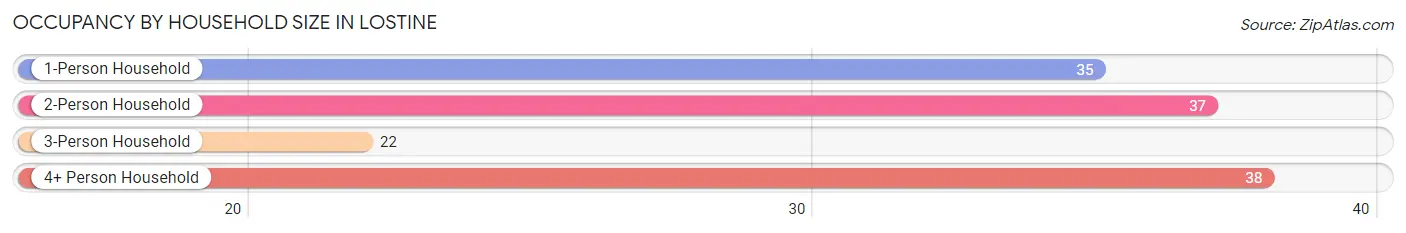
| Household Size | # Housing Units | % Housing Units |
| 1-Person Household | 35 | 26.5% |
| 2-Person Household | 37 | 28.0% |
| 3-Person Household | 22 | 16.7% |
| 4+ Person Household | 38 | 28.8% |
| Total Housing Units | 132 | 100.0% |
Occupancy by Ownership by Household Size in Lostine
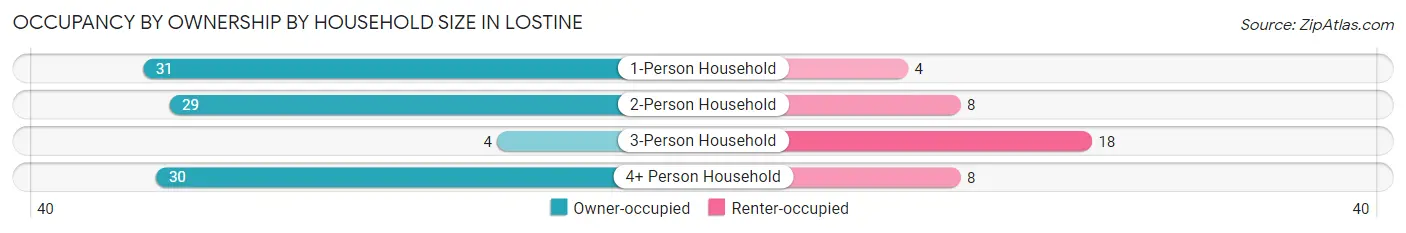
| Household Size | Owner-occupied | Renter-occupied |
| 1-Person Household | 31 (88.6%) | 4 (11.4%) |
| 2-Person Household | 29 (78.4%) | 8 (21.6%) |
| 3-Person Household | 4 (18.2%) | 18 (81.8%) |
| 4+ Person Household | 30 (78.9%) | 8 (21.0%) |
| Total Housing Units | 94 (71.2%) | 38 (28.8%) |
Occupancy by Educational Attainment in Lostine
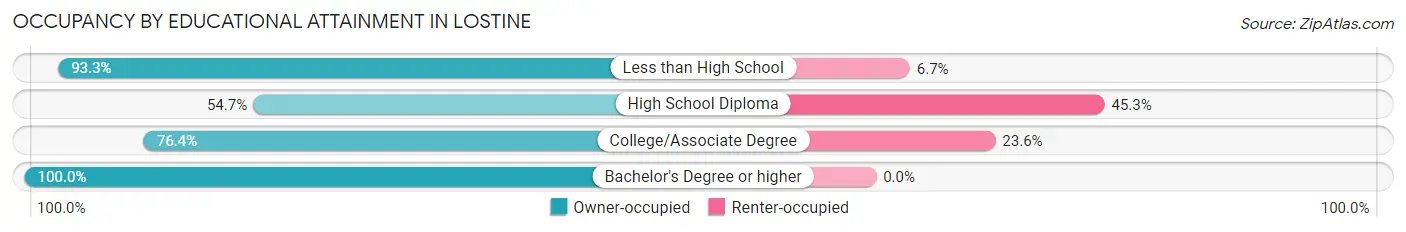
| Household Size | Owner-occupied | Renter-occupied |
| Less than High School | 14 (93.3%) | 1 (6.7%) |
| High School Diploma | 29 (54.7%) | 24 (45.3%) |
| College/Associate Degree | 42 (76.4%) | 13 (23.6%) |
| Bachelor's Degree or higher | 9 (100.0%) | 0 (0.0%) |
Occupancy by Age of Householder in Lostine
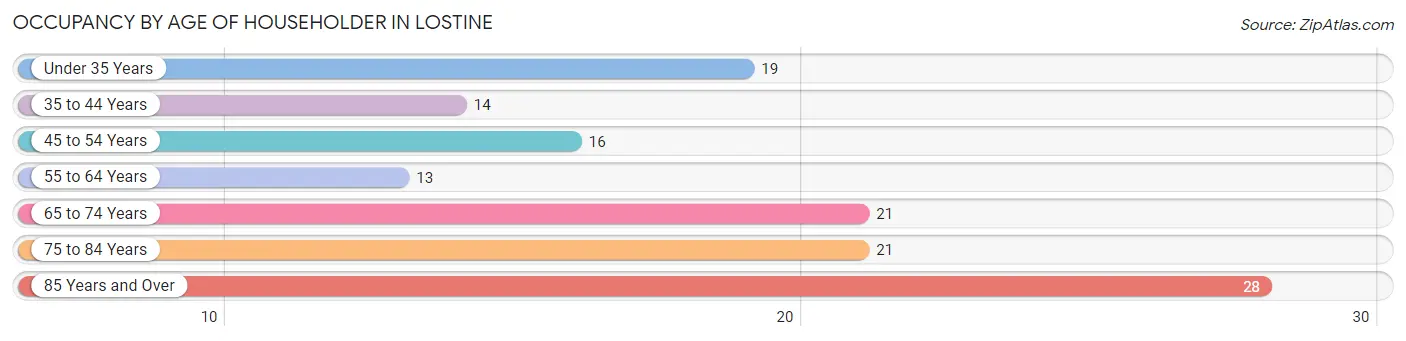
| Age Bracket | # Households | % Households |
| Under 35 Years | 19 | 14.4% |
| 35 to 44 Years | 14 | 10.6% |
| 45 to 54 Years | 16 | 12.1% |
| 55 to 64 Years | 13 | 9.9% |
| 65 to 74 Years | 21 | 15.9% |
| 75 to 84 Years | 21 | 15.9% |
| 85 Years and Over | 28 | 21.2% |
| Total | 132 | 100.0% |
Housing Finances in Lostine
Median Income by Occupancy in Lostine
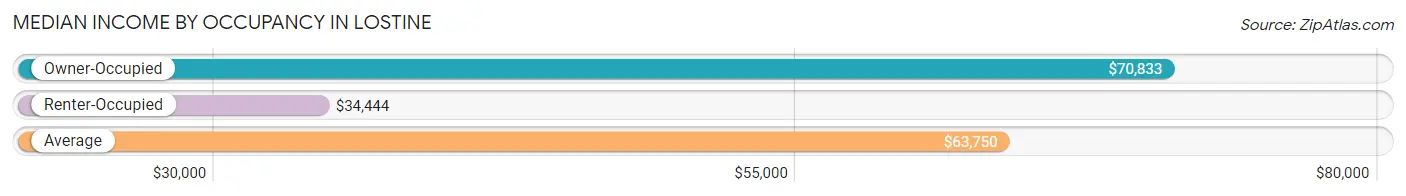
| Occupancy Type | # Households | Median Income |
| Owner-Occupied | 94 (71.2%) | $70,833 |
| Renter-Occupied | 38 (28.8%) | $34,444 |
| Average | 132 (100.0%) | $63,750 |
Occupancy by Householder Income Bracket in Lostine
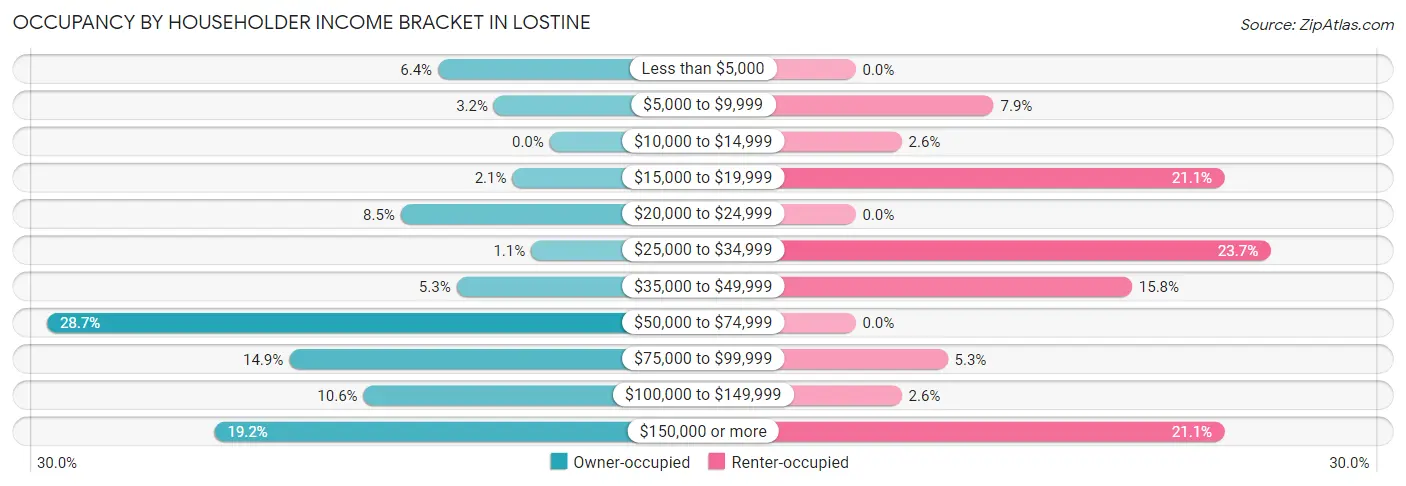
| Income Bracket | Owner-occupied | Renter-occupied |
| Less than $5,000 | 6 (6.4%) | 0 (0.0%) |
| $5,000 to $9,999 | 3 (3.2%) | 3 (7.9%) |
| $10,000 to $14,999 | 0 (0.0%) | 1 (2.6%) |
| $15,000 to $19,999 | 2 (2.1%) | 8 (21.0%) |
| $20,000 to $24,999 | 8 (8.5%) | 0 (0.0%) |
| $25,000 to $34,999 | 1 (1.1%) | 9 (23.7%) |
| $35,000 to $49,999 | 5 (5.3%) | 6 (15.8%) |
| $50,000 to $74,999 | 27 (28.7%) | 0 (0.0%) |
| $75,000 to $99,999 | 14 (14.9%) | 2 (5.3%) |
| $100,000 to $149,999 | 10 (10.6%) | 1 (2.6%) |
| $150,000 or more | 18 (19.2%) | 8 (21.0%) |
| Total | 94 (100.0%) | 38 (100.0%) |
Monthly Housing Cost Tiers in Lostine
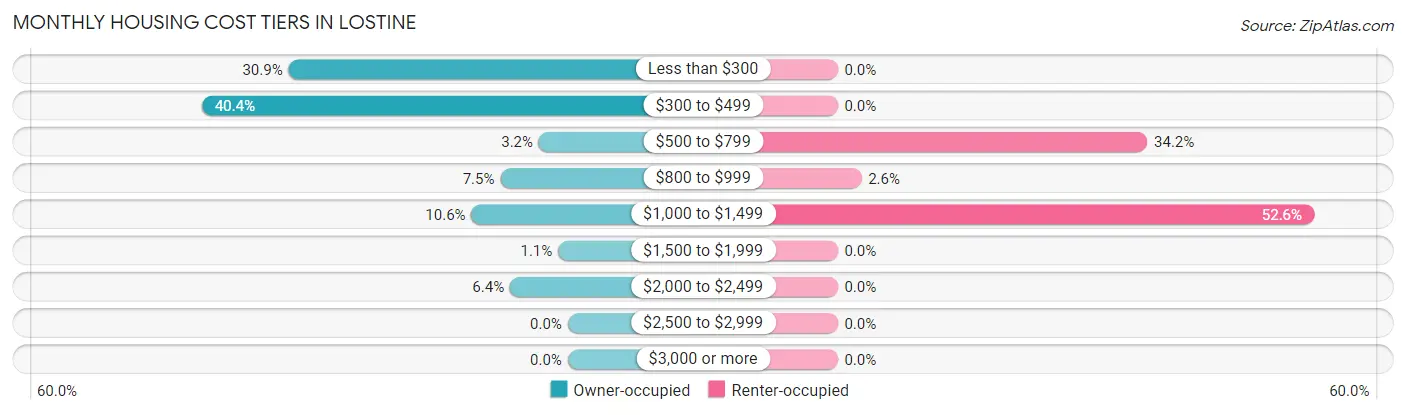
| Monthly Cost | Owner-occupied | Renter-occupied |
| Less than $300 | 29 (30.8%) | 0 (0.0%) |
| $300 to $499 | 38 (40.4%) | 0 (0.0%) |
| $500 to $799 | 3 (3.2%) | 13 (34.2%) |
| $800 to $999 | 7 (7.4%) | 1 (2.6%) |
| $1,000 to $1,499 | 10 (10.6%) | 20 (52.6%) |
| $1,500 to $1,999 | 1 (1.1%) | 0 (0.0%) |
| $2,000 to $2,499 | 6 (6.4%) | 0 (0.0%) |
| $2,500 to $2,999 | 0 (0.0%) | 0 (0.0%) |
| $3,000 or more | 0 (0.0%) | 0 (0.0%) |
| Total | 94 (100.0%) | 38 (100.0%) |
Physical Housing Characteristics in Lostine
Housing Structures in Lostine
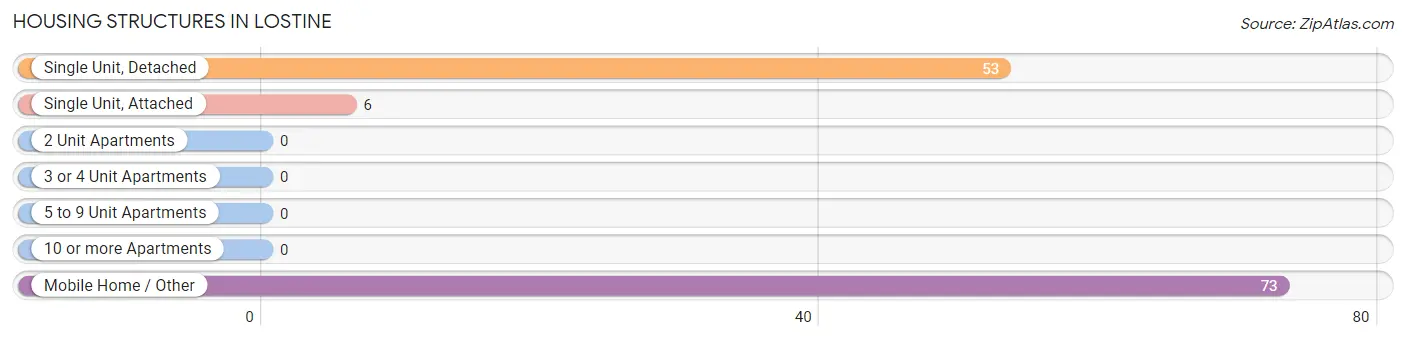
| Structure Type | # Housing Units | % Housing Units |
| Single Unit, Detached | 53 | 40.2% |
| Single Unit, Attached | 6 | 4.5% |
| 2 Unit Apartments | 0 | 0.0% |
| 3 or 4 Unit Apartments | 0 | 0.0% |
| 5 to 9 Unit Apartments | 0 | 0.0% |
| 10 or more Apartments | 0 | 0.0% |
| Mobile Home / Other | 73 | 55.3% |
| Total | 132 | 100.0% |
Housing Structures by Occupancy in Lostine
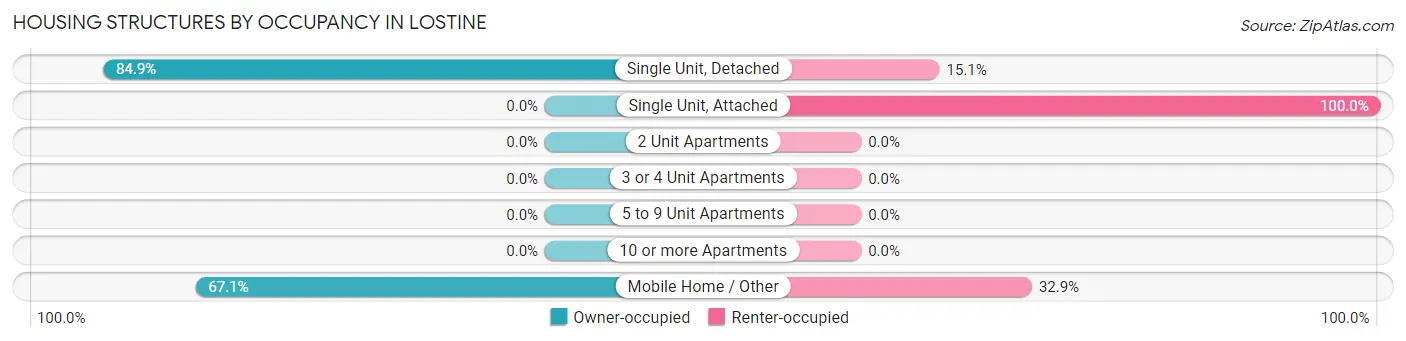
| Structure Type | Owner-occupied | Renter-occupied |
| Single Unit, Detached | 45 (84.9%) | 8 (15.1%) |
| Single Unit, Attached | 0 (0.0%) | 6 (100.0%) |
| 2 Unit Apartments | 0 (0.0%) | 0 (0.0%) |
| 3 or 4 Unit Apartments | 0 (0.0%) | 0 (0.0%) |
| 5 to 9 Unit Apartments | 0 (0.0%) | 0 (0.0%) |
| 10 or more Apartments | 0 (0.0%) | 0 (0.0%) |
| Mobile Home / Other | 49 (67.1%) | 24 (32.9%) |
| Total | 94 (71.2%) | 38 (28.8%) |
Housing Structures by Number of Rooms in Lostine
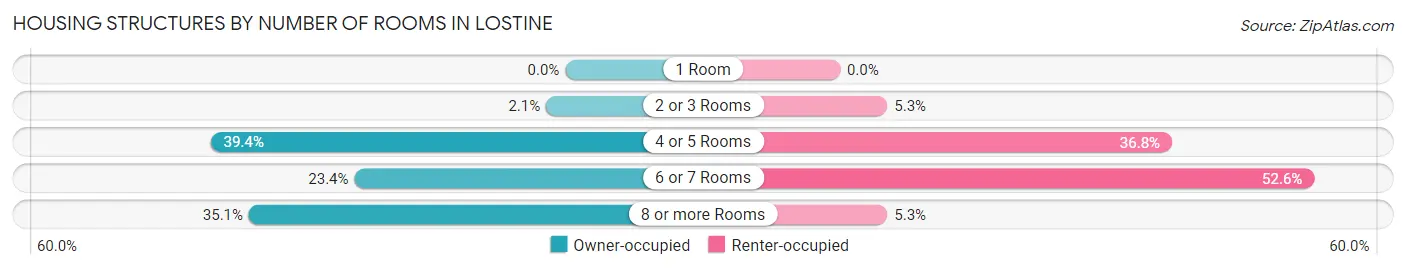
| Number of Rooms | Owner-occupied | Renter-occupied |
| 1 Room | 0 (0.0%) | 0 (0.0%) |
| 2 or 3 Rooms | 2 (2.1%) | 2 (5.3%) |
| 4 or 5 Rooms | 37 (39.4%) | 14 (36.8%) |
| 6 or 7 Rooms | 22 (23.4%) | 20 (52.6%) |
| 8 or more Rooms | 33 (35.1%) | 2 (5.3%) |
| Total | 94 (100.0%) | 38 (100.0%) |
Housing Structure by Heating Type in Lostine
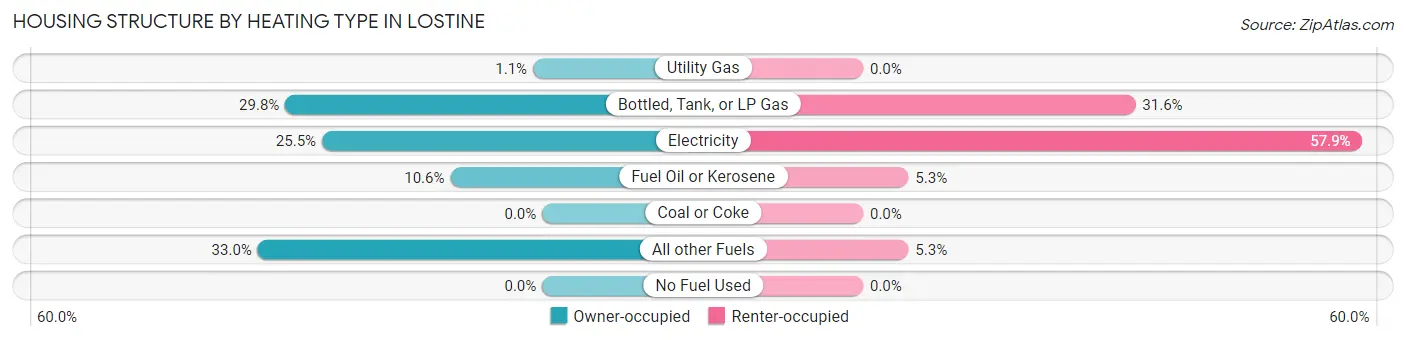
| Heating Type | Owner-occupied | Renter-occupied |
| Utility Gas | 1 (1.1%) | 0 (0.0%) |
| Bottled, Tank, or LP Gas | 28 (29.8%) | 12 (31.6%) |
| Electricity | 24 (25.5%) | 22 (57.9%) |
| Fuel Oil or Kerosene | 10 (10.6%) | 2 (5.3%) |
| Coal or Coke | 0 (0.0%) | 0 (0.0%) |
| All other Fuels | 31 (33.0%) | 2 (5.3%) |
| No Fuel Used | 0 (0.0%) | 0 (0.0%) |
| Total | 94 (100.0%) | 38 (100.0%) |
Household Vehicle Usage in Lostine
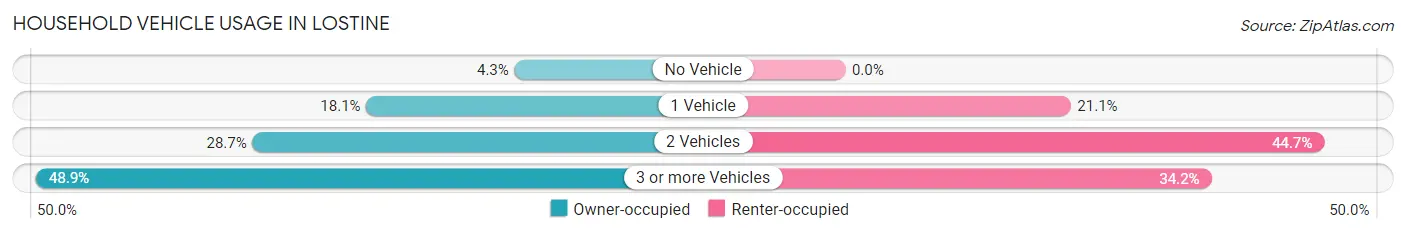
| Vehicles per Household | Owner-occupied | Renter-occupied |
| No Vehicle | 4 (4.3%) | 0 (0.0%) |
| 1 Vehicle | 17 (18.1%) | 8 (21.0%) |
| 2 Vehicles | 27 (28.7%) | 17 (44.7%) |
| 3 or more Vehicles | 46 (48.9%) | 13 (34.2%) |
| Total | 94 (100.0%) | 38 (100.0%) |
Real Estate & Mortgages in Lostine
Real Estate and Mortgage Overview in Lostine
| Characteristic | Without Mortgage | With Mortgage |
| Housing Units | 74 | 20 |
| Median Property Value | $155,000 | $285,700 |
| Median Household Income | $68,333 | $3 |
| Monthly Housing Costs | $340 | $0 |
| Real Estate Taxes | $1,125 | $0 |
Property Value by Mortgage Status in Lostine
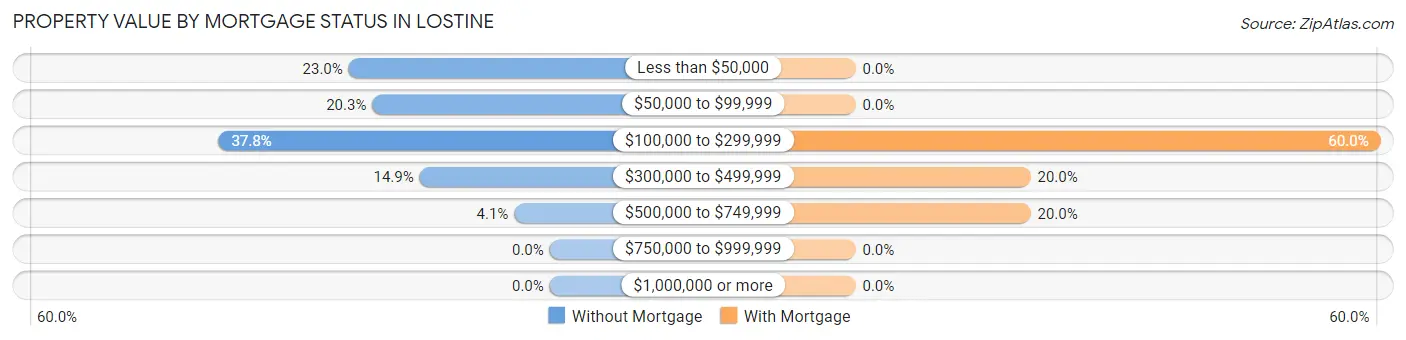
| Property Value | Without Mortgage | With Mortgage |
| Less than $50,000 | 17 (23.0%) | 0 (0.0%) |
| $50,000 to $99,999 | 15 (20.3%) | 0 (0.0%) |
| $100,000 to $299,999 | 28 (37.8%) | 12 (60.0%) |
| $300,000 to $499,999 | 11 (14.9%) | 4 (20.0%) |
| $500,000 to $749,999 | 3 (4.1%) | 4 (20.0%) |
| $750,000 to $999,999 | 0 (0.0%) | 0 (0.0%) |
| $1,000,000 or more | 0 (0.0%) | 0 (0.0%) |
| Total | 74 (100.0%) | 20 (100.0%) |
Household Income by Mortgage Status in Lostine
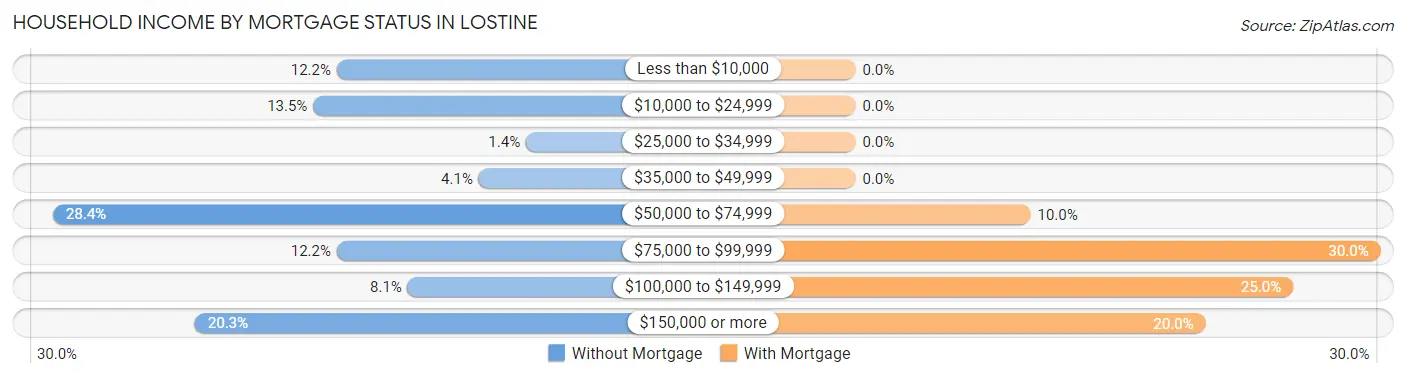
| Household Income | Without Mortgage | With Mortgage |
| Less than $10,000 | 9 (12.2%) | 0 (0.0%) |
| $10,000 to $24,999 | 10 (13.5%) | 0 (0.0%) |
| $25,000 to $34,999 | 1 (1.3%) | 0 (0.0%) |
| $35,000 to $49,999 | 3 (4.1%) | 0 (0.0%) |
| $50,000 to $74,999 | 21 (28.4%) | 2 (10.0%) |
| $75,000 to $99,999 | 9 (12.2%) | 6 (30.0%) |
| $100,000 to $149,999 | 6 (8.1%) | 5 (25.0%) |
| $150,000 or more | 15 (20.3%) | 4 (20.0%) |
| Total | 74 (100.0%) | 20 (100.0%) |
Property Value to Household Income Ratio in Lostine
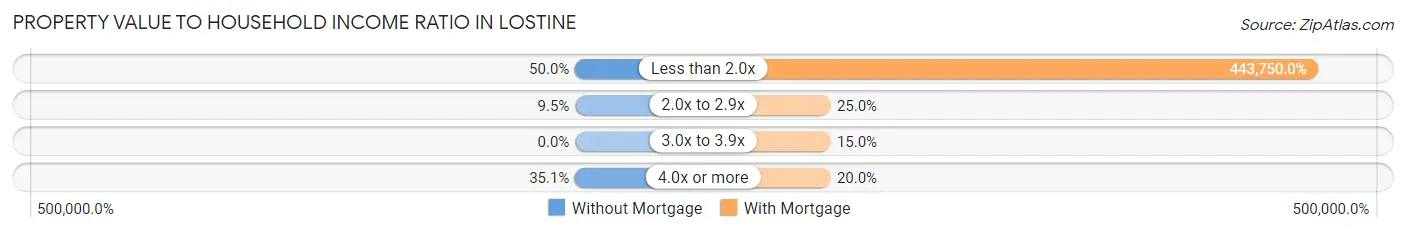
| Value-to-Income Ratio | Without Mortgage | With Mortgage |
| Less than 2.0x | 37 (50.0%) | 88,750 (443,750.0%) |
| 2.0x to 2.9x | 7 (9.5%) | 5 (25.0%) |
| 3.0x to 3.9x | 0 (0.0%) | 3 (15.0%) |
| 4.0x or more | 26 (35.1%) | 4 (20.0%) |
| Total | 74 (100.0%) | 20 (100.0%) |
Real Estate Taxes by Mortgage Status in Lostine
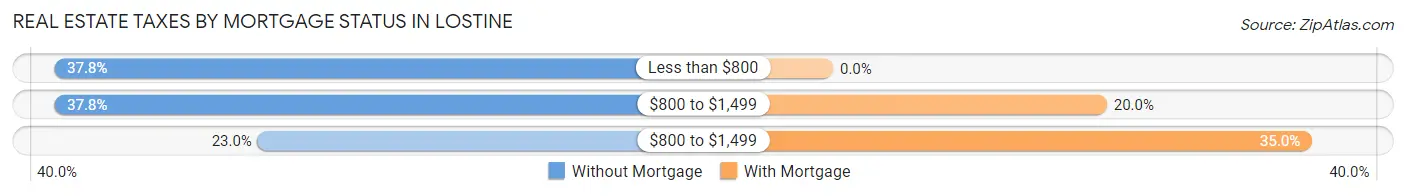
| Property Taxes | Without Mortgage | With Mortgage |
| Less than $800 | 28 (37.8%) | 0 (0.0%) |
| $800 to $1,499 | 28 (37.8%) | 4 (20.0%) |
| $800 to $1,499 | 17 (23.0%) | 7 (35.0%) |
| Total | 74 (100.0%) | 20 (100.0%) |
Health & Disability in Lostine
Health Insurance Coverage by Age in Lostine
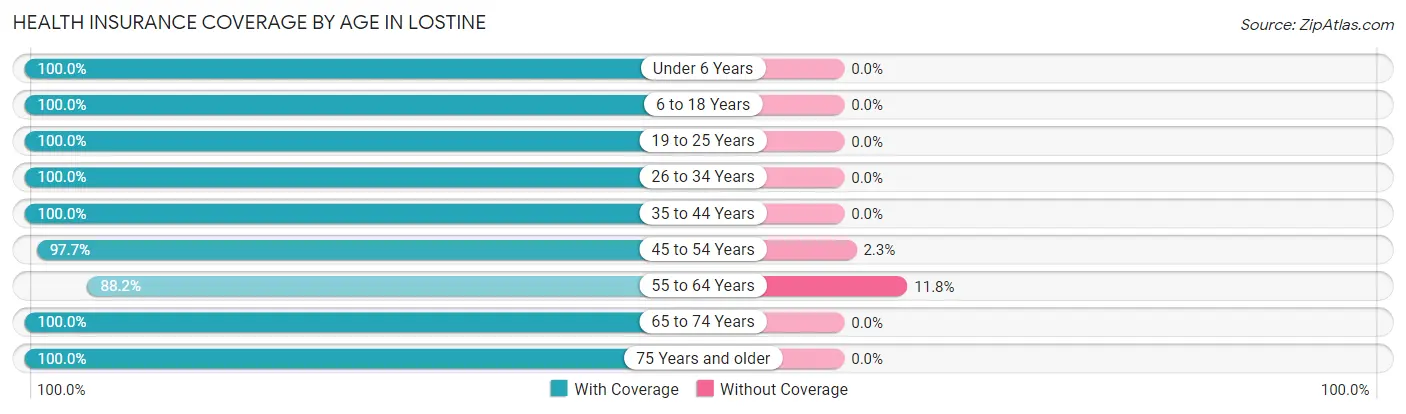
| Age Bracket | With Coverage | Without Coverage |
| Under 6 Years | 40 (100.0%) | 0 (0.0%) |
| 6 to 18 Years | 63 (100.0%) | 0 (0.0%) |
| 19 to 25 Years | 22 (100.0%) | 0 (0.0%) |
| 26 to 34 Years | 44 (100.0%) | 0 (0.0%) |
| 35 to 44 Years | 25 (100.0%) | 0 (0.0%) |
| 45 to 54 Years | 43 (97.7%) | 1 (2.3%) |
| 55 to 64 Years | 30 (88.2%) | 4 (11.8%) |
| 65 to 74 Years | 31 (100.0%) | 0 (0.0%) |
| 75 Years and older | 78 (100.0%) | 0 (0.0%) |
| Total | 376 (98.7%) | 5 (1.3%) |
Health Insurance Coverage by Citizenship Status in Lostine
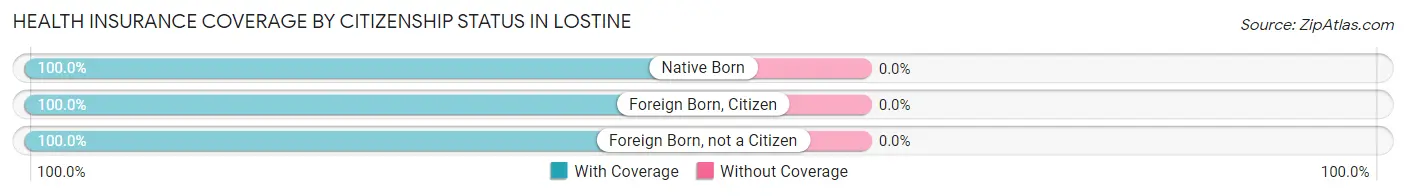
| Citizenship Status | With Coverage | Without Coverage |
| Native Born | 40 (100.0%) | 0 (0.0%) |
| Foreign Born, Citizen | 63 (100.0%) | 0 (0.0%) |
| Foreign Born, not a Citizen | 22 (100.0%) | 0 (0.0%) |
Health Insurance Coverage by Household Income in Lostine
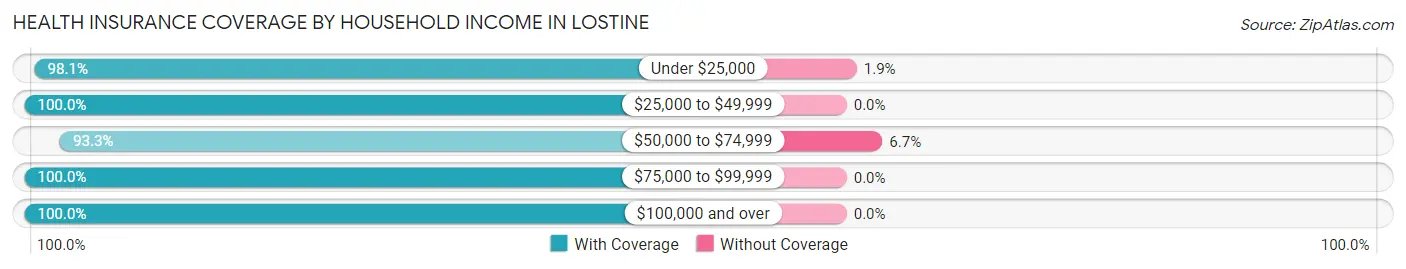
| Household Income | With Coverage | Without Coverage |
| Under $25,000 | 52 (98.1%) | 1 (1.9%) |
| $25,000 to $49,999 | 44 (100.0%) | 0 (0.0%) |
| $50,000 to $74,999 | 56 (93.3%) | 4 (6.7%) |
| $75,000 to $99,999 | 48 (100.0%) | 0 (0.0%) |
| $100,000 and over | 176 (100.0%) | 0 (0.0%) |
Public vs Private Health Insurance Coverage by Age in Lostine
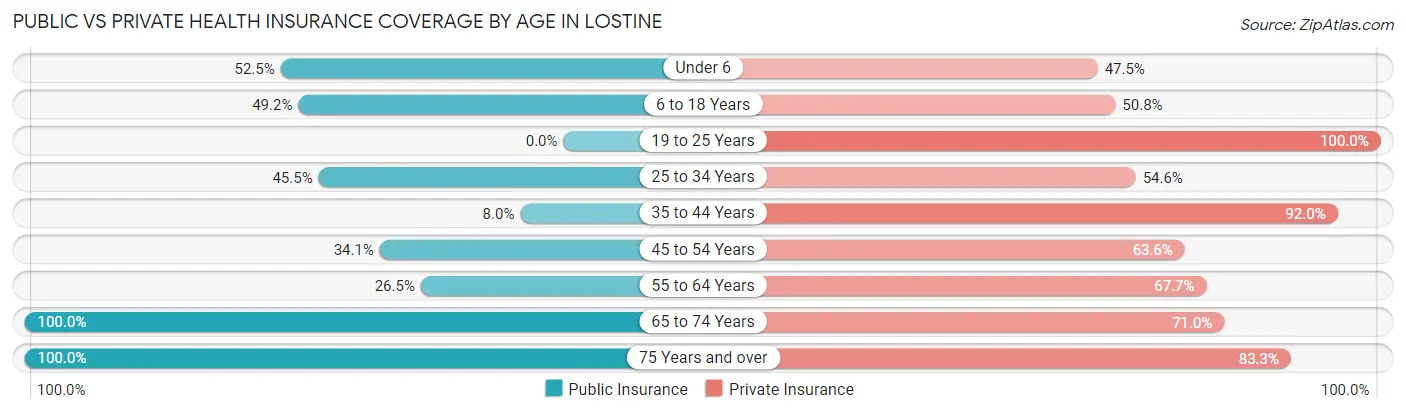
| Age Bracket | Public Insurance | Private Insurance |
| Under 6 | 21 (52.5%) | 19 (47.5%) |
| 6 to 18 Years | 31 (49.2%) | 32 (50.8%) |
| 19 to 25 Years | 0 (0.0%) | 22 (100.0%) |
| 25 to 34 Years | 20 (45.5%) | 24 (54.5%) |
| 35 to 44 Years | 2 (8.0%) | 23 (92.0%) |
| 45 to 54 Years | 15 (34.1%) | 28 (63.6%) |
| 55 to 64 Years | 9 (26.5%) | 23 (67.6%) |
| 65 to 74 Years | 31 (100.0%) | 22 (71.0%) |
| 75 Years and over | 78 (100.0%) | 65 (83.3%) |
| Total | 207 (54.3%) | 258 (67.7%) |
Disability Status by Sex by Age in Lostine
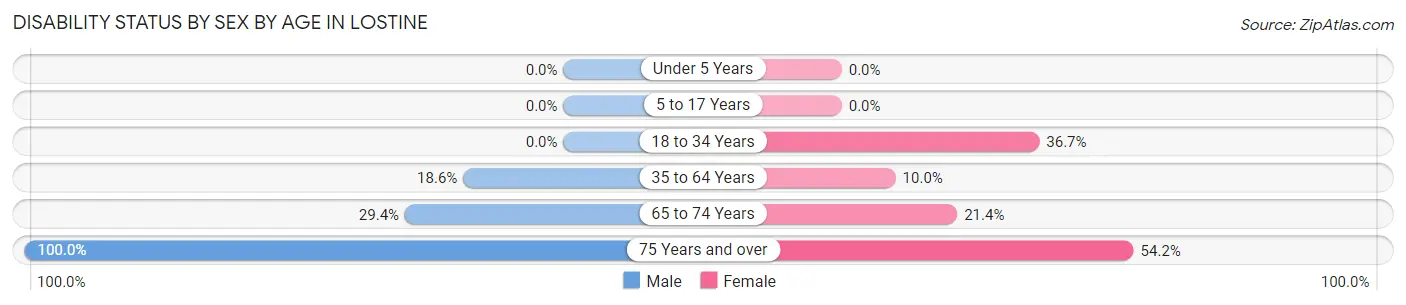
| Age Bracket | Male | Female |
| Under 5 Years | 0 (0.0%) | 0 (0.0%) |
| 5 to 17 Years | 0 (0.0%) | 0 (0.0%) |
| 18 to 34 Years | 0 (0.0%) | 11 (36.7%) |
| 35 to 64 Years | 8 (18.6%) | 6 (10.0%) |
| 65 to 74 Years | 5 (29.4%) | 3 (21.4%) |
| 75 Years and over | 30 (100.0%) | 26 (54.2%) |
Disability Class by Sex by Age in Lostine
Disability Class: Hearing Difficulty
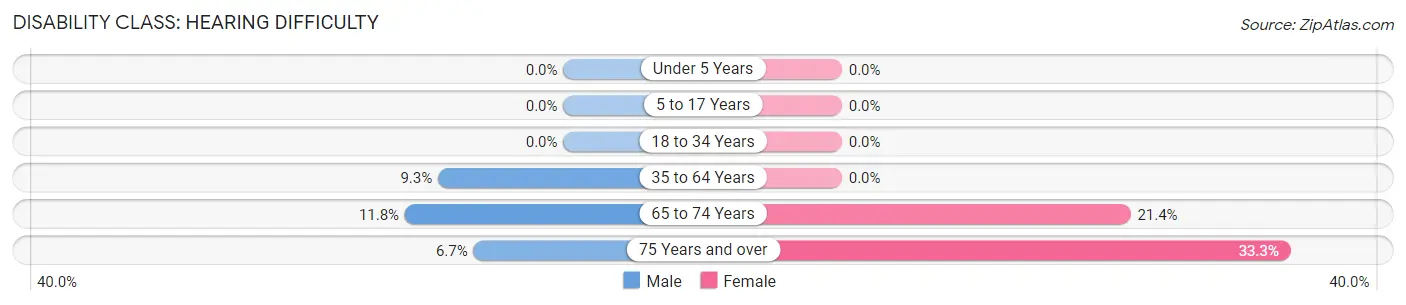
| Age Bracket | Male | Female |
| Under 5 Years | 0 (0.0%) | 0 (0.0%) |
| 5 to 17 Years | 0 (0.0%) | 0 (0.0%) |
| 18 to 34 Years | 0 (0.0%) | 0 (0.0%) |
| 35 to 64 Years | 4 (9.3%) | 0 (0.0%) |
| 65 to 74 Years | 2 (11.8%) | 3 (21.4%) |
| 75 Years and over | 2 (6.7%) | 16 (33.3%) |
Disability Class: Vision Difficulty
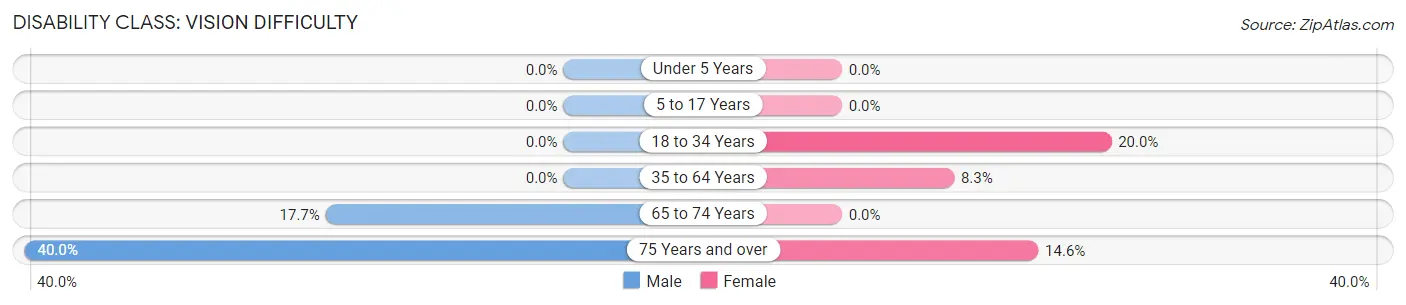
| Age Bracket | Male | Female |
| Under 5 Years | 0 (0.0%) | 0 (0.0%) |
| 5 to 17 Years | 0 (0.0%) | 0 (0.0%) |
| 18 to 34 Years | 0 (0.0%) | 6 (20.0%) |
| 35 to 64 Years | 0 (0.0%) | 5 (8.3%) |
| 65 to 74 Years | 3 (17.6%) | 0 (0.0%) |
| 75 Years and over | 12 (40.0%) | 7 (14.6%) |
Disability Class: Cognitive Difficulty
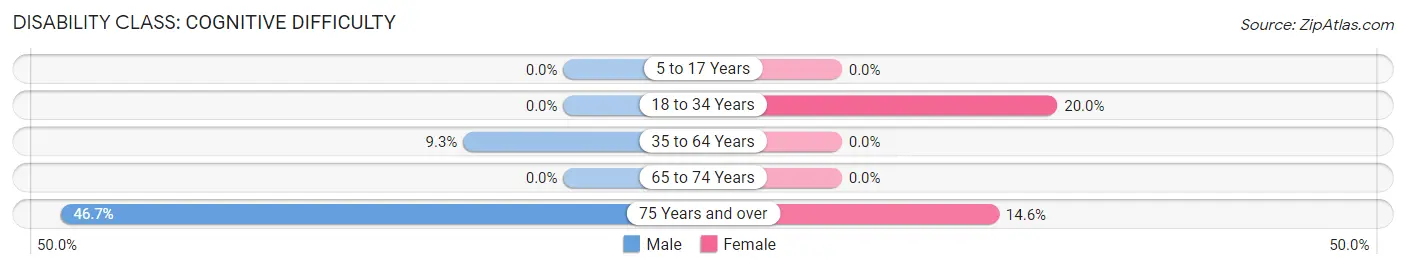
| Age Bracket | Male | Female |
| 5 to 17 Years | 0 (0.0%) | 0 (0.0%) |
| 18 to 34 Years | 0 (0.0%) | 6 (20.0%) |
| 35 to 64 Years | 4 (9.3%) | 0 (0.0%) |
| 65 to 74 Years | 0 (0.0%) | 0 (0.0%) |
| 75 Years and over | 14 (46.7%) | 7 (14.6%) |
Disability Class: Ambulatory Difficulty
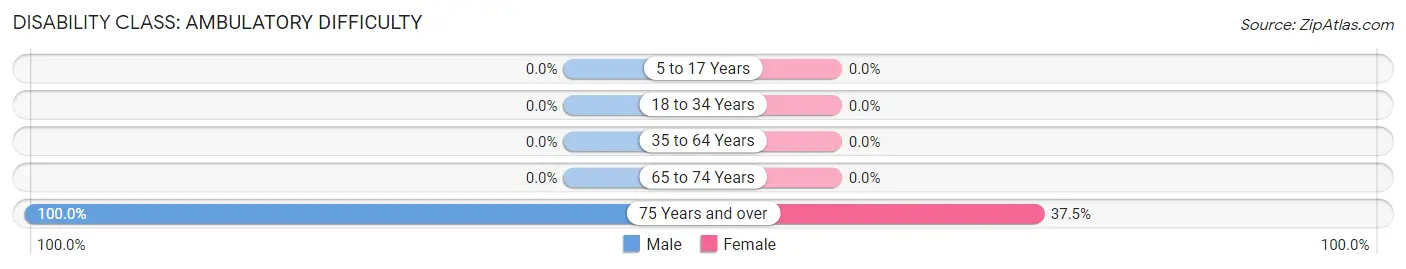
| Age Bracket | Male | Female |
| 5 to 17 Years | 0 (0.0%) | 0 (0.0%) |
| 18 to 34 Years | 0 (0.0%) | 0 (0.0%) |
| 35 to 64 Years | 0 (0.0%) | 0 (0.0%) |
| 65 to 74 Years | 0 (0.0%) | 0 (0.0%) |
| 75 Years and over | 30 (100.0%) | 18 (37.5%) |
Disability Class: Self-Care Difficulty
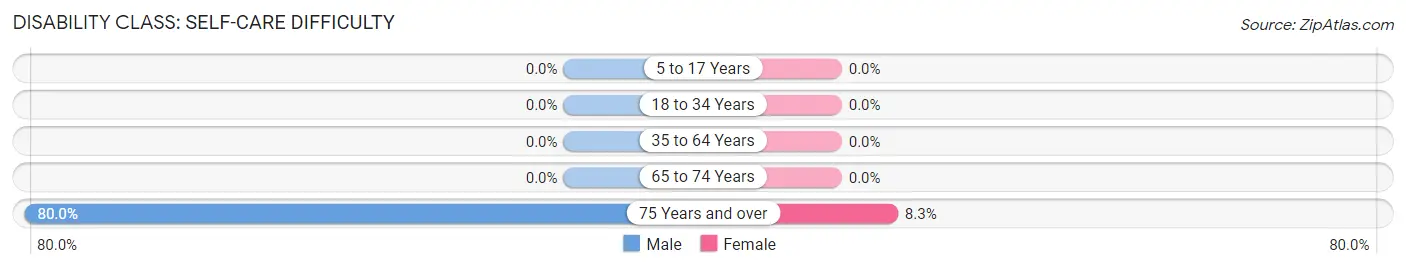
| Age Bracket | Male | Female |
| 5 to 17 Years | 0 (0.0%) | 0 (0.0%) |
| 18 to 34 Years | 0 (0.0%) | 0 (0.0%) |
| 35 to 64 Years | 0 (0.0%) | 0 (0.0%) |
| 65 to 74 Years | 0 (0.0%) | 0 (0.0%) |
| 75 Years and over | 24 (80.0%) | 4 (8.3%) |
Technology Access in Lostine
Computing Device Access in Lostine
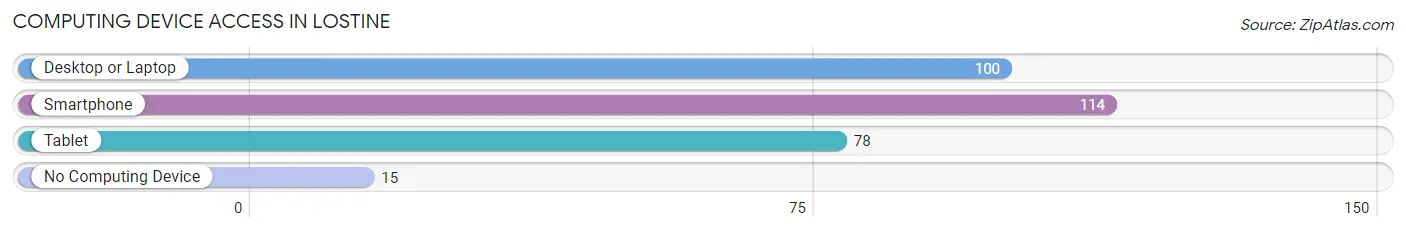
| Device Type | # Households | % Households |
| Desktop or Laptop | 100 | 75.8% |
| Smartphone | 114 | 86.4% |
| Tablet | 78 | 59.1% |
| No Computing Device | 15 | 11.4% |
| Total | 132 | 100.0% |
Internet Access in Lostine
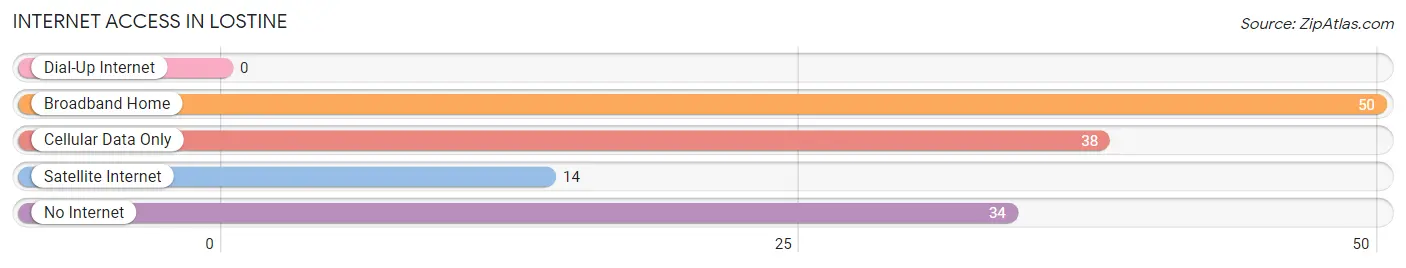
| Internet Type | # Households | % Households |
| Dial-Up Internet | 0 | 0.0% |
| Broadband Home | 50 | 37.9% |
| Cellular Data Only | 38 | 28.8% |
| Satellite Internet | 14 | 10.6% |
| No Internet | 34 | 25.8% |
| Total | 132 | 100.0% |
Lostine Summary
Located in the Wallowa Valley of northeastern Oregon, Lostine is a small unincorporated community with a population of approximately 200 people. The town is situated in the foothills of the Wallowa Mountains, and is surrounded by lush forests and rolling hills. Lostine is a rural community, with a strong agricultural and timber-based economy.
History
Lostine was founded in 1883 by a group of settlers from the Midwest. The town was named after the Lostine River, which runs through the area. The settlers were attracted to the area by the abundance of natural resources, including timber, fish, and game. The town quickly grew, and by the early 1900s, it had become a bustling community with a population of over 500 people.
The town was home to a variety of businesses, including a sawmill, a general store, a hotel, and a blacksmith shop. The town also had a school, a post office, and a church. In the early 1900s, the town was a popular destination for tourists, who came to enjoy the area’s natural beauty.
In the 1920s, the timber industry began to decline, and the town’s population began to dwindle. By the 1950s, the population had dropped to just over 200 people. The town has remained relatively small since then, and today, the population is still around 200 people.
Geography
Lostine is located in the Wallowa Valley, in the northeastern corner of Oregon. The town is situated in the foothills of the Wallowa Mountains, and is surrounded by lush forests and rolling hills. The Lostine River runs through the area, and is a popular destination for fishing and rafting.
The town is located approximately 40 miles from the nearest major city, La Grande. The nearest airport is located in Pendleton, which is about 90 miles away.
Economy
Lostine’s economy is largely based on agriculture and timber. The town is home to several farms, which produce a variety of crops, including hay, wheat, and potatoes. The town also has a sawmill, which produces lumber for the local market.
In addition to agriculture and timber, the town is also home to a variety of small businesses, including a general store, a cafe, and a gas station. The town also has a post office, a library, and a community center.
Demographics
As of the 2010 census, the population of Lostine was approximately 200 people. The town is predominantly white, with a small Hispanic population. The median household income is $35,000, and the median age is 44.
Lostine is a small, rural community with a strong sense of community. The town is home to a variety of businesses, and is a popular destination for tourists who come to enjoy the area’s natural beauty. The town is also home to a variety of outdoor activities, including fishing, hunting, and camping.
Common Questions
What is Per Capita Income in Lostine?
Per Capita income in Lostine is $25,199.
What is the Median Family Income in Lostine?
Median Family Income in Lostine is $75,750.
What is the Median Household income in Lostine?
Median Household Income in Lostine is $63,750.
What is Income or Wage Gap in Lostine?
Income or Wage Gap in Lostine is 48.4%.
Women in Lostine earn 51.6 cents for every dollar earned by a man.
What is Inequality or Gini Index in Lostine?
Inequality or Gini Index in Lostine is 0.40.
What is the Total Population of Lostine?
Total Population of Lostine is 381.
What is the Total Male Population of Lostine?
Total Male Population of Lostine is 189.
What is the Total Female Population of Lostine?
Total Female Population of Lostine is 192.
What is the Ratio of Males per 100 Females in Lostine?
There are 98.44 Males per 100 Females in Lostine.
What is the Ratio of Females per 100 Males in Lostine?
There are 101.59 Females per 100 Males in Lostine.
What is the Median Population Age in Lostine?
Median Population Age in Lostine is 43.1 Years.
What is the Average Family Size in Lostine
Average Family Size in Lostine is 3.3 People.
What is the Average Household Size in Lostine
Average Household Size in Lostine is 2.9 People.
How Large is the Labor Force in Lostine?
There are 169 People in the Labor Forcein in Lostine.
What is the Percentage of People in the Labor Force in Lostine?
58.9% of People are in the Labor Force in Lostine.
What is the Unemployment Rate in Lostine?
Unemployment Rate in Lostine is 12.4%.