Langlois, OR Map & Demographics
Langlois Map
Langlois Overview
$19,494
PER CAPITA INCOME
0.29
INEQUALITY / GINI INDEX
300
TOTAL POPULATION
177
MALE POPULATION
123
FEMALE POPULATION
143.90
MALES / 100 FEMALES
69.49
FEMALES / 100 MALES
65.9
MEDIAN AGE
2.1
AVG FAMILY SIZE
1.7
AVG HOUSEHOLD SIZE
37
LABOR FORCE [ PEOPLE ]
14.4%
PERCENT IN LABOR FORCE
Langlois Zip Codes
Langlois Area Codes
Income in Langlois
Income Overview in Langlois
| Characteristic | Number | Measure |
| Per Capita Income | 300 | $19,494 |
| Median Family Income | 99 | $0 |
| Mean Family Income | 99 | $43,573 |
| Median Household Income | 180 | $0 |
| Mean Household Income | 180 | $38,364 |
| Income Deficit | 99 | $0 |
| Wage / Income Gap (%) | 300 | 0.00% |
| Wage / Income Gap ($) | 300 | 100.00¢ per $1 |
| Gini / Inequality Index | 300 | 0.29 |
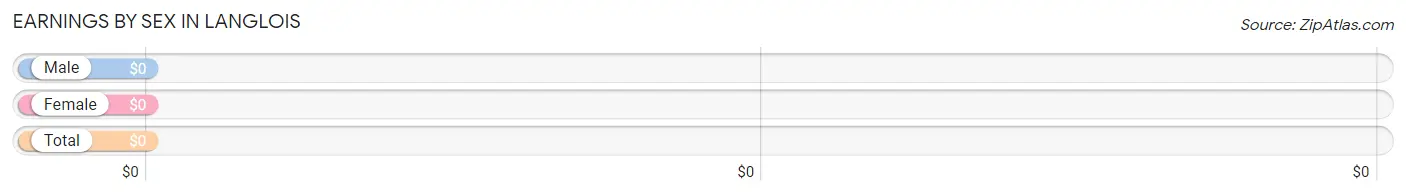
Earnings by Sex in Langlois
| Sex | Number | Average Earnings |
| Male | 11 (29.7%) | $0 |
| Female | 26 (70.3%) | $0 |
| Total | 37 (100.0%) | $0 |
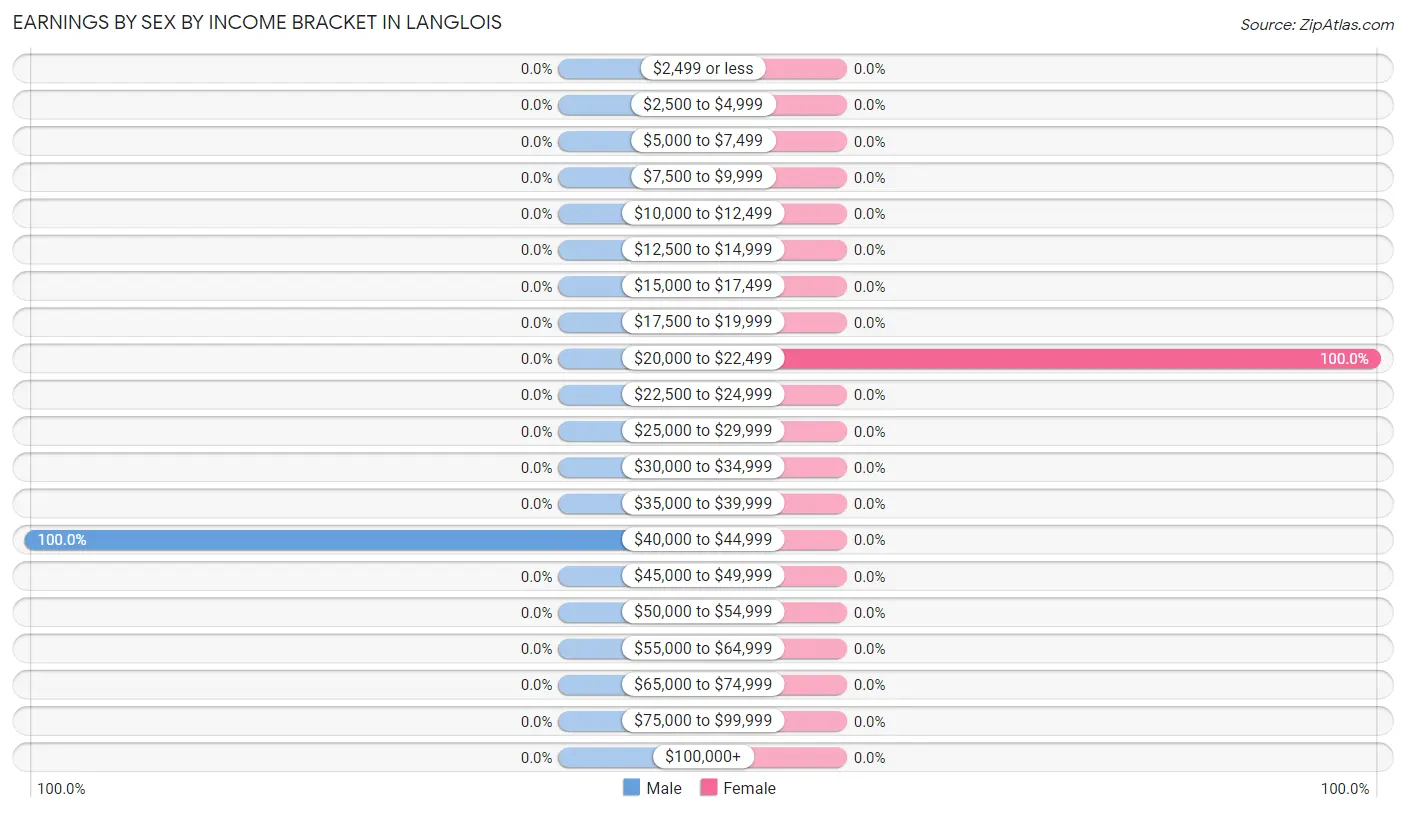
Earnings by Sex by Income Bracket in Langlois
The most common earnings brackets in Langlois are $40,000 to $44,999 for men (11 | 100.0%) and $20,000 to $22,499 for women (26 | 100.0%).
| Income | Male | Female |
| $2,499 or less | 0 (0.0%) | 0 (0.0%) |
| $2,500 to $4,999 | 0 (0.0%) | 0 (0.0%) |
| $5,000 to $7,499 | 0 (0.0%) | 0 (0.0%) |
| $7,500 to $9,999 | 0 (0.0%) | 0 (0.0%) |
| $10,000 to $12,499 | 0 (0.0%) | 0 (0.0%) |
| $12,500 to $14,999 | 0 (0.0%) | 0 (0.0%) |
| $15,000 to $17,499 | 0 (0.0%) | 0 (0.0%) |
| $17,500 to $19,999 | 0 (0.0%) | 0 (0.0%) |
| $20,000 to $22,499 | 0 (0.0%) | 26 (100.0%) |
| $22,500 to $24,999 | 0 (0.0%) | 0 (0.0%) |
| $25,000 to $29,999 | 0 (0.0%) | 0 (0.0%) |
| $30,000 to $34,999 | 0 (0.0%) | 0 (0.0%) |
| $35,000 to $39,999 | 0 (0.0%) | 0 (0.0%) |
| $40,000 to $44,999 | 11 (100.0%) | 0 (0.0%) |
| $45,000 to $49,999 | 0 (0.0%) | 0 (0.0%) |
| $50,000 to $54,999 | 0 (0.0%) | 0 (0.0%) |
| $55,000 to $64,999 | 0 (0.0%) | 0 (0.0%) |
| $65,000 to $74,999 | 0 (0.0%) | 0 (0.0%) |
| $75,000 to $99,999 | 0 (0.0%) | 0 (0.0%) |
| $100,000+ | 0 (0.0%) | 0 (0.0%) |
| Total | 11 (100.0%) | 26 (100.0%) |
Earnings by Sex by Educational Attainment in Langlois
| Educational Attainment | Male Income | Female Income |
| Less than High School | - | - |
| High School Diploma | - | - |
| College or Associate's Degree | - | - |
| Bachelor's Degree | - | - |
| Graduate Degree | - | - |
| Total | - | - |
Family Income in Langlois
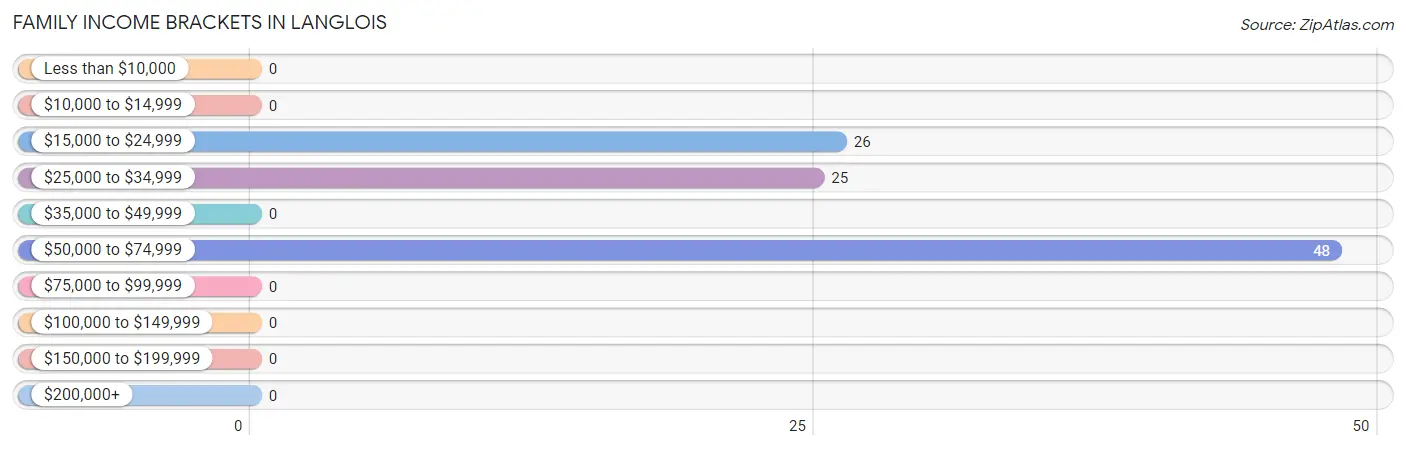
Family Income Brackets in Langlois
According to the Langlois family income data, there are 48 families falling into the $50,000 to $74,999 income range, which is the most common income bracket and makes up 48.5% of all families.
| Income Bracket | # Families | % Families |
| Less than $10,000 | 0 | 0.0% |
| $10,000 to $14,999 | 0 | 0.0% |
| $15,000 to $24,999 | 26 | 26.3% |
| $25,000 to $34,999 | 25 | 25.3% |
| $35,000 to $49,999 | 0 | 0.0% |
| $50,000 to $74,999 | 48 | 48.5% |
| $75,000 to $99,999 | 0 | 0.0% |
| $100,000 to $149,999 | 0 | 0.0% |
| $150,000 to $199,999 | 0 | 0.0% |
| $200,000+ | 0 | 0.0% |
Family Income by Famaliy Size in Langlois
| Income Bracket | # Families | Median Income |
| 2-Person Families | 73 (73.7%) | $0 |
| 3-Person Families | 26 (26.3%) | $0 |
| 4-Person Families | 0 (0.0%) | $0 |
| 5-Person Families | 0 (0.0%) | $0 |
| 6-Person Families | 0 (0.0%) | $0 |
| 7+ Person Families | 0 (0.0%) | $0 |
| Total | 99 (100.0%) | $0 |
Family Income by Number of Earners in Langlois
| Number of Earners | # Families | Median Income |
| No Earners | 73 (73.7%) | $0 |
| 1 Earner | 26 (26.3%) | $0 |
| 2 Earners | 0 (0.0%) | $0 |
| 3+ Earners | 0 (0.0%) | $0 |
| Total | 99 (100.0%) | $0 |
Household Income in Langlois
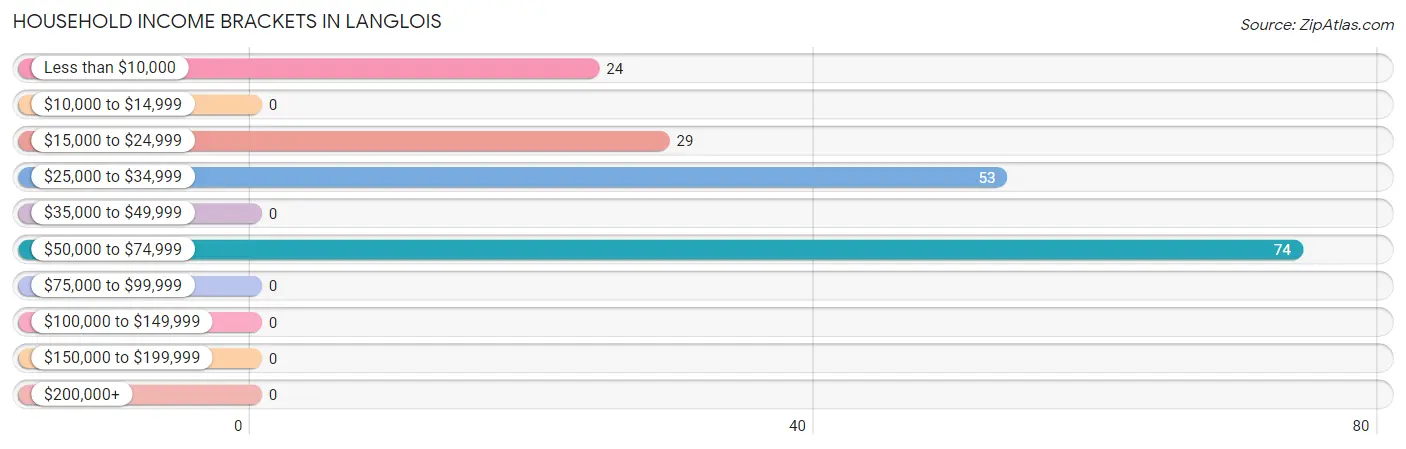
Household Income Brackets in Langlois
With 74 households falling in the category, the $50,000 to $74,999 income range is the most frequent in Langlois, accounting for 41.1% of all households.
| Income Bracket | # Households | % Households |
| Less than $10,000 | 24 | 13.3% |
| $10,000 to $14,999 | 0 | 0.0% |
| $15,000 to $24,999 | 29 | 16.1% |
| $25,000 to $34,999 | 53 | 29.4% |
| $35,000 to $49,999 | 0 | 0.0% |
| $50,000 to $74,999 | 74 | 41.1% |
| $75,000 to $99,999 | 0 | 0.0% |
| $100,000 to $149,999 | 0 | 0.0% |
| $150,000 to $199,999 | 0 | 0.0% |
| $200,000+ | 0 | 0.0% |
Household Income by Householder Age in Langlois
The median household income in Langlois is $0, with the highest median household income of $27,143 found in the 65+ years age bracket for the primary householder. A total of 154 households (85.6%) fall into this category.
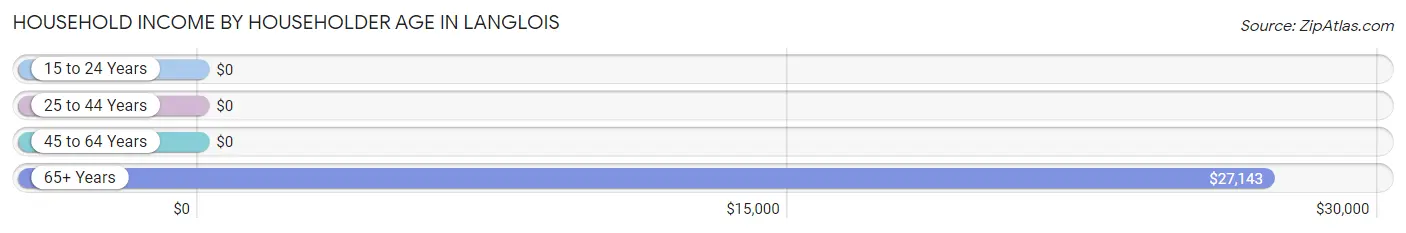
| Income Bracket | # Households | Median Income |
| 15 to 24 Years | 0 (0.0%) | $0 |
| 25 to 44 Years | 26 (14.4%) | $0 |
| 45 to 64 Years | 0 (0.0%) | $0 |
| 65+ Years | 154 (85.6%) | $27,143 |
| Total | 180 (100.0%) | $0 |
Poverty in Langlois
Income Below Poverty by Sex and Age in Langlois
With 24.3% poverty level for males and 40.6% for females among the residents of Langlois, under 5 year old males and 35 to 44 year old females are the most vulnerable to poverty, with 12 males (100.0%) and 26 females (100.0%) in their respective age groups living below the poverty level.
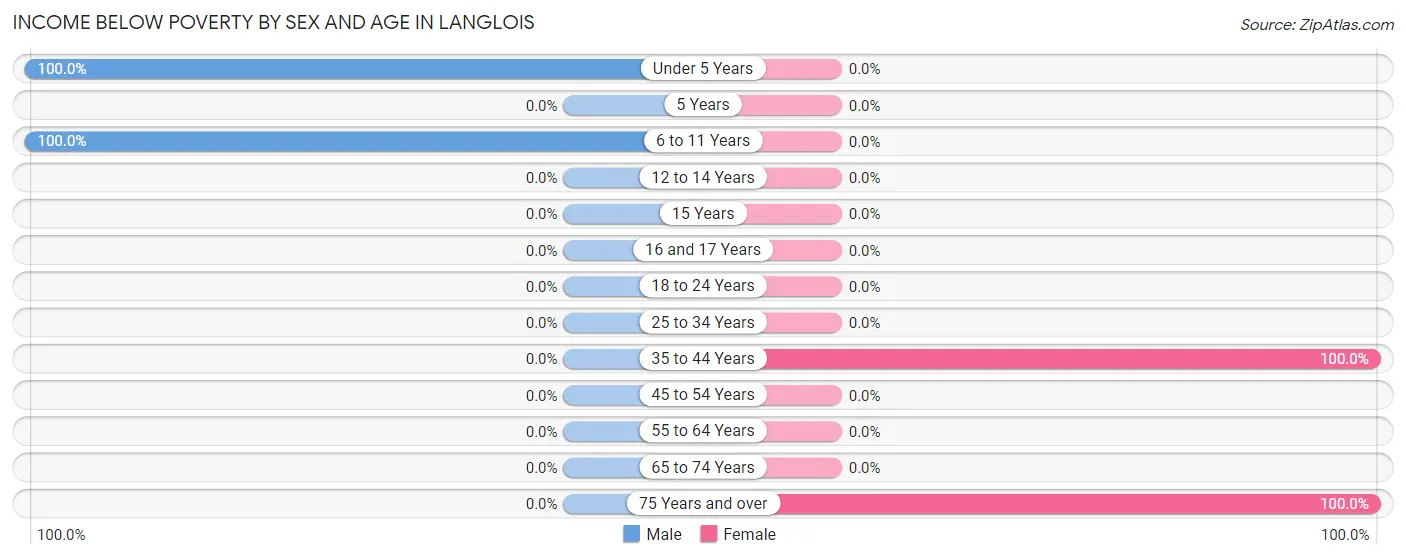
| Age Bracket | Male | Female |
| Under 5 Years | 12 (100.0%) | 0 (0.0%) |
| 5 Years | 0 (0.0%) | 0 (0.0%) |
| 6 to 11 Years | 31 (100.0%) | 0 (0.0%) |
| 12 to 14 Years | 0 (0.0%) | 0 (0.0%) |
| 15 Years | 0 (0.0%) | 0 (0.0%) |
| 16 and 17 Years | 0 (0.0%) | 0 (0.0%) |
| 18 to 24 Years | 0 (0.0%) | 0 (0.0%) |
| 25 to 34 Years | 0 (0.0%) | 0 (0.0%) |
| 35 to 44 Years | 0 (0.0%) | 26 (100.0%) |
| 45 to 54 Years | 0 (0.0%) | 0 (0.0%) |
| 55 to 64 Years | 0 (0.0%) | 0 (0.0%) |
| 65 to 74 Years | 0 (0.0%) | 0 (0.0%) |
| 75 Years and over | 0 (0.0%) | 24 (100.0%) |
| Total | 43 (24.3%) | 50 (40.6%) |
Income Above Poverty by Sex and Age in Langlois
According to the poverty statistics in Langlois, males aged 55 to 64 years and females aged 65 to 74 years are the age groups that are most secure financially, with 100.0% of males and 100.0% of females in these age groups living above the poverty line.
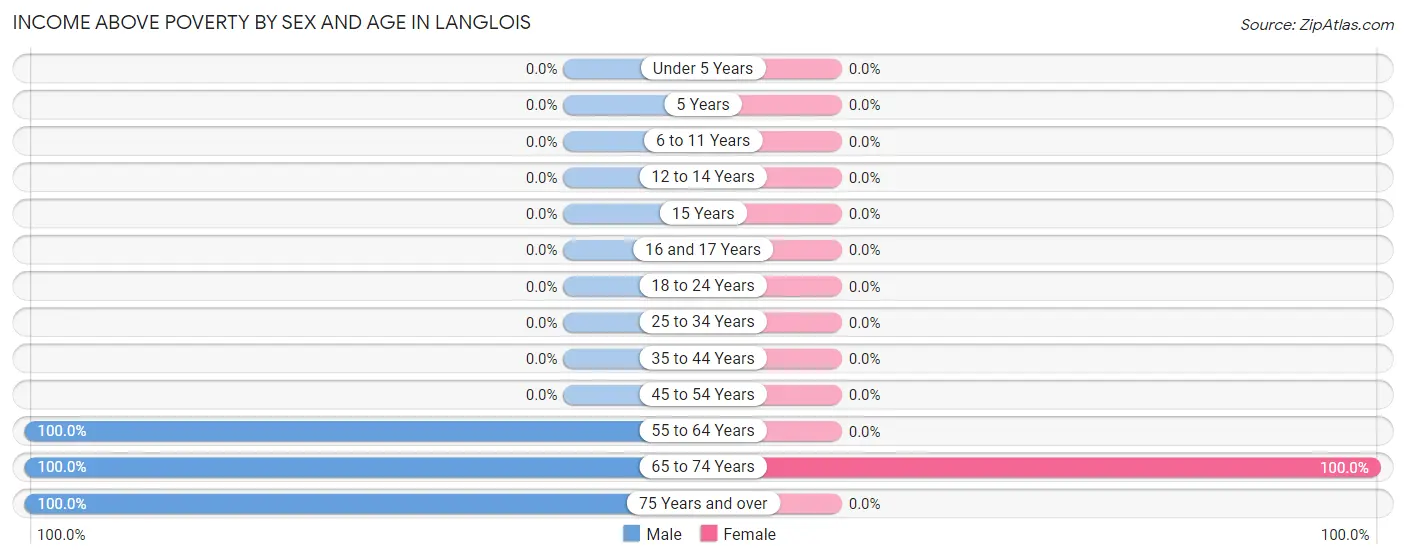
| Age Bracket | Male | Female |
| Under 5 Years | 0 (0.0%) | 0 (0.0%) |
| 5 Years | 0 (0.0%) | 0 (0.0%) |
| 6 to 11 Years | 0 (0.0%) | 0 (0.0%) |
| 12 to 14 Years | 0 (0.0%) | 0 (0.0%) |
| 15 Years | 0 (0.0%) | 0 (0.0%) |
| 16 and 17 Years | 0 (0.0%) | 0 (0.0%) |
| 18 to 24 Years | 0 (0.0%) | 0 (0.0%) |
| 25 to 34 Years | 0 (0.0%) | 0 (0.0%) |
| 35 to 44 Years | 0 (0.0%) | 0 (0.0%) |
| 45 to 54 Years | 0 (0.0%) | 0 (0.0%) |
| 55 to 64 Years | 38 (100.0%) | 0 (0.0%) |
| 65 to 74 Years | 67 (100.0%) | 73 (100.0%) |
| 75 Years and over | 29 (100.0%) | 0 (0.0%) |
| Total | 134 (75.7%) | 73 (59.4%) |
Income Below Poverty Among Married-Couple Families in Langlois
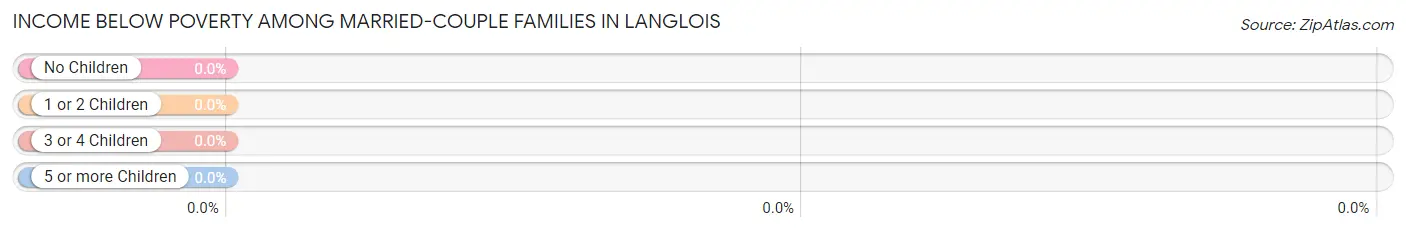
| Children | Above Poverty | Below Poverty |
| No Children | 73 (100.0%) | 0 (0.0%) |
| 1 or 2 Children | 0 (0.0%) | 0 (0.0%) |
| 3 or 4 Children | 0 (0.0%) | 0 (0.0%) |
| 5 or more Children | 0 (0.0%) | 0 (0.0%) |
| Total | 73 (100.0%) | 0 (0.0%) |
Income Below Poverty Among Single-Parent Households in Langlois
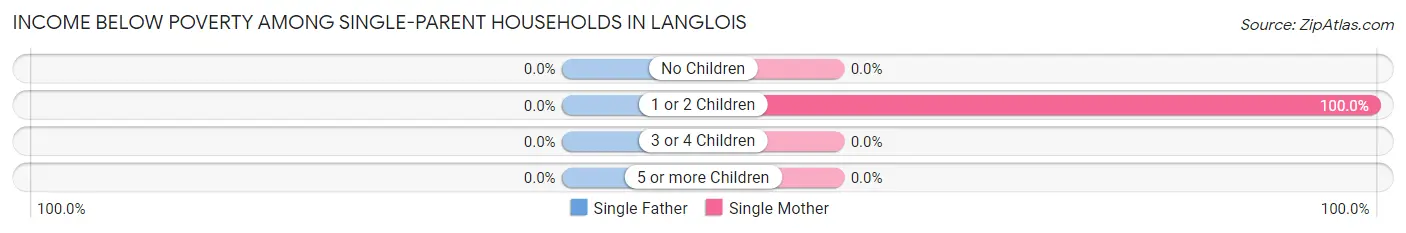
| Children | Single Father | Single Mother |
| No Children | 0 (0.0%) | 0 (0.0%) |
| 1 or 2 Children | 0 (0.0%) | 26 (100.0%) |
| 3 or 4 Children | 0 (0.0%) | 0 (0.0%) |
| 5 or more Children | 0 (0.0%) | 0 (0.0%) |
| Total | 0 (0.0%) | 26 (100.0%) |
Income Below Poverty Among Married-Couple vs Single-Parent Households in Langlois
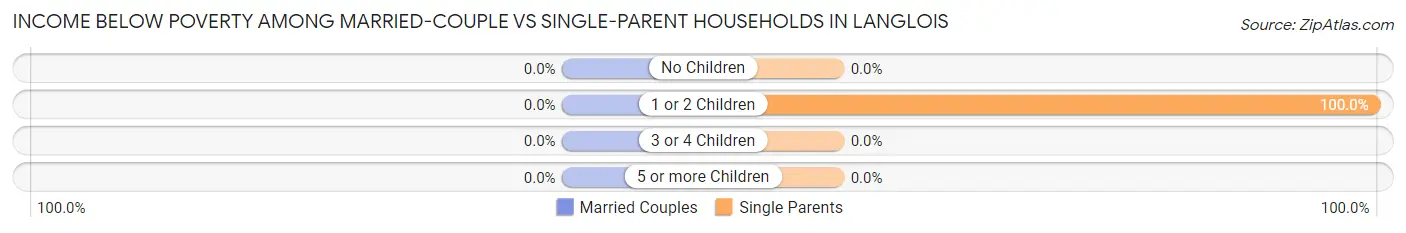
| Children | Married-Couple Families | Single-Parent Households |
| No Children | 0 (0.0%) | 0 (0.0%) |
| 1 or 2 Children | 0 (0.0%) | 26 (100.0%) |
| 3 or 4 Children | 0 (0.0%) | 0 (0.0%) |
| 5 or more Children | 0 (0.0%) | 0 (0.0%) |
| Total | 0 (0.0%) | 26 (100.0%) |
Race in Langlois
The most populous races in Langlois are , and White / Caucasian (300 | 100.0%).
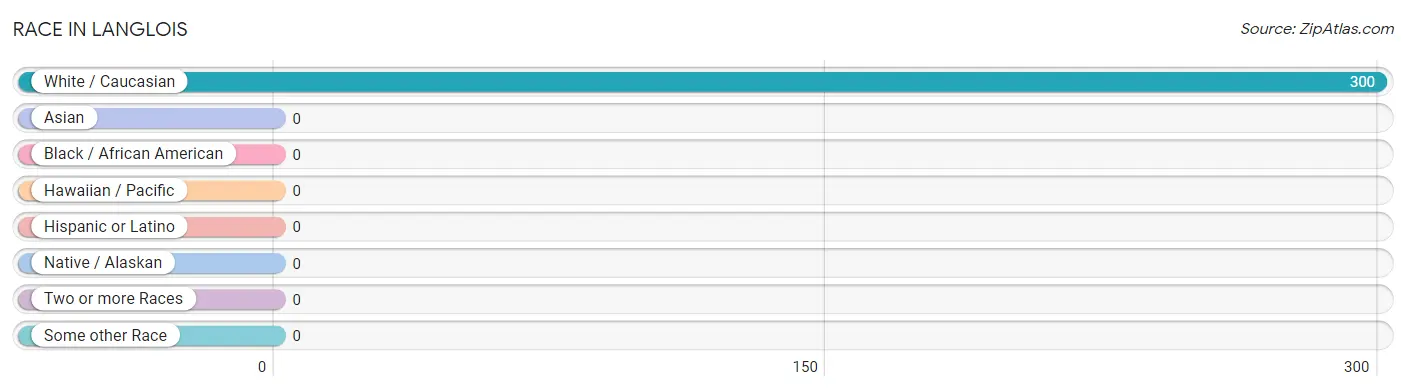
| Race | # Population | % Population |
| Asian | 0 | 0.0% |
| Black / African American | 0 | 0.0% |
| Hawaiian / Pacific | 0 | 0.0% |
| Hispanic or Latino | 0 | 0.0% |
| Native / Alaskan | 0 | 0.0% |
| White / Caucasian | 300 | 100.0% |
| Two or more Races | 0 | 0.0% |
| Some other Race | 0 | 0.0% |
| Total | 300 | 100.0% |
Ancestry in Langlois
The most populous ancestries reported in Langlois are English (130 | 43.3%), German (79 | 26.3%), Irish (66 | 22.0%), Swedish (27 | 9.0%), and Norwegian (11 | 3.7%), together accounting for 104.3% of all Langlois residents.
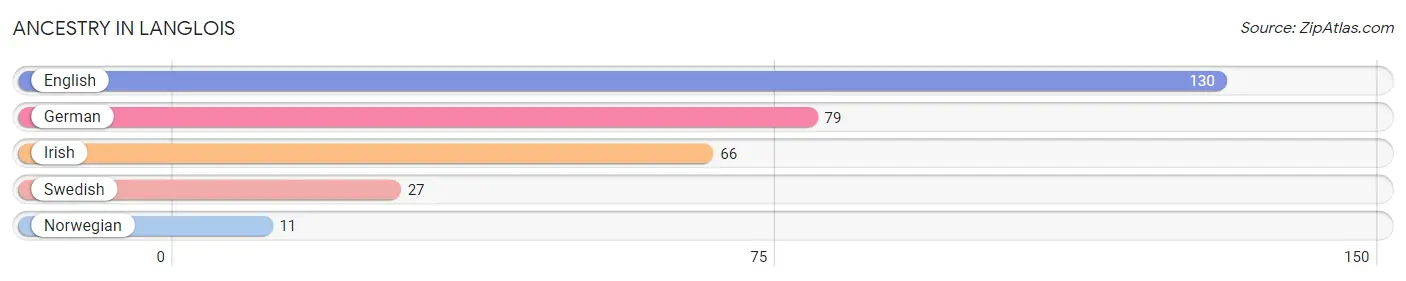
| Ancestry | # Population | % Population |
| English | 130 | 43.3% |
| German | 79 | 26.3% |
| Irish | 66 | 22.0% |
| Norwegian | 11 | 3.7% |
| Swedish | 27 | 9.0% | View All 5 Rows |
Immigrants in Langlois

| Immigration Origin | # Population | % Population | View All 0 Rows |
Sex and Age in Langlois
Sex and Age in Langlois
The most populous age groups in Langlois are 70 to 74 Years (67 | 37.9%) for men and 65 to 69 Years (73 | 59.4%) for women.
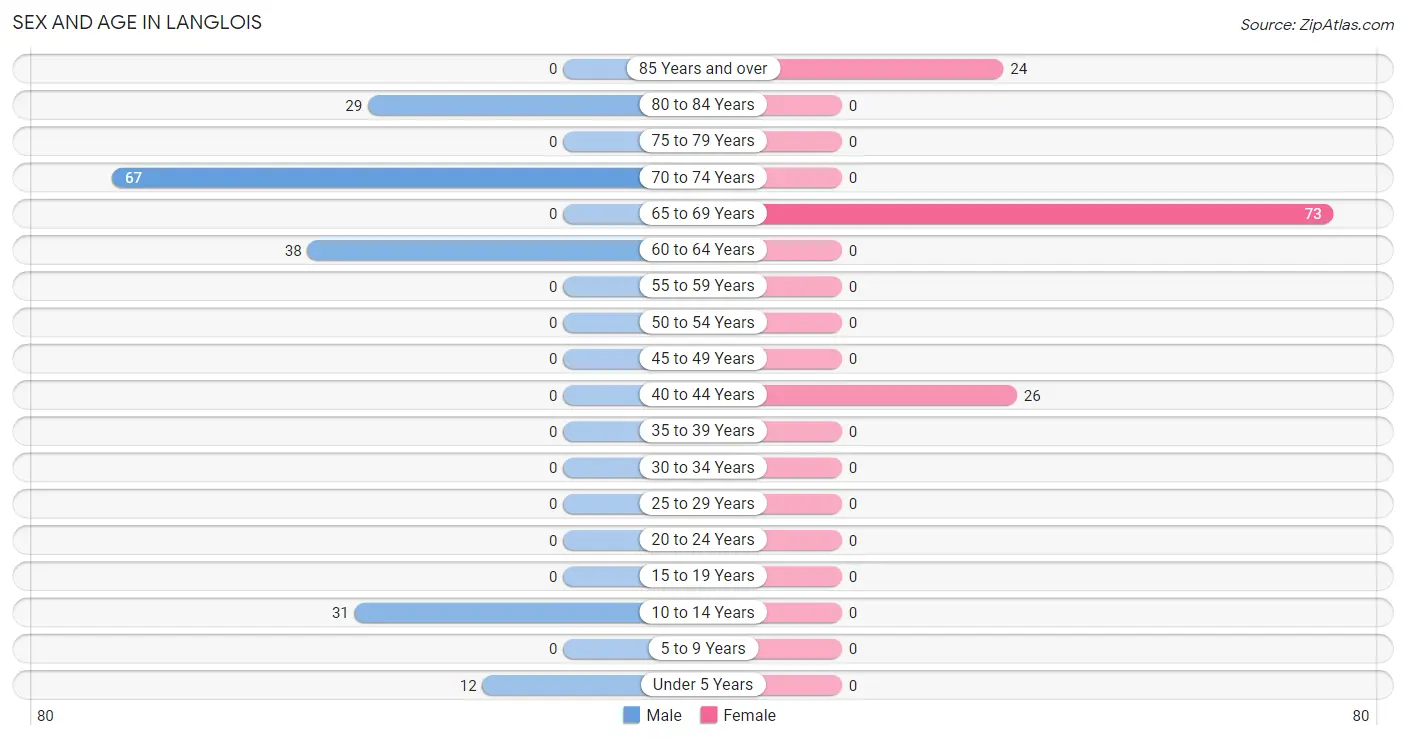
| Age Bracket | Male | Female |
| Under 5 Years | 12 (6.8%) | 0 (0.0%) |
| 5 to 9 Years | 0 (0.0%) | 0 (0.0%) |
| 10 to 14 Years | 31 (17.5%) | 0 (0.0%) |
| 15 to 19 Years | 0 (0.0%) | 0 (0.0%) |
| 20 to 24 Years | 0 (0.0%) | 0 (0.0%) |
| 25 to 29 Years | 0 (0.0%) | 0 (0.0%) |
| 30 to 34 Years | 0 (0.0%) | 0 (0.0%) |
| 35 to 39 Years | 0 (0.0%) | 0 (0.0%) |
| 40 to 44 Years | 0 (0.0%) | 26 (21.1%) |
| 45 to 49 Years | 0 (0.0%) | 0 (0.0%) |
| 50 to 54 Years | 0 (0.0%) | 0 (0.0%) |
| 55 to 59 Years | 0 (0.0%) | 0 (0.0%) |
| 60 to 64 Years | 38 (21.5%) | 0 (0.0%) |
| 65 to 69 Years | 0 (0.0%) | 73 (59.4%) |
| 70 to 74 Years | 67 (37.9%) | 0 (0.0%) |
| 75 to 79 Years | 0 (0.0%) | 0 (0.0%) |
| 80 to 84 Years | 29 (16.4%) | 0 (0.0%) |
| 85 Years and over | 0 (0.0%) | 24 (19.5%) |
| Total | 177 (100.0%) | 123 (100.0%) |
Families and Households in Langlois
Median Family Size in Langlois
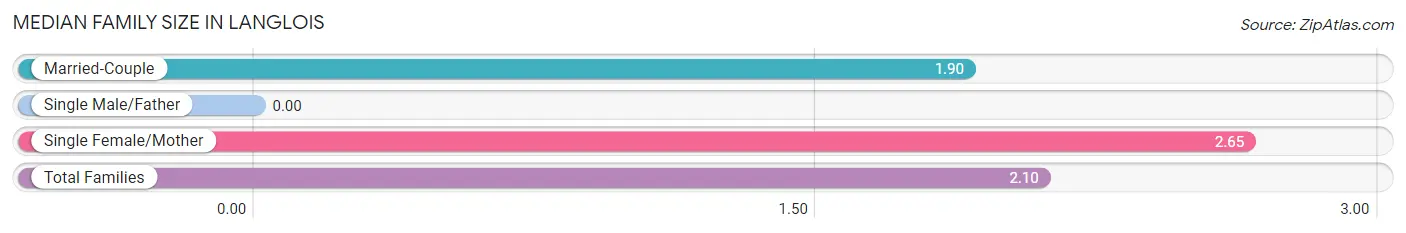
| Family Type | # Families | Family Size |
| Married-Couple | 73 (73.7%) | 1.90 |
| Single Male/Father | 0 (0.0%) | - |
| Single Female/Mother | 26 (26.3%) | 2.65 |
| Total Families | 99 (100.0%) | 2.10 |
Median Household Size in Langlois
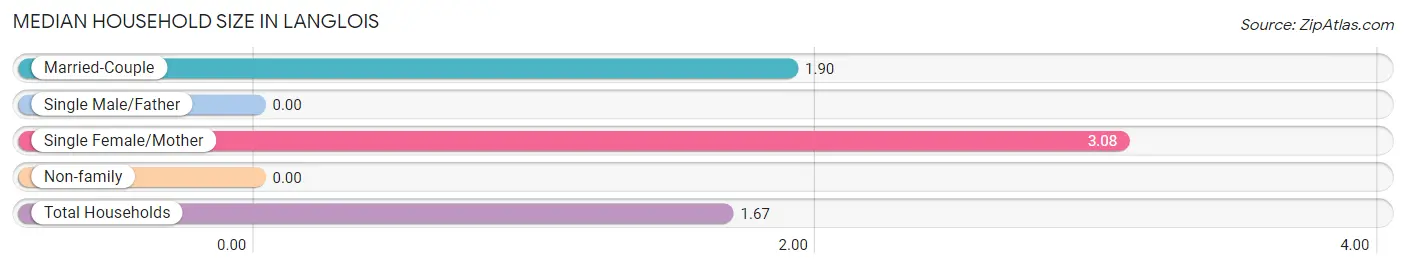
| Household Type | # Households | Household Size |
| Married-Couple | 73 (40.6%) | 1.90 |
| Single Male/Father | 0 (0.0%) | - |
| Single Female/Mother | 26 (14.4%) | 3.08 |
| Non-family | 81 (45.0%) | - |
| Total Households | 180 (100.0%) | 1.67 |
Household Size by Marriage Status in Langlois
Out of a total of 180 households in Langlois, 99 (55.0%) are family households, while 81 (45.0%) are nonfamily households. The most numerous type of family households are 2-person households, comprising 73, and the most common type of nonfamily households are 1-person households, comprising 81.
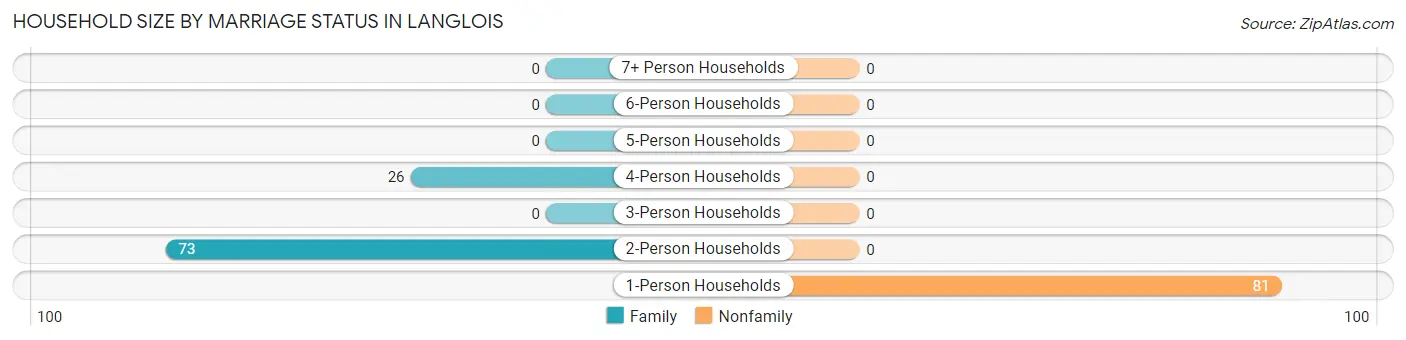
| Household Size | Family Households | Nonfamily Households |
| 1-Person Households | - | 81 (45.0%) |
| 2-Person Households | 73 (40.6%) | 0 (0.0%) |
| 3-Person Households | 0 (0.0%) | 0 (0.0%) |
| 4-Person Households | 26 (14.4%) | 0 (0.0%) |
| 5-Person Households | 0 (0.0%) | 0 (0.0%) |
| 6-Person Households | 0 (0.0%) | 0 (0.0%) |
| 7+ Person Households | 0 (0.0%) | 0 (0.0%) |
| Total | 99 (55.0%) | 81 (45.0%) |
Female Fertility in Langlois
Fertility by Age in Langlois
| Age Bracket | Women with Births | Births / 1,000 Women |
| 15 to 19 years | 0 (0.0%) | 0.0 |
| 20 to 34 years | 0 (0.0%) | 0.0 |
| 35 to 50 years | 0 (0.0%) | 0.0 |
| Total | 0 (0.0%) | 0.0 |
Fertility by Age by Marriage Status in Langlois
| Age Bracket | Married | Unmarried |
| 15 to 19 years | 0 (0.0%) | 0 (0.0%) |
| 20 to 34 years | 0 (0.0%) | 0 (0.0%) |
| 35 to 50 years | 0 (0.0%) | 0 (0.0%) |
| Total | 0 (0.0%) | 0 (0.0%) |
Fertility by Education in Langlois
| Educational Attainment | Women with Births | Births / 1,000 Women |
| Less than High School | 0 (0.0%) | 0.0 |
| High School Diploma | 0 (0.0%) | 0.0 |
| College or Associate's Degree | 0 (0.0%) | 0.0 |
| Bachelor's Degree | 0 (0.0%) | 0.0 |
| Graduate Degree | 0 (0.0%) | 0.0 |
| Total | 0 (0.0%) | 0.0 |
Fertility by Education by Marriage Status in Langlois
| Educational Attainment | Married | Unmarried |
| Less than High School | 0 (0.0%) | 0 (0.0%) |
| High School Diploma | 0 (0.0%) | 0 (0.0%) |
| College or Associate's Degree | 0 (0.0%) | 0 (0.0%) |
| Bachelor's Degree | 0 (0.0%) | 0 (0.0%) |
| Graduate Degree | 0 (0.0%) | 0 (0.0%) |
| Total | 0 (0.0%) | 0 (0.0%) |
Employment Characteristics in Langlois
Employment by Class of Employer in Langlois
Among the 37 employed individuals in Langlois, , and self-employed (not incorporated) (37 | 100.0%) make up the most common classes of employment.
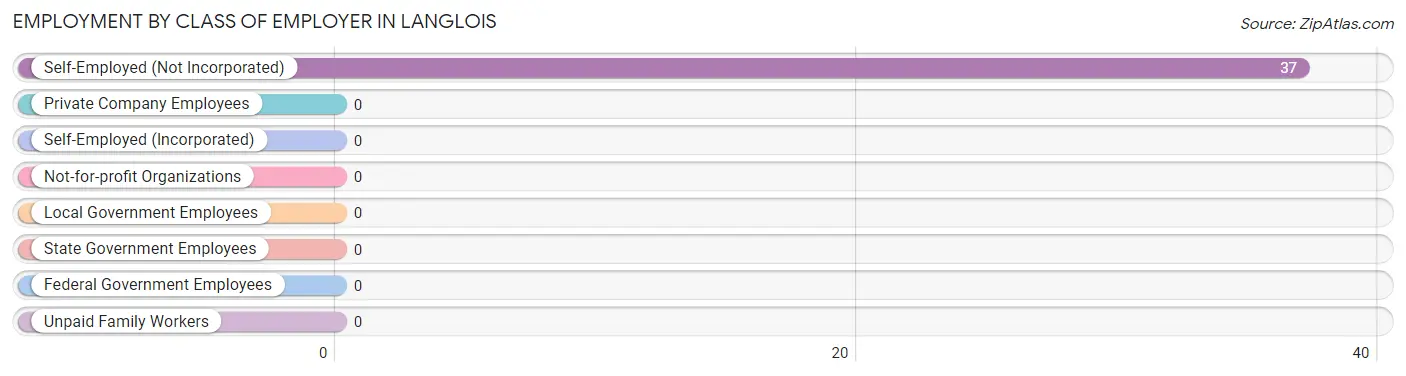
| Employer Class | # Employees | % Employees |
| Private Company Employees | 0 | 0.0% |
| Self-Employed (Incorporated) | 0 | 0.0% |
| Self-Employed (Not Incorporated) | 37 | 100.0% |
| Not-for-profit Organizations | 0 | 0.0% |
| Local Government Employees | 0 | 0.0% |
| State Government Employees | 0 | 0.0% |
| Federal Government Employees | 0 | 0.0% |
| Unpaid Family Workers | 0 | 0.0% |
| Total | 37 | 100.0% |
Employment Status by Age in Langlois
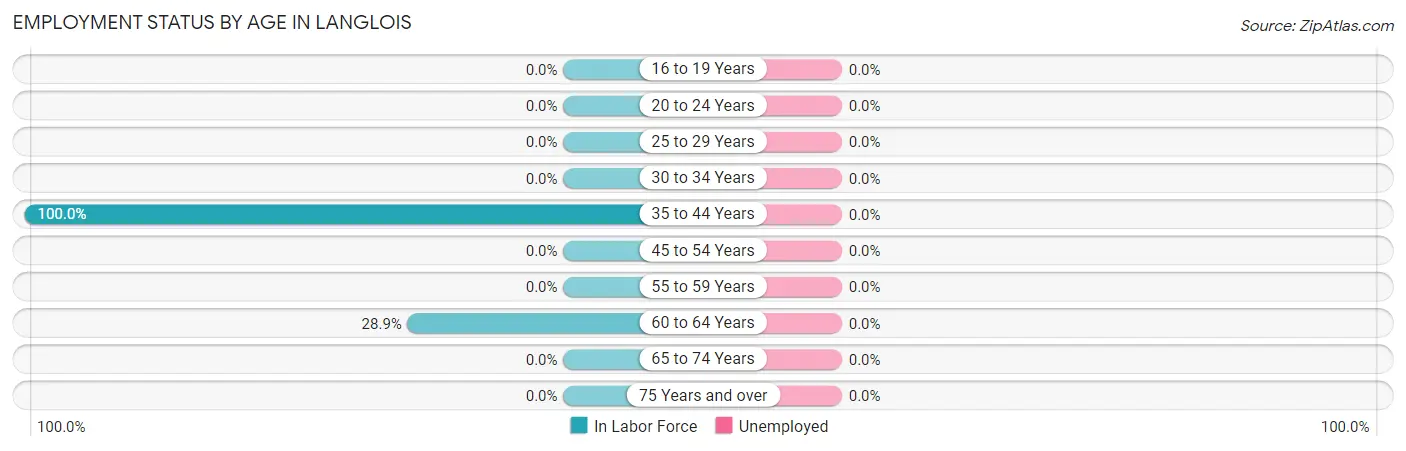
| Age Bracket | In Labor Force | Unemployed |
| 16 to 19 Years | 0 (0.0%) | 0 (0.0%) |
| 20 to 24 Years | 0 (0.0%) | 0 (0.0%) |
| 25 to 29 Years | 0 (0.0%) | 0 (0.0%) |
| 30 to 34 Years | 0 (0.0%) | 0 (0.0%) |
| 35 to 44 Years | 26 (100.0%) | 0 (0.0%) |
| 45 to 54 Years | 0 (0.0%) | 0 (0.0%) |
| 55 to 59 Years | 0 (0.0%) | 0 (0.0%) |
| 60 to 64 Years | 11 (28.9%) | 0 (0.0%) |
| 65 to 74 Years | 0 (0.0%) | 0 (0.0%) |
| 75 Years and over | 0 (0.0%) | 0 (0.0%) |
| Total | 37 (14.4%) | 0 (0.0%) |
Employment Status by Educational Attainment in Langlois
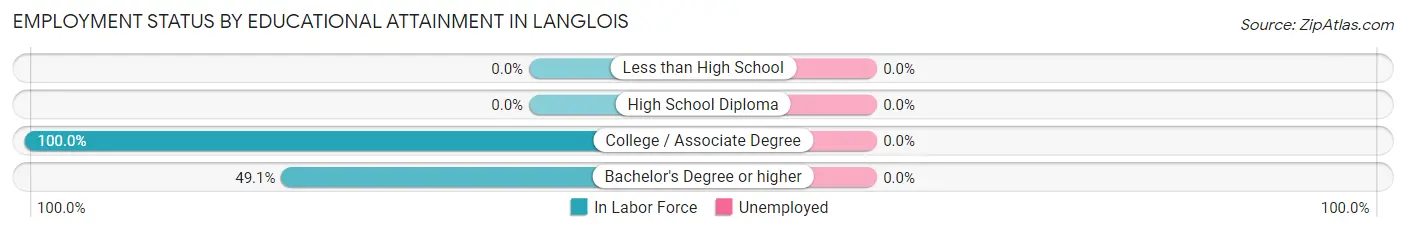
| Educational Attainment | In Labor Force | Unemployed |
| Less than High School | 0 (0.0%) | 0 (0.0%) |
| High School Diploma | 0 (0.0%) | 0 (0.0%) |
| College / Associate Degree | 11 (100.0%) | 0 (0.0%) |
| Bachelor's Degree or higher | 26 (49.1%) | 0 (0.0%) |
| Total | 37 (57.8%) | 0 (0.0%) |
Employment Occupations by Sex in Langlois
Management, Business, Science and Arts Occupations
The most common Management, Business, Science and Arts occupations in Langlois are , and Management (37 | 100.0%).
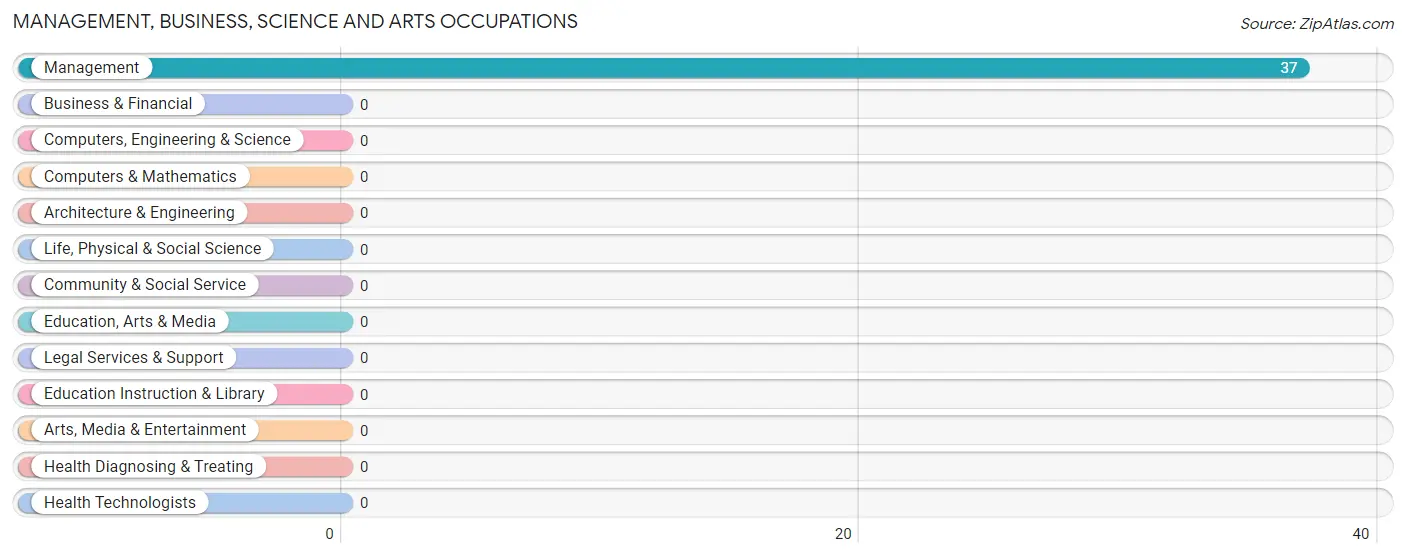
Management, Business, Science and Arts Occupations by Sex
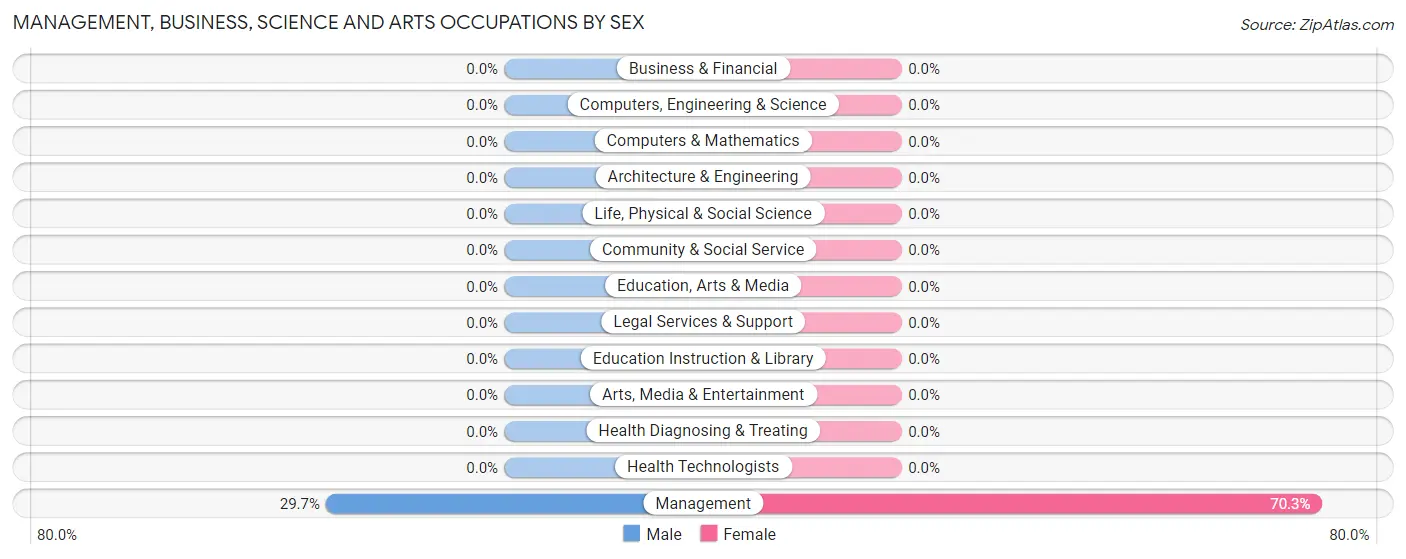
| Occupation | Male | Female |
| Management | 11 (29.7%) | 26 (70.3%) |
| Business & Financial | 0 (0.0%) | 0 (0.0%) |
| Computers, Engineering & Science | 0 (0.0%) | 0 (0.0%) |
| Computers & Mathematics | 0 (0.0%) | 0 (0.0%) |
| Architecture & Engineering | 0 (0.0%) | 0 (0.0%) |
| Life, Physical & Social Science | 0 (0.0%) | 0 (0.0%) |
| Community & Social Service | 0 (0.0%) | 0 (0.0%) |
| Education, Arts & Media | 0 (0.0%) | 0 (0.0%) |
| Legal Services & Support | 0 (0.0%) | 0 (0.0%) |
| Education Instruction & Library | 0 (0.0%) | 0 (0.0%) |
| Arts, Media & Entertainment | 0 (0.0%) | 0 (0.0%) |
| Health Diagnosing & Treating | 0 (0.0%) | 0 (0.0%) |
| Health Technologists | 0 (0.0%) | 0 (0.0%) |
| Total (Category) | 11 (29.7%) | 26 (70.3%) |
| Total (Overall) | 11 (29.7%) | 26 (70.3%) |
Services Occupations
Services Occupations by Sex
| Occupation | Male | Female |
| Healthcare Support | 0 (0.0%) | 0 (0.0%) |
| Security & Protection | 0 (0.0%) | 0 (0.0%) |
| Firefighting & Prevention | 0 (0.0%) | 0 (0.0%) |
| Law Enforcement | 0 (0.0%) | 0 (0.0%) |
| Food Preparation & Serving | 0 (0.0%) | 0 (0.0%) |
| Cleaning & Maintenance | 0 (0.0%) | 0 (0.0%) |
| Personal Care & Service | 0 (0.0%) | 0 (0.0%) |
| Total (Category) | 0 (0.0%) | 0 (0.0%) |
| Total (Overall) | 11 (29.7%) | 26 (70.3%) |
Sales and Office Occupations
Sales and Office Occupations by Sex
| Occupation | Male | Female |
| Sales & Related | 0 (0.0%) | 0 (0.0%) |
| Office & Administration | 0 (0.0%) | 0 (0.0%) |
| Total (Category) | 0 (0.0%) | 0 (0.0%) |
| Total (Overall) | 11 (29.7%) | 26 (70.3%) |
Natural Resources, Construction and Maintenance Occupations
Natural Resources, Construction and Maintenance Occupations by Sex
| Occupation | Male | Female |
| Farming, Fishing & Forestry | 0 (0.0%) | 0 (0.0%) |
| Construction & Extraction | 0 (0.0%) | 0 (0.0%) |
| Installation, Maintenance & Repair | 0 (0.0%) | 0 (0.0%) |
| Total (Category) | 0 (0.0%) | 0 (0.0%) |
| Total (Overall) | 11 (29.7%) | 26 (70.3%) |
Production, Transportation and Moving Occupations
Production, Transportation and Moving Occupations by Sex
| Occupation | Male | Female |
| Production | 0 (0.0%) | 0 (0.0%) |
| Transportation | 0 (0.0%) | 0 (0.0%) |
| Material Moving | 0 (0.0%) | 0 (0.0%) |
| Total (Category) | 0 (0.0%) | 0 (0.0%) |
| Total (Overall) | 11 (29.7%) | 26 (70.3%) |
Employment Industries by Sex in Langlois
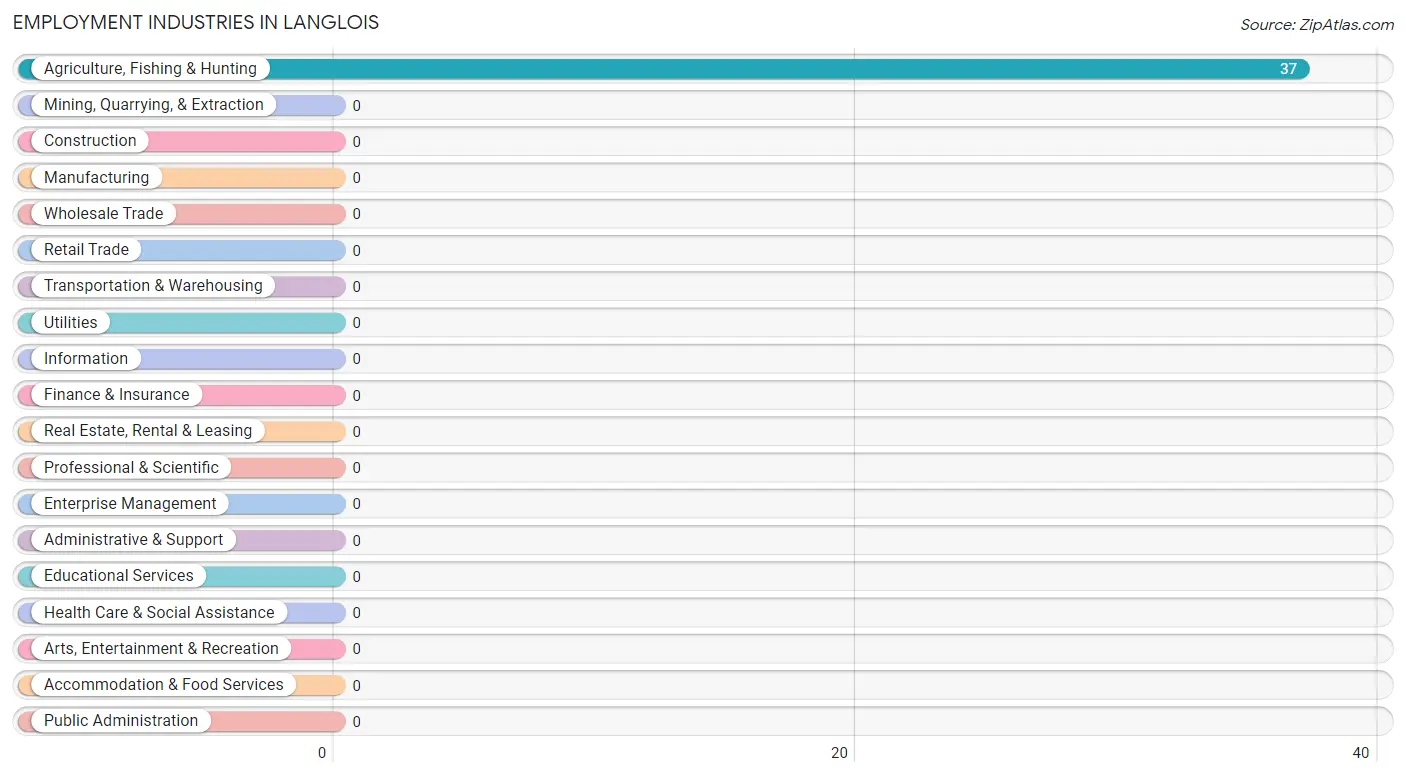
Employment Industries in Langlois
The major employment industries in Langlois include , and Agriculture, Fishing & Hunting (37 | 100.0%).
Employment Industries by Sex in Langlois
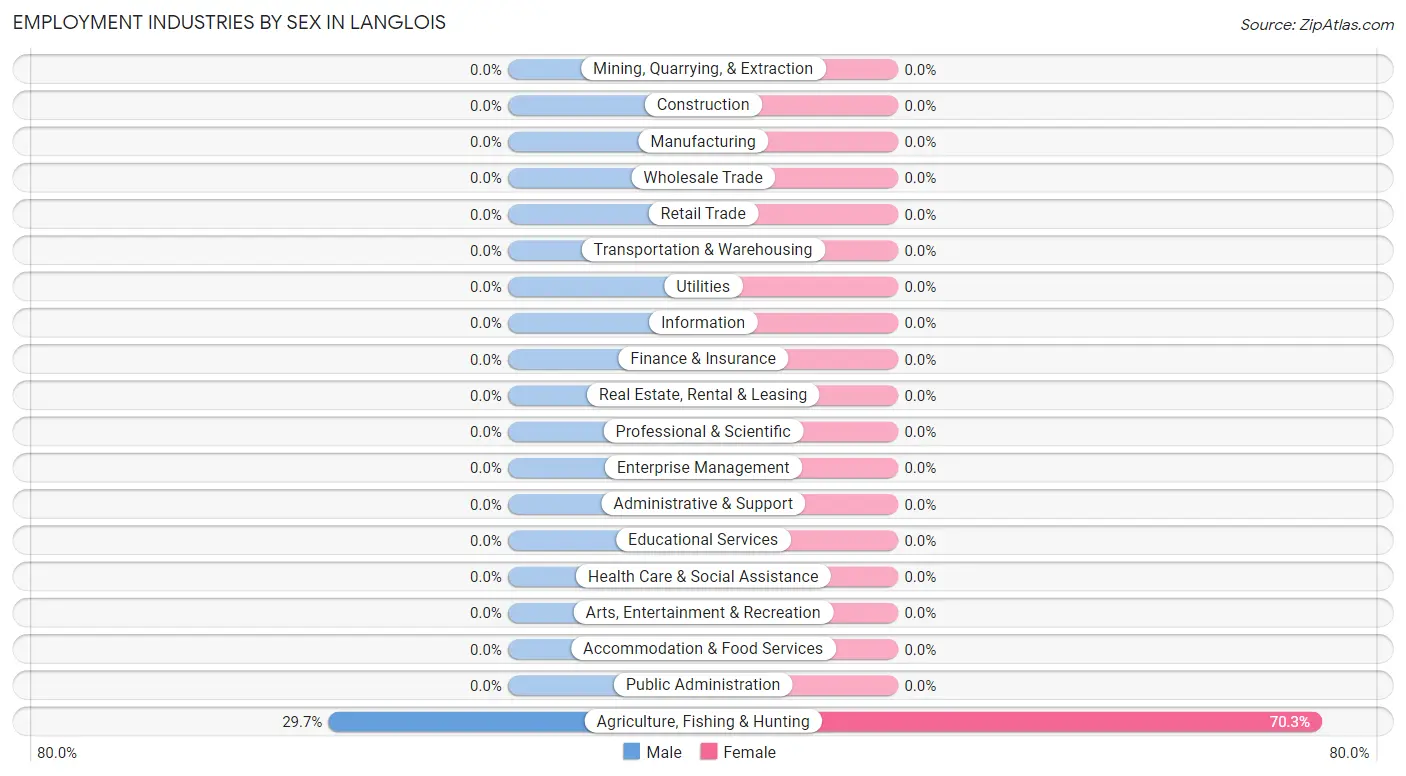
| Industry | Male | Female |
| Agriculture, Fishing & Hunting | 11 (29.7%) | 26 (70.3%) |
| Mining, Quarrying, & Extraction | 0 (0.0%) | 0 (0.0%) |
| Construction | 0 (0.0%) | 0 (0.0%) |
| Manufacturing | 0 (0.0%) | 0 (0.0%) |
| Wholesale Trade | 0 (0.0%) | 0 (0.0%) |
| Retail Trade | 0 (0.0%) | 0 (0.0%) |
| Transportation & Warehousing | 0 (0.0%) | 0 (0.0%) |
| Utilities | 0 (0.0%) | 0 (0.0%) |
| Information | 0 (0.0%) | 0 (0.0%) |
| Finance & Insurance | 0 (0.0%) | 0 (0.0%) |
| Real Estate, Rental & Leasing | 0 (0.0%) | 0 (0.0%) |
| Professional & Scientific | 0 (0.0%) | 0 (0.0%) |
| Enterprise Management | 0 (0.0%) | 0 (0.0%) |
| Administrative & Support | 0 (0.0%) | 0 (0.0%) |
| Educational Services | 0 (0.0%) | 0 (0.0%) |
| Health Care & Social Assistance | 0 (0.0%) | 0 (0.0%) |
| Arts, Entertainment & Recreation | 0 (0.0%) | 0 (0.0%) |
| Accommodation & Food Services | 0 (0.0%) | 0 (0.0%) |
| Public Administration | 0 (0.0%) | 0 (0.0%) |
| Total | 11 (29.7%) | 26 (70.3%) |
Education in Langlois
School Enrollment in Langlois
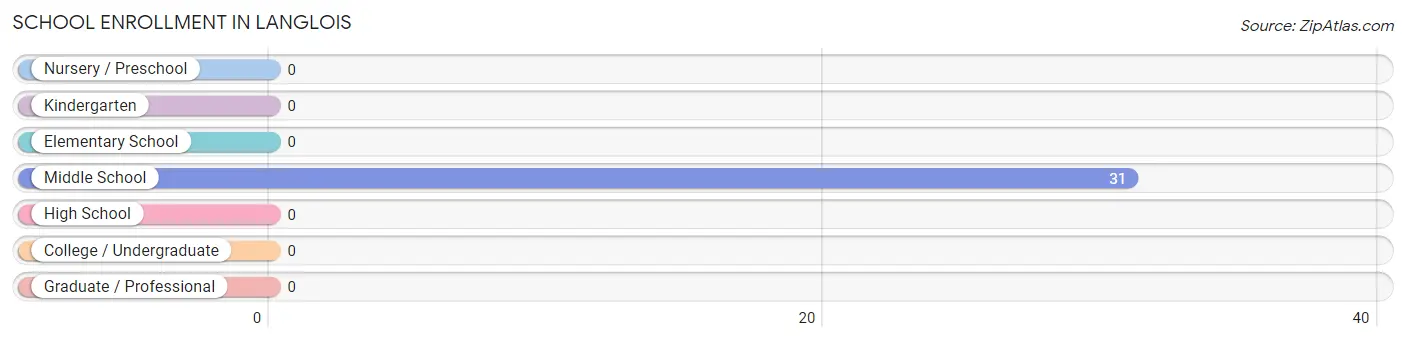
| School Level | # Students | % Students |
| Nursery / Preschool | 0 | 0.0% |
| Kindergarten | 0 | 0.0% |
| Elementary School | 0 | 0.0% |
| Middle School | 31 | 100.0% |
| High School | 0 | 0.0% |
| College / Undergraduate | 0 | 0.0% |
| Graduate / Professional | 0 | 0.0% |
| Total | 31 | 100.0% |
School Enrollment by Age by Funding Source in Langlois
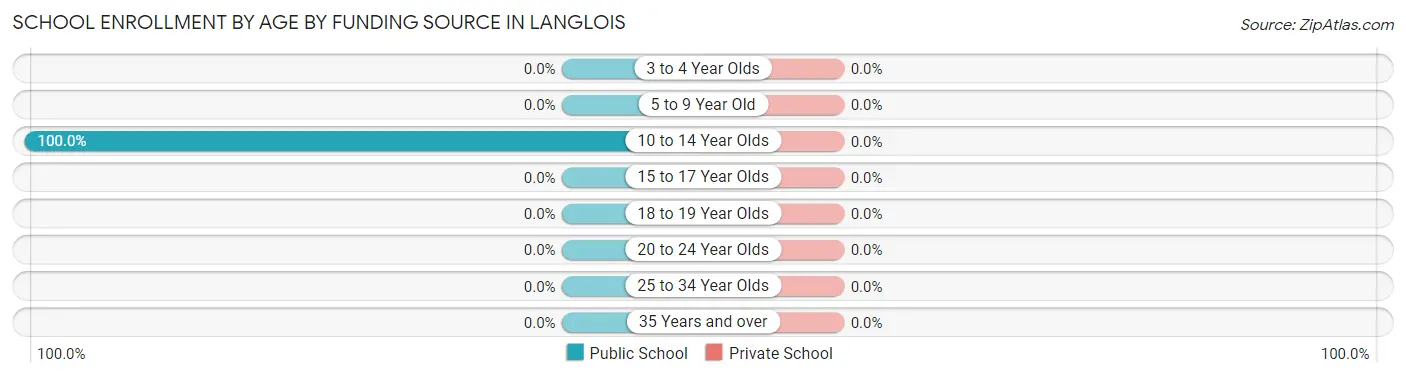
| Age Bracket | Public School | Private School |
| 3 to 4 Year Olds | 0 (0.0%) | 0 (0.0%) |
| 5 to 9 Year Old | 0 (0.0%) | 0 (0.0%) |
| 10 to 14 Year Olds | 31 (100.0%) | 0 (0.0%) |
| 15 to 17 Year Olds | 0 (0.0%) | 0 (0.0%) |
| 18 to 19 Year Olds | 0 (0.0%) | 0 (0.0%) |
| 20 to 24 Year Olds | 0 (0.0%) | 0 (0.0%) |
| 25 to 34 Year Olds | 0 (0.0%) | 0 (0.0%) |
| 35 Years and over | 0 (0.0%) | 0 (0.0%) |
| Total | 31 (100.0%) | 0 (0.0%) |
Educational Attainment by Field of Study in Langlois
Social sciences (87 | 34.7%), bio, nature & agricultural (50 | 19.9%), business (48 | 19.1%), visual & performing arts (39 | 15.5%), and education (27 | 10.8%) are the most common fields of study among 251 individuals in Langlois who have obtained a bachelor's degree or higher.
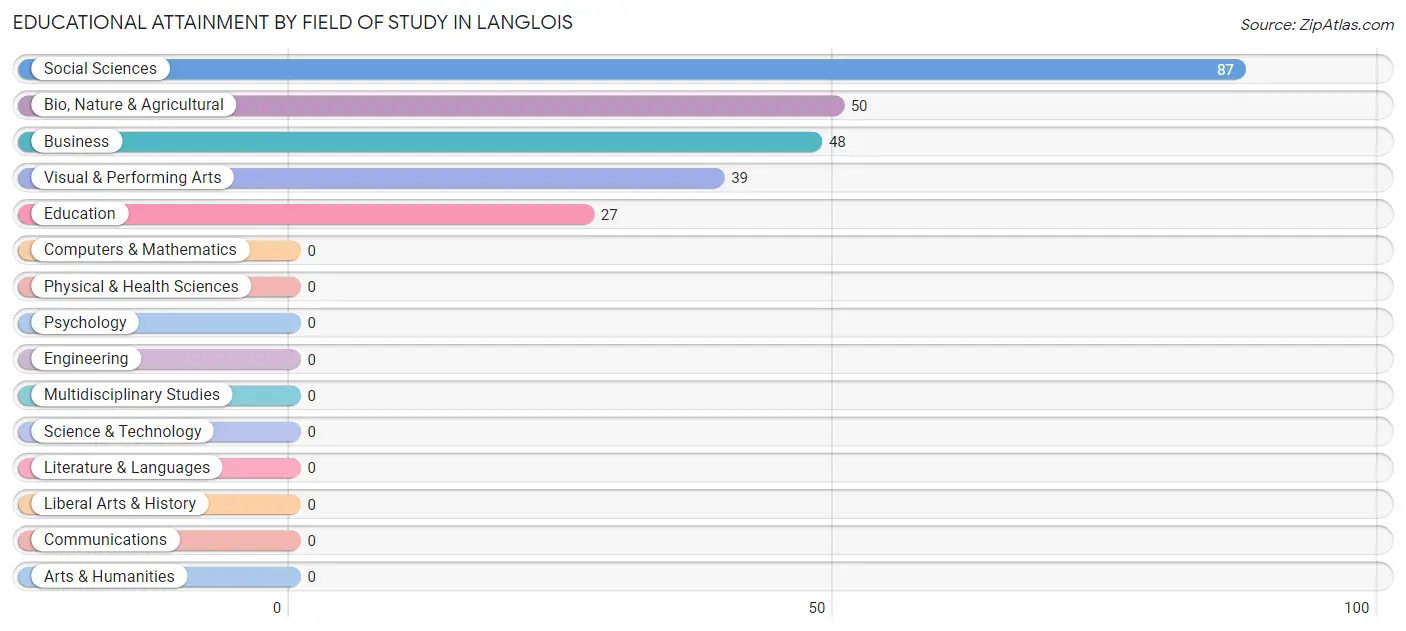
| Field of Study | # Graduates | % Graduates |
| Computers & Mathematics | 0 | 0.0% |
| Bio, Nature & Agricultural | 50 | 19.9% |
| Physical & Health Sciences | 0 | 0.0% |
| Psychology | 0 | 0.0% |
| Social Sciences | 87 | 34.7% |
| Engineering | 0 | 0.0% |
| Multidisciplinary Studies | 0 | 0.0% |
| Science & Technology | 0 | 0.0% |
| Business | 48 | 19.1% |
| Education | 27 | 10.8% |
| Literature & Languages | 0 | 0.0% |
| Liberal Arts & History | 0 | 0.0% |
| Visual & Performing Arts | 39 | 15.5% |
| Communications | 0 | 0.0% |
| Arts & Humanities | 0 | 0.0% |
| Total | 251 | 100.0% |
Transportation & Commute in Langlois
Vehicle Availability by Sex in Langlois
The most prevalent vehicle ownership categories in Langlois are males with 2 vehicles (11, accounting for 100.0%) and females with 2 vehicles (26, making up 42.3%).
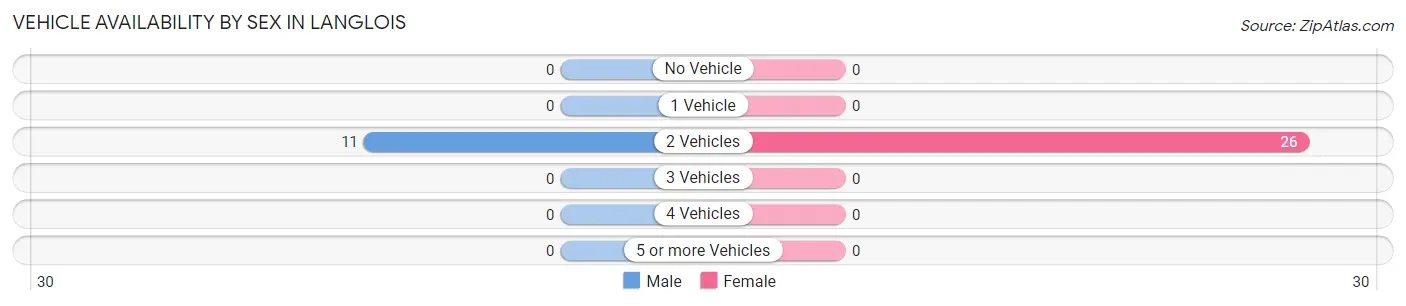
| Vehicles Available | Male | Female |
| No Vehicle | 0 (0.0%) | 0 (0.0%) |
| 1 Vehicle | 0 (0.0%) | 0 (0.0%) |
| 2 Vehicles | 11 (100.0%) | 26 (100.0%) |
| 3 Vehicles | 0 (0.0%) | 0 (0.0%) |
| 4 Vehicles | 0 (0.0%) | 0 (0.0%) |
| 5 or more Vehicles | 0 (0.0%) | 0 (0.0%) |
| Total | 11 (100.0%) | 26 (100.0%) |
Commute Time in Langlois
The most frequently occuring commute durations in Langlois are 5 to 9 minutes (26 commuters, 70.3%), 15 to 19 minutes (11 commuters, 29.7%), and less than 5 minutes (0 commuters, 0.0%).
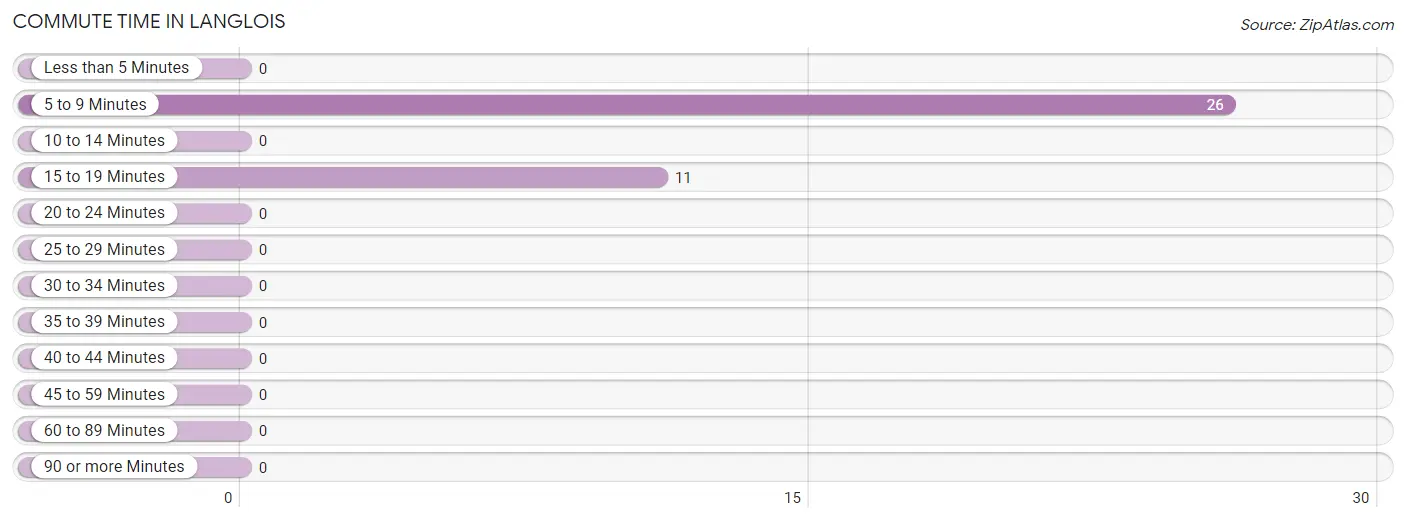
| Commute Time | # Commuters | % Commuters |
| Less than 5 Minutes | 0 | 0.0% |
| 5 to 9 Minutes | 26 | 70.3% |
| 10 to 14 Minutes | 0 | 0.0% |
| 15 to 19 Minutes | 11 | 29.7% |
| 20 to 24 Minutes | 0 | 0.0% |
| 25 to 29 Minutes | 0 | 0.0% |
| 30 to 34 Minutes | 0 | 0.0% |
| 35 to 39 Minutes | 0 | 0.0% |
| 40 to 44 Minutes | 0 | 0.0% |
| 45 to 59 Minutes | 0 | 0.0% |
| 60 to 89 Minutes | 0 | 0.0% |
| 90 or more Minutes | 0 | 0.0% |
Commute Time by Sex in Langlois
The most common commute times in Langlois are 15 to 19 minutes (11 commuters, 100.0%) for males and 5 to 9 minutes (26 commuters, 100.0%) for females.
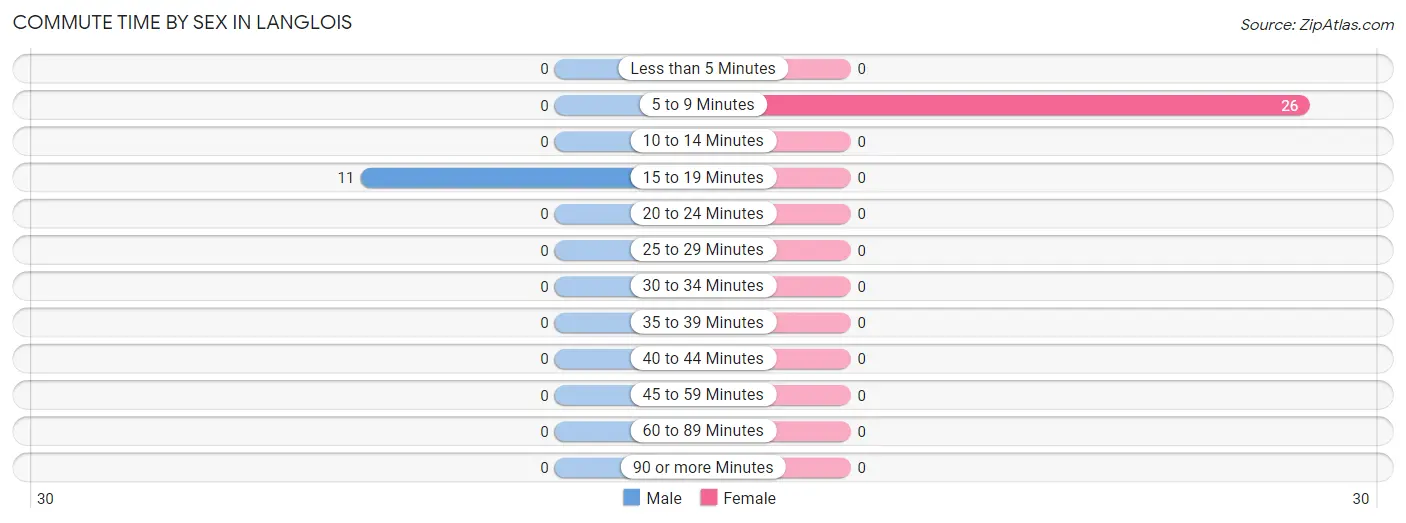
| Commute Time | Male | Female |
| Less than 5 Minutes | 0 (0.0%) | 0 (0.0%) |
| 5 to 9 Minutes | 0 (0.0%) | 26 (100.0%) |
| 10 to 14 Minutes | 0 (0.0%) | 0 (0.0%) |
| 15 to 19 Minutes | 11 (100.0%) | 0 (0.0%) |
| 20 to 24 Minutes | 0 (0.0%) | 0 (0.0%) |
| 25 to 29 Minutes | 0 (0.0%) | 0 (0.0%) |
| 30 to 34 Minutes | 0 (0.0%) | 0 (0.0%) |
| 35 to 39 Minutes | 0 (0.0%) | 0 (0.0%) |
| 40 to 44 Minutes | 0 (0.0%) | 0 (0.0%) |
| 45 to 59 Minutes | 0 (0.0%) | 0 (0.0%) |
| 60 to 89 Minutes | 0 (0.0%) | 0 (0.0%) |
| 90 or more Minutes | 0 (0.0%) | 0 (0.0%) |
Time of Departure to Work by Sex in Langlois
The most frequent times of departure to work in Langlois are 7:00 AM to 7:29 AM (11, 100.0%) for males and 8:30 AM to 8:59 AM (26, 100.0%) for females.
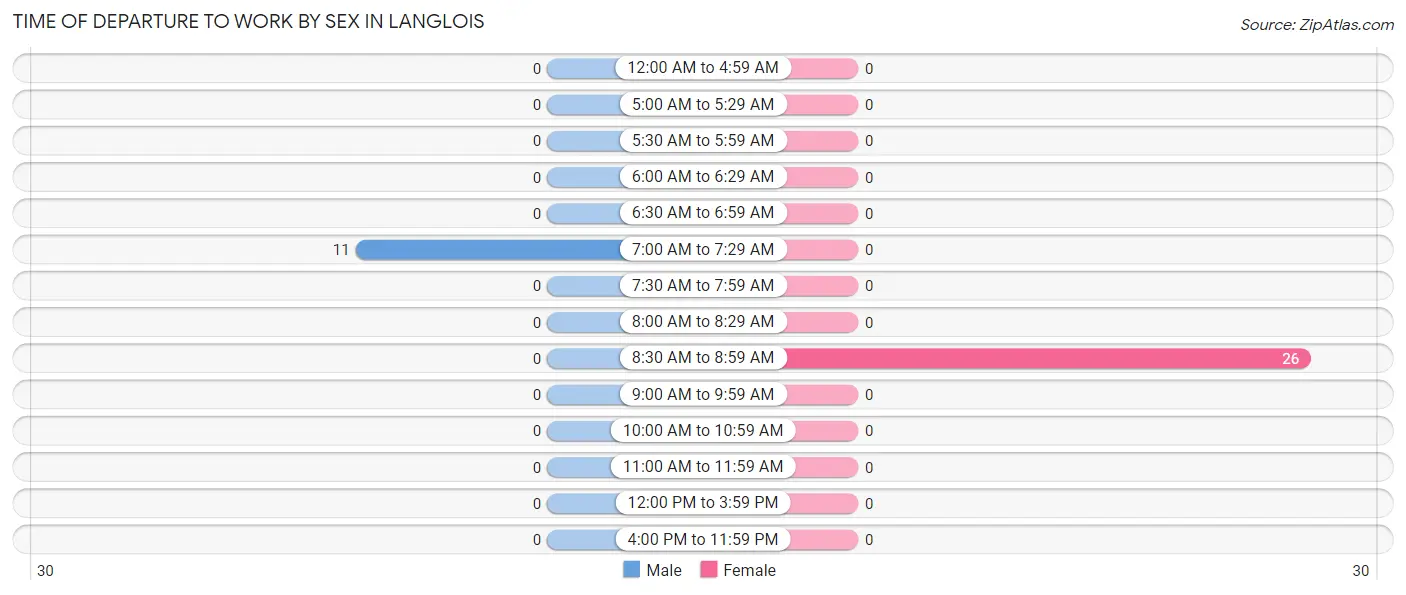
| Time of Departure | Male | Female |
| 12:00 AM to 4:59 AM | 0 (0.0%) | 0 (0.0%) |
| 5:00 AM to 5:29 AM | 0 (0.0%) | 0 (0.0%) |
| 5:30 AM to 5:59 AM | 0 (0.0%) | 0 (0.0%) |
| 6:00 AM to 6:29 AM | 0 (0.0%) | 0 (0.0%) |
| 6:30 AM to 6:59 AM | 0 (0.0%) | 0 (0.0%) |
| 7:00 AM to 7:29 AM | 11 (100.0%) | 0 (0.0%) |
| 7:30 AM to 7:59 AM | 0 (0.0%) | 0 (0.0%) |
| 8:00 AM to 8:29 AM | 0 (0.0%) | 0 (0.0%) |
| 8:30 AM to 8:59 AM | 0 (0.0%) | 26 (100.0%) |
| 9:00 AM to 9:59 AM | 0 (0.0%) | 0 (0.0%) |
| 10:00 AM to 10:59 AM | 0 (0.0%) | 0 (0.0%) |
| 11:00 AM to 11:59 AM | 0 (0.0%) | 0 (0.0%) |
| 12:00 PM to 3:59 PM | 0 (0.0%) | 0 (0.0%) |
| 4:00 PM to 11:59 PM | 0 (0.0%) | 0 (0.0%) |
| Total | 11 (100.0%) | 26 (100.0%) |
Housing Occupancy in Langlois
Occupancy by Ownership in Langlois
Of the total 180 dwellings in Langlois, owner-occupied units account for 180 (100.0%), while renter-occupied units make up 0 (0.0%).
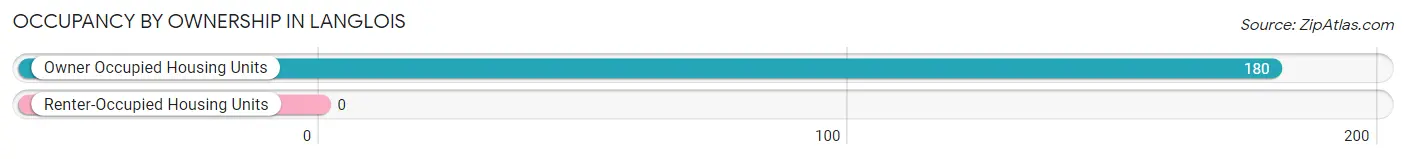
| Occupancy | # Housing Units | % Housing Units |
| Owner Occupied Housing Units | 180 | 100.0% |
| Renter-Occupied Housing Units | 0 | 0.0% |
| Total Occupied Housing Units | 180 | 100.0% |
Occupancy by Household Size in Langlois
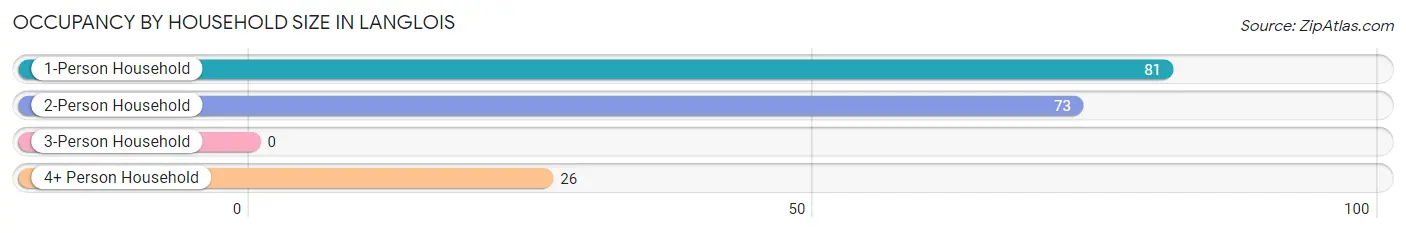
| Household Size | # Housing Units | % Housing Units |
| 1-Person Household | 81 | 45.0% |
| 2-Person Household | 73 | 40.6% |
| 3-Person Household | 0 | 0.0% |
| 4+ Person Household | 26 | 14.4% |
| Total Housing Units | 180 | 100.0% |
Occupancy by Ownership by Household Size in Langlois
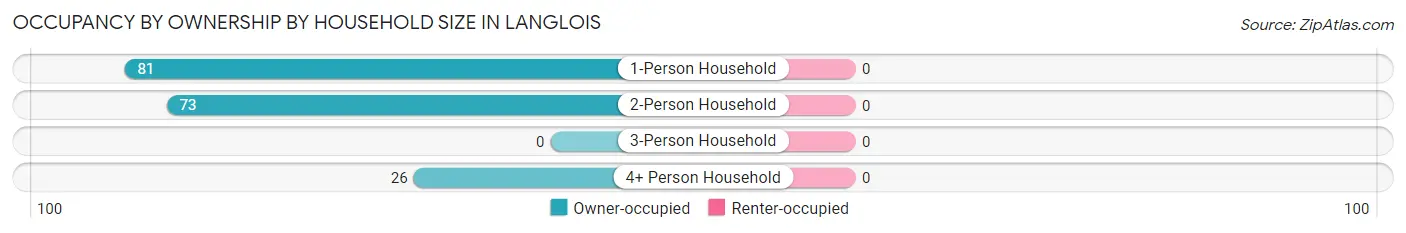
| Household Size | Owner-occupied | Renter-occupied |
| 1-Person Household | 81 (100.0%) | 0 (0.0%) |
| 2-Person Household | 73 (100.0%) | 0 (0.0%) |
| 3-Person Household | 0 (0.0%) | 0 (0.0%) |
| 4+ Person Household | 26 (100.0%) | 0 (0.0%) |
| Total Housing Units | 180 (100.0%) | 0 (0.0%) |
Occupancy by Educational Attainment in Langlois
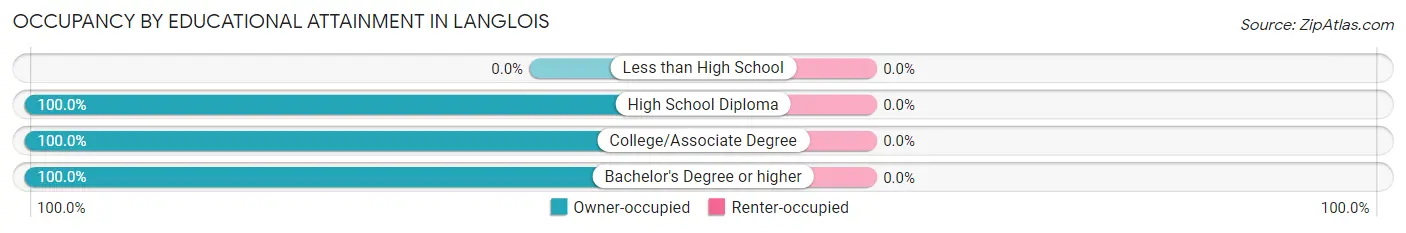
| Household Size | Owner-occupied | Renter-occupied |
| Less than High School | 0 (0.0%) | 0 (0.0%) |
| High School Diploma | 25 (100.0%) | 0 (0.0%) |
| College/Associate Degree | 57 (100.0%) | 0 (0.0%) |
| Bachelor's Degree or higher | 98 (100.0%) | 0 (0.0%) |
Occupancy by Age of Householder in Langlois
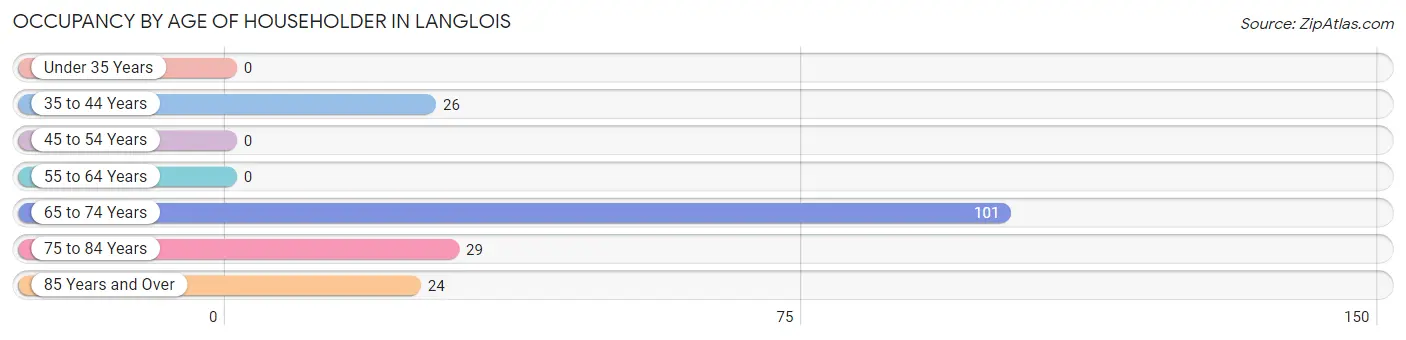
| Age Bracket | # Households | % Households |
| Under 35 Years | 0 | 0.0% |
| 35 to 44 Years | 26 | 14.4% |
| 45 to 54 Years | 0 | 0.0% |
| 55 to 64 Years | 0 | 0.0% |
| 65 to 74 Years | 101 | 56.1% |
| 75 to 84 Years | 29 | 16.1% |
| 85 Years and Over | 24 | 13.3% |
| Total | 180 | 100.0% |
Housing Finances in Langlois
Median Income by Occupancy in Langlois
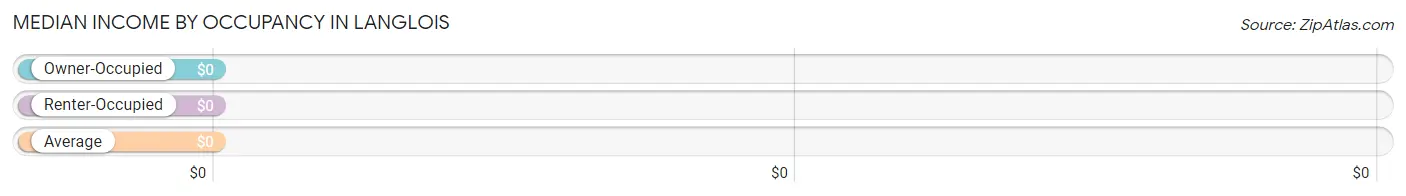
| Occupancy Type | # Households | Median Income |
| Owner-Occupied | 180 (100.0%) | $0 |
| Renter-Occupied | 0 (0.0%) | $0 |
| Average | 180 (100.0%) | $0 |
Occupancy by Householder Income Bracket in Langlois
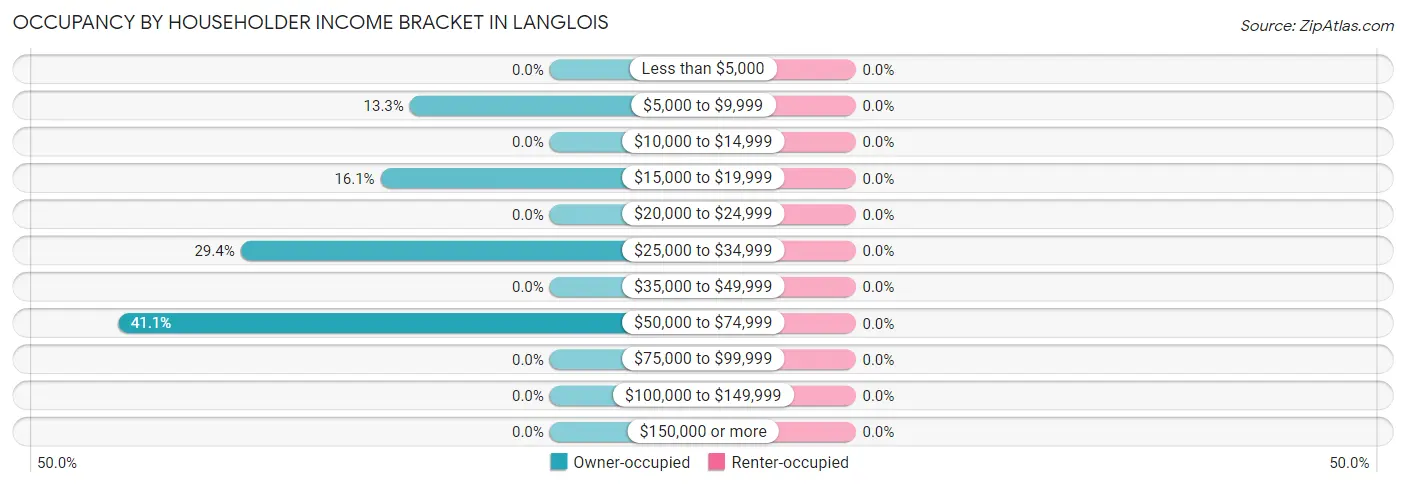
| Income Bracket | Owner-occupied | Renter-occupied |
| Less than $5,000 | 0 (0.0%) | 0 (0.0%) |
| $5,000 to $9,999 | 24 (13.3%) | 0 (0.0%) |
| $10,000 to $14,999 | 0 (0.0%) | 0 (0.0%) |
| $15,000 to $19,999 | 29 (16.1%) | 0 (0.0%) |
| $20,000 to $24,999 | 0 (0.0%) | 0 (0.0%) |
| $25,000 to $34,999 | 53 (29.4%) | 0 (0.0%) |
| $35,000 to $49,999 | 0 (0.0%) | 0 (0.0%) |
| $50,000 to $74,999 | 74 (41.1%) | 0 (0.0%) |
| $75,000 to $99,999 | 0 (0.0%) | 0 (0.0%) |
| $100,000 to $149,999 | 0 (0.0%) | 0 (0.0%) |
| $150,000 or more | 0 (0.0%) | 0 (0.0%) |
| Total | 180 (100.0%) | 0 (0.0%) |
Monthly Housing Cost Tiers in Langlois
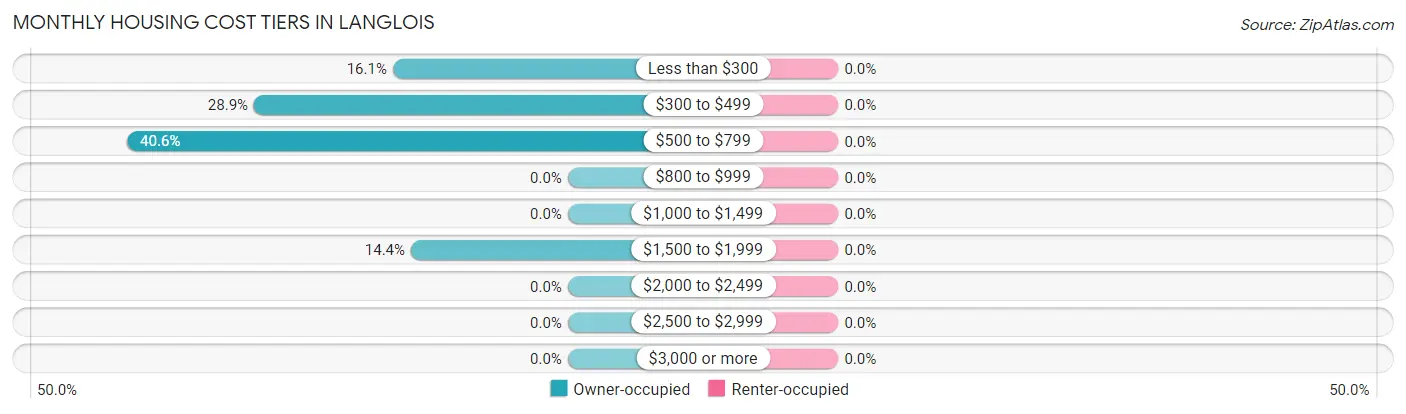
| Monthly Cost | Owner-occupied | Renter-occupied |
| Less than $300 | 29 (16.1%) | 0 (0.0%) |
| $300 to $499 | 52 (28.9%) | 0 (0.0%) |
| $500 to $799 | 73 (40.6%) | 0 (0.0%) |
| $800 to $999 | 0 (0.0%) | 0 (0.0%) |
| $1,000 to $1,499 | 0 (0.0%) | 0 (0.0%) |
| $1,500 to $1,999 | 26 (14.4%) | 0 (0.0%) |
| $2,000 to $2,499 | 0 (0.0%) | 0 (0.0%) |
| $2,500 to $2,999 | 0 (0.0%) | 0 (0.0%) |
| $3,000 or more | 0 (0.0%) | 0 (0.0%) |
| Total | 180 (100.0%) | 0 (0.0%) |
Physical Housing Characteristics in Langlois
Housing Structures in Langlois
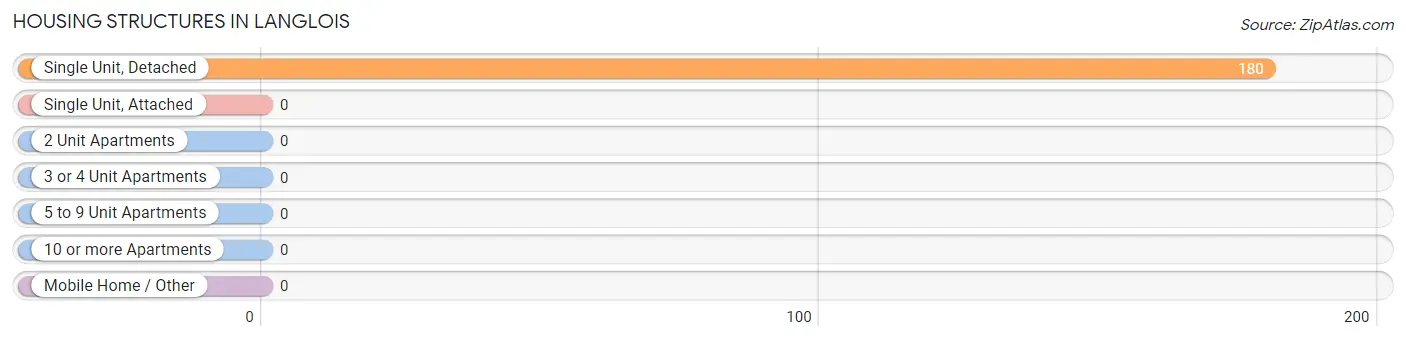
| Structure Type | # Housing Units | % Housing Units |
| Single Unit, Detached | 180 | 100.0% |
| Single Unit, Attached | 0 | 0.0% |
| 2 Unit Apartments | 0 | 0.0% |
| 3 or 4 Unit Apartments | 0 | 0.0% |
| 5 to 9 Unit Apartments | 0 | 0.0% |
| 10 or more Apartments | 0 | 0.0% |
| Mobile Home / Other | 0 | 0.0% |
| Total | 180 | 100.0% |
Housing Structures by Occupancy in Langlois
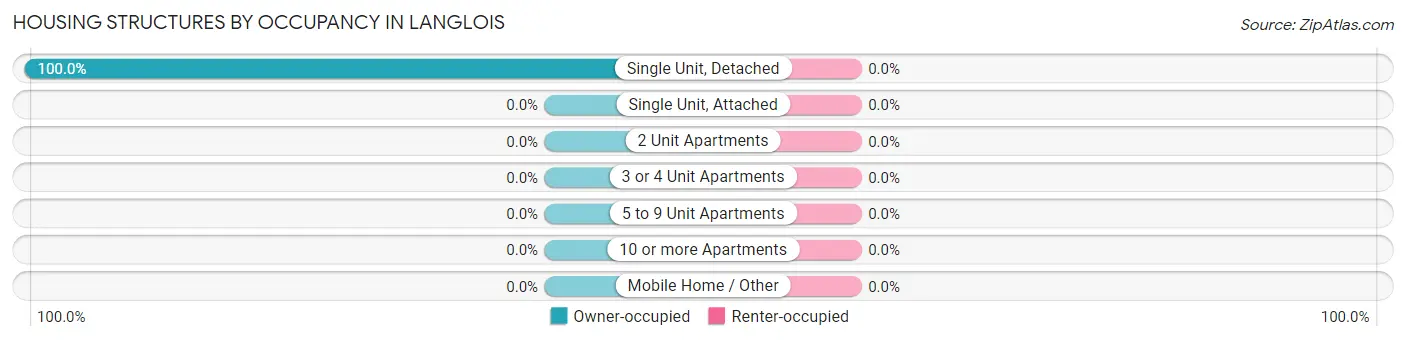
| Structure Type | Owner-occupied | Renter-occupied |
| Single Unit, Detached | 180 (100.0%) | 0 (0.0%) |
| Single Unit, Attached | 0 (0.0%) | 0 (0.0%) |
| 2 Unit Apartments | 0 (0.0%) | 0 (0.0%) |
| 3 or 4 Unit Apartments | 0 (0.0%) | 0 (0.0%) |
| 5 to 9 Unit Apartments | 0 (0.0%) | 0 (0.0%) |
| 10 or more Apartments | 0 (0.0%) | 0 (0.0%) |
| Mobile Home / Other | 0 (0.0%) | 0 (0.0%) |
| Total | 180 (100.0%) | 0 (0.0%) |
Housing Structures by Number of Rooms in Langlois
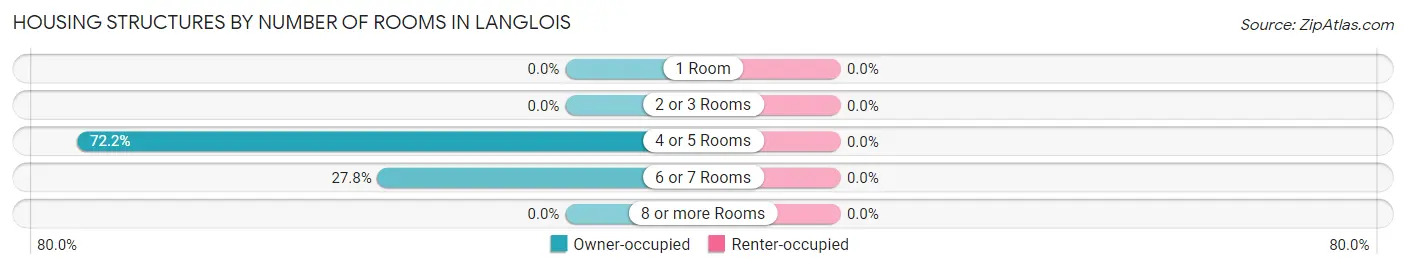
| Number of Rooms | Owner-occupied | Renter-occupied |
| 1 Room | 0 (0.0%) | 0 (0.0%) |
| 2 or 3 Rooms | 0 (0.0%) | 0 (0.0%) |
| 4 or 5 Rooms | 130 (72.2%) | 0 (0.0%) |
| 6 or 7 Rooms | 50 (27.8%) | 0 (0.0%) |
| 8 or more Rooms | 0 (0.0%) | 0 (0.0%) |
| Total | 180 (100.0%) | 0 (0.0%) |
Housing Structure by Heating Type in Langlois
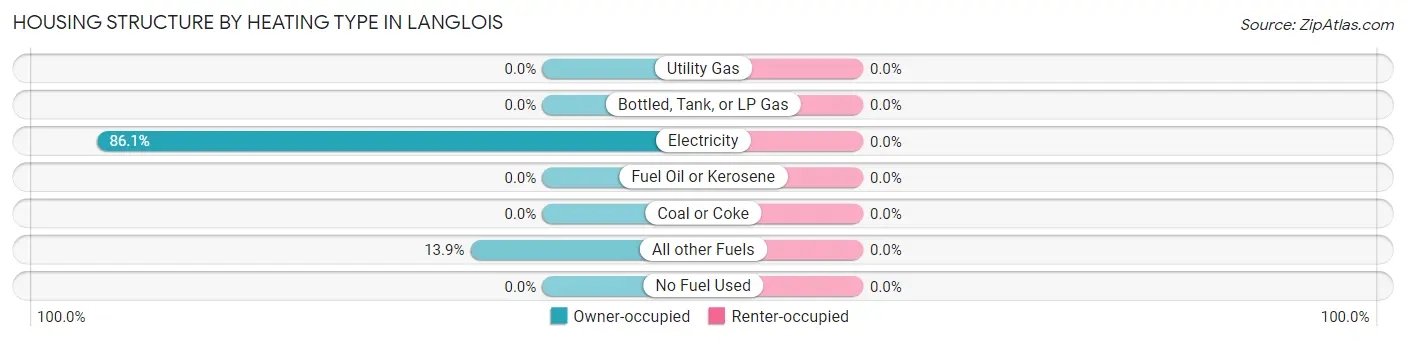
| Heating Type | Owner-occupied | Renter-occupied |
| Utility Gas | 0 (0.0%) | 0 (0.0%) |
| Bottled, Tank, or LP Gas | 0 (0.0%) | 0 (0.0%) |
| Electricity | 155 (86.1%) | 0 (0.0%) |
| Fuel Oil or Kerosene | 0 (0.0%) | 0 (0.0%) |
| Coal or Coke | 0 (0.0%) | 0 (0.0%) |
| All other Fuels | 25 (13.9%) | 0 (0.0%) |
| No Fuel Used | 0 (0.0%) | 0 (0.0%) |
| Total | 180 (100.0%) | 0 (0.0%) |
Household Vehicle Usage in Langlois
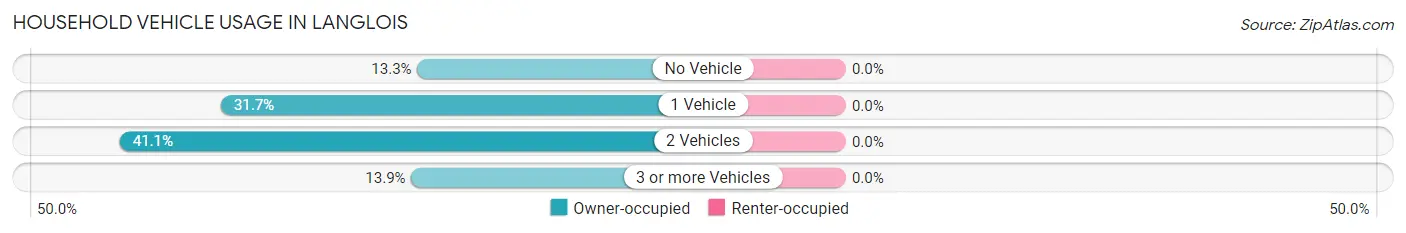
| Vehicles per Household | Owner-occupied | Renter-occupied |
| No Vehicle | 24 (13.3%) | 0 (0.0%) |
| 1 Vehicle | 57 (31.7%) | 0 (0.0%) |
| 2 Vehicles | 74 (41.1%) | 0 (0.0%) |
| 3 or more Vehicles | 25 (13.9%) | 0 (0.0%) |
| Total | 180 (100.0%) | 0 (0.0%) |
Real Estate & Mortgages in Langlois
Real Estate and Mortgage Overview in Langlois
| Characteristic | Without Mortgage | With Mortgage |
| Housing Units | 106 | 74 |
| Median Property Value | $293,100 | $0 |
| Median Household Income | $22,500 | $0 |
| Monthly Housing Costs | $375 | $0 |
| Real Estate Taxes | $1,893 | $0 |
Property Value by Mortgage Status in Langlois
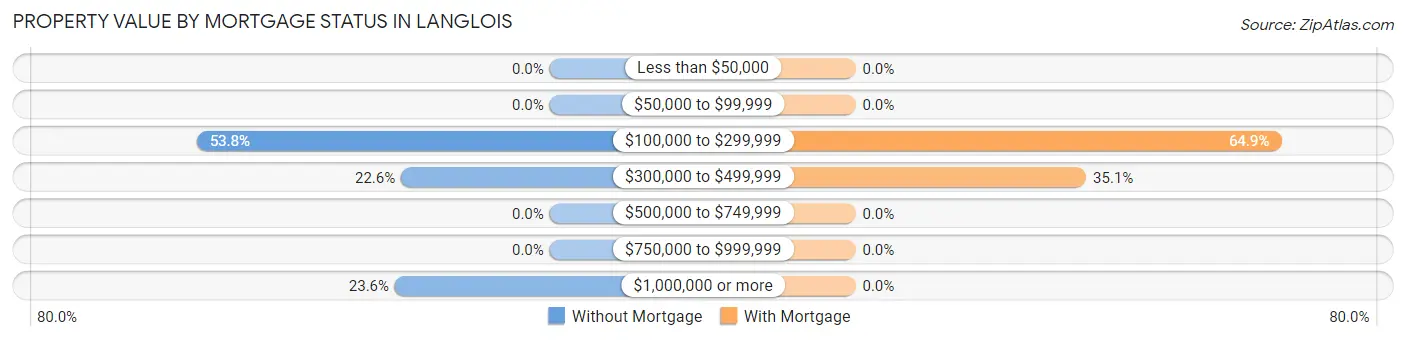
| Property Value | Without Mortgage | With Mortgage |
| Less than $50,000 | 0 (0.0%) | 0 (0.0%) |
| $50,000 to $99,999 | 0 (0.0%) | 0 (0.0%) |
| $100,000 to $299,999 | 57 (53.8%) | 48 (64.9%) |
| $300,000 to $499,999 | 24 (22.6%) | 26 (35.1%) |
| $500,000 to $749,999 | 0 (0.0%) | 0 (0.0%) |
| $750,000 to $999,999 | 0 (0.0%) | 0 (0.0%) |
| $1,000,000 or more | 25 (23.6%) | 0 (0.0%) |
| Total | 106 (100.0%) | 74 (100.0%) |
Household Income by Mortgage Status in Langlois
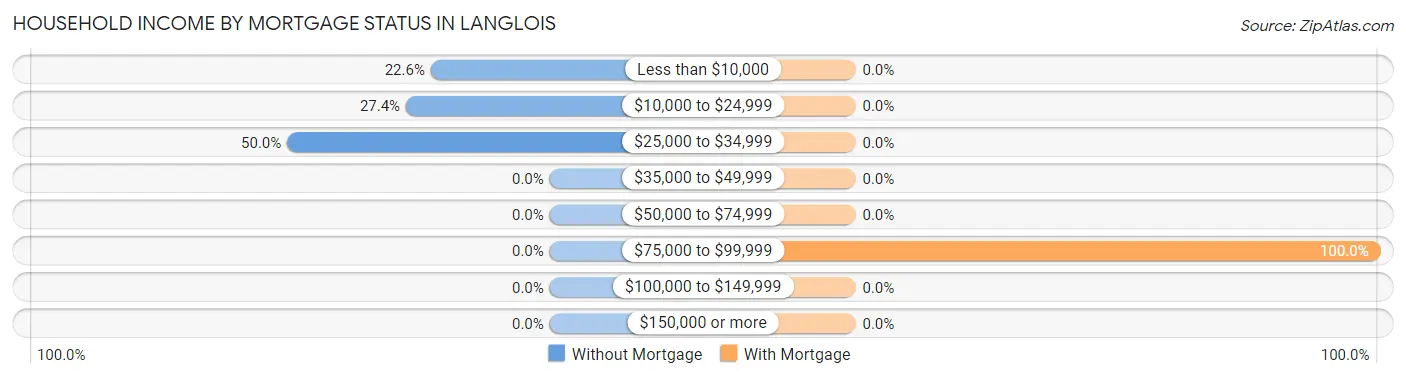
| Household Income | Without Mortgage | With Mortgage |
| Less than $10,000 | 24 (22.6%) | 0 (0.0%) |
| $10,000 to $24,999 | 29 (27.4%) | 0 (0.0%) |
| $25,000 to $34,999 | 53 (50.0%) | 0 (0.0%) |
| $35,000 to $49,999 | 0 (0.0%) | 0 (0.0%) |
| $50,000 to $74,999 | 0 (0.0%) | 0 (0.0%) |
| $75,000 to $99,999 | 0 (0.0%) | 74 (100.0%) |
| $100,000 to $149,999 | 0 (0.0%) | 0 (0.0%) |
| $150,000 or more | 0 (0.0%) | 0 (0.0%) |
| Total | 106 (100.0%) | 74 (100.0%) |
Property Value to Household Income Ratio in Langlois
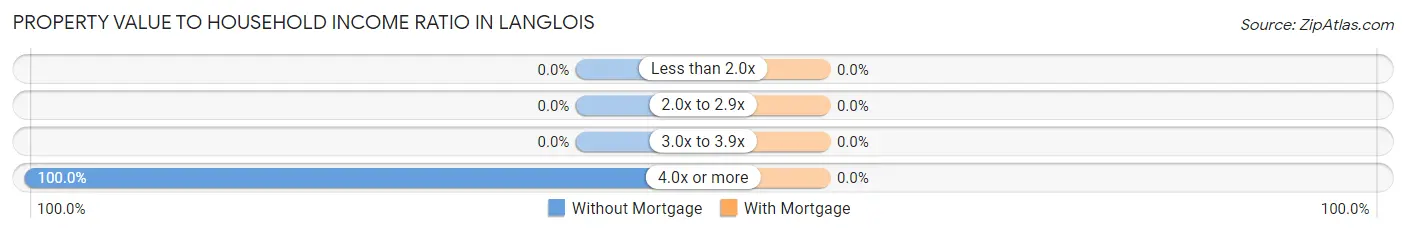
| Value-to-Income Ratio | Without Mortgage | With Mortgage |
| Less than 2.0x | 0 (0.0%) | 0 (0.0%) |
| 2.0x to 2.9x | 0 (0.0%) | 0 (0.0%) |
| 3.0x to 3.9x | 0 (0.0%) | 0 (0.0%) |
| 4.0x or more | 106 (100.0%) | 0 (0.0%) |
| Total | 106 (100.0%) | 74 (100.0%) |
Real Estate Taxes by Mortgage Status in Langlois
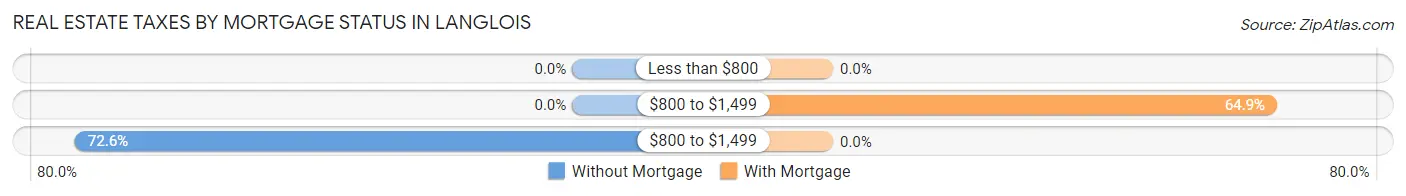
| Property Taxes | Without Mortgage | With Mortgage |
| Less than $800 | 0 (0.0%) | 0 (0.0%) |
| $800 to $1,499 | 0 (0.0%) | 48 (64.9%) |
| $800 to $1,499 | 77 (72.6%) | 0 (0.0%) |
| Total | 106 (100.0%) | 74 (100.0%) |
Health & Disability in Langlois
Health Insurance Coverage by Age in Langlois
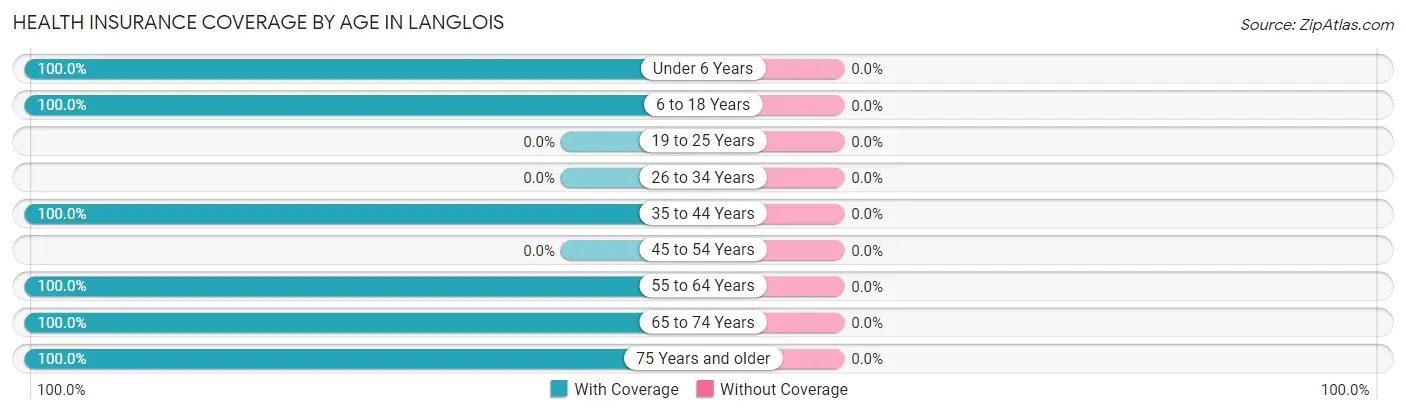
| Age Bracket | With Coverage | Without Coverage |
| Under 6 Years | 12 (100.0%) | 0 (0.0%) |
| 6 to 18 Years | 31 (100.0%) | 0 (0.0%) |
| 19 to 25 Years | 0 (0.0%) | 0 (0.0%) |
| 26 to 34 Years | 0 (0.0%) | 0 (0.0%) |
| 35 to 44 Years | 26 (100.0%) | 0 (0.0%) |
| 45 to 54 Years | 0 (0.0%) | 0 (0.0%) |
| 55 to 64 Years | 38 (100.0%) | 0 (0.0%) |
| 65 to 74 Years | 140 (100.0%) | 0 (0.0%) |
| 75 Years and older | 53 (100.0%) | 0 (0.0%) |
| Total | 300 (100.0%) | 0 (0.0%) |
Health Insurance Coverage by Citizenship Status in Langlois
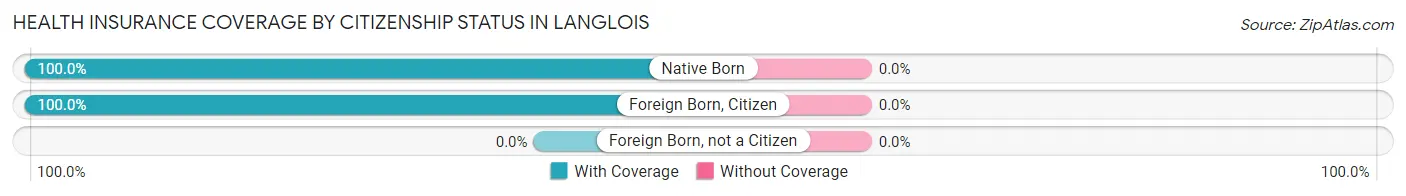
| Citizenship Status | With Coverage | Without Coverage |
| Native Born | 12 (100.0%) | 0 (0.0%) |
| Foreign Born, Citizen | 31 (100.0%) | 0 (0.0%) |
| Foreign Born, not a Citizen | 0 (0.0%) | 0 (0.0%) |
Health Insurance Coverage by Household Income in Langlois
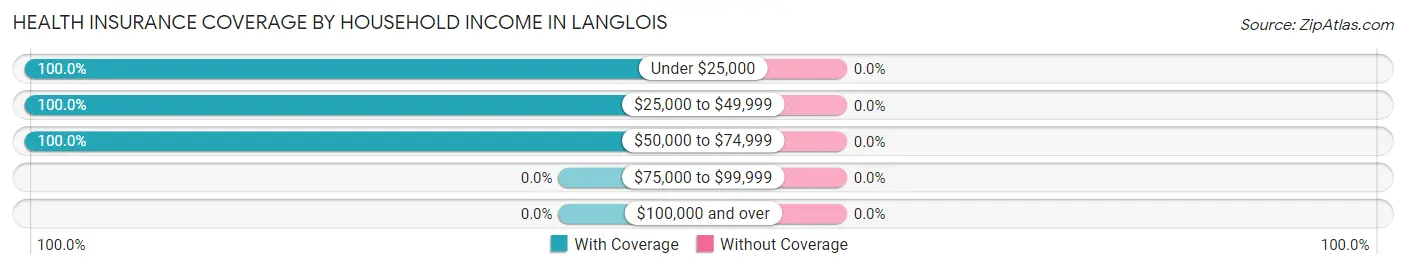
| Household Income | With Coverage | Without Coverage |
| Under $25,000 | 53 (100.0%) | 0 (0.0%) |
| $25,000 to $49,999 | 80 (100.0%) | 0 (0.0%) |
| $50,000 to $74,999 | 167 (100.0%) | 0 (0.0%) |
| $75,000 to $99,999 | 0 (0.0%) | 0 (0.0%) |
| $100,000 and over | 0 (0.0%) | 0 (0.0%) |
Public vs Private Health Insurance Coverage by Age in Langlois
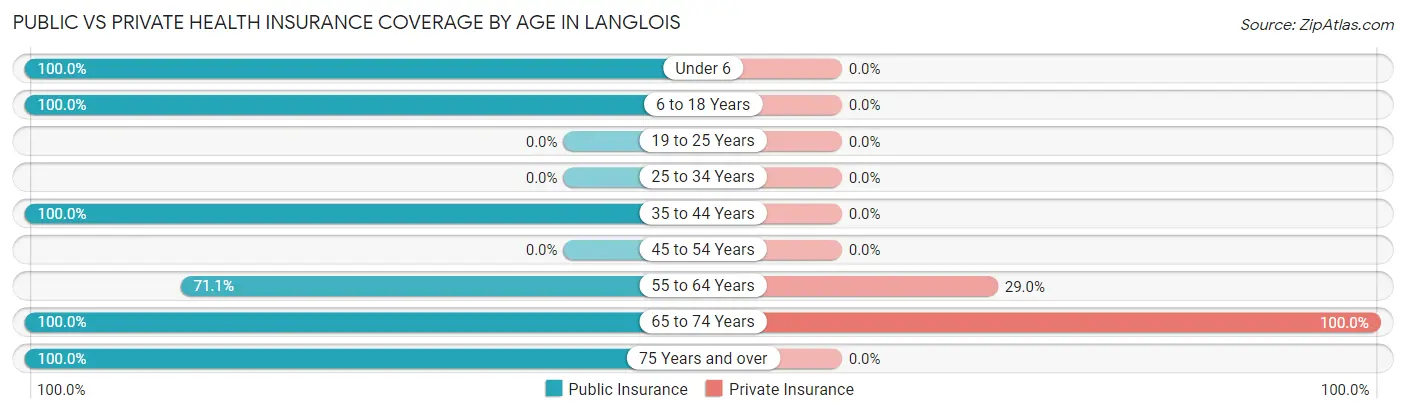
| Age Bracket | Public Insurance | Private Insurance |
| Under 6 | 12 (100.0%) | 0 (0.0%) |
| 6 to 18 Years | 31 (100.0%) | 0 (0.0%) |
| 19 to 25 Years | 0 (0.0%) | 0 (0.0%) |
| 25 to 34 Years | 0 (0.0%) | 0 (0.0%) |
| 35 to 44 Years | 26 (100.0%) | 0 (0.0%) |
| 45 to 54 Years | 0 (0.0%) | 0 (0.0%) |
| 55 to 64 Years | 27 (71.1%) | 11 (28.9%) |
| 65 to 74 Years | 140 (100.0%) | 140 (100.0%) |
| 75 Years and over | 53 (100.0%) | 0 (0.0%) |
| Total | 289 (96.3%) | 151 (50.3%) |
Disability Status by Sex by Age in Langlois
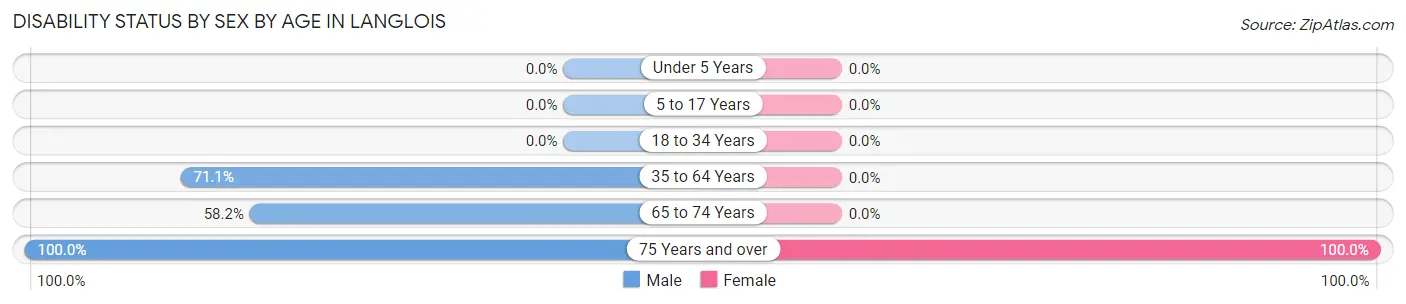
| Age Bracket | Male | Female |
| Under 5 Years | 0 (0.0%) | 0 (0.0%) |
| 5 to 17 Years | 0 (0.0%) | 0 (0.0%) |
| 18 to 34 Years | 0 (0.0%) | 0 (0.0%) |
| 35 to 64 Years | 27 (71.1%) | 0 (0.0%) |
| 65 to 74 Years | 39 (58.2%) | 0 (0.0%) |
| 75 Years and over | 29 (100.0%) | 24 (100.0%) |
Disability Class by Sex by Age in Langlois
Disability Class: Hearing Difficulty
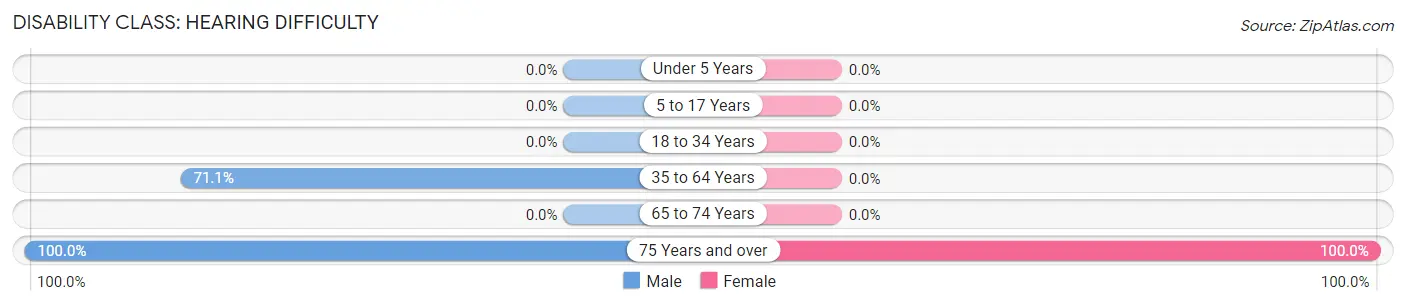
| Age Bracket | Male | Female |
| Under 5 Years | 0 (0.0%) | 0 (0.0%) |
| 5 to 17 Years | 0 (0.0%) | 0 (0.0%) |
| 18 to 34 Years | 0 (0.0%) | 0 (0.0%) |
| 35 to 64 Years | 27 (71.1%) | 0 (0.0%) |
| 65 to 74 Years | 0 (0.0%) | 0 (0.0%) |
| 75 Years and over | 29 (100.0%) | 24 (100.0%) |
Disability Class: Vision Difficulty
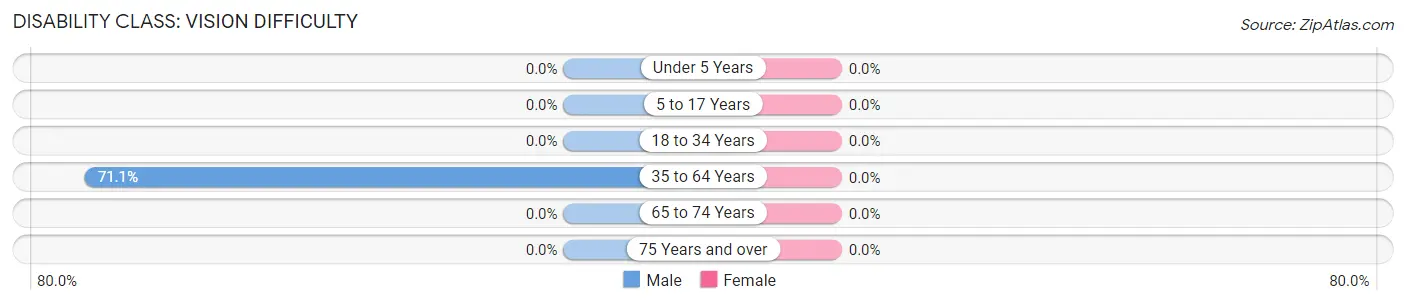
| Age Bracket | Male | Female |
| Under 5 Years | 0 (0.0%) | 0 (0.0%) |
| 5 to 17 Years | 0 (0.0%) | 0 (0.0%) |
| 18 to 34 Years | 0 (0.0%) | 0 (0.0%) |
| 35 to 64 Years | 27 (71.1%) | 0 (0.0%) |
| 65 to 74 Years | 0 (0.0%) | 0 (0.0%) |
| 75 Years and over | 0 (0.0%) | 0 (0.0%) |
Disability Class: Cognitive Difficulty
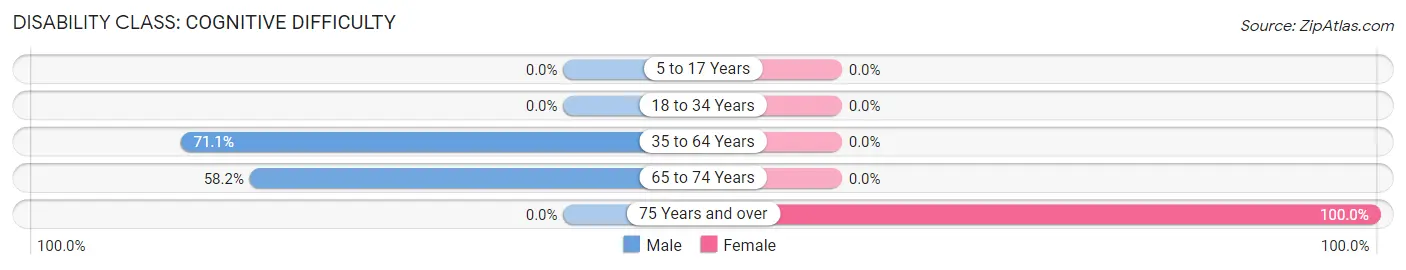
| Age Bracket | Male | Female |
| 5 to 17 Years | 0 (0.0%) | 0 (0.0%) |
| 18 to 34 Years | 0 (0.0%) | 0 (0.0%) |
| 35 to 64 Years | 27 (71.1%) | 0 (0.0%) |
| 65 to 74 Years | 39 (58.2%) | 0 (0.0%) |
| 75 Years and over | 0 (0.0%) | 24 (100.0%) |
Disability Class: Ambulatory Difficulty
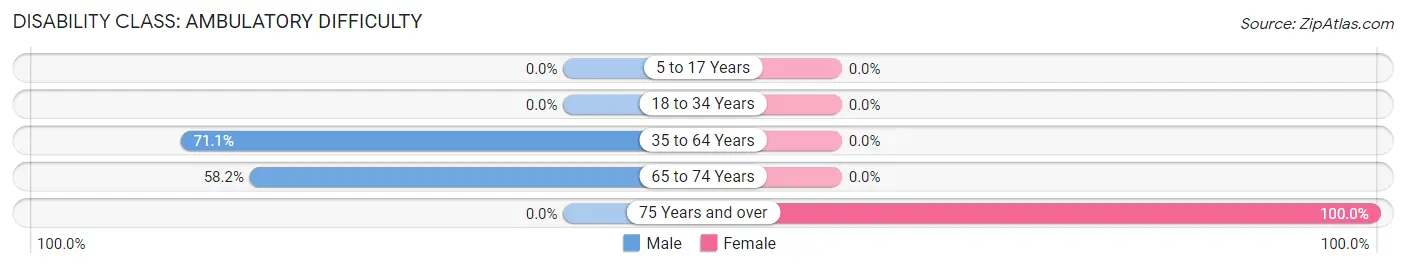
| Age Bracket | Male | Female |
| 5 to 17 Years | 0 (0.0%) | 0 (0.0%) |
| 18 to 34 Years | 0 (0.0%) | 0 (0.0%) |
| 35 to 64 Years | 27 (71.1%) | 0 (0.0%) |
| 65 to 74 Years | 39 (58.2%) | 0 (0.0%) |
| 75 Years and over | 0 (0.0%) | 24 (100.0%) |
Disability Class: Self-Care Difficulty
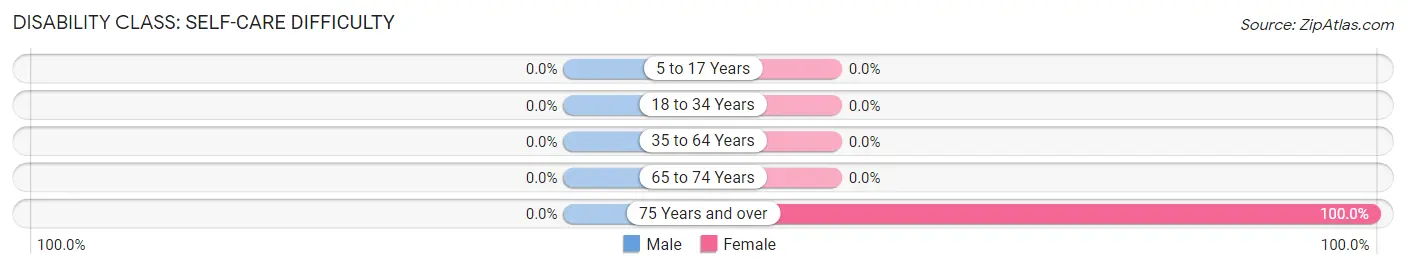
| Age Bracket | Male | Female |
| 5 to 17 Years | 0 (0.0%) | 0 (0.0%) |
| 18 to 34 Years | 0 (0.0%) | 0 (0.0%) |
| 35 to 64 Years | 0 (0.0%) | 0 (0.0%) |
| 65 to 74 Years | 0 (0.0%) | 0 (0.0%) |
| 75 Years and over | 0 (0.0%) | 24 (100.0%) |
Technology Access in Langlois
Computing Device Access in Langlois
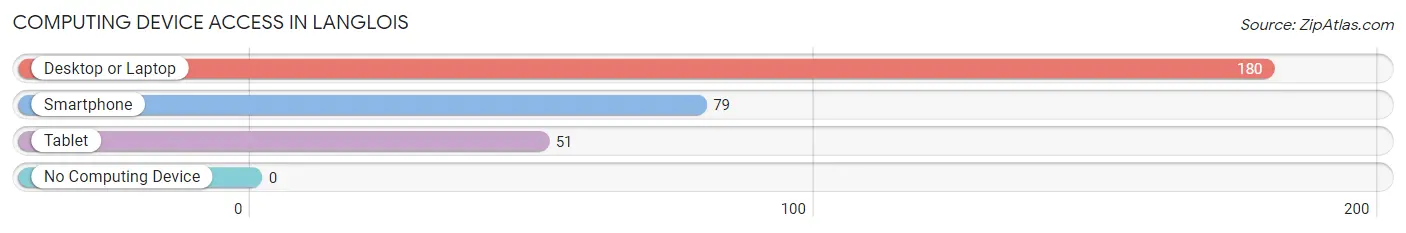
| Device Type | # Households | % Households |
| Desktop or Laptop | 180 | 100.0% |
| Smartphone | 79 | 43.9% |
| Tablet | 51 | 28.3% |
| No Computing Device | 0 | 0.0% |
| Total | 180 | 100.0% |
Internet Access in Langlois
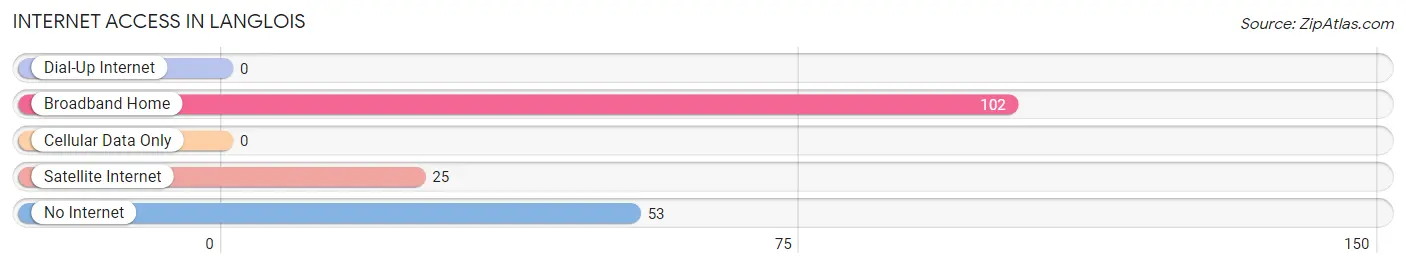
| Internet Type | # Households | % Households |
| Dial-Up Internet | 0 | 0.0% |
| Broadband Home | 102 | 56.7% |
| Cellular Data Only | 0 | 0.0% |
| Satellite Internet | 25 | 13.9% |
| No Internet | 53 | 29.4% |
| Total | 180 | 100.0% |
Langlois Summary
Langlois is a small unincorporated community located in the southwestern corner of Oregon, in the United States. It is situated in the northern part of Coos County, approximately 20 miles south of Bandon and 25 miles north of Port Orford. The population of Langlois was estimated to be around 500 in 2020.
History
Langlois was founded in 1891 by French-Canadian settlers who had come to the area to work in the timber industry. The town was named after the Langlois family, who were among the first settlers. The town was originally a logging camp, but it soon grew into a small farming community. The first post office was established in 1892, and the first school was built in 1895.
In the early 1900s, Langlois was a thriving community with a population of over 500 people. The town had several stores, a hotel, a blacksmith shop, a sawmill, and a lumber mill. The town also had a newspaper, the Langlois News, which was published from 1902 to 1910.
In the 1920s, the timber industry began to decline, and the population of Langlois began to decline as well. By the 1940s, the population had dropped to around 200 people. The town continued to decline until the 1970s, when the population began to slowly increase again.
Geography
Langlois is located in the northern part of Coos County, in the southwestern corner of Oregon. It is situated on the banks of the Coquille River, approximately 20 miles south of Bandon and 25 miles north of Port Orford. The town is surrounded by forests and rolling hills, and is located in the coastal range of the Pacific Northwest.
The climate in Langlois is mild and temperate, with warm summers and cool winters. The average annual temperature is around 50°F, and the average annual precipitation is around 40 inches.
Economy
The economy of Langlois is largely based on agriculture and forestry. The town is home to several farms, which produce a variety of crops, including hay, wheat, oats, and vegetables. The town also has several sawmills and lumber mills, which produce lumber for the local market.
In addition to agriculture and forestry, Langlois is also home to several small businesses, including restaurants, stores, and a gas station. The town also has a post office, a library, and a community center.
Demographics
As of 2020, the population of Langlois was estimated to be around 500 people. The town is predominantly white, with a small Hispanic population. The median household income is around $35,000, and the median home value is around $150,000. The town has a high rate of poverty, with around 25% of the population living below the poverty line.
Common Questions
What is Per Capita Income in Langlois?
Per Capita income in Langlois is $19,494.
What is Inequality or Gini Index in Langlois?
Inequality or Gini Index in Langlois is 0.29.
What is the Total Population of Langlois?
Total Population of Langlois is 300.
What is the Total Male Population of Langlois?
Total Male Population of Langlois is 177.
What is the Total Female Population of Langlois?
Total Female Population of Langlois is 123.
What is the Ratio of Males per 100 Females in Langlois?
There are 143.90 Males per 100 Females in Langlois.
What is the Ratio of Females per 100 Males in Langlois?
There are 69.49 Females per 100 Males in Langlois.
What is the Median Population Age in Langlois?
Median Population Age in Langlois is 65.9 Years.
What is the Average Family Size in Langlois
Average Family Size in Langlois is 2.1 People.
What is the Average Household Size in Langlois
Average Household Size in Langlois is 1.7 People.
How Large is the Labor Force in Langlois?
There are 37 People in the Labor Forcein in Langlois.
What is the Percentage of People in the Labor Force in Langlois?
14.4% of People are in the Labor Force in Langlois.