Independence, OR Map & Demographics
Independence Map
Independence Overview
$27,180
PER CAPITA INCOME
$75,924
AVG FAMILY INCOME
$73,361
AVG HOUSEHOLD INCOME
15.0%
WAGE / INCOME GAP [ % ]
85.0¢/ $1
WAGE / INCOME GAP [ $ ]
0.38
INEQUALITY / GINI INDEX
9,981
TOTAL POPULATION
5,110
MALE POPULATION
4,871
FEMALE POPULATION
104.91
MALES / 100 FEMALES
95.32
FEMALES / 100 MALES
29.7
MEDIAN AGE
3.9
AVG FAMILY SIZE
3.3
AVG HOUSEHOLD SIZE
5,573
LABOR FORCE [ PEOPLE ]
72.2%
PERCENT IN LABOR FORCE
4.4%
UNEMPLOYMENT RATE
Independence Zip Codes
Independence Area Codes
Income in Independence
Income Overview in Independence
Per Capita Income in Independence is $27,180, while median incomes of families and households are $75,924 and $73,361 respectively.
| Characteristic | Number | Measure |
| Per Capita Income | 9,981 | $27,180 |
| Median Family Income | 2,099 | $75,924 |
| Mean Family Income | 2,099 | $88,202 |
| Median Household Income | 3,008 | $73,361 |
| Mean Household Income | 3,008 | $80,667 |
| Income Deficit | 2,099 | $0 |
| Wage / Income Gap (%) | 9,981 | 15.02% |
| Wage / Income Gap ($) | 9,981 | 84.98¢ per $1 |
| Gini / Inequality Index | 9,981 | 0.38 |
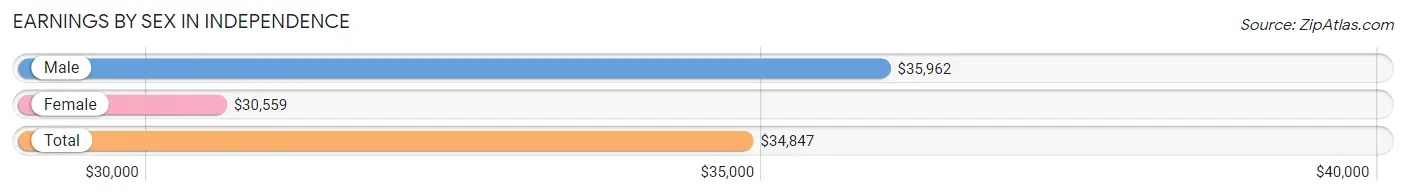
Earnings by Sex in Independence
Average Earnings in Independence are $34,847, $35,962 for men and $30,559 for women, a difference of 15.0%.
| Sex | Number | Average Earnings |
| Male | 3,285 (58.1%) | $35,962 |
| Female | 2,365 (41.9%) | $30,559 |
| Total | 5,650 (100.0%) | $34,847 |
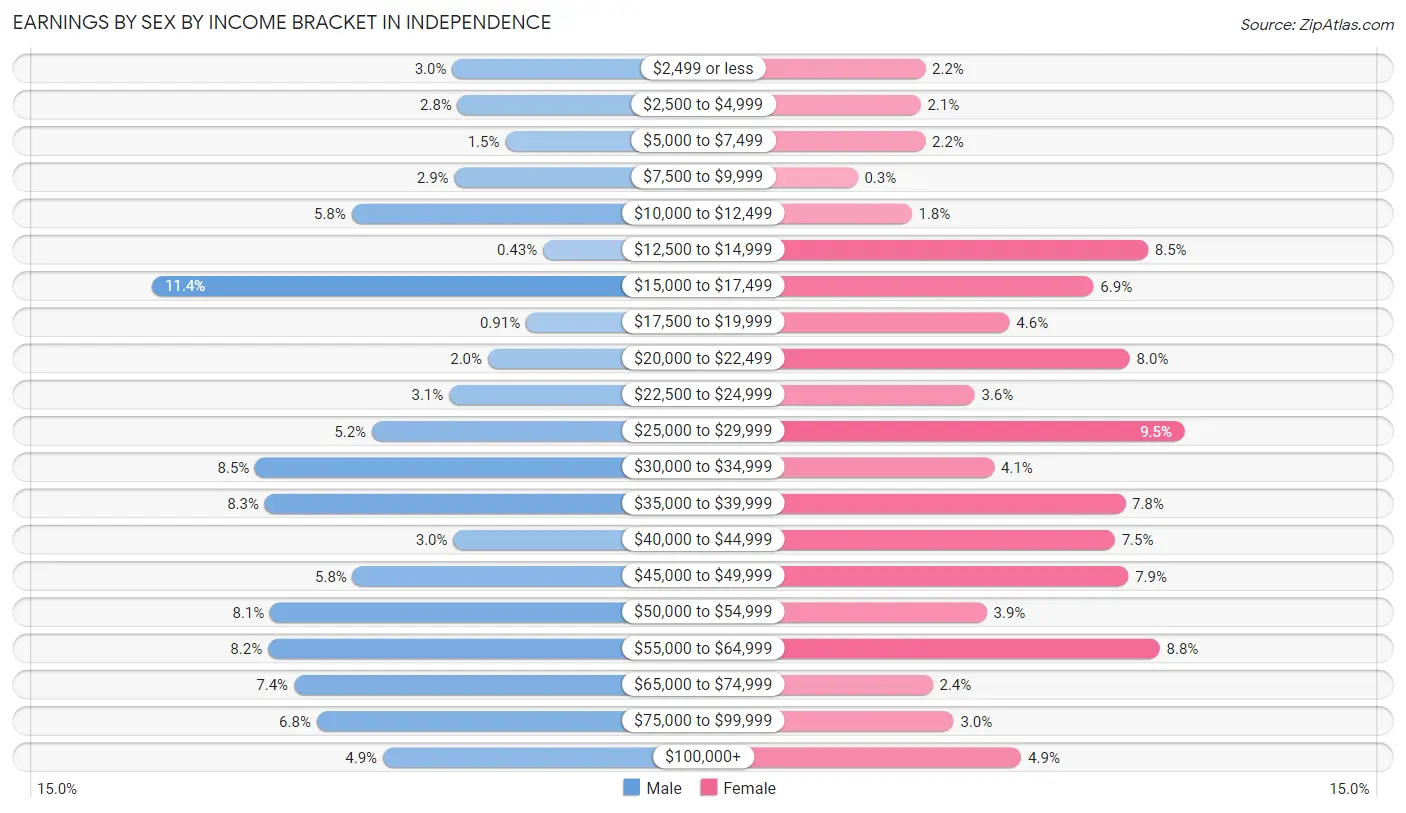
Earnings by Sex by Income Bracket in Independence
The most common earnings brackets in Independence are $15,000 to $17,499 for men (375 | 11.4%) and $25,000 to $29,999 for women (224 | 9.5%).
| Income | Male | Female |
| $2,499 or less | 98 (3.0%) | 52 (2.2%) |
| $2,500 to $4,999 | 93 (2.8%) | 49 (2.1%) |
| $5,000 to $7,499 | 49 (1.5%) | 52 (2.2%) |
| $7,500 to $9,999 | 96 (2.9%) | 7 (0.3%) |
| $10,000 to $12,499 | 191 (5.8%) | 43 (1.8%) |
| $12,500 to $14,999 | 14 (0.4%) | 200 (8.5%) |
| $15,000 to $17,499 | 375 (11.4%) | 164 (6.9%) |
| $17,500 to $19,999 | 30 (0.9%) | 108 (4.6%) |
| $20,000 to $22,499 | 65 (2.0%) | 188 (8.0%) |
| $22,500 to $24,999 | 101 (3.1%) | 85 (3.6%) |
| $25,000 to $29,999 | 172 (5.2%) | 224 (9.5%) |
| $30,000 to $34,999 | 280 (8.5%) | 98 (4.1%) |
| $35,000 to $39,999 | 271 (8.3%) | 185 (7.8%) |
| $40,000 to $44,999 | 97 (2.9%) | 178 (7.5%) |
| $45,000 to $49,999 | 190 (5.8%) | 187 (7.9%) |
| $50,000 to $54,999 | 266 (8.1%) | 93 (3.9%) |
| $55,000 to $64,999 | 268 (8.2%) | 208 (8.8%) |
| $65,000 to $74,999 | 244 (7.4%) | 57 (2.4%) |
| $75,000 to $99,999 | 223 (6.8%) | 71 (3.0%) |
| $100,000+ | 162 (4.9%) | 116 (4.9%) |
| Total | 3,285 (100.0%) | 2,365 (100.0%) |
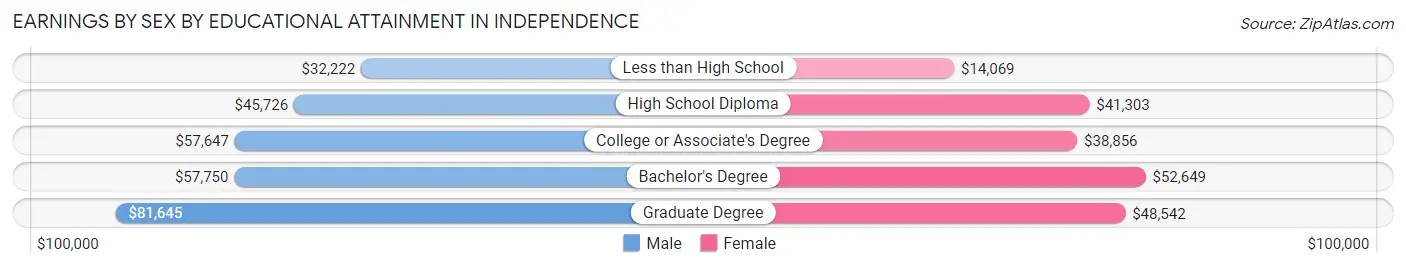
Earnings by Sex by Educational Attainment in Independence
Average earnings in Independence are $50,836 for men and $39,949 for women, a difference of 21.4%. Men with an educational attainment of graduate degree enjoy the highest average annual earnings of $81,645, while those with less than high school education earn the least with $32,222. Women with an educational attainment of bachelor's degree earn the most with the average annual earnings of $52,649, while those with less than high school education have the smallest earnings of $14,069.
| Educational Attainment | Male Income | Female Income |
| Less than High School | $32,222 | $14,069 |
| High School Diploma | $45,726 | $41,303 |
| College or Associate's Degree | $57,647 | $38,856 |
| Bachelor's Degree | $57,750 | $52,649 |
| Graduate Degree | $81,645 | $48,542 |
| Total | $50,836 | $39,949 |
Family Income in Independence
Family Income Brackets in Independence
According to the Independence family income data, there are 428 families falling into the $50,000 to $74,999 income range, which is the most common income bracket and makes up 20.4% of all families. Conversely, the less than $10,000 income bracket is the least frequent group with only 15 families (0.7%) belonging to this category.
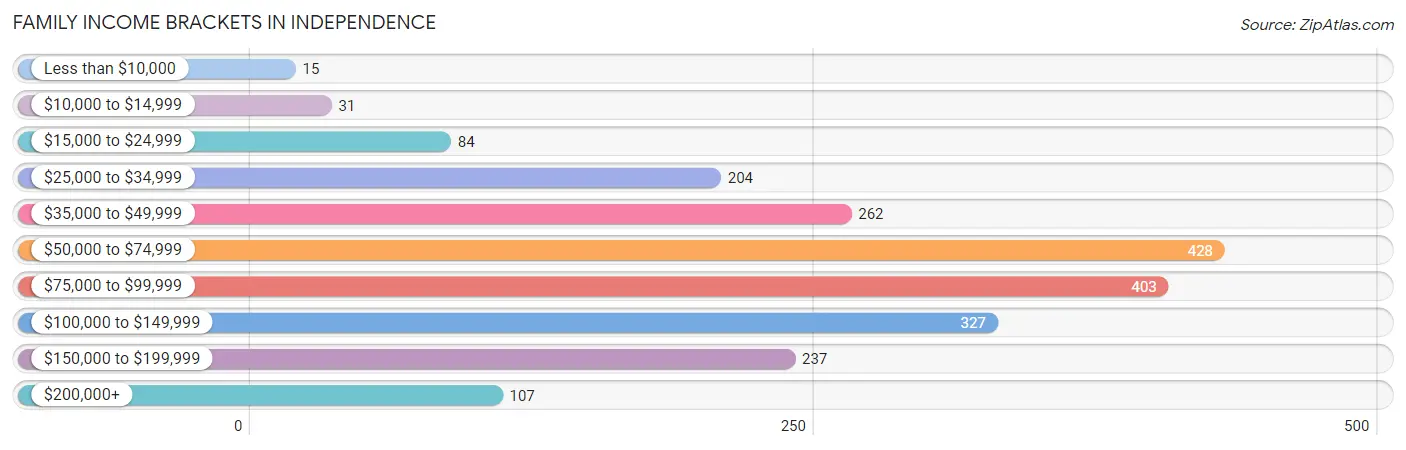
| Income Bracket | # Families | % Families |
| Less than $10,000 | 15 | 0.7% |
| $10,000 to $14,999 | 31 | 1.5% |
| $15,000 to $24,999 | 84 | 4.0% |
| $25,000 to $34,999 | 204 | 9.7% |
| $35,000 to $49,999 | 262 | 12.5% |
| $50,000 to $74,999 | 428 | 20.4% |
| $75,000 to $99,999 | 403 | 19.2% |
| $100,000 to $149,999 | 327 | 15.6% |
| $150,000 to $199,999 | 237 | 11.3% |
| $200,000+ | 107 | 5.1% |
Family Income by Famaliy Size in Independence
7+ person families (55 | 2.6%) account for the highest median family income in Independence with $173,641 per family, while 2-person families (790 | 37.6%) have the highest median income of $32,178 per family member.
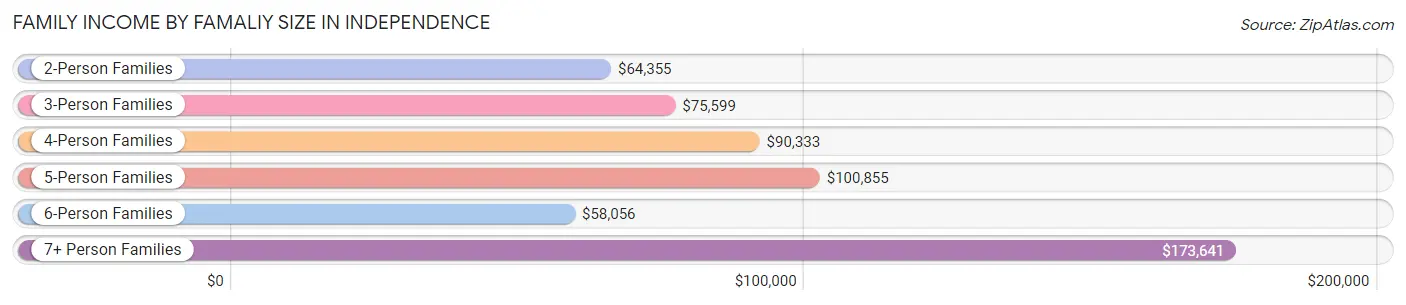
| Income Bracket | # Families | Median Income |
| 2-Person Families | 790 (37.6%) | $64,355 |
| 3-Person Families | 495 (23.6%) | $75,599 |
| 4-Person Families | 400 (19.1%) | $90,333 |
| 5-Person Families | 155 (7.4%) | $100,855 |
| 6-Person Families | 204 (9.7%) | $58,056 |
| 7+ Person Families | 55 (2.6%) | $173,641 |
| Total | 2,099 (100.0%) | $75,924 |
Family Income by Number of Earners in Independence
The median family income in Independence is $75,924, with families comprising 3+ earners (404) having the highest median family income of $152,656, while families with 1 earner (539) have the lowest median family income of $41,150, accounting for 19.3% and 25.7% of families, respectively.
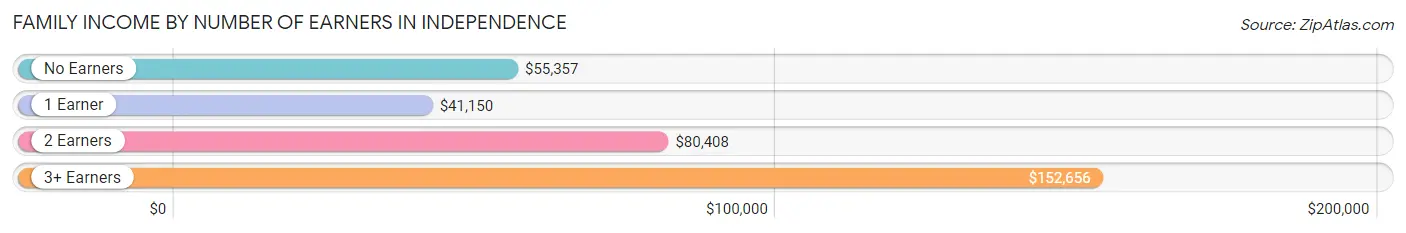
| Number of Earners | # Families | Median Income |
| No Earners | 222 (10.6%) | $55,357 |
| 1 Earner | 539 (25.7%) | $41,150 |
| 2 Earners | 934 (44.5%) | $80,408 |
| 3+ Earners | 404 (19.3%) | $152,656 |
| Total | 2,099 (100.0%) | $75,924 |
Household Income in Independence
Household Income Brackets in Independence
With 584 households falling in the category, the $75,000 to $99,999 income range is the most frequent in Independence, accounting for 19.4% of all households. In contrast, only 90 households (3.0%) fall into the $10,000 to $14,999 income bracket, making it the least populous group.
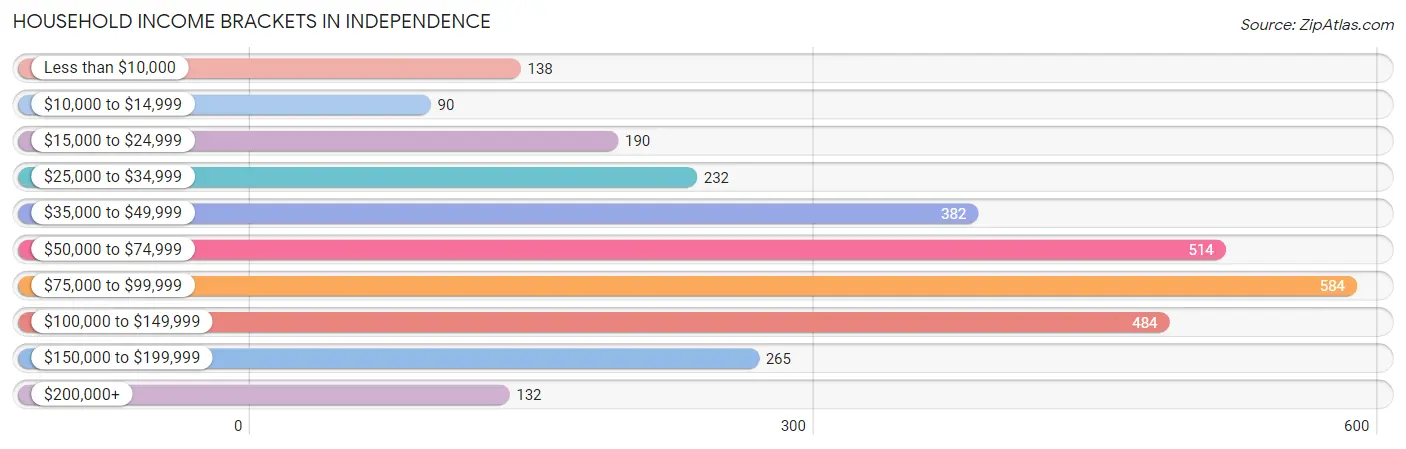
| Income Bracket | # Households | % Households |
| Less than $10,000 | 138 | 4.6% |
| $10,000 to $14,999 | 90 | 3.0% |
| $15,000 to $24,999 | 190 | 6.3% |
| $25,000 to $34,999 | 232 | 7.7% |
| $35,000 to $49,999 | 382 | 12.7% |
| $50,000 to $74,999 | 514 | 17.1% |
| $75,000 to $99,999 | 584 | 19.4% |
| $100,000 to $149,999 | 484 | 16.1% |
| $150,000 to $199,999 | 265 | 8.8% |
| $200,000+ | 132 | 4.4% |
Household Income by Householder Age in Independence
The median household income in Independence is $73,361, with the highest median household income of $85,169 found in the 25 to 44 years age bracket for the primary householder. A total of 1,133 households (37.7%) fall into this category. Meanwhile, the 65+ years age bracket for the primary householder has the lowest median household income of $41,429, with 566 households (18.8%) in this group.
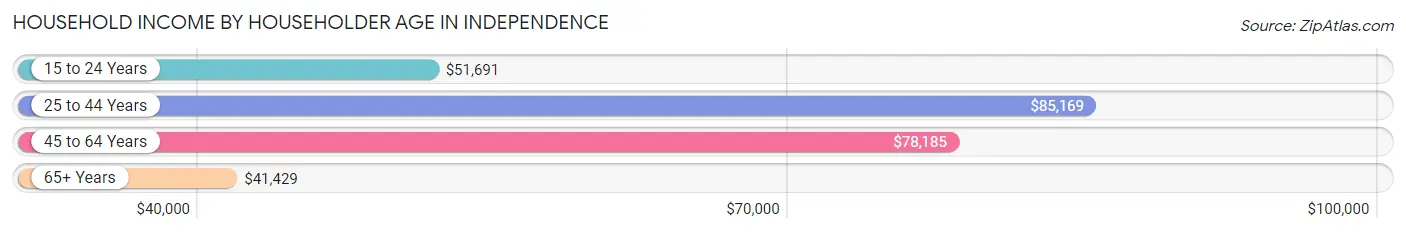
| Income Bracket | # Households | Median Income |
| 15 to 24 Years | 337 (11.2%) | $51,691 |
| 25 to 44 Years | 1,133 (37.7%) | $85,169 |
| 45 to 64 Years | 972 (32.3%) | $78,185 |
| 65+ Years | 566 (18.8%) | $41,429 |
| Total | 3,008 (100.0%) | $73,361 |
Poverty in Independence
Income Below Poverty by Sex and Age in Independence
With 9.2% poverty level for males and 10.9% for females among the residents of Independence, under 5 year old males and 65 to 74 year old females are the most vulnerable to poverty, with 104 males (47.9%) and 101 females (33.9%) in their respective age groups living below the poverty level.
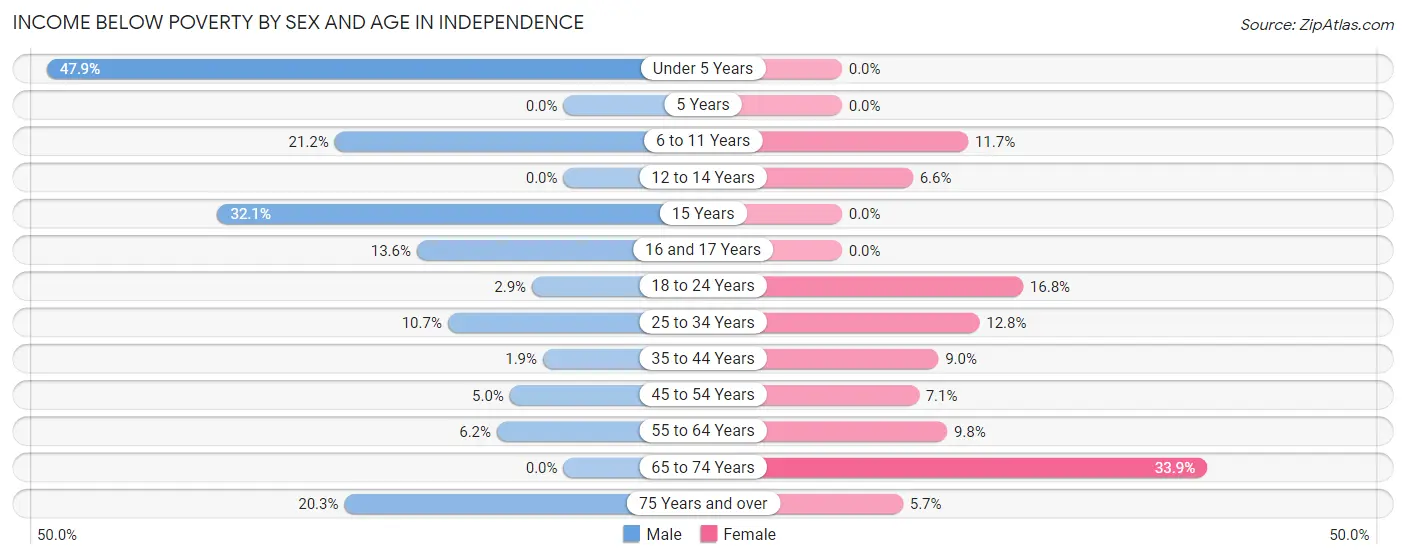
| Age Bracket | Male | Female |
| Under 5 Years | 104 (47.9%) | 0 (0.0%) |
| 5 Years | 0 (0.0%) | 0 (0.0%) |
| 6 to 11 Years | 76 (21.2%) | 59 (11.7%) |
| 12 to 14 Years | 0 (0.0%) | 15 (6.6%) |
| 15 Years | 43 (32.1%) | 0 (0.0%) |
| 16 and 17 Years | 17 (13.6%) | 0 (0.0%) |
| 18 to 24 Years | 32 (2.9%) | 138 (16.8%) |
| 25 to 34 Years | 72 (10.7%) | 61 (12.8%) |
| 35 to 44 Years | 12 (1.9%) | 64 (8.9%) |
| 45 to 54 Years | 33 (5.0%) | 33 (7.1%) |
| 55 to 64 Years | 29 (6.2%) | 45 (9.8%) |
| 65 to 74 Years | 0 (0.0%) | 101 (33.9%) |
| 75 Years and over | 50 (20.3%) | 9 (5.7%) |
| Total | 468 (9.2%) | 525 (10.9%) |
Income Above Poverty by Sex and Age in Independence
According to the poverty statistics in Independence, males aged 5 years and females aged under 5 years are the age groups that are most secure financially, with 100.0% of males and 100.0% of females in these age groups living above the poverty line.
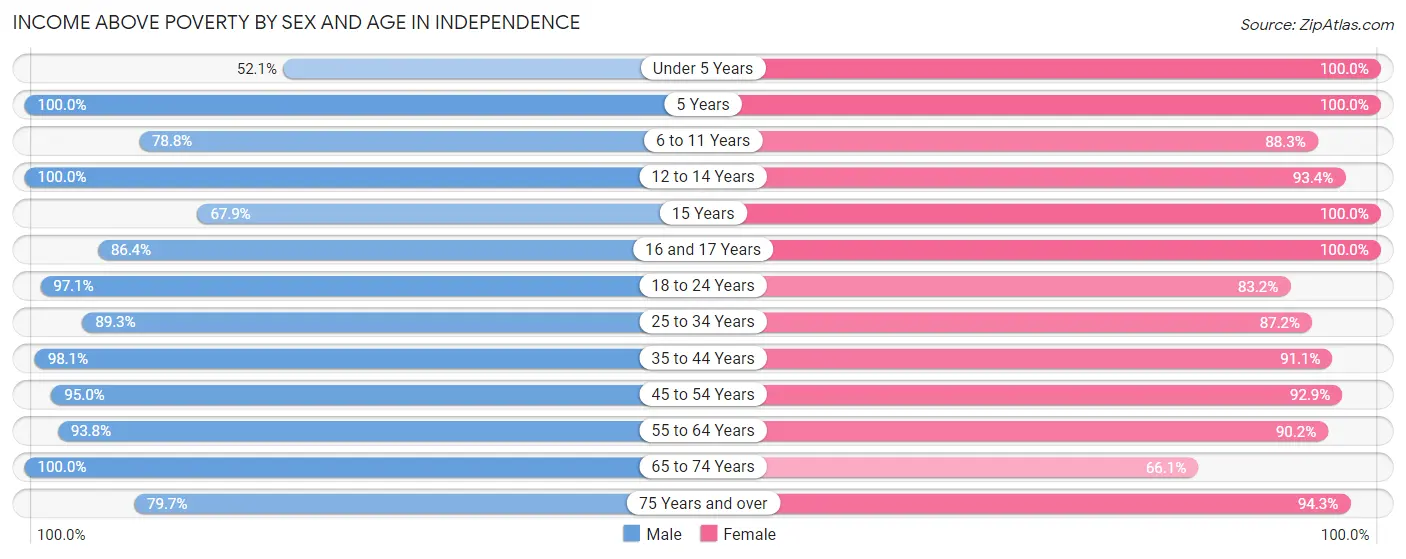
| Age Bracket | Male | Female |
| Under 5 Years | 113 (52.1%) | 362 (100.0%) |
| 5 Years | 65 (100.0%) | 56 (100.0%) |
| 6 to 11 Years | 282 (78.8%) | 445 (88.3%) |
| 12 to 14 Years | 167 (100.0%) | 213 (93.4%) |
| 15 Years | 91 (67.9%) | 111 (100.0%) |
| 16 and 17 Years | 108 (86.4%) | 168 (100.0%) |
| 18 to 24 Years | 1,065 (97.1%) | 683 (83.2%) |
| 25 to 34 Years | 599 (89.3%) | 417 (87.2%) |
| 35 to 44 Years | 621 (98.1%) | 651 (91.0%) |
| 45 to 54 Years | 629 (95.0%) | 429 (92.9%) |
| 55 to 64 Years | 441 (93.8%) | 416 (90.2%) |
| 65 to 74 Years | 244 (100.0%) | 197 (66.1%) |
| 75 Years and over | 196 (79.7%) | 150 (94.3%) |
| Total | 4,621 (90.8%) | 4,298 (89.1%) |
Income Below Poverty Among Married-Couple Families in Independence
The poverty statistics for married-couple families in Independence show that 2.7% or 40 of the total 1,482 families live below the poverty line. Families with 3 or 4 children have the highest poverty rate of 11.6%, comprising of 28 families. On the other hand, families with no children have the lowest poverty rate of 0.0%, which includes 0 families.
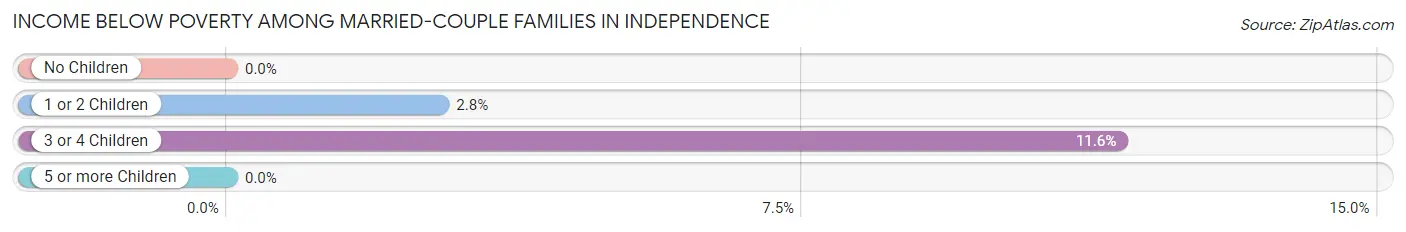
| Children | Above Poverty | Below Poverty |
| No Children | 806 (100.0%) | 0 (0.0%) |
| 1 or 2 Children | 423 (97.2%) | 12 (2.8%) |
| 3 or 4 Children | 213 (88.4%) | 28 (11.6%) |
| 5 or more Children | 0 (0.0%) | 0 (0.0%) |
| Total | 1,442 (97.3%) | 40 (2.7%) |
Income Below Poverty Among Single-Parent Households in Independence
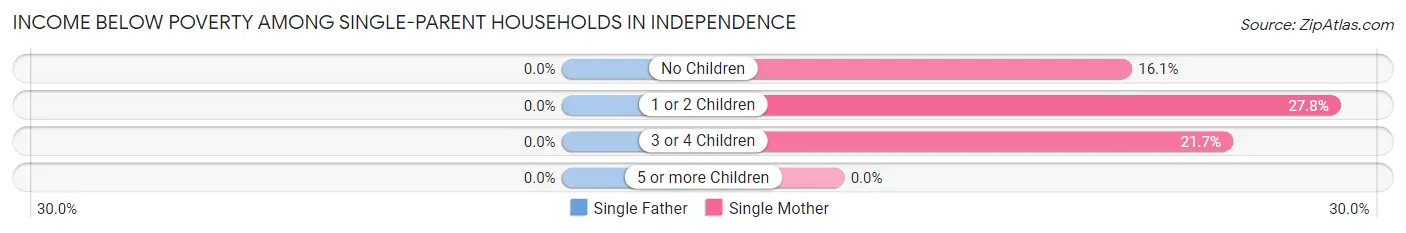
| Children | Single Father | Single Mother |
| No Children | 0 (0.0%) | 18 (16.1%) |
| 1 or 2 Children | 0 (0.0%) | 73 (27.8%) |
| 3 or 4 Children | 0 (0.0%) | 10 (21.7%) |
| 5 or more Children | 0 (0.0%) | 0 (0.0%) |
| Total | 0 (0.0%) | 101 (23.1%) |
Income Below Poverty Among Married-Couple vs Single-Parent Households in Independence
The poverty data for Independence shows that 40 of the married-couple family households (2.7%) and 101 of the single-parent households (16.4%) are living below the poverty level. Within the married-couple family households, those with 3 or 4 children have the highest poverty rate, with 28 households (11.6%) falling below the poverty line. Among the single-parent households, those with 3 or 4 children have the highest poverty rate, with 10 household (21.7%) living below poverty.
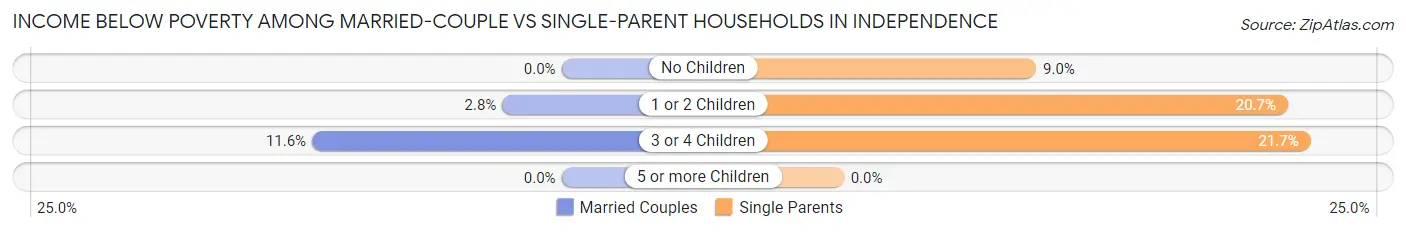
| Children | Married-Couple Families | Single-Parent Households |
| No Children | 0 (0.0%) | 18 (9.0%) |
| 1 or 2 Children | 12 (2.8%) | 73 (20.7%) |
| 3 or 4 Children | 28 (11.6%) | 10 (21.7%) |
| 5 or more Children | 0 (0.0%) | 0 (0.0%) |
| Total | 40 (2.7%) | 101 (16.4%) |
Race in Independence
The most populous races in Independence are White / Caucasian (7,192 | 72.1%), Hispanic or Latino (3,809 | 38.2%), and Some other Race (1,588 | 15.9%).
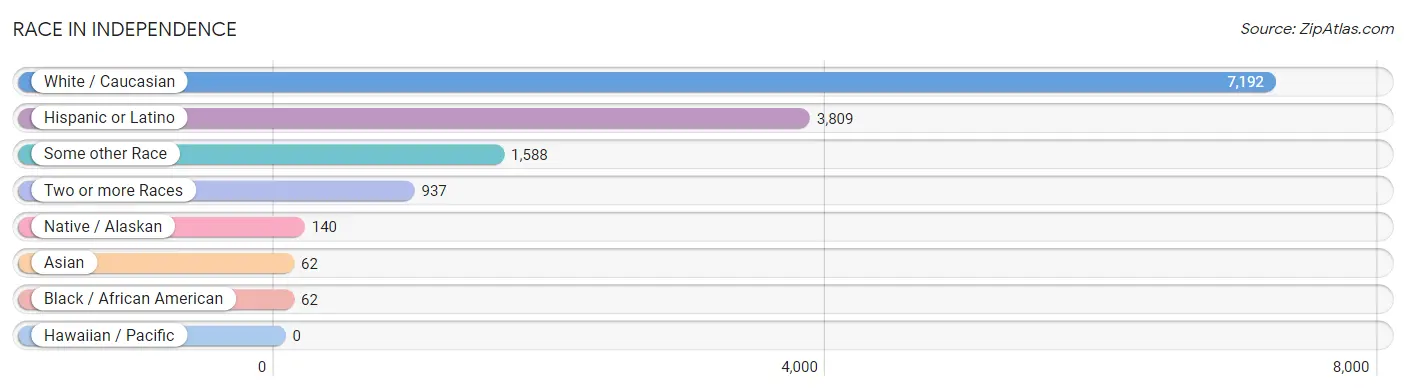
| Race | # Population | % Population |
| Asian | 62 | 0.6% |
| Black / African American | 62 | 0.6% |
| Hawaiian / Pacific | 0 | 0.0% |
| Hispanic or Latino | 3,809 | 38.2% |
| Native / Alaskan | 140 | 1.4% |
| White / Caucasian | 7,192 | 72.1% |
| Two or more Races | 937 | 9.4% |
| Some other Race | 1,588 | 15.9% |
| Total | 9,981 | 100.0% |
Ancestry in Independence
The most populous ancestries reported in Independence are Mexican (3,536 | 35.4%), German (1,384 | 13.9%), Irish (999 | 10.0%), English (801 | 8.0%), and American (504 | 5.1%), together accounting for 72.4% of all Independence residents.
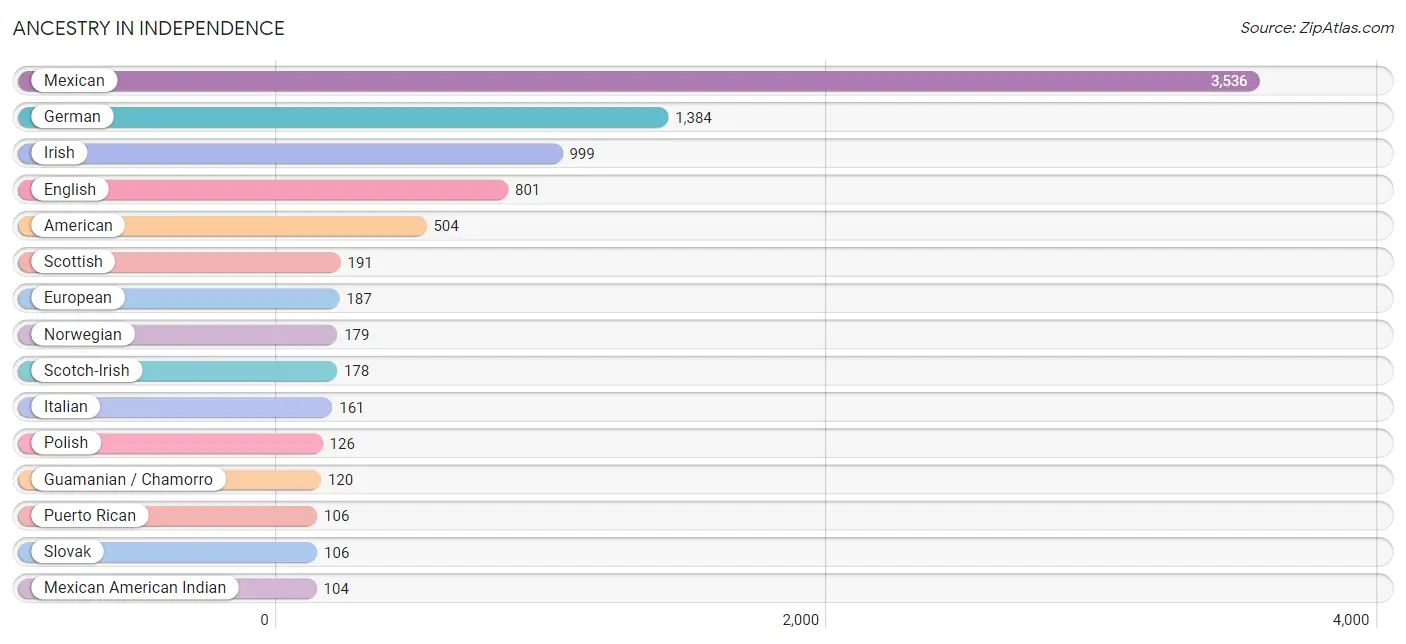
| Ancestry | # Population | % Population |
| American | 504 | 5.1% |
| Apache | 35 | 0.4% |
| Arab | 30 | 0.3% |
| Argentinean | 32 | 0.3% |
| Armenian | 13 | 0.1% |
| Basque | 19 | 0.2% |
| Bhutanese | 24 | 0.2% |
| British | 14 | 0.1% |
| Canadian | 20 | 0.2% |
| Central American | 52 | 0.5% |
| Cherokee | 79 | 0.8% |
| Colombian | 28 | 0.3% |
| Costa Rican | 52 | 0.5% |
| Czech | 23 | 0.2% |
| Dutch | 60 | 0.6% |
| English | 801 | 8.0% |
| European | 187 | 1.9% |
| French | 86 | 0.9% |
| French Canadian | 49 | 0.5% |
| German | 1,384 | 13.9% |
| Guamanian / Chamorro | 120 | 1.2% |
| Haitian | 27 | 0.3% |
| Hungarian | 3 | 0.0% |
| Indian (Asian) | 25 | 0.3% |
| Irish | 999 | 10.0% |
| Iroquois | 16 | 0.2% |
| Italian | 161 | 1.6% |
| Korean | 19 | 0.2% |
| Mexican | 3,536 | 35.4% |
| Mexican American Indian | 104 | 1.0% |
| Northern European | 58 | 0.6% |
| Norwegian | 179 | 1.8% |
| Polish | 126 | 1.3% |
| Puerto Rican | 106 | 1.1% |
| Russian | 63 | 0.6% |
| Scandinavian | 53 | 0.5% |
| Scotch-Irish | 178 | 1.8% |
| Scottish | 191 | 1.9% |
| Slovak | 106 | 1.1% |
| South American | 60 | 0.6% |
| South American Indian | 32 | 0.3% |
| Sri Lankan | 8 | 0.1% |
| Swedish | 89 | 0.9% |
| Swiss | 13 | 0.1% |
| Thai | 3 | 0.0% |
| Trinidadian and Tobagonian | 29 | 0.3% |
| Ukrainian | 16 | 0.2% |
| Welsh | 44 | 0.4% | View All 48 Rows |
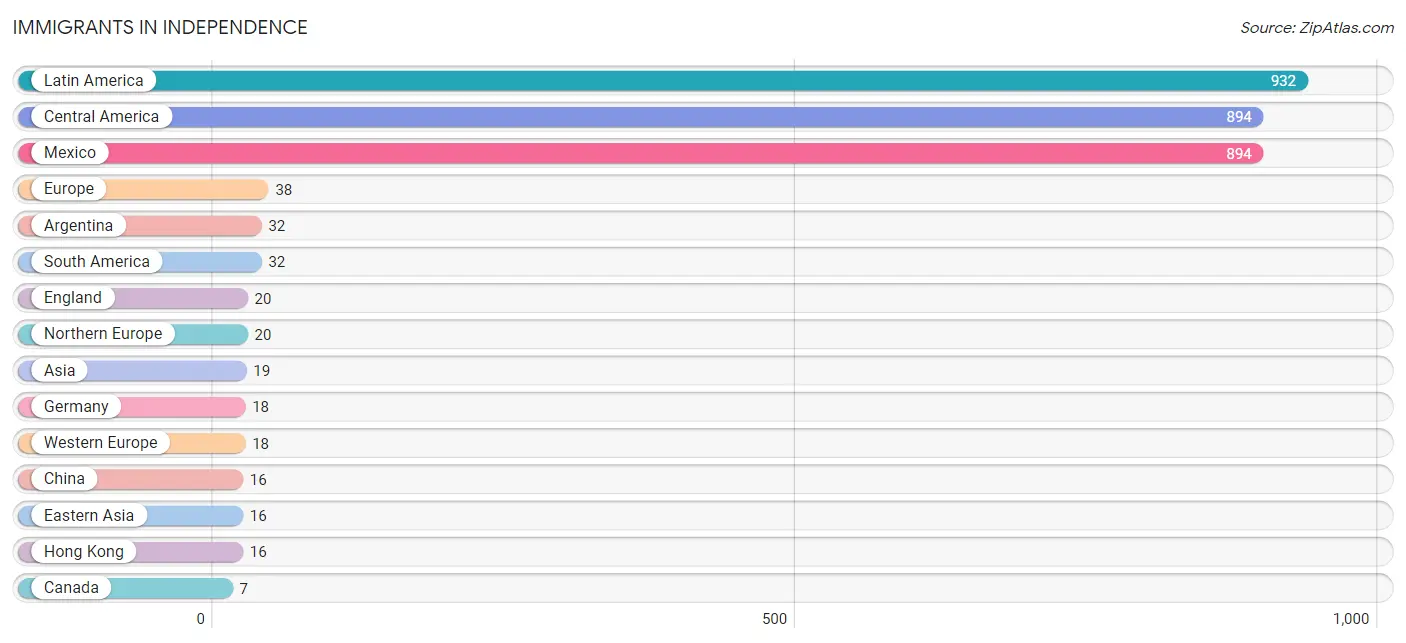
Immigrants in Independence
The most numerous immigrant groups reported in Independence came from Latin America (932 | 9.3%), Central America (894 | 9.0%), Mexico (894 | 9.0%), Europe (38 | 0.4%), and Argentina (32 | 0.3%), together accounting for 28.0% of all Independence residents.
| Immigration Origin | # Population | % Population |
| Argentina | 32 | 0.3% |
| Asia | 19 | 0.2% |
| Canada | 7 | 0.1% |
| Caribbean | 6 | 0.1% |
| Central America | 894 | 9.0% |
| China | 16 | 0.2% |
| Eastern Asia | 16 | 0.2% |
| England | 20 | 0.2% |
| Europe | 38 | 0.4% |
| Germany | 18 | 0.2% |
| Hong Kong | 16 | 0.2% |
| India | 3 | 0.0% |
| Latin America | 932 | 9.3% |
| Mexico | 894 | 9.0% |
| Northern Europe | 20 | 0.2% |
| South America | 32 | 0.3% |
| South Central Asia | 3 | 0.0% |
| Trinidad and Tobago | 6 | 0.1% |
| Western Europe | 18 | 0.2% | View All 19 Rows |
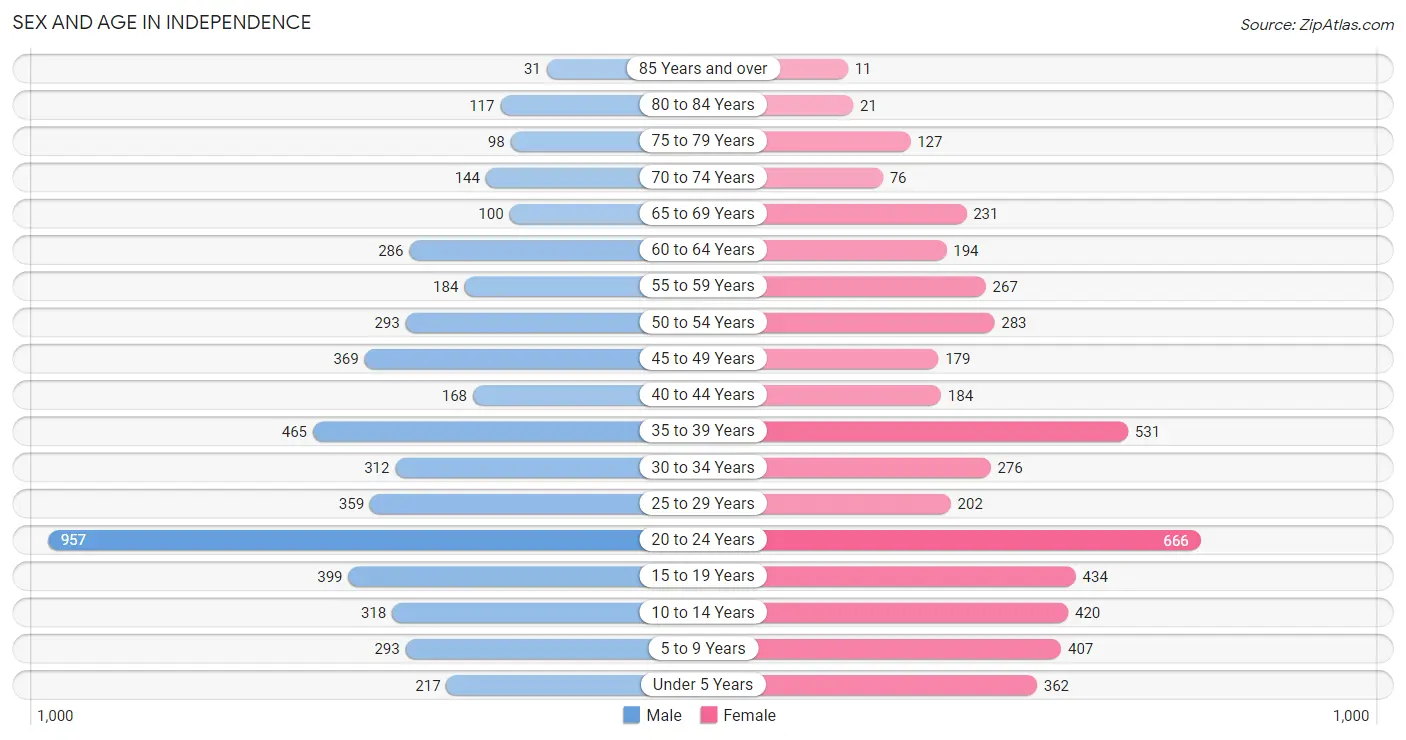
Sex and Age in Independence
Sex and Age in Independence
The most populous age groups in Independence are 20 to 24 Years (957 | 18.7%) for men and 20 to 24 Years (666 | 13.7%) for women.
| Age Bracket | Male | Female |
| Under 5 Years | 217 (4.3%) | 362 (7.4%) |
| 5 to 9 Years | 293 (5.7%) | 407 (8.4%) |
| 10 to 14 Years | 318 (6.2%) | 420 (8.6%) |
| 15 to 19 Years | 399 (7.8%) | 434 (8.9%) |
| 20 to 24 Years | 957 (18.7%) | 666 (13.7%) |
| 25 to 29 Years | 359 (7.0%) | 202 (4.2%) |
| 30 to 34 Years | 312 (6.1%) | 276 (5.7%) |
| 35 to 39 Years | 465 (9.1%) | 531 (10.9%) |
| 40 to 44 Years | 168 (3.3%) | 184 (3.8%) |
| 45 to 49 Years | 369 (7.2%) | 179 (3.7%) |
| 50 to 54 Years | 293 (5.7%) | 283 (5.8%) |
| 55 to 59 Years | 184 (3.6%) | 267 (5.5%) |
| 60 to 64 Years | 286 (5.6%) | 194 (4.0%) |
| 65 to 69 Years | 100 (2.0%) | 231 (4.7%) |
| 70 to 74 Years | 144 (2.8%) | 76 (1.6%) |
| 75 to 79 Years | 98 (1.9%) | 127 (2.6%) |
| 80 to 84 Years | 117 (2.3%) | 21 (0.4%) |
| 85 Years and over | 31 (0.6%) | 11 (0.2%) |
| Total | 5,110 (100.0%) | 4,871 (100.0%) |
Families and Households in Independence
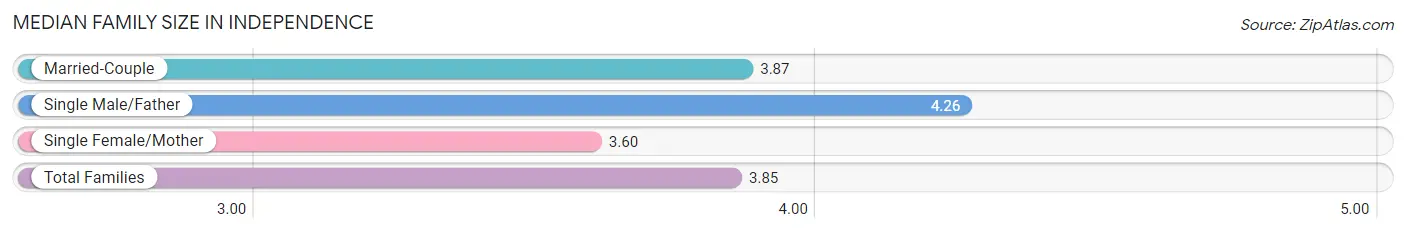
Median Family Size in Independence
The median family size in Independence is 3.85 persons per family, with single male/father families (179 | 8.5%) accounting for the largest median family size of 4.26 persons per family. On the other hand, single female/mother families (438 | 20.9%) represent the smallest median family size with 3.60 persons per family.
| Family Type | # Families | Family Size |
| Married-Couple | 1,482 (70.6%) | 3.87 |
| Single Male/Father | 179 (8.5%) | 4.26 |
| Single Female/Mother | 438 (20.9%) | 3.60 |
| Total Families | 2,099 (100.0%) | 3.85 |
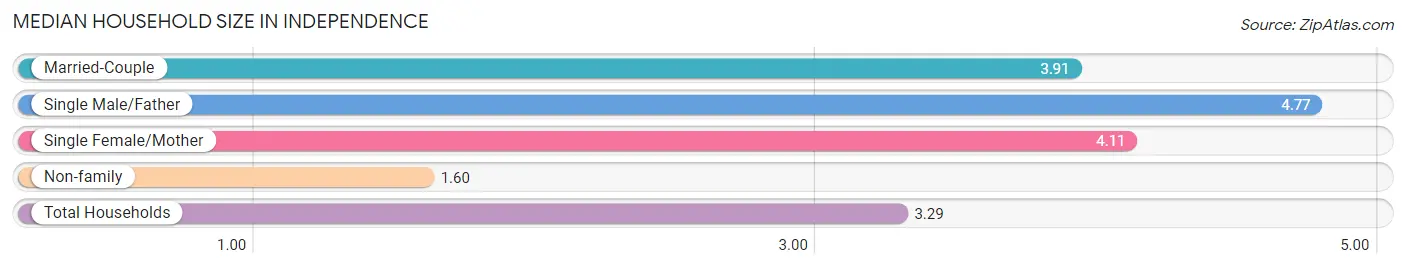
Median Household Size in Independence
The median household size in Independence is 3.29 persons per household, with single male/father households (179 | 5.9%) accounting for the largest median household size of 4.77 persons per household. non-family households (909 | 30.2%) represent the smallest median household size with 1.60 persons per household.
| Household Type | # Households | Household Size |
| Married-Couple | 1,482 (49.3%) | 3.91 |
| Single Male/Father | 179 (5.9%) | 4.77 |
| Single Female/Mother | 438 (14.6%) | 4.11 |
| Non-family | 909 (30.2%) | 1.60 |
| Total Households | 3,008 (100.0%) | 3.29 |
Household Size by Marriage Status in Independence
Out of a total of 3,008 households in Independence, 2,099 (69.8%) are family households, while 909 (30.2%) are nonfamily households. The most numerous type of family households are 2-person households, comprising 708, and the most common type of nonfamily households are 1-person households, comprising 582.
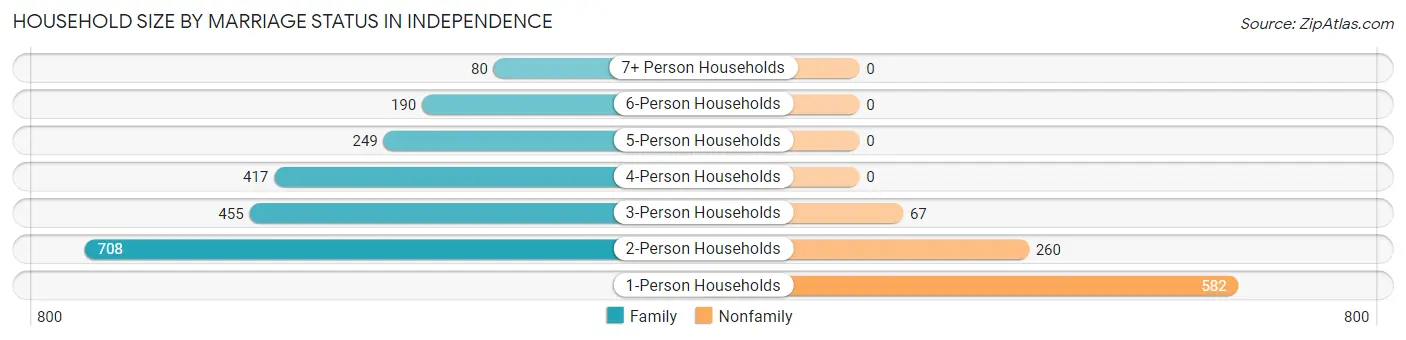
| Household Size | Family Households | Nonfamily Households |
| 1-Person Households | - | 582 (19.4%) |
| 2-Person Households | 708 (23.5%) | 260 (8.6%) |
| 3-Person Households | 455 (15.1%) | 67 (2.2%) |
| 4-Person Households | 417 (13.9%) | 0 (0.0%) |
| 5-Person Households | 249 (8.3%) | 0 (0.0%) |
| 6-Person Households | 190 (6.3%) | 0 (0.0%) |
| 7+ Person Households | 80 (2.7%) | 0 (0.0%) |
| Total | 2,099 (69.8%) | 909 (30.2%) |
Female Fertility in Independence
Fertility by Age in Independence
Average fertility rate in Independence is 43.0 births per 1,000 women. Women in the age bracket of 20 to 34 years have the highest fertility rate with 61.0 births per 1,000 women. Women in the age bracket of 20 to 34 years acount for 64.8% of all women with births.
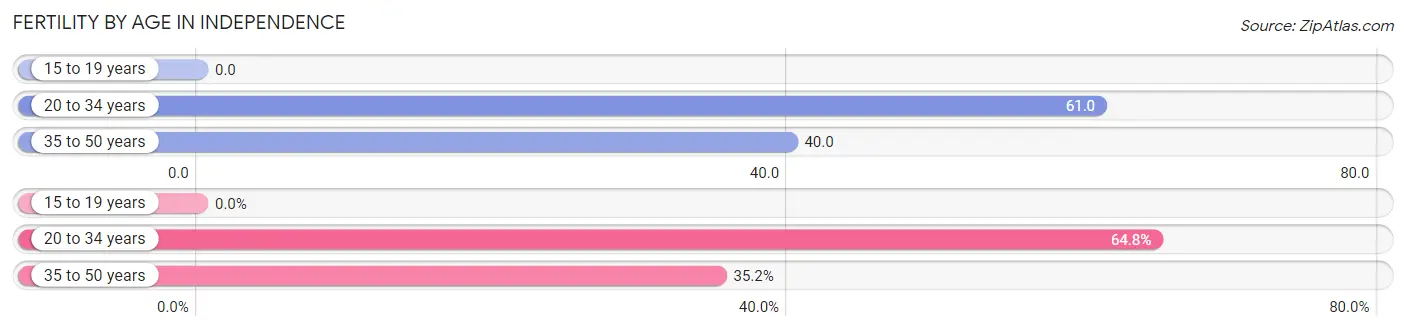
| Age Bracket | Women with Births | Births / 1,000 Women |
| 15 to 19 years | 0 (0.0%) | 0.0 |
| 20 to 34 years | 70 (64.8%) | 61.0 |
| 35 to 50 years | 38 (35.2%) | 40.0 |
| Total | 108 (100.0%) | 43.0 |
Fertility by Age by Marriage Status in Independence
84.3% of women with births (108) in Independence are married. The highest percentage of unmarried women with births falls into 20 to 34 years age bracket with 24.3% of them unmarried at the time of birth, while the lowest percentage of unmarried women with births belong to 35 to 50 years age bracket with 0.0% of them unmarried.
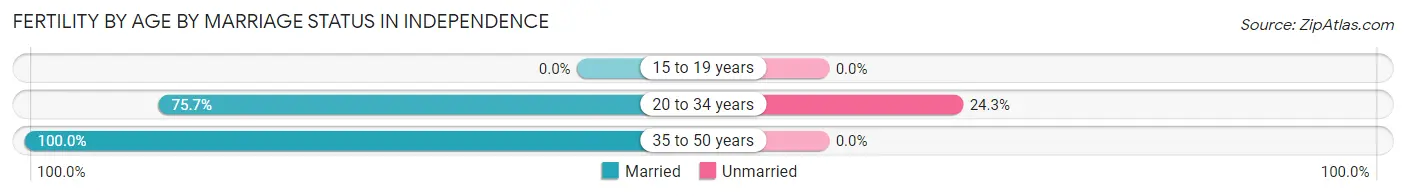
| Age Bracket | Married | Unmarried |
| 15 to 19 years | 0 (0.0%) | 0 (0.0%) |
| 20 to 34 years | 53 (75.7%) | 17 (24.3%) |
| 35 to 50 years | 38 (100.0%) | 0 (0.0%) |
| Total | 91 (84.3%) | 17 (15.7%) |
Fertility by Education in Independence
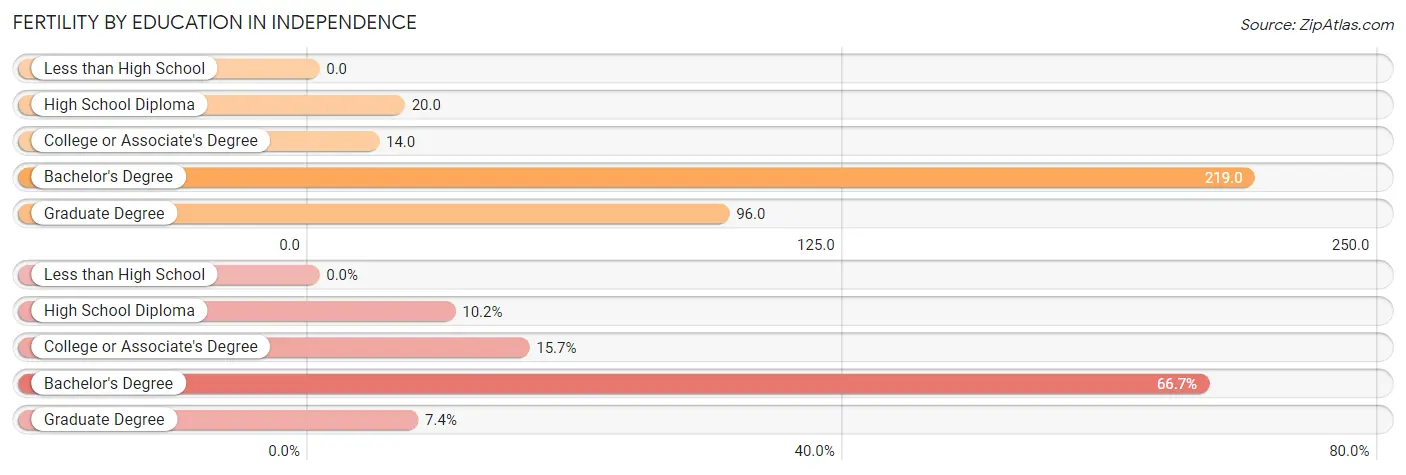
| Educational Attainment | Women with Births | Births / 1,000 Women |
| Less than High School | 0 (0.0%) | 0.0 |
| High School Diploma | 11 (10.2%) | 20.0 |
| College or Associate's Degree | 17 (15.7%) | 14.0 |
| Bachelor's Degree | 72 (66.7%) | 219.0 |
| Graduate Degree | 8 (7.4%) | 96.0 |
| Total | 108 (100.0%) | 43.0 |
Fertility by Education by Marriage Status in Independence
15.7% of women with births in Independence are unmarried. Women with the educational attainment of college or associate's degree are most likely to be married with 100.0% of them married at childbirth, while women with the educational attainment of high school diploma are least likely to be married with 100.0% of them unmarried at childbirth.
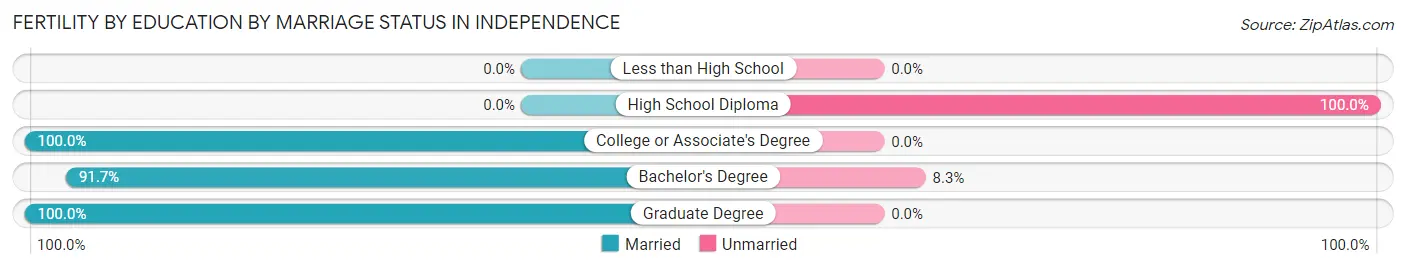
| Educational Attainment | Married | Unmarried |
| Less than High School | 0 (0.0%) | 0 (0.0%) |
| High School Diploma | 0 (0.0%) | 11 (100.0%) |
| College or Associate's Degree | 17 (100.0%) | 0 (0.0%) |
| Bachelor's Degree | 66 (91.7%) | 6 (8.3%) |
| Graduate Degree | 8 (100.0%) | 0 (0.0%) |
| Total | 91 (84.3%) | 17 (15.7%) |
Employment Characteristics in Independence
Employment by Class of Employer in Independence
Among the 5,202 employed individuals in Independence, private company employees (3,230 | 62.1%), state government employees (873 | 16.8%), and local government employees (399 | 7.7%) make up the most common classes of employment.
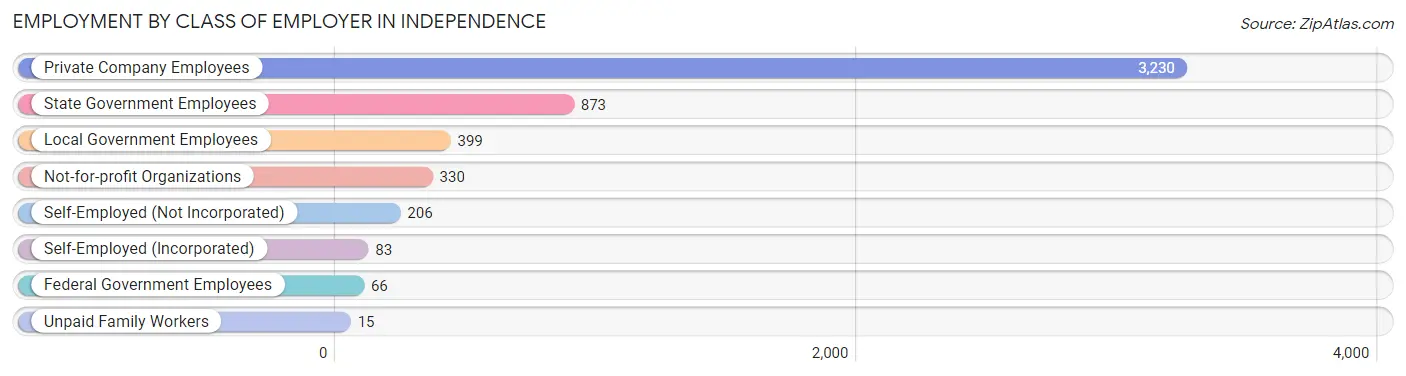
| Employer Class | # Employees | % Employees |
| Private Company Employees | 3,230 | 62.1% |
| Self-Employed (Incorporated) | 83 | 1.6% |
| Self-Employed (Not Incorporated) | 206 | 4.0% |
| Not-for-profit Organizations | 330 | 6.3% |
| Local Government Employees | 399 | 7.7% |
| State Government Employees | 873 | 16.8% |
| Federal Government Employees | 66 | 1.3% |
| Unpaid Family Workers | 15 | 0.3% |
| Total | 5,202 | 100.0% |
Employment Status by Age in Independence
According to the labor force statistics for Independence, out of the total population over 16 years of age (7,719), 72.2% or 5,573 individuals are in the labor force, with 4.4% or 245 of them unemployed. The age group with the highest labor force participation rate is 20 to 24 years, with 97.0% or 1,574 individuals in the labor force. Within the labor force, the 20 to 24 years age range has the highest percentage of unemployed individuals, with 9.6% or 151 of them being unemployed.
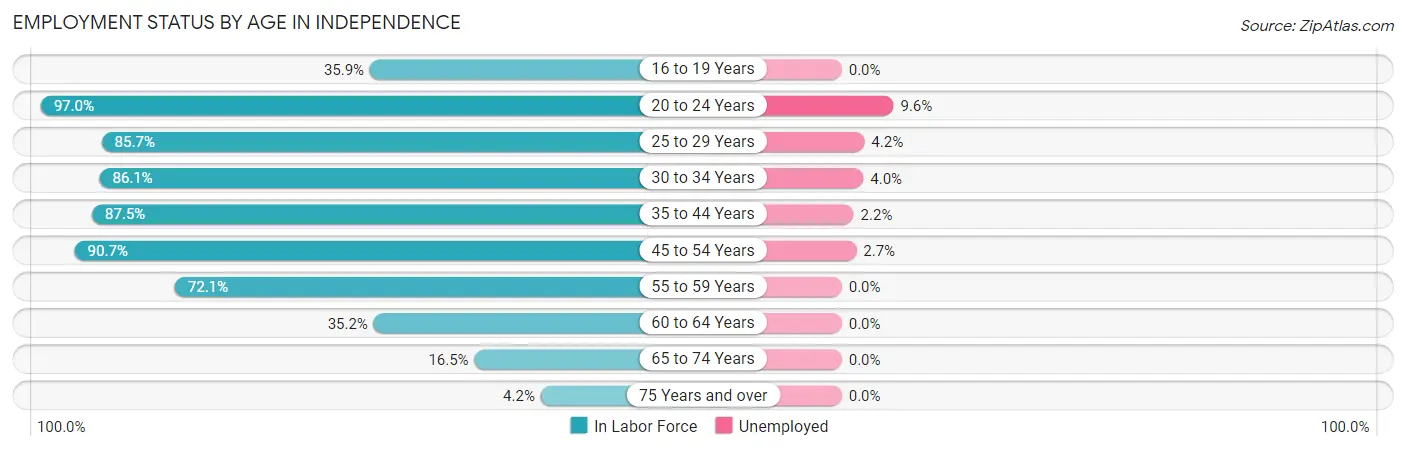
| Age Bracket | In Labor Force | Unemployed |
| 16 to 19 Years | 211 (35.9%) | 0 (0.0%) |
| 20 to 24 Years | 1,574 (97.0%) | 151 (9.6%) |
| 25 to 29 Years | 481 (85.7%) | 20 (4.2%) |
| 30 to 34 Years | 506 (86.1%) | 20 (4.0%) |
| 35 to 44 Years | 1,180 (87.5%) | 26 (2.2%) |
| 45 to 54 Years | 1,019 (90.7%) | 28 (2.7%) |
| 55 to 59 Years | 325 (72.1%) | 0 (0.0%) |
| 60 to 64 Years | 169 (35.2%) | 0 (0.0%) |
| 65 to 74 Years | 91 (16.5%) | 0 (0.0%) |
| 75 Years and over | 17 (4.2%) | 0 (0.0%) |
| Total | 5,573 (72.2%) | 245 (4.4%) |
Employment Status by Educational Attainment in Independence
According to labor force statistics for Independence, 80.8% of individuals (3,678) out of the total population between 25 and 64 years of age (4,552) are in the labor force, with 2.6% or 96 of them being unemployed. The group with the highest labor force participation rate are those with the educational attainment of college / associate degree, with 86.6% or 1,686 individuals in the labor force. Within the labor force, individuals with high school diploma education have the highest percentage of unemployment, with 3.8% or 33 of them being unemployed.
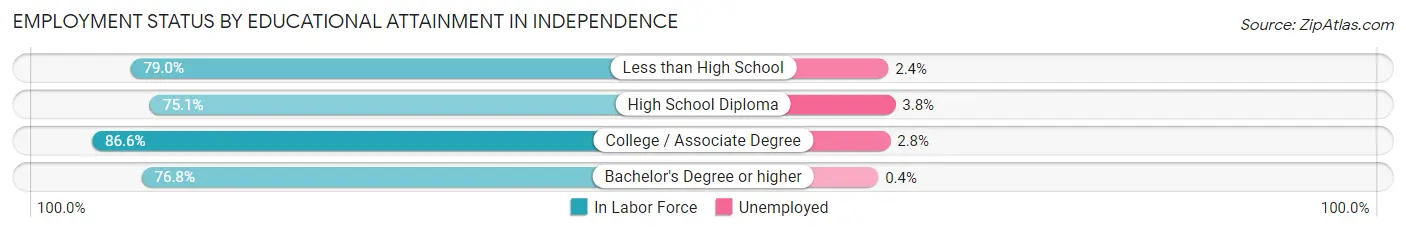
| Educational Attainment | In Labor Force | Unemployed |
| Less than High School | 424 (79.0%) | 13 (2.4%) |
| High School Diploma | 879 (75.1%) | 44 (3.8%) |
| College / Associate Degree | 1,686 (86.6%) | 55 (2.8%) |
| Bachelor's Degree or higher | 690 (76.8%) | 4 (0.4%) |
| Total | 3,678 (80.8%) | 118 (2.6%) |
Employment Occupations by Sex in Independence
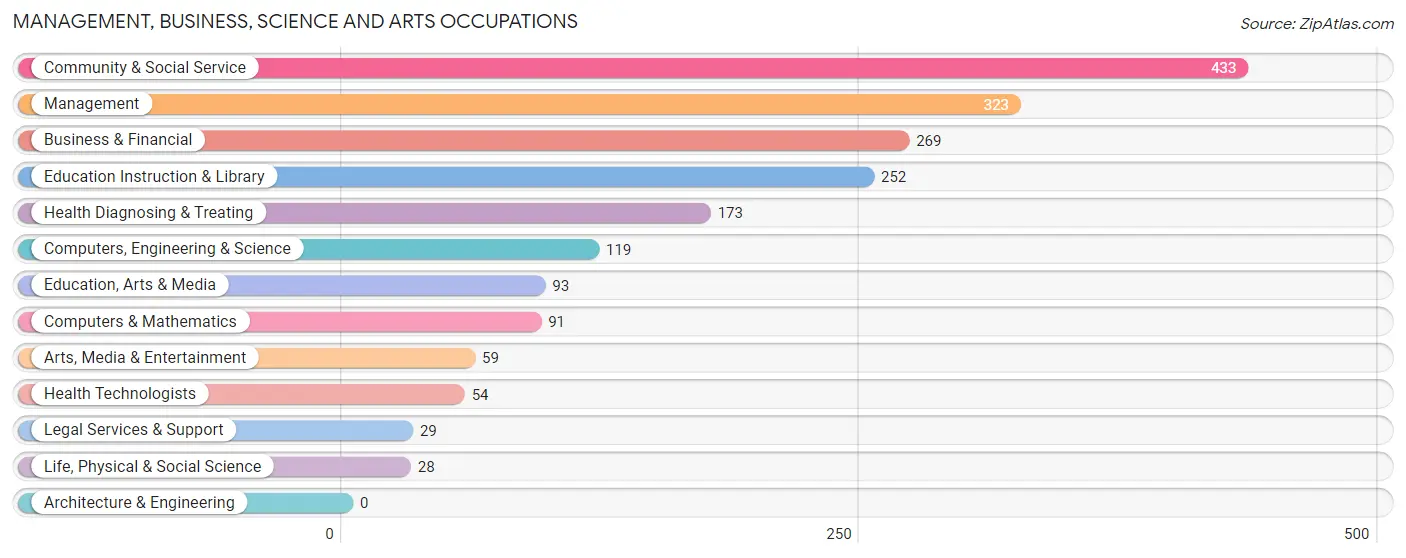
Management, Business, Science and Arts Occupations
The most common Management, Business, Science and Arts occupations in Independence are Community & Social Service (433 | 8.1%), Management (323 | 6.1%), Business & Financial (269 | 5.1%), Education Instruction & Library (252 | 4.7%), and Health Diagnosing & Treating (173 | 3.3%).
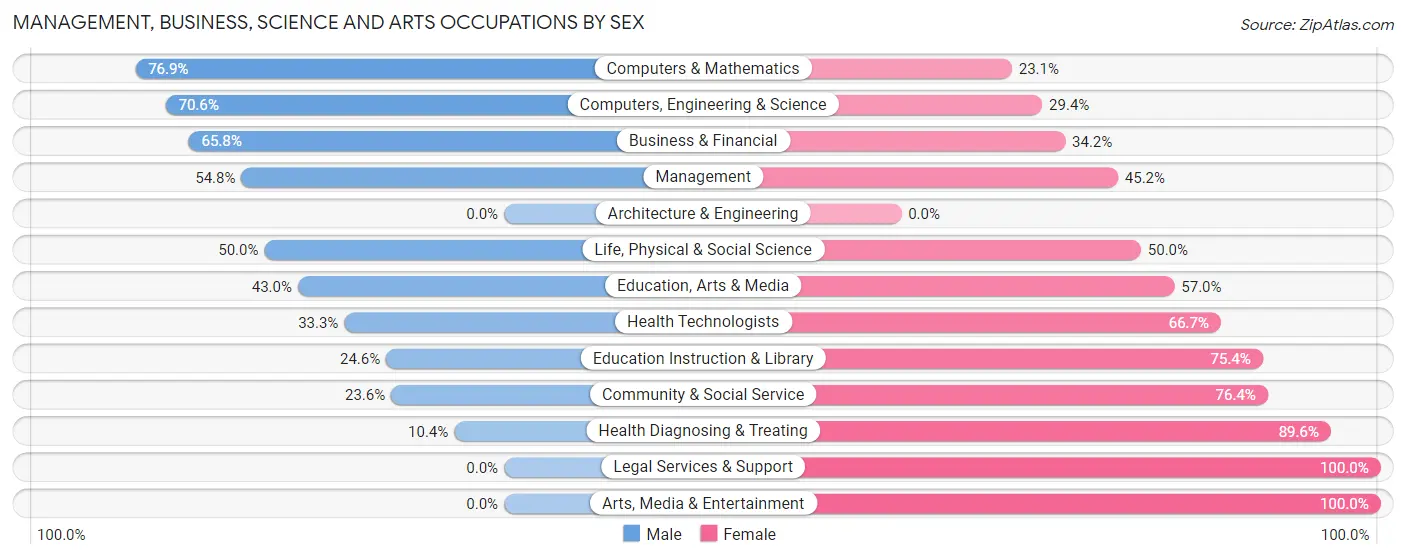
Management, Business, Science and Arts Occupations by Sex
Within the Management, Business, Science and Arts occupations in Independence, the most male-oriented occupations are Computers & Mathematics (76.9%), Computers, Engineering & Science (70.6%), and Business & Financial (65.8%), while the most female-oriented occupations are Legal Services & Support (100.0%), Arts, Media & Entertainment (100.0%), and Health Diagnosing & Treating (89.6%).
| Occupation | Male | Female |
| Management | 177 (54.8%) | 146 (45.2%) |
| Business & Financial | 177 (65.8%) | 92 (34.2%) |
| Computers, Engineering & Science | 84 (70.6%) | 35 (29.4%) |
| Computers & Mathematics | 70 (76.9%) | 21 (23.1%) |
| Architecture & Engineering | 0 (0.0%) | 0 (0.0%) |
| Life, Physical & Social Science | 14 (50.0%) | 14 (50.0%) |
| Community & Social Service | 102 (23.6%) | 331 (76.4%) |
| Education, Arts & Media | 40 (43.0%) | 53 (57.0%) |
| Legal Services & Support | 0 (0.0%) | 29 (100.0%) |
| Education Instruction & Library | 62 (24.6%) | 190 (75.4%) |
| Arts, Media & Entertainment | 0 (0.0%) | 59 (100.0%) |
| Health Diagnosing & Treating | 18 (10.4%) | 155 (89.6%) |
| Health Technologists | 18 (33.3%) | 36 (66.7%) |
| Total (Category) | 558 (42.4%) | 759 (57.6%) |
| Total (Overall) | 3,166 (59.4%) | 2,163 (40.6%) |
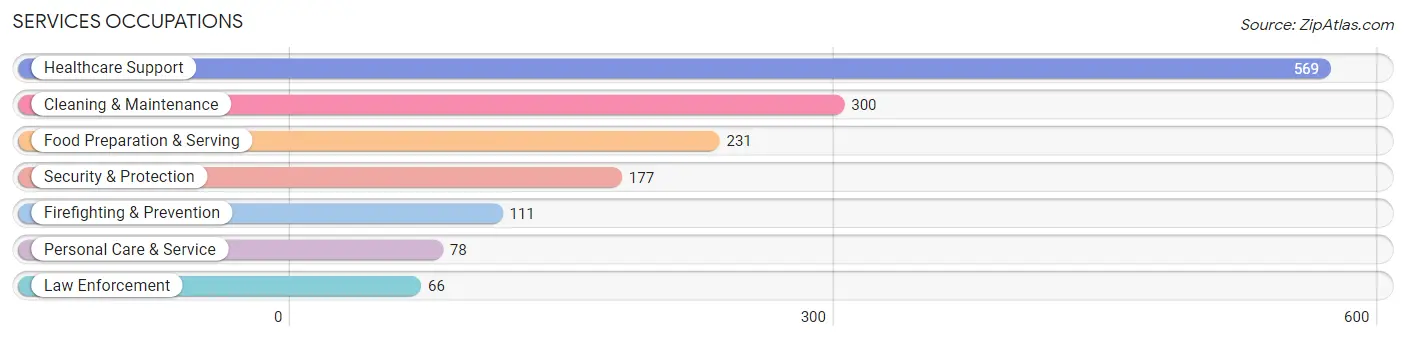
Services Occupations
The most common Services occupations in Independence are Healthcare Support (569 | 10.7%), Cleaning & Maintenance (300 | 5.6%), Food Preparation & Serving (231 | 4.3%), Security & Protection (177 | 3.3%), and Firefighting & Prevention (111 | 2.1%).
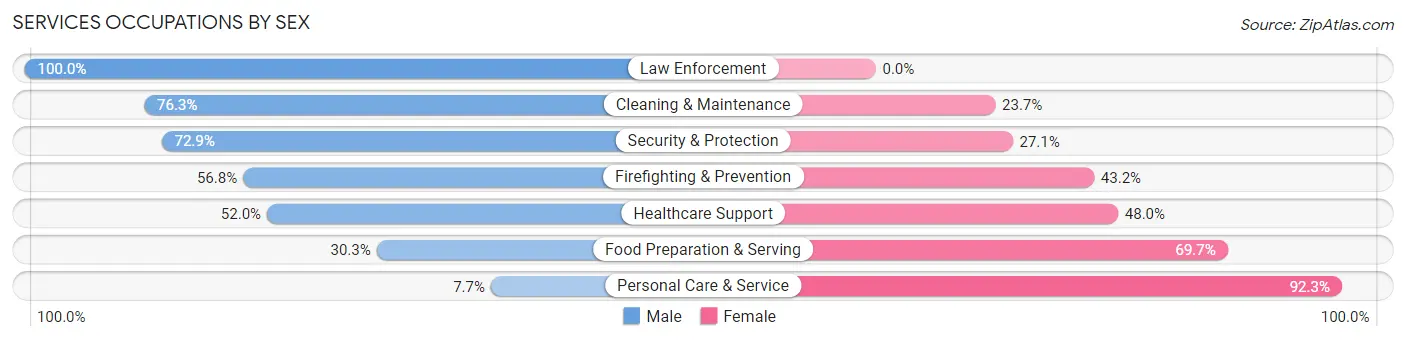
Services Occupations by Sex
Within the Services occupations in Independence, the most male-oriented occupations are Law Enforcement (100.0%), Cleaning & Maintenance (76.3%), and Security & Protection (72.9%), while the most female-oriented occupations are Personal Care & Service (92.3%), Food Preparation & Serving (69.7%), and Healthcare Support (48.0%).
| Occupation | Male | Female |
| Healthcare Support | 296 (52.0%) | 273 (48.0%) |
| Security & Protection | 129 (72.9%) | 48 (27.1%) |
| Firefighting & Prevention | 63 (56.8%) | 48 (43.2%) |
| Law Enforcement | 66 (100.0%) | 0 (0.0%) |
| Food Preparation & Serving | 70 (30.3%) | 161 (69.7%) |
| Cleaning & Maintenance | 229 (76.3%) | 71 (23.7%) |
| Personal Care & Service | 6 (7.7%) | 72 (92.3%) |
| Total (Category) | 730 (53.9%) | 625 (46.1%) |
| Total (Overall) | 3,166 (59.4%) | 2,163 (40.6%) |
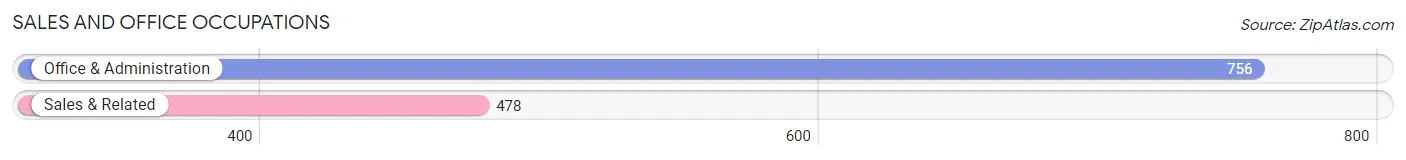
Sales and Office Occupations
The most common Sales and Office occupations in Independence are Office & Administration (756 | 14.2%), and Sales & Related (478 | 9.0%).
Sales and Office Occupations by Sex
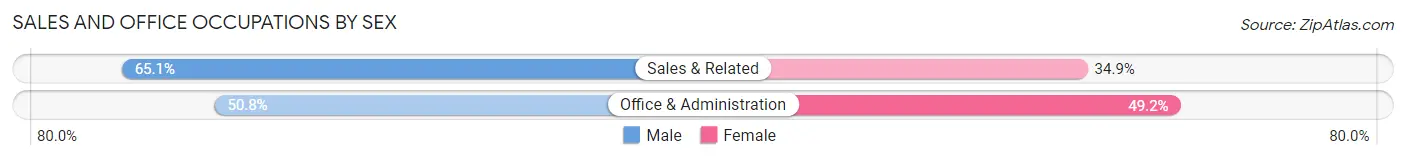
| Occupation | Male | Female |
| Sales & Related | 311 (65.1%) | 167 (34.9%) |
| Office & Administration | 384 (50.8%) | 372 (49.2%) |
| Total (Category) | 695 (56.3%) | 539 (43.7%) |
| Total (Overall) | 3,166 (59.4%) | 2,163 (40.6%) |
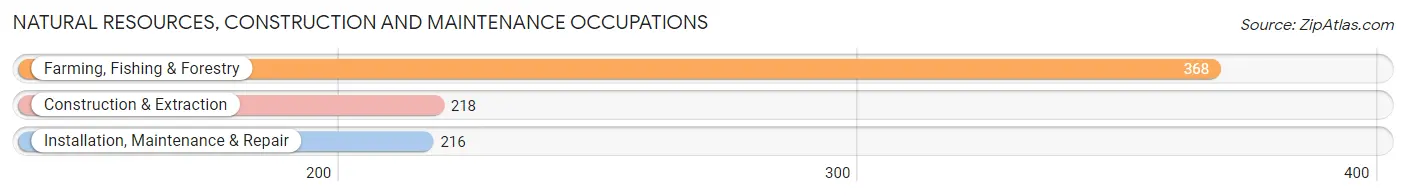
Natural Resources, Construction and Maintenance Occupations
The most common Natural Resources, Construction and Maintenance occupations in Independence are Farming, Fishing & Forestry (368 | 6.9%), Construction & Extraction (218 | 4.1%), and Installation, Maintenance & Repair (216 | 4.1%).
Natural Resources, Construction and Maintenance Occupations by Sex
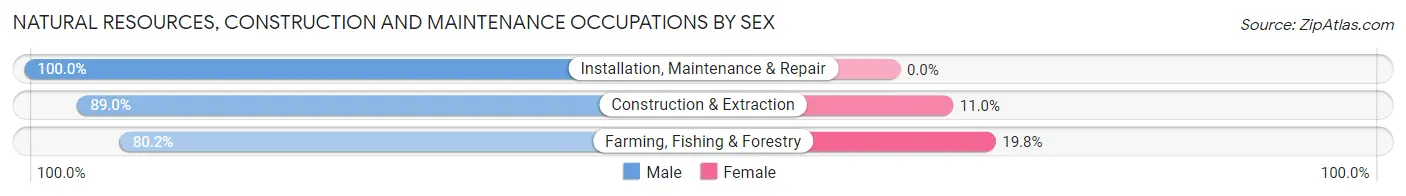
| Occupation | Male | Female |
| Farming, Fishing & Forestry | 295 (80.2%) | 73 (19.8%) |
| Construction & Extraction | 194 (89.0%) | 24 (11.0%) |
| Installation, Maintenance & Repair | 216 (100.0%) | 0 (0.0%) |
| Total (Category) | 705 (87.9%) | 97 (12.1%) |
| Total (Overall) | 3,166 (59.4%) | 2,163 (40.6%) |
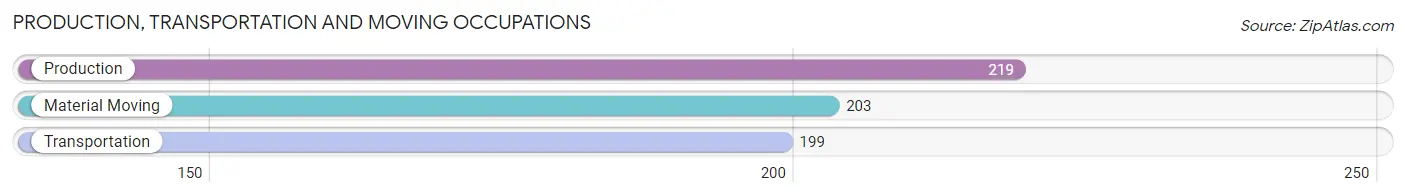
Production, Transportation and Moving Occupations
The most common Production, Transportation and Moving occupations in Independence are Production (219 | 4.1%), Material Moving (203 | 3.8%), and Transportation (199 | 3.7%).
Production, Transportation and Moving Occupations by Sex
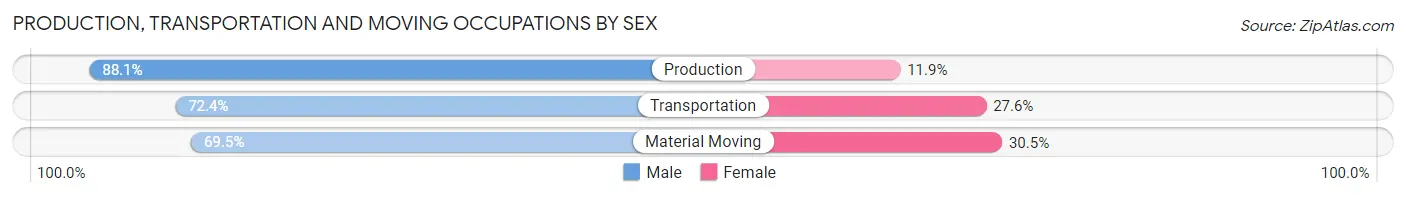
| Occupation | Male | Female |
| Production | 193 (88.1%) | 26 (11.9%) |
| Transportation | 144 (72.4%) | 55 (27.6%) |
| Material Moving | 141 (69.5%) | 62 (30.5%) |
| Total (Category) | 478 (77.0%) | 143 (23.0%) |
| Total (Overall) | 3,166 (59.4%) | 2,163 (40.6%) |
Employment Industries by Sex in Independence
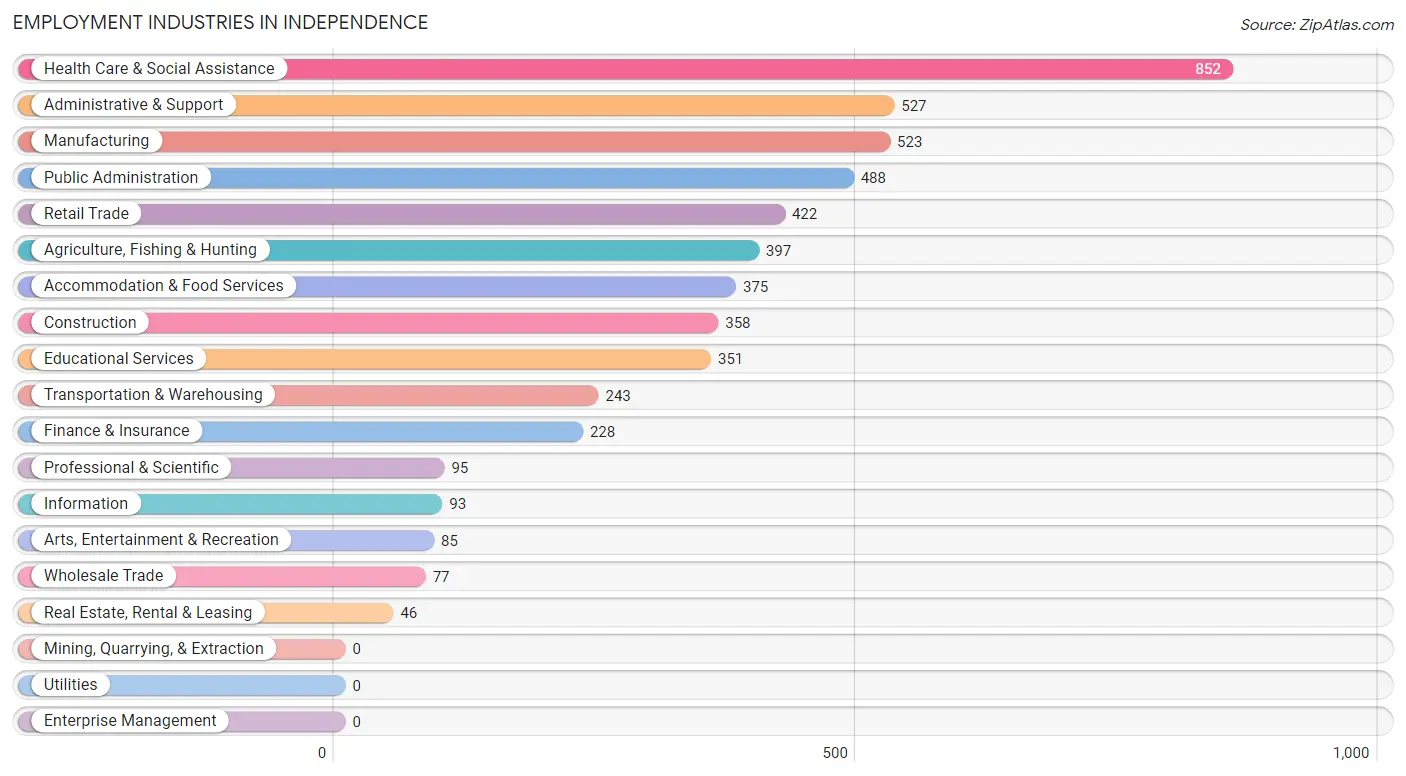
Employment Industries in Independence
The major employment industries in Independence include Health Care & Social Assistance (852 | 16.0%), Administrative & Support (527 | 9.9%), Manufacturing (523 | 9.8%), Public Administration (488 | 9.2%), and Retail Trade (422 | 7.9%).
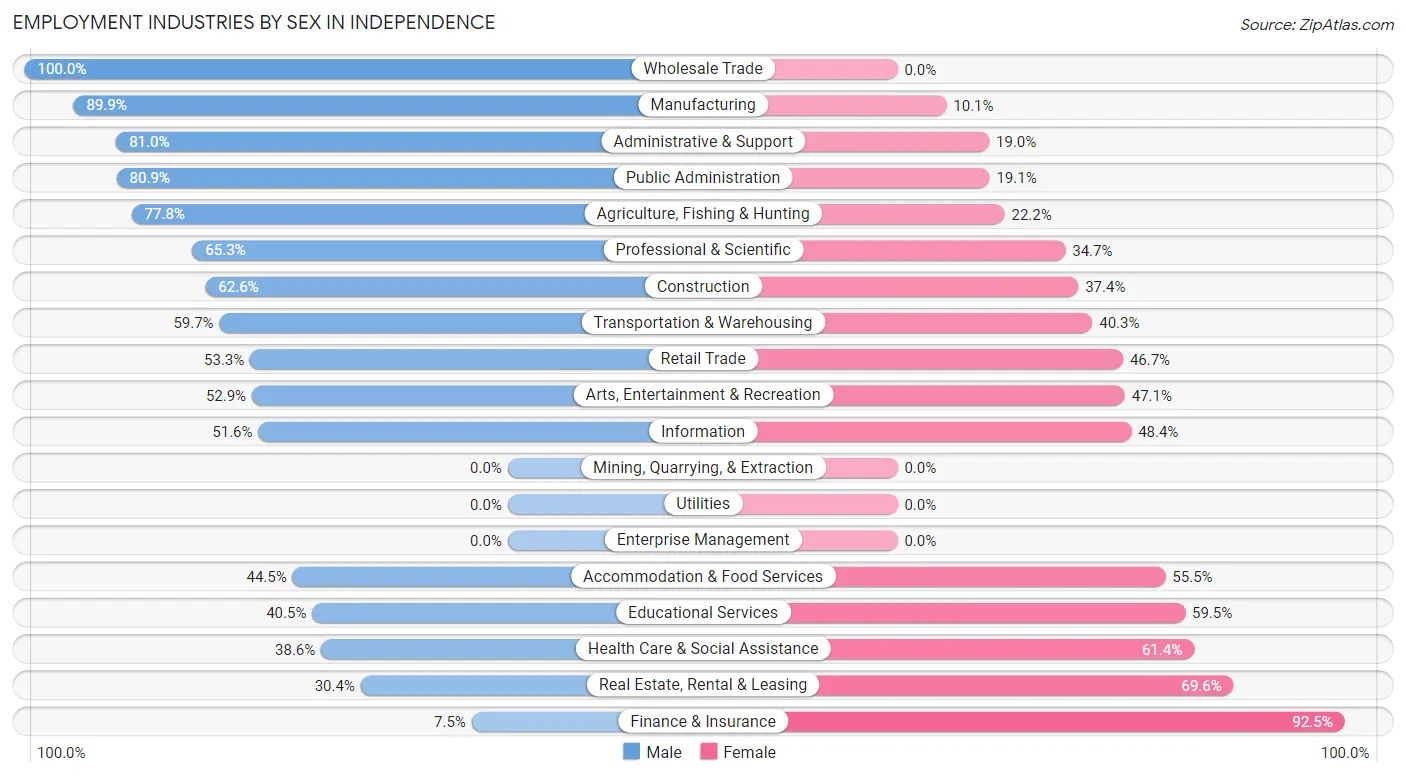
Employment Industries by Sex in Independence
The Independence industries that see more men than women are Wholesale Trade (100.0%), Manufacturing (89.9%), and Administrative & Support (81.0%), whereas the industries that tend to have a higher number of women are Finance & Insurance (92.5%), Real Estate, Rental & Leasing (69.6%), and Health Care & Social Assistance (61.4%).
| Industry | Male | Female |
| Agriculture, Fishing & Hunting | 309 (77.8%) | 88 (22.2%) |
| Mining, Quarrying, & Extraction | 0 (0.0%) | 0 (0.0%) |
| Construction | 224 (62.6%) | 134 (37.4%) |
| Manufacturing | 470 (89.9%) | 53 (10.1%) |
| Wholesale Trade | 77 (100.0%) | 0 (0.0%) |
| Retail Trade | 225 (53.3%) | 197 (46.7%) |
| Transportation & Warehousing | 145 (59.7%) | 98 (40.3%) |
| Utilities | 0 (0.0%) | 0 (0.0%) |
| Information | 48 (51.6%) | 45 (48.4%) |
| Finance & Insurance | 17 (7.5%) | 211 (92.5%) |
| Real Estate, Rental & Leasing | 14 (30.4%) | 32 (69.6%) |
| Professional & Scientific | 62 (65.3%) | 33 (34.7%) |
| Enterprise Management | 0 (0.0%) | 0 (0.0%) |
| Administrative & Support | 427 (81.0%) | 100 (19.0%) |
| Educational Services | 142 (40.5%) | 209 (59.5%) |
| Health Care & Social Assistance | 329 (38.6%) | 523 (61.4%) |
| Arts, Entertainment & Recreation | 45 (52.9%) | 40 (47.1%) |
| Accommodation & Food Services | 167 (44.5%) | 208 (55.5%) |
| Public Administration | 395 (80.9%) | 93 (19.1%) |
| Total | 3,166 (59.4%) | 2,163 (40.6%) |
Education in Independence
School Enrollment in Independence
The most common levels of schooling among the 2,814 students in Independence are college / undergraduate (808 | 28.7%), middle school (599 | 21.3%), and elementary school (574 | 20.4%).
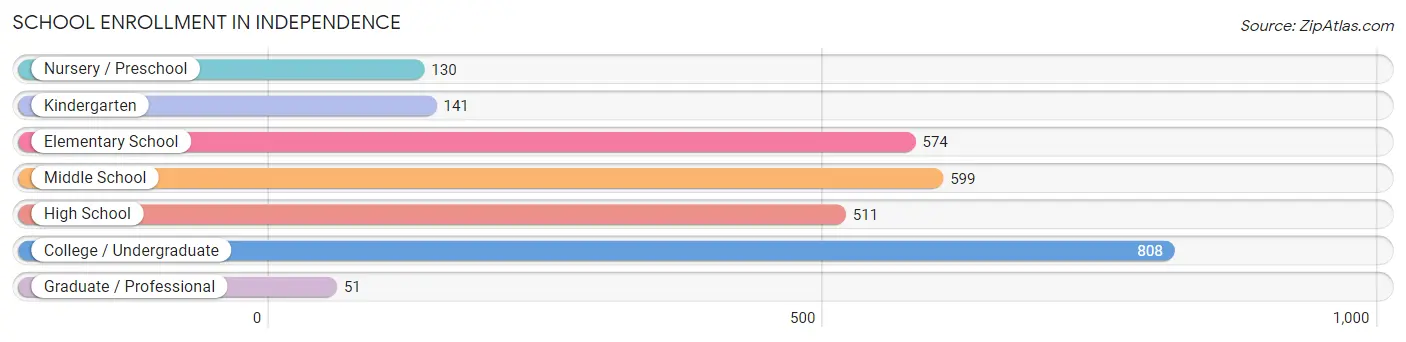
| School Level | # Students | % Students |
| Nursery / Preschool | 130 | 4.6% |
| Kindergarten | 141 | 5.0% |
| Elementary School | 574 | 20.4% |
| Middle School | 599 | 21.3% |
| High School | 511 | 18.2% |
| College / Undergraduate | 808 | 28.7% |
| Graduate / Professional | 51 | 1.8% |
| Total | 2,814 | 100.0% |
School Enrollment by Age by Funding Source in Independence
Out of a total of 2,814 students who are enrolled in schools in Independence, 197 (7.0%) attend a private institution, while the remaining 2,617 (93.0%) are enrolled in public schools. The age group of 18 to 19 year olds has the highest likelihood of being enrolled in private schools, with 50 (28.7% in the age bracket) enrolled. Conversely, the age group of 25 to 34 year olds has the lowest likelihood of being enrolled in a private school, with 166 (100.0% in the age bracket) attending a public institution.
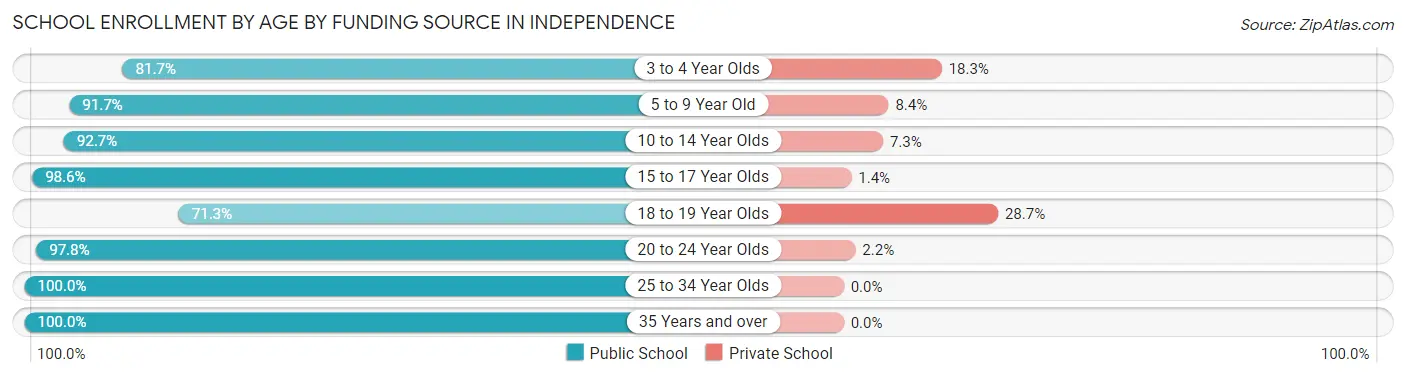
| Age Bracket | Public School | Private School |
| 3 to 4 Year Olds | 94 (81.7%) | 21 (18.3%) |
| 5 to 9 Year Old | 604 (91.6%) | 55 (8.4%) |
| 10 to 14 Year Olds | 684 (92.7%) | 54 (7.3%) |
| 15 to 17 Year Olds | 414 (98.6%) | 6 (1.4%) |
| 18 to 19 Year Olds | 124 (71.3%) | 50 (28.7%) |
| 20 to 24 Year Olds | 492 (97.8%) | 11 (2.2%) |
| 25 to 34 Year Olds | 166 (100.0%) | 0 (0.0%) |
| 35 Years and over | 39 (100.0%) | 0 (0.0%) |
| Total | 2,617 (93.0%) | 197 (7.0%) |
Educational Attainment by Field of Study in Independence
Arts & humanities (294 | 22.8%), business (194 | 15.1%), education (164 | 12.7%), bio, nature & agricultural (83 | 6.4%), and psychology (74 | 5.8%) are the most common fields of study among 1,288 individuals in Independence who have obtained a bachelor's degree or higher.
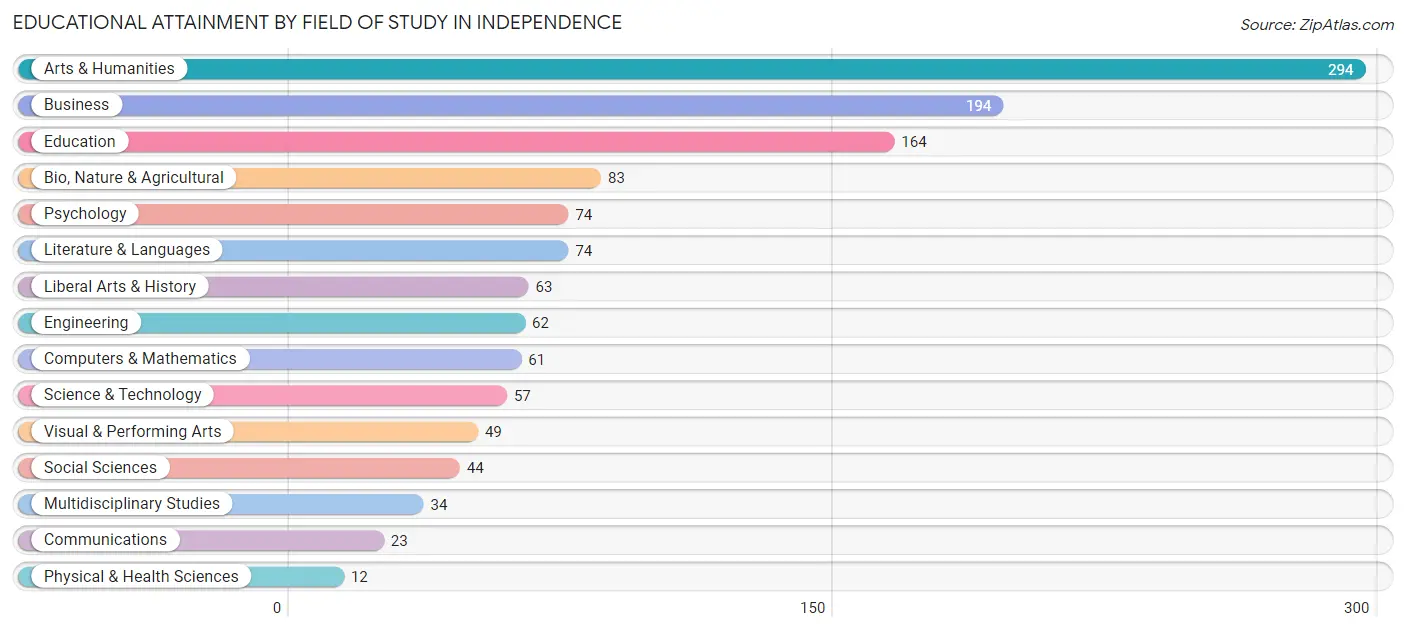
| Field of Study | # Graduates | % Graduates |
| Computers & Mathematics | 61 | 4.7% |
| Bio, Nature & Agricultural | 83 | 6.4% |
| Physical & Health Sciences | 12 | 0.9% |
| Psychology | 74 | 5.8% |
| Social Sciences | 44 | 3.4% |
| Engineering | 62 | 4.8% |
| Multidisciplinary Studies | 34 | 2.6% |
| Science & Technology | 57 | 4.4% |
| Business | 194 | 15.1% |
| Education | 164 | 12.7% |
| Literature & Languages | 74 | 5.8% |
| Liberal Arts & History | 63 | 4.9% |
| Visual & Performing Arts | 49 | 3.8% |
| Communications | 23 | 1.8% |
| Arts & Humanities | 294 | 22.8% |
| Total | 1,288 | 100.0% |
Transportation & Commute in Independence
Vehicle Availability by Sex in Independence
The most prevalent vehicle ownership categories in Independence are males with 2 vehicles (998, accounting for 31.6%) and females with 2 vehicles (685, making up 48.7%).
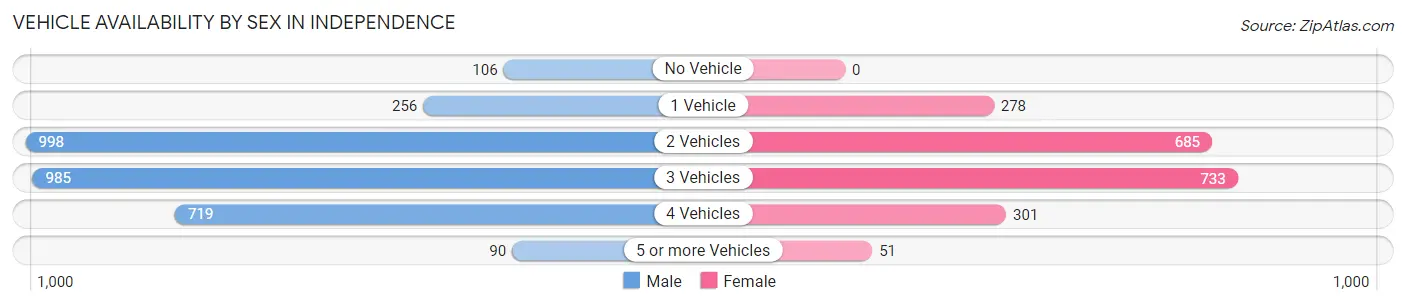
| Vehicles Available | Male | Female |
| No Vehicle | 106 (3.4%) | 0 (0.0%) |
| 1 Vehicle | 256 (8.1%) | 278 (13.6%) |
| 2 Vehicles | 998 (31.6%) | 685 (33.5%) |
| 3 Vehicles | 985 (31.2%) | 733 (35.8%) |
| 4 Vehicles | 719 (22.8%) | 301 (14.7%) |
| 5 or more Vehicles | 90 (2.9%) | 51 (2.5%) |
| Total | 3,154 (100.0%) | 2,048 (100.0%) |
Commute Time in Independence
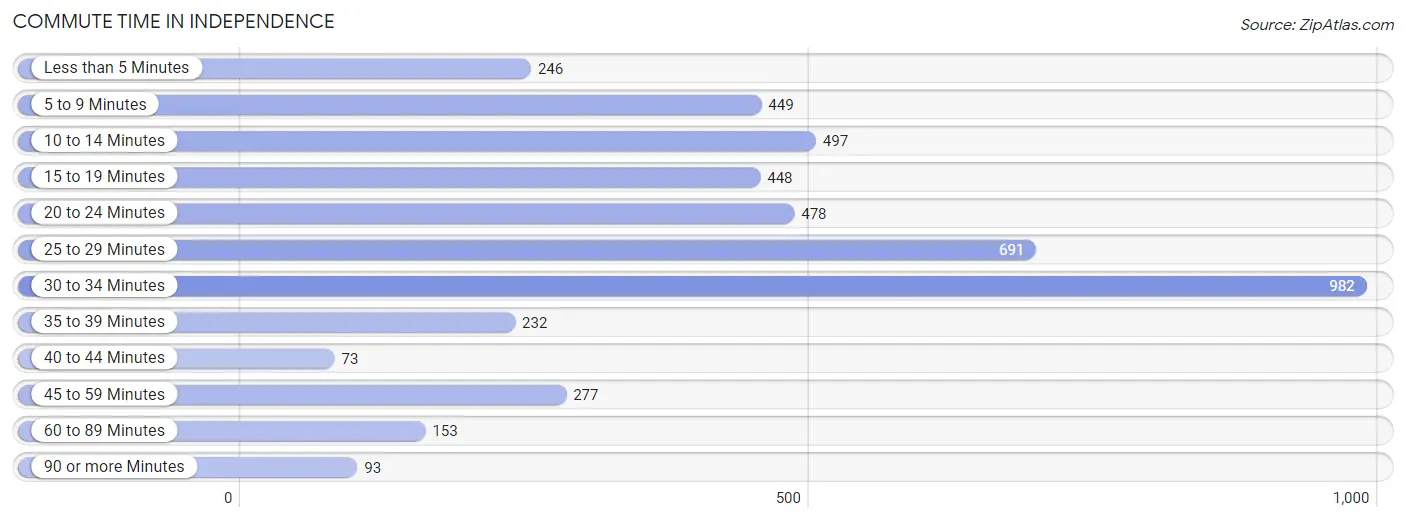
The most frequently occuring commute durations in Independence are 30 to 34 minutes (982 commuters, 21.3%), 25 to 29 minutes (691 commuters, 15.0%), and 10 to 14 minutes (497 commuters, 10.8%).
| Commute Time | # Commuters | % Commuters |
| Less than 5 Minutes | 246 | 5.3% |
| 5 to 9 Minutes | 449 | 9.7% |
| 10 to 14 Minutes | 497 | 10.8% |
| 15 to 19 Minutes | 448 | 9.7% |
| 20 to 24 Minutes | 478 | 10.3% |
| 25 to 29 Minutes | 691 | 15.0% |
| 30 to 34 Minutes | 982 | 21.3% |
| 35 to 39 Minutes | 232 | 5.0% |
| 40 to 44 Minutes | 73 | 1.6% |
| 45 to 59 Minutes | 277 | 6.0% |
| 60 to 89 Minutes | 153 | 3.3% |
| 90 or more Minutes | 93 | 2.0% |
Commute Time by Sex in Independence
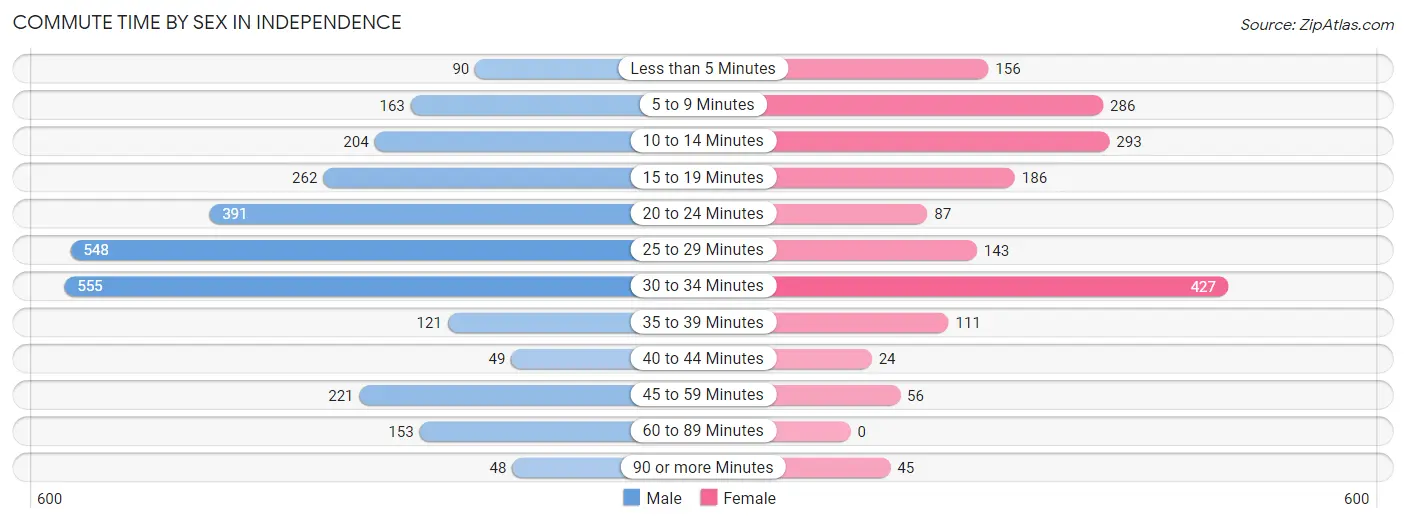
The most common commute times in Independence are 30 to 34 minutes (555 commuters, 19.8%) for males and 30 to 34 minutes (427 commuters, 23.5%) for females.
| Commute Time | Male | Female |
| Less than 5 Minutes | 90 (3.2%) | 156 (8.6%) |
| 5 to 9 Minutes | 163 (5.8%) | 286 (15.8%) |
| 10 to 14 Minutes | 204 (7.3%) | 293 (16.2%) |
| 15 to 19 Minutes | 262 (9.3%) | 186 (10.2%) |
| 20 to 24 Minutes | 391 (13.9%) | 87 (4.8%) |
| 25 to 29 Minutes | 548 (19.5%) | 143 (7.9%) |
| 30 to 34 Minutes | 555 (19.8%) | 427 (23.5%) |
| 35 to 39 Minutes | 121 (4.3%) | 111 (6.1%) |
| 40 to 44 Minutes | 49 (1.8%) | 24 (1.3%) |
| 45 to 59 Minutes | 221 (7.9%) | 56 (3.1%) |
| 60 to 89 Minutes | 153 (5.4%) | 0 (0.0%) |
| 90 or more Minutes | 48 (1.7%) | 45 (2.5%) |
Time of Departure to Work by Sex in Independence
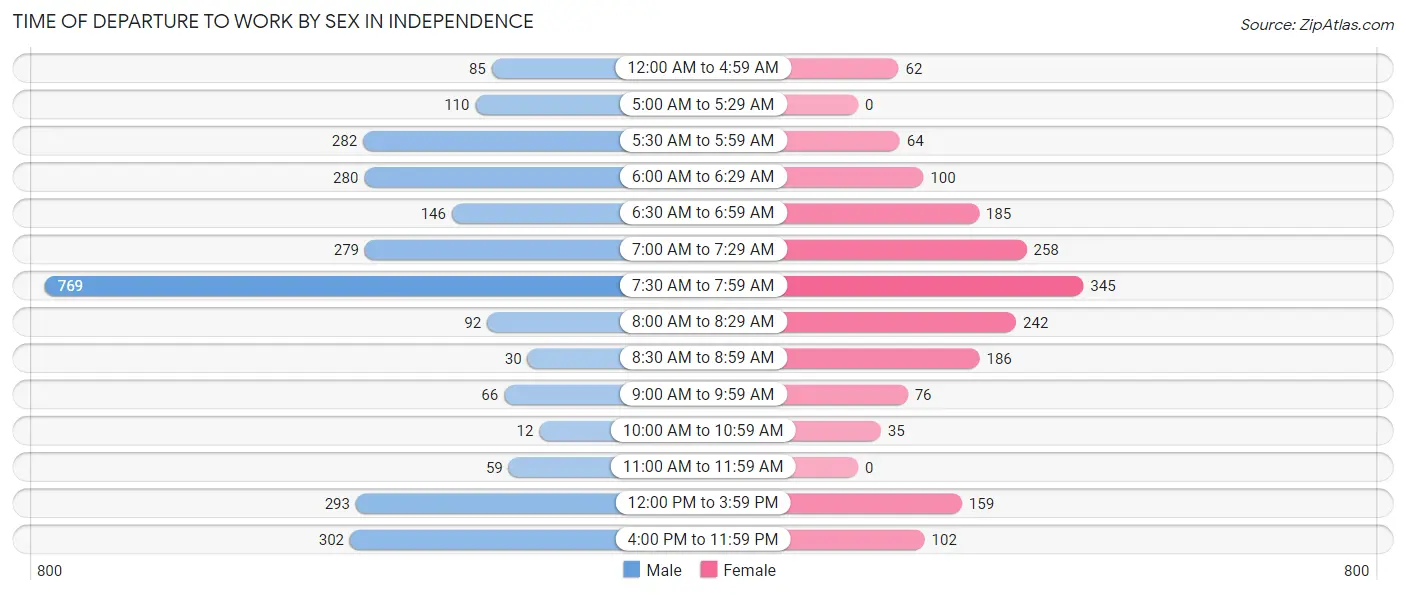
The most frequent times of departure to work in Independence are 7:30 AM to 7:59 AM (769, 27.4%) for males and 7:30 AM to 7:59 AM (345, 19.0%) for females.
| Time of Departure | Male | Female |
| 12:00 AM to 4:59 AM | 85 (3.0%) | 62 (3.4%) |
| 5:00 AM to 5:29 AM | 110 (3.9%) | 0 (0.0%) |
| 5:30 AM to 5:59 AM | 282 (10.1%) | 64 (3.5%) |
| 6:00 AM to 6:29 AM | 280 (10.0%) | 100 (5.5%) |
| 6:30 AM to 6:59 AM | 146 (5.2%) | 185 (10.2%) |
| 7:00 AM to 7:29 AM | 279 (10.0%) | 258 (14.2%) |
| 7:30 AM to 7:59 AM | 769 (27.4%) | 345 (19.0%) |
| 8:00 AM to 8:29 AM | 92 (3.3%) | 242 (13.3%) |
| 8:30 AM to 8:59 AM | 30 (1.1%) | 186 (10.2%) |
| 9:00 AM to 9:59 AM | 66 (2.4%) | 76 (4.2%) |
| 10:00 AM to 10:59 AM | 12 (0.4%) | 35 (1.9%) |
| 11:00 AM to 11:59 AM | 59 (2.1%) | 0 (0.0%) |
| 12:00 PM to 3:59 PM | 293 (10.4%) | 159 (8.8%) |
| 4:00 PM to 11:59 PM | 302 (10.8%) | 102 (5.6%) |
| Total | 2,805 (100.0%) | 1,814 (100.0%) |
Housing Occupancy in Independence
Occupancy by Ownership in Independence
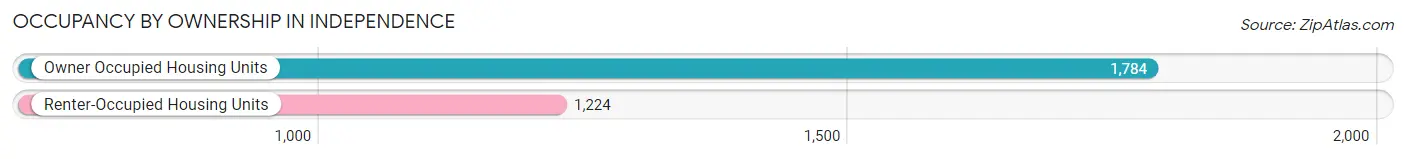
Of the total 3,008 dwellings in Independence, owner-occupied units account for 1,784 (59.3%), while renter-occupied units make up 1,224 (40.7%).
| Occupancy | # Housing Units | % Housing Units |
| Owner Occupied Housing Units | 1,784 | 59.3% |
| Renter-Occupied Housing Units | 1,224 | 40.7% |
| Total Occupied Housing Units | 3,008 | 100.0% |
Occupancy by Household Size in Independence
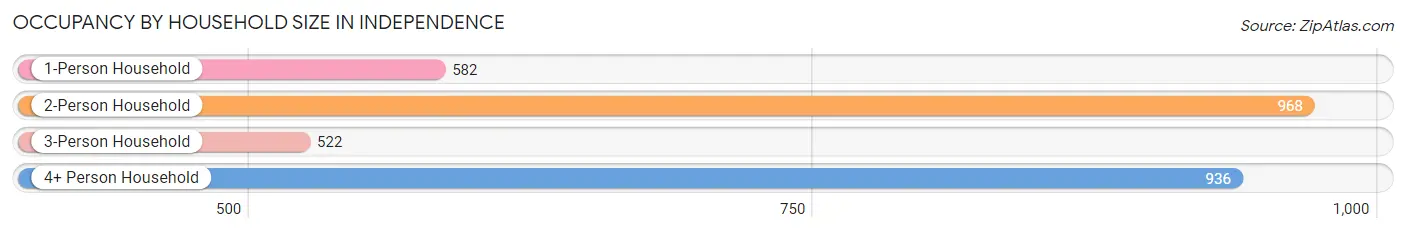
| Household Size | # Housing Units | % Housing Units |
| 1-Person Household | 582 | 19.4% |
| 2-Person Household | 968 | 32.2% |
| 3-Person Household | 522 | 17.3% |
| 4+ Person Household | 936 | 31.1% |
| Total Housing Units | 3,008 | 100.0% |
Occupancy by Ownership by Household Size in Independence
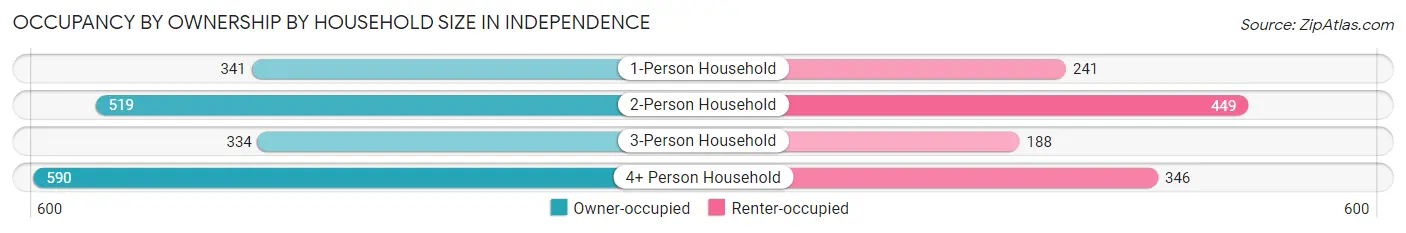
| Household Size | Owner-occupied | Renter-occupied |
| 1-Person Household | 341 (58.6%) | 241 (41.4%) |
| 2-Person Household | 519 (53.6%) | 449 (46.4%) |
| 3-Person Household | 334 (64.0%) | 188 (36.0%) |
| 4+ Person Household | 590 (63.0%) | 346 (37.0%) |
| Total Housing Units | 1,784 (59.3%) | 1,224 (40.7%) |
Occupancy by Educational Attainment in Independence
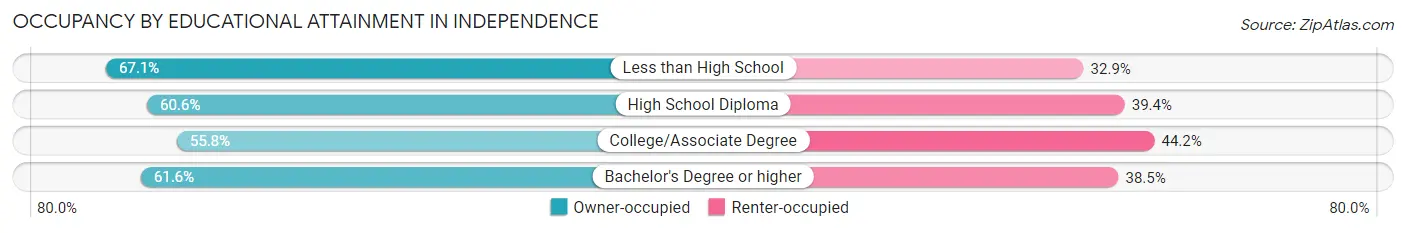
| Household Size | Owner-occupied | Renter-occupied |
| Less than High School | 159 (67.1%) | 78 (32.9%) |
| High School Diploma | 447 (60.6%) | 291 (39.4%) |
| College/Associate Degree | 717 (55.8%) | 567 (44.2%) |
| Bachelor's Degree or higher | 461 (61.6%) | 288 (38.5%) |
Occupancy by Age of Householder in Independence
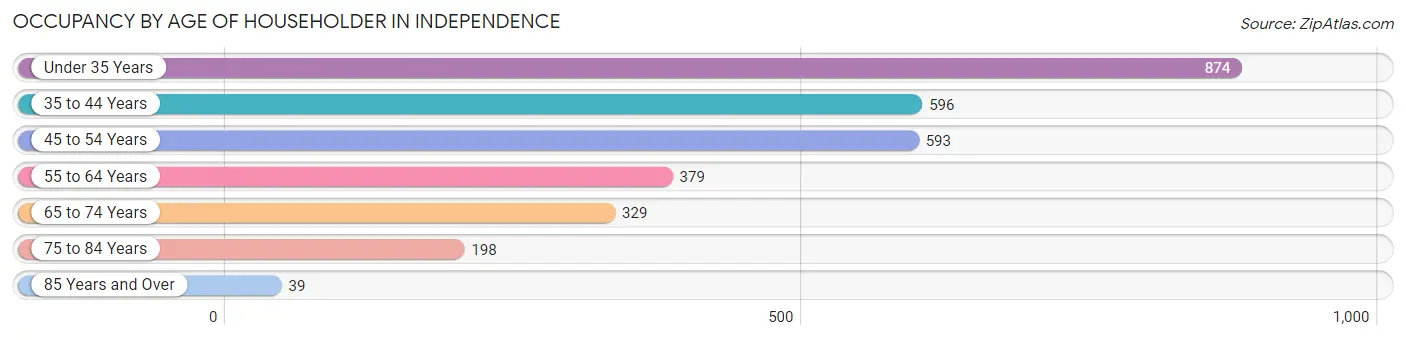
| Age Bracket | # Households | % Households |
| Under 35 Years | 874 | 29.1% |
| 35 to 44 Years | 596 | 19.8% |
| 45 to 54 Years | 593 | 19.7% |
| 55 to 64 Years | 379 | 12.6% |
| 65 to 74 Years | 329 | 10.9% |
| 75 to 84 Years | 198 | 6.6% |
| 85 Years and Over | 39 | 1.3% |
| Total | 3,008 | 100.0% |
Housing Finances in Independence
Median Income by Occupancy in Independence
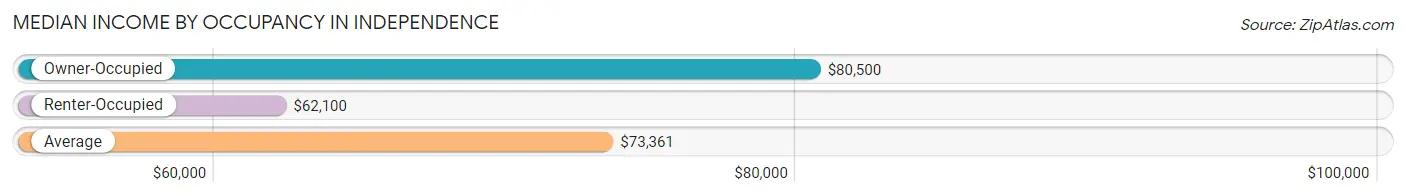
| Occupancy Type | # Households | Median Income |
| Owner-Occupied | 1,784 (59.3%) | $80,500 |
| Renter-Occupied | 1,224 (40.7%) | $62,100 |
| Average | 3,008 (100.0%) | $73,361 |
Occupancy by Householder Income Bracket in Independence
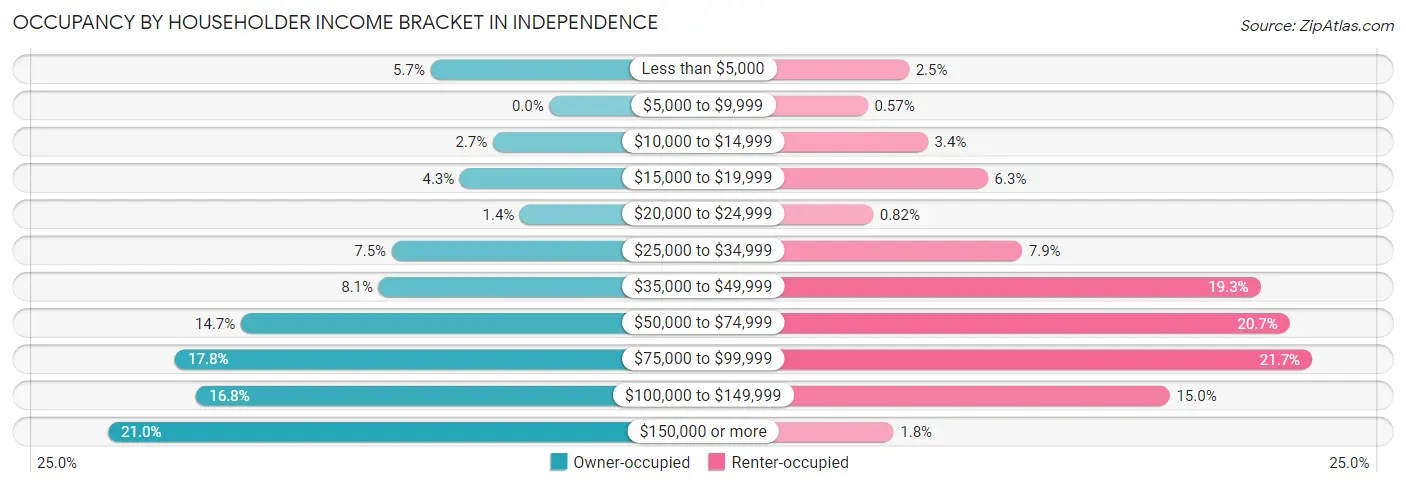
| Income Bracket | Owner-occupied | Renter-occupied |
| Less than $5,000 | 101 (5.7%) | 31 (2.5%) |
| $5,000 to $9,999 | 0 (0.0%) | 7 (0.6%) |
| $10,000 to $14,999 | 48 (2.7%) | 42 (3.4%) |
| $15,000 to $19,999 | 76 (4.3%) | 77 (6.3%) |
| $20,000 to $24,999 | 25 (1.4%) | 10 (0.8%) |
| $25,000 to $34,999 | 134 (7.5%) | 97 (7.9%) |
| $35,000 to $49,999 | 145 (8.1%) | 236 (19.3%) |
| $50,000 to $74,999 | 262 (14.7%) | 253 (20.7%) |
| $75,000 to $99,999 | 318 (17.8%) | 266 (21.7%) |
| $100,000 to $149,999 | 300 (16.8%) | 183 (14.9%) |
| $150,000 or more | 375 (21.0%) | 22 (1.8%) |
| Total | 1,784 (100.0%) | 1,224 (100.0%) |
Monthly Housing Cost Tiers in Independence
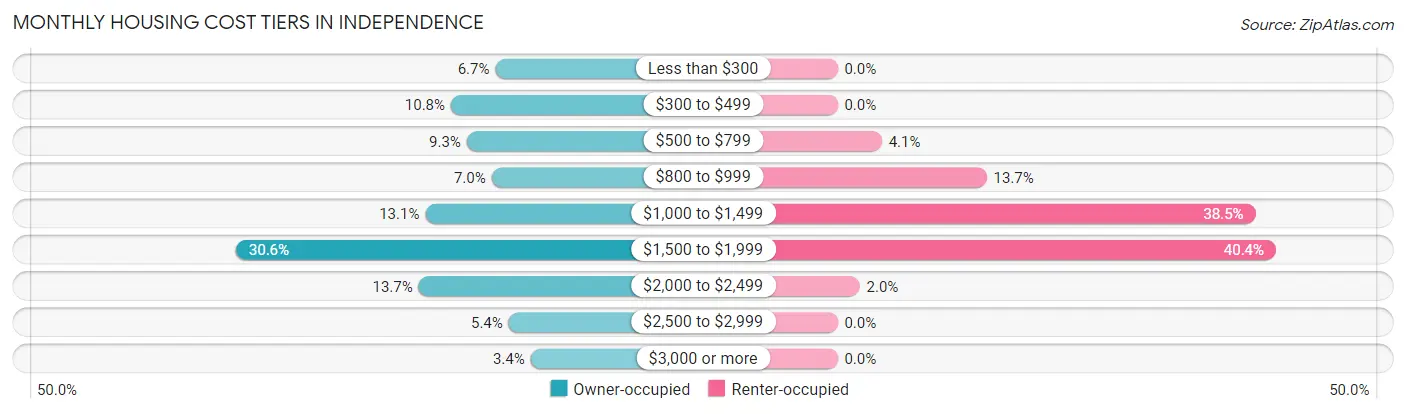
| Monthly Cost | Owner-occupied | Renter-occupied |
| Less than $300 | 119 (6.7%) | 0 (0.0%) |
| $300 to $499 | 192 (10.8%) | 0 (0.0%) |
| $500 to $799 | 166 (9.3%) | 50 (4.1%) |
| $800 to $999 | 125 (7.0%) | 168 (13.7%) |
| $1,000 to $1,499 | 234 (13.1%) | 471 (38.5%) |
| $1,500 to $1,999 | 545 (30.5%) | 494 (40.4%) |
| $2,000 to $2,499 | 245 (13.7%) | 25 (2.0%) |
| $2,500 to $2,999 | 97 (5.4%) | 0 (0.0%) |
| $3,000 or more | 61 (3.4%) | 0 (0.0%) |
| Total | 1,784 (100.0%) | 1,224 (100.0%) |
Physical Housing Characteristics in Independence
Housing Structures in Independence
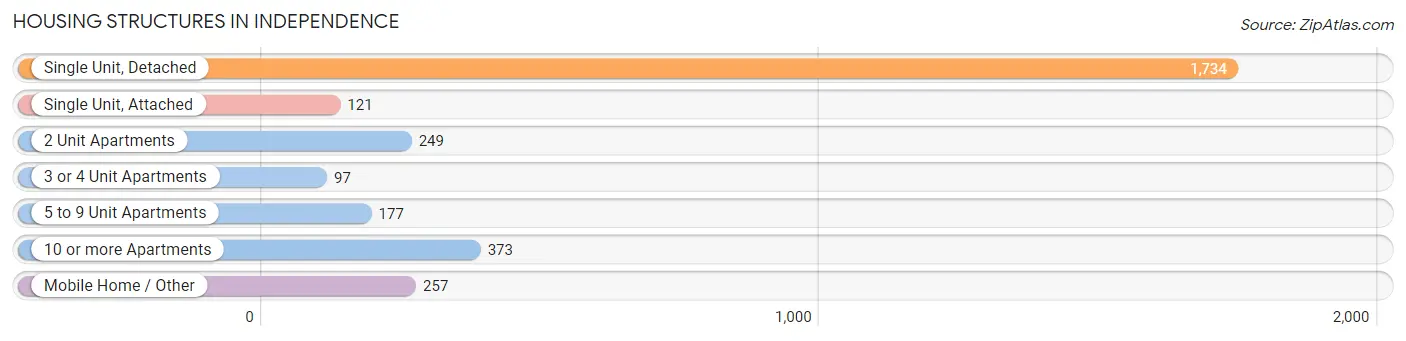
| Structure Type | # Housing Units | % Housing Units |
| Single Unit, Detached | 1,734 | 57.7% |
| Single Unit, Attached | 121 | 4.0% |
| 2 Unit Apartments | 249 | 8.3% |
| 3 or 4 Unit Apartments | 97 | 3.2% |
| 5 to 9 Unit Apartments | 177 | 5.9% |
| 10 or more Apartments | 373 | 12.4% |
| Mobile Home / Other | 257 | 8.5% |
| Total | 3,008 | 100.0% |
Housing Structures by Occupancy in Independence
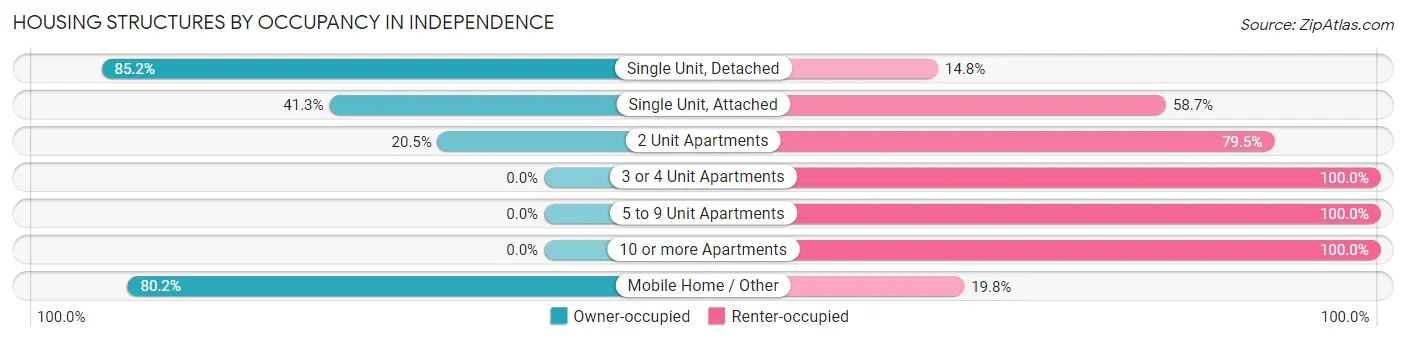
| Structure Type | Owner-occupied | Renter-occupied |
| Single Unit, Detached | 1,477 (85.2%) | 257 (14.8%) |
| Single Unit, Attached | 50 (41.3%) | 71 (58.7%) |
| 2 Unit Apartments | 51 (20.5%) | 198 (79.5%) |
| 3 or 4 Unit Apartments | 0 (0.0%) | 97 (100.0%) |
| 5 to 9 Unit Apartments | 0 (0.0%) | 177 (100.0%) |
| 10 or more Apartments | 0 (0.0%) | 373 (100.0%) |
| Mobile Home / Other | 206 (80.2%) | 51 (19.8%) |
| Total | 1,784 (59.3%) | 1,224 (40.7%) |
Housing Structures by Number of Rooms in Independence
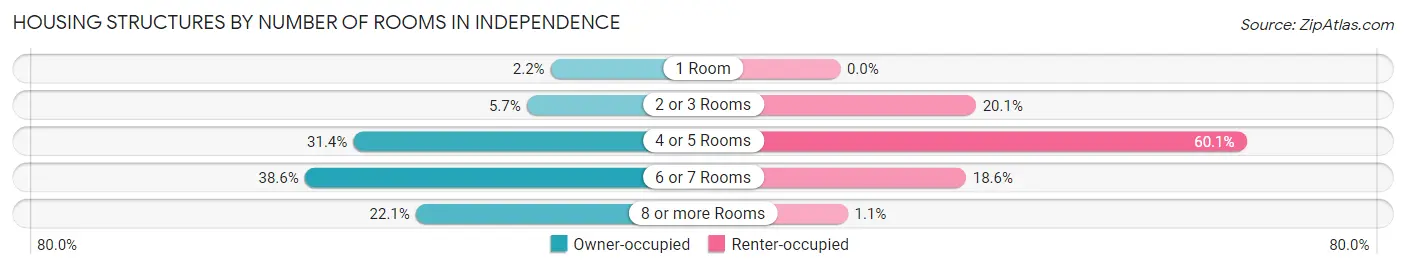
| Number of Rooms | Owner-occupied | Renter-occupied |
| 1 Room | 39 (2.2%) | 0 (0.0%) |
| 2 or 3 Rooms | 102 (5.7%) | 246 (20.1%) |
| 4 or 5 Rooms | 560 (31.4%) | 736 (60.1%) |
| 6 or 7 Rooms | 688 (38.6%) | 228 (18.6%) |
| 8 or more Rooms | 395 (22.1%) | 14 (1.1%) |
| Total | 1,784 (100.0%) | 1,224 (100.0%) |
Housing Structure by Heating Type in Independence
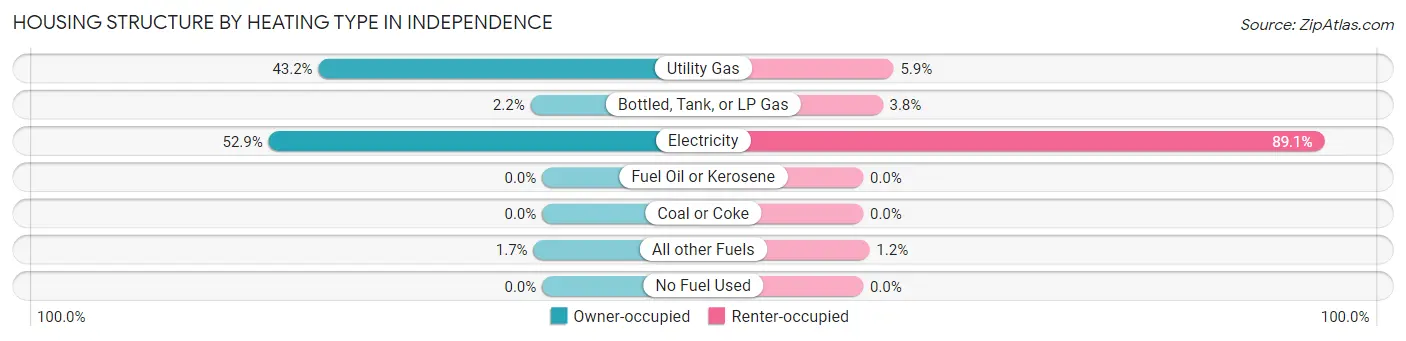
| Heating Type | Owner-occupied | Renter-occupied |
| Utility Gas | 771 (43.2%) | 72 (5.9%) |
| Bottled, Tank, or LP Gas | 40 (2.2%) | 46 (3.8%) |
| Electricity | 943 (52.9%) | 1,091 (89.1%) |
| Fuel Oil or Kerosene | 0 (0.0%) | 0 (0.0%) |
| Coal or Coke | 0 (0.0%) | 0 (0.0%) |
| All other Fuels | 30 (1.7%) | 15 (1.2%) |
| No Fuel Used | 0 (0.0%) | 0 (0.0%) |
| Total | 1,784 (100.0%) | 1,224 (100.0%) |
Household Vehicle Usage in Independence
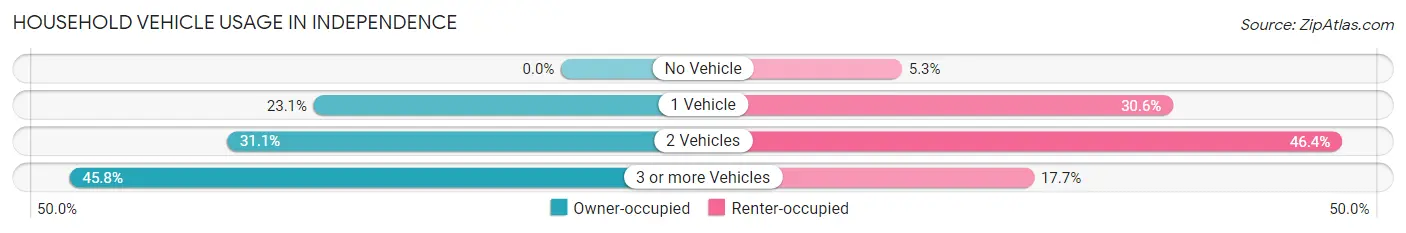
| Vehicles per Household | Owner-occupied | Renter-occupied |
| No Vehicle | 0 (0.0%) | 65 (5.3%) |
| 1 Vehicle | 412 (23.1%) | 375 (30.6%) |
| 2 Vehicles | 555 (31.1%) | 568 (46.4%) |
| 3 or more Vehicles | 817 (45.8%) | 216 (17.6%) |
| Total | 1,784 (100.0%) | 1,224 (100.0%) |
Real Estate & Mortgages in Independence
Real Estate and Mortgage Overview in Independence
| Characteristic | Without Mortgage | With Mortgage |
| Housing Units | 574 | 1,210 |
| Median Property Value | $198,900 | $308,500 |
| Median Household Income | $58,036 | $267 |
| Monthly Housing Costs | $488 | $61 |
| Real Estate Taxes | $2,555 | $19 |
Property Value by Mortgage Status in Independence
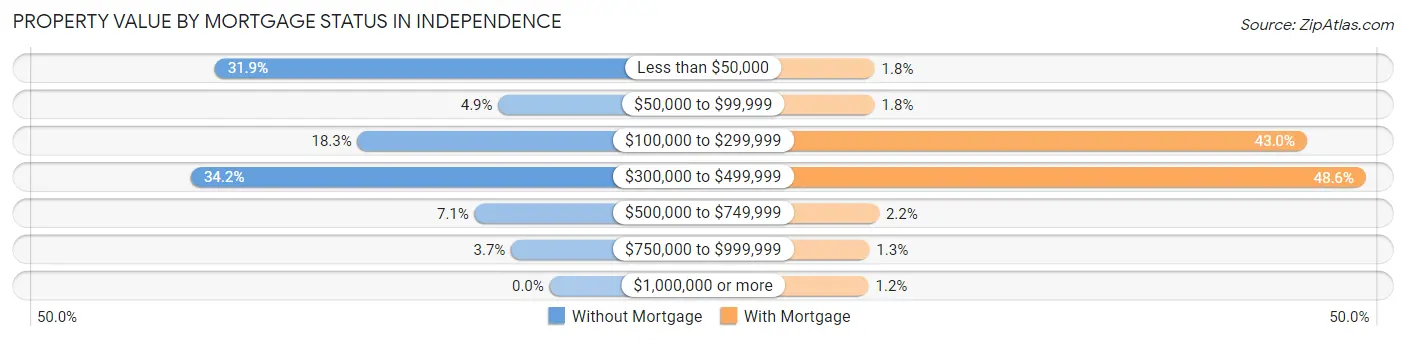
| Property Value | Without Mortgage | With Mortgage |
| Less than $50,000 | 183 (31.9%) | 22 (1.8%) |
| $50,000 to $99,999 | 28 (4.9%) | 22 (1.8%) |
| $100,000 to $299,999 | 105 (18.3%) | 520 (43.0%) |
| $300,000 to $499,999 | 196 (34.2%) | 588 (48.6%) |
| $500,000 to $749,999 | 41 (7.1%) | 27 (2.2%) |
| $750,000 to $999,999 | 21 (3.7%) | 16 (1.3%) |
| $1,000,000 or more | 0 (0.0%) | 15 (1.2%) |
| Total | 574 (100.0%) | 1,210 (100.0%) |
Household Income by Mortgage Status in Independence
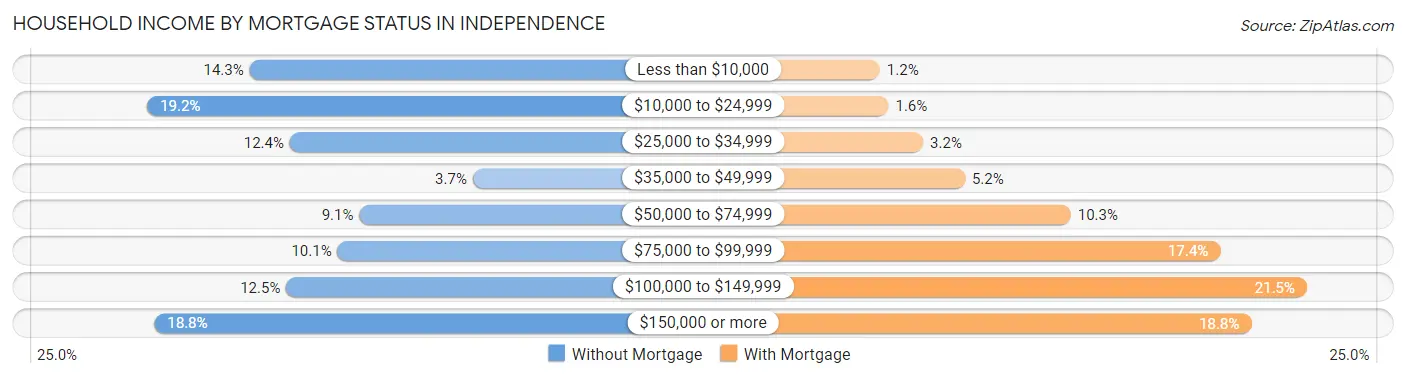
| Household Income | Without Mortgage | With Mortgage |
| Less than $10,000 | 82 (14.3%) | 14 (1.2%) |
| $10,000 to $24,999 | 110 (19.2%) | 19 (1.6%) |
| $25,000 to $34,999 | 71 (12.4%) | 39 (3.2%) |
| $35,000 to $49,999 | 21 (3.7%) | 63 (5.2%) |
| $50,000 to $74,999 | 52 (9.1%) | 124 (10.2%) |
| $75,000 to $99,999 | 58 (10.1%) | 210 (17.4%) |
| $100,000 to $149,999 | 72 (12.5%) | 260 (21.5%) |
| $150,000 or more | 108 (18.8%) | 228 (18.8%) |
| Total | 574 (100.0%) | 1,210 (100.0%) |
Property Value to Household Income Ratio in Independence
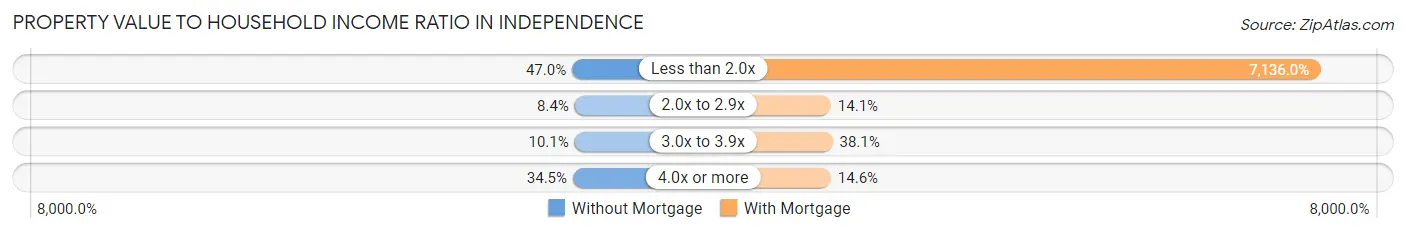
| Value-to-Income Ratio | Without Mortgage | With Mortgage |
| Less than 2.0x | 270 (47.0%) | 86,346 (7,136.0%) |
| 2.0x to 2.9x | 48 (8.4%) | 171 (14.1%) |
| 3.0x to 3.9x | 58 (10.1%) | 461 (38.1%) |
| 4.0x or more | 198 (34.5%) | 176 (14.5%) |
| Total | 574 (100.0%) | 1,210 (100.0%) |
Real Estate Taxes by Mortgage Status in Independence
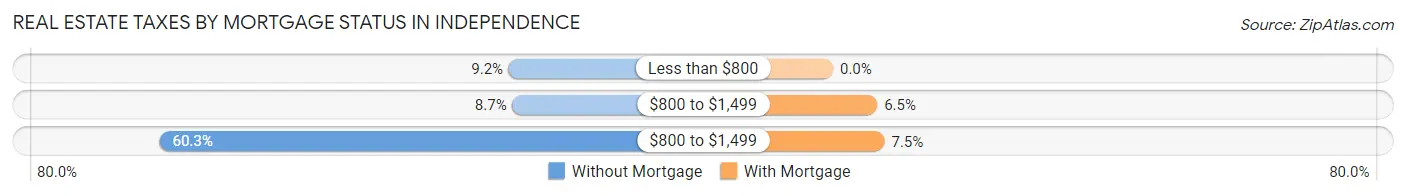
| Property Taxes | Without Mortgage | With Mortgage |
| Less than $800 | 53 (9.2%) | 0 (0.0%) |
| $800 to $1,499 | 50 (8.7%) | 78 (6.5%) |
| $800 to $1,499 | 346 (60.3%) | 91 (7.5%) |
| Total | 574 (100.0%) | 1,210 (100.0%) |
Health & Disability in Independence
Health Insurance Coverage by Age in Independence
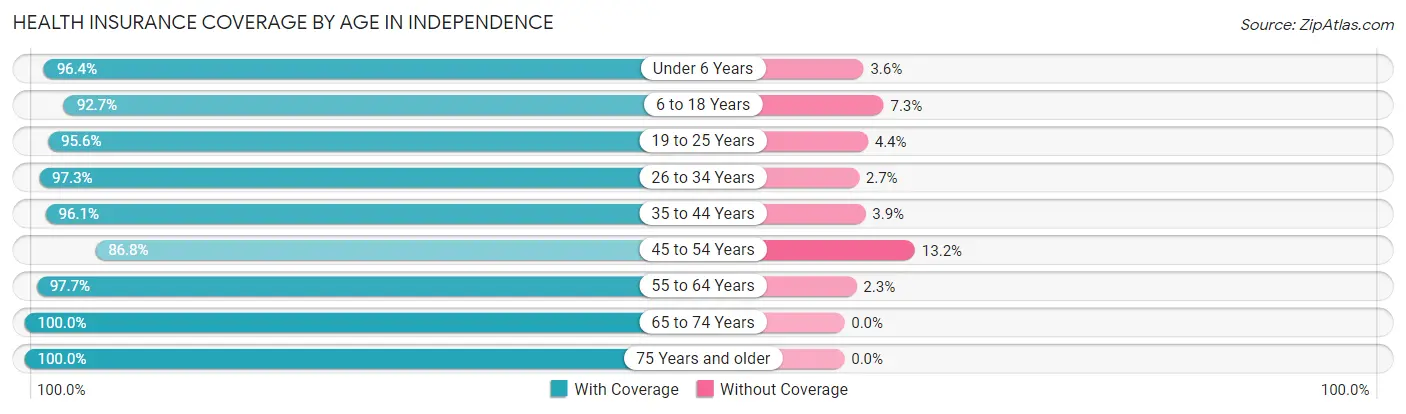
| Age Bracket | With Coverage | Without Coverage |
| Under 6 Years | 675 (96.4%) | 25 (3.6%) |
| 6 to 18 Years | 1,785 (92.7%) | 141 (7.3%) |
| 19 to 25 Years | 1,879 (95.6%) | 86 (4.4%) |
| 26 to 34 Years | 1,003 (97.3%) | 28 (2.7%) |
| 35 to 44 Years | 1,295 (96.1%) | 53 (3.9%) |
| 45 to 54 Years | 976 (86.8%) | 148 (13.2%) |
| 55 to 64 Years | 910 (97.7%) | 21 (2.3%) |
| 65 to 74 Years | 542 (100.0%) | 0 (0.0%) |
| 75 Years and older | 405 (100.0%) | 0 (0.0%) |
| Total | 9,470 (95.0%) | 502 (5.0%) |
Health Insurance Coverage by Citizenship Status in Independence
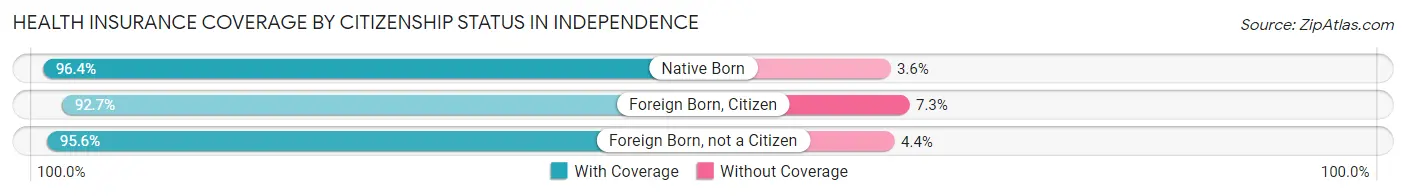
| Citizenship Status | With Coverage | Without Coverage |
| Native Born | 675 (96.4%) | 25 (3.6%) |
| Foreign Born, Citizen | 1,785 (92.7%) | 141 (7.3%) |
| Foreign Born, not a Citizen | 1,879 (95.6%) | 86 (4.4%) |
Health Insurance Coverage by Household Income in Independence
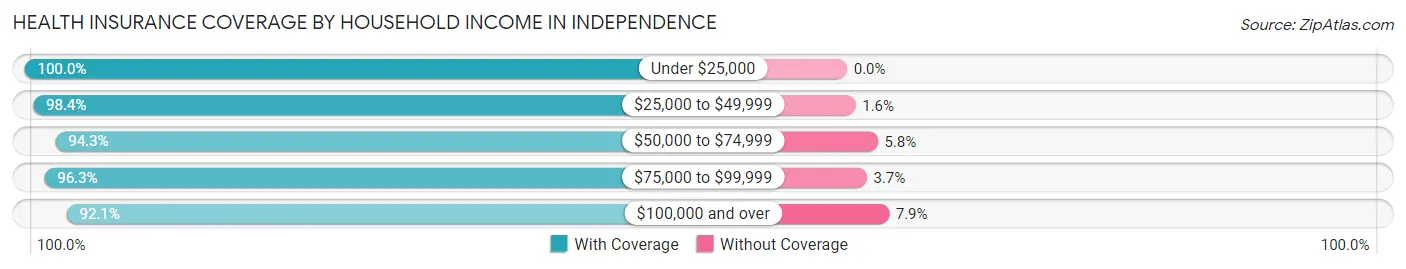
| Household Income | With Coverage | Without Coverage |
| Under $25,000 | 590 (100.0%) | 0 (0.0%) |
| $25,000 to $49,999 | 1,975 (98.4%) | 32 (1.6%) |
| $50,000 to $74,999 | 1,279 (94.3%) | 78 (5.8%) |
| $75,000 to $99,999 | 1,768 (96.3%) | 68 (3.7%) |
| $100,000 and over | 3,791 (92.1%) | 324 (7.9%) |
Public vs Private Health Insurance Coverage by Age in Independence
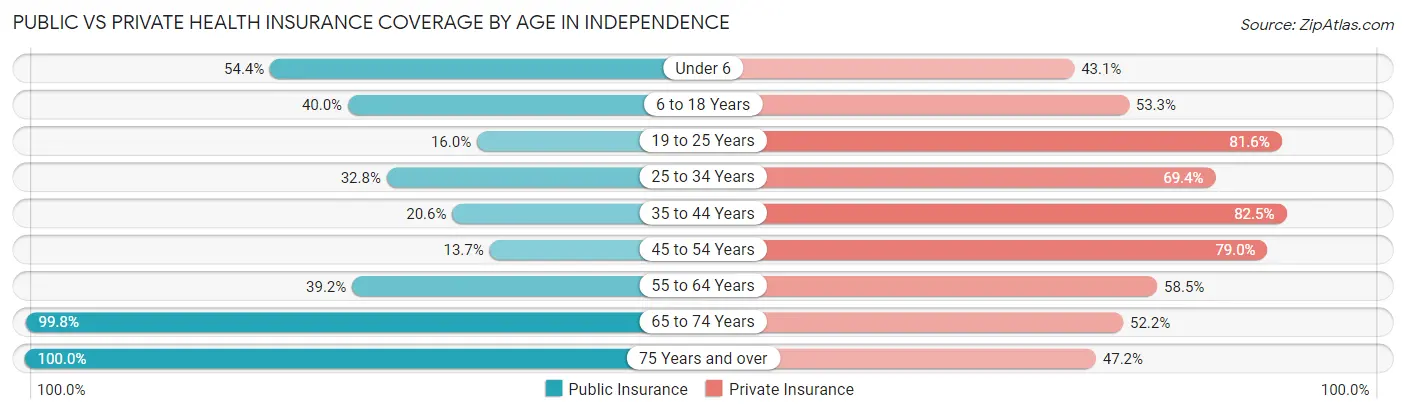
| Age Bracket | Public Insurance | Private Insurance |
| Under 6 | 381 (54.4%) | 302 (43.1%) |
| 6 to 18 Years | 770 (40.0%) | 1,026 (53.3%) |
| 19 to 25 Years | 315 (16.0%) | 1,604 (81.6%) |
| 25 to 34 Years | 338 (32.8%) | 715 (69.4%) |
| 35 to 44 Years | 278 (20.6%) | 1,112 (82.5%) |
| 45 to 54 Years | 154 (13.7%) | 888 (79.0%) |
| 55 to 64 Years | 365 (39.2%) | 545 (58.5%) |
| 65 to 74 Years | 541 (99.8%) | 283 (52.2%) |
| 75 Years and over | 405 (100.0%) | 191 (47.2%) |
| Total | 3,547 (35.6%) | 6,666 (66.8%) |
Disability Status by Sex by Age in Independence
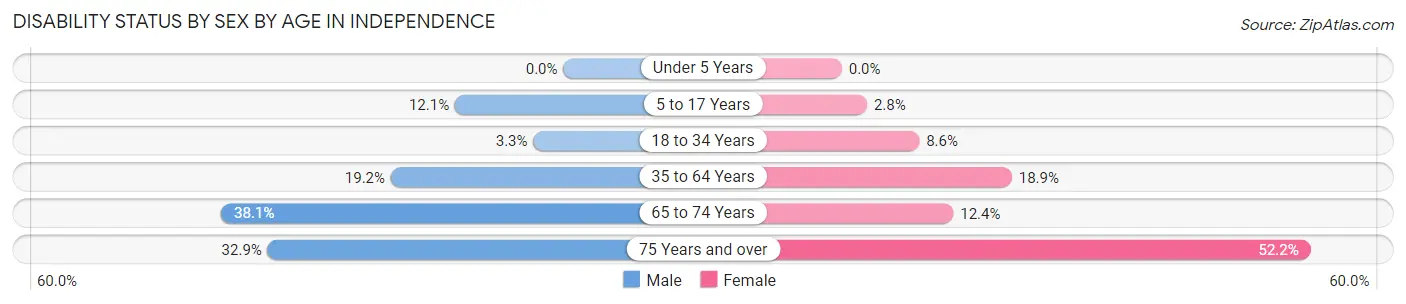
| Age Bracket | Male | Female |
| Under 5 Years | 0 (0.0%) | 0 (0.0%) |
| 5 to 17 Years | 105 (12.1%) | 31 (2.8%) |
| 18 to 34 Years | 59 (3.3%) | 112 (8.6%) |
| 35 to 64 Years | 339 (19.2%) | 310 (18.9%) |
| 65 to 74 Years | 93 (38.1%) | 37 (12.4%) |
| 75 Years and over | 81 (32.9%) | 83 (52.2%) |
Disability Class by Sex by Age in Independence
Disability Class: Hearing Difficulty
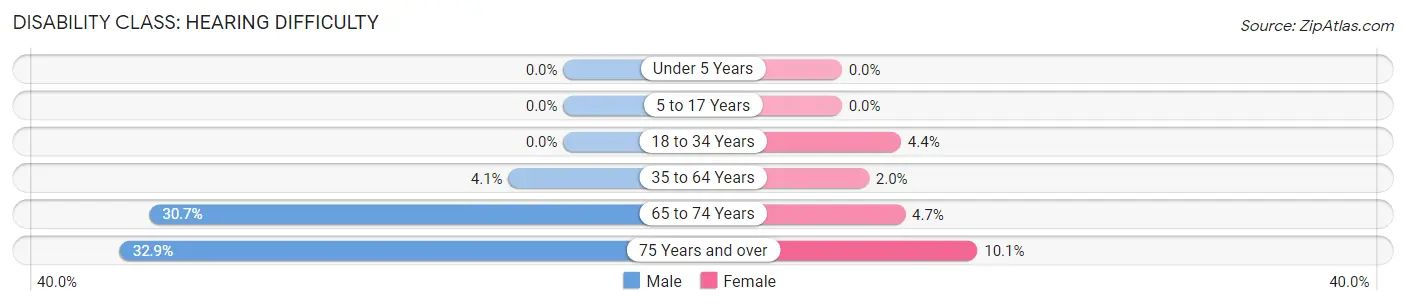
| Age Bracket | Male | Female |
| Under 5 Years | 0 (0.0%) | 0 (0.0%) |
| 5 to 17 Years | 0 (0.0%) | 0 (0.0%) |
| 18 to 34 Years | 0 (0.0%) | 57 (4.4%) |
| 35 to 64 Years | 72 (4.1%) | 33 (2.0%) |
| 65 to 74 Years | 75 (30.7%) | 14 (4.7%) |
| 75 Years and over | 81 (32.9%) | 16 (10.1%) |
Disability Class: Vision Difficulty
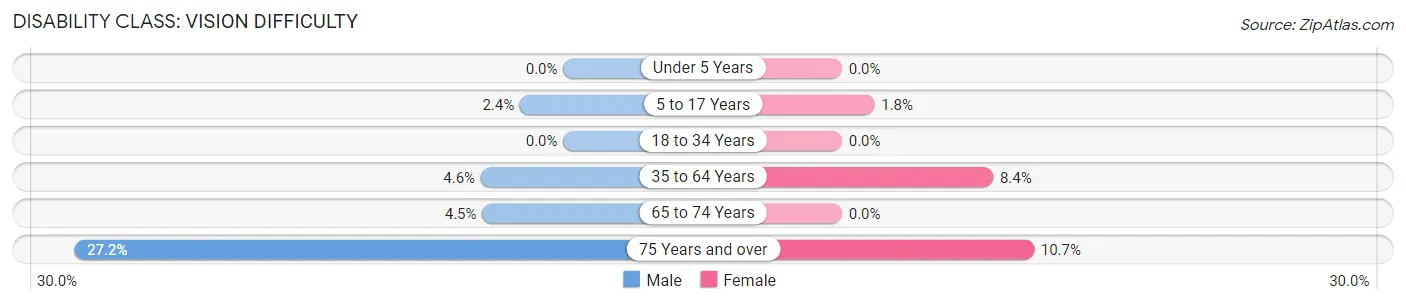
| Age Bracket | Male | Female |
| Under 5 Years | 0 (0.0%) | 0 (0.0%) |
| 5 to 17 Years | 21 (2.4%) | 20 (1.8%) |
| 18 to 34 Years | 0 (0.0%) | 0 (0.0%) |
| 35 to 64 Years | 81 (4.6%) | 138 (8.4%) |
| 65 to 74 Years | 11 (4.5%) | 0 (0.0%) |
| 75 Years and over | 67 (27.2%) | 17 (10.7%) |
Disability Class: Cognitive Difficulty
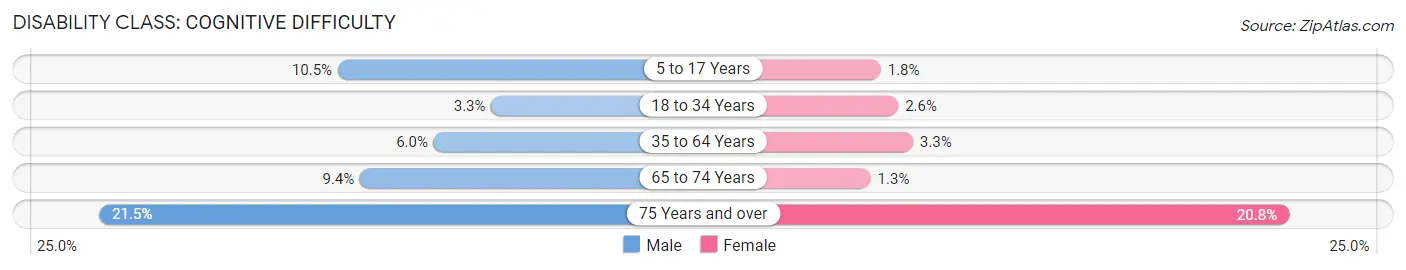
| Age Bracket | Male | Female |
| 5 to 17 Years | 91 (10.5%) | 20 (1.8%) |
| 18 to 34 Years | 59 (3.3%) | 34 (2.6%) |
| 35 to 64 Years | 106 (6.0%) | 54 (3.3%) |
| 65 to 74 Years | 23 (9.4%) | 4 (1.3%) |
| 75 Years and over | 53 (21.5%) | 33 (20.7%) |
Disability Class: Ambulatory Difficulty
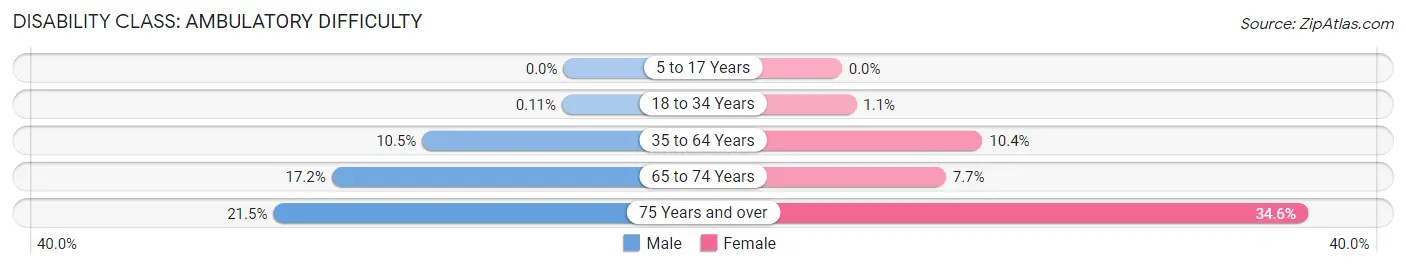
| Age Bracket | Male | Female |
| 5 to 17 Years | 0 (0.0%) | 0 (0.0%) |
| 18 to 34 Years | 2 (0.1%) | 14 (1.1%) |
| 35 to 64 Years | 185 (10.5%) | 171 (10.4%) |
| 65 to 74 Years | 42 (17.2%) | 23 (7.7%) |
| 75 Years and over | 53 (21.5%) | 55 (34.6%) |
Disability Class: Self-Care Difficulty
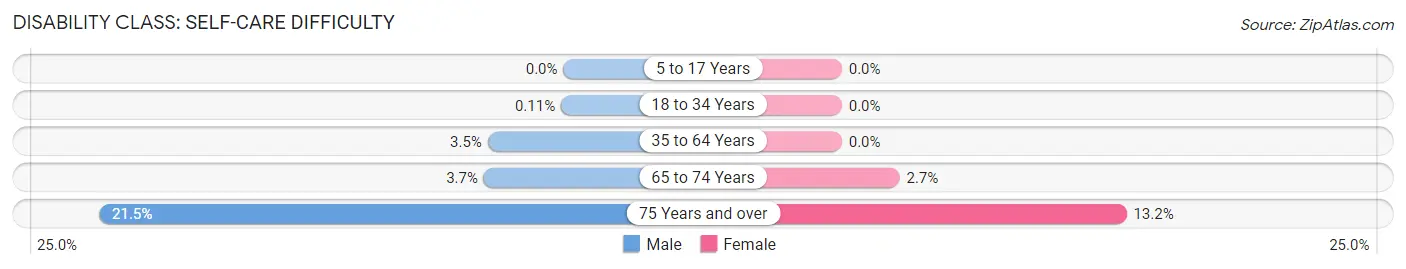
| Age Bracket | Male | Female |
| 5 to 17 Years | 0 (0.0%) | 0 (0.0%) |
| 18 to 34 Years | 2 (0.1%) | 0 (0.0%) |
| 35 to 64 Years | 62 (3.5%) | 0 (0.0%) |
| 65 to 74 Years | 9 (3.7%) | 8 (2.7%) |
| 75 Years and over | 53 (21.5%) | 21 (13.2%) |
Technology Access in Independence
Computing Device Access in Independence
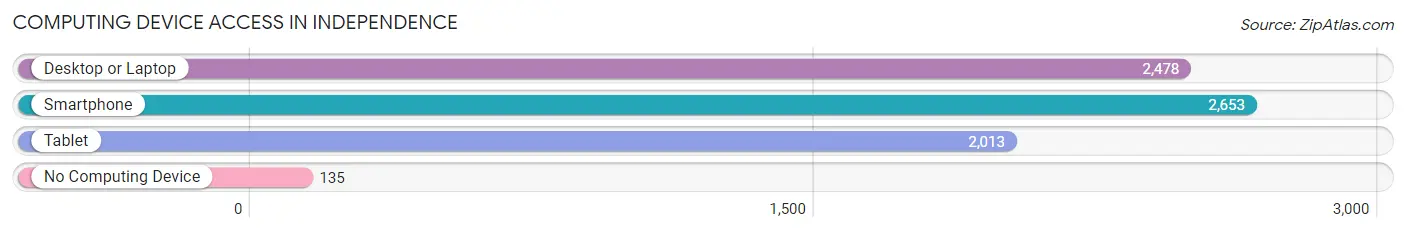
| Device Type | # Households | % Households |
| Desktop or Laptop | 2,478 | 82.4% |
| Smartphone | 2,653 | 88.2% |
| Tablet | 2,013 | 66.9% |
| No Computing Device | 135 | 4.5% |
| Total | 3,008 | 100.0% |
Internet Access in Independence
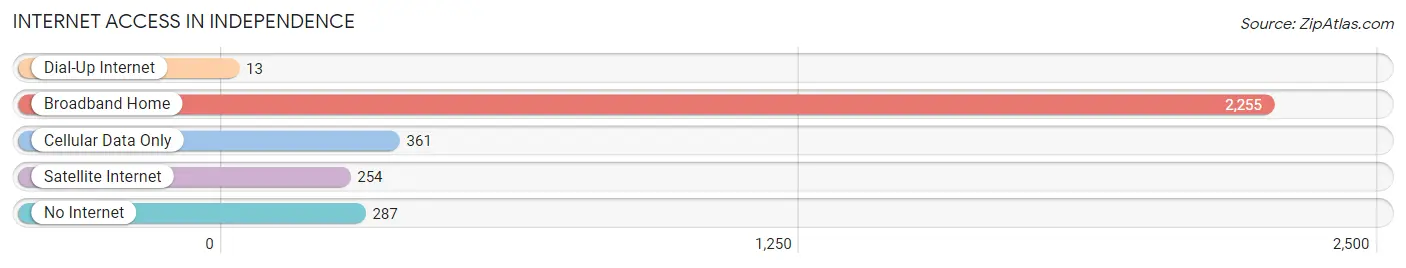
| Internet Type | # Households | % Households |
| Dial-Up Internet | 13 | 0.4% |
| Broadband Home | 2,255 | 75.0% |
| Cellular Data Only | 361 | 12.0% |
| Satellite Internet | 254 | 8.4% |
| No Internet | 287 | 9.5% |
| Total | 3,008 | 100.0% |
Independence Summary
Independence is a city located in Polk County, Oregon, United States. It is part of the Salem Metropolitan Statistical Area. The population was 8,590 at the 2010 census.
History
Independence was founded in 1845 by settlers from the Willamette Valley. The city was named after the Declaration of Independence, which was signed in 1776. The first post office was established in 1851.
In 1853, the Oregon and California Railroad was built through the city, connecting it to the rest of the state. This allowed for the growth of the city and the development of the local economy.
In 1859, the city was incorporated. The city was a major stop on the Oregon Trail, and many settlers passed through the city on their way to the Willamette Valley.
In the late 19th century, the city was a major center for the timber industry. The city was also home to several sawmills and lumber yards.
Geography
Independence is located at the confluence of the Willamette and Santiam Rivers. The city is situated in the foothills of the Cascade Mountains, and is surrounded by rolling hills and forests.
The city has a total area of 4 2 square miles all of which is land
Economy
The economy of Independence is largely based on agriculture and timber. The city is home to several farms and ranches, as well as several timber companies.
The city is also home to several manufacturing companies, including a paper mill and a furniture factory.
Demographics
As of the 2010 census, there were 8,590 people, 3,521 households, and 2,092 families residing in the city. The population density was 2,039.3 people per square mile.
The racial makeup of the city was 91.2% White, 0.7% African American, 0.7% Native American, 0.7% Asian, 0.1% Pacific Islander, 4.2% from other races, and 2.4% from two or more races. Hispanic or Latino of any race were 8.2% of the population.
The median income for a household in the city was $37,917, and the median income for a family was $45,938. The per capita income for the city was $18,945. About 11.2% of families and 14.3% of the population were below the poverty line, including 19.2% of those under age 18 and 8.2% of those age 65 or over.
Common Questions
What is Per Capita Income in Independence?
Per Capita income in Independence is $27,180.
What is the Median Family Income in Independence?
Median Family Income in Independence is $75,924.
What is the Median Household income in Independence?
Median Household Income in Independence is $73,361.
What is Income or Wage Gap in Independence?
Income or Wage Gap in Independence is 15.0%.
Women in Independence earn 85.0 cents for every dollar earned by a man.
What is Inequality or Gini Index in Independence?
Inequality or Gini Index in Independence is 0.38.
What is the Total Population of Independence?
Total Population of Independence is 9,981.
What is the Total Male Population of Independence?
Total Male Population of Independence is 5,110.
What is the Total Female Population of Independence?
Total Female Population of Independence is 4,871.
What is the Ratio of Males per 100 Females in Independence?
There are 104.91 Males per 100 Females in Independence.
What is the Ratio of Females per 100 Males in Independence?
There are 95.32 Females per 100 Males in Independence.
What is the Median Population Age in Independence?
Median Population Age in Independence is 29.7 Years.
What is the Average Family Size in Independence
Average Family Size in Independence is 3.9 People.
What is the Average Household Size in Independence
Average Household Size in Independence is 3.3 People.
How Large is the Labor Force in Independence?
There are 5,573 People in the Labor Forcein in Independence.
What is the Percentage of People in the Labor Force in Independence?
72.2% of People are in the Labor Force in Independence.
What is the Unemployment Rate in Independence?
Unemployment Rate in Independence is 4.4%.