Hines, OR Map & Demographics
Hines Map
Hines Overview
$25,392
PER CAPITA INCOME
$73,199
AVG FAMILY INCOME
$47,321
AVG HOUSEHOLD INCOME
2.2%
WAGE / INCOME GAP [ % ]
97.8¢/ $1
WAGE / INCOME GAP [ $ ]
0.42
INEQUALITY / GINI INDEX
1,608
TOTAL POPULATION
779
MALE POPULATION
829
FEMALE POPULATION
93.97
MALES / 100 FEMALES
106.42
FEMALES / 100 MALES
40.2
MEDIAN AGE
3.1
AVG FAMILY SIZE
2.4
AVG HOUSEHOLD SIZE
684
LABOR FORCE [ PEOPLE ]
54.7%
PERCENT IN LABOR FORCE
6.7%
UNEMPLOYMENT RATE
Hines Zip Codes
Hines Area Codes
Income in Hines
Income Overview in Hines
Per Capita Income in Hines is $25,392, while median incomes of families and households are $73,199 and $47,321 respectively.
| Characteristic | Number | Measure |
| Per Capita Income | 1,608 | $25,392 |
| Median Family Income | 423 | $73,199 |
| Mean Family Income | 423 | $80,678 |
| Median Household Income | 643 | $47,321 |
| Mean Household Income | 643 | $61,422 |
| Income Deficit | 423 | $0 |
| Wage / Income Gap (%) | 1,608 | 2.23% |
| Wage / Income Gap ($) | 1,608 | 97.77¢ per $1 |
| Gini / Inequality Index | 1,608 | 0.42 |
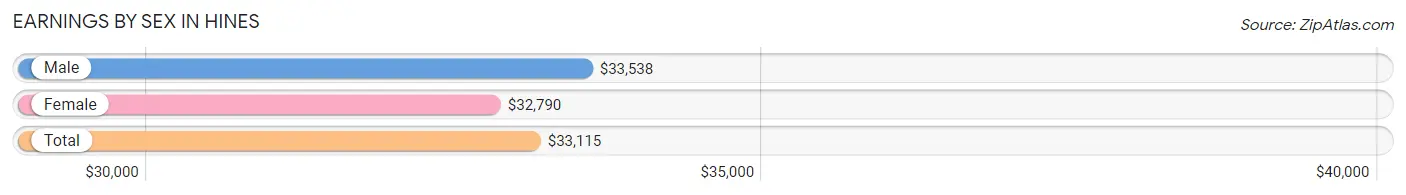
Earnings by Sex in Hines
Average Earnings in Hines are $33,115, $33,538 for men and $32,790 for women, a difference of 2.2%.
| Sex | Number | Average Earnings |
| Male | 402 (55.1%) | $33,538 |
| Female | 328 (44.9%) | $32,790 |
| Total | 730 (100.0%) | $33,115 |
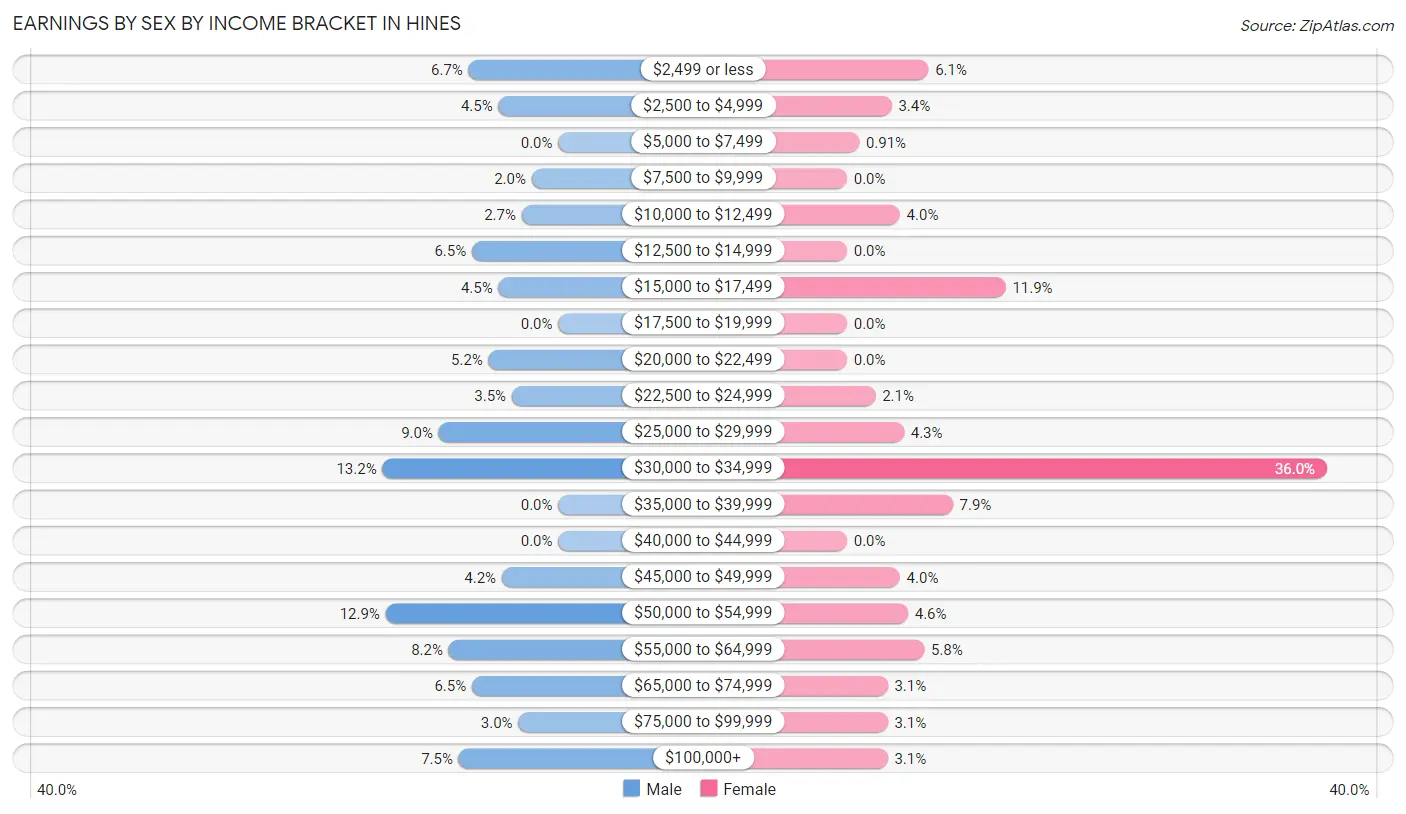
Earnings by Sex by Income Bracket in Hines
The most common earnings brackets in Hines are $30,000 to $34,999 for men (53 | 13.2%) and $30,000 to $34,999 for women (118 | 36.0%).
| Income | Male | Female |
| $2,499 or less | 27 (6.7%) | 20 (6.1%) |
| $2,500 to $4,999 | 18 (4.5%) | 11 (3.4%) |
| $5,000 to $7,499 | 0 (0.0%) | 3 (0.9%) |
| $7,500 to $9,999 | 8 (2.0%) | 0 (0.0%) |
| $10,000 to $12,499 | 11 (2.7%) | 13 (4.0%) |
| $12,500 to $14,999 | 26 (6.5%) | 0 (0.0%) |
| $15,000 to $17,499 | 18 (4.5%) | 39 (11.9%) |
| $17,500 to $19,999 | 0 (0.0%) | 0 (0.0%) |
| $20,000 to $22,499 | 21 (5.2%) | 0 (0.0%) |
| $22,500 to $24,999 | 14 (3.5%) | 7 (2.1%) |
| $25,000 to $29,999 | 36 (9.0%) | 14 (4.3%) |
| $30,000 to $34,999 | 53 (13.2%) | 118 (36.0%) |
| $35,000 to $39,999 | 0 (0.0%) | 26 (7.9%) |
| $40,000 to $44,999 | 0 (0.0%) | 0 (0.0%) |
| $45,000 to $49,999 | 17 (4.2%) | 13 (4.0%) |
| $50,000 to $54,999 | 52 (12.9%) | 15 (4.6%) |
| $55,000 to $64,999 | 33 (8.2%) | 19 (5.8%) |
| $65,000 to $74,999 | 26 (6.5%) | 10 (3.0%) |
| $75,000 to $99,999 | 12 (3.0%) | 10 (3.0%) |
| $100,000+ | 30 (7.5%) | 10 (3.0%) |
| Total | 402 (100.0%) | 328 (100.0%) |
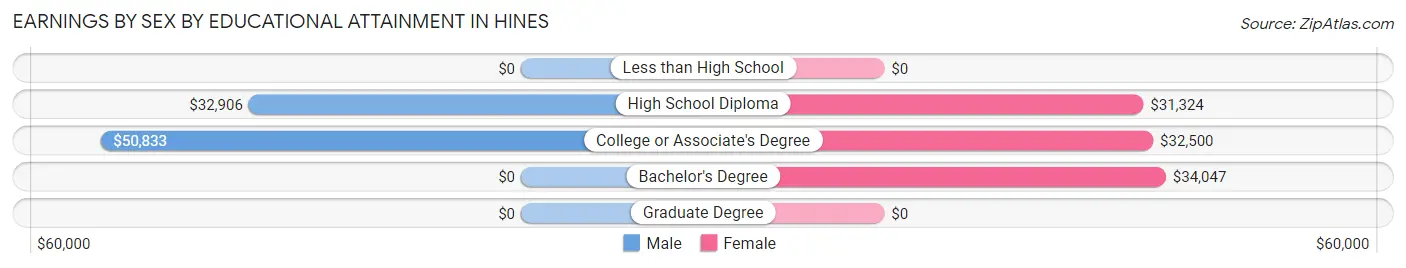
Earnings by Sex by Educational Attainment in Hines
Average earnings in Hines are $34,882 for men and $33,514 for women, a difference of 3.9%. Men with an educational attainment of college or associate's degree enjoy the highest average annual earnings of $50,833, while those with high school diploma education earn the least with $32,906. Women with an educational attainment of bachelor's degree earn the most with the average annual earnings of $34,047, while those with high school diploma education have the smallest earnings of $31,324.
| Educational Attainment | Male Income | Female Income |
| Less than High School | - | - |
| High School Diploma | $32,906 | $31,324 |
| College or Associate's Degree | $50,833 | $32,500 |
| Bachelor's Degree | - | - |
| Graduate Degree | - | - |
| Total | $34,882 | $33,514 |
Family Income in Hines
Family Income Brackets in Hines
According to the Hines family income data, there are 120 families falling into the $50,000 to $74,999 income range, which is the most common income bracket and makes up 28.4% of all families. Conversely, the $10,000 to $14,999 income bracket is the least frequent group with only 4 families (0.9%) belonging to this category.
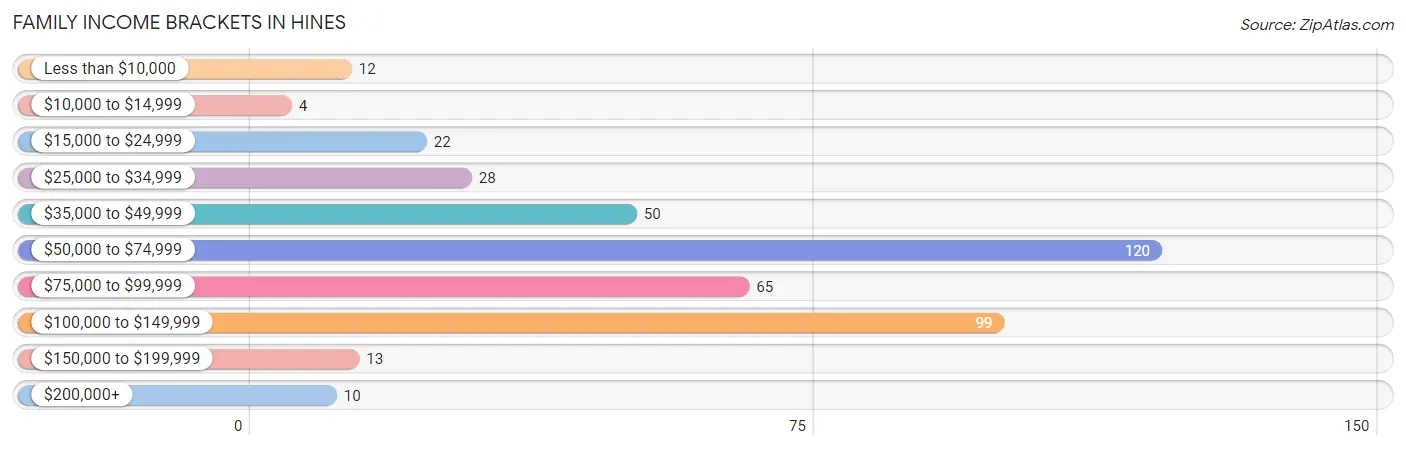
| Income Bracket | # Families | % Families |
| Less than $10,000 | 12 | 2.8% |
| $10,000 to $14,999 | 4 | 0.9% |
| $15,000 to $24,999 | 22 | 5.2% |
| $25,000 to $34,999 | 28 | 6.6% |
| $35,000 to $49,999 | 50 | 11.8% |
| $50,000 to $74,999 | 120 | 28.4% |
| $75,000 to $99,999 | 65 | 15.4% |
| $100,000 to $149,999 | 99 | 23.4% |
| $150,000 to $199,999 | 13 | 3.1% |
| $200,000+ | 10 | 2.4% |
Family Income by Famaliy Size in Hines
4-person families (69 | 16.3%) account for the highest median family income in Hines with $87,813 per family, while 2-person families (186 | 44.0%) have the highest median income of $41,072 per family member.
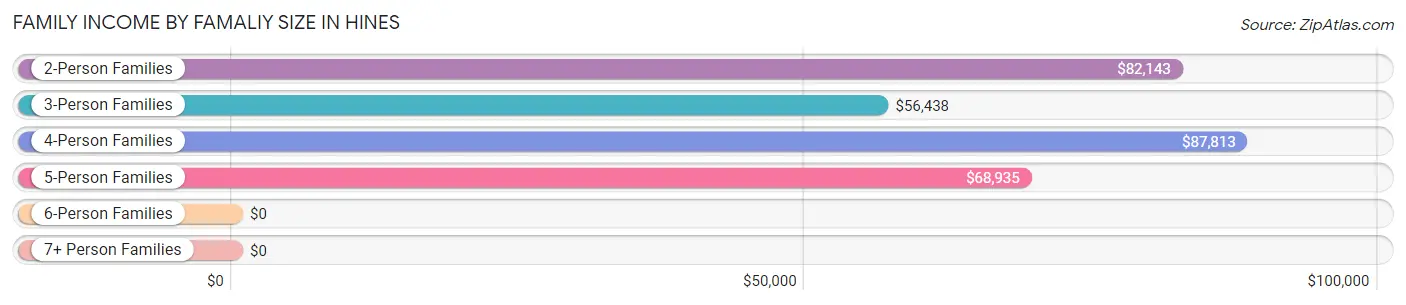
| Income Bracket | # Families | Median Income |
| 2-Person Families | 186 (44.0%) | $82,143 |
| 3-Person Families | 65 (15.4%) | $56,438 |
| 4-Person Families | 69 (16.3%) | $87,813 |
| 5-Person Families | 88 (20.8%) | $68,935 |
| 6-Person Families | 13 (3.1%) | $0 |
| 7+ Person Families | 2 (0.5%) | $0 |
| Total | 423 (100.0%) | $73,199 |
Family Income by Number of Earners in Hines
The median family income in Hines is $73,199, with families comprising 3+ earners (21) having the highest median family income of $92,321, while families with no earners (55) have the lowest median family income of $32,266, accounting for 5.0% and 13.0% of families, respectively.
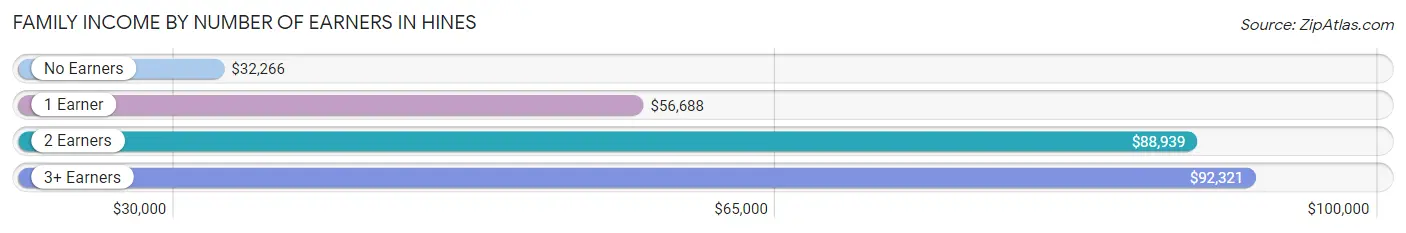
| Number of Earners | # Families | Median Income |
| No Earners | 55 (13.0%) | $32,266 |
| 1 Earner | 147 (34.7%) | $56,688 |
| 2 Earners | 200 (47.3%) | $88,939 |
| 3+ Earners | 21 (5.0%) | $92,321 |
| Total | 423 (100.0%) | $73,199 |
Household Income in Hines
Household Income Brackets in Hines
With 120 households falling in the category, the $50,000 to $74,999 income range is the most frequent in Hines, accounting for 18.7% of all households. In contrast, only 10 households (1.6%) fall into the $200,000+ income bracket, making it the least populous group.
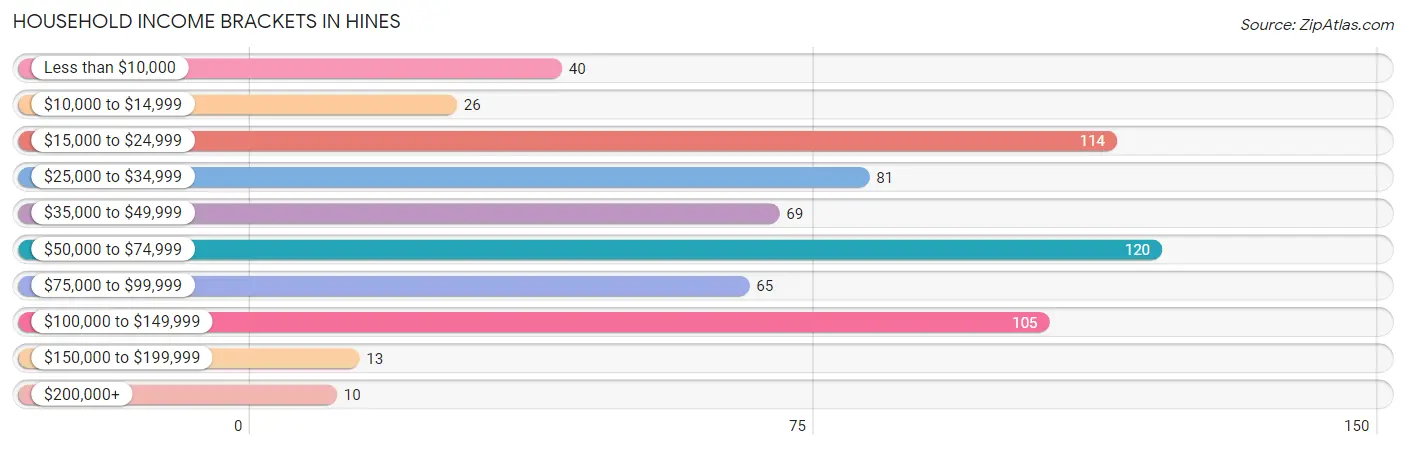
| Income Bracket | # Households | % Households |
| Less than $10,000 | 40 | 6.2% |
| $10,000 to $14,999 | 26 | 4.0% |
| $15,000 to $24,999 | 114 | 17.7% |
| $25,000 to $34,999 | 81 | 12.6% |
| $35,000 to $49,999 | 69 | 10.7% |
| $50,000 to $74,999 | 120 | 18.7% |
| $75,000 to $99,999 | 65 | 10.1% |
| $100,000 to $149,999 | 105 | 16.3% |
| $150,000 to $199,999 | 13 | 2.0% |
| $200,000+ | 10 | 1.6% |
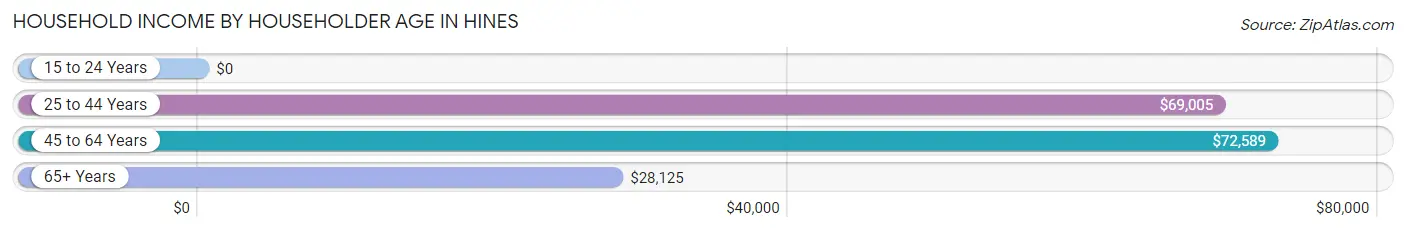
Household Income by Householder Age in Hines
The median household income in Hines is $47,321, with the highest median household income of $72,589 found in the 45 to 64 years age bracket for the primary householder. A total of 137 households (21.3%) fall into this category.
| Income Bracket | # Households | Median Income |
| 15 to 24 Years | 0 (0.0%) | $0 |
| 25 to 44 Years | 267 (41.5%) | $69,005 |
| 45 to 64 Years | 137 (21.3%) | $72,589 |
| 65+ Years | 239 (37.2%) | $28,125 |
| Total | 643 (100.0%) | $47,321 |
Poverty in Hines
Income Below Poverty by Sex and Age in Hines
With 14.9% poverty level for males and 14.3% for females among the residents of Hines, 6 to 11 year old males and 12 to 14 year old females are the most vulnerable to poverty, with 58 males (65.9%) and 11 females (45.8%) in their respective age groups living below the poverty level.
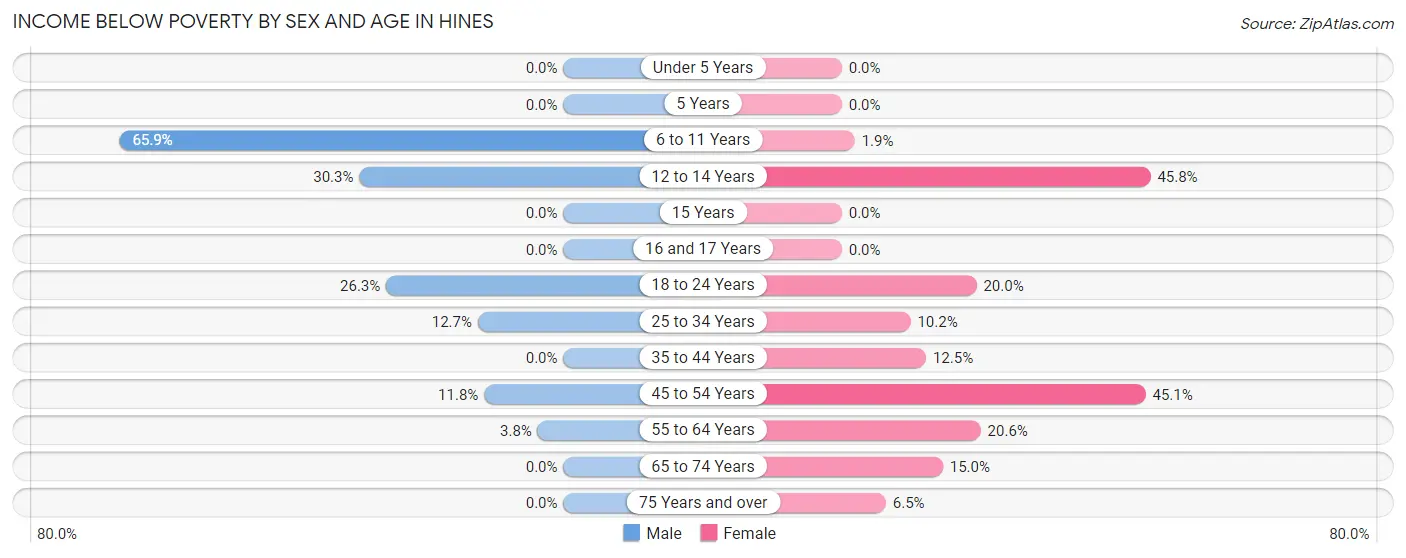
| Age Bracket | Male | Female |
| Under 5 Years | 0 (0.0%) | 0 (0.0%) |
| 5 Years | 0 (0.0%) | 0 (0.0%) |
| 6 to 11 Years | 58 (65.9%) | 1 (1.9%) |
| 12 to 14 Years | 20 (30.3%) | 11 (45.8%) |
| 15 Years | 0 (0.0%) | 0 (0.0%) |
| 16 and 17 Years | 0 (0.0%) | 0 (0.0%) |
| 18 to 24 Years | 15 (26.3%) | 10 (20.0%) |
| 25 to 34 Years | 8 (12.7%) | 5 (10.2%) |
| 35 to 44 Years | 0 (0.0%) | 28 (12.5%) |
| 45 to 54 Years | 8 (11.8%) | 23 (45.1%) |
| 55 to 64 Years | 4 (3.8%) | 20 (20.6%) |
| 65 to 74 Years | 0 (0.0%) | 12 (15.0%) |
| 75 Years and over | 0 (0.0%) | 7 (6.5%) |
| Total | 113 (14.9%) | 117 (14.3%) |
Income Above Poverty by Sex and Age in Hines
According to the poverty statistics in Hines, males aged under 5 years and females aged under 5 years are the age groups that are most secure financially, with 100.0% of males and 100.0% of females in these age groups living above the poverty line.
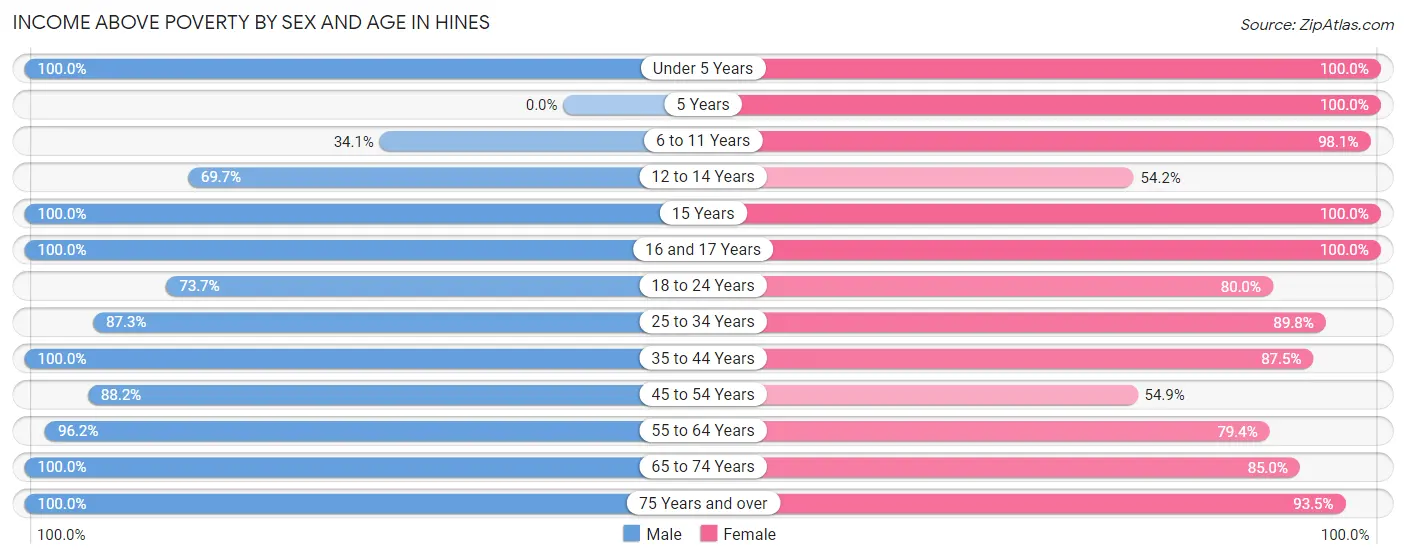
| Age Bracket | Male | Female |
| Under 5 Years | 53 (100.0%) | 60 (100.0%) |
| 5 Years | 0 (0.0%) | 8 (100.0%) |
| 6 to 11 Years | 30 (34.1%) | 51 (98.1%) |
| 12 to 14 Years | 46 (69.7%) | 13 (54.2%) |
| 15 Years | 2 (100.0%) | 5 (100.0%) |
| 16 and 17 Years | 12 (100.0%) | 10 (100.0%) |
| 18 to 24 Years | 42 (73.7%) | 40 (80.0%) |
| 25 to 34 Years | 55 (87.3%) | 44 (89.8%) |
| 35 to 44 Years | 115 (100.0%) | 196 (87.5%) |
| 45 to 54 Years | 60 (88.2%) | 28 (54.9%) |
| 55 to 64 Years | 101 (96.2%) | 77 (79.4%) |
| 65 to 74 Years | 81 (100.0%) | 68 (85.0%) |
| 75 Years and over | 49 (100.0%) | 100 (93.5%) |
| Total | 646 (85.1%) | 700 (85.7%) |
Income Below Poverty Among Married-Couple Families in Hines
The poverty statistics for married-couple families in Hines show that 2.4% or 8 of the total 333 families live below the poverty line. Families with 1 or 2 children have the highest poverty rate of 8.4%, comprising of 8 families. On the other hand, families with no children have the lowest poverty rate of 0.0%, which includes 0 families.
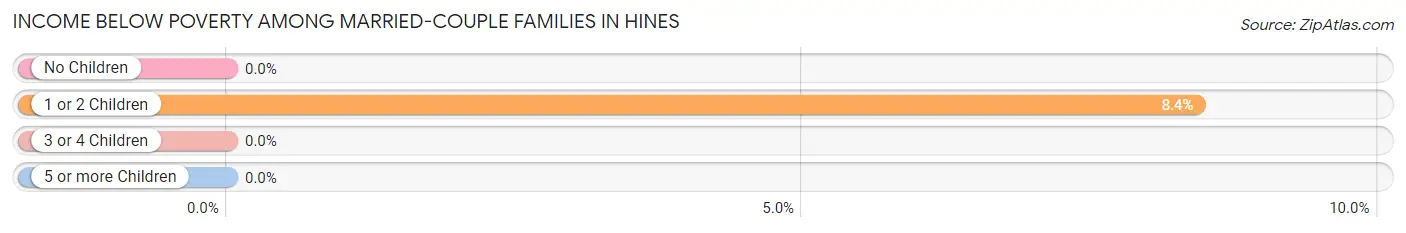
| Children | Above Poverty | Below Poverty |
| No Children | 171 (100.0%) | 0 (0.0%) |
| 1 or 2 Children | 87 (91.6%) | 8 (8.4%) |
| 3 or 4 Children | 67 (100.0%) | 0 (0.0%) |
| 5 or more Children | 0 (0.0%) | 0 (0.0%) |
| Total | 325 (97.6%) | 8 (2.4%) |
Income Below Poverty Among Single-Parent Households in Hines
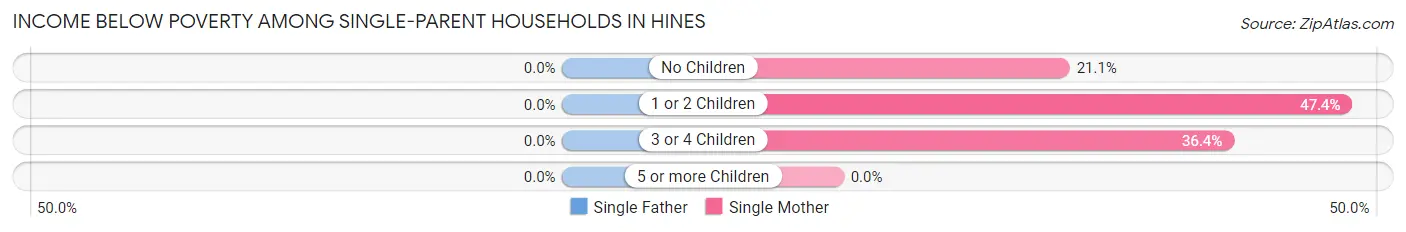
| Children | Single Father | Single Mother |
| No Children | 0 (0.0%) | 4 (21.0%) |
| 1 or 2 Children | 0 (0.0%) | 9 (47.4%) |
| 3 or 4 Children | 0 (0.0%) | 8 (36.4%) |
| 5 or more Children | 0 (0.0%) | 0 (0.0%) |
| Total | 0 (0.0%) | 21 (33.9%) |
Income Below Poverty Among Married-Couple vs Single-Parent Households in Hines
The poverty data for Hines shows that 8 of the married-couple family households (2.4%) and 21 of the single-parent households (23.3%) are living below the poverty level. Within the married-couple family households, those with 1 or 2 children have the highest poverty rate, with 8 households (8.4%) falling below the poverty line. Among the single-parent households, those with 3 or 4 children have the highest poverty rate, with 8 household (36.4%) living below poverty.
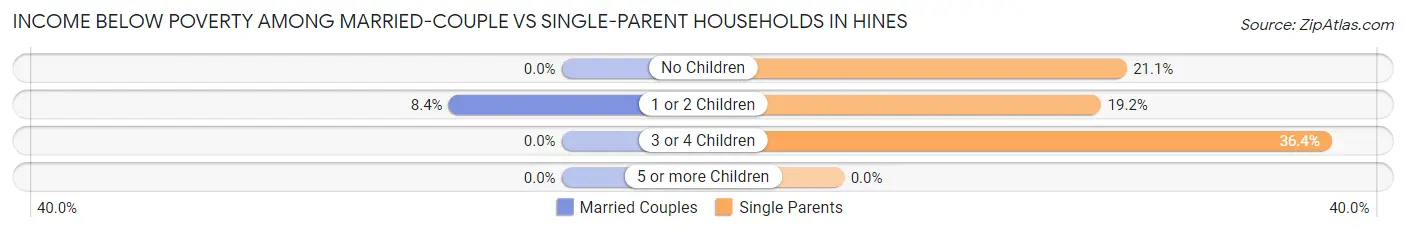
| Children | Married-Couple Families | Single-Parent Households |
| No Children | 0 (0.0%) | 4 (21.0%) |
| 1 or 2 Children | 8 (8.4%) | 9 (19.2%) |
| 3 or 4 Children | 0 (0.0%) | 8 (36.4%) |
| 5 or more Children | 0 (0.0%) | 0 (0.0%) |
| Total | 8 (2.4%) | 21 (23.3%) |
Race in Hines
The most populous races in Hines are White / Caucasian (1,456 | 90.5%), Two or more Races (133 | 8.3%), and Hispanic or Latino (81 | 5.0%).
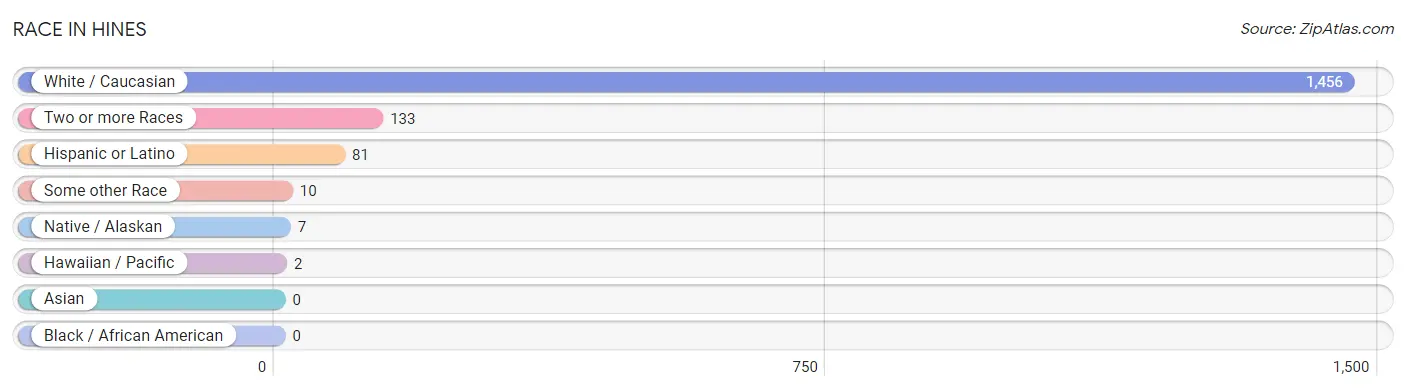
| Race | # Population | % Population |
| Asian | 0 | 0.0% |
| Black / African American | 0 | 0.0% |
| Hawaiian / Pacific | 2 | 0.1% |
| Hispanic or Latino | 81 | 5.0% |
| Native / Alaskan | 7 | 0.4% |
| White / Caucasian | 1,456 | 90.5% |
| Two or more Races | 133 | 8.3% |
| Some other Race | 10 | 0.6% |
| Total | 1,608 | 100.0% |
Ancestry in Hines
The most populous ancestries reported in Hines are German (360 | 22.4%), Irish (157 | 9.8%), Polish (143 | 8.9%), English (127 | 7.9%), and American (114 | 7.1%), together accounting for 56.0% of all Hines residents.
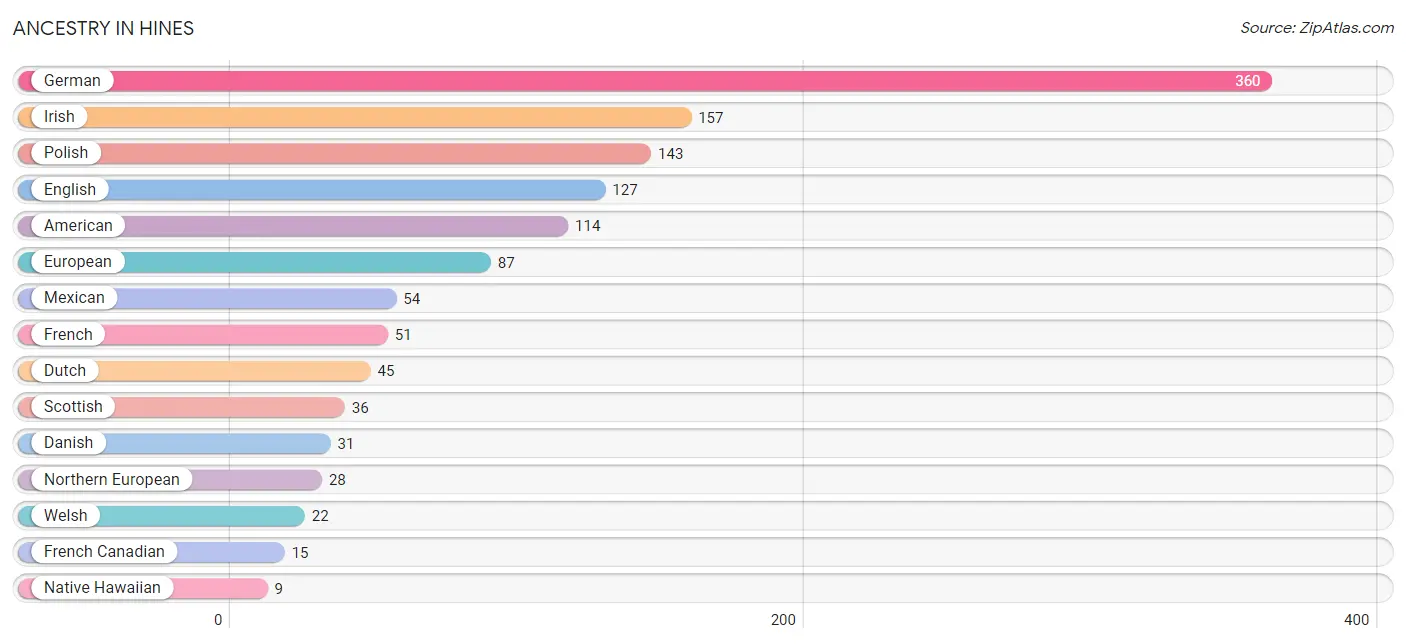
| Ancestry | # Population | % Population |
| American | 114 | 7.1% |
| Basque | 6 | 0.4% |
| Colville | 2 | 0.1% |
| Danish | 31 | 1.9% |
| Dutch | 45 | 2.8% |
| English | 127 | 7.9% |
| European | 87 | 5.4% |
| French | 51 | 3.2% |
| French Canadian | 15 | 0.9% |
| German | 360 | 22.4% |
| Greek | 6 | 0.4% |
| Irish | 157 | 9.8% |
| Mexican | 54 | 3.4% |
| Native Hawaiian | 9 | 0.6% |
| Northern European | 28 | 1.7% |
| Norwegian | 6 | 0.4% |
| Paiute | 5 | 0.3% |
| Polish | 143 | 8.9% |
| Scotch-Irish | 5 | 0.3% |
| Scottish | 36 | 2.2% |
| Spanish | 5 | 0.3% |
| Swedish | 7 | 0.4% |
| Welsh | 22 | 1.4% | View All 23 Rows |
Immigrants in Hines
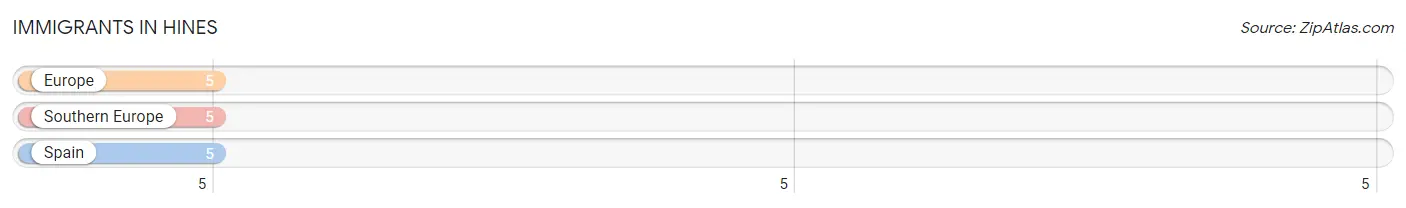
The most numerous immigrant groups reported in Hines came from Europe (5 | 0.3%), Southern Europe (5 | 0.3%), and Spain (5 | 0.3%), together accounting for 0.9% of all Hines residents.
| Immigration Origin | # Population | % Population |
| Europe | 5 | 0.3% |
| Southern Europe | 5 | 0.3% |
| Spain | 5 | 0.3% | View All 3 Rows |
Sex and Age in Hines
Sex and Age in Hines
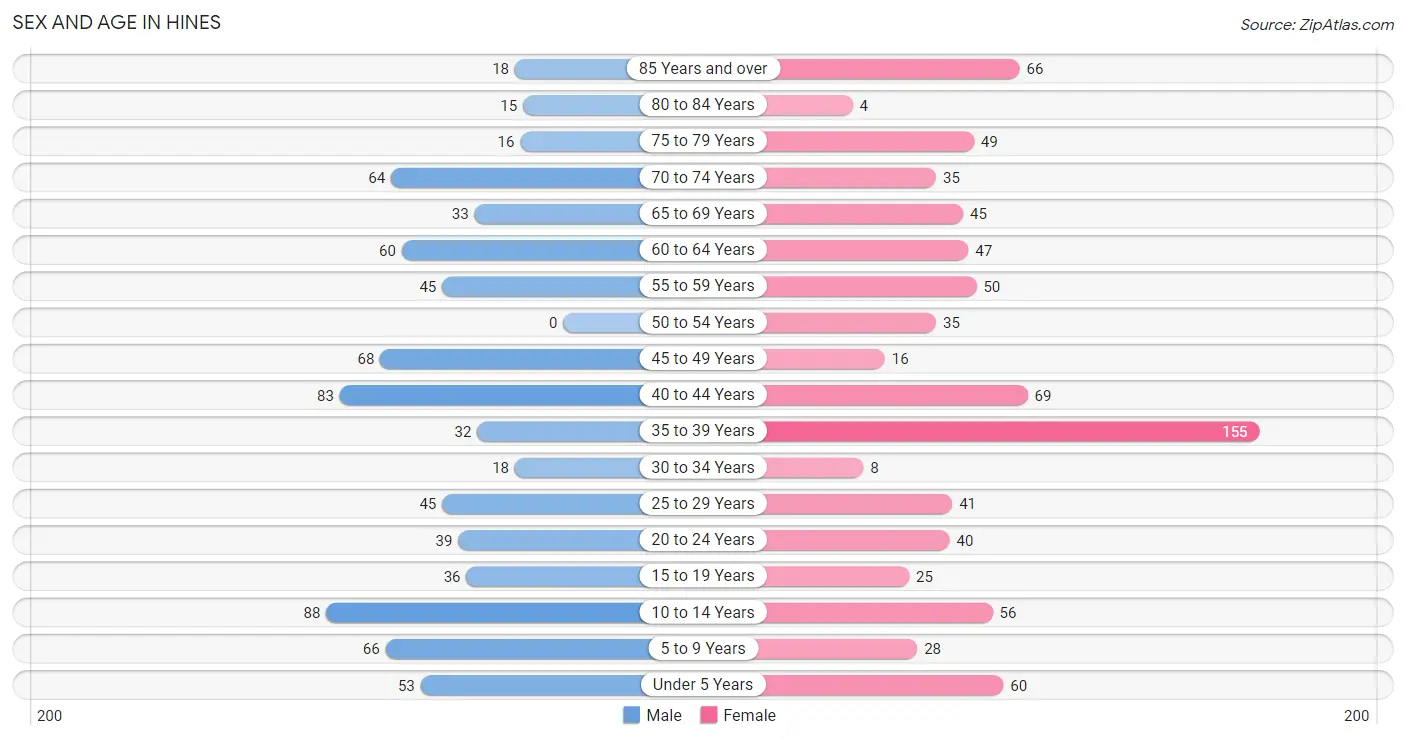
The most populous age groups in Hines are 10 to 14 Years (88 | 11.3%) for men and 35 to 39 Years (155 | 18.7%) for women.
| Age Bracket | Male | Female |
| Under 5 Years | 53 (6.8%) | 60 (7.2%) |
| 5 to 9 Years | 66 (8.5%) | 28 (3.4%) |
| 10 to 14 Years | 88 (11.3%) | 56 (6.8%) |
| 15 to 19 Years | 36 (4.6%) | 25 (3.0%) |
| 20 to 24 Years | 39 (5.0%) | 40 (4.8%) |
| 25 to 29 Years | 45 (5.8%) | 41 (5.0%) |
| 30 to 34 Years | 18 (2.3%) | 8 (1.0%) |
| 35 to 39 Years | 32 (4.1%) | 155 (18.7%) |
| 40 to 44 Years | 83 (10.6%) | 69 (8.3%) |
| 45 to 49 Years | 68 (8.7%) | 16 (1.9%) |
| 50 to 54 Years | 0 (0.0%) | 35 (4.2%) |
| 55 to 59 Years | 45 (5.8%) | 50 (6.0%) |
| 60 to 64 Years | 60 (7.7%) | 47 (5.7%) |
| 65 to 69 Years | 33 (4.2%) | 45 (5.4%) |
| 70 to 74 Years | 64 (8.2%) | 35 (4.2%) |
| 75 to 79 Years | 16 (2.1%) | 49 (5.9%) |
| 80 to 84 Years | 15 (1.9%) | 4 (0.5%) |
| 85 Years and over | 18 (2.3%) | 66 (8.0%) |
| Total | 779 (100.0%) | 829 (100.0%) |
Families and Households in Hines
Median Family Size in Hines
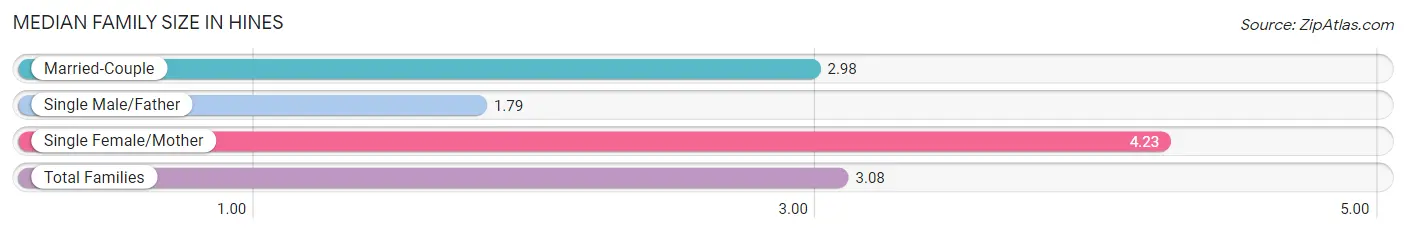
The median family size in Hines is 3.08 persons per family, with single female/mother families (62 | 14.7%) accounting for the largest median family size of 4.23 persons per family. On the other hand, single male/father families (28 | 6.6%) represent the smallest median family size with 1.79 persons per family.
| Family Type | # Families | Family Size |
| Married-Couple | 333 (78.7%) | 2.98 |
| Single Male/Father | 28 (6.6%) | 1.79 |
| Single Female/Mother | 62 (14.7%) | 4.23 |
| Total Families | 423 (100.0%) | 3.08 |
Median Household Size in Hines
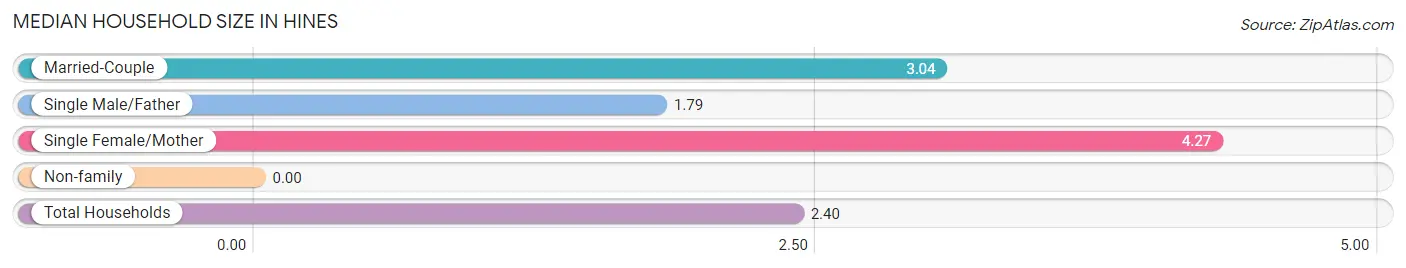
| Household Type | # Households | Household Size |
| Married-Couple | 333 (51.8%) | 3.04 |
| Single Male/Father | 28 (4.3%) | 1.79 |
| Single Female/Mother | 62 (9.6%) | 4.27 |
| Non-family | 220 (34.2%) | - |
| Total Households | 643 (100.0%) | 2.40 |
Household Size by Marriage Status in Hines
Out of a total of 643 households in Hines, 423 (65.8%) are family households, while 220 (34.2%) are nonfamily households. The most numerous type of family households are 2-person households, comprising 180, and the most common type of nonfamily households are 1-person households, comprising 220.
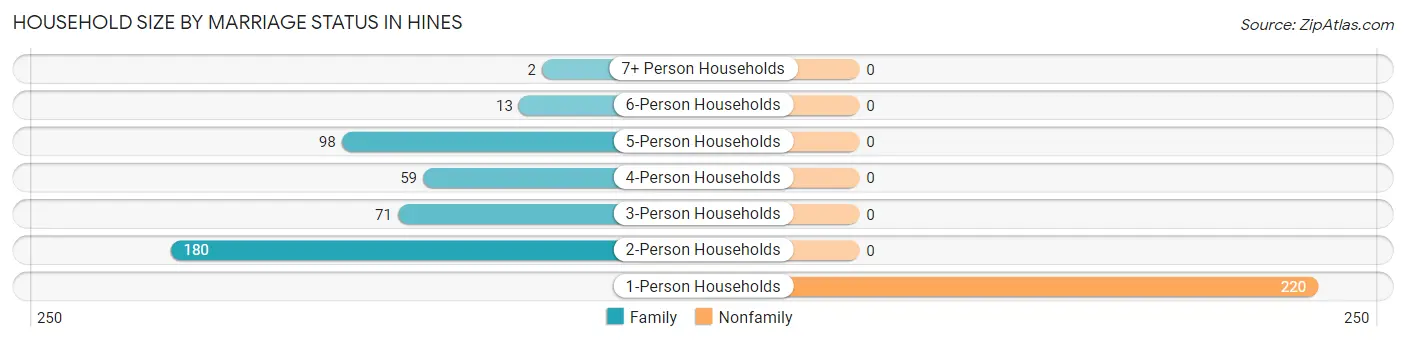
| Household Size | Family Households | Nonfamily Households |
| 1-Person Households | - | 220 (34.2%) |
| 2-Person Households | 180 (28.0%) | 0 (0.0%) |
| 3-Person Households | 71 (11.0%) | 0 (0.0%) |
| 4-Person Households | 59 (9.2%) | 0 (0.0%) |
| 5-Person Households | 98 (15.2%) | 0 (0.0%) |
| 6-Person Households | 13 (2.0%) | 0 (0.0%) |
| 7+ Person Households | 2 (0.3%) | 0 (0.0%) |
| Total | 423 (65.8%) | 220 (34.2%) |
Female Fertility in Hines
Fertility by Age in Hines
Average fertility rate in Hines is 180.0 births per 1,000 women. Women in the age bracket of 20 to 34 years have the highest fertility rate with 416.0 births per 1,000 women. Women in the age bracket of 20 to 34 years acount for 56.9% of all women with births.
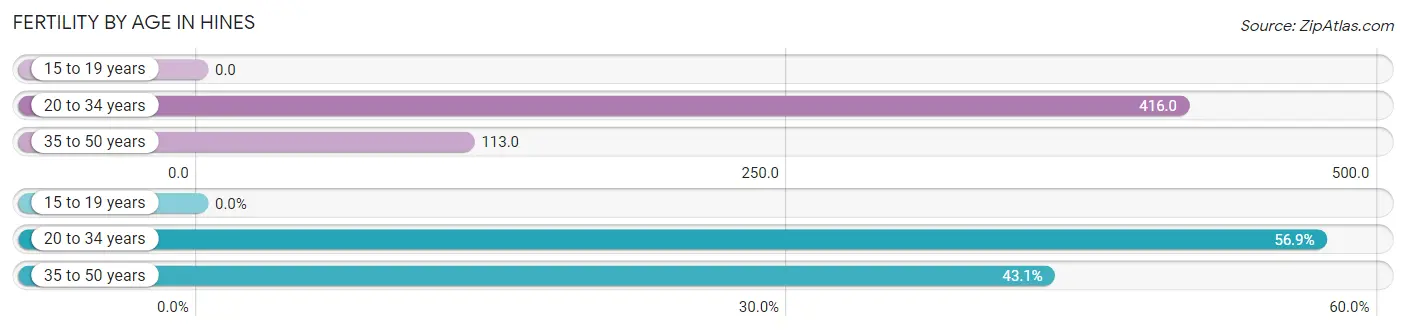
| Age Bracket | Women with Births | Births / 1,000 Women |
| 15 to 19 years | 0 (0.0%) | 0.0 |
| 20 to 34 years | 37 (56.9%) | 416.0 |
| 35 to 50 years | 28 (43.1%) | 113.0 |
| Total | 65 (100.0%) | 180.0 |
Fertility by Age by Marriage Status in Hines
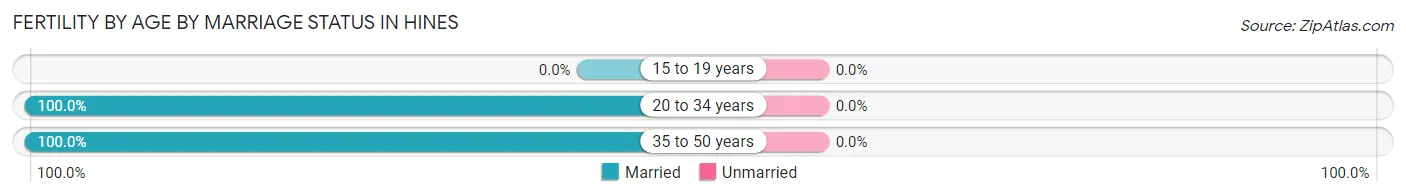
| Age Bracket | Married | Unmarried |
| 15 to 19 years | 0 (0.0%) | 0 (0.0%) |
| 20 to 34 years | 37 (100.0%) | 0 (0.0%) |
| 35 to 50 years | 28 (100.0%) | 0 (0.0%) |
| Total | 65 (100.0%) | 0 (0.0%) |
Fertility by Education in Hines
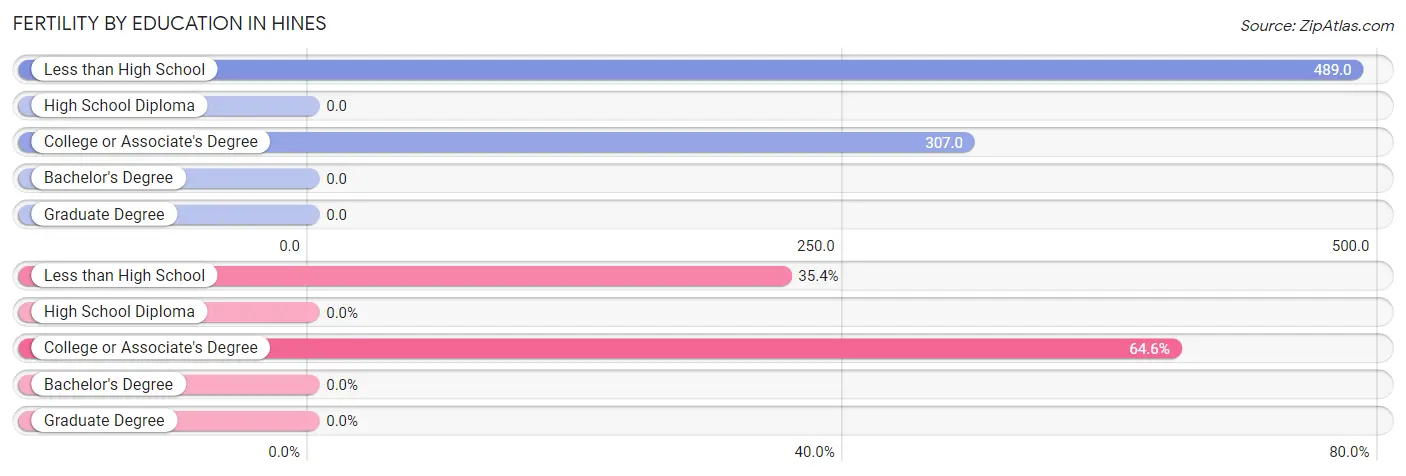
| Educational Attainment | Women with Births | Births / 1,000 Women |
| Less than High School | 23 (35.4%) | 489.0 |
| High School Diploma | 0 (0.0%) | 0.0 |
| College or Associate's Degree | 42 (64.6%) | 307.0 |
| Bachelor's Degree | 0 (0.0%) | 0.0 |
| Graduate Degree | 0 (0.0%) | 0.0 |
| Total | 65 (100.0%) | 180.0 |
Fertility by Education by Marriage Status in Hines
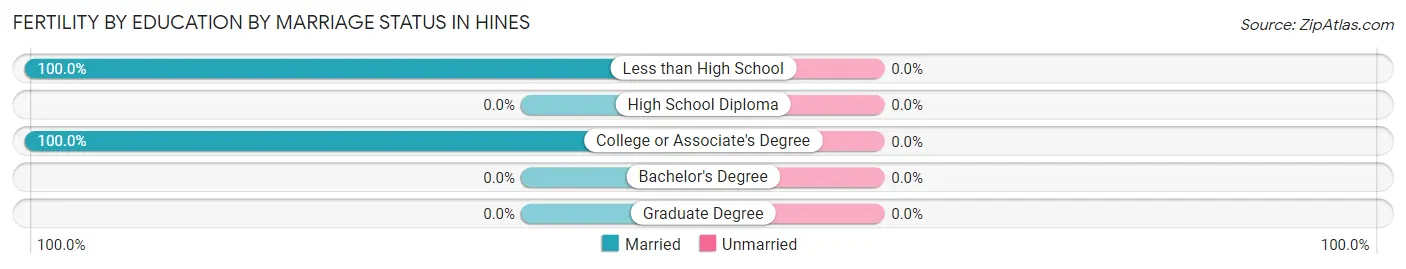
| Educational Attainment | Married | Unmarried |
| Less than High School | 23 (100.0%) | 0 (0.0%) |
| High School Diploma | 0 (0.0%) | 0 (0.0%) |
| College or Associate's Degree | 42 (100.0%) | 0 (0.0%) |
| Bachelor's Degree | 0 (0.0%) | 0 (0.0%) |
| Graduate Degree | 0 (0.0%) | 0 (0.0%) |
| Total | 65 (100.0%) | 0 (0.0%) |
Employment Characteristics in Hines
Employment by Class of Employer in Hines
Among the 628 employed individuals in Hines, private company employees (275 | 43.8%), self-employed (not incorporated) (113 | 18.0%), and state government employees (65 | 10.3%) make up the most common classes of employment.
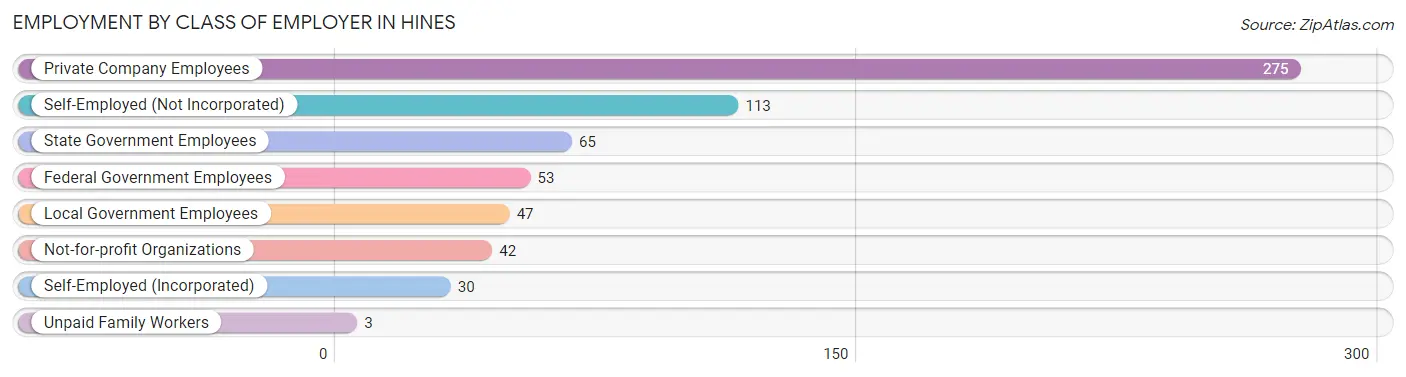
| Employer Class | # Employees | % Employees |
| Private Company Employees | 275 | 43.8% |
| Self-Employed (Incorporated) | 30 | 4.8% |
| Self-Employed (Not Incorporated) | 113 | 18.0% |
| Not-for-profit Organizations | 42 | 6.7% |
| Local Government Employees | 47 | 7.5% |
| State Government Employees | 65 | 10.3% |
| Federal Government Employees | 53 | 8.4% |
| Unpaid Family Workers | 3 | 0.5% |
| Total | 628 | 100.0% |
Employment Status by Age in Hines
According to the labor force statistics for Hines, out of the total population over 16 years of age (1,250), 54.7% or 684 individuals are in the labor force, with 6.7% or 46 of them unemployed. The age group with the highest labor force participation rate is 20 to 24 years, with 94.9% or 75 individuals in the labor force. Within the labor force, the 20 to 24 years age range has the highest percentage of unemployed individuals, with 26.7% or 20 of them being unemployed.
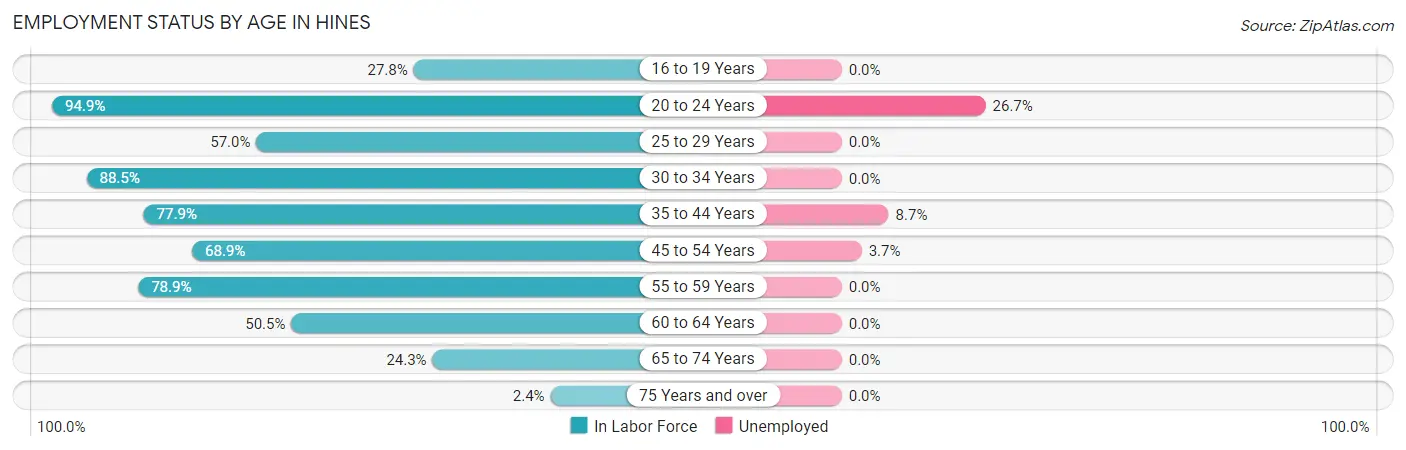
| Age Bracket | In Labor Force | Unemployed |
| 16 to 19 Years | 15 (27.8%) | 0 (0.0%) |
| 20 to 24 Years | 75 (94.9%) | 20 (26.7%) |
| 25 to 29 Years | 49 (57.0%) | 0 (0.0%) |
| 30 to 34 Years | 23 (88.5%) | 0 (0.0%) |
| 35 to 44 Years | 264 (77.9%) | 23 (8.7%) |
| 45 to 54 Years | 82 (68.9%) | 3 (3.7%) |
| 55 to 59 Years | 75 (78.9%) | 0 (0.0%) |
| 60 to 64 Years | 54 (50.5%) | 0 (0.0%) |
| 65 to 74 Years | 43 (24.3%) | 0 (0.0%) |
| 75 Years and over | 4 (2.4%) | 0 (0.0%) |
| Total | 684 (54.7%) | 46 (6.7%) |
Employment Status by Educational Attainment in Hines
According to labor force statistics for Hines, 70.9% of individuals (547) out of the total population between 25 and 64 years of age (772) are in the labor force, with 4.8% or 26 of them being unemployed. The group with the highest labor force participation rate are those with the educational attainment of bachelor's degree or higher, with 85.7% or 174 individuals in the labor force. Within the labor force, individuals with less than high school education have the highest percentage of unemployment, with 50.0% or 7 of them being unemployed.
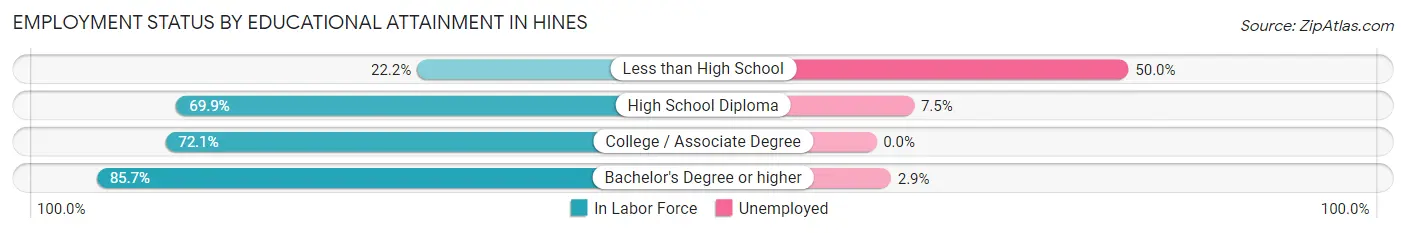
| Educational Attainment | In Labor Force | Unemployed |
| Less than High School | 14 (22.2%) | 32 (50.0%) |
| High School Diploma | 186 (69.9%) | 20 (7.5%) |
| College / Associate Degree | 173 (72.1%) | 0 (0.0%) |
| Bachelor's Degree or higher | 174 (85.7%) | 6 (2.9%) |
| Total | 547 (70.9%) | 37 (4.8%) |
Employment Occupations by Sex in Hines
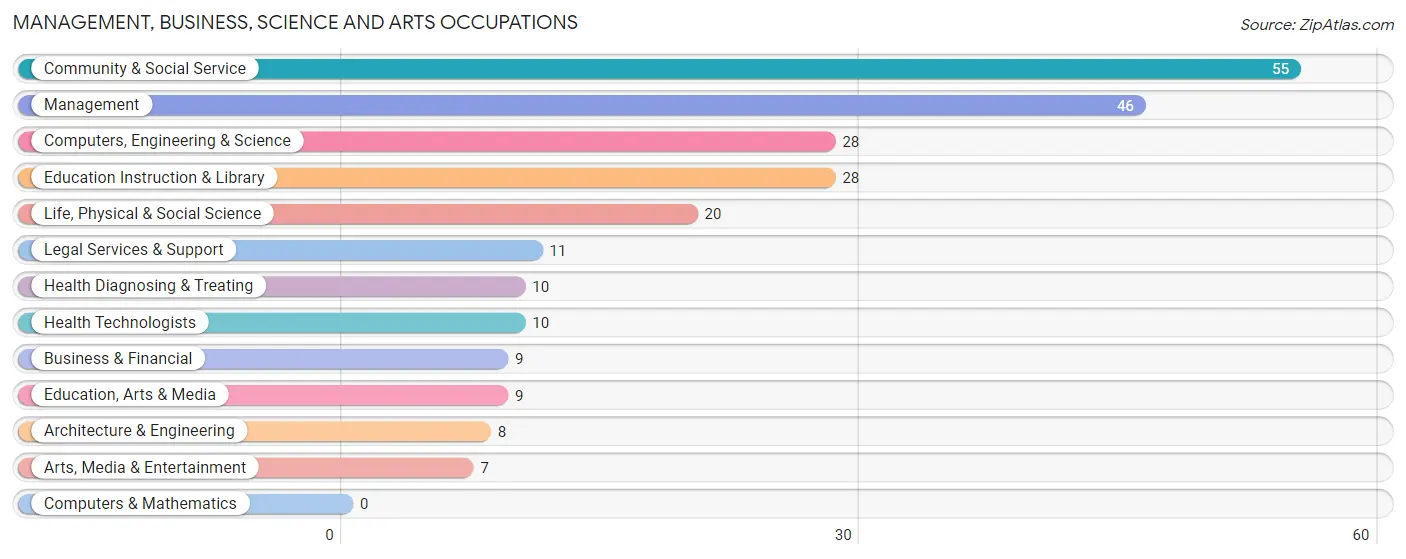
Management, Business, Science and Arts Occupations
The most common Management, Business, Science and Arts occupations in Hines are Community & Social Service (55 | 8.6%), Management (46 | 7.2%), Computers, Engineering & Science (28 | 4.4%), Education Instruction & Library (28 | 4.4%), and Life, Physical & Social Science (20 | 3.1%).
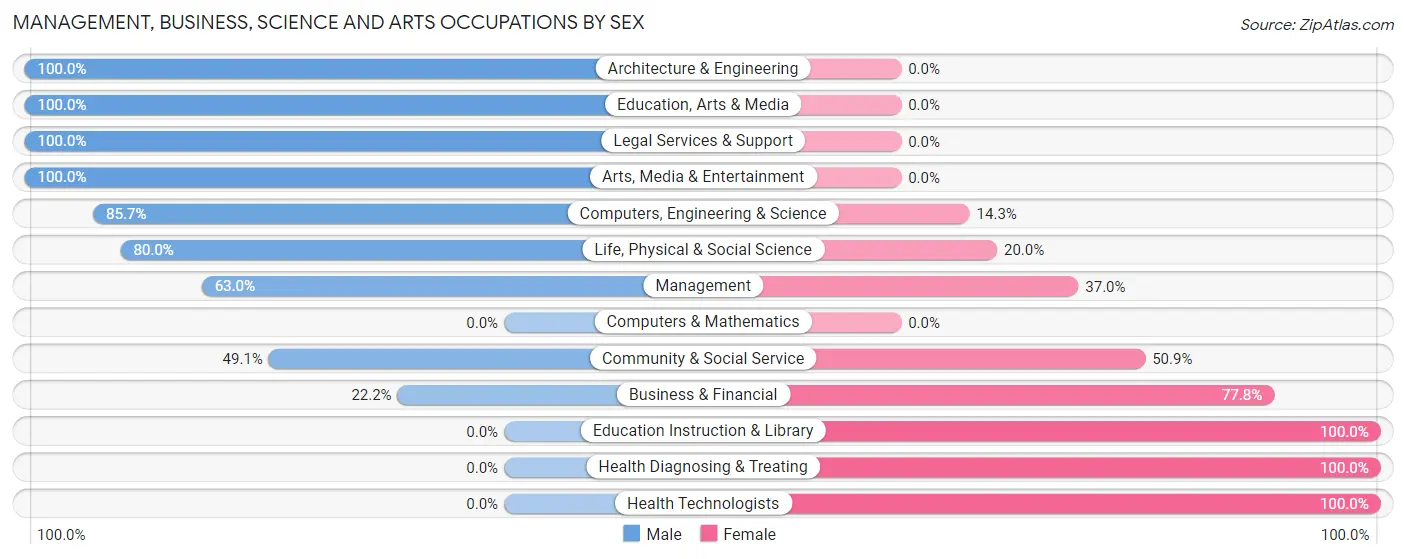
Management, Business, Science and Arts Occupations by Sex
Within the Management, Business, Science and Arts occupations in Hines, the most male-oriented occupations are Architecture & Engineering (100.0%), Education, Arts & Media (100.0%), and Legal Services & Support (100.0%), while the most female-oriented occupations are Education Instruction & Library (100.0%), Health Diagnosing & Treating (100.0%), and Health Technologists (100.0%).
| Occupation | Male | Female |
| Management | 29 (63.0%) | 17 (37.0%) |
| Business & Financial | 2 (22.2%) | 7 (77.8%) |
| Computers, Engineering & Science | 24 (85.7%) | 4 (14.3%) |
| Computers & Mathematics | 0 (0.0%) | 0 (0.0%) |
| Architecture & Engineering | 8 (100.0%) | 0 (0.0%) |
| Life, Physical & Social Science | 16 (80.0%) | 4 (20.0%) |
| Community & Social Service | 27 (49.1%) | 28 (50.9%) |
| Education, Arts & Media | 9 (100.0%) | 0 (0.0%) |
| Legal Services & Support | 11 (100.0%) | 0 (0.0%) |
| Education Instruction & Library | 0 (0.0%) | 28 (100.0%) |
| Arts, Media & Entertainment | 7 (100.0%) | 0 (0.0%) |
| Health Diagnosing & Treating | 0 (0.0%) | 10 (100.0%) |
| Health Technologists | 0 (0.0%) | 10 (100.0%) |
| Total (Category) | 82 (55.4%) | 66 (44.6%) |
| Total (Overall) | 367 (57.5%) | 271 (42.5%) |
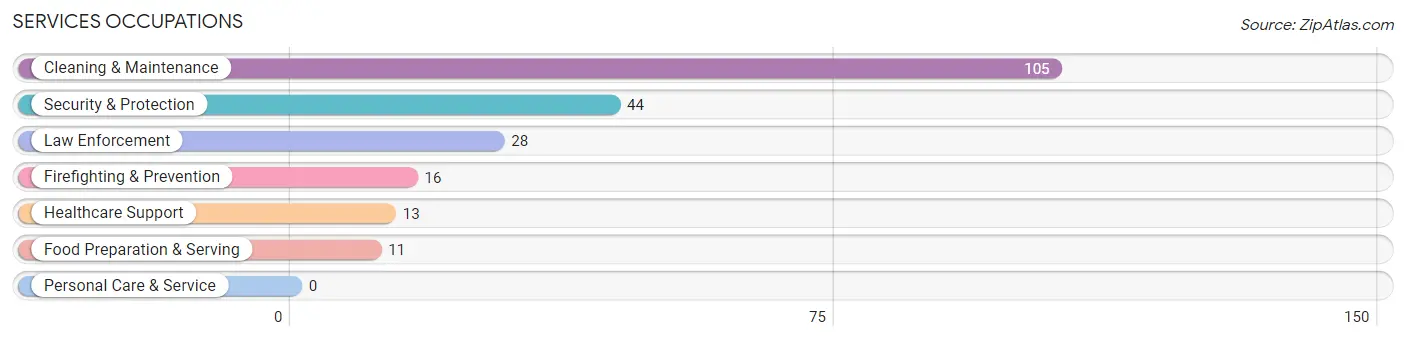
Services Occupations
The most common Services occupations in Hines are Cleaning & Maintenance (105 | 16.5%), Security & Protection (44 | 6.9%), Law Enforcement (28 | 4.4%), Firefighting & Prevention (16 | 2.5%), and Healthcare Support (13 | 2.0%).
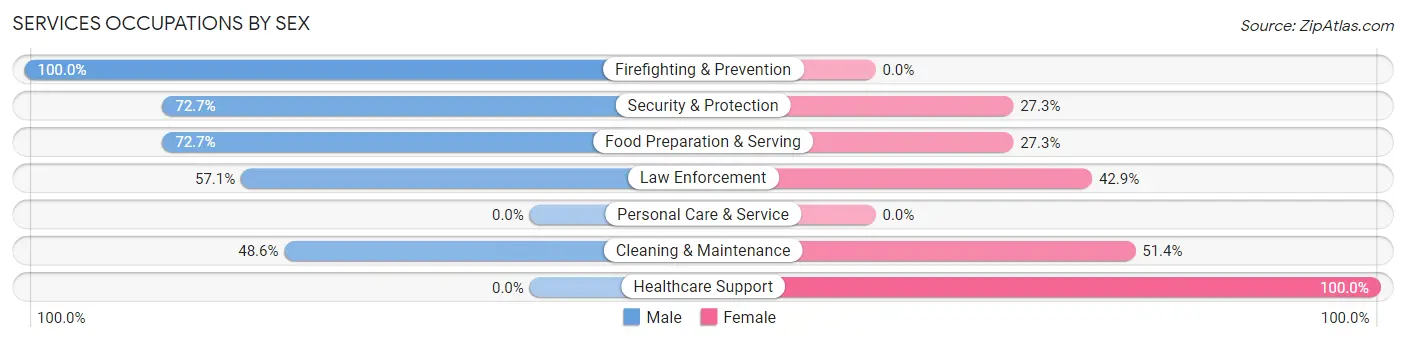
Services Occupations by Sex
Within the Services occupations in Hines, the most male-oriented occupations are Firefighting & Prevention (100.0%), Security & Protection (72.7%), and Food Preparation & Serving (72.7%), while the most female-oriented occupations are Healthcare Support (100.0%), Cleaning & Maintenance (51.4%), and Law Enforcement (42.9%).
| Occupation | Male | Female |
| Healthcare Support | 0 (0.0%) | 13 (100.0%) |
| Security & Protection | 32 (72.7%) | 12 (27.3%) |
| Firefighting & Prevention | 16 (100.0%) | 0 (0.0%) |
| Law Enforcement | 16 (57.1%) | 12 (42.9%) |
| Food Preparation & Serving | 8 (72.7%) | 3 (27.3%) |
| Cleaning & Maintenance | 51 (48.6%) | 54 (51.4%) |
| Personal Care & Service | 0 (0.0%) | 0 (0.0%) |
| Total (Category) | 91 (52.6%) | 82 (47.4%) |
| Total (Overall) | 367 (57.5%) | 271 (42.5%) |
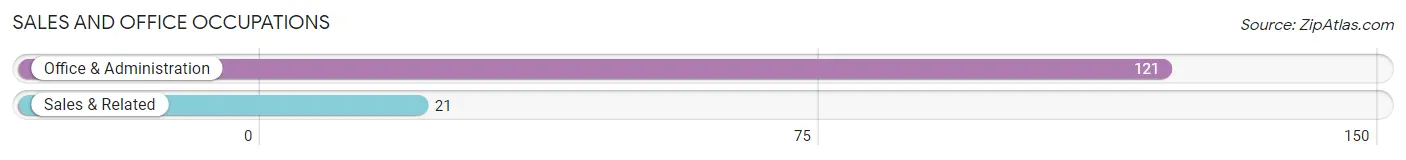
Sales and Office Occupations
The most common Sales and Office occupations in Hines are Office & Administration (121 | 19.0%), and Sales & Related (21 | 3.3%).
Sales and Office Occupations by Sex
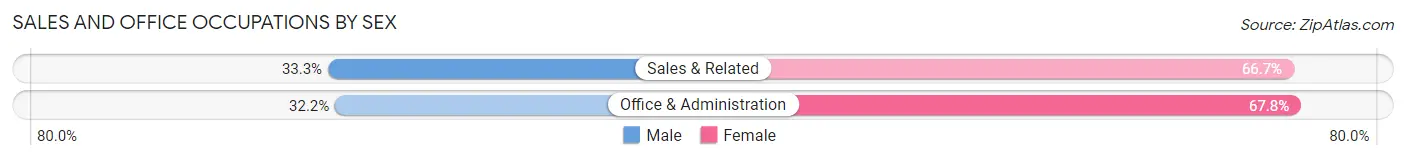
| Occupation | Male | Female |
| Sales & Related | 7 (33.3%) | 14 (66.7%) |
| Office & Administration | 39 (32.2%) | 82 (67.8%) |
| Total (Category) | 46 (32.4%) | 96 (67.6%) |
| Total (Overall) | 367 (57.5%) | 271 (42.5%) |
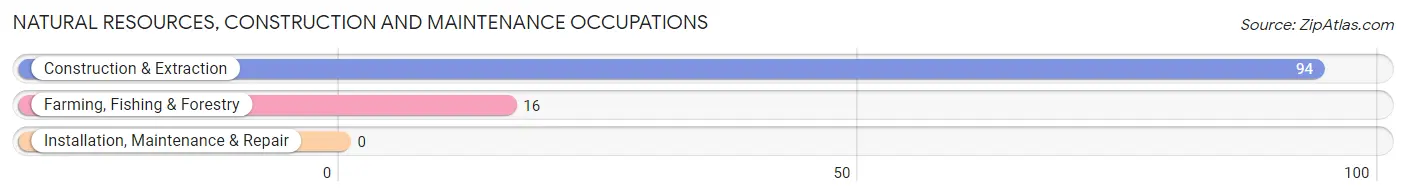
Natural Resources, Construction and Maintenance Occupations
The most common Natural Resources, Construction and Maintenance occupations in Hines are Construction & Extraction (94 | 14.7%), and Farming, Fishing & Forestry (16 | 2.5%).
Natural Resources, Construction and Maintenance Occupations by Sex
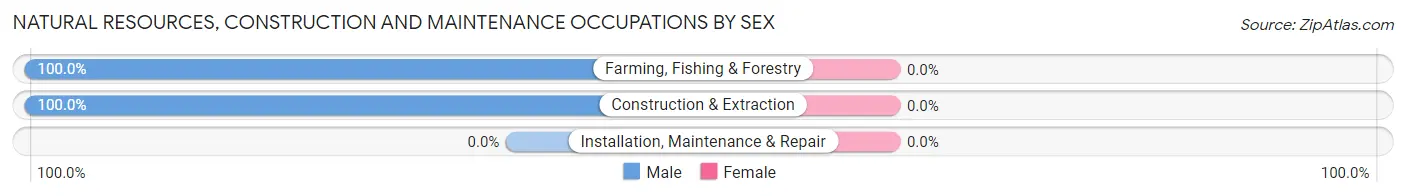
| Occupation | Male | Female |
| Farming, Fishing & Forestry | 16 (100.0%) | 0 (0.0%) |
| Construction & Extraction | 94 (100.0%) | 0 (0.0%) |
| Installation, Maintenance & Repair | 0 (0.0%) | 0 (0.0%) |
| Total (Category) | 110 (100.0%) | 0 (0.0%) |
| Total (Overall) | 367 (57.5%) | 271 (42.5%) |
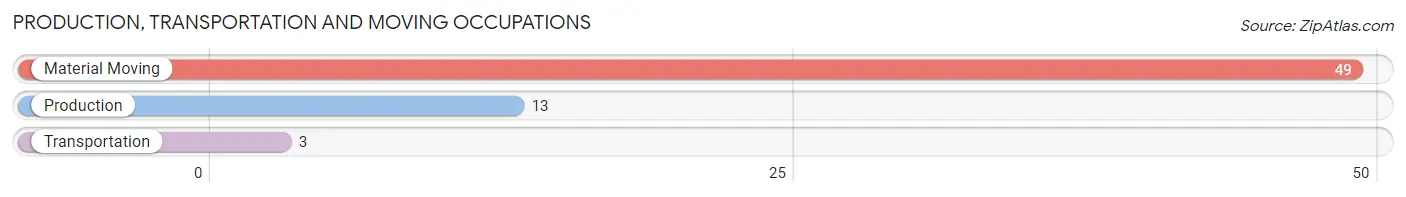
Production, Transportation and Moving Occupations
The most common Production, Transportation and Moving occupations in Hines are Material Moving (49 | 7.7%), Production (13 | 2.0%), and Transportation (3 | 0.5%).
Production, Transportation and Moving Occupations by Sex
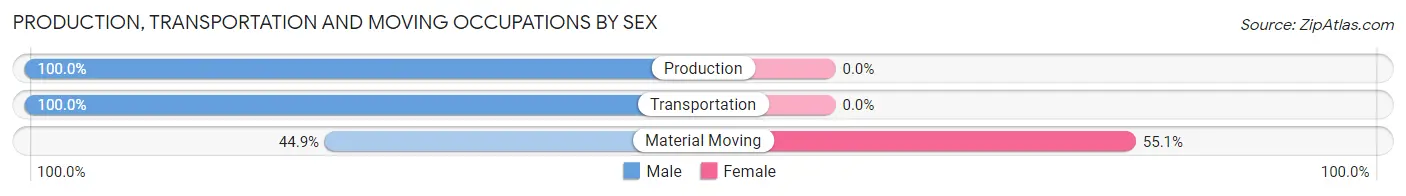
| Occupation | Male | Female |
| Production | 13 (100.0%) | 0 (0.0%) |
| Transportation | 3 (100.0%) | 0 (0.0%) |
| Material Moving | 22 (44.9%) | 27 (55.1%) |
| Total (Category) | 38 (58.5%) | 27 (41.5%) |
| Total (Overall) | 367 (57.5%) | 271 (42.5%) |
Employment Industries by Sex in Hines
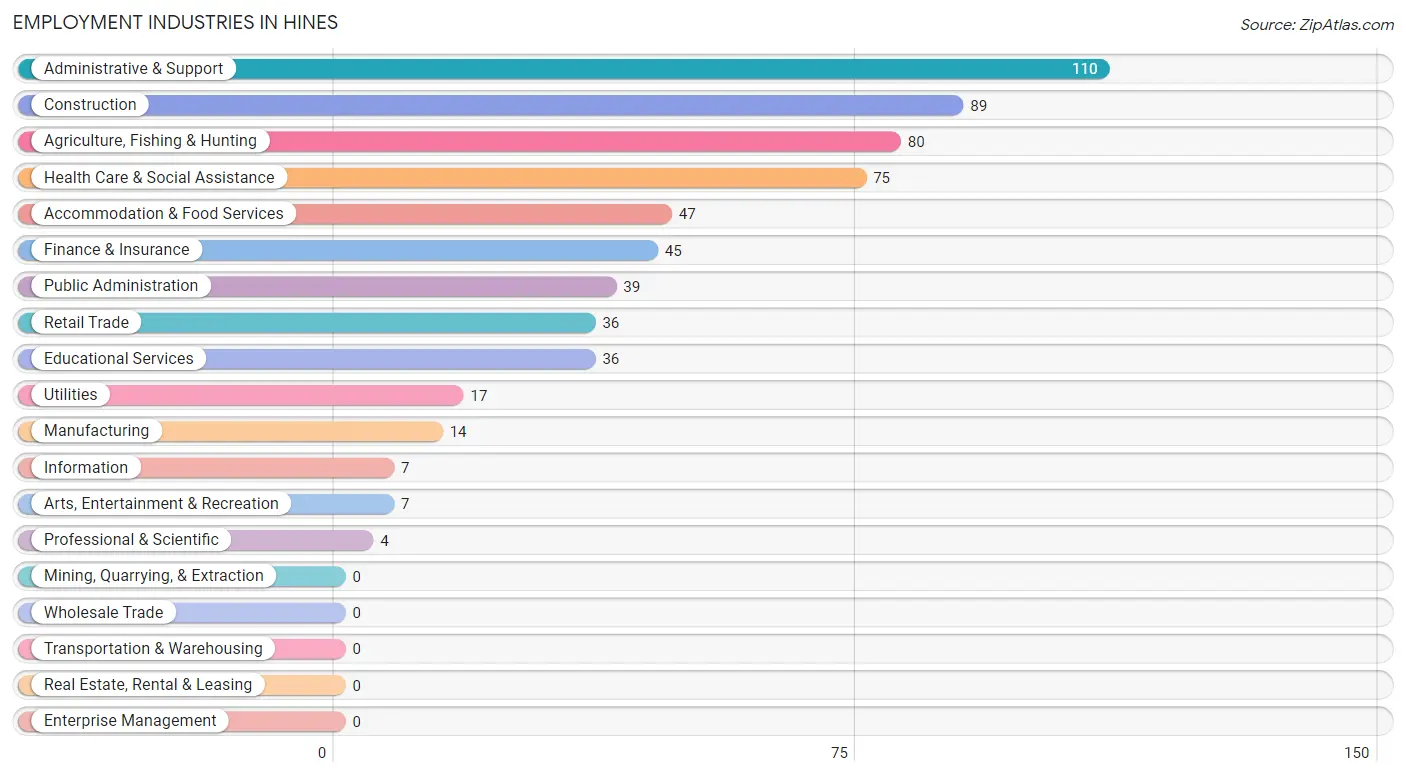
Employment Industries in Hines
The major employment industries in Hines include Administrative & Support (110 | 17.2%), Construction (89 | 14.0%), Agriculture, Fishing & Hunting (80 | 12.5%), Health Care & Social Assistance (75 | 11.8%), and Accommodation & Food Services (47 | 7.4%).
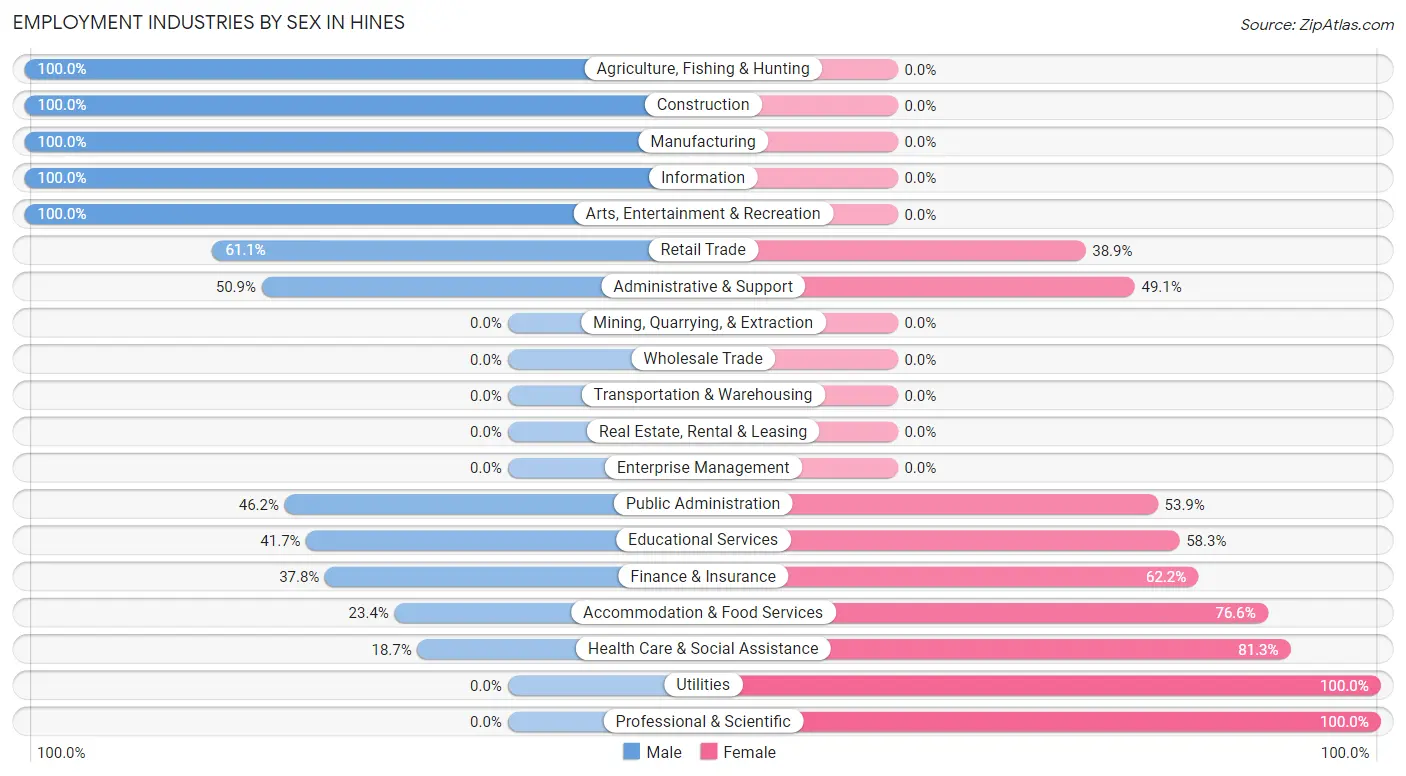
Employment Industries by Sex in Hines
The Hines industries that see more men than women are Agriculture, Fishing & Hunting (100.0%), Construction (100.0%), and Manufacturing (100.0%), whereas the industries that tend to have a higher number of women are Utilities (100.0%), Professional & Scientific (100.0%), and Health Care & Social Assistance (81.3%).
| Industry | Male | Female |
| Agriculture, Fishing & Hunting | 80 (100.0%) | 0 (0.0%) |
| Mining, Quarrying, & Extraction | 0 (0.0%) | 0 (0.0%) |
| Construction | 89 (100.0%) | 0 (0.0%) |
| Manufacturing | 14 (100.0%) | 0 (0.0%) |
| Wholesale Trade | 0 (0.0%) | 0 (0.0%) |
| Retail Trade | 22 (61.1%) | 14 (38.9%) |
| Transportation & Warehousing | 0 (0.0%) | 0 (0.0%) |
| Utilities | 0 (0.0%) | 17 (100.0%) |
| Information | 7 (100.0%) | 0 (0.0%) |
| Finance & Insurance | 17 (37.8%) | 28 (62.2%) |
| Real Estate, Rental & Leasing | 0 (0.0%) | 0 (0.0%) |
| Professional & Scientific | 0 (0.0%) | 4 (100.0%) |
| Enterprise Management | 0 (0.0%) | 0 (0.0%) |
| Administrative & Support | 56 (50.9%) | 54 (49.1%) |
| Educational Services | 15 (41.7%) | 21 (58.3%) |
| Health Care & Social Assistance | 14 (18.7%) | 61 (81.3%) |
| Arts, Entertainment & Recreation | 7 (100.0%) | 0 (0.0%) |
| Accommodation & Food Services | 11 (23.4%) | 36 (76.6%) |
| Public Administration | 18 (46.2%) | 21 (53.8%) |
| Total | 367 (57.5%) | 271 (42.5%) |
Education in Hines
School Enrollment in Hines
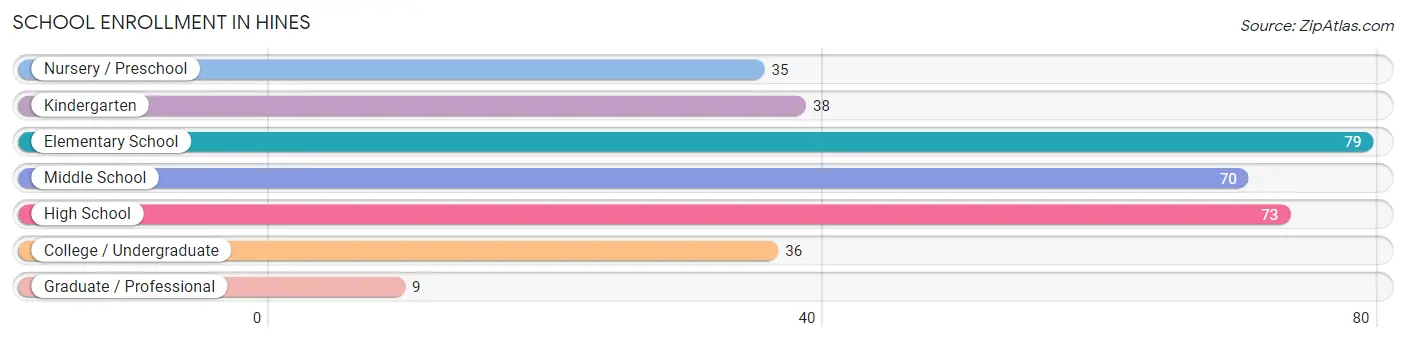
The most common levels of schooling among the 340 students in Hines are elementary school (79 | 23.2%), high school (73 | 21.5%), and middle school (70 | 20.6%).
| School Level | # Students | % Students |
| Nursery / Preschool | 35 | 10.3% |
| Kindergarten | 38 | 11.2% |
| Elementary School | 79 | 23.2% |
| Middle School | 70 | 20.6% |
| High School | 73 | 21.5% |
| College / Undergraduate | 36 | 10.6% |
| Graduate / Professional | 9 | 2.6% |
| Total | 340 | 100.0% |
School Enrollment by Age by Funding Source in Hines
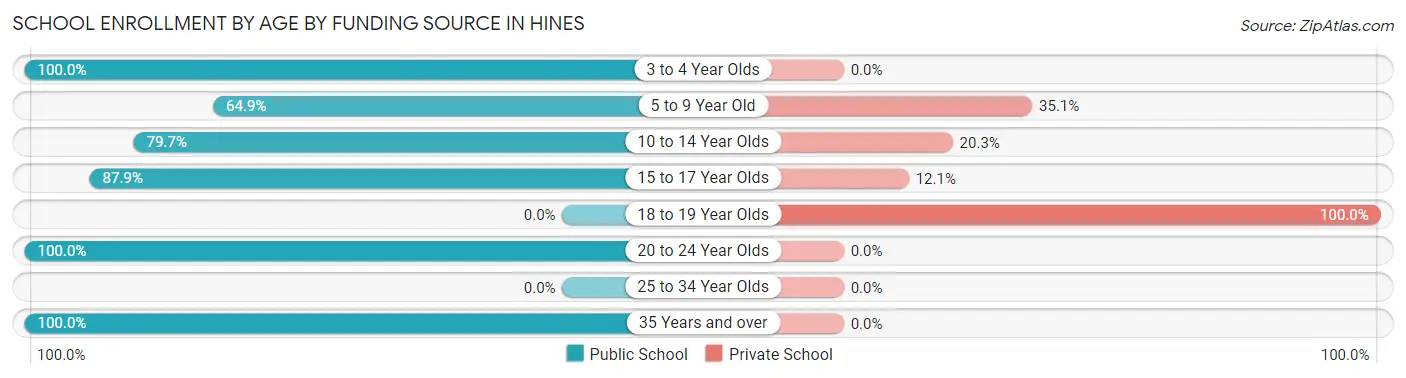
Out of a total of 340 students who are enrolled in schools in Hines, 74 (21.8%) attend a private institution, while the remaining 266 (78.2%) are enrolled in public schools. The age group of 18 to 19 year olds has the highest likelihood of being enrolled in private schools, with 10 (100.0% in the age bracket) enrolled. Conversely, the age group of 3 to 4 year olds has the lowest likelihood of being enrolled in a private school, with 35 (100.0% in the age bracket) attending a public institution.
| Age Bracket | Public School | Private School |
| 3 to 4 Year Olds | 35 (100.0%) | 0 (0.0%) |
| 5 to 9 Year Old | 61 (64.9%) | 33 (35.1%) |
| 10 to 14 Year Olds | 106 (79.7%) | 27 (20.3%) |
| 15 to 17 Year Olds | 29 (87.9%) | 4 (12.1%) |
| 18 to 19 Year Olds | 0 (0.0%) | 10 (100.0%) |
| 20 to 24 Year Olds | 26 (100.0%) | 0 (0.0%) |
| 25 to 34 Year Olds | 0 (0.0%) | 0 (0.0%) |
| 35 Years and over | 9 (100.0%) | 0 (0.0%) |
| Total | 266 (78.2%) | 74 (21.8%) |
Educational Attainment by Field of Study in Hines
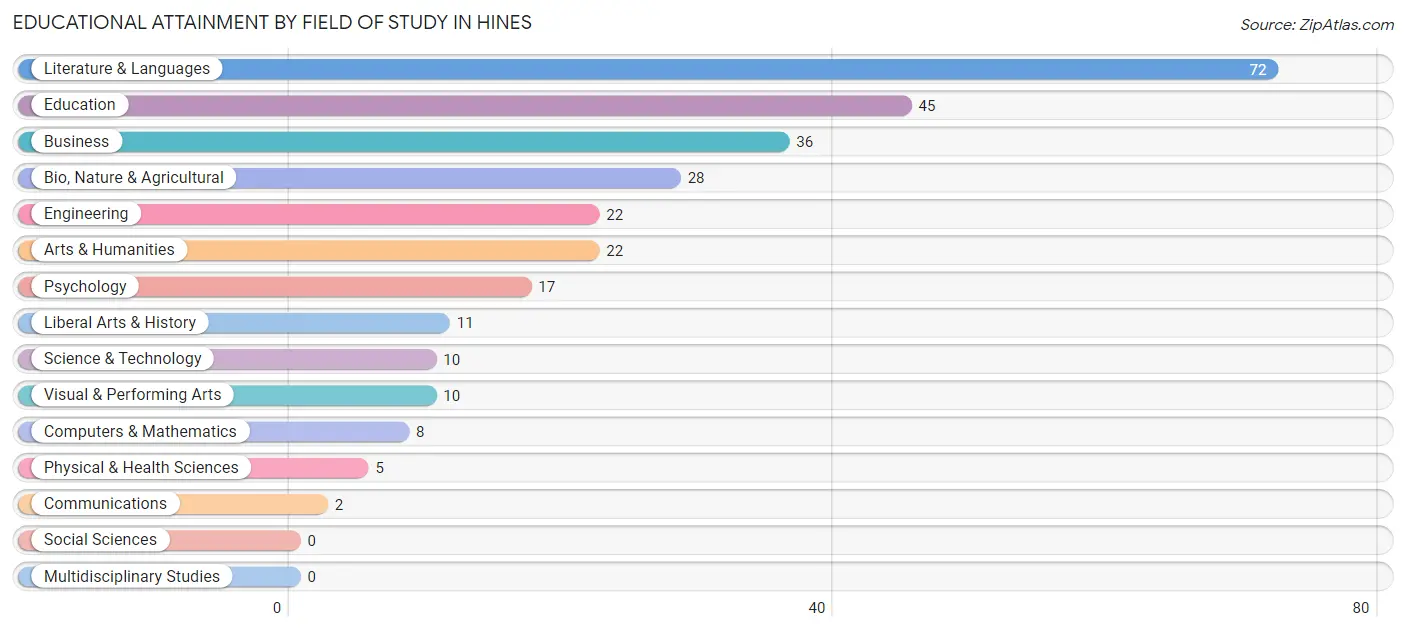
Literature & languages (72 | 25.0%), education (45 | 15.6%), business (36 | 12.5%), bio, nature & agricultural (28 | 9.7%), and engineering (22 | 7.6%) are the most common fields of study among 288 individuals in Hines who have obtained a bachelor's degree or higher.
| Field of Study | # Graduates | % Graduates |
| Computers & Mathematics | 8 | 2.8% |
| Bio, Nature & Agricultural | 28 | 9.7% |
| Physical & Health Sciences | 5 | 1.7% |
| Psychology | 17 | 5.9% |
| Social Sciences | 0 | 0.0% |
| Engineering | 22 | 7.6% |
| Multidisciplinary Studies | 0 | 0.0% |
| Science & Technology | 10 | 3.5% |
| Business | 36 | 12.5% |
| Education | 45 | 15.6% |
| Literature & Languages | 72 | 25.0% |
| Liberal Arts & History | 11 | 3.8% |
| Visual & Performing Arts | 10 | 3.5% |
| Communications | 2 | 0.7% |
| Arts & Humanities | 22 | 7.6% |
| Total | 288 | 100.0% |
Transportation & Commute in Hines
Vehicle Availability by Sex in Hines
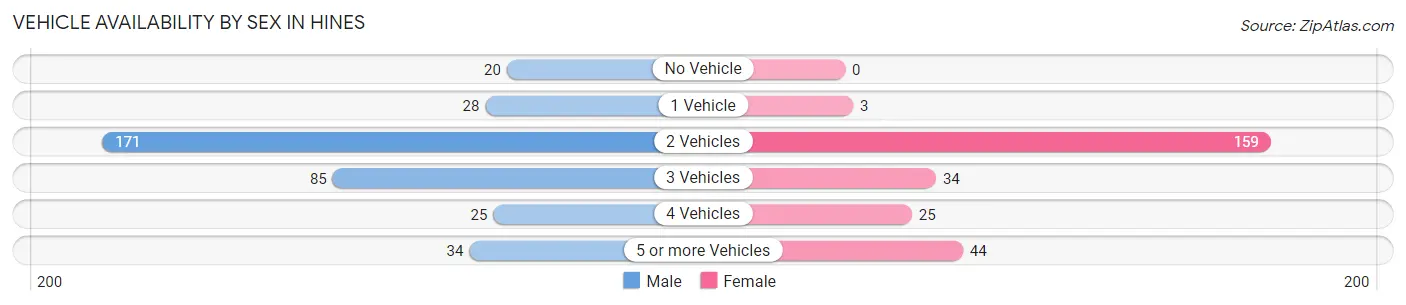
The most prevalent vehicle ownership categories in Hines are males with 2 vehicles (171, accounting for 47.1%) and females with 2 vehicles (159, making up 64.5%).
| Vehicles Available | Male | Female |
| No Vehicle | 20 (5.5%) | 0 (0.0%) |
| 1 Vehicle | 28 (7.7%) | 3 (1.1%) |
| 2 Vehicles | 171 (47.1%) | 159 (60.0%) |
| 3 Vehicles | 85 (23.4%) | 34 (12.8%) |
| 4 Vehicles | 25 (6.9%) | 25 (9.4%) |
| 5 or more Vehicles | 34 (9.4%) | 44 (16.6%) |
| Total | 363 (100.0%) | 265 (100.0%) |
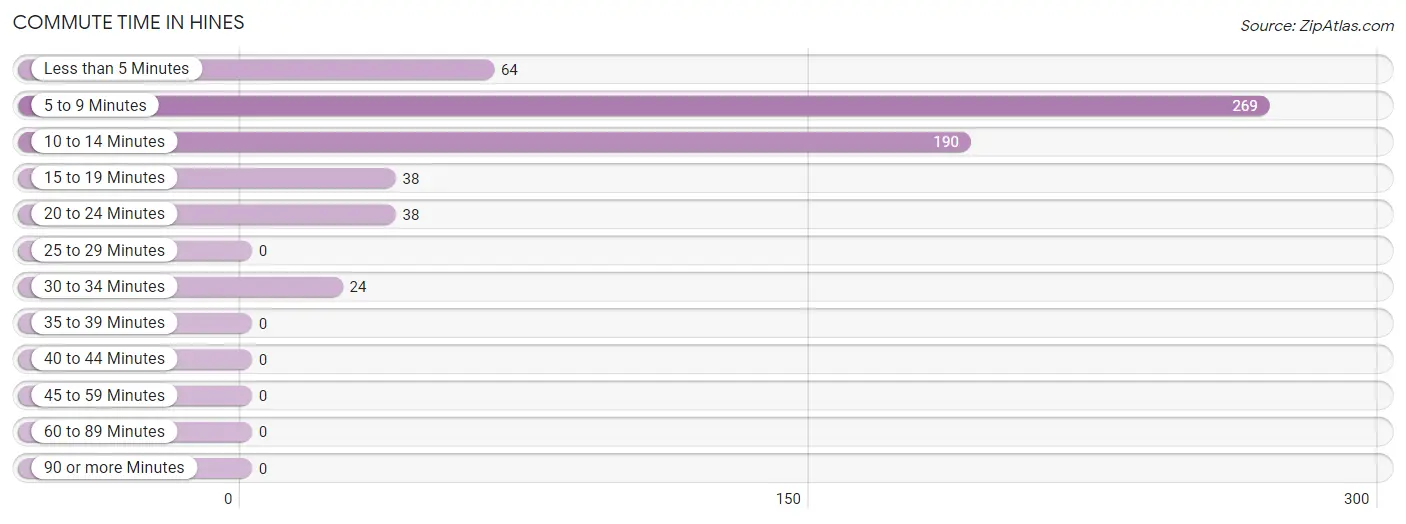
Commute Time in Hines
The most frequently occuring commute durations in Hines are 5 to 9 minutes (269 commuters, 43.2%), 10 to 14 minutes (190 commuters, 30.5%), and less than 5 minutes (64 commuters, 10.3%).
| Commute Time | # Commuters | % Commuters |
| Less than 5 Minutes | 64 | 10.3% |
| 5 to 9 Minutes | 269 | 43.2% |
| 10 to 14 Minutes | 190 | 30.5% |
| 15 to 19 Minutes | 38 | 6.1% |
| 20 to 24 Minutes | 38 | 6.1% |
| 25 to 29 Minutes | 0 | 0.0% |
| 30 to 34 Minutes | 24 | 3.8% |
| 35 to 39 Minutes | 0 | 0.0% |
| 40 to 44 Minutes | 0 | 0.0% |
| 45 to 59 Minutes | 0 | 0.0% |
| 60 to 89 Minutes | 0 | 0.0% |
| 90 or more Minutes | 0 | 0.0% |
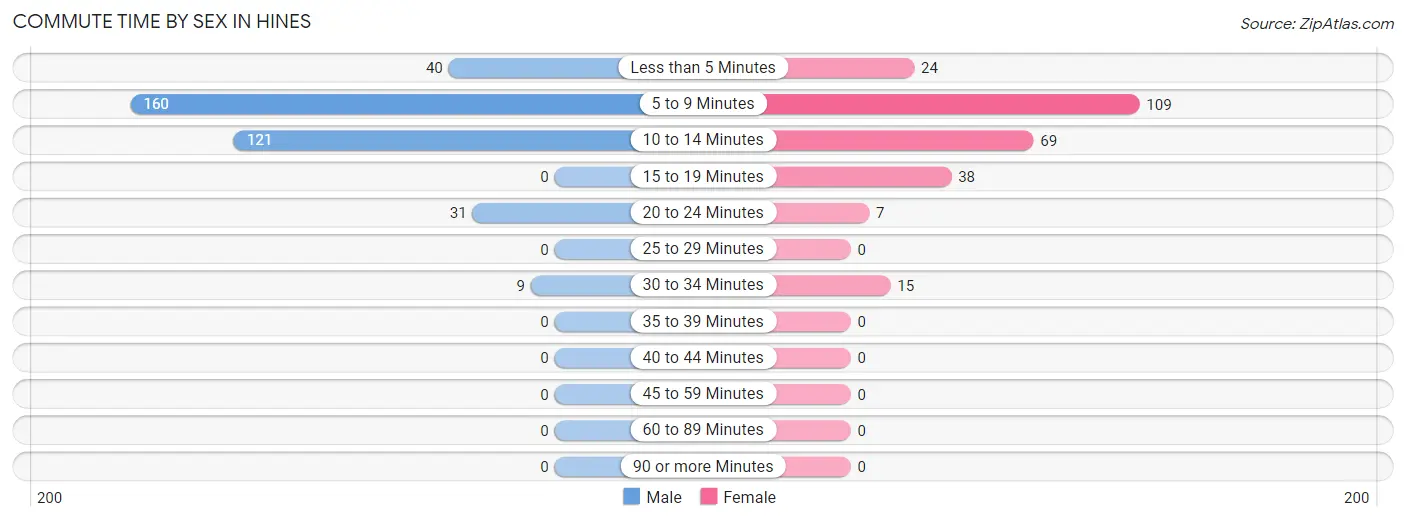
Commute Time by Sex in Hines
The most common commute times in Hines are 5 to 9 minutes (160 commuters, 44.3%) for males and 5 to 9 minutes (109 commuters, 41.6%) for females.
| Commute Time | Male | Female |
| Less than 5 Minutes | 40 (11.1%) | 24 (9.2%) |
| 5 to 9 Minutes | 160 (44.3%) | 109 (41.6%) |
| 10 to 14 Minutes | 121 (33.5%) | 69 (26.3%) |
| 15 to 19 Minutes | 0 (0.0%) | 38 (14.5%) |
| 20 to 24 Minutes | 31 (8.6%) | 7 (2.7%) |
| 25 to 29 Minutes | 0 (0.0%) | 0 (0.0%) |
| 30 to 34 Minutes | 9 (2.5%) | 15 (5.7%) |
| 35 to 39 Minutes | 0 (0.0%) | 0 (0.0%) |
| 40 to 44 Minutes | 0 (0.0%) | 0 (0.0%) |
| 45 to 59 Minutes | 0 (0.0%) | 0 (0.0%) |
| 60 to 89 Minutes | 0 (0.0%) | 0 (0.0%) |
| 90 or more Minutes | 0 (0.0%) | 0 (0.0%) |
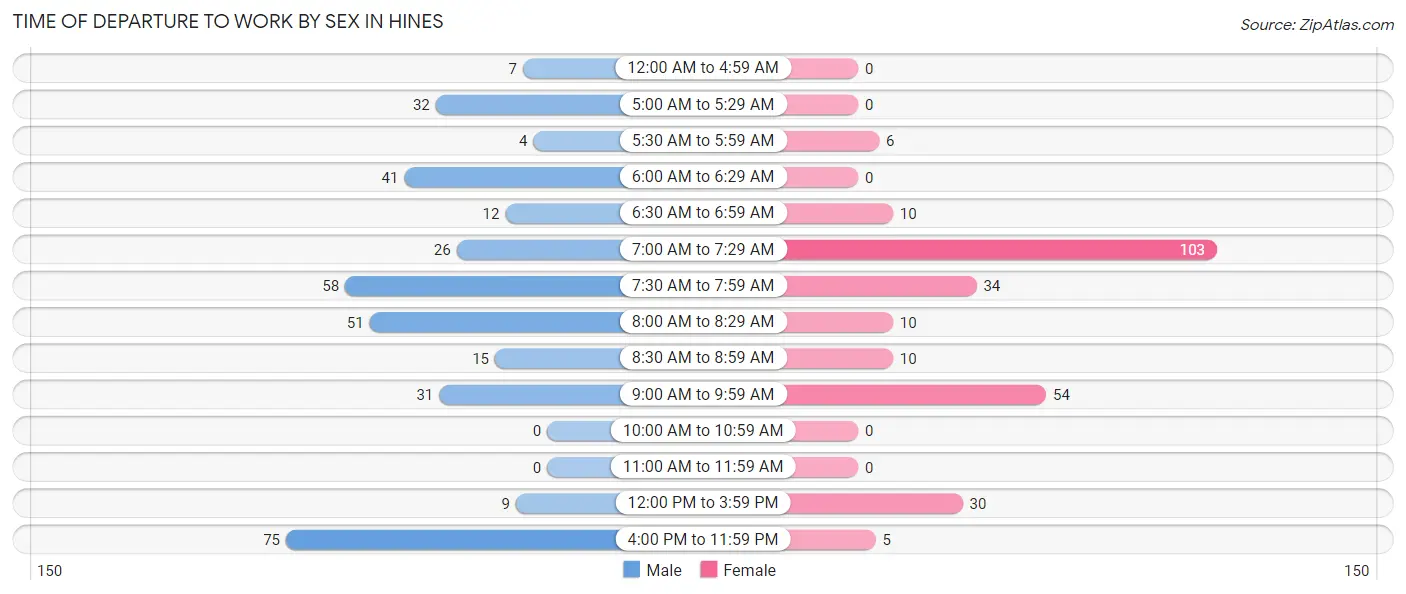
Time of Departure to Work by Sex in Hines
The most frequent times of departure to work in Hines are 4:00 PM to 11:59 PM (75, 20.8%) for males and 7:00 AM to 7:29 AM (103, 39.3%) for females.
| Time of Departure | Male | Female |
| 12:00 AM to 4:59 AM | 7 (1.9%) | 0 (0.0%) |
| 5:00 AM to 5:29 AM | 32 (8.9%) | 0 (0.0%) |
| 5:30 AM to 5:59 AM | 4 (1.1%) | 6 (2.3%) |
| 6:00 AM to 6:29 AM | 41 (11.4%) | 0 (0.0%) |
| 6:30 AM to 6:59 AM | 12 (3.3%) | 10 (3.8%) |
| 7:00 AM to 7:29 AM | 26 (7.2%) | 103 (39.3%) |
| 7:30 AM to 7:59 AM | 58 (16.1%) | 34 (13.0%) |
| 8:00 AM to 8:29 AM | 51 (14.1%) | 10 (3.8%) |
| 8:30 AM to 8:59 AM | 15 (4.2%) | 10 (3.8%) |
| 9:00 AM to 9:59 AM | 31 (8.6%) | 54 (20.6%) |
| 10:00 AM to 10:59 AM | 0 (0.0%) | 0 (0.0%) |
| 11:00 AM to 11:59 AM | 0 (0.0%) | 0 (0.0%) |
| 12:00 PM to 3:59 PM | 9 (2.5%) | 30 (11.5%) |
| 4:00 PM to 11:59 PM | 75 (20.8%) | 5 (1.9%) |
| Total | 361 (100.0%) | 262 (100.0%) |
Housing Occupancy in Hines
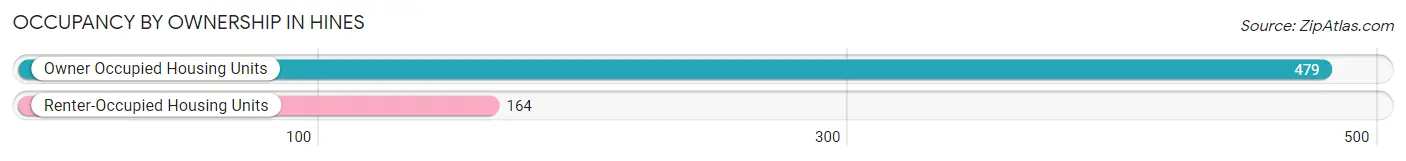
Occupancy by Ownership in Hines
Of the total 643 dwellings in Hines, owner-occupied units account for 479 (74.5%), while renter-occupied units make up 164 (25.5%).
| Occupancy | # Housing Units | % Housing Units |
| Owner Occupied Housing Units | 479 | 74.5% |
| Renter-Occupied Housing Units | 164 | 25.5% |
| Total Occupied Housing Units | 643 | 100.0% |
Occupancy by Household Size in Hines
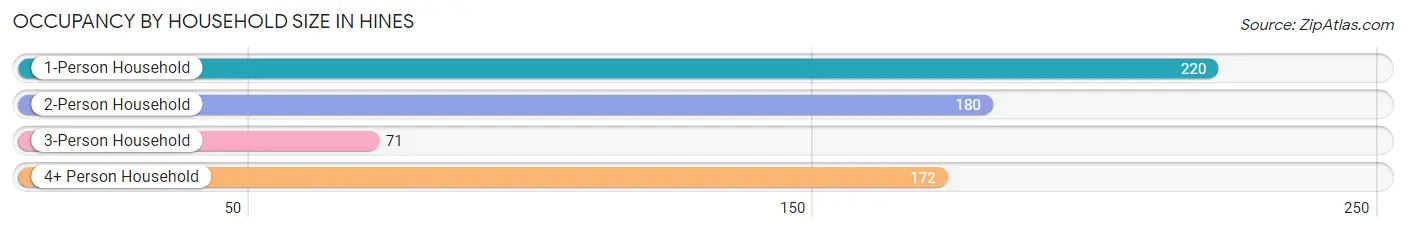
| Household Size | # Housing Units | % Housing Units |
| 1-Person Household | 220 | 34.2% |
| 2-Person Household | 180 | 28.0% |
| 3-Person Household | 71 | 11.0% |
| 4+ Person Household | 172 | 26.8% |
| Total Housing Units | 643 | 100.0% |
Occupancy by Ownership by Household Size in Hines
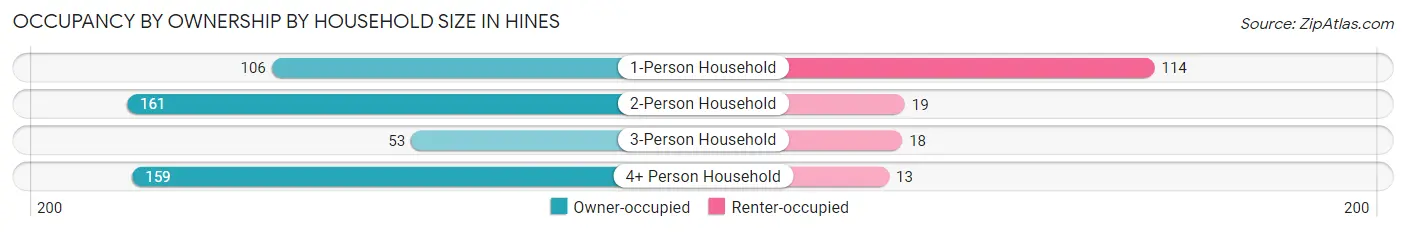
| Household Size | Owner-occupied | Renter-occupied |
| 1-Person Household | 106 (48.2%) | 114 (51.8%) |
| 2-Person Household | 161 (89.4%) | 19 (10.6%) |
| 3-Person Household | 53 (74.7%) | 18 (25.4%) |
| 4+ Person Household | 159 (92.4%) | 13 (7.6%) |
| Total Housing Units | 479 (74.5%) | 164 (25.5%) |
Occupancy by Educational Attainment in Hines
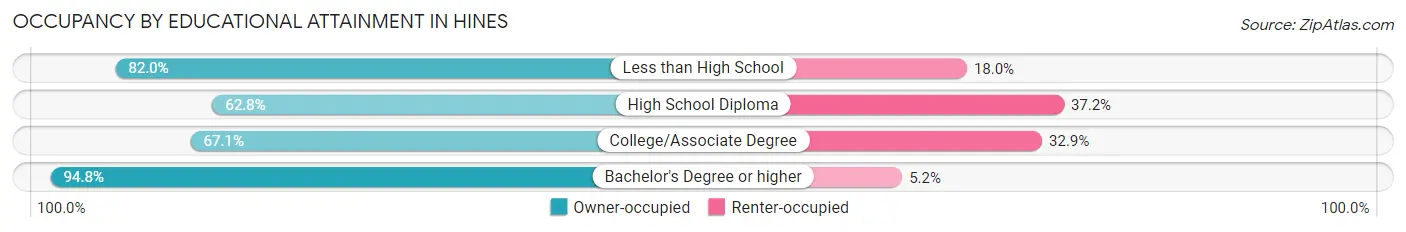
| Household Size | Owner-occupied | Renter-occupied |
| Less than High School | 41 (82.0%) | 9 (18.0%) |
| High School Diploma | 118 (62.8%) | 70 (37.2%) |
| College/Associate Degree | 155 (67.1%) | 76 (32.9%) |
| Bachelor's Degree or higher | 165 (94.8%) | 9 (5.2%) |
Occupancy by Age of Householder in Hines
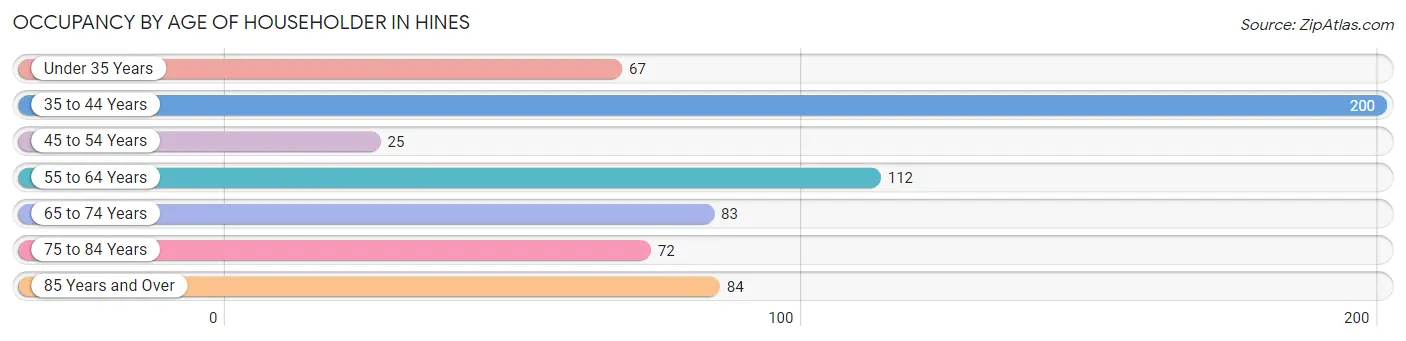
| Age Bracket | # Households | % Households |
| Under 35 Years | 67 | 10.4% |
| 35 to 44 Years | 200 | 31.1% |
| 45 to 54 Years | 25 | 3.9% |
| 55 to 64 Years | 112 | 17.4% |
| 65 to 74 Years | 83 | 12.9% |
| 75 to 84 Years | 72 | 11.2% |
| 85 Years and Over | 84 | 13.1% |
| Total | 643 | 100.0% |
Housing Finances in Hines
Median Income by Occupancy in Hines
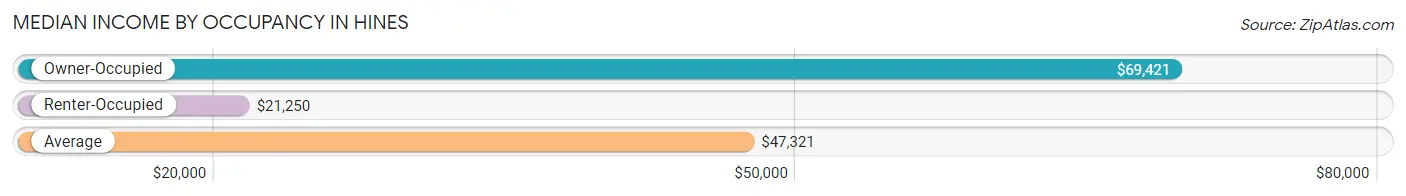
| Occupancy Type | # Households | Median Income |
| Owner-Occupied | 479 (74.5%) | $69,421 |
| Renter-Occupied | 164 (25.5%) | $21,250 |
| Average | 643 (100.0%) | $47,321 |
Occupancy by Householder Income Bracket in Hines
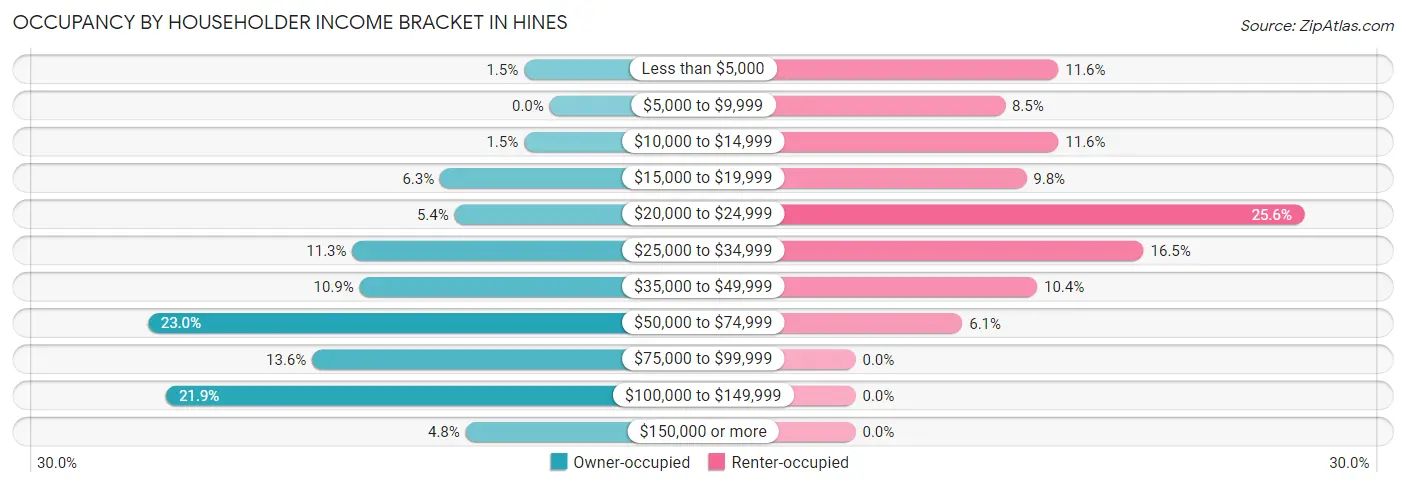
| Income Bracket | Owner-occupied | Renter-occupied |
| Less than $5,000 | 7 (1.5%) | 19 (11.6%) |
| $5,000 to $9,999 | 0 (0.0%) | 14 (8.5%) |
| $10,000 to $14,999 | 7 (1.5%) | 19 (11.6%) |
| $15,000 to $19,999 | 30 (6.3%) | 16 (9.8%) |
| $20,000 to $24,999 | 26 (5.4%) | 42 (25.6%) |
| $25,000 to $34,999 | 54 (11.3%) | 27 (16.5%) |
| $35,000 to $49,999 | 52 (10.9%) | 17 (10.4%) |
| $50,000 to $74,999 | 110 (23.0%) | 10 (6.1%) |
| $75,000 to $99,999 | 65 (13.6%) | 0 (0.0%) |
| $100,000 to $149,999 | 105 (21.9%) | 0 (0.0%) |
| $150,000 or more | 23 (4.8%) | 0 (0.0%) |
| Total | 479 (100.0%) | 164 (100.0%) |
Monthly Housing Cost Tiers in Hines
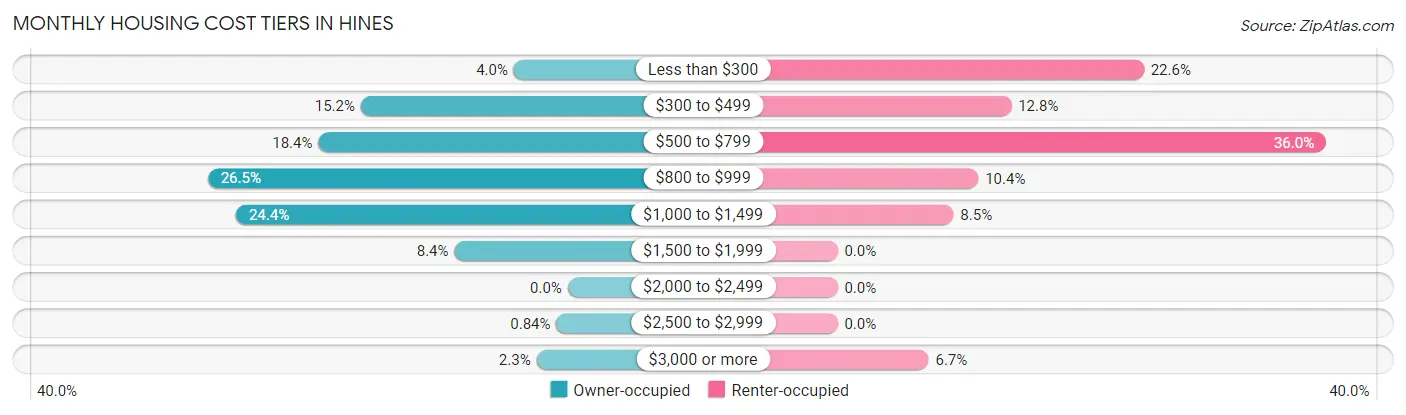
| Monthly Cost | Owner-occupied | Renter-occupied |
| Less than $300 | 19 (4.0%) | 37 (22.6%) |
| $300 to $499 | 73 (15.2%) | 21 (12.8%) |
| $500 to $799 | 88 (18.4%) | 59 (36.0%) |
| $800 to $999 | 127 (26.5%) | 17 (10.4%) |
| $1,000 to $1,499 | 117 (24.4%) | 14 (8.5%) |
| $1,500 to $1,999 | 40 (8.4%) | 0 (0.0%) |
| $2,000 to $2,499 | 0 (0.0%) | 0 (0.0%) |
| $2,500 to $2,999 | 4 (0.8%) | 0 (0.0%) |
| $3,000 or more | 11 (2.3%) | 11 (6.7%) |
| Total | 479 (100.0%) | 164 (100.0%) |
Physical Housing Characteristics in Hines
Housing Structures in Hines
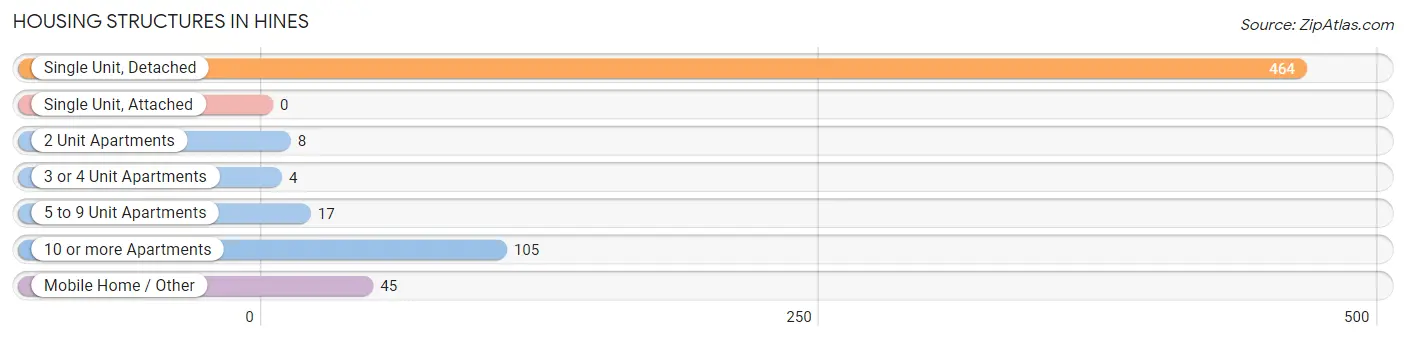
| Structure Type | # Housing Units | % Housing Units |
| Single Unit, Detached | 464 | 72.2% |
| Single Unit, Attached | 0 | 0.0% |
| 2 Unit Apartments | 8 | 1.2% |
| 3 or 4 Unit Apartments | 4 | 0.6% |
| 5 to 9 Unit Apartments | 17 | 2.6% |
| 10 or more Apartments | 105 | 16.3% |
| Mobile Home / Other | 45 | 7.0% |
| Total | 643 | 100.0% |
Housing Structures by Occupancy in Hines
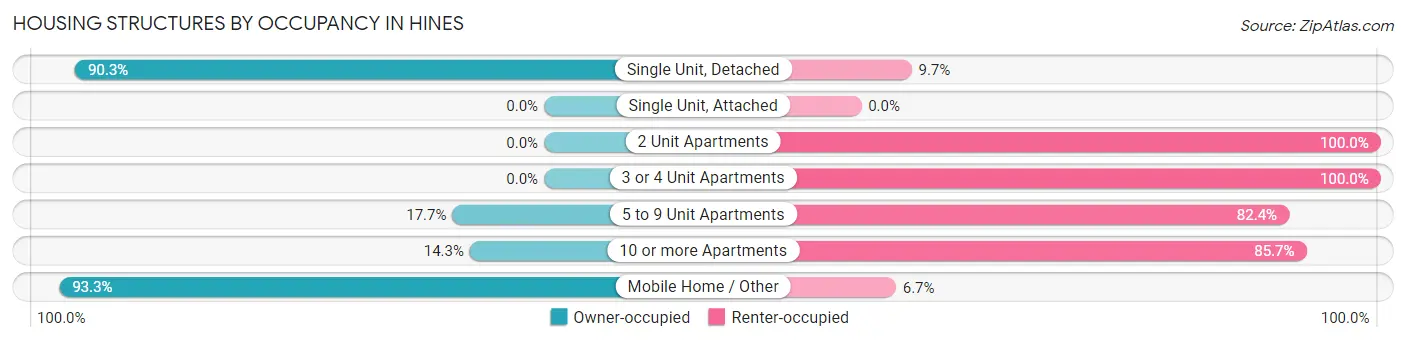
| Structure Type | Owner-occupied | Renter-occupied |
| Single Unit, Detached | 419 (90.3%) | 45 (9.7%) |
| Single Unit, Attached | 0 (0.0%) | 0 (0.0%) |
| 2 Unit Apartments | 0 (0.0%) | 8 (100.0%) |
| 3 or 4 Unit Apartments | 0 (0.0%) | 4 (100.0%) |
| 5 to 9 Unit Apartments | 3 (17.6%) | 14 (82.4%) |
| 10 or more Apartments | 15 (14.3%) | 90 (85.7%) |
| Mobile Home / Other | 42 (93.3%) | 3 (6.7%) |
| Total | 479 (74.5%) | 164 (25.5%) |
Housing Structures by Number of Rooms in Hines
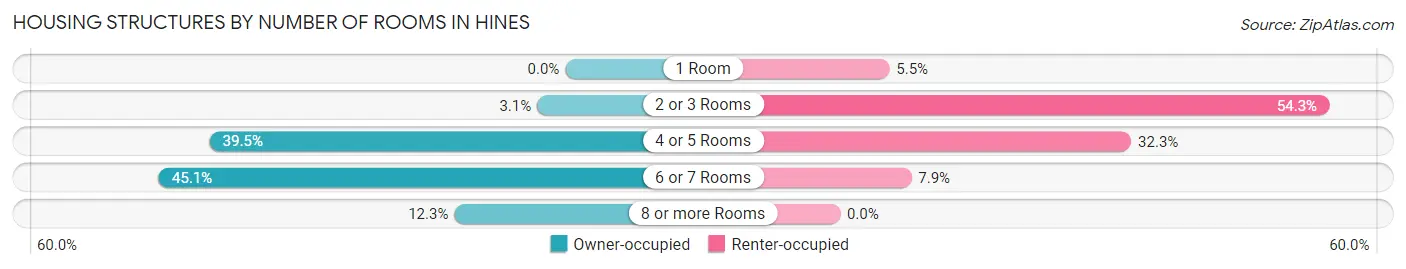
| Number of Rooms | Owner-occupied | Renter-occupied |
| 1 Room | 0 (0.0%) | 9 (5.5%) |
| 2 or 3 Rooms | 15 (3.1%) | 89 (54.3%) |
| 4 or 5 Rooms | 189 (39.5%) | 53 (32.3%) |
| 6 or 7 Rooms | 216 (45.1%) | 13 (7.9%) |
| 8 or more Rooms | 59 (12.3%) | 0 (0.0%) |
| Total | 479 (100.0%) | 164 (100.0%) |
Housing Structure by Heating Type in Hines
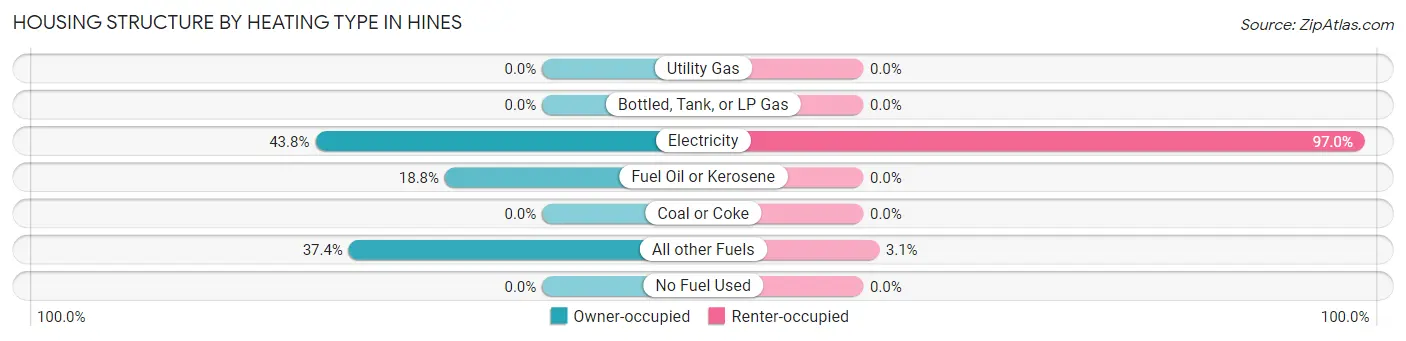
| Heating Type | Owner-occupied | Renter-occupied |
| Utility Gas | 0 (0.0%) | 0 (0.0%) |
| Bottled, Tank, or LP Gas | 0 (0.0%) | 0 (0.0%) |
| Electricity | 210 (43.8%) | 159 (97.0%) |
| Fuel Oil or Kerosene | 90 (18.8%) | 0 (0.0%) |
| Coal or Coke | 0 (0.0%) | 0 (0.0%) |
| All other Fuels | 179 (37.4%) | 5 (3.0%) |
| No Fuel Used | 0 (0.0%) | 0 (0.0%) |
| Total | 479 (100.0%) | 164 (100.0%) |
Household Vehicle Usage in Hines
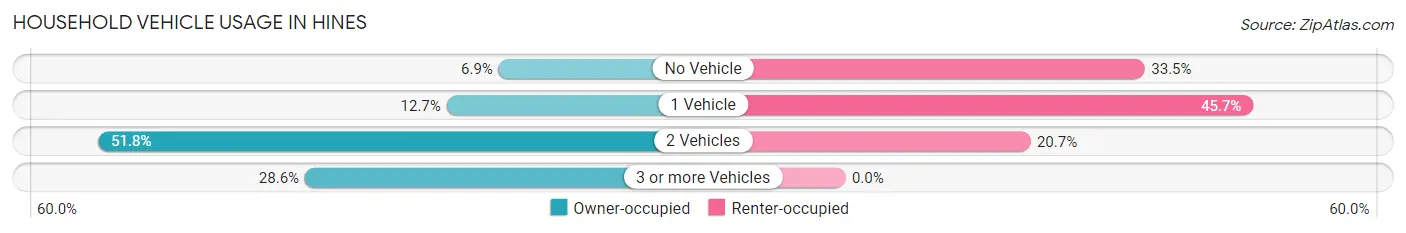
| Vehicles per Household | Owner-occupied | Renter-occupied |
| No Vehicle | 33 (6.9%) | 55 (33.5%) |
| 1 Vehicle | 61 (12.7%) | 75 (45.7%) |
| 2 Vehicles | 248 (51.8%) | 34 (20.7%) |
| 3 or more Vehicles | 137 (28.6%) | 0 (0.0%) |
| Total | 479 (100.0%) | 164 (100.0%) |
Real Estate & Mortgages in Hines
Real Estate and Mortgage Overview in Hines
| Characteristic | Without Mortgage | With Mortgage |
| Housing Units | 147 | 332 |
| Median Property Value | $153,800 | $153,700 |
| Median Household Income | - | - |
| Monthly Housing Costs | $490 | $11 |
| Real Estate Taxes | $1,844 | $0 |
Property Value by Mortgage Status in Hines
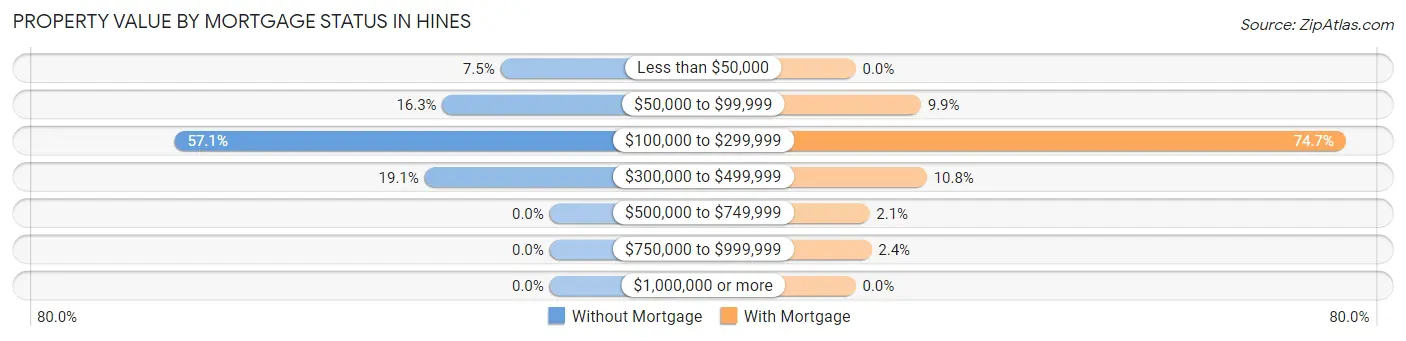
| Property Value | Without Mortgage | With Mortgage |
| Less than $50,000 | 11 (7.5%) | 0 (0.0%) |
| $50,000 to $99,999 | 24 (16.3%) | 33 (9.9%) |
| $100,000 to $299,999 | 84 (57.1%) | 248 (74.7%) |
| $300,000 to $499,999 | 28 (19.1%) | 36 (10.8%) |
| $500,000 to $749,999 | 0 (0.0%) | 7 (2.1%) |
| $750,000 to $999,999 | 0 (0.0%) | 8 (2.4%) |
| $1,000,000 or more | 0 (0.0%) | 0 (0.0%) |
| Total | 147 (100.0%) | 332 (100.0%) |
Household Income by Mortgage Status in Hines
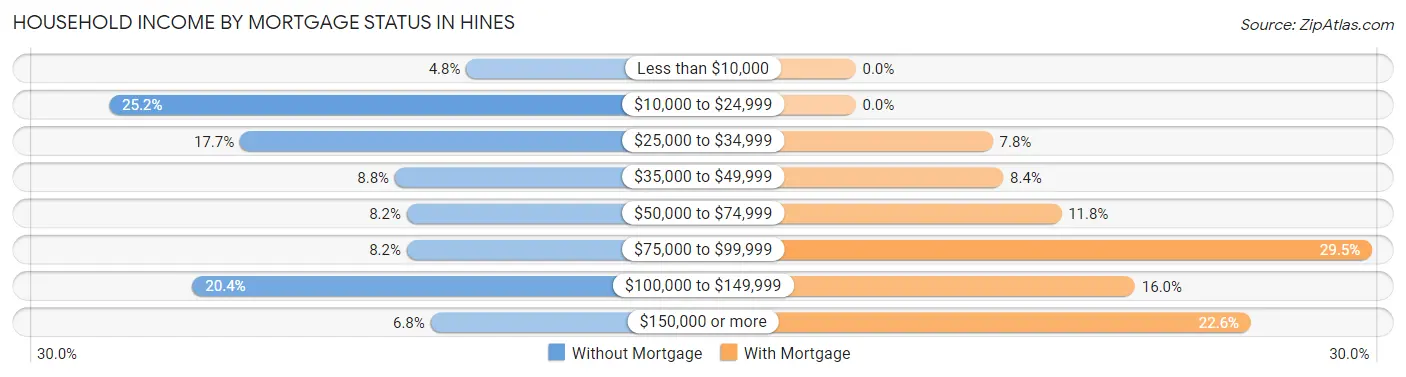
| Household Income | Without Mortgage | With Mortgage |
| Less than $10,000 | 7 (4.8%) | 0 (0.0%) |
| $10,000 to $24,999 | 37 (25.2%) | 0 (0.0%) |
| $25,000 to $34,999 | 26 (17.7%) | 26 (7.8%) |
| $35,000 to $49,999 | 13 (8.8%) | 28 (8.4%) |
| $50,000 to $74,999 | 12 (8.2%) | 39 (11.7%) |
| $75,000 to $99,999 | 12 (8.2%) | 98 (29.5%) |
| $100,000 to $149,999 | 30 (20.4%) | 53 (16.0%) |
| $150,000 or more | 10 (6.8%) | 75 (22.6%) |
| Total | 147 (100.0%) | 332 (100.0%) |
Property Value to Household Income Ratio in Hines
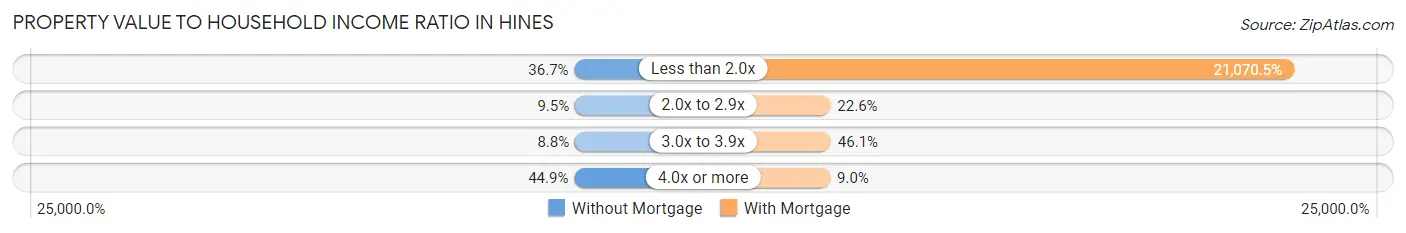
| Value-to-Income Ratio | Without Mortgage | With Mortgage |
| Less than 2.0x | 54 (36.7%) | 69,954 (21,070.5%) |
| 2.0x to 2.9x | 14 (9.5%) | 75 (22.6%) |
| 3.0x to 3.9x | 13 (8.8%) | 153 (46.1%) |
| 4.0x or more | 66 (44.9%) | 30 (9.0%) |
| Total | 147 (100.0%) | 332 (100.0%) |
Real Estate Taxes by Mortgage Status in Hines
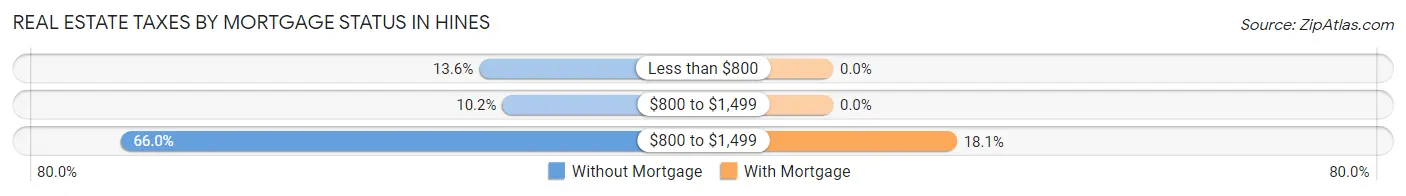
| Property Taxes | Without Mortgage | With Mortgage |
| Less than $800 | 20 (13.6%) | 0 (0.0%) |
| $800 to $1,499 | 15 (10.2%) | 0 (0.0%) |
| $800 to $1,499 | 97 (66.0%) | 60 (18.1%) |
| Total | 147 (100.0%) | 332 (100.0%) |
Health & Disability in Hines
Health Insurance Coverage by Age in Hines
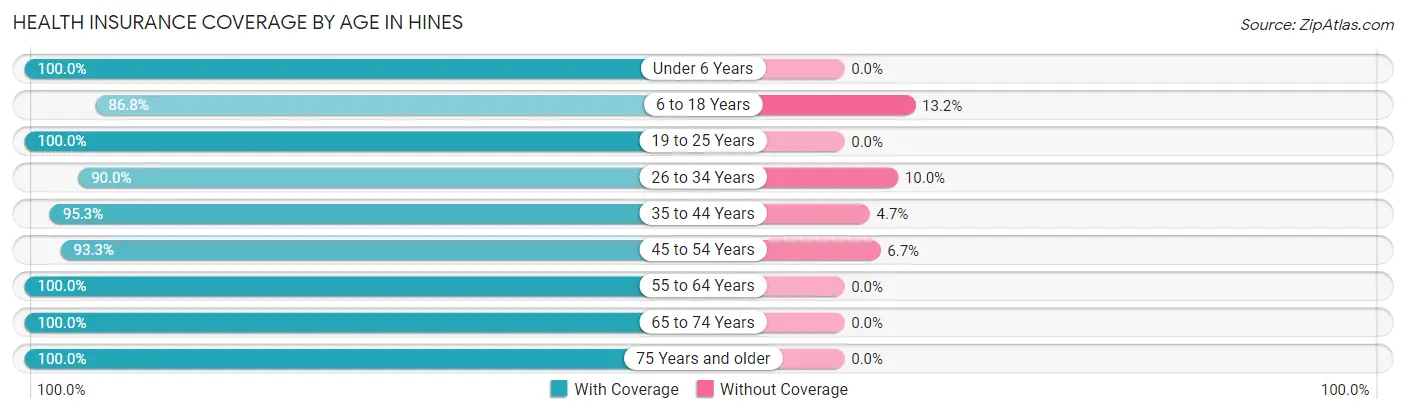
| Age Bracket | With Coverage | Without Coverage |
| Under 6 Years | 121 (100.0%) | 0 (0.0%) |
| 6 to 18 Years | 243 (86.8%) | 37 (13.2%) |
| 19 to 25 Years | 118 (100.0%) | 0 (0.0%) |
| 26 to 34 Years | 72 (90.0%) | 8 (10.0%) |
| 35 to 44 Years | 323 (95.3%) | 16 (4.7%) |
| 45 to 54 Years | 111 (93.3%) | 8 (6.7%) |
| 55 to 64 Years | 202 (100.0%) | 0 (0.0%) |
| 65 to 74 Years | 161 (100.0%) | 0 (0.0%) |
| 75 Years and older | 156 (100.0%) | 0 (0.0%) |
| Total | 1,507 (95.6%) | 69 (4.4%) |
Health Insurance Coverage by Citizenship Status in Hines
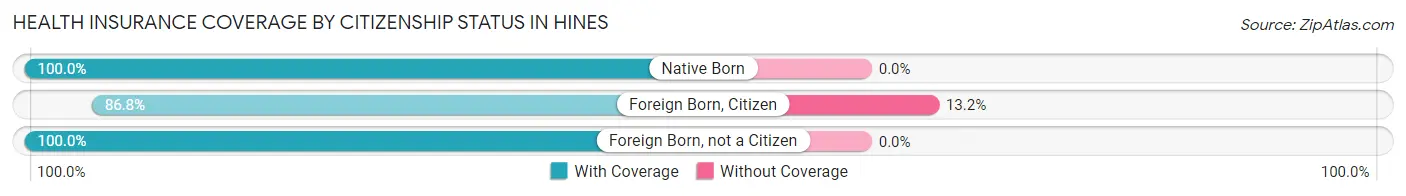
| Citizenship Status | With Coverage | Without Coverage |
| Native Born | 121 (100.0%) | 0 (0.0%) |
| Foreign Born, Citizen | 243 (86.8%) | 37 (13.2%) |
| Foreign Born, not a Citizen | 118 (100.0%) | 0 (0.0%) |
Health Insurance Coverage by Household Income in Hines
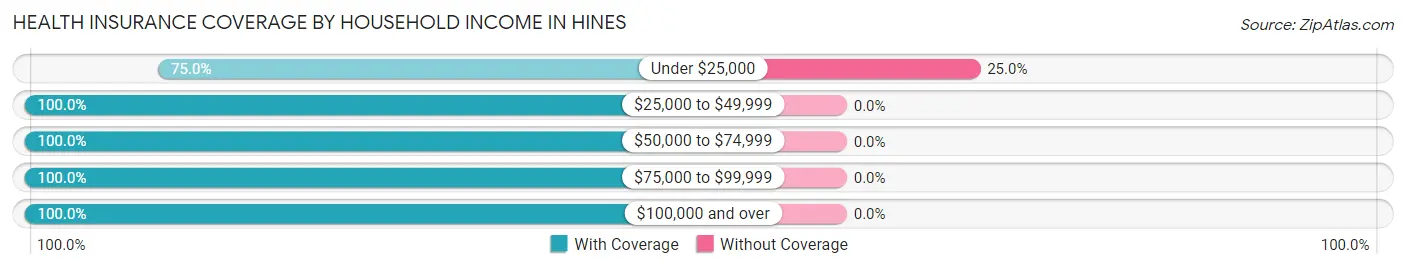
| Household Income | With Coverage | Without Coverage |
| Under $25,000 | 207 (75.0%) | 69 (25.0%) |
| $25,000 to $49,999 | 290 (100.0%) | 0 (0.0%) |
| $50,000 to $74,999 | 397 (100.0%) | 0 (0.0%) |
| $75,000 to $99,999 | 201 (100.0%) | 0 (0.0%) |
| $100,000 and over | 382 (100.0%) | 0 (0.0%) |
Public vs Private Health Insurance Coverage by Age in Hines
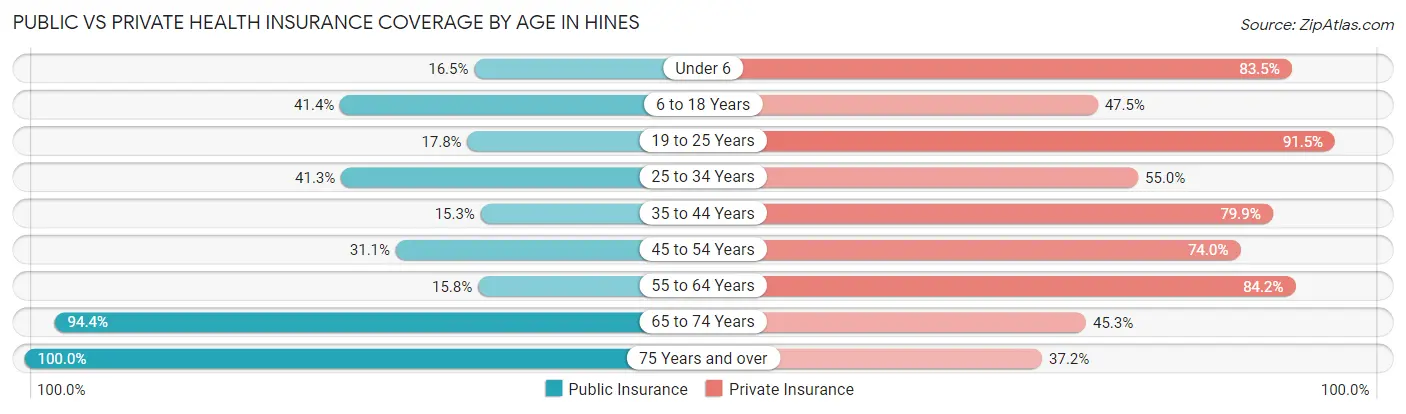
| Age Bracket | Public Insurance | Private Insurance |
| Under 6 | 20 (16.5%) | 101 (83.5%) |
| 6 to 18 Years | 116 (41.4%) | 133 (47.5%) |
| 19 to 25 Years | 21 (17.8%) | 108 (91.5%) |
| 25 to 34 Years | 33 (41.2%) | 44 (55.0%) |
| 35 to 44 Years | 52 (15.3%) | 271 (79.9%) |
| 45 to 54 Years | 37 (31.1%) | 88 (74.0%) |
| 55 to 64 Years | 32 (15.8%) | 170 (84.2%) |
| 65 to 74 Years | 152 (94.4%) | 73 (45.3%) |
| 75 Years and over | 156 (100.0%) | 58 (37.2%) |
| Total | 619 (39.3%) | 1,046 (66.4%) |
Disability Status by Sex by Age in Hines
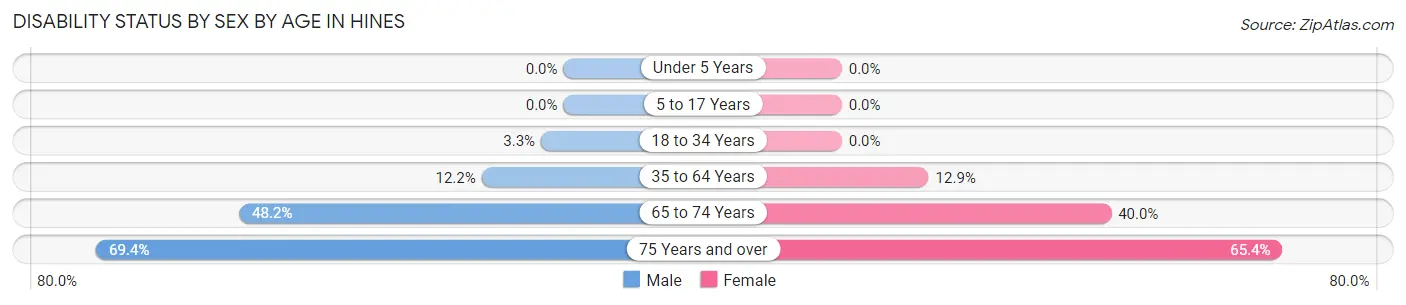
| Age Bracket | Male | Female |
| Under 5 Years | 0 (0.0%) | 0 (0.0%) |
| 5 to 17 Years | 0 (0.0%) | 0 (0.0%) |
| 18 to 34 Years | 4 (3.3%) | 0 (0.0%) |
| 35 to 64 Years | 35 (12.1%) | 48 (12.9%) |
| 65 to 74 Years | 39 (48.1%) | 32 (40.0%) |
| 75 Years and over | 34 (69.4%) | 70 (65.4%) |
Disability Class by Sex by Age in Hines
Disability Class: Hearing Difficulty
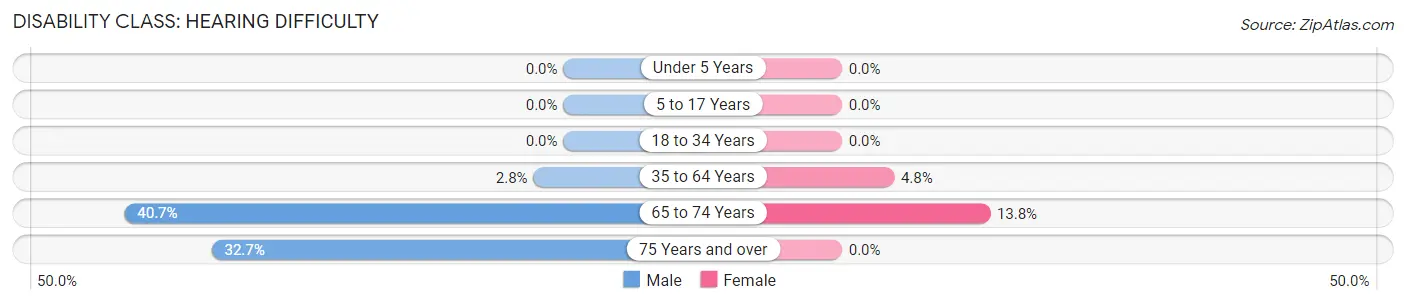
| Age Bracket | Male | Female |
| Under 5 Years | 0 (0.0%) | 0 (0.0%) |
| 5 to 17 Years | 0 (0.0%) | 0 (0.0%) |
| 18 to 34 Years | 0 (0.0%) | 0 (0.0%) |
| 35 to 64 Years | 8 (2.8%) | 18 (4.8%) |
| 65 to 74 Years | 33 (40.7%) | 11 (13.8%) |
| 75 Years and over | 16 (32.7%) | 0 (0.0%) |
Disability Class: Vision Difficulty
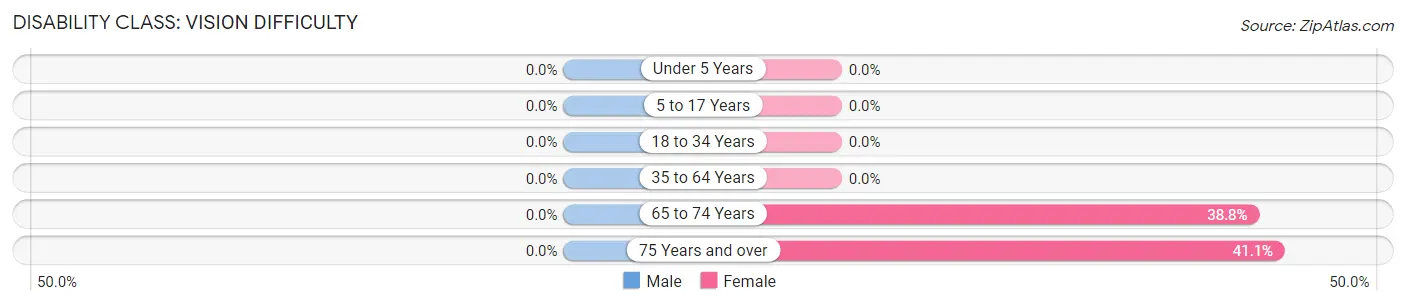
| Age Bracket | Male | Female |
| Under 5 Years | 0 (0.0%) | 0 (0.0%) |
| 5 to 17 Years | 0 (0.0%) | 0 (0.0%) |
| 18 to 34 Years | 0 (0.0%) | 0 (0.0%) |
| 35 to 64 Years | 0 (0.0%) | 0 (0.0%) |
| 65 to 74 Years | 0 (0.0%) | 31 (38.8%) |
| 75 Years and over | 0 (0.0%) | 44 (41.1%) |
Disability Class: Cognitive Difficulty
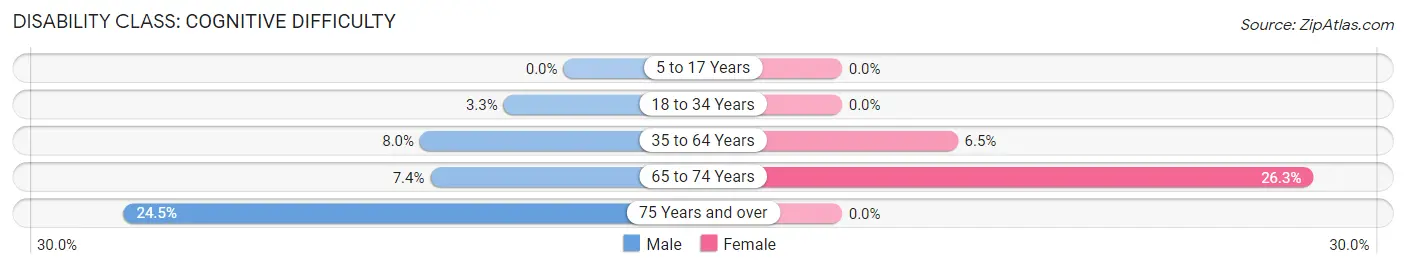
| Age Bracket | Male | Female |
| 5 to 17 Years | 0 (0.0%) | 0 (0.0%) |
| 18 to 34 Years | 4 (3.3%) | 0 (0.0%) |
| 35 to 64 Years | 23 (8.0%) | 24 (6.5%) |
| 65 to 74 Years | 6 (7.4%) | 21 (26.3%) |
| 75 Years and over | 12 (24.5%) | 0 (0.0%) |
Disability Class: Ambulatory Difficulty
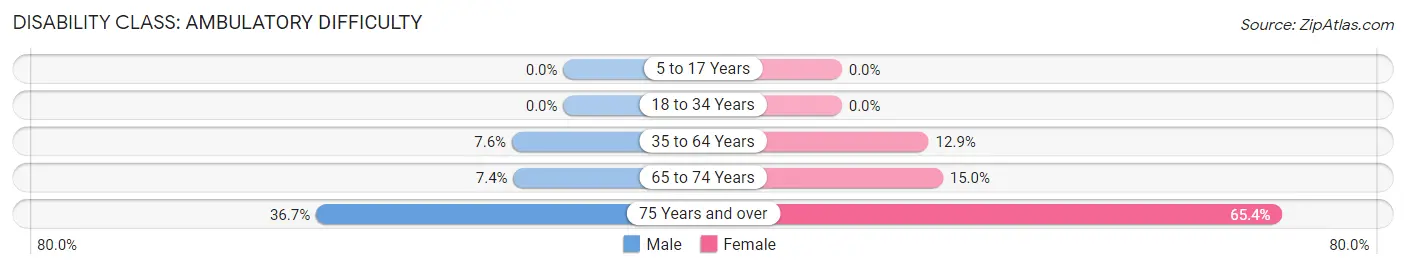
| Age Bracket | Male | Female |
| 5 to 17 Years | 0 (0.0%) | 0 (0.0%) |
| 18 to 34 Years | 0 (0.0%) | 0 (0.0%) |
| 35 to 64 Years | 22 (7.6%) | 48 (12.9%) |
| 65 to 74 Years | 6 (7.4%) | 12 (15.0%) |
| 75 Years and over | 18 (36.7%) | 70 (65.4%) |
Disability Class: Self-Care Difficulty
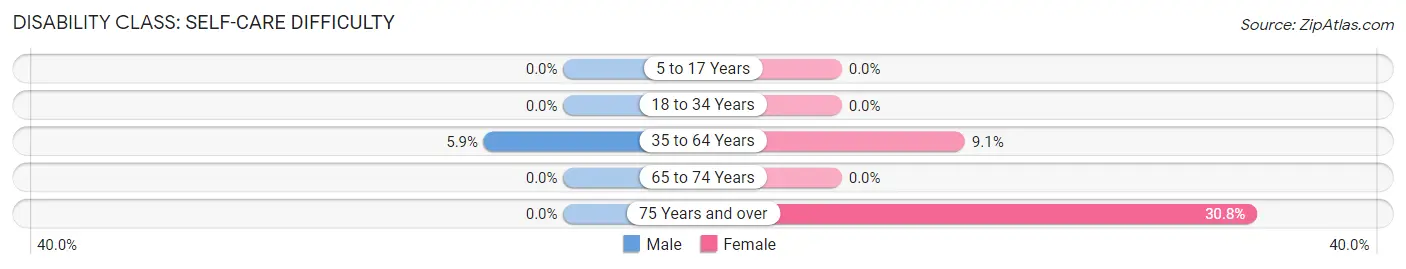
| Age Bracket | Male | Female |
| 5 to 17 Years | 0 (0.0%) | 0 (0.0%) |
| 18 to 34 Years | 0 (0.0%) | 0 (0.0%) |
| 35 to 64 Years | 17 (5.9%) | 34 (9.1%) |
| 65 to 74 Years | 0 (0.0%) | 0 (0.0%) |
| 75 Years and over | 0 (0.0%) | 33 (30.8%) |
Technology Access in Hines
Computing Device Access in Hines
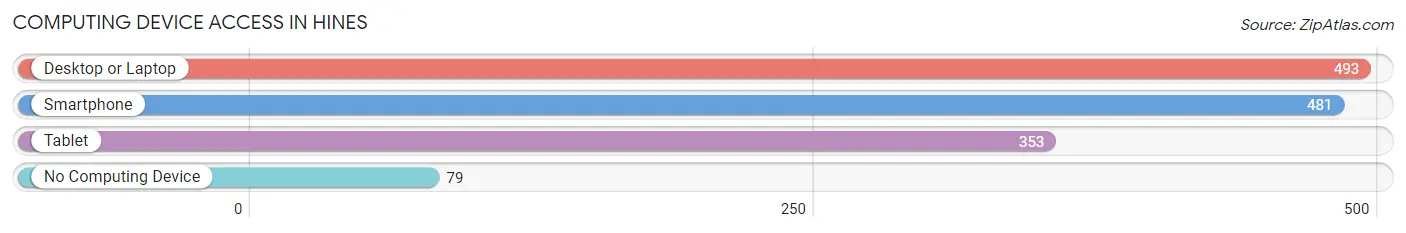
| Device Type | # Households | % Households |
| Desktop or Laptop | 493 | 76.7% |
| Smartphone | 481 | 74.8% |
| Tablet | 353 | 54.9% |
| No Computing Device | 79 | 12.3% |
| Total | 643 | 100.0% |
Internet Access in Hines
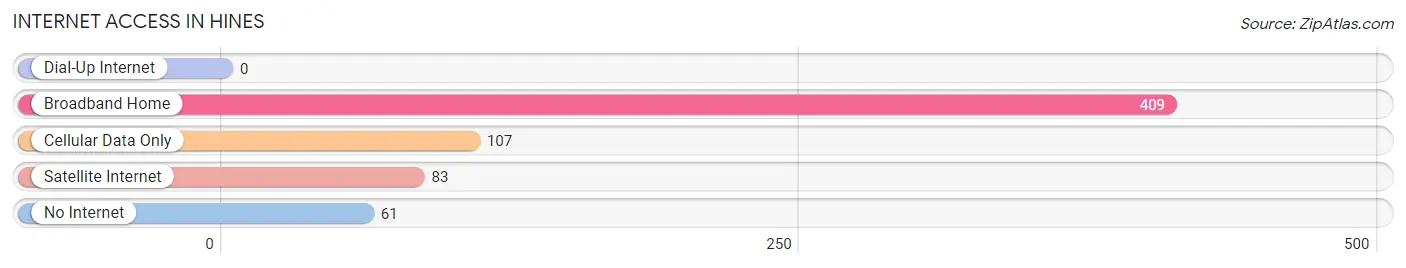
| Internet Type | # Households | % Households |
| Dial-Up Internet | 0 | 0.0% |
| Broadband Home | 409 | 63.6% |
| Cellular Data Only | 107 | 16.6% |
| Satellite Internet | 83 | 12.9% |
| No Internet | 61 | 9.5% |
| Total | 643 | 100.0% |
Hines Summary
Hines is a city located in Harney County, Oregon, United States. The population was 2,719 at the 2010 census. It is the county seat of Harney County.
History
Hines was founded in 1887 by the Oregon and California Railroad. The city was named after William Hines, a railroad official. The city was incorporated in 1911.
Geography
Hines is located at an elevation of 4,093 feet (1,248 m) in the high desert of southeastern Oregon. It is situated on the south bank of the Silvies River, near the intersection of U.S. Route 20 and Oregon Route 78.
The city is located in the Harney Basin, a large, flat, arid area surrounded by mountains. To the north are the Steens Mountains, to the east are the Hart Mountain National Antelope Refuge and the Alvord Desert, to the south are the Malheur National Forest and the Donner und Blitzen River, and to the west are the Warner Mountains.
Climate
Hines has a semi-arid climate, with hot summers and cold winters. The average annual precipitation is 8.5 inches (216 mm).
Economy
The economy of Hines is largely based on agriculture and ranching. The city is home to several large ranches, including the historic Harney County Cattle Company.
The city is also home to several industries, including a lumber mill, a grain elevator, and a food processing plant.
Demographics
As of the 2010 census, there were 2,719 people, 1,093 households, and 690 families residing in the city. The population density was 1,093.3 people per square mile (422.2/km2). There were 1,223 housing units at an average density of 476.3 per square mile (184.2/km2). The racial makeup of the city was 91.2% White, 0.3% African American, 1.2% Native American, 0.7% Asian, 0.1% Pacific Islander, 4.2% from other races, and 2.3% from two or more races. Hispanic or Latino of any race were 8.2% of the population.
There were 1,093 households, out of which 28.2% had children under the age of 18 living with them, 48.2% were married couples living together, 11.2% had a female householder with no husband present, and 35.2% were non-families. 29.7% of all households were made up of individuals, and 14.2% had someone living alone who was 65 years of age or older. The average household size was 2.45 and the average family size was 3.02.
In the city, the population was spread out, with 25.7% under the age of 18, 8.2% from 18 to 24, 24.2% from 25 to 44, 24.2% from 45 to 64, and 17.7% who were 65 years of age or older. The median age was 39 years. For every 100 females, there were 95.2 males. For every 100 females age 18 and over, there were 92.2 males.
The median income for a household in the city was $30,938, and the median income for a family was $37,917. Males had a median income of $30,000 versus $20,000 for females. The per capita income for the city was $15,945. About 11.2% of families and 14.2% of the population were below the poverty line, including 19.2% of those under age 18 and 8.2% of those age 65 or over.
Common Questions
What is Per Capita Income in Hines?
Per Capita income in Hines is $25,392.
What is the Median Family Income in Hines?
Median Family Income in Hines is $73,199.
What is the Median Household income in Hines?
Median Household Income in Hines is $47,321.
What is Income or Wage Gap in Hines?
Income or Wage Gap in Hines is 2.2%.
Women in Hines earn 97.8 cents for every dollar earned by a man.
What is Inequality or Gini Index in Hines?
Inequality or Gini Index in Hines is 0.42.
What is the Total Population of Hines?
Total Population of Hines is 1,608.
What is the Total Male Population of Hines?
Total Male Population of Hines is 779.
What is the Total Female Population of Hines?
Total Female Population of Hines is 829.
What is the Ratio of Males per 100 Females in Hines?
There are 93.97 Males per 100 Females in Hines.
What is the Ratio of Females per 100 Males in Hines?
There are 106.42 Females per 100 Males in Hines.
What is the Median Population Age in Hines?
Median Population Age in Hines is 40.2 Years.
What is the Average Family Size in Hines
Average Family Size in Hines is 3.1 People.
What is the Average Household Size in Hines
Average Household Size in Hines is 2.4 People.
How Large is the Labor Force in Hines?
There are 684 People in the Labor Forcein in Hines.
What is the Percentage of People in the Labor Force in Hines?
54.7% of People are in the Labor Force in Hines.
What is the Unemployment Rate in Hines?
Unemployment Rate in Hines is 6.7%.