Harrisburg, OR Map & Demographics
Harrisburg Map
Harrisburg Overview
$24,343
PER CAPITA INCOME
$59,792
AVG FAMILY INCOME
$51,708
AVG HOUSEHOLD INCOME
42.3%
WAGE / INCOME GAP [ % ]
57.7¢/ $1
WAGE / INCOME GAP [ $ ]
0.38
INEQUALITY / GINI INDEX
3,663
TOTAL POPULATION
1,870
MALE POPULATION
1,793
FEMALE POPULATION
104.29
MALES / 100 FEMALES
95.88
FEMALES / 100 MALES
33.5
MEDIAN AGE
3.3
AVG FAMILY SIZE
2.9
AVG HOUSEHOLD SIZE
1,643
LABOR FORCE [ PEOPLE ]
63.3%
PERCENT IN LABOR FORCE
5.5%
UNEMPLOYMENT RATE
Harrisburg Zip Codes
Harrisburg Area Codes
Income in Harrisburg
Income Overview in Harrisburg
Per Capita Income in Harrisburg is $24,343, while median incomes of families and households are $59,792 and $51,708 respectively.
| Characteristic | Number | Measure |
| Per Capita Income | 3,663 | $24,343 |
| Median Family Income | 938 | $59,792 |
| Mean Family Income | 938 | $77,285 |
| Median Household Income | 1,271 | $51,708 |
| Mean Household Income | 1,271 | $69,009 |
| Income Deficit | 938 | $0 |
| Wage / Income Gap (%) | 3,663 | 42.34% |
| Wage / Income Gap ($) | 3,663 | 57.66¢ per $1 |
| Gini / Inequality Index | 3,663 | 0.38 |
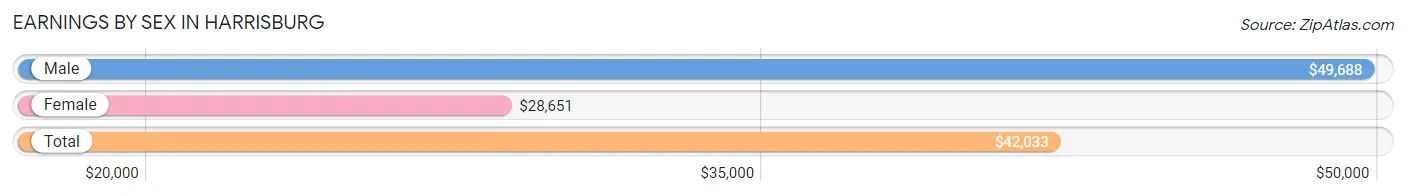
Earnings by Sex in Harrisburg
Average Earnings in Harrisburg are $42,033, $49,688 for men and $28,651 for women, a difference of 42.3%.
| Sex | Number | Average Earnings |
| Male | 1,006 (59.2%) | $49,688 |
| Female | 694 (40.8%) | $28,651 |
| Total | 1,700 (100.0%) | $42,033 |
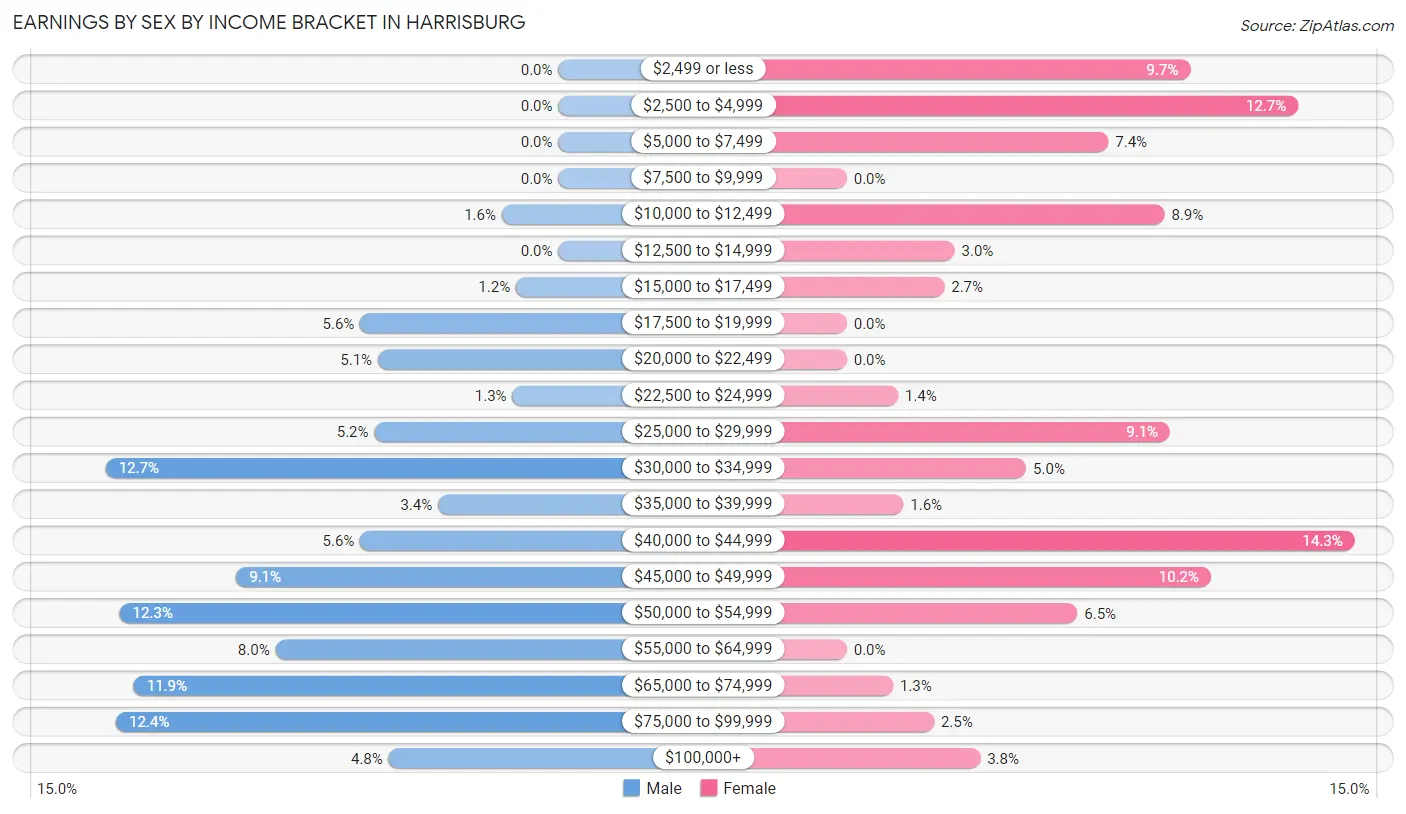
Earnings by Sex by Income Bracket in Harrisburg
The most common earnings brackets in Harrisburg are $30,000 to $34,999 for men (128 | 12.7%) and $40,000 to $44,999 for women (99 | 14.3%).
| Income | Male | Female |
| $2,499 or less | 0 (0.0%) | 67 (9.7%) |
| $2,500 to $4,999 | 0 (0.0%) | 88 (12.7%) |
| $5,000 to $7,499 | 0 (0.0%) | 51 (7.3%) |
| $7,500 to $9,999 | 0 (0.0%) | 0 (0.0%) |
| $10,000 to $12,499 | 16 (1.6%) | 62 (8.9%) |
| $12,500 to $14,999 | 0 (0.0%) | 21 (3.0%) |
| $15,000 to $17,499 | 12 (1.2%) | 19 (2.7%) |
| $17,500 to $19,999 | 56 (5.6%) | 0 (0.0%) |
| $20,000 to $22,499 | 51 (5.1%) | 0 (0.0%) |
| $22,500 to $24,999 | 13 (1.3%) | 10 (1.4%) |
| $25,000 to $29,999 | 52 (5.2%) | 63 (9.1%) |
| $30,000 to $34,999 | 128 (12.7%) | 35 (5.0%) |
| $35,000 to $39,999 | 34 (3.4%) | 11 (1.6%) |
| $40,000 to $44,999 | 56 (5.6%) | 99 (14.3%) |
| $45,000 to $49,999 | 91 (9.0%) | 71 (10.2%) |
| $50,000 to $54,999 | 124 (12.3%) | 45 (6.5%) |
| $55,000 to $64,999 | 80 (8.0%) | 0 (0.0%) |
| $65,000 to $74,999 | 120 (11.9%) | 9 (1.3%) |
| $75,000 to $99,999 | 125 (12.4%) | 17 (2.5%) |
| $100,000+ | 48 (4.8%) | 26 (3.7%) |
| Total | 1,006 (100.0%) | 694 (100.0%) |
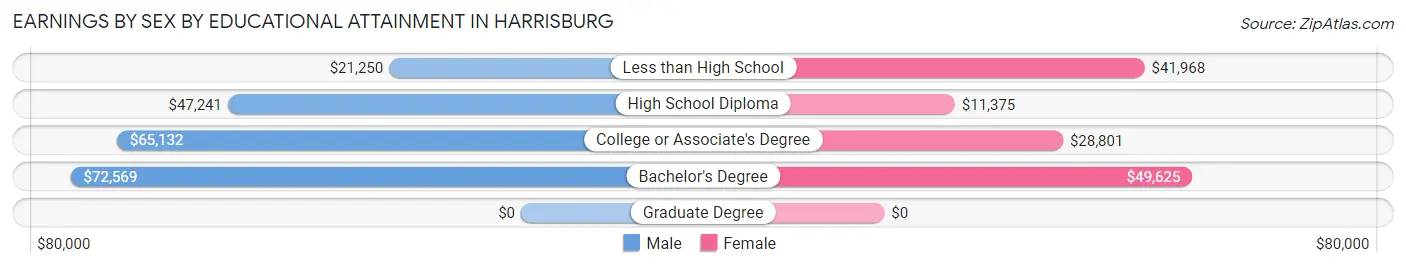
Earnings by Sex by Educational Attainment in Harrisburg
Average earnings in Harrisburg are $51,134 for men and $29,107 for women, a difference of 43.1%. Men with an educational attainment of bachelor's degree enjoy the highest average annual earnings of $72,569, while those with less than high school education earn the least with $21,250. Women with an educational attainment of bachelor's degree earn the most with the average annual earnings of $49,625, while those with high school diploma education have the smallest earnings of $11,375.
| Educational Attainment | Male Income | Female Income |
| Less than High School | $21,250 | $41,968 |
| High School Diploma | $47,241 | $11,375 |
| College or Associate's Degree | $65,132 | $28,801 |
| Bachelor's Degree | $72,569 | $49,625 |
| Graduate Degree | - | - |
| Total | $51,134 | $29,107 |
Family Income in Harrisburg
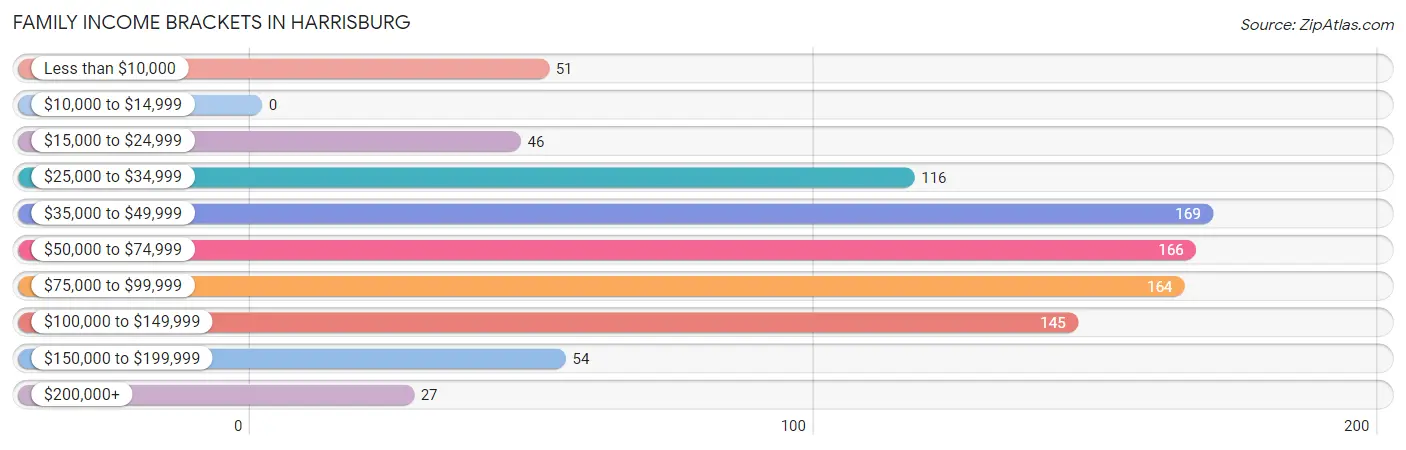
Family Income Brackets in Harrisburg
According to the Harrisburg family income data, there are 169 families falling into the $35,000 to $49,999 income range, which is the most common income bracket and makes up 18.0% of all families.
| Income Bracket | # Families | % Families |
| Less than $10,000 | 51 | 5.4% |
| $10,000 to $14,999 | 0 | 0.0% |
| $15,000 to $24,999 | 46 | 4.9% |
| $25,000 to $34,999 | 116 | 12.4% |
| $35,000 to $49,999 | 169 | 18.0% |
| $50,000 to $74,999 | 166 | 17.7% |
| $75,000 to $99,999 | 164 | 17.5% |
| $100,000 to $149,999 | 145 | 15.5% |
| $150,000 to $199,999 | 54 | 5.8% |
| $200,000+ | 27 | 2.9% |
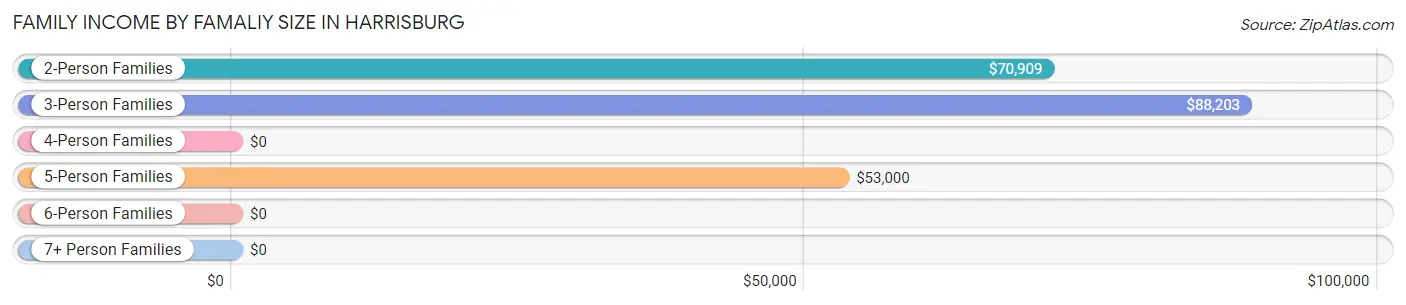
Family Income by Famaliy Size in Harrisburg
3-person families (387 | 41.3%) account for the highest median family income in Harrisburg with $88,203 per family, while 2-person families (322 | 34.3%) have the highest median income of $35,454 per family member.
| Income Bracket | # Families | Median Income |
| 2-Person Families | 322 (34.3%) | $70,909 |
| 3-Person Families | 387 (41.3%) | $88,203 |
| 4-Person Families | 19 (2.0%) | $0 |
| 5-Person Families | 126 (13.4%) | $53,000 |
| 6-Person Families | 58 (6.2%) | $0 |
| 7+ Person Families | 26 (2.8%) | $0 |
| Total | 938 (100.0%) | $59,792 |
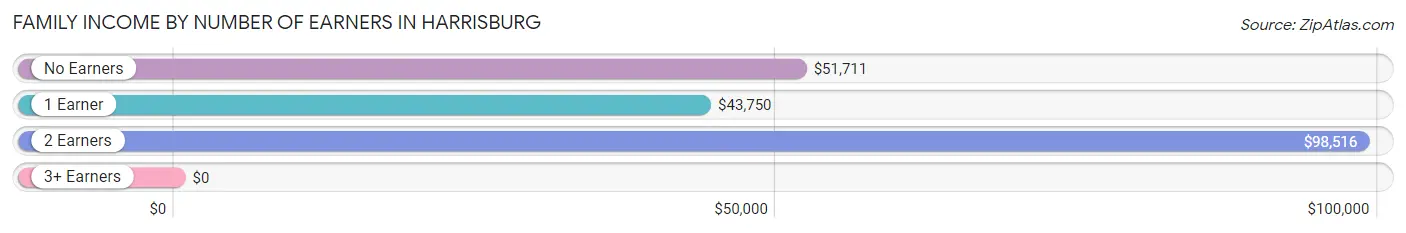
Family Income by Number of Earners in Harrisburg
| Number of Earners | # Families | Median Income |
| No Earners | 54 (5.8%) | $51,711 |
| 1 Earner | 494 (52.7%) | $43,750 |
| 2 Earners | 351 (37.4%) | $98,516 |
| 3+ Earners | 39 (4.2%) | $0 |
| Total | 938 (100.0%) | $59,792 |
Household Income in Harrisburg
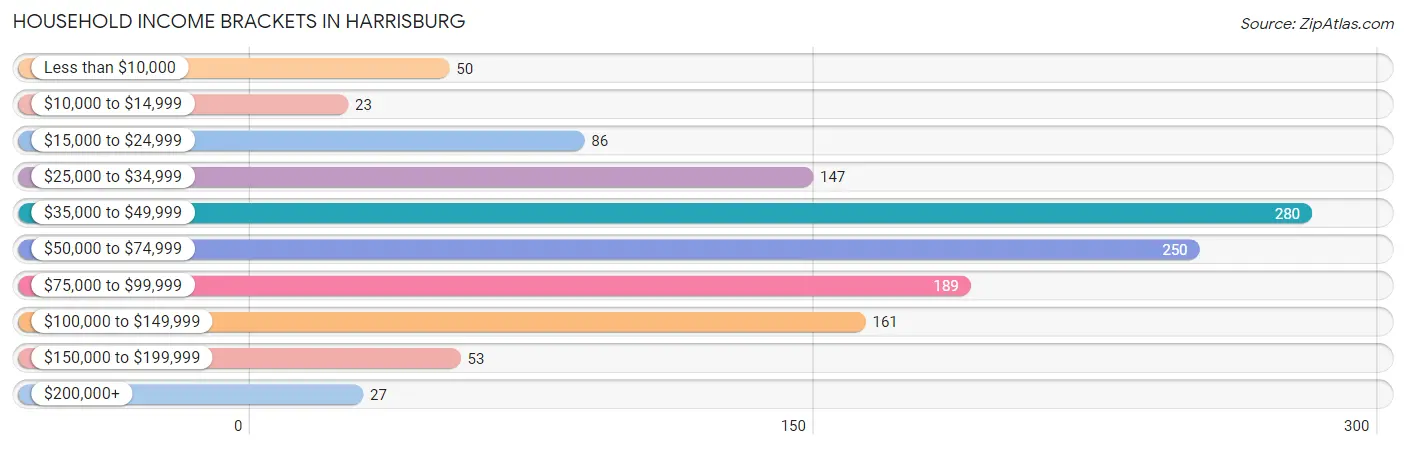
Household Income Brackets in Harrisburg
With 280 households falling in the category, the $35,000 to $49,999 income range is the most frequent in Harrisburg, accounting for 22.0% of all households. In contrast, only 23 households (1.8%) fall into the $10,000 to $14,999 income bracket, making it the least populous group.
| Income Bracket | # Households | % Households |
| Less than $10,000 | 50 | 3.9% |
| $10,000 to $14,999 | 23 | 1.8% |
| $15,000 to $24,999 | 86 | 6.8% |
| $25,000 to $34,999 | 147 | 11.6% |
| $35,000 to $49,999 | 280 | 22.0% |
| $50,000 to $74,999 | 250 | 19.7% |
| $75,000 to $99,999 | 189 | 14.9% |
| $100,000 to $149,999 | 161 | 12.7% |
| $150,000 to $199,999 | 53 | 4.2% |
| $200,000+ | 27 | 2.1% |
Household Income by Householder Age in Harrisburg
The median household income in Harrisburg is $51,708, with the highest median household income of $52,067 found in the 25 to 44 years age bracket for the primary householder. A total of 580 households (45.6%) fall into this category. Meanwhile, the 15 to 24 years age bracket for the primary householder has the lowest median household income of $0, with 28 households (2.2%) in this group.
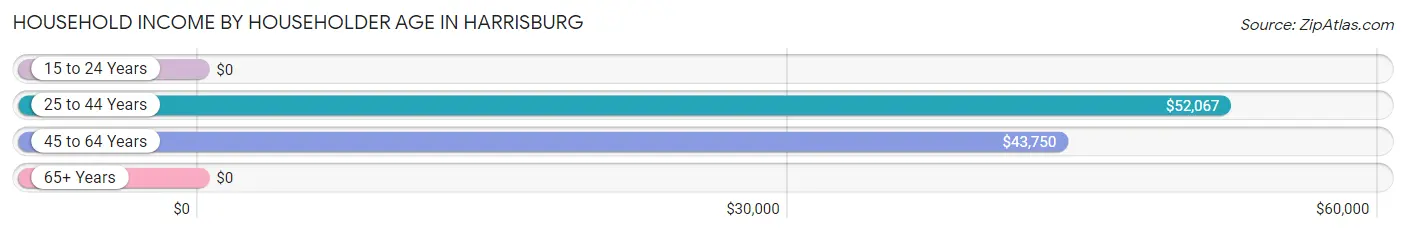
| Income Bracket | # Households | Median Income |
| 15 to 24 Years | 28 (2.2%) | $0 |
| 25 to 44 Years | 580 (45.6%) | $52,067 |
| 45 to 64 Years | 502 (39.5%) | $43,750 |
| 65+ Years | 161 (12.7%) | $0 |
| Total | 1,271 (100.0%) | $51,708 |
Poverty in Harrisburg
Income Below Poverty by Sex and Age in Harrisburg
With 13.9% poverty level for males and 12.8% for females among the residents of Harrisburg, under 5 year old males and 75 year old and over females are the most vulnerable to poverty, with 142 males (63.1%) and 57 females (56.4%) in their respective age groups living below the poverty level.
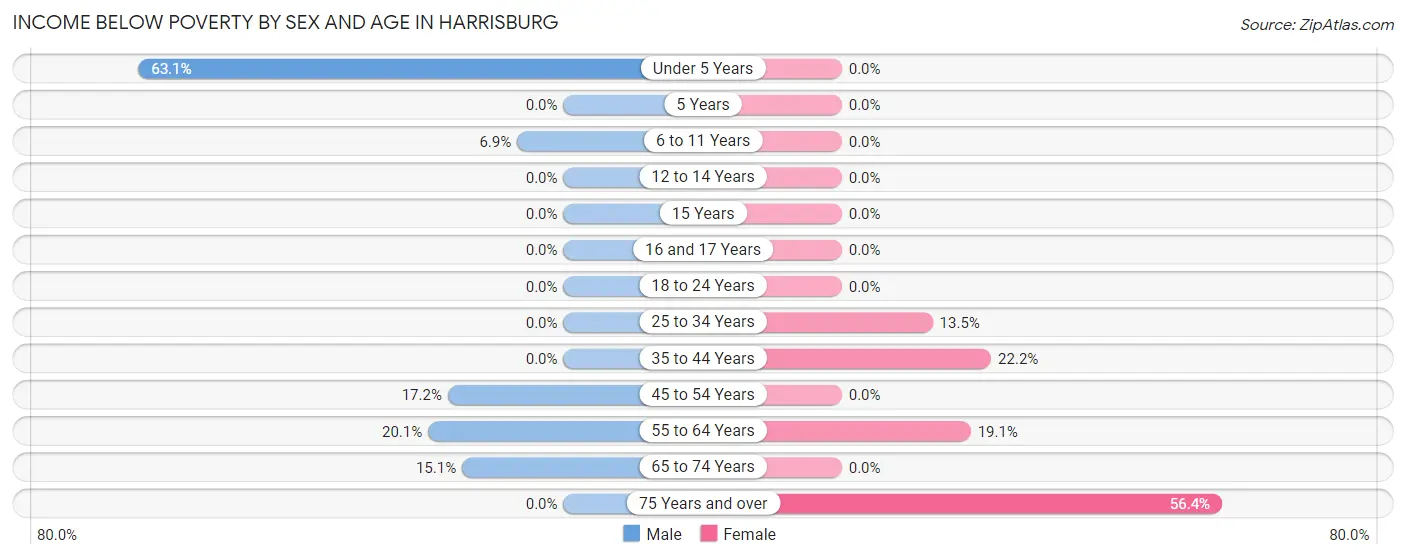
| Age Bracket | Male | Female |
| Under 5 Years | 142 (63.1%) | 0 (0.0%) |
| 5 Years | 0 (0.0%) | 0 (0.0%) |
| 6 to 11 Years | 22 (6.9%) | 0 (0.0%) |
| 12 to 14 Years | 0 (0.0%) | 0 (0.0%) |
| 15 Years | 0 (0.0%) | 0 (0.0%) |
| 16 and 17 Years | 0 (0.0%) | 0 (0.0%) |
| 18 to 24 Years | 0 (0.0%) | 0 (0.0%) |
| 25 to 34 Years | 0 (0.0%) | 51 (13.5%) |
| 35 to 44 Years | 0 (0.0%) | 63 (22.2%) |
| 45 to 54 Years | 34 (17.2%) | 0 (0.0%) |
| 55 to 64 Years | 47 (20.1%) | 58 (19.1%) |
| 65 to 74 Years | 14 (15.0%) | 0 (0.0%) |
| 75 Years and over | 0 (0.0%) | 57 (56.4%) |
| Total | 259 (13.9%) | 229 (12.8%) |
Income Above Poverty by Sex and Age in Harrisburg
According to the poverty statistics in Harrisburg, males aged 5 years and females aged under 5 years are the age groups that are most secure financially, with 100.0% of males and 100.0% of females in these age groups living above the poverty line.
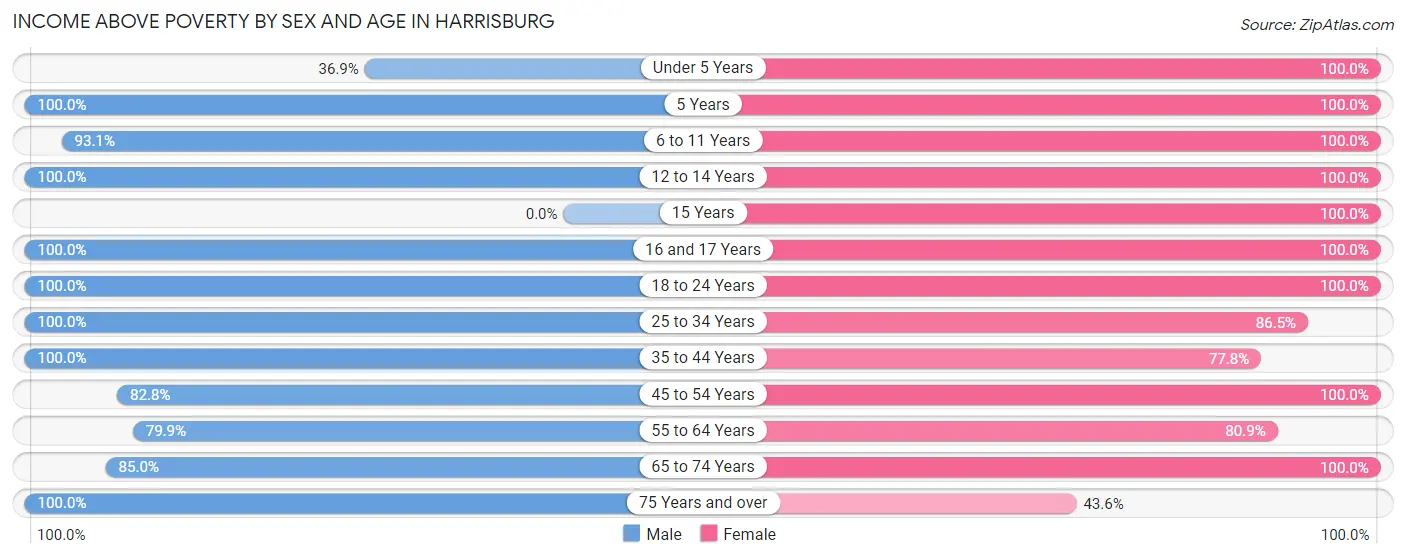
| Age Bracket | Male | Female |
| Under 5 Years | 83 (36.9%) | 138 (100.0%) |
| 5 Years | 10 (100.0%) | 39 (100.0%) |
| 6 to 11 Years | 298 (93.1%) | 246 (100.0%) |
| 12 to 14 Years | 10 (100.0%) | 37 (100.0%) |
| 15 Years | 0 (0.0%) | 43 (100.0%) |
| 16 and 17 Years | 52 (100.0%) | 23 (100.0%) |
| 18 to 24 Years | 45 (100.0%) | 77 (100.0%) |
| 25 to 34 Years | 336 (100.0%) | 327 (86.5%) |
| 35 to 44 Years | 341 (100.0%) | 221 (77.8%) |
| 45 to 54 Years | 164 (82.8%) | 54 (100.0%) |
| 55 to 64 Years | 187 (79.9%) | 245 (80.9%) |
| 65 to 74 Years | 79 (85.0%) | 70 (100.0%) |
| 75 Years and over | 6 (100.0%) | 44 (43.6%) |
| Total | 1,611 (86.2%) | 1,564 (87.2%) |
Income Below Poverty Among Married-Couple Families in Harrisburg
The poverty statistics for married-couple families in Harrisburg show that 8.7% or 59 of the total 679 families live below the poverty line. Families with no children have the highest poverty rate of 12.1%, comprising of 35 families. On the other hand, families with 3 or 4 children have the lowest poverty rate of 0.0%, which includes 0 families.
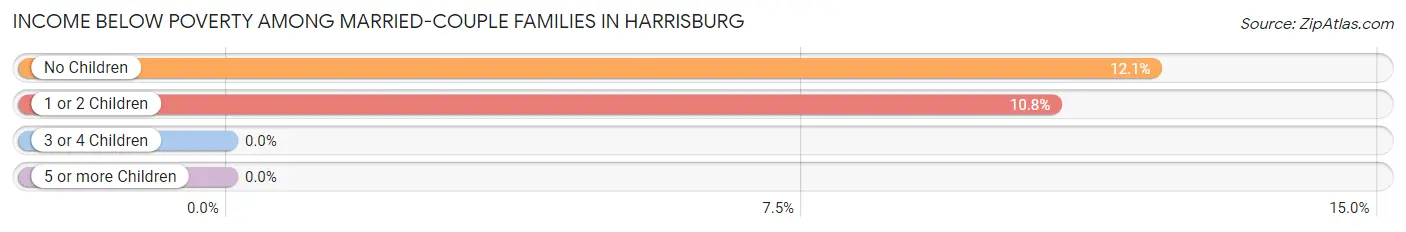
| Children | Above Poverty | Below Poverty |
| No Children | 255 (87.9%) | 35 (12.1%) |
| 1 or 2 Children | 199 (89.2%) | 24 (10.8%) |
| 3 or 4 Children | 151 (100.0%) | 0 (0.0%) |
| 5 or more Children | 15 (100.0%) | 0 (0.0%) |
| Total | 620 (91.3%) | 59 (8.7%) |
Income Below Poverty Among Single-Parent Households in Harrisburg
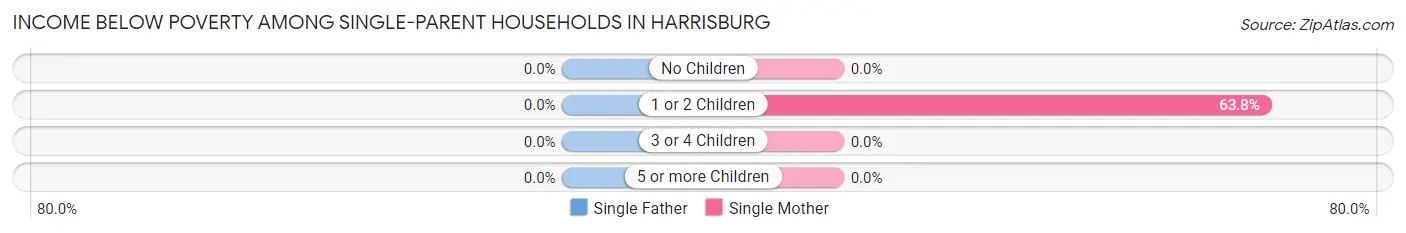
| Children | Single Father | Single Mother |
| No Children | 0 (0.0%) | 0 (0.0%) |
| 1 or 2 Children | 0 (0.0%) | 51 (63.7%) |
| 3 or 4 Children | 0 (0.0%) | 0 (0.0%) |
| 5 or more Children | 0 (0.0%) | 0 (0.0%) |
| Total | 0 (0.0%) | 51 (35.2%) |
Income Below Poverty Among Married-Couple vs Single-Parent Households in Harrisburg
The poverty data for Harrisburg shows that 59 of the married-couple family households (8.7%) and 51 of the single-parent households (19.7%) are living below the poverty level. Within the married-couple family households, those with no children have the highest poverty rate, with 35 households (12.1%) falling below the poverty line. Among the single-parent households, those with 1 or 2 children have the highest poverty rate, with 51 household (34.7%) living below poverty.
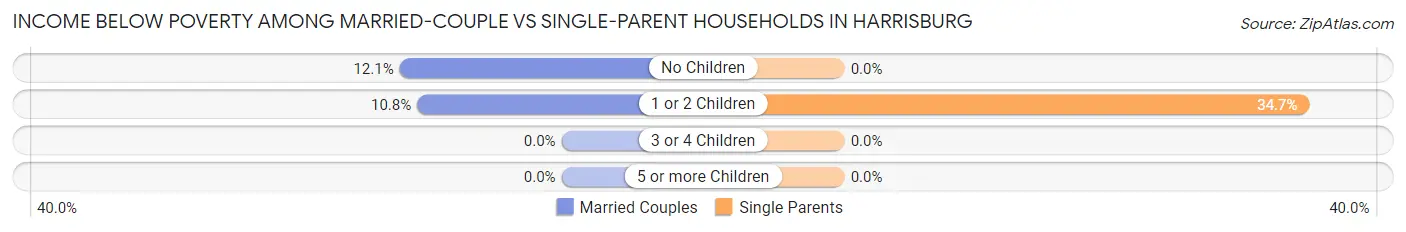
| Children | Married-Couple Families | Single-Parent Households |
| No Children | 35 (12.1%) | 0 (0.0%) |
| 1 or 2 Children | 24 (10.8%) | 51 (34.7%) |
| 3 or 4 Children | 0 (0.0%) | 0 (0.0%) |
| 5 or more Children | 0 (0.0%) | 0 (0.0%) |
| Total | 59 (8.7%) | 51 (19.7%) |
Race in Harrisburg
The most populous races in Harrisburg are White / Caucasian (3,161 | 86.3%), Two or more Races (405 | 11.1%), and Hispanic or Latino (284 | 7.7%).
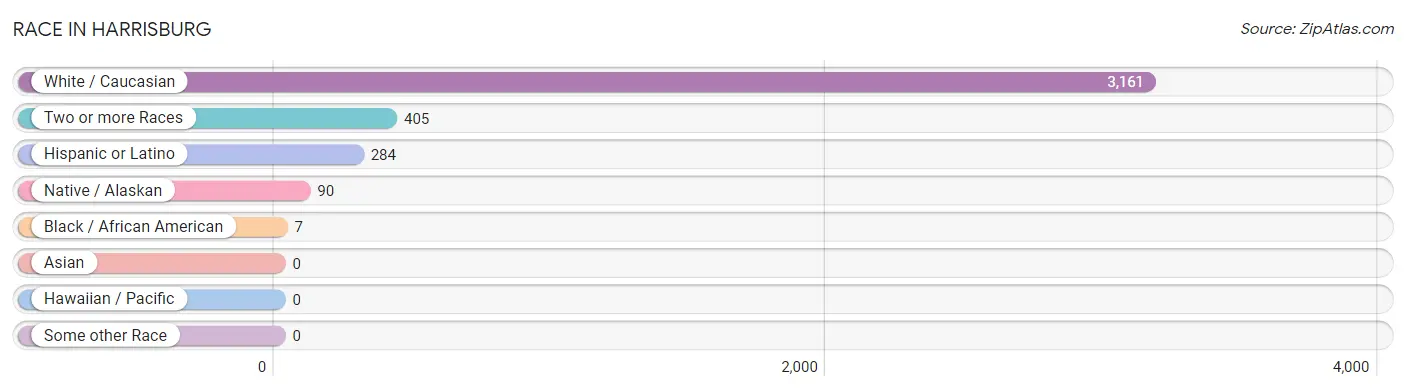
| Race | # Population | % Population |
| Asian | 0 | 0.0% |
| Black / African American | 7 | 0.2% |
| Hawaiian / Pacific | 0 | 0.0% |
| Hispanic or Latino | 284 | 7.7% |
| Native / Alaskan | 90 | 2.5% |
| White / Caucasian | 3,161 | 86.3% |
| Two or more Races | 405 | 11.1% |
| Some other Race | 0 | 0.0% |
| Total | 3,663 | 100.0% |
Ancestry in Harrisburg
The most populous ancestries reported in Harrisburg are German (782 | 21.3%), English (493 | 13.5%), Irish (408 | 11.1%), Blackfeet (232 | 6.3%), and Mexican (232 | 6.3%), together accounting for 58.6% of all Harrisburg residents.
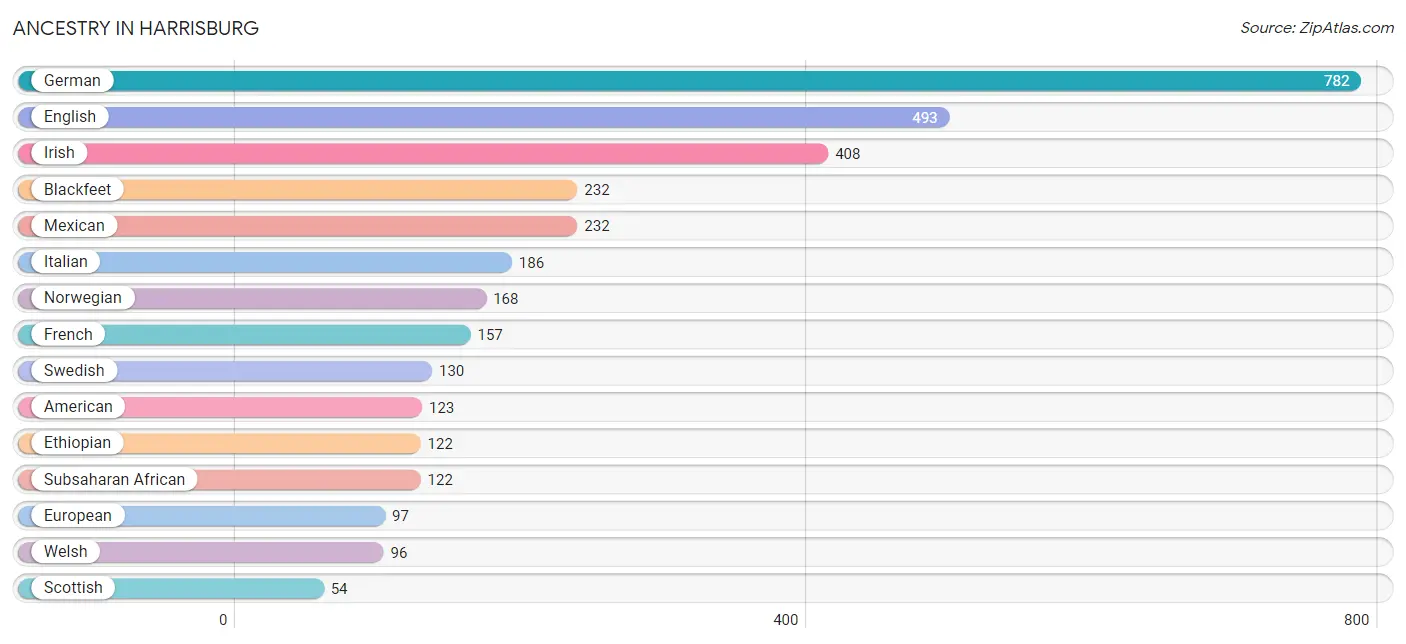
| Ancestry | # Population | % Population |
| American | 123 | 3.4% |
| Australian | 7 | 0.2% |
| Bhutanese | 28 | 0.8% |
| Blackfeet | 232 | 6.3% |
| Central American | 40 | 1.1% |
| Costa Rican | 40 | 1.1% |
| Czech | 37 | 1.0% |
| Czechoslovakian | 15 | 0.4% |
| Dutch | 16 | 0.4% |
| English | 493 | 13.5% |
| Ethiopian | 122 | 3.3% |
| European | 97 | 2.6% |
| French | 157 | 4.3% |
| French Canadian | 19 | 0.5% |
| German | 782 | 21.3% |
| Greek | 26 | 0.7% |
| Indian (Asian) | 44 | 1.2% |
| Irish | 408 | 11.1% |
| Italian | 186 | 5.1% |
| Korean | 44 | 1.2% |
| Mexican | 232 | 6.3% |
| Norwegian | 168 | 4.6% |
| Portuguese | 29 | 0.8% |
| Scottish | 54 | 1.5% |
| Subsaharan African | 122 | 3.3% |
| Swedish | 130 | 3.5% |
| Welsh | 96 | 2.6% | View All 27 Rows |
Immigrants in Harrisburg
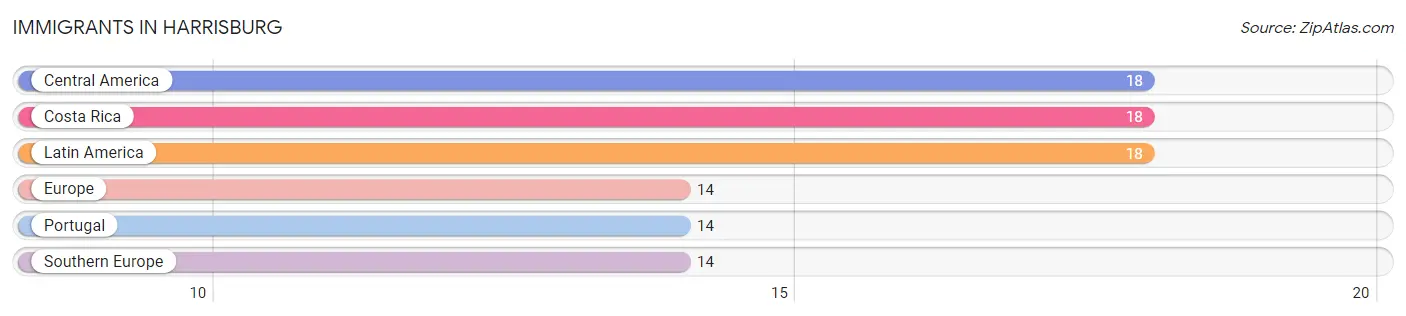
The most numerous immigrant groups reported in Harrisburg came from Central America (18 | 0.5%), Costa Rica (18 | 0.5%), Latin America (18 | 0.5%), Europe (14 | 0.4%), and Portugal (14 | 0.4%), together accounting for 2.2% of all Harrisburg residents.
| Immigration Origin | # Population | % Population |
| Central America | 18 | 0.5% |
| Costa Rica | 18 | 0.5% |
| Europe | 14 | 0.4% |
| Latin America | 18 | 0.5% |
| Portugal | 14 | 0.4% |
| Southern Europe | 14 | 0.4% | View All 6 Rows |
Sex and Age in Harrisburg
Sex and Age in Harrisburg
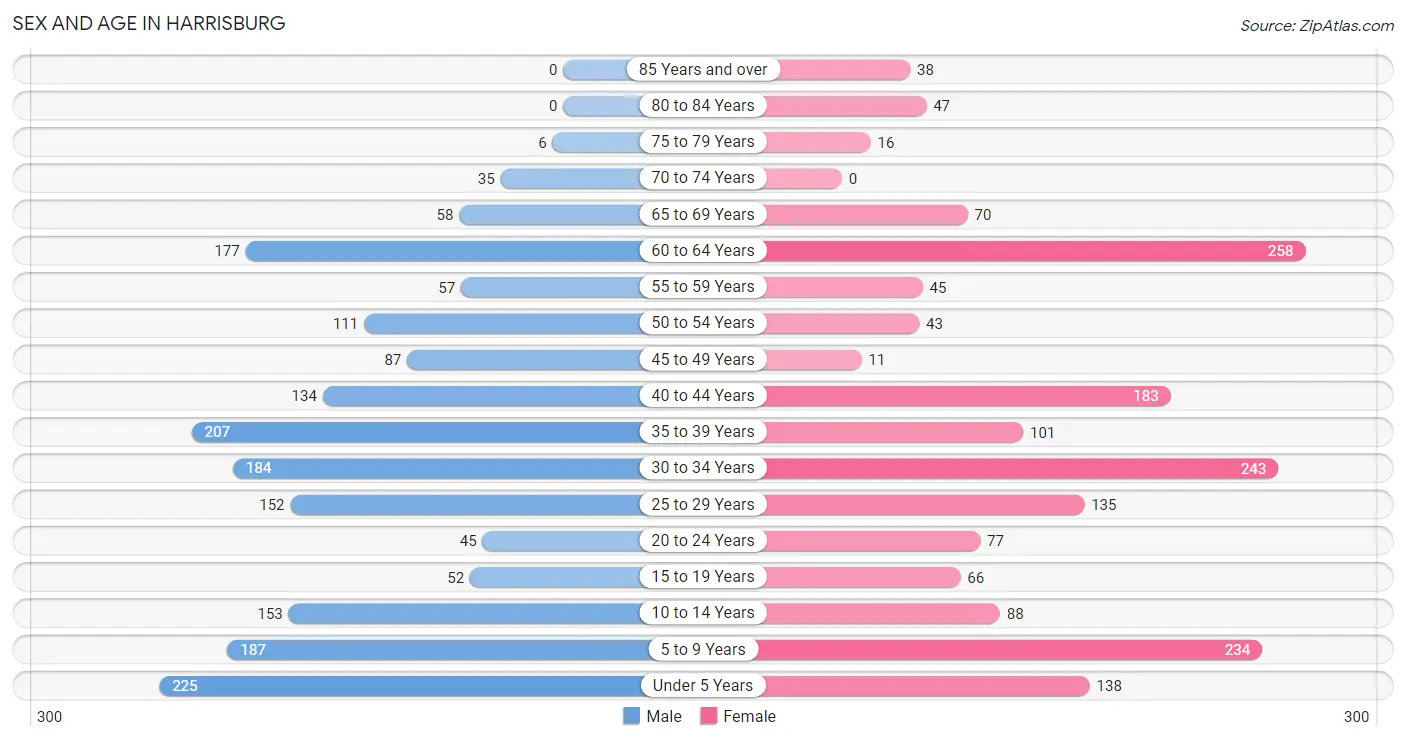
The most populous age groups in Harrisburg are Under 5 Years (225 | 12.0%) for men and 60 to 64 Years (258 | 14.4%) for women.
| Age Bracket | Male | Female |
| Under 5 Years | 225 (12.0%) | 138 (7.7%) |
| 5 to 9 Years | 187 (10.0%) | 234 (13.1%) |
| 10 to 14 Years | 153 (8.2%) | 88 (4.9%) |
| 15 to 19 Years | 52 (2.8%) | 66 (3.7%) |
| 20 to 24 Years | 45 (2.4%) | 77 (4.3%) |
| 25 to 29 Years | 152 (8.1%) | 135 (7.5%) |
| 30 to 34 Years | 184 (9.8%) | 243 (13.6%) |
| 35 to 39 Years | 207 (11.1%) | 101 (5.6%) |
| 40 to 44 Years | 134 (7.2%) | 183 (10.2%) |
| 45 to 49 Years | 87 (4.6%) | 11 (0.6%) |
| 50 to 54 Years | 111 (5.9%) | 43 (2.4%) |
| 55 to 59 Years | 57 (3.0%) | 45 (2.5%) |
| 60 to 64 Years | 177 (9.5%) | 258 (14.4%) |
| 65 to 69 Years | 58 (3.1%) | 70 (3.9%) |
| 70 to 74 Years | 35 (1.9%) | 0 (0.0%) |
| 75 to 79 Years | 6 (0.3%) | 16 (0.9%) |
| 80 to 84 Years | 0 (0.0%) | 47 (2.6%) |
| 85 Years and over | 0 (0.0%) | 38 (2.1%) |
| Total | 1,870 (100.0%) | 1,793 (100.0%) |
Families and Households in Harrisburg
Median Family Size in Harrisburg
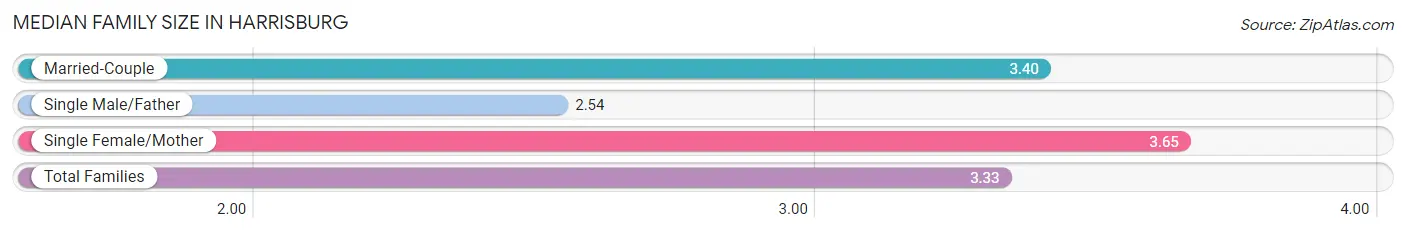
The median family size in Harrisburg is 3.33 persons per family, with single female/mother families (145 | 15.5%) accounting for the largest median family size of 3.65 persons per family. On the other hand, single male/father families (114 | 12.1%) represent the smallest median family size with 2.54 persons per family.
| Family Type | # Families | Family Size |
| Married-Couple | 679 (72.4%) | 3.40 |
| Single Male/Father | 114 (12.1%) | 2.54 |
| Single Female/Mother | 145 (15.5%) | 3.65 |
| Total Families | 938 (100.0%) | 3.33 |
Median Household Size in Harrisburg
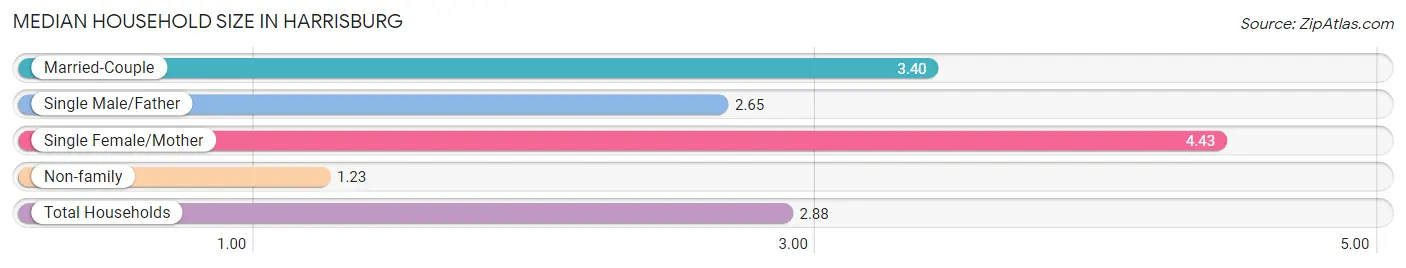
The median household size in Harrisburg is 2.88 persons per household, with single female/mother households (145 | 11.4%) accounting for the largest median household size of 4.43 persons per household. non-family households (333 | 26.2%) represent the smallest median household size with 1.23 persons per household.
| Household Type | # Households | Household Size |
| Married-Couple | 679 (53.4%) | 3.40 |
| Single Male/Father | 114 (9.0%) | 2.65 |
| Single Female/Mother | 145 (11.4%) | 4.43 |
| Non-family | 333 (26.2%) | 1.23 |
| Total Households | 1,271 (100.0%) | 2.88 |
Household Size by Marriage Status in Harrisburg
Out of a total of 1,271 households in Harrisburg, 938 (73.8%) are family households, while 333 (26.2%) are nonfamily households. The most numerous type of family households are 3-person households, comprising 347, and the most common type of nonfamily households are 1-person households, comprising 253.
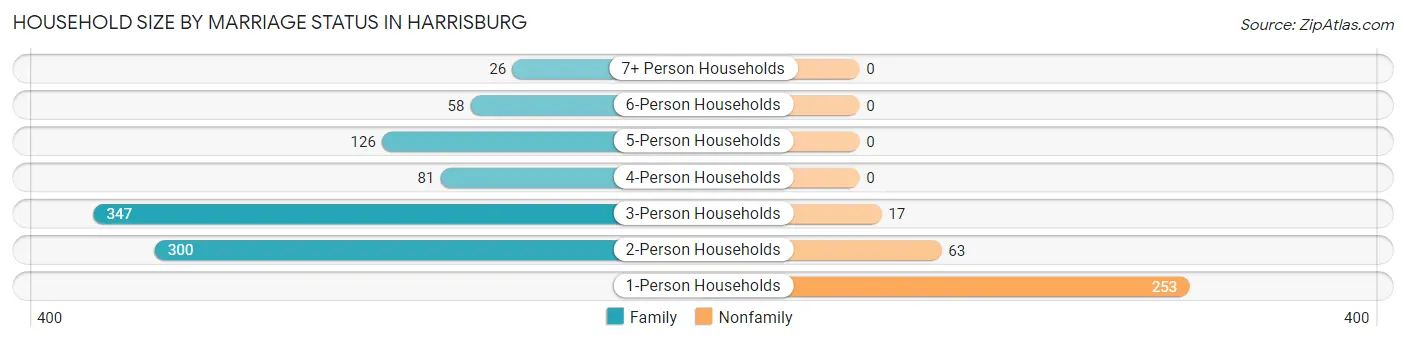
| Household Size | Family Households | Nonfamily Households |
| 1-Person Households | - | 253 (19.9%) |
| 2-Person Households | 300 (23.6%) | 63 (5.0%) |
| 3-Person Households | 347 (27.3%) | 17 (1.3%) |
| 4-Person Households | 81 (6.4%) | 0 (0.0%) |
| 5-Person Households | 126 (9.9%) | 0 (0.0%) |
| 6-Person Households | 58 (4.6%) | 0 (0.0%) |
| 7+ Person Households | 26 (2.1%) | 0 (0.0%) |
| Total | 938 (73.8%) | 333 (26.2%) |
Female Fertility in Harrisburg
Fertility by Age in Harrisburg
Average fertility rate in Harrisburg is 137.0 births per 1,000 women. Women in the age bracket of 35 to 50 years have the highest fertility rate with 157.0 births per 1,000 women. Women in the age bracket of 20 to 34 years acount for 57.5% of all women with births.
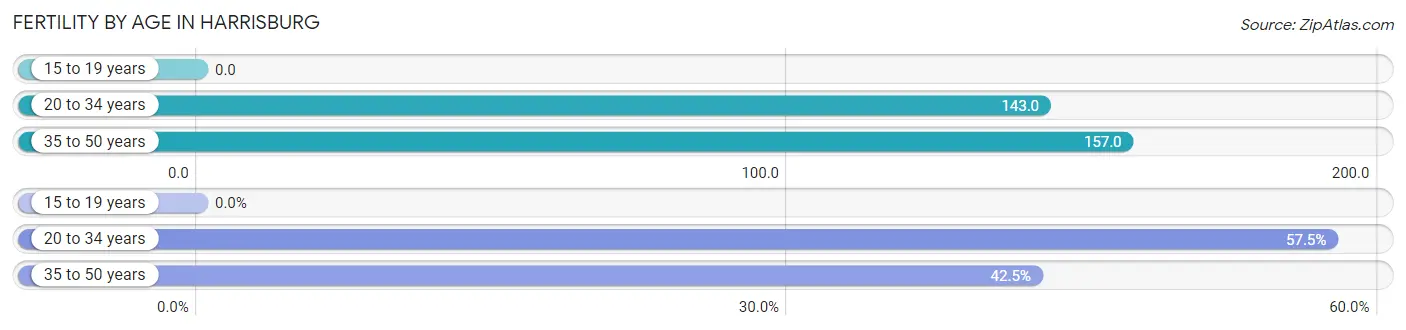
| Age Bracket | Women with Births | Births / 1,000 Women |
| 15 to 19 years | 0 (0.0%) | 0.0 |
| 20 to 34 years | 65 (57.5%) | 143.0 |
| 35 to 50 years | 48 (42.5%) | 157.0 |
| Total | 113 (100.0%) | 137.0 |
Fertility by Age by Marriage Status in Harrisburg
54.9% of women with births (113) in Harrisburg are married. The highest percentage of unmarried women with births falls into 20 to 34 years age bracket with 78.5% of them unmarried at the time of birth, while the lowest percentage of unmarried women with births belong to 35 to 50 years age bracket with 0.0% of them unmarried.
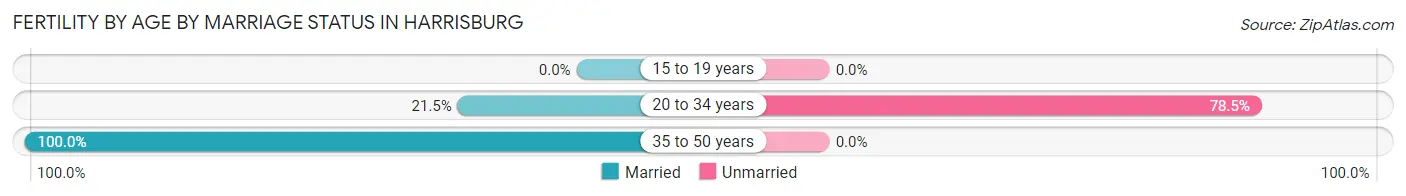
| Age Bracket | Married | Unmarried |
| 15 to 19 years | 0 (0.0%) | 0 (0.0%) |
| 20 to 34 years | 14 (21.5%) | 51 (78.5%) |
| 35 to 50 years | 48 (100.0%) | 0 (0.0%) |
| Total | 62 (54.9%) | 51 (45.1%) |
Fertility by Education in Harrisburg
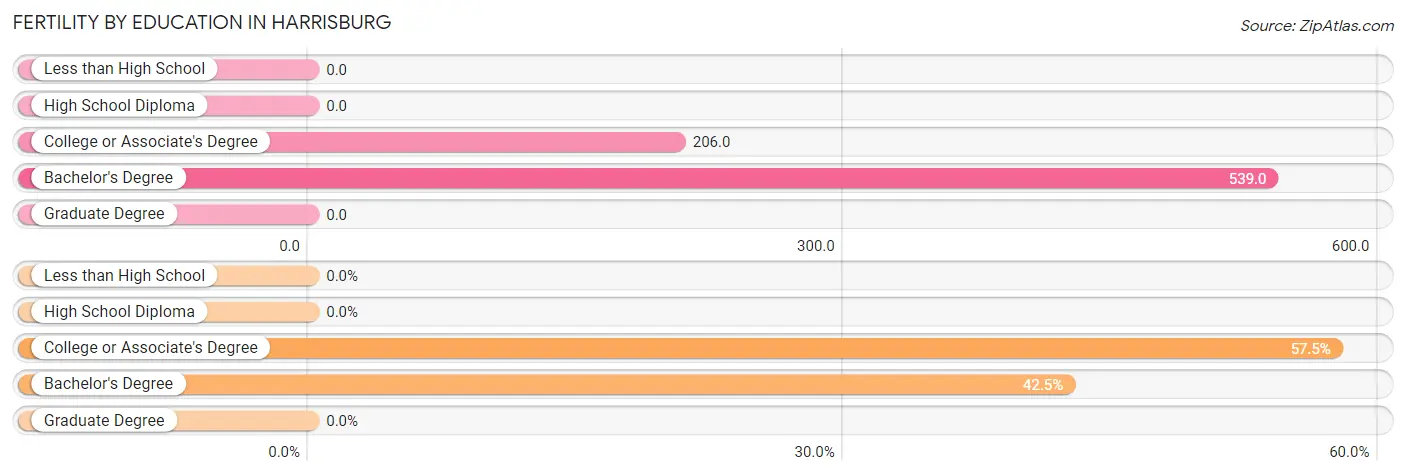
| Educational Attainment | Women with Births | Births / 1,000 Women |
| Less than High School | 0 (0.0%) | 0.0 |
| High School Diploma | 0 (0.0%) | 0.0 |
| College or Associate's Degree | 65 (57.5%) | 206.0 |
| Bachelor's Degree | 48 (42.5%) | 539.0 |
| Graduate Degree | 0 (0.0%) | 0.0 |
| Total | 113 (100.0%) | 137.0 |
Fertility by Education by Marriage Status in Harrisburg
45.1% of women with births in Harrisburg are unmarried. Women with the educational attainment of bachelor's degree are most likely to be married with 100.0% of them married at childbirth, while women with the educational attainment of college or associate's degree are least likely to be married with 78.5% of them unmarried at childbirth.
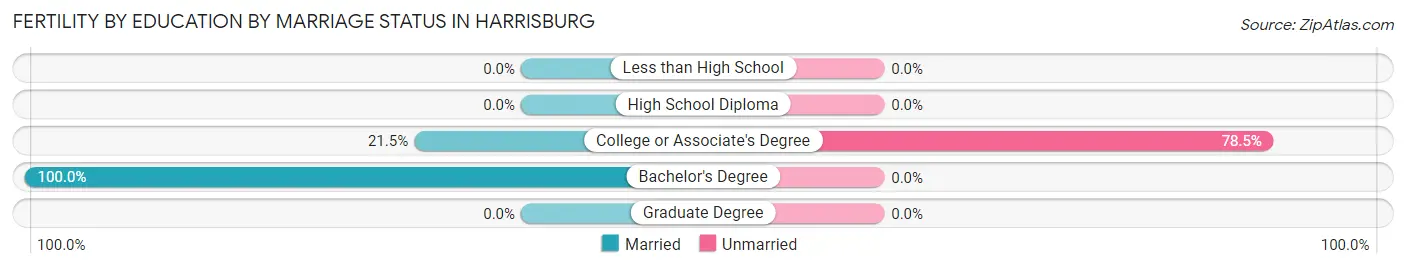
| Educational Attainment | Married | Unmarried |
| Less than High School | 0 (0.0%) | 0 (0.0%) |
| High School Diploma | 0 (0.0%) | 0 (0.0%) |
| College or Associate's Degree | 14 (21.5%) | 51 (78.5%) |
| Bachelor's Degree | 48 (100.0%) | 0 (0.0%) |
| Graduate Degree | 0 (0.0%) | 0 (0.0%) |
| Total | 62 (54.9%) | 51 (45.1%) |
Employment Characteristics in Harrisburg
Employment by Class of Employer in Harrisburg
Among the 1,495 employed individuals in Harrisburg, private company employees (1,082 | 72.4%), not-for-profit organizations (139 | 9.3%), and local government employees (109 | 7.3%) make up the most common classes of employment.
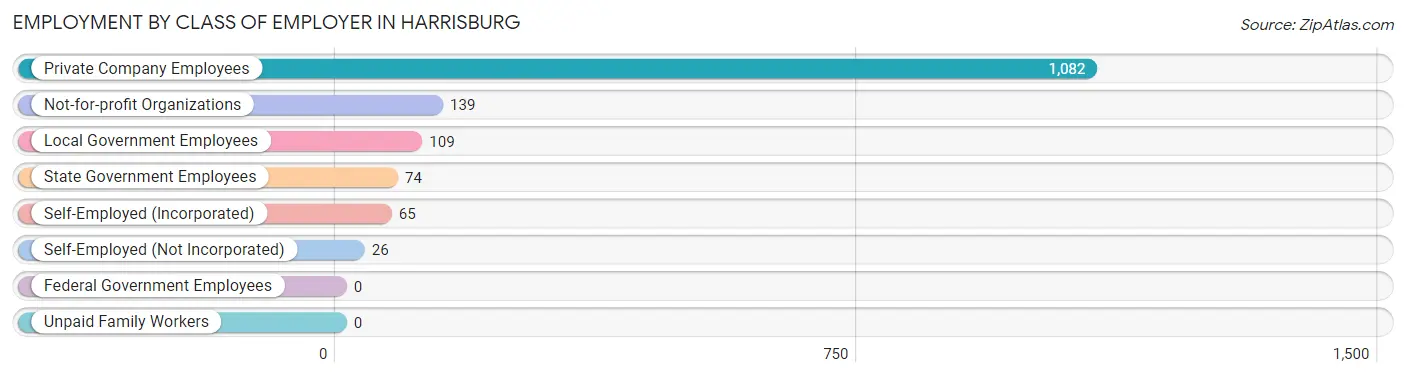
| Employer Class | # Employees | % Employees |
| Private Company Employees | 1,082 | 72.4% |
| Self-Employed (Incorporated) | 65 | 4.3% |
| Self-Employed (Not Incorporated) | 26 | 1.7% |
| Not-for-profit Organizations | 139 | 9.3% |
| Local Government Employees | 109 | 7.3% |
| State Government Employees | 74 | 5.0% |
| Federal Government Employees | 0 | 0.0% |
| Unpaid Family Workers | 0 | 0.0% |
| Total | 1,495 | 100.0% |
Employment Status by Age in Harrisburg
According to the labor force statistics for Harrisburg, out of the total population over 16 years of age (2,595), 63.3% or 1,643 individuals are in the labor force, with 5.5% or 90 of them unemployed. The age group with the highest labor force participation rate is 20 to 24 years, with 100.0% or 122 individuals in the labor force. Within the labor force, the 45 to 54 years age range has the highest percentage of unemployed individuals, with 13.5% or 34 of them being unemployed.
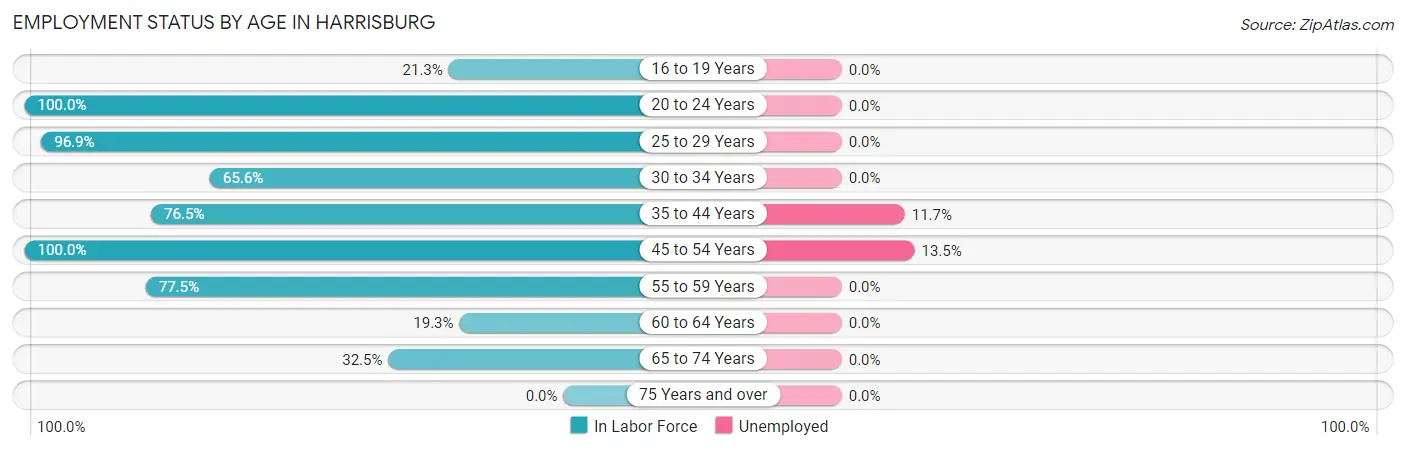
| Age Bracket | In Labor Force | Unemployed |
| 16 to 19 Years | 16 (21.3%) | 0 (0.0%) |
| 20 to 24 Years | 122 (100.0%) | 0 (0.0%) |
| 25 to 29 Years | 278 (96.9%) | 0 (0.0%) |
| 30 to 34 Years | 280 (65.6%) | 0 (0.0%) |
| 35 to 44 Years | 478 (76.5%) | 56 (11.7%) |
| 45 to 54 Years | 252 (100.0%) | 34 (13.5%) |
| 55 to 59 Years | 79 (77.5%) | 0 (0.0%) |
| 60 to 64 Years | 84 (19.3%) | 0 (0.0%) |
| 65 to 74 Years | 53 (32.5%) | 0 (0.0%) |
| 75 Years and over | 0 (0.0%) | 0 (0.0%) |
| Total | 1,643 (63.3%) | 90 (5.5%) |
Employment Status by Educational Attainment in Harrisburg
According to labor force statistics for Harrisburg, 68.2% of individuals (1,451) out of the total population between 25 and 64 years of age (2,128) are in the labor force, with 6.2% or 90 of them being unemployed. The group with the highest labor force participation rate are those with the educational attainment of college / associate degree, with 75.3% or 663 individuals in the labor force. Within the labor force, individuals with college / associate degree education have the highest percentage of unemployment, with 13.6% or 90 of them being unemployed.
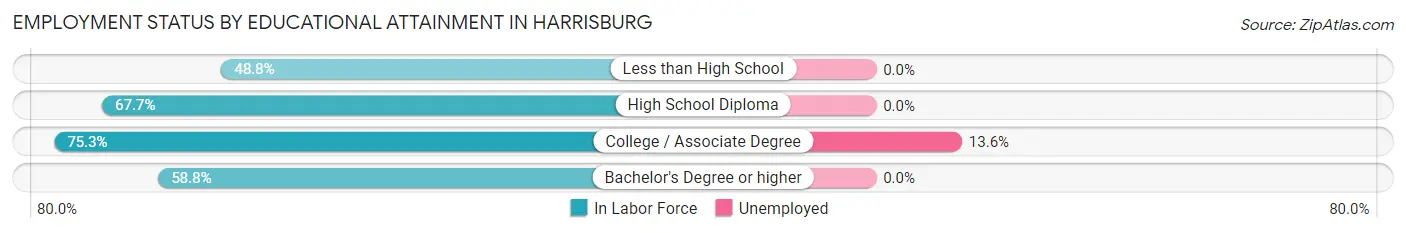
| Educational Attainment | In Labor Force | Unemployed |
| Less than High School | 98 (48.8%) | 0 (0.0%) |
| High School Diploma | 570 (67.7%) | 0 (0.0%) |
| College / Associate Degree | 663 (75.3%) | 120 (13.6%) |
| Bachelor's Degree or higher | 120 (58.8%) | 0 (0.0%) |
| Total | 1,451 (68.2%) | 132 (6.2%) |
Employment Occupations by Sex in Harrisburg
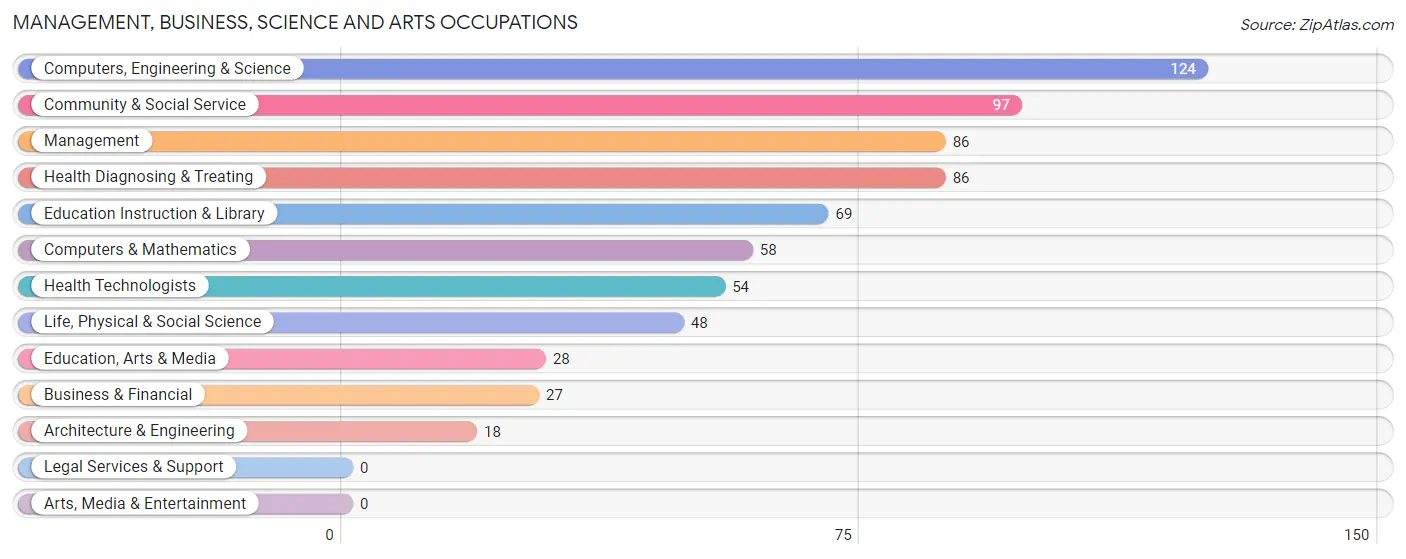
Management, Business, Science and Arts Occupations
The most common Management, Business, Science and Arts occupations in Harrisburg are Computers, Engineering & Science (124 | 8.0%), Community & Social Service (97 | 6.2%), Management (86 | 5.5%), Health Diagnosing & Treating (86 | 5.5%), and Education Instruction & Library (69 | 4.4%).
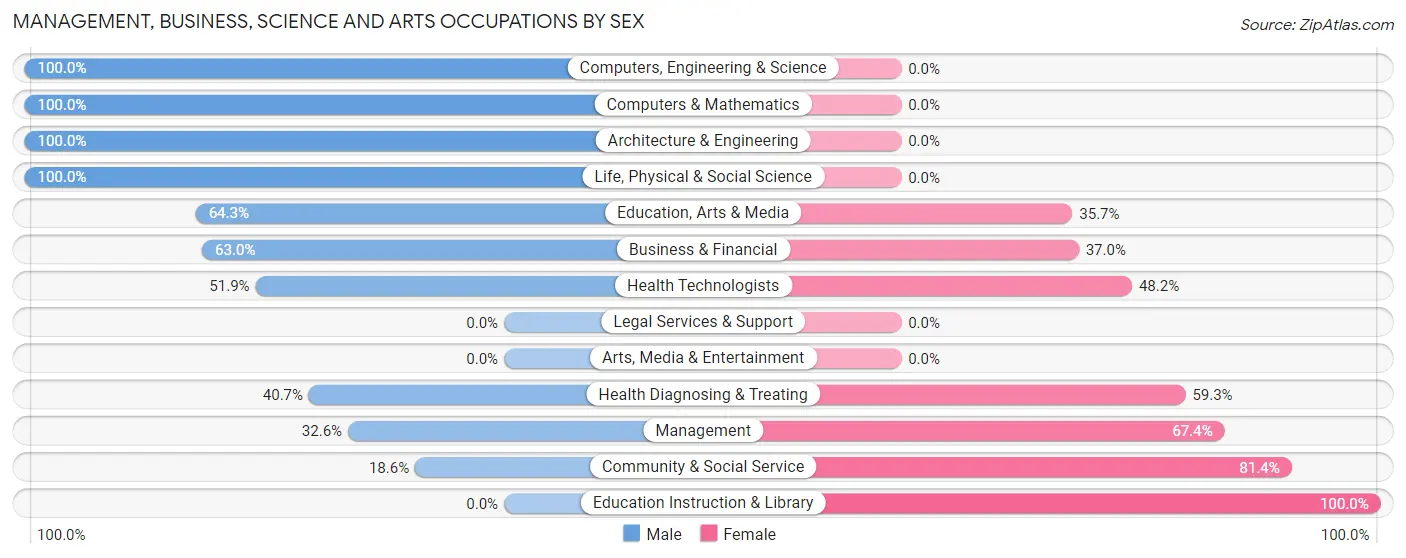
Management, Business, Science and Arts Occupations by Sex
Within the Management, Business, Science and Arts occupations in Harrisburg, the most male-oriented occupations are Computers, Engineering & Science (100.0%), Computers & Mathematics (100.0%), and Architecture & Engineering (100.0%), while the most female-oriented occupations are Education Instruction & Library (100.0%), Community & Social Service (81.4%), and Management (67.4%).
| Occupation | Male | Female |
| Management | 28 (32.6%) | 58 (67.4%) |
| Business & Financial | 17 (63.0%) | 10 (37.0%) |
| Computers, Engineering & Science | 124 (100.0%) | 0 (0.0%) |
| Computers & Mathematics | 58 (100.0%) | 0 (0.0%) |
| Architecture & Engineering | 18 (100.0%) | 0 (0.0%) |
| Life, Physical & Social Science | 48 (100.0%) | 0 (0.0%) |
| Community & Social Service | 18 (18.6%) | 79 (81.4%) |
| Education, Arts & Media | 18 (64.3%) | 10 (35.7%) |
| Legal Services & Support | 0 (0.0%) | 0 (0.0%) |
| Education Instruction & Library | 0 (0.0%) | 69 (100.0%) |
| Arts, Media & Entertainment | 0 (0.0%) | 0 (0.0%) |
| Health Diagnosing & Treating | 35 (40.7%) | 51 (59.3%) |
| Health Technologists | 28 (51.8%) | 26 (48.1%) |
| Total (Category) | 222 (52.9%) | 198 (47.1%) |
| Total (Overall) | 916 (59.0%) | 636 (41.0%) |
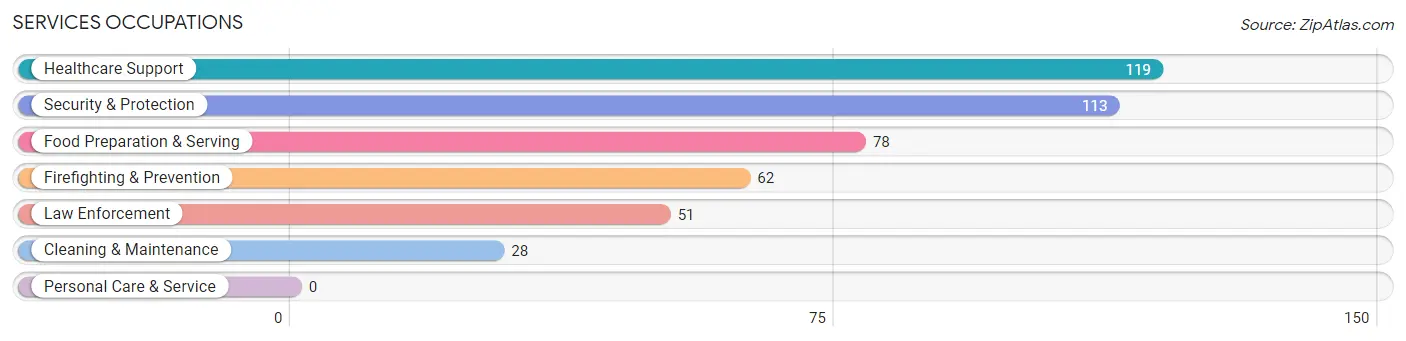
Services Occupations
The most common Services occupations in Harrisburg are Healthcare Support (119 | 7.7%), Security & Protection (113 | 7.3%), Food Preparation & Serving (78 | 5.0%), Firefighting & Prevention (62 | 4.0%), and Law Enforcement (51 | 3.3%).
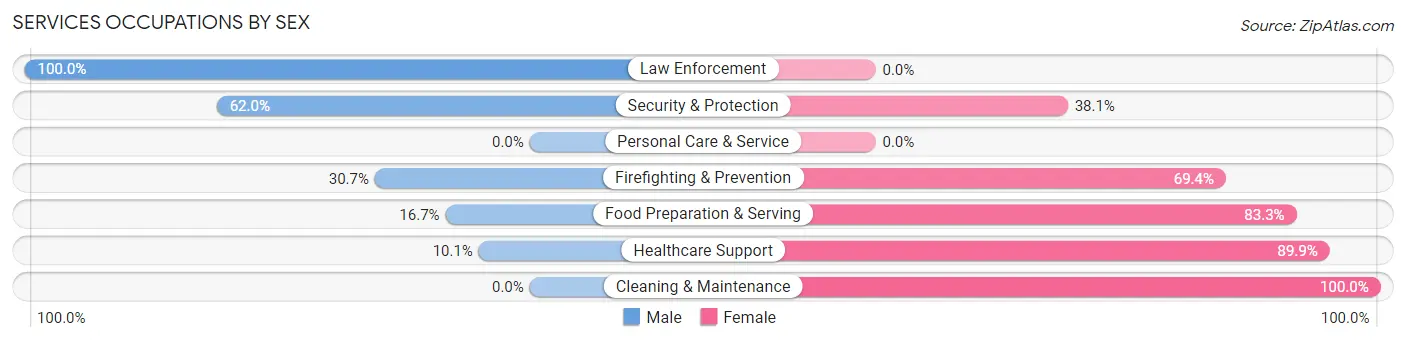
Services Occupations by Sex
Within the Services occupations in Harrisburg, the most male-oriented occupations are Law Enforcement (100.0%), Security & Protection (62.0%), and Firefighting & Prevention (30.6%), while the most female-oriented occupations are Cleaning & Maintenance (100.0%), Healthcare Support (89.9%), and Food Preparation & Serving (83.3%).
| Occupation | Male | Female |
| Healthcare Support | 12 (10.1%) | 107 (89.9%) |
| Security & Protection | 70 (62.0%) | 43 (38.1%) |
| Firefighting & Prevention | 19 (30.6%) | 43 (69.4%) |
| Law Enforcement | 51 (100.0%) | 0 (0.0%) |
| Food Preparation & Serving | 13 (16.7%) | 65 (83.3%) |
| Cleaning & Maintenance | 0 (0.0%) | 28 (100.0%) |
| Personal Care & Service | 0 (0.0%) | 0 (0.0%) |
| Total (Category) | 95 (28.1%) | 243 (71.9%) |
| Total (Overall) | 916 (59.0%) | 636 (41.0%) |
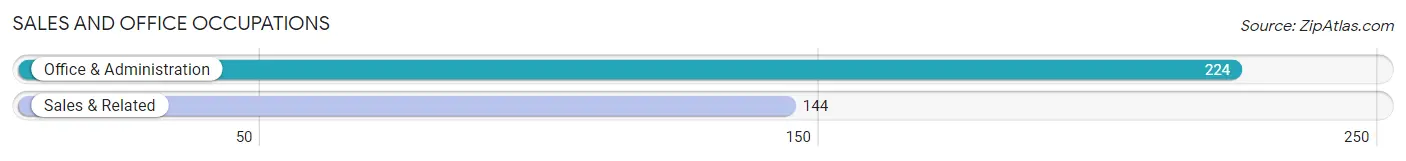
Sales and Office Occupations
The most common Sales and Office occupations in Harrisburg are Office & Administration (224 | 14.4%), and Sales & Related (144 | 9.3%).
Sales and Office Occupations by Sex
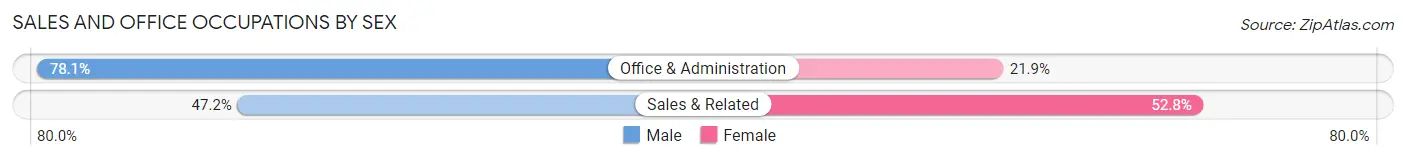
| Occupation | Male | Female |
| Sales & Related | 68 (47.2%) | 76 (52.8%) |
| Office & Administration | 175 (78.1%) | 49 (21.9%) |
| Total (Category) | 243 (66.0%) | 125 (34.0%) |
| Total (Overall) | 916 (59.0%) | 636 (41.0%) |
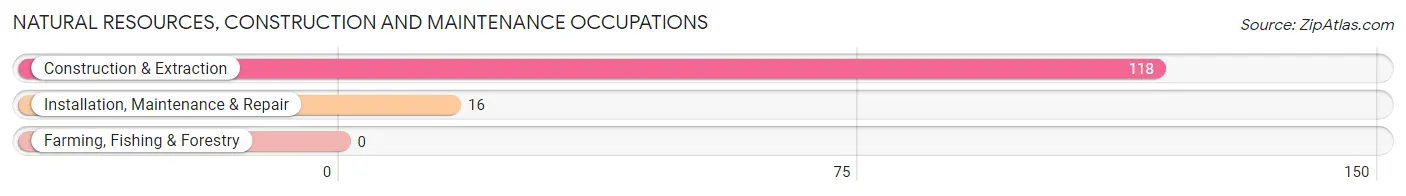
Natural Resources, Construction and Maintenance Occupations
The most common Natural Resources, Construction and Maintenance occupations in Harrisburg are Construction & Extraction (118 | 7.6%), and Installation, Maintenance & Repair (16 | 1.0%).
Natural Resources, Construction and Maintenance Occupations by Sex
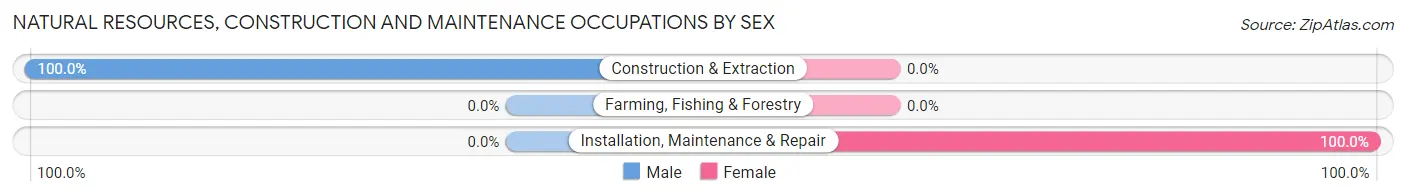
| Occupation | Male | Female |
| Farming, Fishing & Forestry | 0 (0.0%) | 0 (0.0%) |
| Construction & Extraction | 118 (100.0%) | 0 (0.0%) |
| Installation, Maintenance & Repair | 0 (0.0%) | 16 (100.0%) |
| Total (Category) | 118 (88.1%) | 16 (11.9%) |
| Total (Overall) | 916 (59.0%) | 636 (41.0%) |
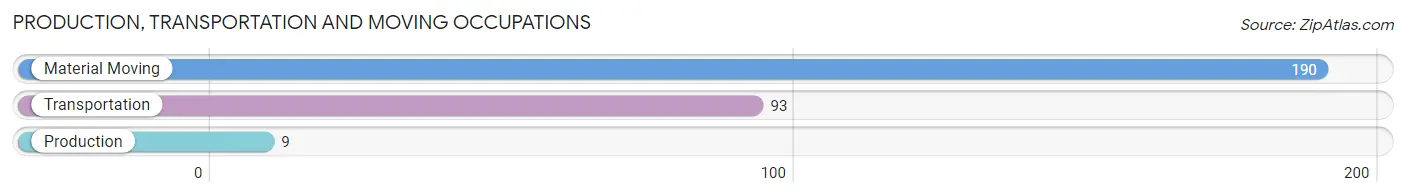
Production, Transportation and Moving Occupations
The most common Production, Transportation and Moving occupations in Harrisburg are Material Moving (190 | 12.2%), Transportation (93 | 6.0%), and Production (9 | 0.6%).
Production, Transportation and Moving Occupations by Sex
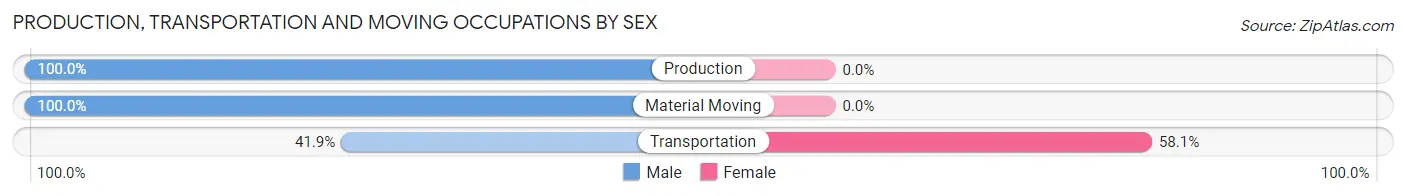
| Occupation | Male | Female |
| Production | 9 (100.0%) | 0 (0.0%) |
| Transportation | 39 (41.9%) | 54 (58.1%) |
| Material Moving | 190 (100.0%) | 0 (0.0%) |
| Total (Category) | 238 (81.5%) | 54 (18.5%) |
| Total (Overall) | 916 (59.0%) | 636 (41.0%) |
Employment Industries by Sex in Harrisburg
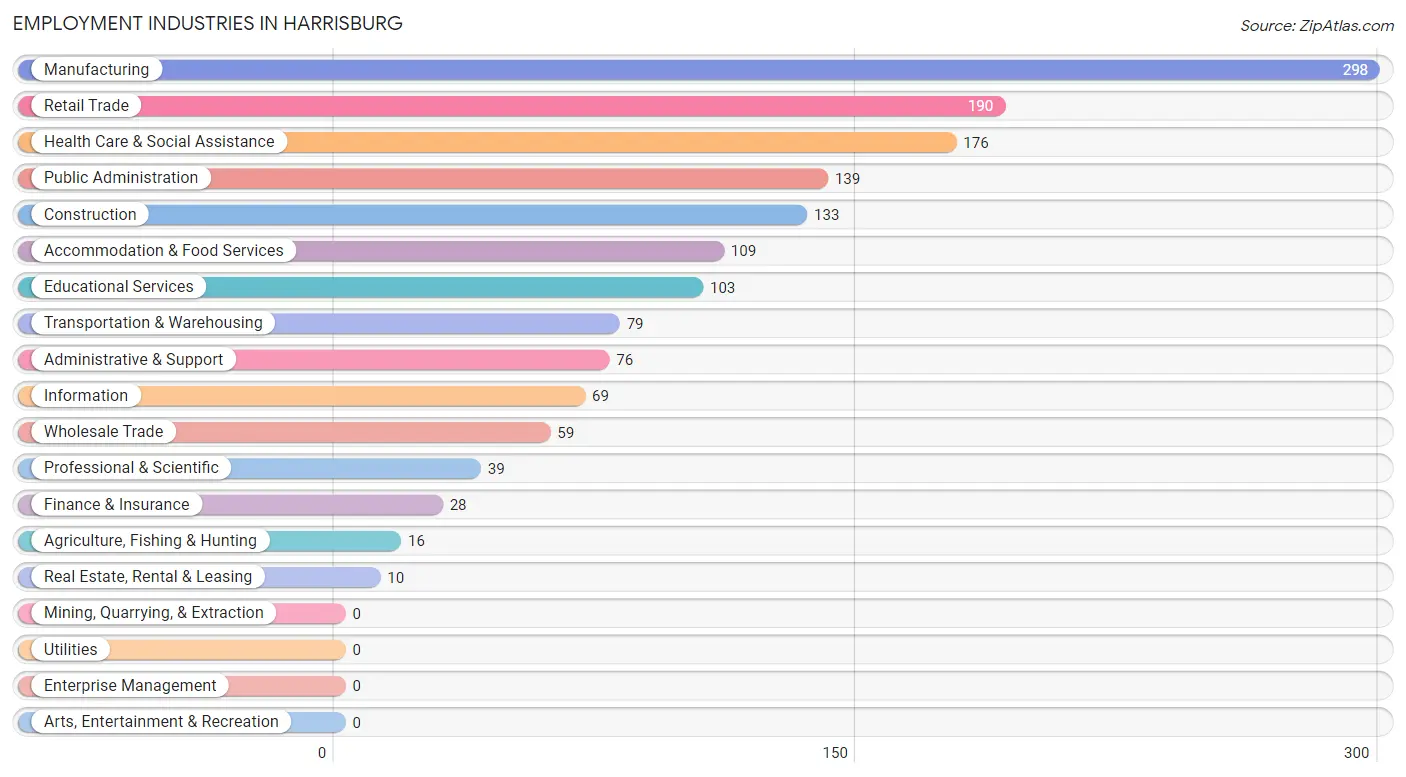
Employment Industries in Harrisburg
The major employment industries in Harrisburg include Manufacturing (298 | 19.2%), Retail Trade (190 | 12.2%), Health Care & Social Assistance (176 | 11.3%), Public Administration (139 | 9.0%), and Construction (133 | 8.6%).
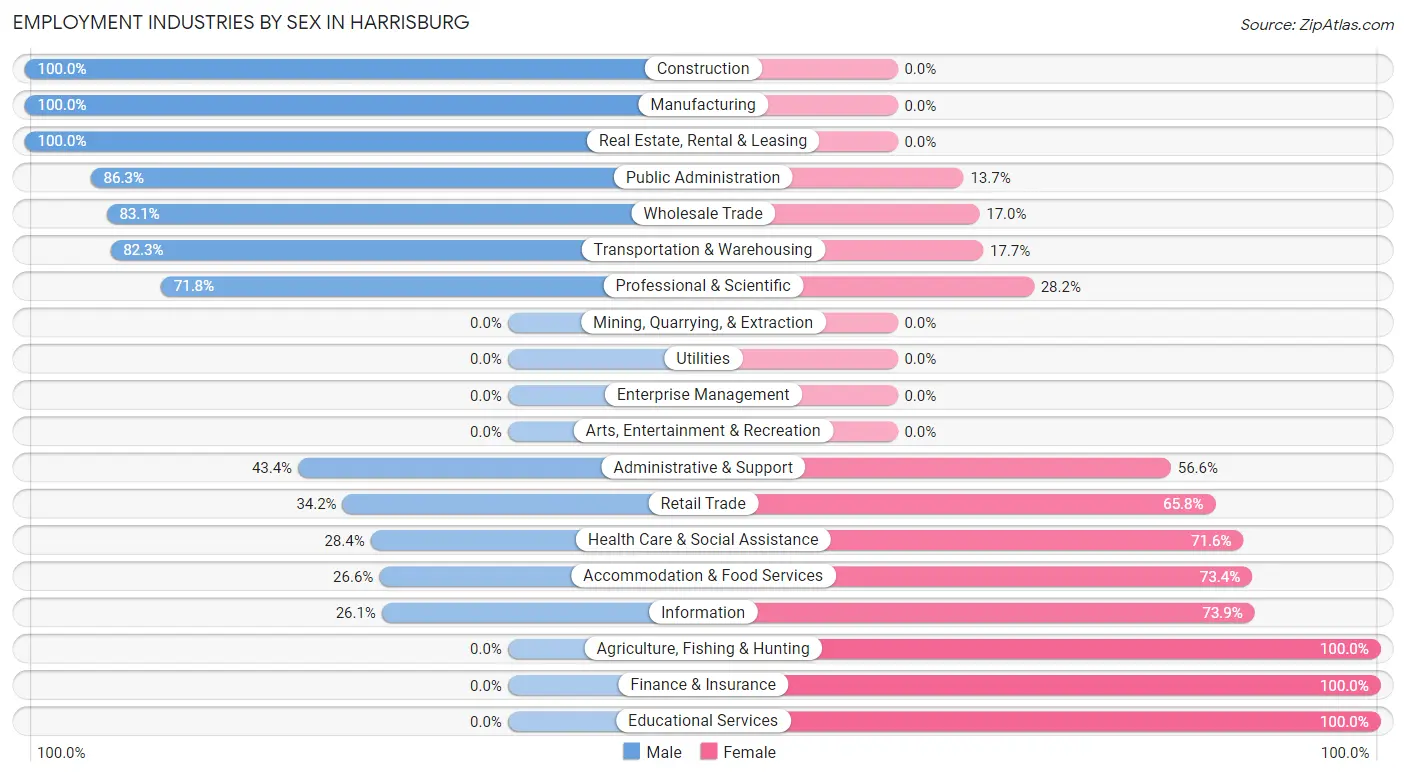
Employment Industries by Sex in Harrisburg
The Harrisburg industries that see more men than women are Construction (100.0%), Manufacturing (100.0%), and Real Estate, Rental & Leasing (100.0%), whereas the industries that tend to have a higher number of women are Agriculture, Fishing & Hunting (100.0%), Finance & Insurance (100.0%), and Educational Services (100.0%).
| Industry | Male | Female |
| Agriculture, Fishing & Hunting | 0 (0.0%) | 16 (100.0%) |
| Mining, Quarrying, & Extraction | 0 (0.0%) | 0 (0.0%) |
| Construction | 133 (100.0%) | 0 (0.0%) |
| Manufacturing | 298 (100.0%) | 0 (0.0%) |
| Wholesale Trade | 49 (83.1%) | 10 (17.0%) |
| Retail Trade | 65 (34.2%) | 125 (65.8%) |
| Transportation & Warehousing | 65 (82.3%) | 14 (17.7%) |
| Utilities | 0 (0.0%) | 0 (0.0%) |
| Information | 18 (26.1%) | 51 (73.9%) |
| Finance & Insurance | 0 (0.0%) | 28 (100.0%) |
| Real Estate, Rental & Leasing | 10 (100.0%) | 0 (0.0%) |
| Professional & Scientific | 28 (71.8%) | 11 (28.2%) |
| Enterprise Management | 0 (0.0%) | 0 (0.0%) |
| Administrative & Support | 33 (43.4%) | 43 (56.6%) |
| Educational Services | 0 (0.0%) | 103 (100.0%) |
| Health Care & Social Assistance | 50 (28.4%) | 126 (71.6%) |
| Arts, Entertainment & Recreation | 0 (0.0%) | 0 (0.0%) |
| Accommodation & Food Services | 29 (26.6%) | 80 (73.4%) |
| Public Administration | 120 (86.3%) | 19 (13.7%) |
| Total | 916 (59.0%) | 636 (41.0%) |
Education in Harrisburg
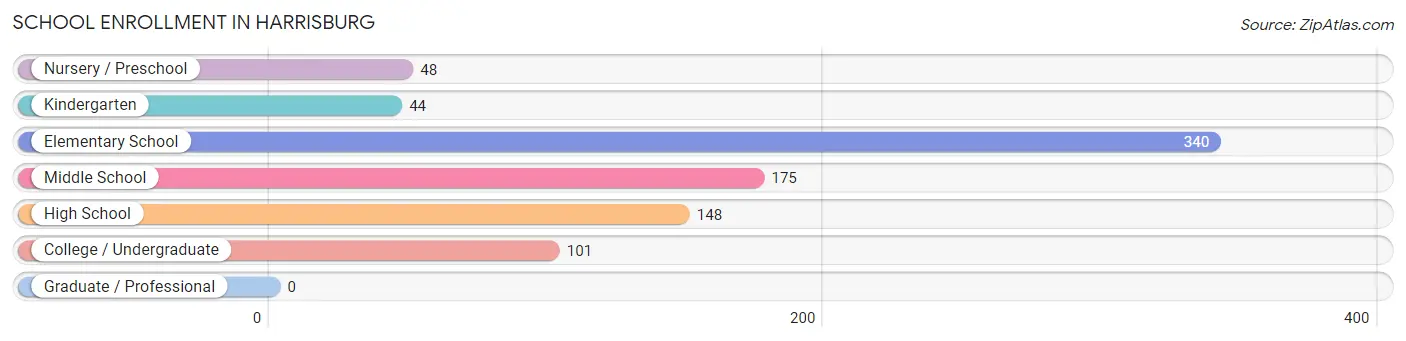
School Enrollment in Harrisburg
The most common levels of schooling among the 856 students in Harrisburg are elementary school (340 | 39.7%), middle school (175 | 20.4%), and high school (148 | 17.3%).
| School Level | # Students | % Students |
| Nursery / Preschool | 48 | 5.6% |
| Kindergarten | 44 | 5.1% |
| Elementary School | 340 | 39.7% |
| Middle School | 175 | 20.4% |
| High School | 148 | 17.3% |
| College / Undergraduate | 101 | 11.8% |
| Graduate / Professional | 0 | 0.0% |
| Total | 856 | 100.0% |
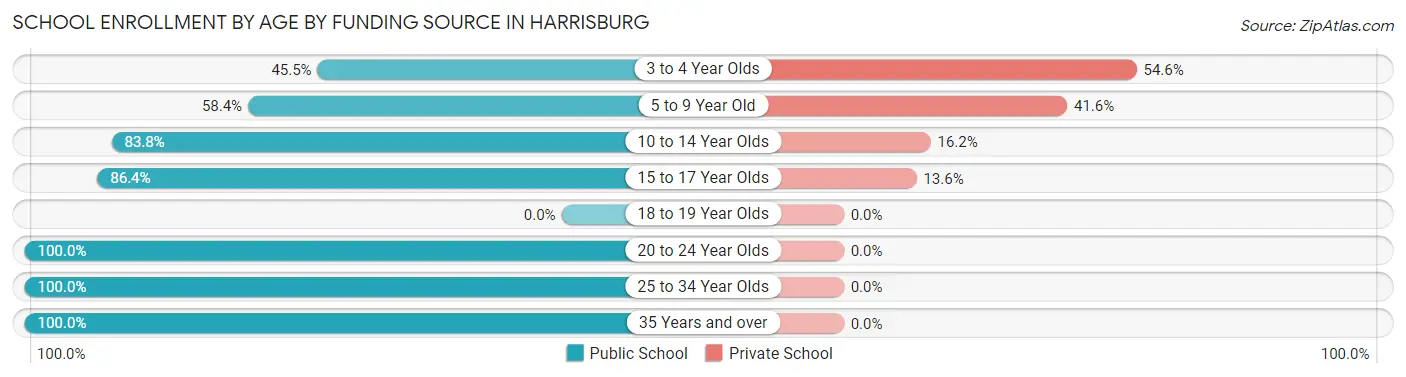
School Enrollment by Age by Funding Source in Harrisburg
Out of a total of 856 students who are enrolled in schools in Harrisburg, 224 (26.2%) attend a private institution, while the remaining 632 (73.8%) are enrolled in public schools. The age group of 3 to 4 year olds has the highest likelihood of being enrolled in private schools, with 18 (54.5% in the age bracket) enrolled. Conversely, the age group of 20 to 24 year olds has the lowest likelihood of being enrolled in a private school, with 11 (100.0% in the age bracket) attending a public institution.
| Age Bracket | Public School | Private School |
| 3 to 4 Year Olds | 15 (45.5%) | 18 (54.5%) |
| 5 to 9 Year Old | 212 (58.4%) | 151 (41.6%) |
| 10 to 14 Year Olds | 202 (83.8%) | 39 (16.2%) |
| 15 to 17 Year Olds | 102 (86.4%) | 16 (13.6%) |
| 18 to 19 Year Olds | 0 (0.0%) | 0 (0.0%) |
| 20 to 24 Year Olds | 11 (100.0%) | 0 (0.0%) |
| 25 to 34 Year Olds | 55 (100.0%) | 0 (0.0%) |
| 35 Years and over | 35 (100.0%) | 0 (0.0%) |
| Total | 632 (73.8%) | 224 (26.2%) |
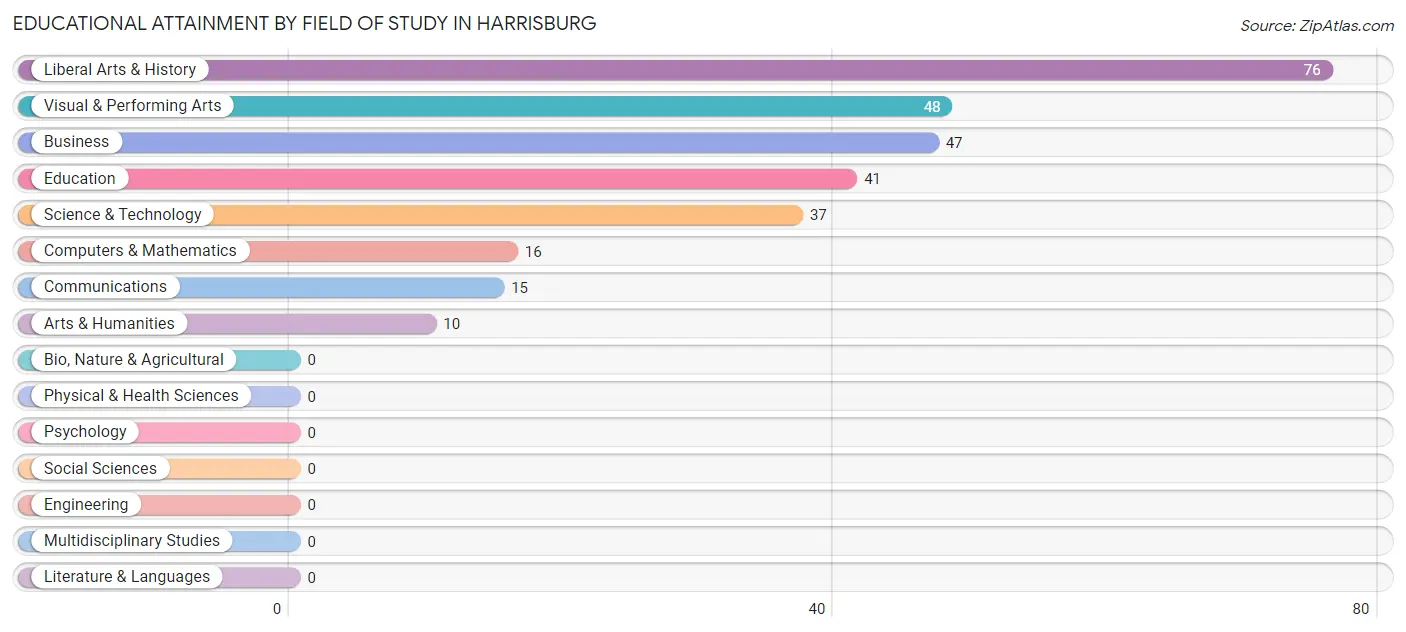
Educational Attainment by Field of Study in Harrisburg
Liberal arts & history (76 | 26.2%), visual & performing arts (48 | 16.6%), business (47 | 16.2%), education (41 | 14.1%), and science & technology (37 | 12.8%) are the most common fields of study among 290 individuals in Harrisburg who have obtained a bachelor's degree or higher.
| Field of Study | # Graduates | % Graduates |
| Computers & Mathematics | 16 | 5.5% |
| Bio, Nature & Agricultural | 0 | 0.0% |
| Physical & Health Sciences | 0 | 0.0% |
| Psychology | 0 | 0.0% |
| Social Sciences | 0 | 0.0% |
| Engineering | 0 | 0.0% |
| Multidisciplinary Studies | 0 | 0.0% |
| Science & Technology | 37 | 12.8% |
| Business | 47 | 16.2% |
| Education | 41 | 14.1% |
| Literature & Languages | 0 | 0.0% |
| Liberal Arts & History | 76 | 26.2% |
| Visual & Performing Arts | 48 | 16.6% |
| Communications | 15 | 5.2% |
| Arts & Humanities | 10 | 3.5% |
| Total | 290 | 100.0% |
Transportation & Commute in Harrisburg
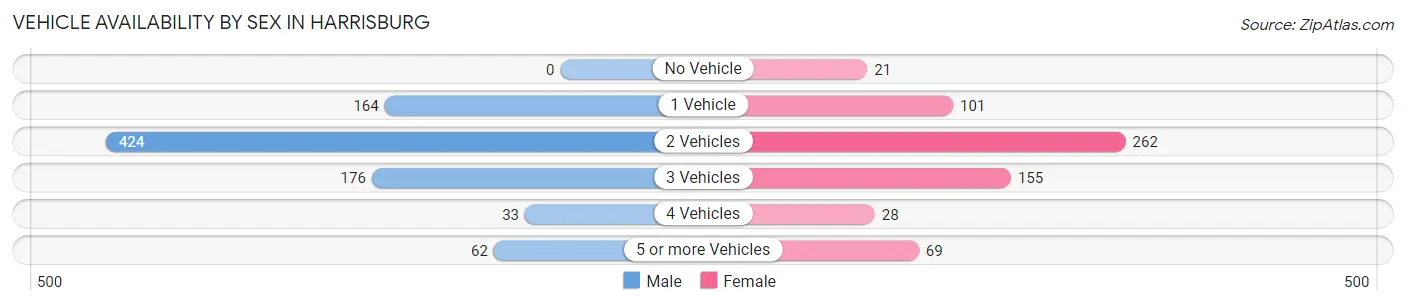
Vehicle Availability by Sex in Harrisburg
The most prevalent vehicle ownership categories in Harrisburg are males with 2 vehicles (424, accounting for 49.4%) and females with 2 vehicles (262, making up 66.7%).
| Vehicles Available | Male | Female |
| No Vehicle | 0 (0.0%) | 21 (3.3%) |
| 1 Vehicle | 164 (19.1%) | 101 (15.9%) |
| 2 Vehicles | 424 (49.4%) | 262 (41.2%) |
| 3 Vehicles | 176 (20.5%) | 155 (24.4%) |
| 4 Vehicles | 33 (3.8%) | 28 (4.4%) |
| 5 or more Vehicles | 62 (7.2%) | 69 (10.8%) |
| Total | 859 (100.0%) | 636 (100.0%) |
Commute Time in Harrisburg
The most frequently occuring commute durations in Harrisburg are 20 to 24 minutes (225 commuters, 16.8%), 5 to 9 minutes (216 commuters, 16.1%), and 30 to 34 minutes (201 commuters, 15.0%).
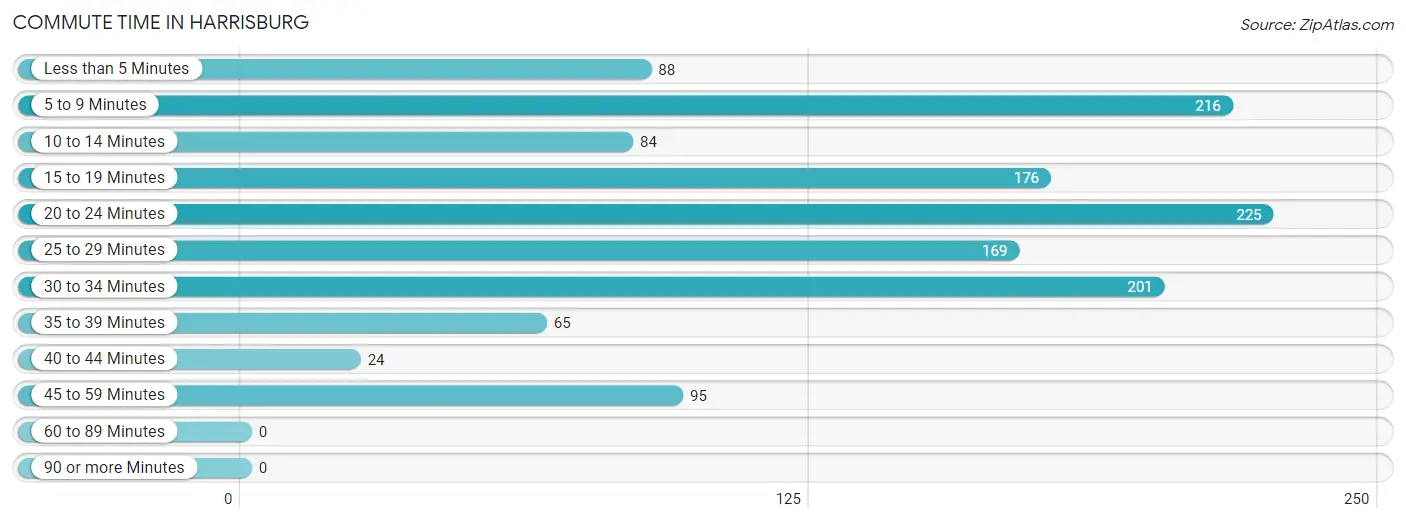
| Commute Time | # Commuters | % Commuters |
| Less than 5 Minutes | 88 | 6.6% |
| 5 to 9 Minutes | 216 | 16.1% |
| 10 to 14 Minutes | 84 | 6.2% |
| 15 to 19 Minutes | 176 | 13.1% |
| 20 to 24 Minutes | 225 | 16.8% |
| 25 to 29 Minutes | 169 | 12.6% |
| 30 to 34 Minutes | 201 | 15.0% |
| 35 to 39 Minutes | 65 | 4.8% |
| 40 to 44 Minutes | 24 | 1.8% |
| 45 to 59 Minutes | 95 | 7.1% |
| 60 to 89 Minutes | 0 | 0.0% |
| 90 or more Minutes | 0 | 0.0% |
Commute Time by Sex in Harrisburg
The most common commute times in Harrisburg are 30 to 34 minutes (124 commuters, 15.6%) for males and 20 to 24 minutes (127 commuters, 23.1%) for females.
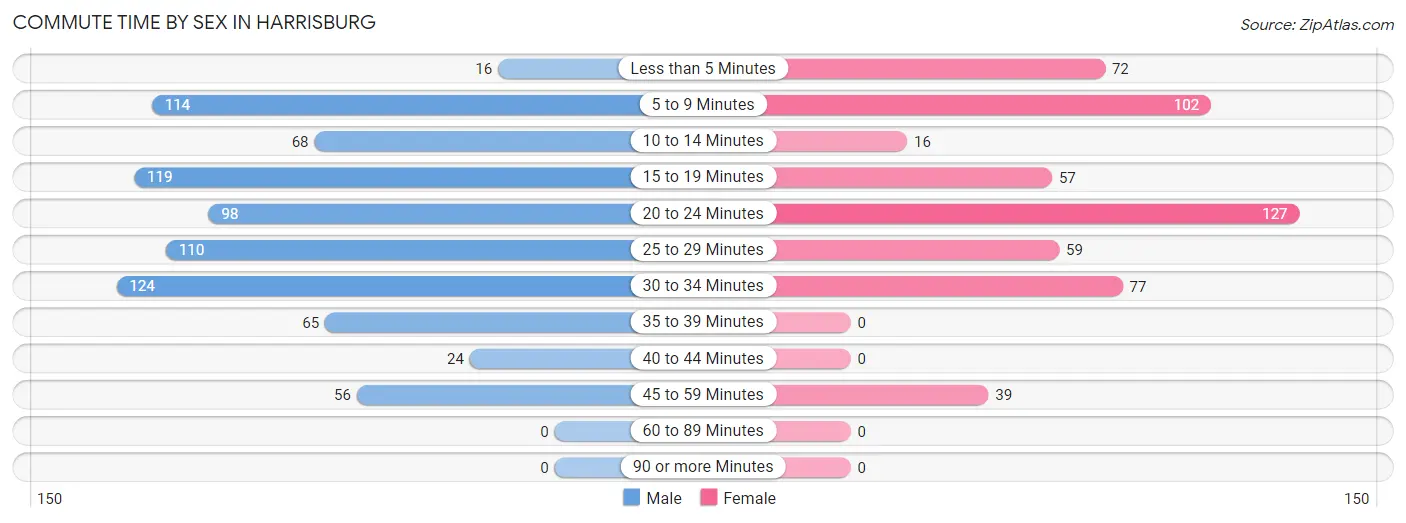
| Commute Time | Male | Female |
| Less than 5 Minutes | 16 (2.0%) | 72 (13.1%) |
| 5 to 9 Minutes | 114 (14.4%) | 102 (18.6%) |
| 10 to 14 Minutes | 68 (8.6%) | 16 (2.9%) |
| 15 to 19 Minutes | 119 (15.0%) | 57 (10.4%) |
| 20 to 24 Minutes | 98 (12.3%) | 127 (23.1%) |
| 25 to 29 Minutes | 110 (13.9%) | 59 (10.7%) |
| 30 to 34 Minutes | 124 (15.6%) | 77 (14.0%) |
| 35 to 39 Minutes | 65 (8.2%) | 0 (0.0%) |
| 40 to 44 Minutes | 24 (3.0%) | 0 (0.0%) |
| 45 to 59 Minutes | 56 (7.0%) | 39 (7.1%) |
| 60 to 89 Minutes | 0 (0.0%) | 0 (0.0%) |
| 90 or more Minutes | 0 (0.0%) | 0 (0.0%) |
Time of Departure to Work by Sex in Harrisburg
The most frequent times of departure to work in Harrisburg are 6:30 AM to 6:59 AM (198, 24.9%) for males and 7:30 AM to 7:59 AM (93, 16.9%) for females.
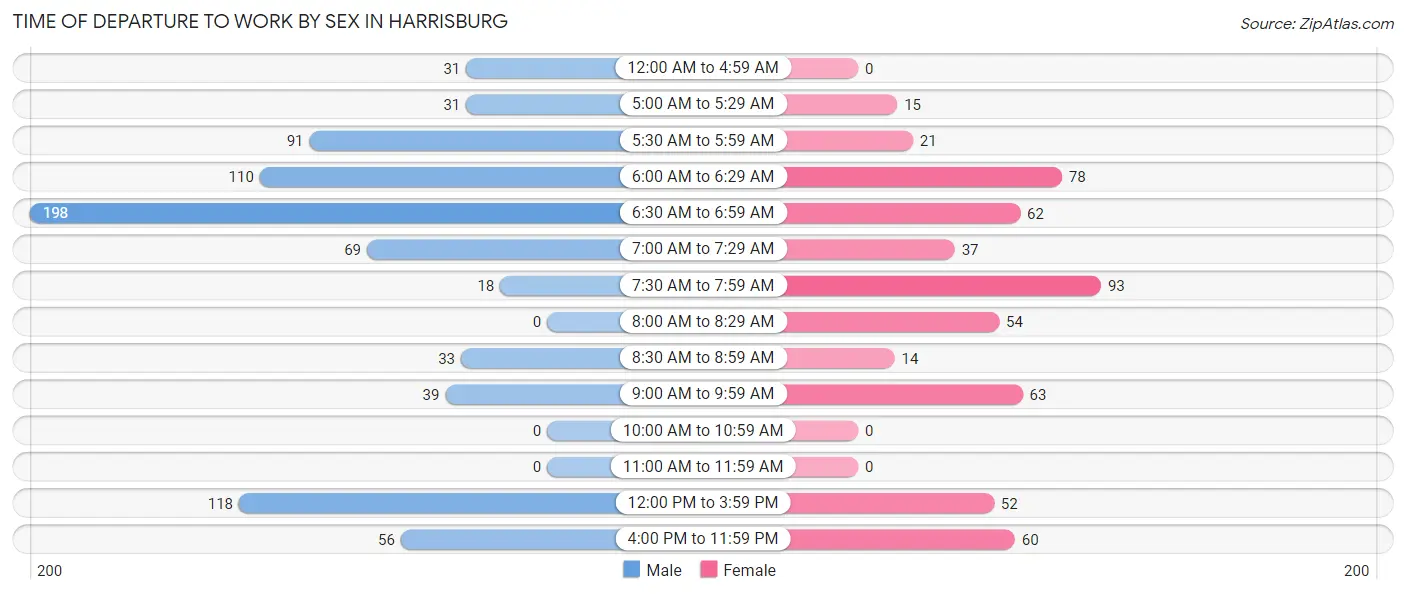
| Time of Departure | Male | Female |
| 12:00 AM to 4:59 AM | 31 (3.9%) | 0 (0.0%) |
| 5:00 AM to 5:29 AM | 31 (3.9%) | 15 (2.7%) |
| 5:30 AM to 5:59 AM | 91 (11.5%) | 21 (3.8%) |
| 6:00 AM to 6:29 AM | 110 (13.9%) | 78 (14.2%) |
| 6:30 AM to 6:59 AM | 198 (24.9%) | 62 (11.3%) |
| 7:00 AM to 7:29 AM | 69 (8.7%) | 37 (6.7%) |
| 7:30 AM to 7:59 AM | 18 (2.3%) | 93 (16.9%) |
| 8:00 AM to 8:29 AM | 0 (0.0%) | 54 (9.8%) |
| 8:30 AM to 8:59 AM | 33 (4.2%) | 14 (2.5%) |
| 9:00 AM to 9:59 AM | 39 (4.9%) | 63 (11.5%) |
| 10:00 AM to 10:59 AM | 0 (0.0%) | 0 (0.0%) |
| 11:00 AM to 11:59 AM | 0 (0.0%) | 0 (0.0%) |
| 12:00 PM to 3:59 PM | 118 (14.9%) | 52 (9.5%) |
| 4:00 PM to 11:59 PM | 56 (7.0%) | 60 (10.9%) |
| Total | 794 (100.0%) | 549 (100.0%) |
Housing Occupancy in Harrisburg
Occupancy by Ownership in Harrisburg
Of the total 1,271 dwellings in Harrisburg, owner-occupied units account for 965 (75.9%), while renter-occupied units make up 306 (24.1%).
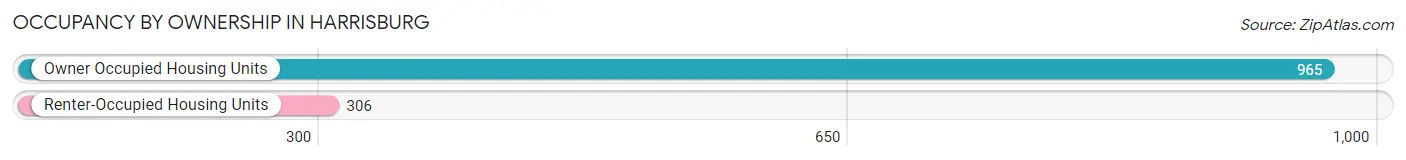
| Occupancy | # Housing Units | % Housing Units |
| Owner Occupied Housing Units | 965 | 75.9% |
| Renter-Occupied Housing Units | 306 | 24.1% |
| Total Occupied Housing Units | 1,271 | 100.0% |
Occupancy by Household Size in Harrisburg
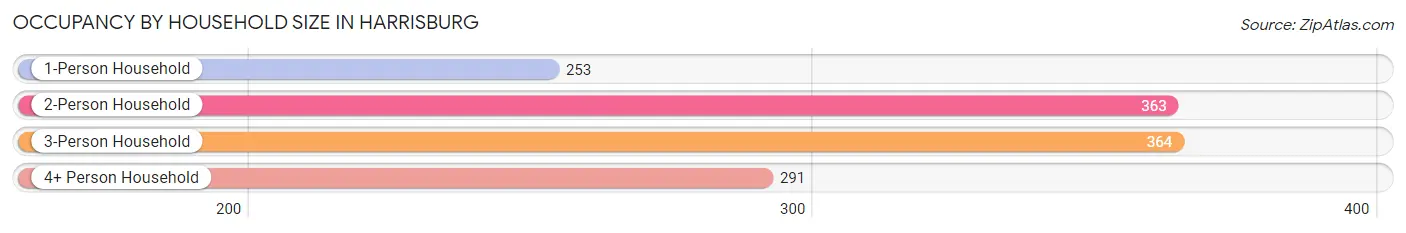
| Household Size | # Housing Units | % Housing Units |
| 1-Person Household | 253 | 19.9% |
| 2-Person Household | 363 | 28.6% |
| 3-Person Household | 364 | 28.6% |
| 4+ Person Household | 291 | 22.9% |
| Total Housing Units | 1,271 | 100.0% |
Occupancy by Ownership by Household Size in Harrisburg
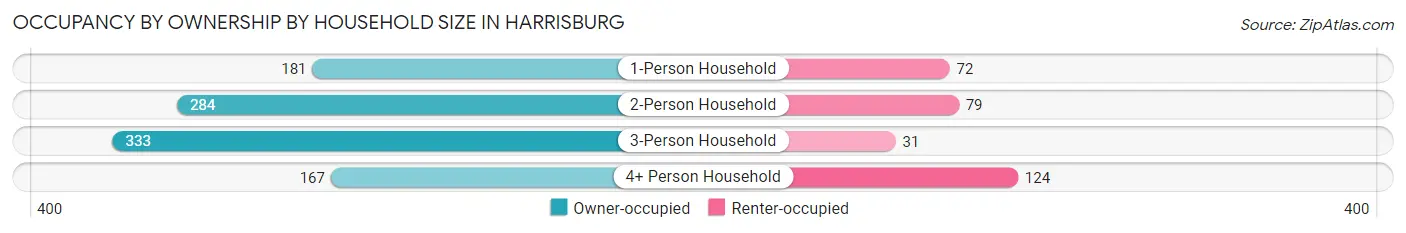
| Household Size | Owner-occupied | Renter-occupied |
| 1-Person Household | 181 (71.5%) | 72 (28.5%) |
| 2-Person Household | 284 (78.2%) | 79 (21.8%) |
| 3-Person Household | 333 (91.5%) | 31 (8.5%) |
| 4+ Person Household | 167 (57.4%) | 124 (42.6%) |
| Total Housing Units | 965 (75.9%) | 306 (24.1%) |
Occupancy by Educational Attainment in Harrisburg
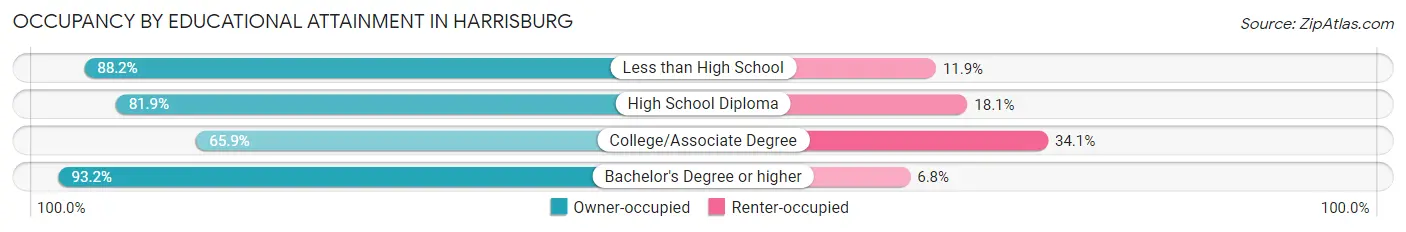
| Household Size | Owner-occupied | Renter-occupied |
| Less than High School | 119 (88.1%) | 16 (11.8%) |
| High School Diploma | 290 (81.9%) | 64 (18.1%) |
| College/Associate Degree | 418 (65.9%) | 216 (34.1%) |
| Bachelor's Degree or higher | 138 (93.2%) | 10 (6.8%) |
Occupancy by Age of Householder in Harrisburg
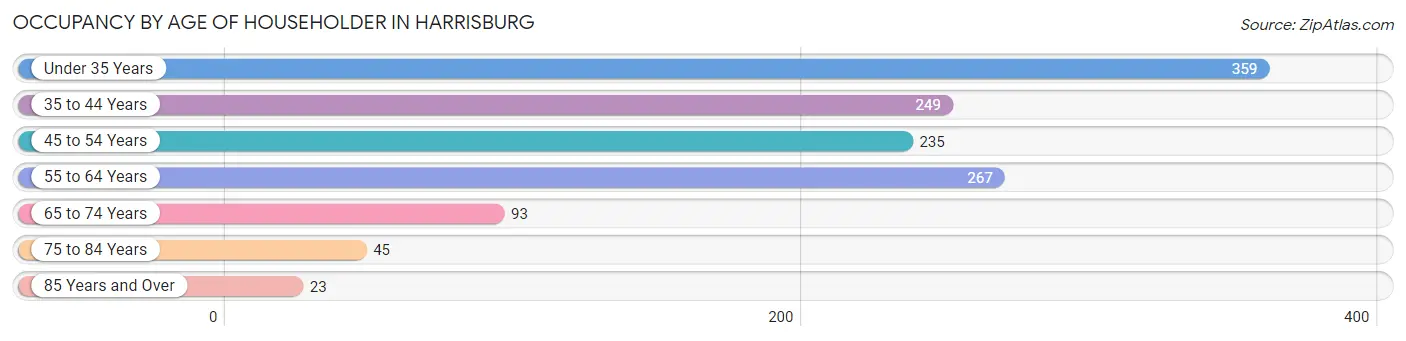
| Age Bracket | # Households | % Households |
| Under 35 Years | 359 | 28.2% |
| 35 to 44 Years | 249 | 19.6% |
| 45 to 54 Years | 235 | 18.5% |
| 55 to 64 Years | 267 | 21.0% |
| 65 to 74 Years | 93 | 7.3% |
| 75 to 84 Years | 45 | 3.5% |
| 85 Years and Over | 23 | 1.8% |
| Total | 1,271 | 100.0% |
Housing Finances in Harrisburg
Median Income by Occupancy in Harrisburg
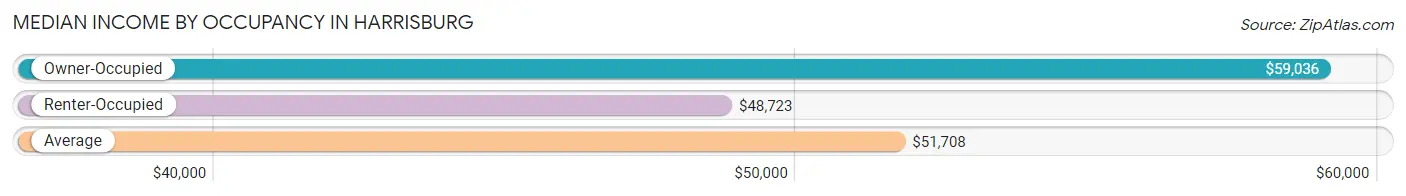
| Occupancy Type | # Households | Median Income |
| Owner-Occupied | 965 (75.9%) | $59,036 |
| Renter-Occupied | 306 (24.1%) | $48,723 |
| Average | 1,271 (100.0%) | $51,708 |
Occupancy by Householder Income Bracket in Harrisburg
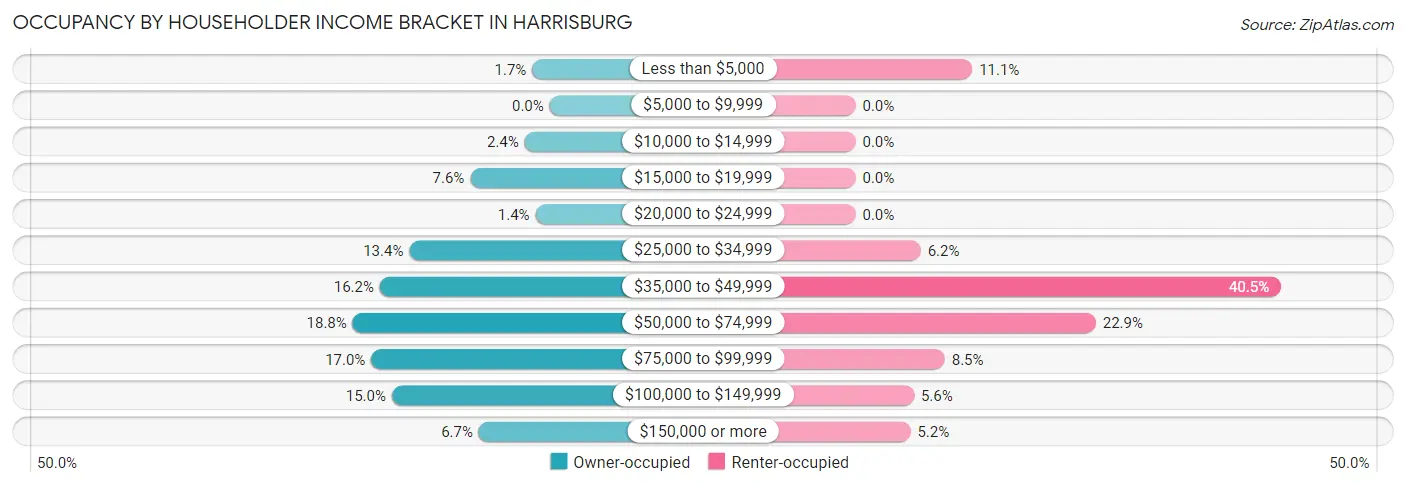
| Income Bracket | Owner-occupied | Renter-occupied |
| Less than $5,000 | 16 (1.7%) | 34 (11.1%) |
| $5,000 to $9,999 | 0 (0.0%) | 0 (0.0%) |
| $10,000 to $14,999 | 23 (2.4%) | 0 (0.0%) |
| $15,000 to $19,999 | 73 (7.6%) | 0 (0.0%) |
| $20,000 to $24,999 | 13 (1.3%) | 0 (0.0%) |
| $25,000 to $34,999 | 129 (13.4%) | 19 (6.2%) |
| $35,000 to $49,999 | 156 (16.2%) | 124 (40.5%) |
| $50,000 to $74,999 | 181 (18.8%) | 70 (22.9%) |
| $75,000 to $99,999 | 164 (17.0%) | 26 (8.5%) |
| $100,000 to $149,999 | 145 (15.0%) | 17 (5.6%) |
| $150,000 or more | 65 (6.7%) | 16 (5.2%) |
| Total | 965 (100.0%) | 306 (100.0%) |
Monthly Housing Cost Tiers in Harrisburg
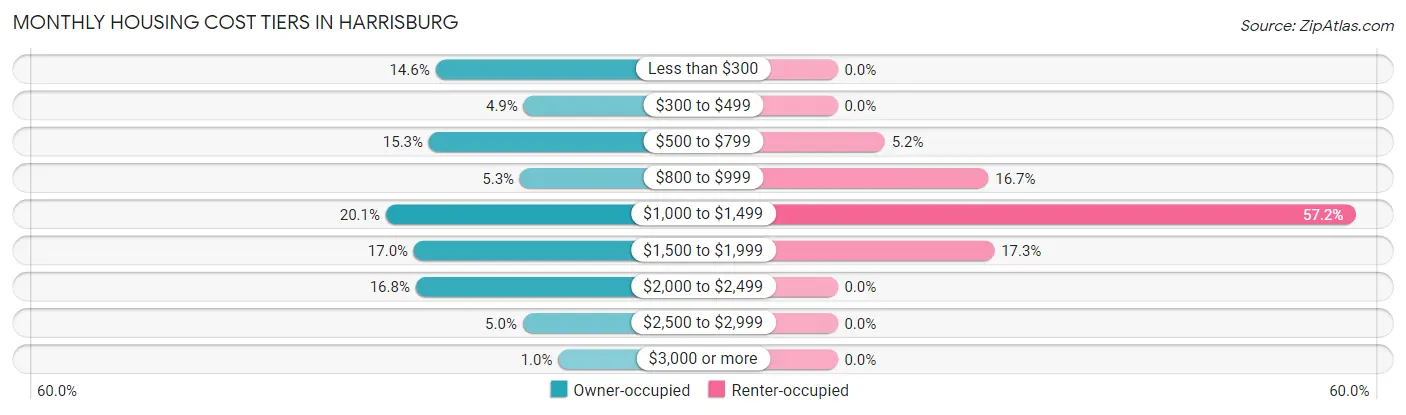
| Monthly Cost | Owner-occupied | Renter-occupied |
| Less than $300 | 141 (14.6%) | 0 (0.0%) |
| $300 to $499 | 47 (4.9%) | 0 (0.0%) |
| $500 to $799 | 148 (15.3%) | 16 (5.2%) |
| $800 to $999 | 51 (5.3%) | 51 (16.7%) |
| $1,000 to $1,499 | 194 (20.1%) | 175 (57.2%) |
| $1,500 to $1,999 | 164 (17.0%) | 53 (17.3%) |
| $2,000 to $2,499 | 162 (16.8%) | 0 (0.0%) |
| $2,500 to $2,999 | 48 (5.0%) | 0 (0.0%) |
| $3,000 or more | 10 (1.0%) | 0 (0.0%) |
| Total | 965 (100.0%) | 306 (100.0%) |
Physical Housing Characteristics in Harrisburg
Housing Structures in Harrisburg
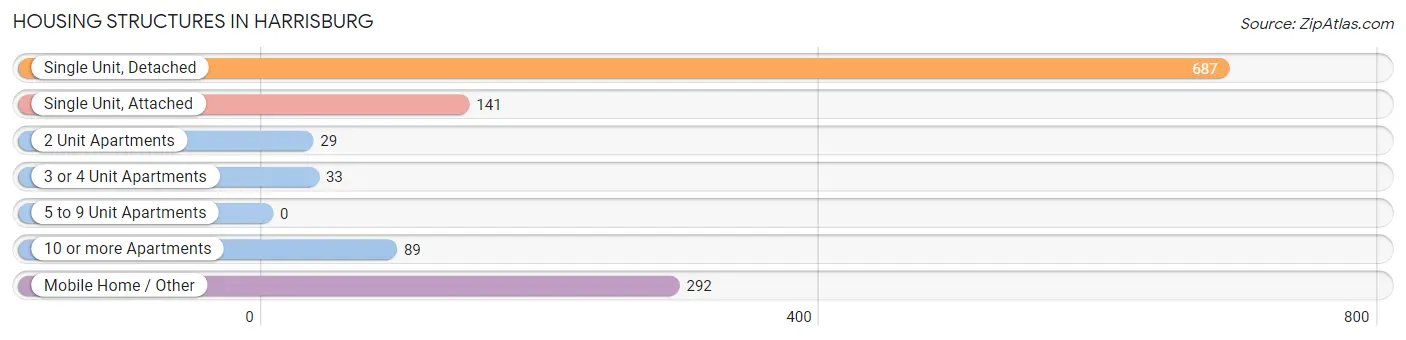
| Structure Type | # Housing Units | % Housing Units |
| Single Unit, Detached | 687 | 54.0% |
| Single Unit, Attached | 141 | 11.1% |
| 2 Unit Apartments | 29 | 2.3% |
| 3 or 4 Unit Apartments | 33 | 2.6% |
| 5 to 9 Unit Apartments | 0 | 0.0% |
| 10 or more Apartments | 89 | 7.0% |
| Mobile Home / Other | 292 | 23.0% |
| Total | 1,271 | 100.0% |
Housing Structures by Occupancy in Harrisburg
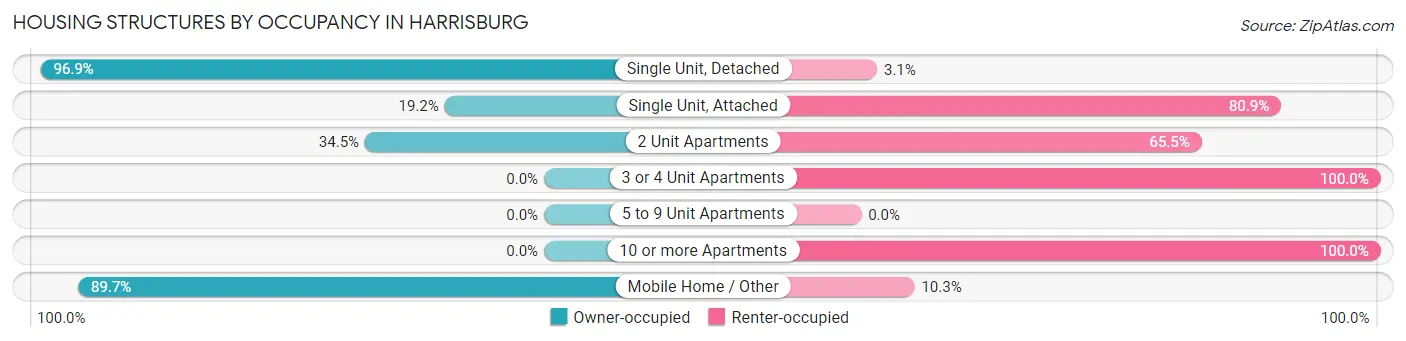
| Structure Type | Owner-occupied | Renter-occupied |
| Single Unit, Detached | 666 (96.9%) | 21 (3.1%) |
| Single Unit, Attached | 27 (19.2%) | 114 (80.8%) |
| 2 Unit Apartments | 10 (34.5%) | 19 (65.5%) |
| 3 or 4 Unit Apartments | 0 (0.0%) | 33 (100.0%) |
| 5 to 9 Unit Apartments | 0 (0.0%) | 0 (0.0%) |
| 10 or more Apartments | 0 (0.0%) | 89 (100.0%) |
| Mobile Home / Other | 262 (89.7%) | 30 (10.3%) |
| Total | 965 (75.9%) | 306 (24.1%) |
Housing Structures by Number of Rooms in Harrisburg
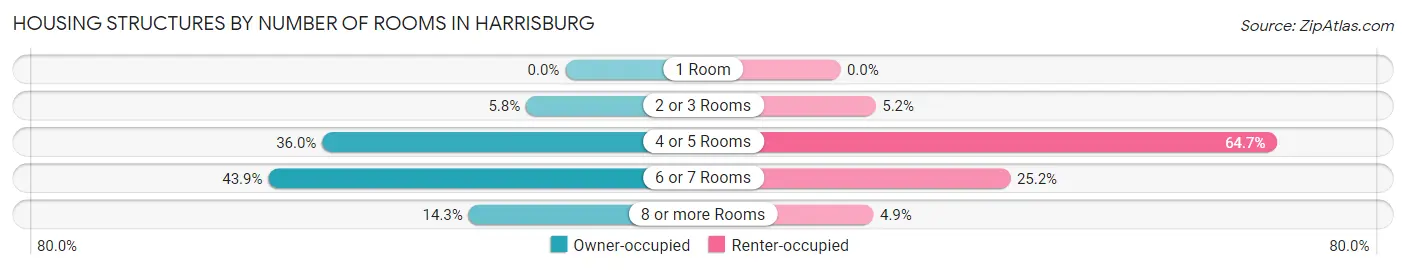
| Number of Rooms | Owner-occupied | Renter-occupied |
| 1 Room | 0 (0.0%) | 0 (0.0%) |
| 2 or 3 Rooms | 56 (5.8%) | 16 (5.2%) |
| 4 or 5 Rooms | 347 (36.0%) | 198 (64.7%) |
| 6 or 7 Rooms | 424 (43.9%) | 77 (25.2%) |
| 8 or more Rooms | 138 (14.3%) | 15 (4.9%) |
| Total | 965 (100.0%) | 306 (100.0%) |
Housing Structure by Heating Type in Harrisburg
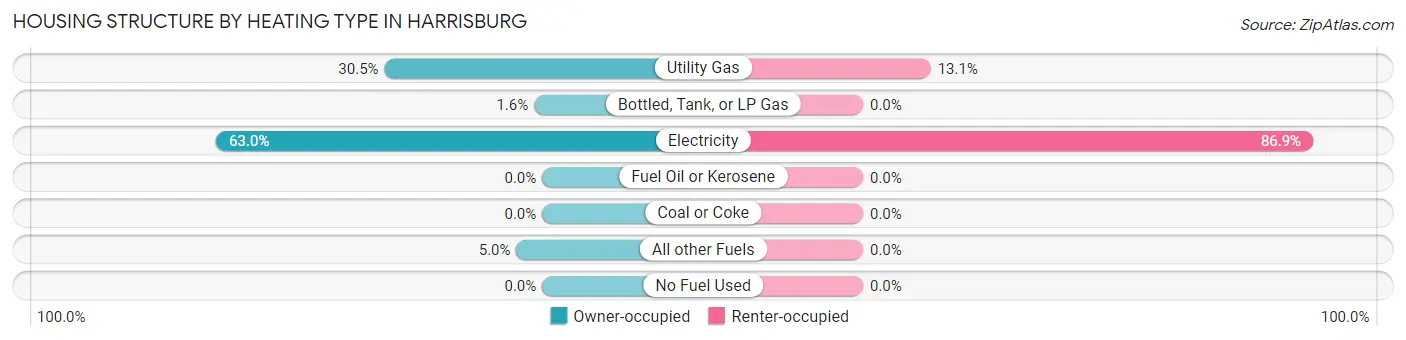
| Heating Type | Owner-occupied | Renter-occupied |
| Utility Gas | 294 (30.5%) | 40 (13.1%) |
| Bottled, Tank, or LP Gas | 15 (1.5%) | 0 (0.0%) |
| Electricity | 608 (63.0%) | 266 (86.9%) |
| Fuel Oil or Kerosene | 0 (0.0%) | 0 (0.0%) |
| Coal or Coke | 0 (0.0%) | 0 (0.0%) |
| All other Fuels | 48 (5.0%) | 0 (0.0%) |
| No Fuel Used | 0 (0.0%) | 0 (0.0%) |
| Total | 965 (100.0%) | 306 (100.0%) |
Household Vehicle Usage in Harrisburg
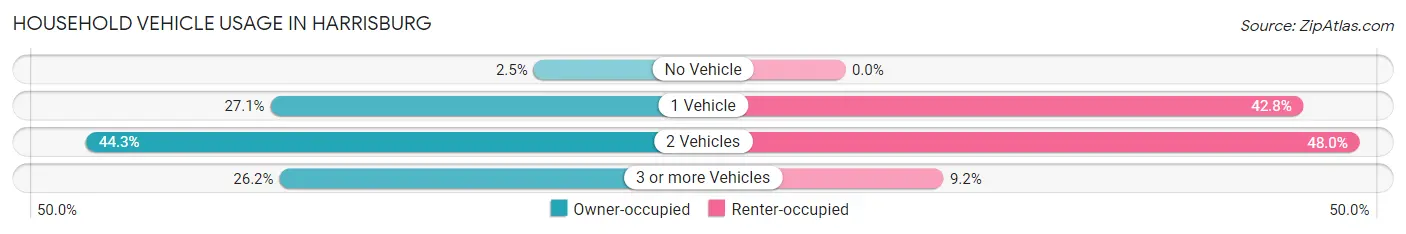
| Vehicles per Household | Owner-occupied | Renter-occupied |
| No Vehicle | 24 (2.5%) | 0 (0.0%) |
| 1 Vehicle | 261 (27.1%) | 131 (42.8%) |
| 2 Vehicles | 427 (44.3%) | 147 (48.0%) |
| 3 or more Vehicles | 253 (26.2%) | 28 (9.1%) |
| Total | 965 (100.0%) | 306 (100.0%) |
Real Estate & Mortgages in Harrisburg
Real Estate and Mortgage Overview in Harrisburg
| Characteristic | Without Mortgage | With Mortgage |
| Housing Units | 296 | 669 |
| Median Property Value | - | - |
| Median Household Income | $35,787 | $54 |
| Monthly Housing Costs | $573 | $10 |
| Real Estate Taxes | $1,457 | $0 |
Property Value by Mortgage Status in Harrisburg
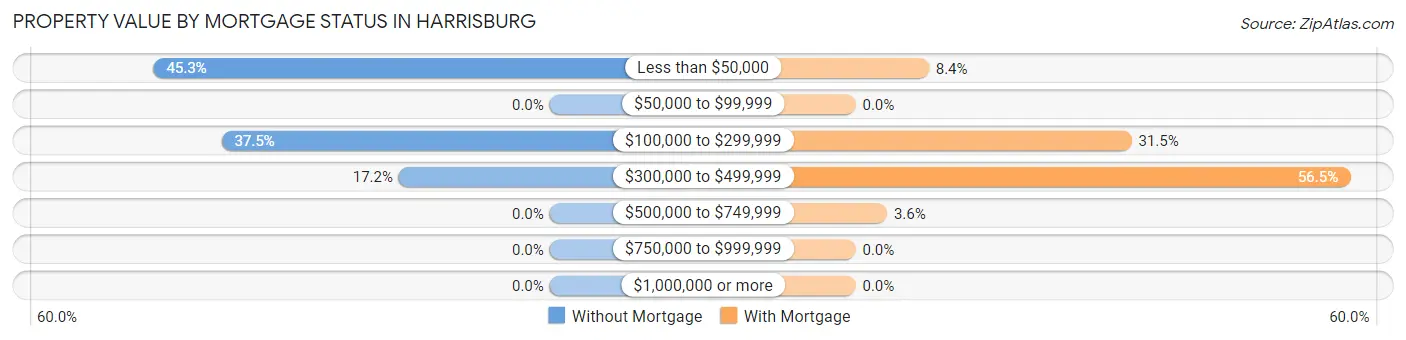
| Property Value | Without Mortgage | With Mortgage |
| Less than $50,000 | 134 (45.3%) | 56 (8.4%) |
| $50,000 to $99,999 | 0 (0.0%) | 0 (0.0%) |
| $100,000 to $299,999 | 111 (37.5%) | 211 (31.5%) |
| $300,000 to $499,999 | 51 (17.2%) | 378 (56.5%) |
| $500,000 to $749,999 | 0 (0.0%) | 24 (3.6%) |
| $750,000 to $999,999 | 0 (0.0%) | 0 (0.0%) |
| $1,000,000 or more | 0 (0.0%) | 0 (0.0%) |
| Total | 296 (100.0%) | 669 (100.0%) |
Household Income by Mortgage Status in Harrisburg
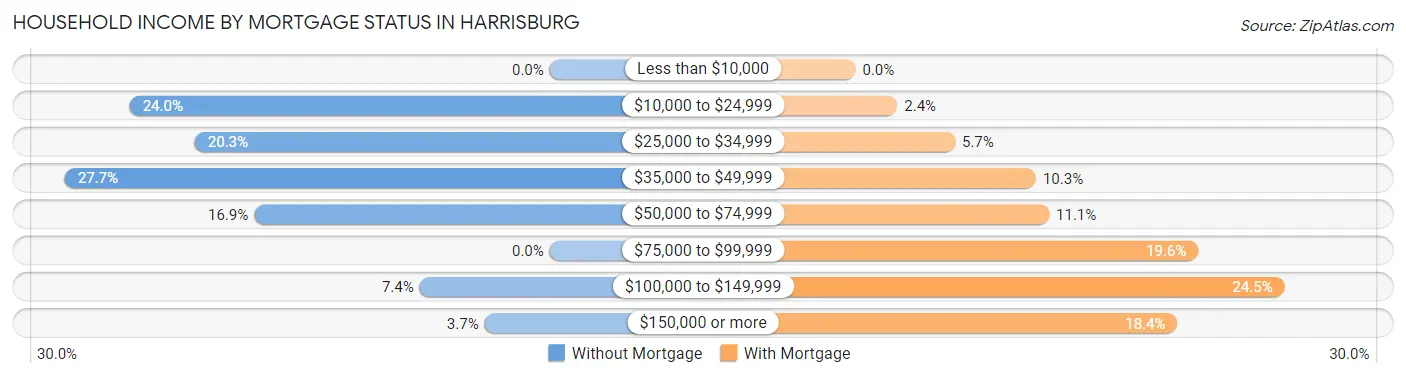
| Household Income | Without Mortgage | With Mortgage |
| Less than $10,000 | 0 (0.0%) | 0 (0.0%) |
| $10,000 to $24,999 | 71 (24.0%) | 16 (2.4%) |
| $25,000 to $34,999 | 60 (20.3%) | 38 (5.7%) |
| $35,000 to $49,999 | 82 (27.7%) | 69 (10.3%) |
| $50,000 to $74,999 | 50 (16.9%) | 74 (11.1%) |
| $75,000 to $99,999 | 0 (0.0%) | 131 (19.6%) |
| $100,000 to $149,999 | 22 (7.4%) | 164 (24.5%) |
| $150,000 or more | 11 (3.7%) | 123 (18.4%) |
| Total | 296 (100.0%) | 669 (100.0%) |
Property Value to Household Income Ratio in Harrisburg
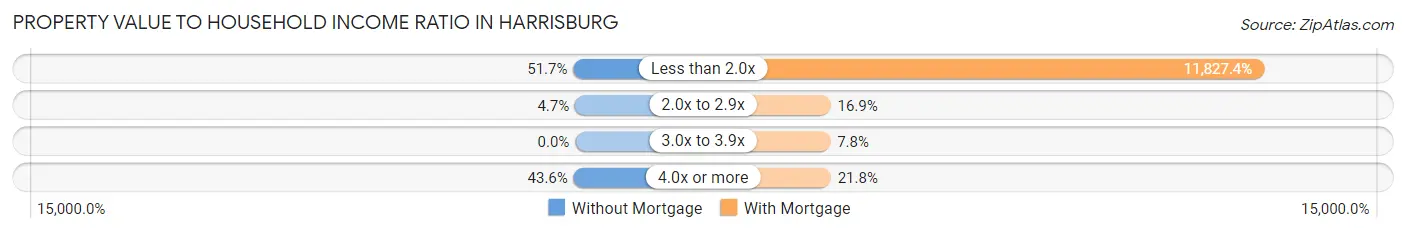
| Value-to-Income Ratio | Without Mortgage | With Mortgage |
| Less than 2.0x | 153 (51.7%) | 79,125 (11,827.3%) |
| 2.0x to 2.9x | 14 (4.7%) | 113 (16.9%) |
| 3.0x to 3.9x | 0 (0.0%) | 52 (7.8%) |
| 4.0x or more | 129 (43.6%) | 146 (21.8%) |
| Total | 296 (100.0%) | 669 (100.0%) |
Real Estate Taxes by Mortgage Status in Harrisburg
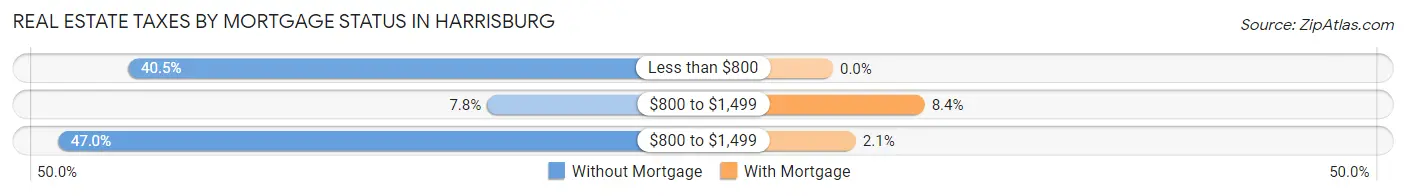
| Property Taxes | Without Mortgage | With Mortgage |
| Less than $800 | 120 (40.5%) | 0 (0.0%) |
| $800 to $1,499 | 23 (7.8%) | 56 (8.4%) |
| $800 to $1,499 | 139 (47.0%) | 14 (2.1%) |
| Total | 296 (100.0%) | 669 (100.0%) |
Health & Disability in Harrisburg
Health Insurance Coverage by Age in Harrisburg
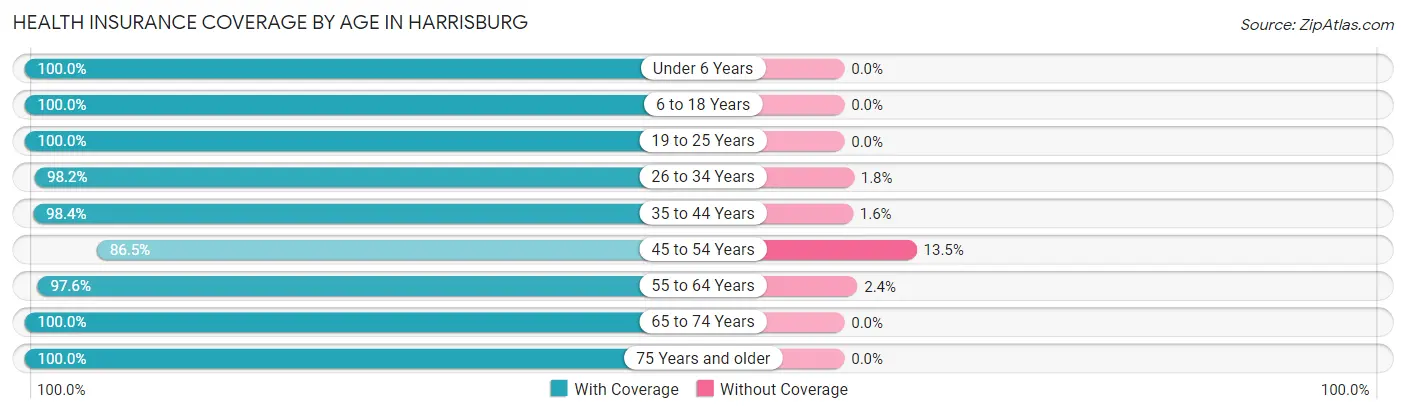
| Age Bracket | With Coverage | Without Coverage |
| Under 6 Years | 412 (100.0%) | 0 (0.0%) |
| 6 to 18 Years | 731 (100.0%) | 0 (0.0%) |
| 19 to 25 Years | 158 (100.0%) | 0 (0.0%) |
| 26 to 34 Years | 666 (98.2%) | 12 (1.8%) |
| 35 to 44 Years | 615 (98.4%) | 10 (1.6%) |
| 45 to 54 Years | 218 (86.5%) | 34 (13.5%) |
| 55 to 64 Years | 524 (97.6%) | 13 (2.4%) |
| 65 to 74 Years | 163 (100.0%) | 0 (0.0%) |
| 75 Years and older | 107 (100.0%) | 0 (0.0%) |
| Total | 3,594 (98.1%) | 69 (1.9%) |
Health Insurance Coverage by Citizenship Status in Harrisburg
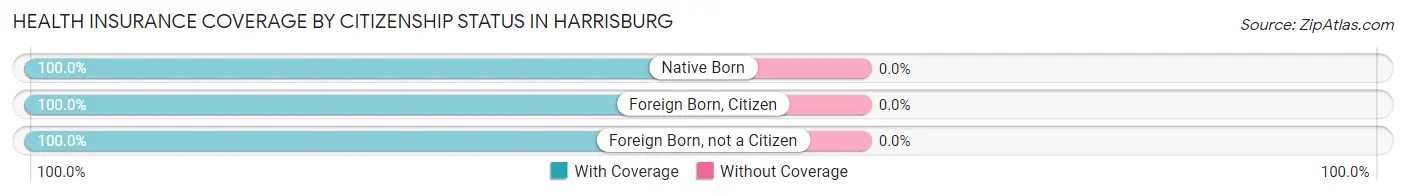
| Citizenship Status | With Coverage | Without Coverage |
| Native Born | 412 (100.0%) | 0 (0.0%) |
| Foreign Born, Citizen | 731 (100.0%) | 0 (0.0%) |
| Foreign Born, not a Citizen | 158 (100.0%) | 0 (0.0%) |
Health Insurance Coverage by Household Income in Harrisburg
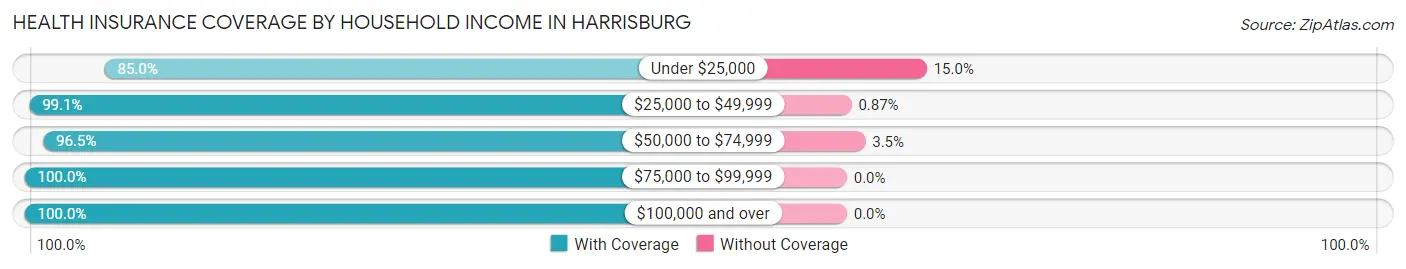
| Household Income | With Coverage | Without Coverage |
| Under $25,000 | 193 (85.0%) | 34 (15.0%) |
| $25,000 to $49,999 | 1,482 (99.1%) | 13 (0.9%) |
| $50,000 to $74,999 | 613 (96.5%) | 22 (3.5%) |
| $75,000 to $99,999 | 587 (100.0%) | 0 (0.0%) |
| $100,000 and over | 719 (100.0%) | 0 (0.0%) |
Public vs Private Health Insurance Coverage by Age in Harrisburg
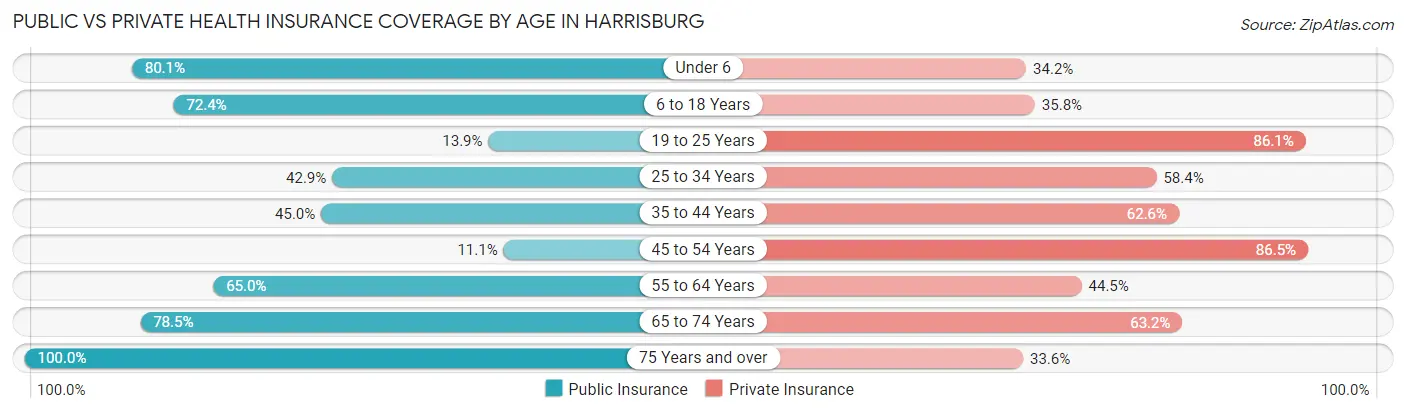
| Age Bracket | Public Insurance | Private Insurance |
| Under 6 | 330 (80.1%) | 141 (34.2%) |
| 6 to 18 Years | 529 (72.4%) | 262 (35.8%) |
| 19 to 25 Years | 22 (13.9%) | 136 (86.1%) |
| 25 to 34 Years | 291 (42.9%) | 396 (58.4%) |
| 35 to 44 Years | 281 (45.0%) | 391 (62.6%) |
| 45 to 54 Years | 28 (11.1%) | 218 (86.5%) |
| 55 to 64 Years | 349 (65.0%) | 239 (44.5%) |
| 65 to 74 Years | 128 (78.5%) | 103 (63.2%) |
| 75 Years and over | 107 (100.0%) | 36 (33.6%) |
| Total | 2,065 (56.4%) | 1,922 (52.5%) |
Disability Status by Sex by Age in Harrisburg
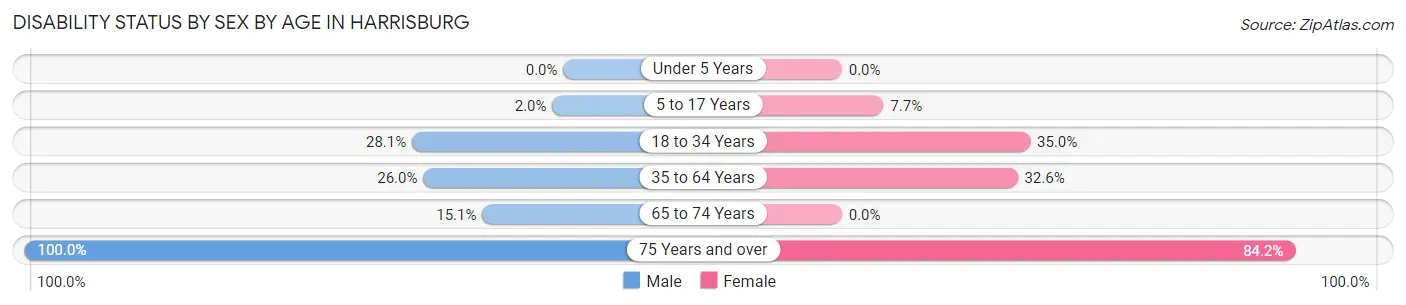
| Age Bracket | Male | Female |
| Under 5 Years | 0 (0.0%) | 0 (0.0%) |
| 5 to 17 Years | 8 (2.0%) | 30 (7.7%) |
| 18 to 34 Years | 107 (28.1%) | 159 (34.9%) |
| 35 to 64 Years | 201 (26.0%) | 209 (32.6%) |
| 65 to 74 Years | 14 (15.0%) | 0 (0.0%) |
| 75 Years and over | 6 (100.0%) | 85 (84.2%) |
Disability Class by Sex by Age in Harrisburg
Disability Class: Hearing Difficulty
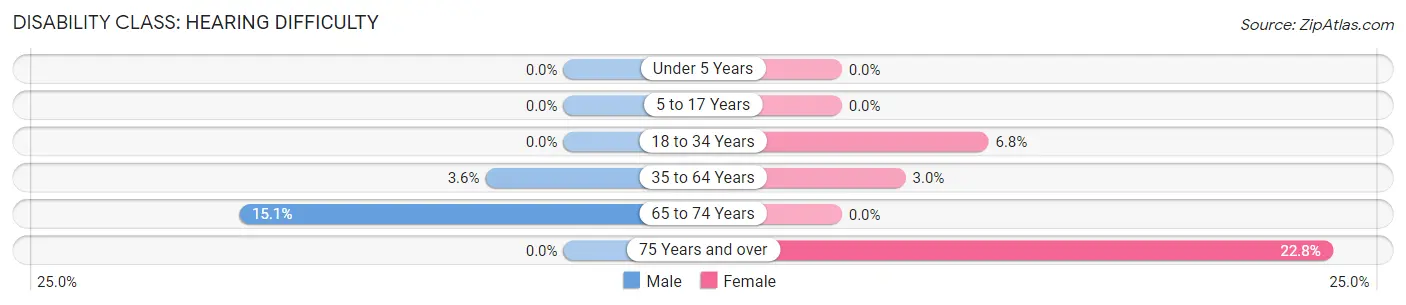
| Age Bracket | Male | Female |
| Under 5 Years | 0 (0.0%) | 0 (0.0%) |
| 5 to 17 Years | 0 (0.0%) | 0 (0.0%) |
| 18 to 34 Years | 0 (0.0%) | 31 (6.8%) |
| 35 to 64 Years | 28 (3.6%) | 19 (3.0%) |
| 65 to 74 Years | 14 (15.0%) | 0 (0.0%) |
| 75 Years and over | 0 (0.0%) | 23 (22.8%) |
Disability Class: Vision Difficulty
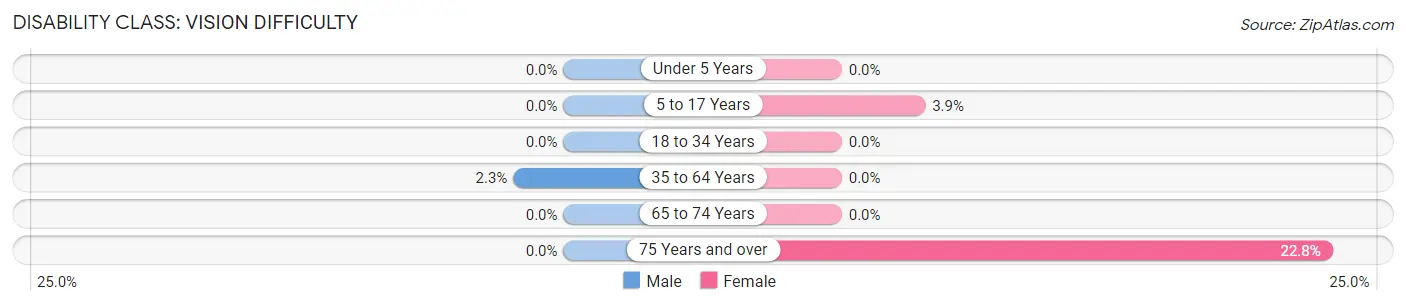
| Age Bracket | Male | Female |
| Under 5 Years | 0 (0.0%) | 0 (0.0%) |
| 5 to 17 Years | 0 (0.0%) | 15 (3.9%) |
| 18 to 34 Years | 0 (0.0%) | 0 (0.0%) |
| 35 to 64 Years | 18 (2.3%) | 0 (0.0%) |
| 65 to 74 Years | 0 (0.0%) | 0 (0.0%) |
| 75 Years and over | 0 (0.0%) | 23 (22.8%) |
Disability Class: Cognitive Difficulty
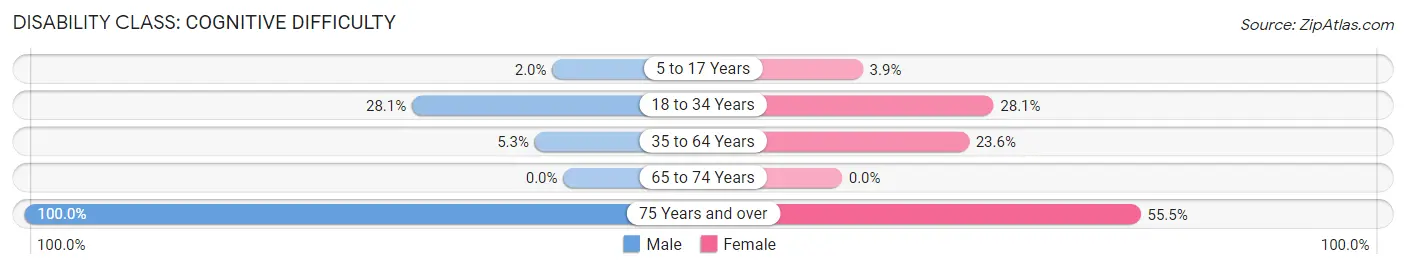
| Age Bracket | Male | Female |
| 5 to 17 Years | 8 (2.0%) | 15 (3.9%) |
| 18 to 34 Years | 107 (28.1%) | 128 (28.1%) |
| 35 to 64 Years | 41 (5.3%) | 151 (23.6%) |
| 65 to 74 Years | 0 (0.0%) | 0 (0.0%) |
| 75 Years and over | 6 (100.0%) | 56 (55.4%) |
Disability Class: Ambulatory Difficulty
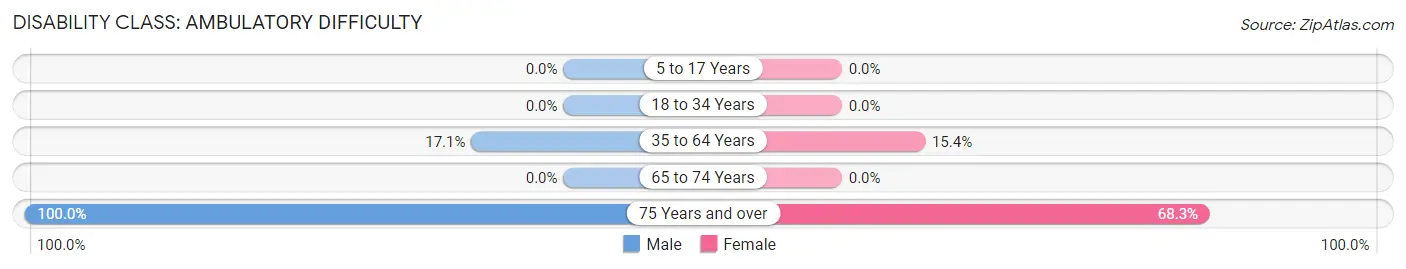
| Age Bracket | Male | Female |
| 5 to 17 Years | 0 (0.0%) | 0 (0.0%) |
| 18 to 34 Years | 0 (0.0%) | 0 (0.0%) |
| 35 to 64 Years | 132 (17.1%) | 99 (15.4%) |
| 65 to 74 Years | 0 (0.0%) | 0 (0.0%) |
| 75 Years and over | 6 (100.0%) | 69 (68.3%) |
Disability Class: Self-Care Difficulty
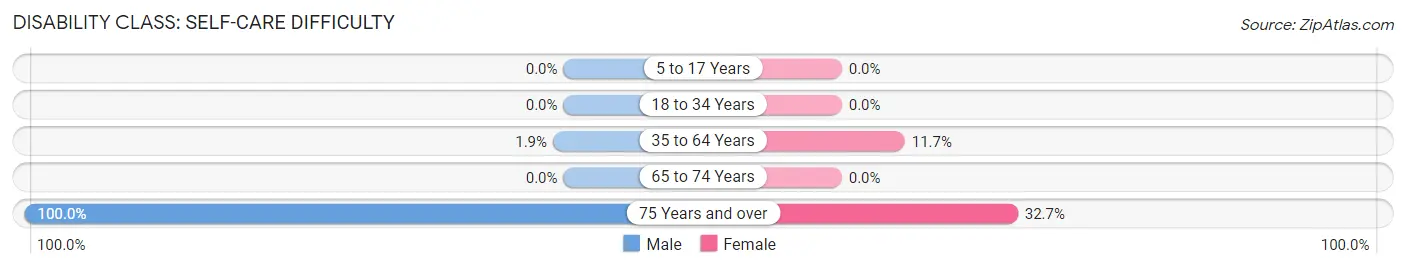
| Age Bracket | Male | Female |
| 5 to 17 Years | 0 (0.0%) | 0 (0.0%) |
| 18 to 34 Years | 0 (0.0%) | 0 (0.0%) |
| 35 to 64 Years | 15 (1.9%) | 75 (11.7%) |
| 65 to 74 Years | 0 (0.0%) | 0 (0.0%) |
| 75 Years and over | 6 (100.0%) | 33 (32.7%) |
Technology Access in Harrisburg
Computing Device Access in Harrisburg
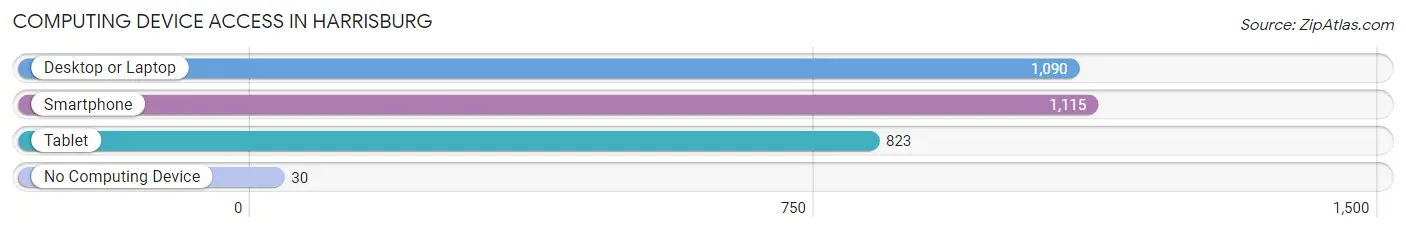
| Device Type | # Households | % Households |
| Desktop or Laptop | 1,090 | 85.8% |
| Smartphone | 1,115 | 87.7% |
| Tablet | 823 | 64.7% |
| No Computing Device | 30 | 2.4% |
| Total | 1,271 | 100.0% |
Internet Access in Harrisburg
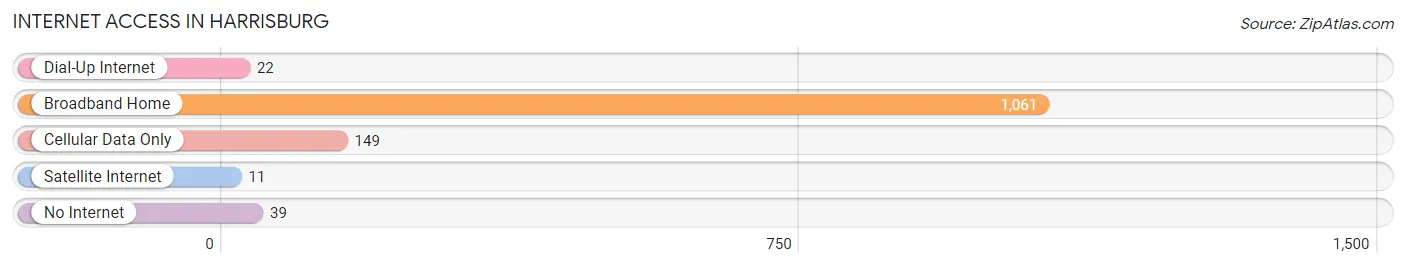
| Internet Type | # Households | % Households |
| Dial-Up Internet | 22 | 1.7% |
| Broadband Home | 1,061 | 83.5% |
| Cellular Data Only | 149 | 11.7% |
| Satellite Internet | 11 | 0.9% |
| No Internet | 39 | 3.1% |
| Total | 1,271 | 100.0% |
Harrisburg Summary
Harrisburg, Oregon is a small city located in Linn County, Oregon, United States. It is situated on the banks of the Willamette River, approximately 10 miles south of Albany and 25 miles north of Eugene. The population of Harrisburg was 1,890 at the 2010 census.
History
The area that is now Harrisburg was originally inhabited by the Kalapuya Native American tribe. The first white settlers arrived in the area in the early 1850s. The town was named after Harrisburg, Pennsylvania, the hometown of one of the first settlers.
In 1853 the first post office was established in Harrisburg The town was incorporated in 1891
Geography
Harrisburg is located at the confluence of the Willamette and Long Tom Rivers. The city has a total area of 1.2 square miles, all of which is land.
The climate in Harrisburg is mild and temperate. The average annual temperature is around 50°F (10°C). The average annual precipitation is around 40 inches (101 cm).
Economy
The economy of Harrisburg is largely based on agriculture. The city is home to several farms and ranches, as well as a number of small businesses.
The city is also home to a number of manufacturing companies, including a wood products plant, a metal fabrication plant, and a plastics plant.
Demographics
As of the 2010 census, the population of Harrisburg was 1,890. The racial makeup of the city was 94.3% White, 0.7% African American, 0.7% Native American, 0.7% Asian, 0.2% Pacific Islander, 0.7% from other races, and 2.4% from two or more races. Hispanic or Latino of any race were 3.2% of the population.
The median income for a household in Harrisburg was $41,250, and the median income for a family was $50,000. The per capita income for the city was $20,845. About 11.2% of families and 14.2% of the population were below the poverty line, including 18.2% of those under age 18 and 8.3% of those age 65 or over.
Harrisburg is served by the Harrisburg School District. The district has one elementary school, one middle school, and one high school. The city is also home to a branch of the Linn-Benton Community College.
Common Questions
What is Per Capita Income in Harrisburg?
Per Capita income in Harrisburg is $24,343.
What is the Median Family Income in Harrisburg?
Median Family Income in Harrisburg is $59,792.
What is the Median Household income in Harrisburg?
Median Household Income in Harrisburg is $51,708.
What is Income or Wage Gap in Harrisburg?
Income or Wage Gap in Harrisburg is 42.3%.
Women in Harrisburg earn 57.7 cents for every dollar earned by a man.
What is Inequality or Gini Index in Harrisburg?
Inequality or Gini Index in Harrisburg is 0.38.
What is the Total Population of Harrisburg?
Total Population of Harrisburg is 3,663.
What is the Total Male Population of Harrisburg?
Total Male Population of Harrisburg is 1,870.
What is the Total Female Population of Harrisburg?
Total Female Population of Harrisburg is 1,793.
What is the Ratio of Males per 100 Females in Harrisburg?
There are 104.29 Males per 100 Females in Harrisburg.
What is the Ratio of Females per 100 Males in Harrisburg?
There are 95.88 Females per 100 Males in Harrisburg.
What is the Median Population Age in Harrisburg?
Median Population Age in Harrisburg is 33.5 Years.
What is the Average Family Size in Harrisburg
Average Family Size in Harrisburg is 3.3 People.
What is the Average Household Size in Harrisburg
Average Household Size in Harrisburg is 2.9 People.
How Large is the Labor Force in Harrisburg?
There are 1,643 People in the Labor Forcein in Harrisburg.
What is the Percentage of People in the Labor Force in Harrisburg?
63.3% of People are in the Labor Force in Harrisburg.
What is the Unemployment Rate in Harrisburg?
Unemployment Rate in Harrisburg is 5.5%.