Government Camp, OR Map & Demographics
Government Camp Map
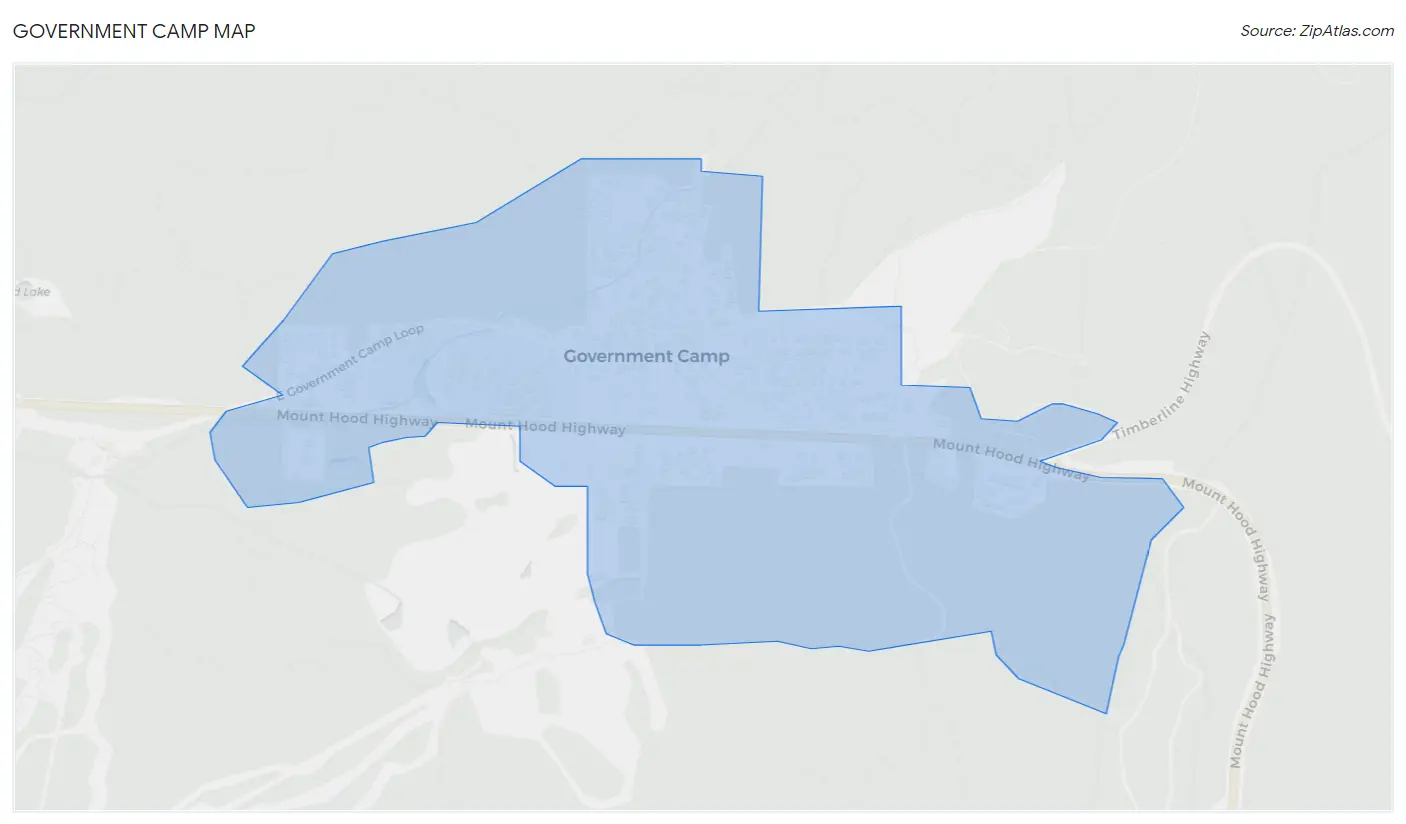
Government Camp Overview
$45,703
PER CAPITA INCOME
0.28
INEQUALITY / GINI INDEX
101
TOTAL POPULATION
66
MALE POPULATION
35
FEMALE POPULATION
188.57
MALES / 100 FEMALES
53.03
FEMALES / 100 MALES
72.1
MEDIAN AGE
1.9
AVG FAMILY SIZE
1.4
AVG HOUSEHOLD SIZE
49
LABOR FORCE [ PEOPLE ]
48.5%
PERCENT IN LABOR FORCE
4.1%
UNEMPLOYMENT RATE
Government Camp Zip Codes
Government Camp Area Codes
Income in Government Camp
Income Overview in Government Camp
| Characteristic | Number | Measure |
| Per Capita Income | 101 | $45,703 |
| Median Family Income | 25 | $0 |
| Mean Family Income | 25 | $0 |
| Median Household Income | 62 | $0 |
| Mean Household Income | 62 | $70,174 |
| Income Deficit | 25 | $0 |
| Wage / Income Gap (%) | 101 | 0.00% |
| Wage / Income Gap ($) | 101 | 100.00¢ per $1 |
| Gini / Inequality Index | 101 | 0.28 |
Earnings by Sex in Government Camp
| Sex | Number | Average Earnings |
| Male | 43 (87.8%) | $0 |
| Female | 6 (12.2%) | $0 |
| Total | 49 (100.0%) | $0 |
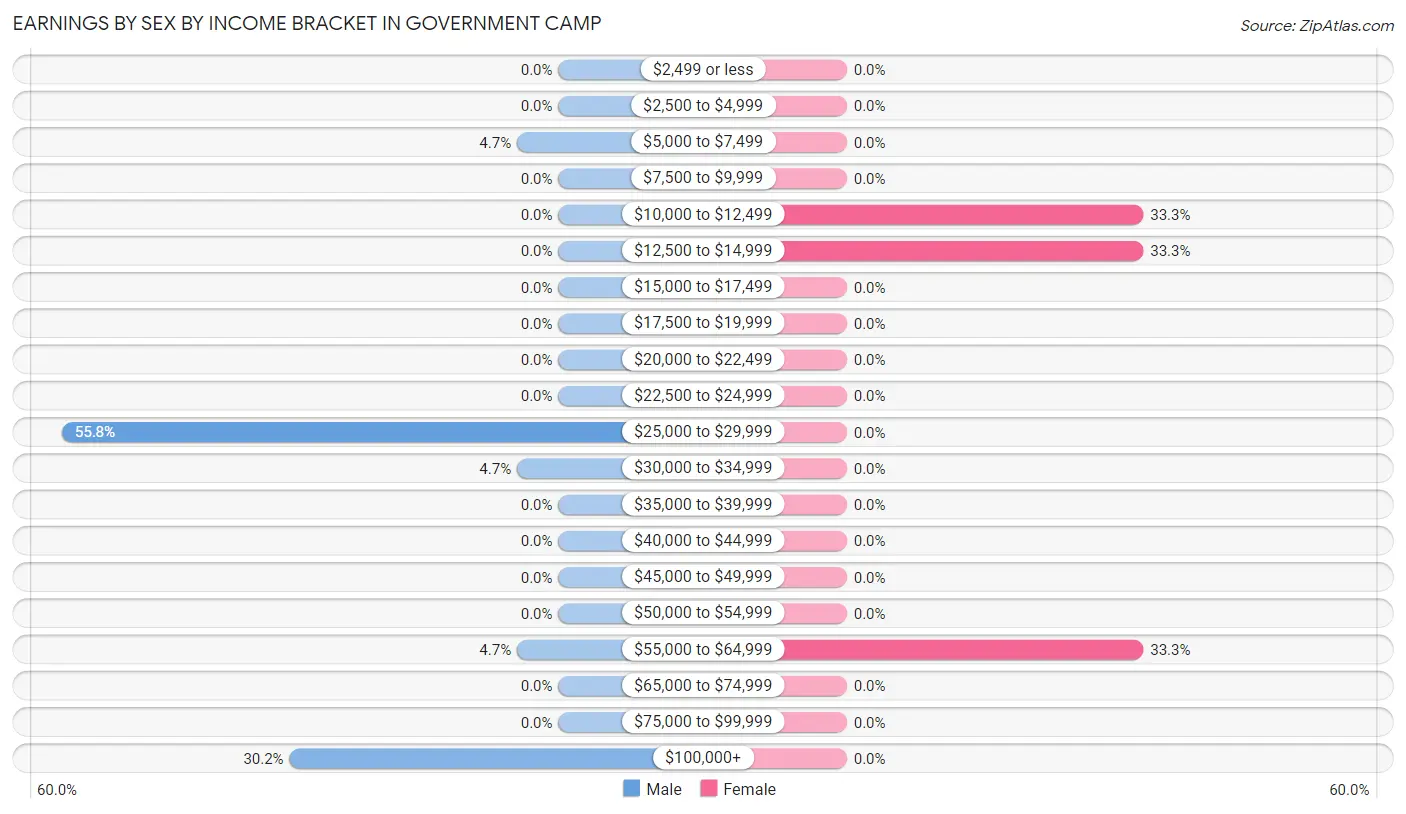
Earnings by Sex by Income Bracket in Government Camp
The most common earnings brackets in Government Camp are $25,000 to $29,999 for men (24 | 55.8%) and $10,000 to $12,499 for women (2 | 33.3%).
| Income | Male | Female |
| $2,499 or less | 0 (0.0%) | 0 (0.0%) |
| $2,500 to $4,999 | 0 (0.0%) | 0 (0.0%) |
| $5,000 to $7,499 | 2 (4.6%) | 0 (0.0%) |
| $7,500 to $9,999 | 0 (0.0%) | 0 (0.0%) |
| $10,000 to $12,499 | 0 (0.0%) | 2 (33.3%) |
| $12,500 to $14,999 | 0 (0.0%) | 2 (33.3%) |
| $15,000 to $17,499 | 0 (0.0%) | 0 (0.0%) |
| $17,500 to $19,999 | 0 (0.0%) | 0 (0.0%) |
| $20,000 to $22,499 | 0 (0.0%) | 0 (0.0%) |
| $22,500 to $24,999 | 0 (0.0%) | 0 (0.0%) |
| $25,000 to $29,999 | 24 (55.8%) | 0 (0.0%) |
| $30,000 to $34,999 | 2 (4.6%) | 0 (0.0%) |
| $35,000 to $39,999 | 0 (0.0%) | 0 (0.0%) |
| $40,000 to $44,999 | 0 (0.0%) | 0 (0.0%) |
| $45,000 to $49,999 | 0 (0.0%) | 0 (0.0%) |
| $50,000 to $54,999 | 0 (0.0%) | 0 (0.0%) |
| $55,000 to $64,999 | 2 (4.6%) | 2 (33.3%) |
| $65,000 to $74,999 | 0 (0.0%) | 0 (0.0%) |
| $75,000 to $99,999 | 0 (0.0%) | 0 (0.0%) |
| $100,000+ | 13 (30.2%) | 0 (0.0%) |
| Total | 43 (100.0%) | 6 (100.0%) |
Earnings by Sex by Educational Attainment in Government Camp
| Educational Attainment | Male Income | Female Income |
| Less than High School | - | - |
| High School Diploma | - | - |
| College or Associate's Degree | - | - |
| Bachelor's Degree | - | - |
| Graduate Degree | - | - |
| Total | - | - |
Family Income in Government Camp
Family Income Brackets in Government Camp
According to the Government Camp family income data, there are 25 families falling into the $75,000 to $99,999 income range, which is the most common income bracket and makes up 100.0% of all families.
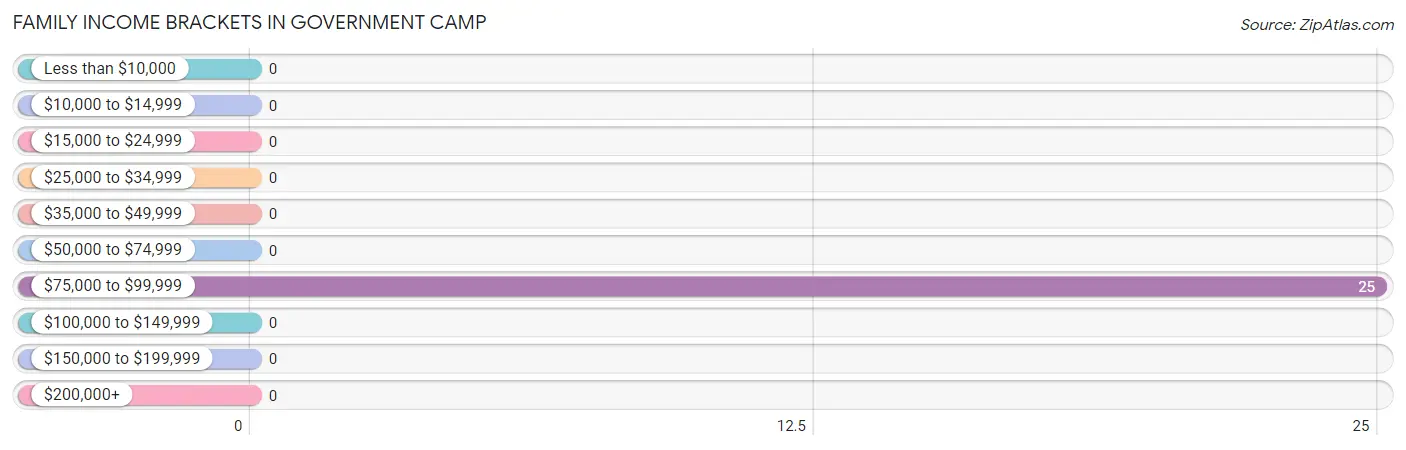
| Income Bracket | # Families | % Families |
| Less than $10,000 | 0 | 0.0% |
| $10,000 to $14,999 | 0 | 0.0% |
| $15,000 to $24,999 | 0 | 0.0% |
| $25,000 to $34,999 | 0 | 0.0% |
| $35,000 to $49,999 | 0 | 0.0% |
| $50,000 to $74,999 | 0 | 0.0% |
| $75,000 to $99,999 | 25 | 100.0% |
| $100,000 to $149,999 | 0 | 0.0% |
| $150,000 to $199,999 | 0 | 0.0% |
| $200,000+ | 0 | 0.0% |
Family Income by Famaliy Size in Government Camp
| Income Bracket | # Families | Median Income |
| 2-Person Families | 25 (100.0%) | $0 |
| 3-Person Families | 0 (0.0%) | $0 |
| 4-Person Families | 0 (0.0%) | $0 |
| 5-Person Families | 0 (0.0%) | $0 |
| 6-Person Families | 0 (0.0%) | $0 |
| 7+ Person Families | 0 (0.0%) | $0 |
| Total | 25 (100.0%) | $0 |
Family Income by Number of Earners in Government Camp
| Number of Earners | # Families | Median Income |
| No Earners | 25 (100.0%) | $0 |
| 1 Earner | 0 (0.0%) | $0 |
| 2 Earners | 0 (0.0%) | $0 |
| 3+ Earners | 0 (0.0%) | $0 |
| Total | 25 (100.0%) | $0 |
Household Income in Government Camp
Household Income Brackets in Government Camp
With 25 households falling in the category, the $75,000 to $99,999 income range is the most frequent in Government Camp, accounting for 40.3% of all households.
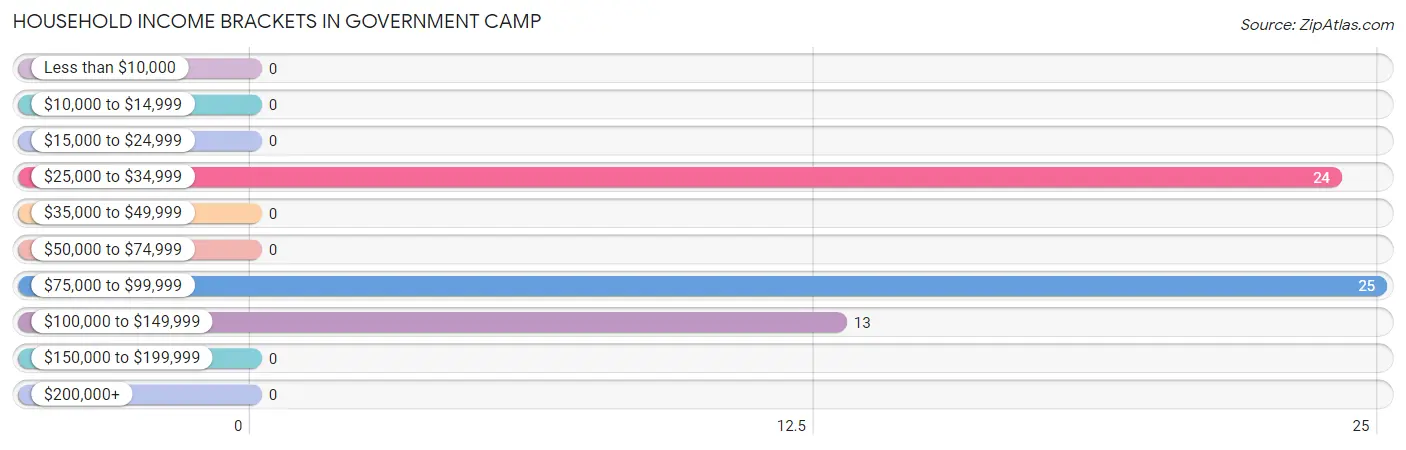
| Income Bracket | # Households | % Households |
| Less than $10,000 | 0 | 0.0% |
| $10,000 to $14,999 | 0 | 0.0% |
| $15,000 to $24,999 | 0 | 0.0% |
| $25,000 to $34,999 | 24 | 38.7% |
| $35,000 to $49,999 | 0 | 0.0% |
| $50,000 to $74,999 | 0 | 0.0% |
| $75,000 to $99,999 | 25 | 40.3% |
| $100,000 to $149,999 | 13 | 21.0% |
| $150,000 to $199,999 | 0 | 0.0% |
| $200,000+ | 0 | 0.0% |
Household Income by Householder Age in Government Camp
| Income Bracket | # Households | Median Income |
| 15 to 24 Years | 0 (0.0%) | $0 |
| 25 to 44 Years | 24 (38.7%) | $0 |
| 45 to 64 Years | 13 (21.0%) | $0 |
| 65+ Years | 25 (40.3%) | $0 |
| Total | 62 (100.0%) | $0 |
Poverty in Government Camp
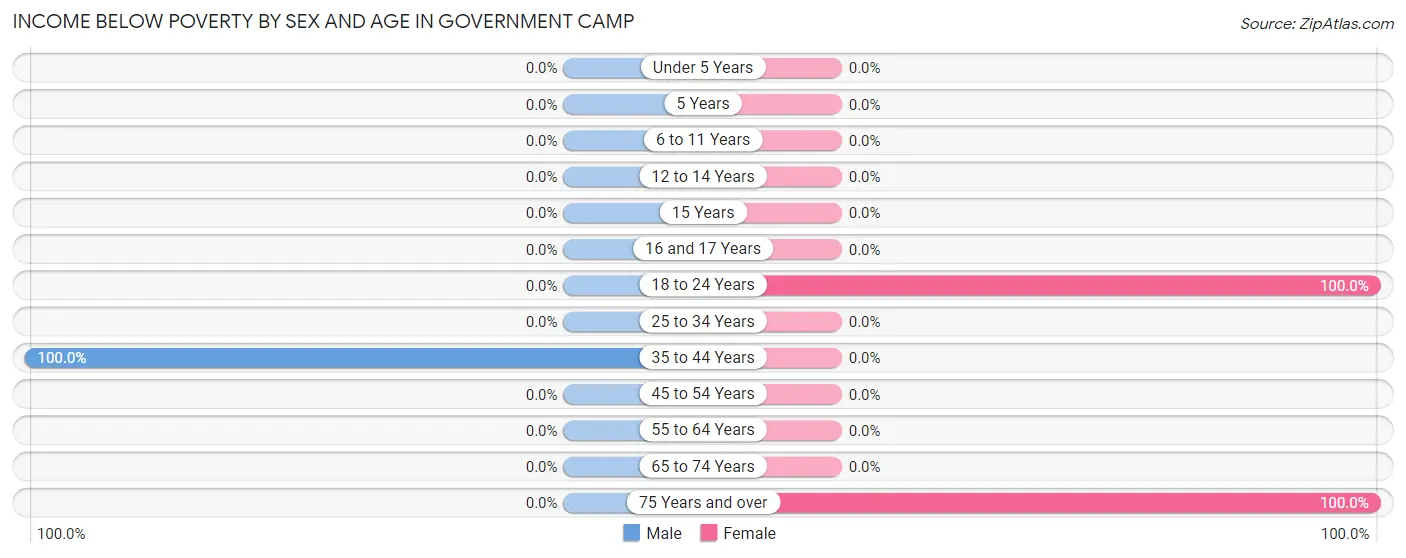
Income Below Poverty by Sex and Age in Government Camp
With 3.0% poverty level for males and 22.9% for females among the residents of Government Camp, 35 to 44 year old males and 18 to 24 year old females are the most vulnerable to poverty, with 2 males (100.0%) and 4 females (100.0%) in their respective age groups living below the poverty level.
| Age Bracket | Male | Female |
| Under 5 Years | 0 (0.0%) | 0 (0.0%) |
| 5 Years | 0 (0.0%) | 0 (0.0%) |
| 6 to 11 Years | 0 (0.0%) | 0 (0.0%) |
| 12 to 14 Years | 0 (0.0%) | 0 (0.0%) |
| 15 Years | 0 (0.0%) | 0 (0.0%) |
| 16 and 17 Years | 0 (0.0%) | 0 (0.0%) |
| 18 to 24 Years | 0 (0.0%) | 4 (100.0%) |
| 25 to 34 Years | 0 (0.0%) | 0 (0.0%) |
| 35 to 44 Years | 2 (100.0%) | 0 (0.0%) |
| 45 to 54 Years | 0 (0.0%) | 0 (0.0%) |
| 55 to 64 Years | 0 (0.0%) | 0 (0.0%) |
| 65 to 74 Years | 0 (0.0%) | 0 (0.0%) |
| 75 Years and over | 0 (0.0%) | 4 (100.0%) |
| Total | 2 (3.0%) | 8 (22.9%) |
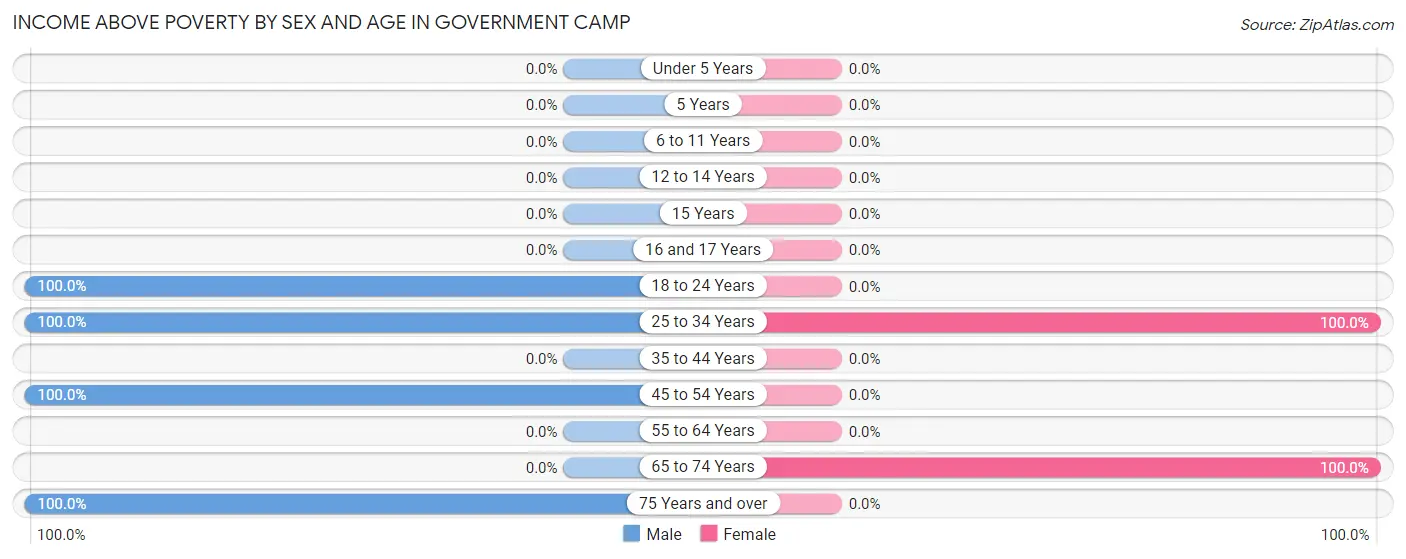
Income Above Poverty by Sex and Age in Government Camp
According to the poverty statistics in Government Camp, males aged 18 to 24 years and females aged 25 to 34 years are the age groups that are most secure financially, with 100.0% of males and 100.0% of females in these age groups living above the poverty line.
| Age Bracket | Male | Female |
| Under 5 Years | 0 (0.0%) | 0 (0.0%) |
| 5 Years | 0 (0.0%) | 0 (0.0%) |
| 6 to 11 Years | 0 (0.0%) | 0 (0.0%) |
| 12 to 14 Years | 0 (0.0%) | 0 (0.0%) |
| 15 Years | 0 (0.0%) | 0 (0.0%) |
| 16 and 17 Years | 0 (0.0%) | 0 (0.0%) |
| 18 to 24 Years | 4 (100.0%) | 0 (0.0%) |
| 25 to 34 Years | 24 (100.0%) | 2 (100.0%) |
| 35 to 44 Years | 0 (0.0%) | 0 (0.0%) |
| 45 to 54 Years | 13 (100.0%) | 0 (0.0%) |
| 55 to 64 Years | 0 (0.0%) | 0 (0.0%) |
| 65 to 74 Years | 0 (0.0%) | 25 (100.0%) |
| 75 Years and over | 23 (100.0%) | 0 (0.0%) |
| Total | 64 (97.0%) | 27 (77.1%) |
Income Below Poverty Among Married-Couple Families in Government Camp
| Children | Above Poverty | Below Poverty |
| No Children | 25 (100.0%) | 0 (0.0%) |
| 1 or 2 Children | 0 (0.0%) | 0 (0.0%) |
| 3 or 4 Children | 0 (0.0%) | 0 (0.0%) |
| 5 or more Children | 0 (0.0%) | 0 (0.0%) |
| Total | 25 (100.0%) | 0 (0.0%) |
Income Below Poverty Among Single-Parent Households in Government Camp
| Children | Single Father | Single Mother |
| No Children | 0 (0.0%) | 0 (0.0%) |
| 1 or 2 Children | 0 (0.0%) | 0 (0.0%) |
| 3 or 4 Children | 0 (0.0%) | 0 (0.0%) |
| 5 or more Children | 0 (0.0%) | 0 (0.0%) |
| Total | 0 (0.0%) | 0 (0.0%) |
Income Below Poverty Among Married-Couple vs Single-Parent Households in Government Camp
| Children | Married-Couple Families | Single-Parent Households |
| No Children | 0 (0.0%) | 0 (0.0%) |
| 1 or 2 Children | 0 (0.0%) | 0 (0.0%) |
| 3 or 4 Children | 0 (0.0%) | 0 (0.0%) |
| 5 or more Children | 0 (0.0%) | 0 (0.0%) |
| Total | 0 (0.0%) | 0 (0.0%) |
Race in Government Camp
The most populous races in Government Camp are White / Caucasian (95 | 94.1%), Hispanic or Latino (4 | 4.0%), and Two or more Races (4 | 4.0%).
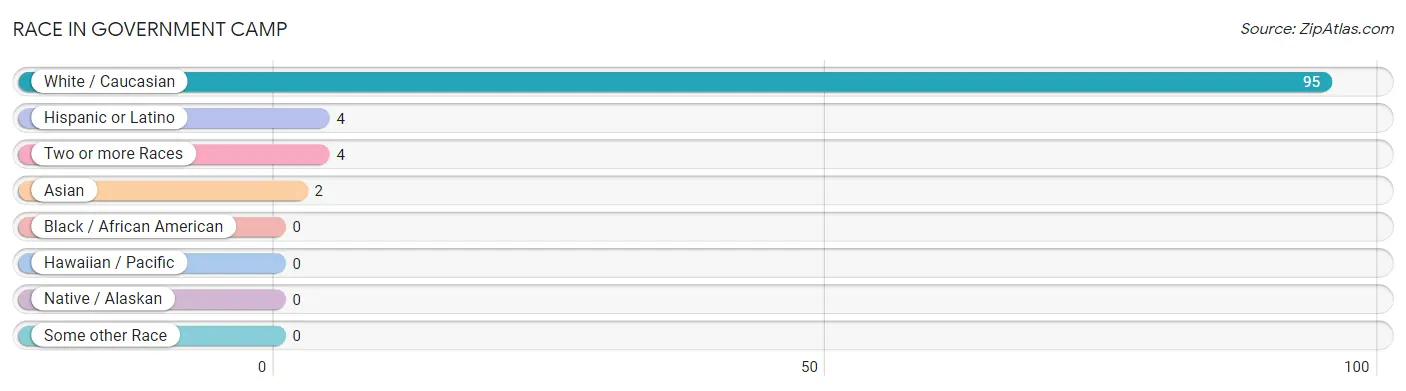
| Race | # Population | % Population |
| Asian | 2 | 2.0% |
| Black / African American | 0 | 0.0% |
| Hawaiian / Pacific | 0 | 0.0% |
| Hispanic or Latino | 4 | 4.0% |
| Native / Alaskan | 0 | 0.0% |
| White / Caucasian | 95 | 94.1% |
| Two or more Races | 4 | 4.0% |
| Some other Race | 0 | 0.0% |
| Total | 101 | 100.0% |
Ancestry in Government Camp
The most populous ancestries reported in Government Camp are German (29 | 28.7%), Dutch (25 | 24.7%), Scottish (25 | 24.7%), American (13 | 12.9%), and Hungarian (13 | 12.9%), together accounting for 104.0% of all Government Camp residents.
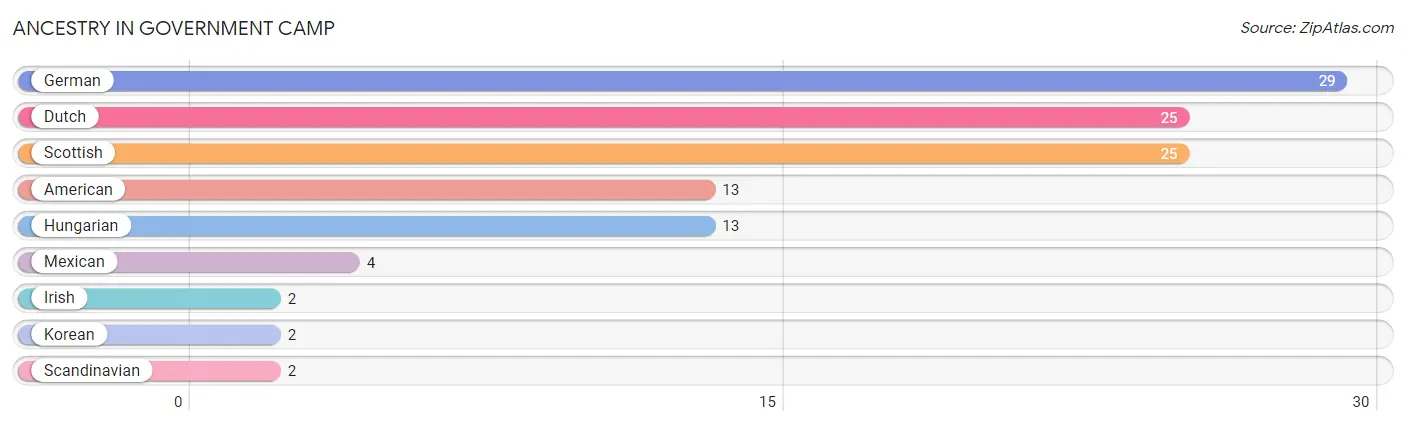
| Ancestry | # Population | % Population |
| American | 13 | 12.9% |
| Dutch | 25 | 24.7% |
| German | 29 | 28.7% |
| Hungarian | 13 | 12.9% |
| Irish | 2 | 2.0% |
| Korean | 2 | 2.0% |
| Mexican | 4 | 4.0% |
| Scandinavian | 2 | 2.0% |
| Scottish | 25 | 24.7% | View All 9 Rows |
Immigrants in Government Camp

| Immigration Origin | # Population | % Population | View All 0 Rows |
Sex and Age in Government Camp
Sex and Age in Government Camp
The most populous age groups in Government Camp are 25 to 29 Years (24 | 36.4%) for men and 70 to 74 Years (25 | 71.4%) for women.
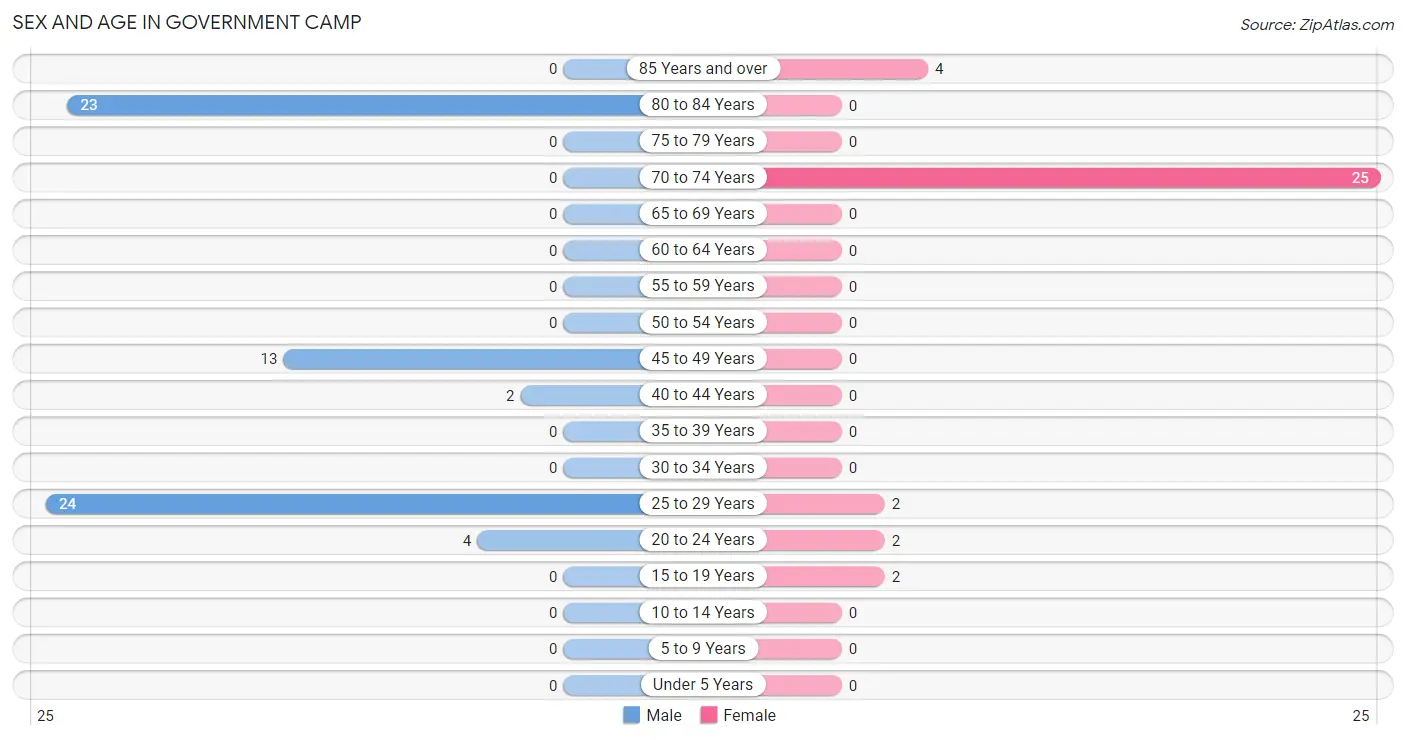
| Age Bracket | Male | Female |
| Under 5 Years | 0 (0.0%) | 0 (0.0%) |
| 5 to 9 Years | 0 (0.0%) | 0 (0.0%) |
| 10 to 14 Years | 0 (0.0%) | 0 (0.0%) |
| 15 to 19 Years | 0 (0.0%) | 2 (5.7%) |
| 20 to 24 Years | 4 (6.1%) | 2 (5.7%) |
| 25 to 29 Years | 24 (36.4%) | 2 (5.7%) |
| 30 to 34 Years | 0 (0.0%) | 0 (0.0%) |
| 35 to 39 Years | 0 (0.0%) | 0 (0.0%) |
| 40 to 44 Years | 2 (3.0%) | 0 (0.0%) |
| 45 to 49 Years | 13 (19.7%) | 0 (0.0%) |
| 50 to 54 Years | 0 (0.0%) | 0 (0.0%) |
| 55 to 59 Years | 0 (0.0%) | 0 (0.0%) |
| 60 to 64 Years | 0 (0.0%) | 0 (0.0%) |
| 65 to 69 Years | 0 (0.0%) | 0 (0.0%) |
| 70 to 74 Years | 0 (0.0%) | 25 (71.4%) |
| 75 to 79 Years | 0 (0.0%) | 0 (0.0%) |
| 80 to 84 Years | 23 (34.8%) | 0 (0.0%) |
| 85 Years and over | 0 (0.0%) | 4 (11.4%) |
| Total | 66 (100.0%) | 35 (100.0%) |
Families and Households in Government Camp
Median Family Size in Government Camp
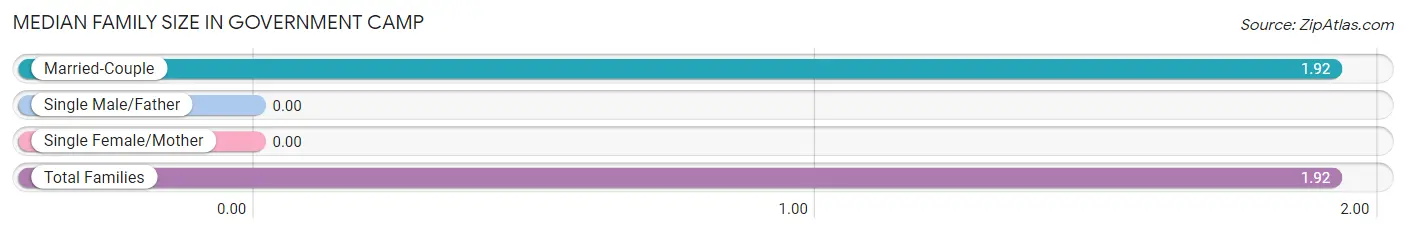
| Family Type | # Families | Family Size |
| Married-Couple | 25 (100.0%) | 1.92 |
| Single Male/Father | 0 (0.0%) | - |
| Single Female/Mother | 0 (0.0%) | - |
| Total Families | 25 (100.0%) | 1.92 |
Median Household Size in Government Camp
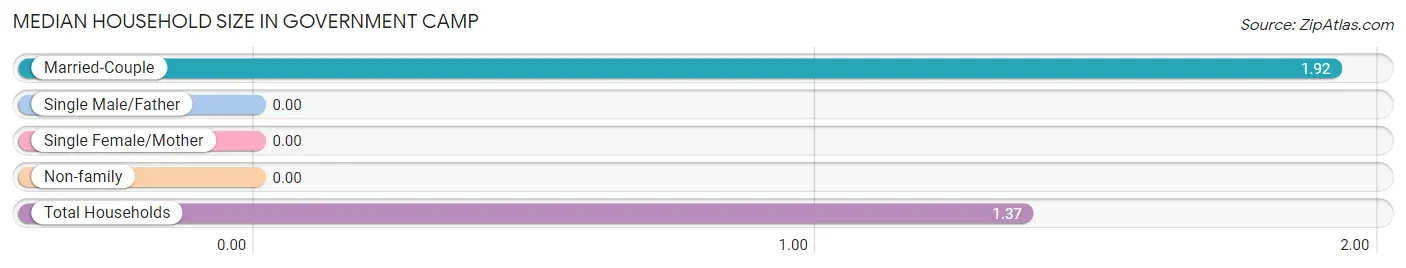
| Household Type | # Households | Household Size |
| Married-Couple | 25 (40.3%) | 1.92 |
| Single Male/Father | 0 (0.0%) | - |
| Single Female/Mother | 0 (0.0%) | - |
| Non-family | 37 (59.7%) | - |
| Total Households | 62 (100.0%) | 1.37 |
Household Size by Marriage Status in Government Camp
Out of a total of 62 households in Government Camp, 25 (40.3%) are family households, while 37 (59.7%) are nonfamily households. The most numerous type of family households are 2-person households, comprising 25, and the most common type of nonfamily households are 1-person households, comprising 37.
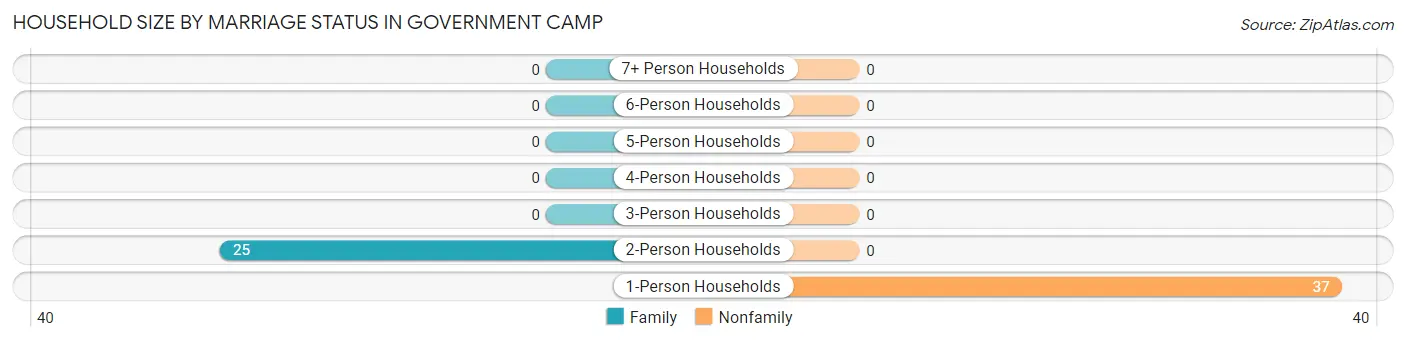
| Household Size | Family Households | Nonfamily Households |
| 1-Person Households | - | 37 (59.7%) |
| 2-Person Households | 25 (40.3%) | 0 (0.0%) |
| 3-Person Households | 0 (0.0%) | 0 (0.0%) |
| 4-Person Households | 0 (0.0%) | 0 (0.0%) |
| 5-Person Households | 0 (0.0%) | 0 (0.0%) |
| 6-Person Households | 0 (0.0%) | 0 (0.0%) |
| 7+ Person Households | 0 (0.0%) | 0 (0.0%) |
| Total | 25 (40.3%) | 37 (59.7%) |
Female Fertility in Government Camp
Fertility by Age in Government Camp
| Age Bracket | Women with Births | Births / 1,000 Women |
| 15 to 19 years | 0 (0.0%) | 0.0 |
| 20 to 34 years | 0 (0.0%) | 0.0 |
| 35 to 50 years | 0 (0.0%) | 0.0 |
| Total | 0 (0.0%) | 0.0 |
Fertility by Age by Marriage Status in Government Camp
| Age Bracket | Married | Unmarried |
| 15 to 19 years | 0 (0.0%) | 0 (0.0%) |
| 20 to 34 years | 0 (0.0%) | 0 (0.0%) |
| 35 to 50 years | 0 (0.0%) | 0 (0.0%) |
| Total | 0 (0.0%) | 0 (0.0%) |
Fertility by Education in Government Camp
| Educational Attainment | Women with Births | Births / 1,000 Women |
| Less than High School | 0 (0.0%) | 0.0 |
| High School Diploma | 0 (0.0%) | 0.0 |
| College or Associate's Degree | 0 (0.0%) | 0.0 |
| Bachelor's Degree | 0 (0.0%) | 0.0 |
| Graduate Degree | 0 (0.0%) | 0.0 |
| Total | 0 (0.0%) | 0.0 |
Fertility by Education by Marriage Status in Government Camp
| Educational Attainment | Married | Unmarried |
| Less than High School | 0 (0.0%) | 0 (0.0%) |
| High School Diploma | 0 (0.0%) | 0 (0.0%) |
| College or Associate's Degree | 0 (0.0%) | 0 (0.0%) |
| Bachelor's Degree | 0 (0.0%) | 0 (0.0%) |
| Graduate Degree | 0 (0.0%) | 0 (0.0%) |
| Total | 0 (0.0%) | 0 (0.0%) |
Employment Characteristics in Government Camp
Employment by Class of Employer in Government Camp
Among the 47 employed individuals in Government Camp, , and private company employees (47 | 100.0%) make up the most common classes of employment.
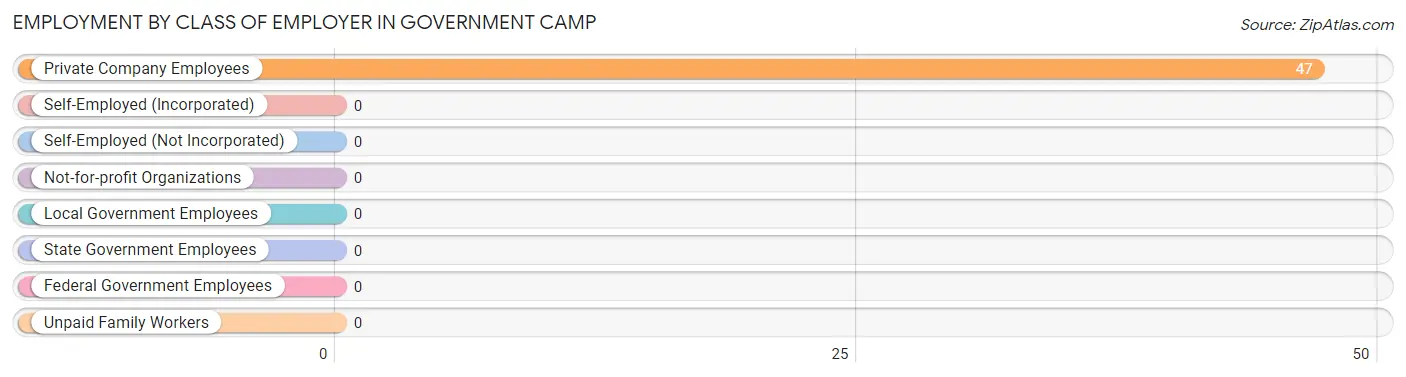
| Employer Class | # Employees | % Employees |
| Private Company Employees | 47 | 100.0% |
| Self-Employed (Incorporated) | 0 | 0.0% |
| Self-Employed (Not Incorporated) | 0 | 0.0% |
| Not-for-profit Organizations | 0 | 0.0% |
| Local Government Employees | 0 | 0.0% |
| State Government Employees | 0 | 0.0% |
| Federal Government Employees | 0 | 0.0% |
| Unpaid Family Workers | 0 | 0.0% |
| Total | 47 | 100.0% |
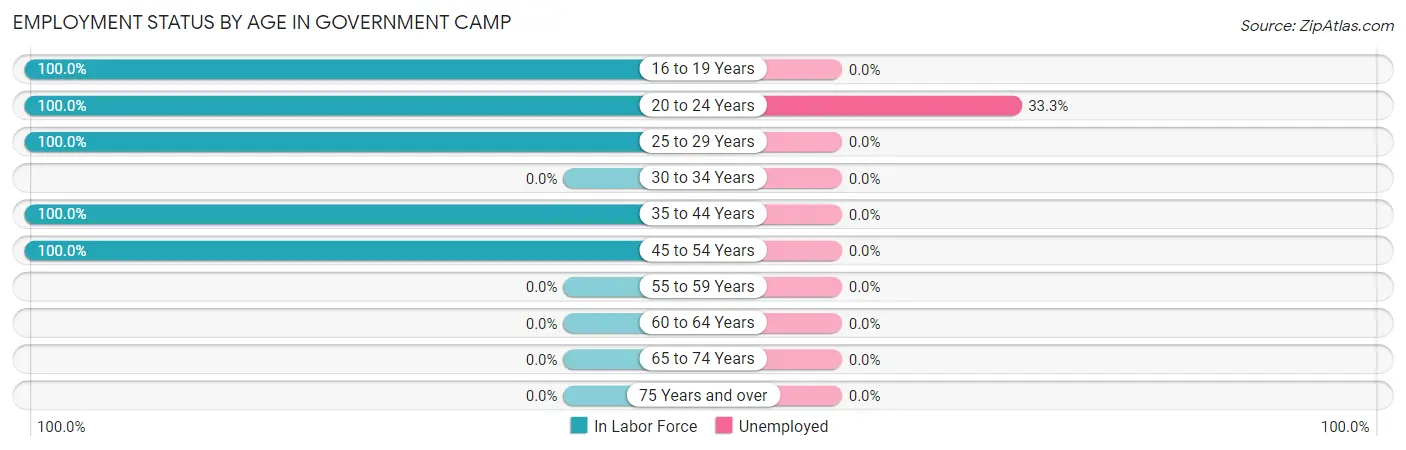
Employment Status by Age in Government Camp
According to the labor force statistics for Government Camp, out of the total population over 16 years of age (101), 48.5% or 49 individuals are in the labor force, with 4.1% or 2 of them unemployed. The age group with the highest labor force participation rate is 16 to 19 years, with 100.0% or 2 individuals in the labor force. Within the labor force, the 20 to 24 years age range has the highest percentage of unemployed individuals, with 33.3% or 2 of them being unemployed.
| Age Bracket | In Labor Force | Unemployed |
| 16 to 19 Years | 2 (100.0%) | 0 (0.0%) |
| 20 to 24 Years | 6 (100.0%) | 2 (33.3%) |
| 25 to 29 Years | 26 (100.0%) | 0 (0.0%) |
| 30 to 34 Years | 0 (0.0%) | 0 (0.0%) |
| 35 to 44 Years | 2 (100.0%) | 0 (0.0%) |
| 45 to 54 Years | 13 (100.0%) | 0 (0.0%) |
| 55 to 59 Years | 0 (0.0%) | 0 (0.0%) |
| 60 to 64 Years | 0 (0.0%) | 0 (0.0%) |
| 65 to 74 Years | 0 (0.0%) | 0 (0.0%) |
| 75 Years and over | 0 (0.0%) | 0 (0.0%) |
| Total | 49 (48.5%) | 2 (4.1%) |
Employment Status by Educational Attainment in Government Camp
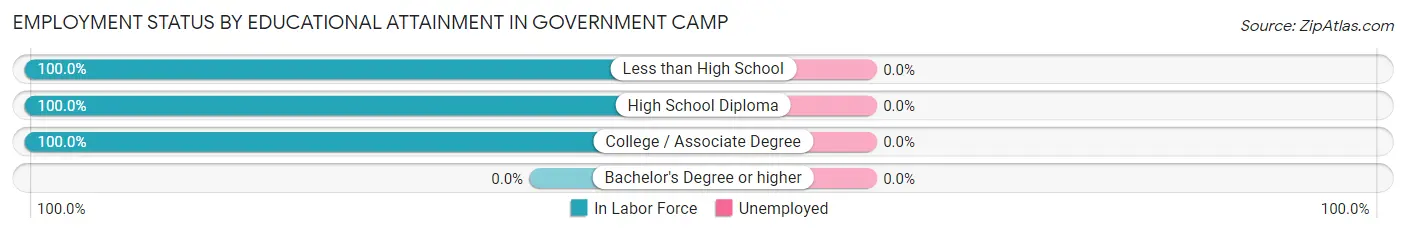
| Educational Attainment | In Labor Force | Unemployed |
| Less than High School | 2 (100.0%) | 0 (0.0%) |
| High School Diploma | 24 (100.0%) | 0 (0.0%) |
| College / Associate Degree | 15 (100.0%) | 0 (0.0%) |
| Bachelor's Degree or higher | 0 (0.0%) | 0 (0.0%) |
| Total | 41 (100.0%) | 0 (0.0%) |
Employment Occupations by Sex in Government Camp
Management, Business, Science and Arts Occupations
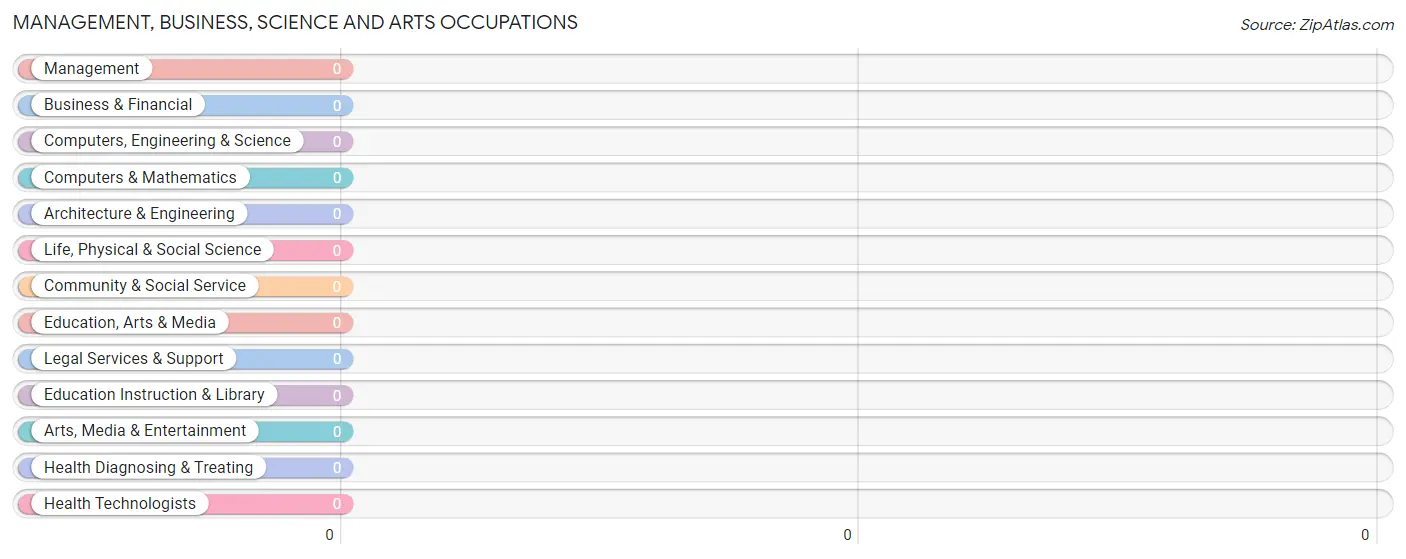
Management, Business, Science and Arts Occupations by Sex
| Occupation | Male | Female |
| Management | 0 (0.0%) | 0 (0.0%) |
| Business & Financial | 0 (0.0%) | 0 (0.0%) |
| Computers, Engineering & Science | 0 (0.0%) | 0 (0.0%) |
| Computers & Mathematics | 0 (0.0%) | 0 (0.0%) |
| Architecture & Engineering | 0 (0.0%) | 0 (0.0%) |
| Life, Physical & Social Science | 0 (0.0%) | 0 (0.0%) |
| Community & Social Service | 0 (0.0%) | 0 (0.0%) |
| Education, Arts & Media | 0 (0.0%) | 0 (0.0%) |
| Legal Services & Support | 0 (0.0%) | 0 (0.0%) |
| Education Instruction & Library | 0 (0.0%) | 0 (0.0%) |
| Arts, Media & Entertainment | 0 (0.0%) | 0 (0.0%) |
| Health Diagnosing & Treating | 0 (0.0%) | 0 (0.0%) |
| Health Technologists | 0 (0.0%) | 0 (0.0%) |
| Total (Category) | 0 (0.0%) | 0 (0.0%) |
| Total (Overall) | 41 (87.2%) | 6 (12.8%) |
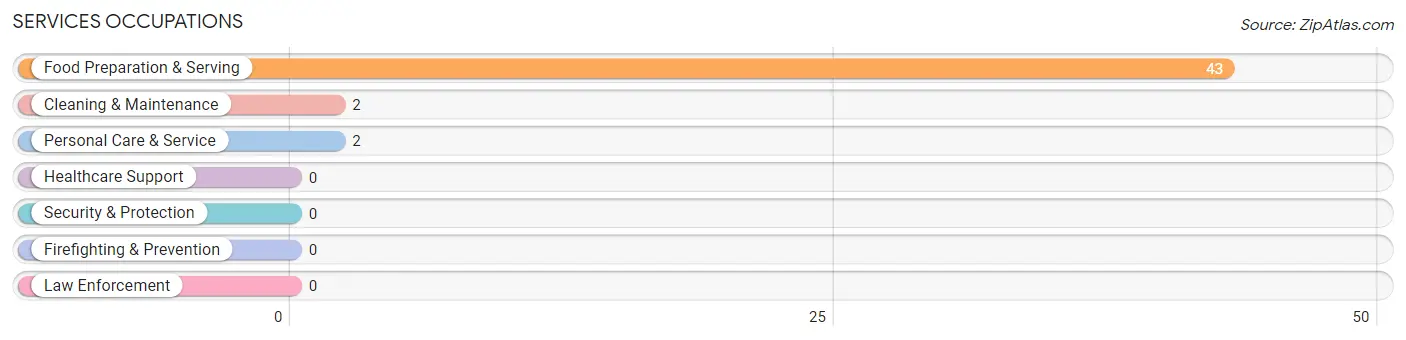
Services Occupations
The most common Services occupations in Government Camp are Food Preparation & Serving (43 | 91.5%), Cleaning & Maintenance (2 | 4.3%), and Personal Care & Service (2 | 4.3%).
Services Occupations by Sex
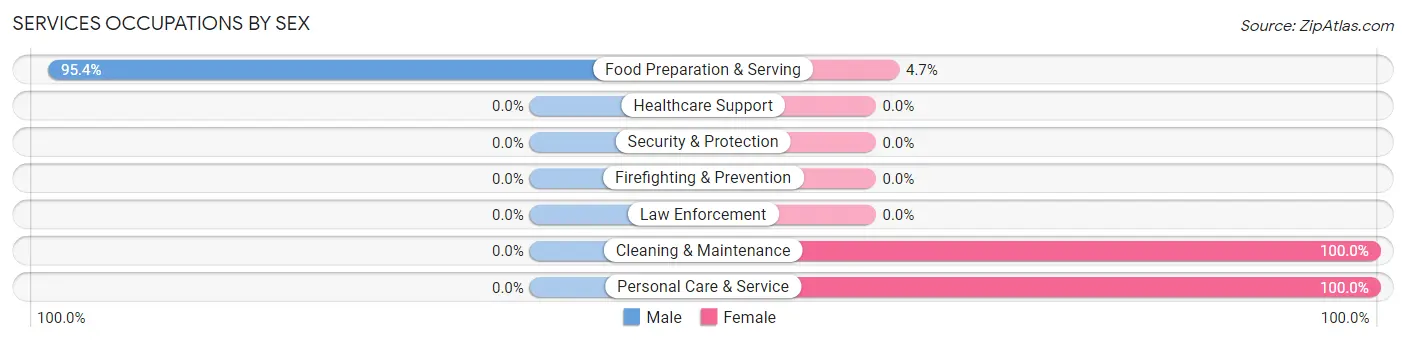
| Occupation | Male | Female |
| Healthcare Support | 0 (0.0%) | 0 (0.0%) |
| Security & Protection | 0 (0.0%) | 0 (0.0%) |
| Firefighting & Prevention | 0 (0.0%) | 0 (0.0%) |
| Law Enforcement | 0 (0.0%) | 0 (0.0%) |
| Food Preparation & Serving | 41 (95.4%) | 2 (4.6%) |
| Cleaning & Maintenance | 0 (0.0%) | 2 (100.0%) |
| Personal Care & Service | 0 (0.0%) | 2 (100.0%) |
| Total (Category) | 41 (87.2%) | 6 (12.8%) |
| Total (Overall) | 41 (87.2%) | 6 (12.8%) |
Sales and Office Occupations
Sales and Office Occupations by Sex
| Occupation | Male | Female |
| Sales & Related | 0 (0.0%) | 0 (0.0%) |
| Office & Administration | 0 (0.0%) | 0 (0.0%) |
| Total (Category) | 0 (0.0%) | 0 (0.0%) |
| Total (Overall) | 41 (87.2%) | 6 (12.8%) |
Natural Resources, Construction and Maintenance Occupations
Natural Resources, Construction and Maintenance Occupations by Sex
| Occupation | Male | Female |
| Farming, Fishing & Forestry | 0 (0.0%) | 0 (0.0%) |
| Construction & Extraction | 0 (0.0%) | 0 (0.0%) |
| Installation, Maintenance & Repair | 0 (0.0%) | 0 (0.0%) |
| Total (Category) | 0 (0.0%) | 0 (0.0%) |
| Total (Overall) | 41 (87.2%) | 6 (12.8%) |
Production, Transportation and Moving Occupations
Production, Transportation and Moving Occupations by Sex
| Occupation | Male | Female |
| Production | 0 (0.0%) | 0 (0.0%) |
| Transportation | 0 (0.0%) | 0 (0.0%) |
| Material Moving | 0 (0.0%) | 0 (0.0%) |
| Total (Category) | 0 (0.0%) | 0 (0.0%) |
| Total (Overall) | 41 (87.2%) | 6 (12.8%) |
Employment Industries by Sex in Government Camp
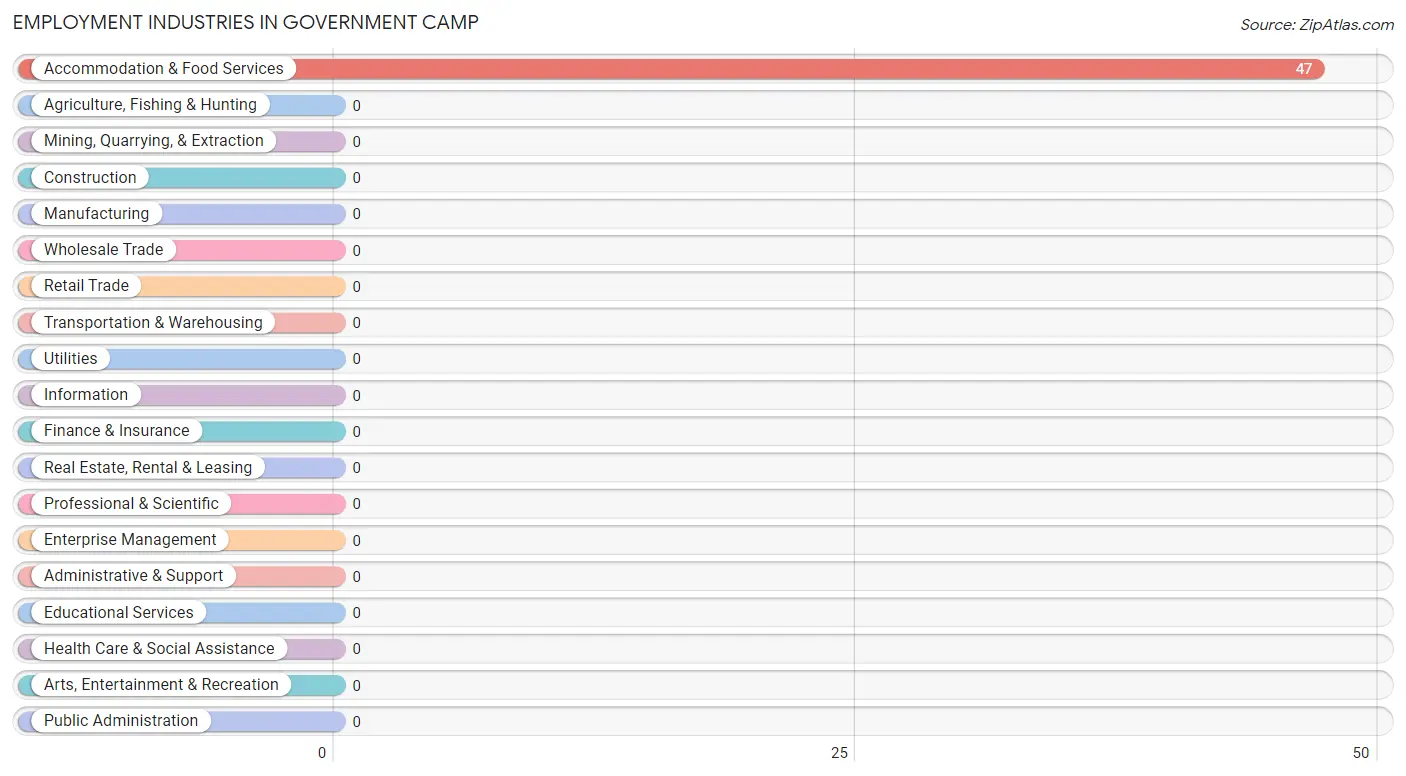
Employment Industries in Government Camp
The major employment industries in Government Camp include , and Accommodation & Food Services (47 | 100.0%).
Employment Industries by Sex in Government Camp
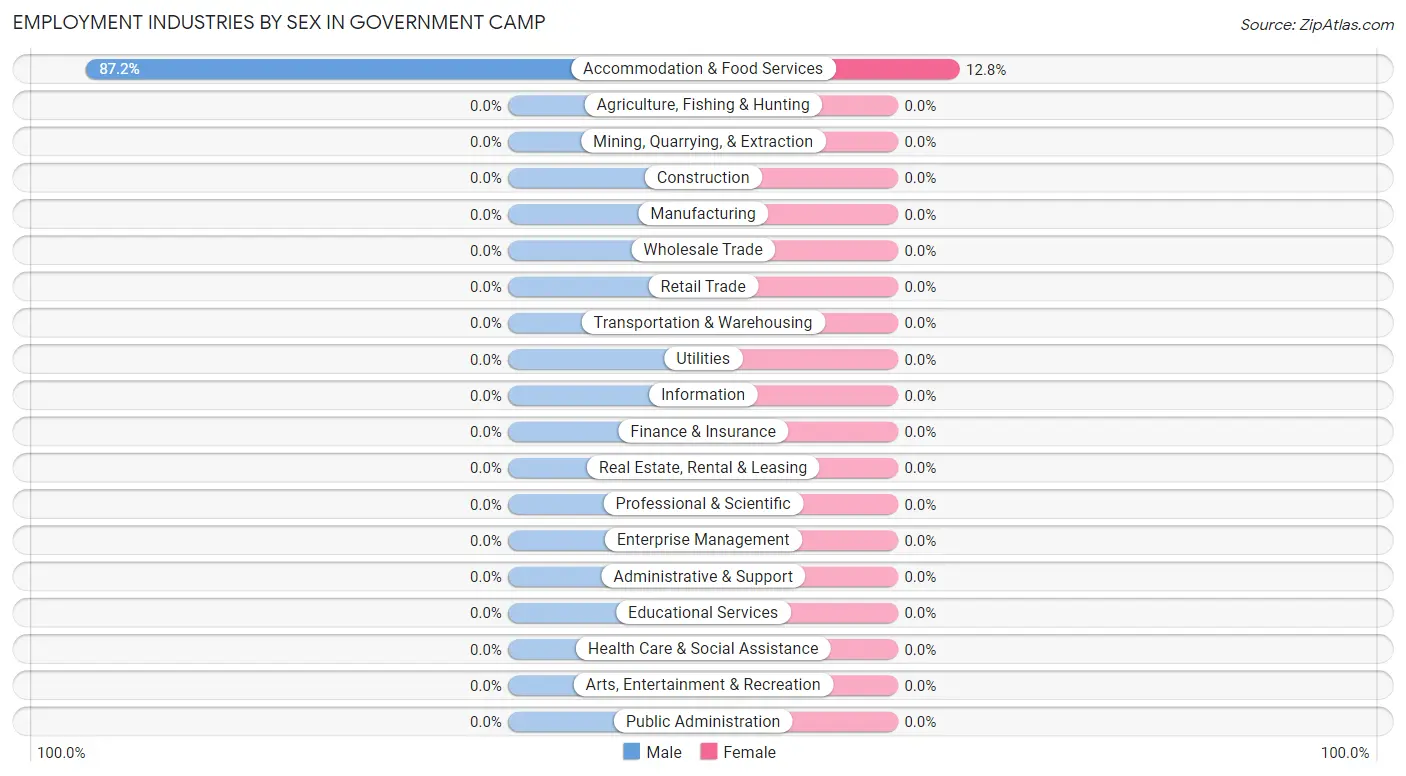
| Industry | Male | Female |
| Agriculture, Fishing & Hunting | 0 (0.0%) | 0 (0.0%) |
| Mining, Quarrying, & Extraction | 0 (0.0%) | 0 (0.0%) |
| Construction | 0 (0.0%) | 0 (0.0%) |
| Manufacturing | 0 (0.0%) | 0 (0.0%) |
| Wholesale Trade | 0 (0.0%) | 0 (0.0%) |
| Retail Trade | 0 (0.0%) | 0 (0.0%) |
| Transportation & Warehousing | 0 (0.0%) | 0 (0.0%) |
| Utilities | 0 (0.0%) | 0 (0.0%) |
| Information | 0 (0.0%) | 0 (0.0%) |
| Finance & Insurance | 0 (0.0%) | 0 (0.0%) |
| Real Estate, Rental & Leasing | 0 (0.0%) | 0 (0.0%) |
| Professional & Scientific | 0 (0.0%) | 0 (0.0%) |
| Enterprise Management | 0 (0.0%) | 0 (0.0%) |
| Administrative & Support | 0 (0.0%) | 0 (0.0%) |
| Educational Services | 0 (0.0%) | 0 (0.0%) |
| Health Care & Social Assistance | 0 (0.0%) | 0 (0.0%) |
| Arts, Entertainment & Recreation | 0 (0.0%) | 0 (0.0%) |
| Accommodation & Food Services | 41 (87.2%) | 6 (12.8%) |
| Public Administration | 0 (0.0%) | 0 (0.0%) |
| Total | 41 (87.2%) | 6 (12.8%) |
Education in Government Camp
School Enrollment in Government Camp
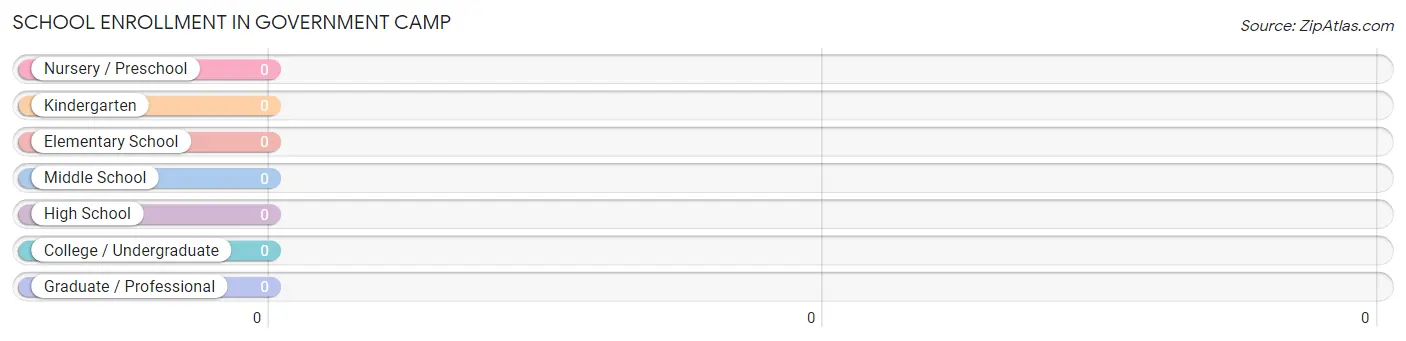
| School Level | # Students | % Students |
| Nursery / Preschool | 0 | 0.0% |
| Kindergarten | 0 | 0.0% |
| Elementary School | 0 | 0.0% |
| Middle School | 0 | 0.0% |
| High School | 0 | 0.0% |
| College / Undergraduate | 0 | 0.0% |
| Graduate / Professional | 0 | 0.0% |
| Total | 0 | 0.0% |
School Enrollment by Age by Funding Source in Government Camp
| Age Bracket | Public School | Private School |
| 3 to 4 Year Olds | 0 (0.0%) | 0 (0.0%) |
| 5 to 9 Year Old | 0 (0.0%) | 0 (0.0%) |
| 10 to 14 Year Olds | 0 (0.0%) | 0 (0.0%) |
| 15 to 17 Year Olds | 0 (0.0%) | 0 (0.0%) |
| 18 to 19 Year Olds | 0 (0.0%) | 0 (0.0%) |
| 20 to 24 Year Olds | 0 (0.0%) | 0 (0.0%) |
| 25 to 34 Year Olds | 0 (0.0%) | 0 (0.0%) |
| 35 Years and over | 0 (0.0%) | 0 (0.0%) |
| Total | 0 (0.0%) | 0 (0.0%) |
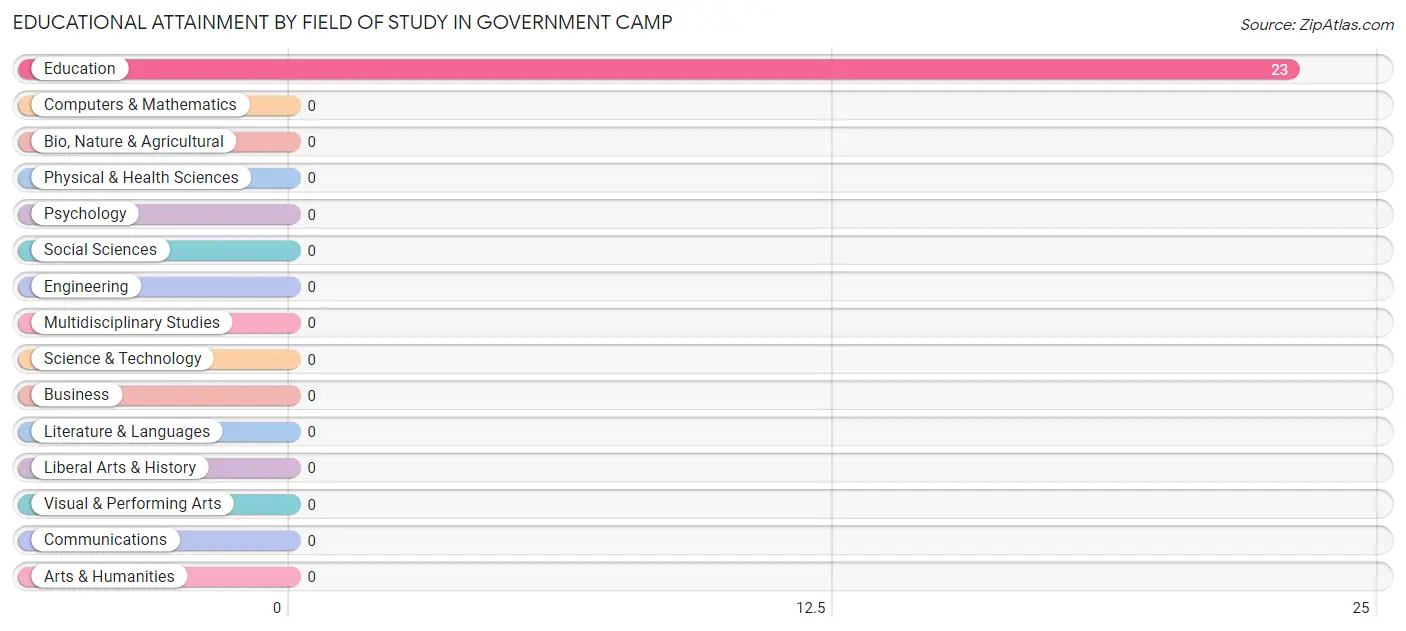
Educational Attainment by Field of Study in Government Camp
, and education (23 | 100.0%) are the most common fields of study among 23 individuals in Government Camp who have obtained a bachelor's degree or higher.
| Field of Study | # Graduates | % Graduates |
| Computers & Mathematics | 0 | 0.0% |
| Bio, Nature & Agricultural | 0 | 0.0% |
| Physical & Health Sciences | 0 | 0.0% |
| Psychology | 0 | 0.0% |
| Social Sciences | 0 | 0.0% |
| Engineering | 0 | 0.0% |
| Multidisciplinary Studies | 0 | 0.0% |
| Science & Technology | 0 | 0.0% |
| Business | 0 | 0.0% |
| Education | 23 | 100.0% |
| Literature & Languages | 0 | 0.0% |
| Liberal Arts & History | 0 | 0.0% |
| Visual & Performing Arts | 0 | 0.0% |
| Communications | 0 | 0.0% |
| Arts & Humanities | 0 | 0.0% |
| Total | 23 | 100.0% |
Transportation & Commute in Government Camp
Vehicle Availability by Sex in Government Camp
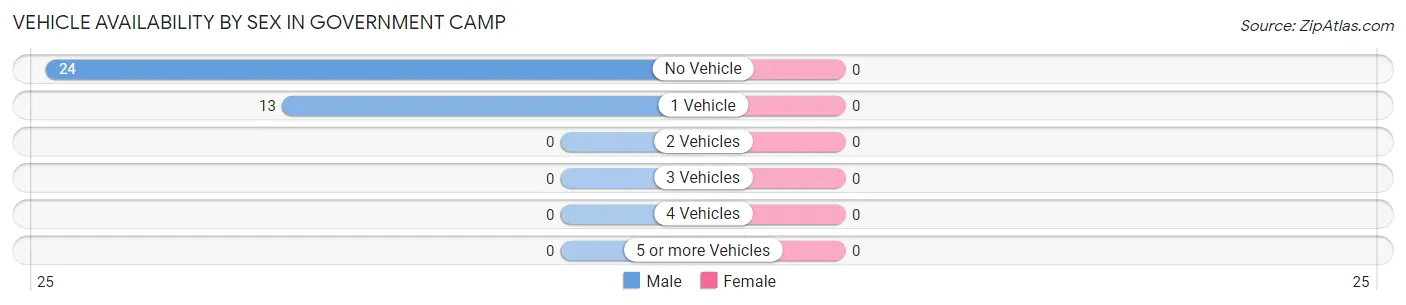
| Vehicles Available | Male | Female |
| No Vehicle | 24 (64.9%) | 0 (0.0%) |
| 1 Vehicle | 13 (35.1%) | 0 (0.0%) |
| 2 Vehicles | 0 (0.0%) | 0 (0.0%) |
| 3 Vehicles | 0 (0.0%) | 0 (0.0%) |
| 4 Vehicles | 0 (0.0%) | 0 (0.0%) |
| 5 or more Vehicles | 0 (0.0%) | 0 (0.0%) |
| Total | 37 (100.0%) | 0 (0.0%) |
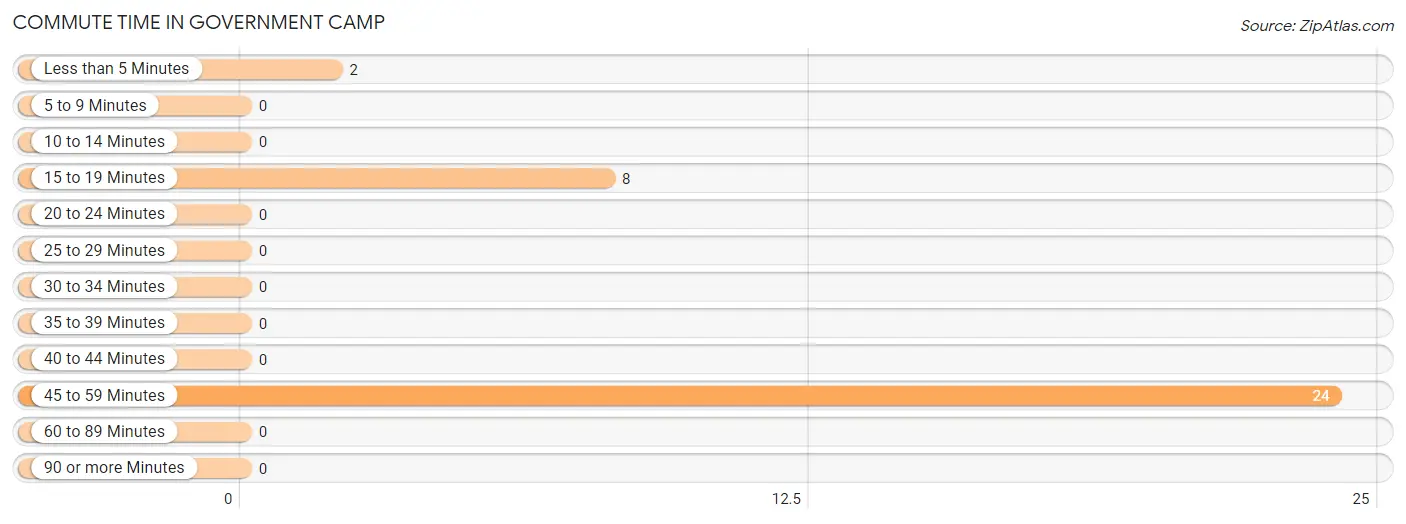
Commute Time in Government Camp
The most frequently occuring commute durations in Government Camp are 45 to 59 minutes (24 commuters, 70.6%), 15 to 19 minutes (8 commuters, 23.5%), and less than 5 minutes (2 commuters, 5.9%).
| Commute Time | # Commuters | % Commuters |
| Less than 5 Minutes | 2 | 5.9% |
| 5 to 9 Minutes | 0 | 0.0% |
| 10 to 14 Minutes | 0 | 0.0% |
| 15 to 19 Minutes | 8 | 23.5% |
| 20 to 24 Minutes | 0 | 0.0% |
| 25 to 29 Minutes | 0 | 0.0% |
| 30 to 34 Minutes | 0 | 0.0% |
| 35 to 39 Minutes | 0 | 0.0% |
| 40 to 44 Minutes | 0 | 0.0% |
| 45 to 59 Minutes | 24 | 70.6% |
| 60 to 89 Minutes | 0 | 0.0% |
| 90 or more Minutes | 0 | 0.0% |
Commute Time by Sex in Government Camp
The most common commute times in Government Camp are 45 to 59 minutes (24 commuters, 85.7%) for males and 15 to 19 minutes (4 commuters, 66.7%) for females.
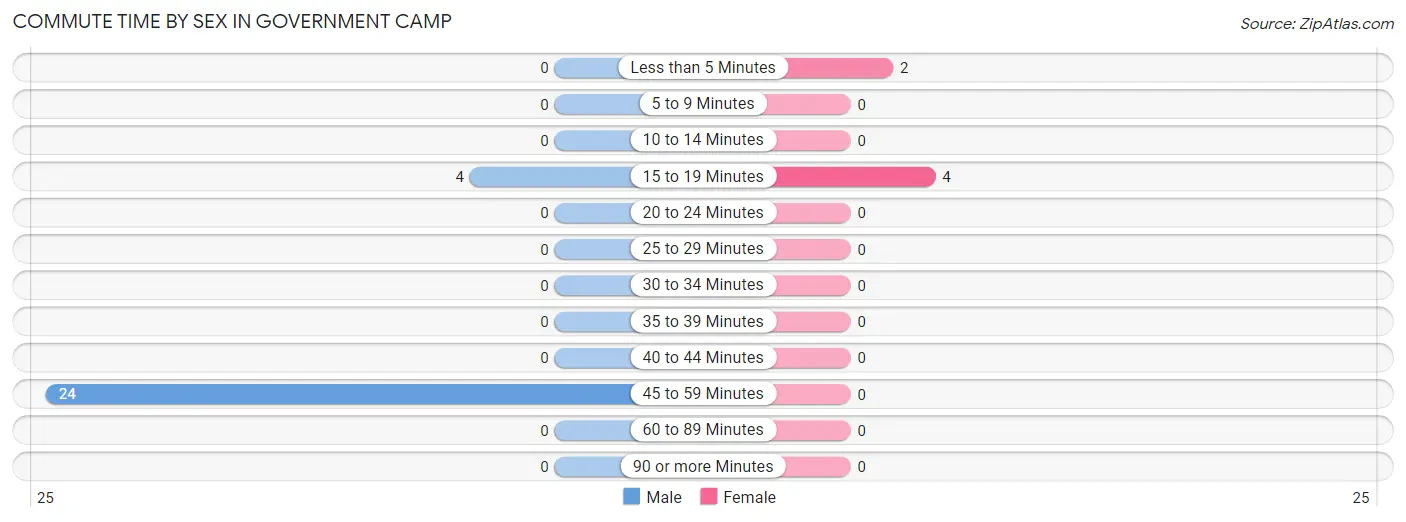
| Commute Time | Male | Female |
| Less than 5 Minutes | 0 (0.0%) | 2 (33.3%) |
| 5 to 9 Minutes | 0 (0.0%) | 0 (0.0%) |
| 10 to 14 Minutes | 0 (0.0%) | 0 (0.0%) |
| 15 to 19 Minutes | 4 (14.3%) | 4 (66.7%) |
| 20 to 24 Minutes | 0 (0.0%) | 0 (0.0%) |
| 25 to 29 Minutes | 0 (0.0%) | 0 (0.0%) |
| 30 to 34 Minutes | 0 (0.0%) | 0 (0.0%) |
| 35 to 39 Minutes | 0 (0.0%) | 0 (0.0%) |
| 40 to 44 Minutes | 0 (0.0%) | 0 (0.0%) |
| 45 to 59 Minutes | 24 (85.7%) | 0 (0.0%) |
| 60 to 89 Minutes | 0 (0.0%) | 0 (0.0%) |
| 90 or more Minutes | 0 (0.0%) | 0 (0.0%) |
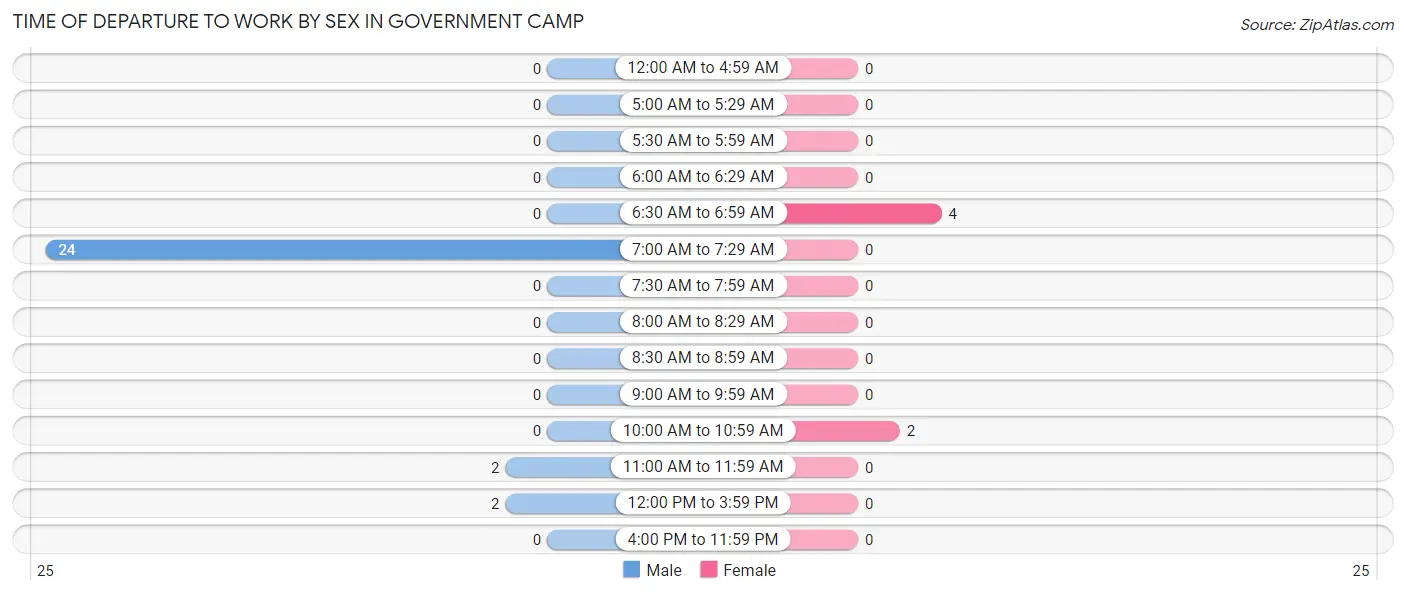
Time of Departure to Work by Sex in Government Camp
The most frequent times of departure to work in Government Camp are 7:00 AM to 7:29 AM (24, 85.7%) for males and 6:30 AM to 6:59 AM (4, 66.7%) for females.
| Time of Departure | Male | Female |
| 12:00 AM to 4:59 AM | 0 (0.0%) | 0 (0.0%) |
| 5:00 AM to 5:29 AM | 0 (0.0%) | 0 (0.0%) |
| 5:30 AM to 5:59 AM | 0 (0.0%) | 0 (0.0%) |
| 6:00 AM to 6:29 AM | 0 (0.0%) | 0 (0.0%) |
| 6:30 AM to 6:59 AM | 0 (0.0%) | 4 (66.7%) |
| 7:00 AM to 7:29 AM | 24 (85.7%) | 0 (0.0%) |
| 7:30 AM to 7:59 AM | 0 (0.0%) | 0 (0.0%) |
| 8:00 AM to 8:29 AM | 0 (0.0%) | 0 (0.0%) |
| 8:30 AM to 8:59 AM | 0 (0.0%) | 0 (0.0%) |
| 9:00 AM to 9:59 AM | 0 (0.0%) | 0 (0.0%) |
| 10:00 AM to 10:59 AM | 0 (0.0%) | 2 (33.3%) |
| 11:00 AM to 11:59 AM | 2 (7.1%) | 0 (0.0%) |
| 12:00 PM to 3:59 PM | 2 (7.1%) | 0 (0.0%) |
| 4:00 PM to 11:59 PM | 0 (0.0%) | 0 (0.0%) |
| Total | 28 (100.0%) | 6 (100.0%) |
Housing Occupancy in Government Camp
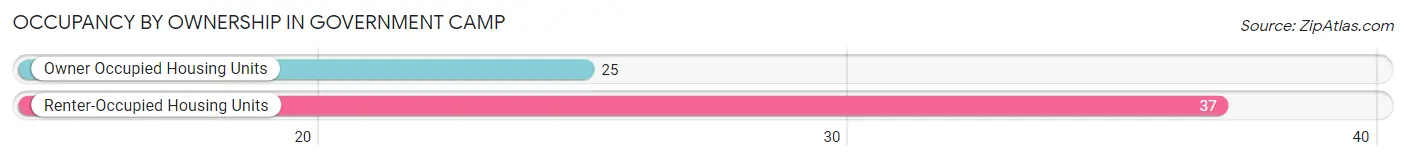
Occupancy by Ownership in Government Camp
Of the total 62 dwellings in Government Camp, owner-occupied units account for 25 (40.3%), while renter-occupied units make up 37 (59.7%).
| Occupancy | # Housing Units | % Housing Units |
| Owner Occupied Housing Units | 25 | 40.3% |
| Renter-Occupied Housing Units | 37 | 59.7% |
| Total Occupied Housing Units | 62 | 100.0% |
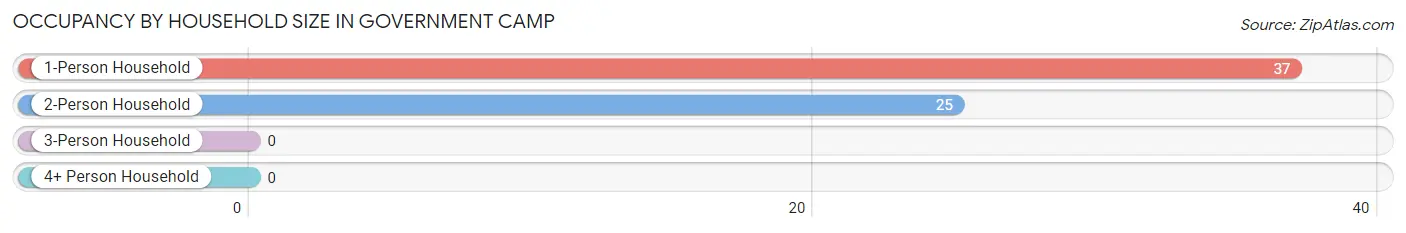
Occupancy by Household Size in Government Camp
| Household Size | # Housing Units | % Housing Units |
| 1-Person Household | 37 | 59.7% |
| 2-Person Household | 25 | 40.3% |
| 3-Person Household | 0 | 0.0% |
| 4+ Person Household | 0 | 0.0% |
| Total Housing Units | 62 | 100.0% |
Occupancy by Ownership by Household Size in Government Camp
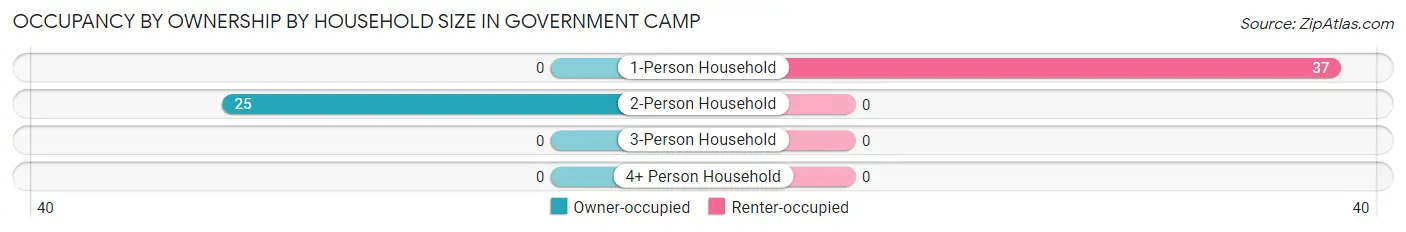
| Household Size | Owner-occupied | Renter-occupied |
| 1-Person Household | 0 (0.0%) | 37 (100.0%) |
| 2-Person Household | 25 (100.0%) | 0 (0.0%) |
| 3-Person Household | 0 (0.0%) | 0 (0.0%) |
| 4+ Person Household | 0 (0.0%) | 0 (0.0%) |
| Total Housing Units | 25 (40.3%) | 37 (59.7%) |
Occupancy by Educational Attainment in Government Camp
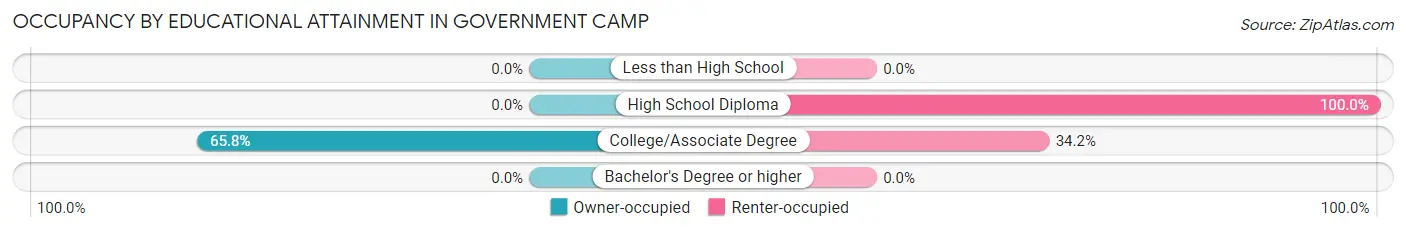
| Household Size | Owner-occupied | Renter-occupied |
| Less than High School | 0 (0.0%) | 0 (0.0%) |
| High School Diploma | 0 (0.0%) | 24 (100.0%) |
| College/Associate Degree | 25 (65.8%) | 13 (34.2%) |
| Bachelor's Degree or higher | 0 (0.0%) | 0 (0.0%) |
Occupancy by Age of Householder in Government Camp
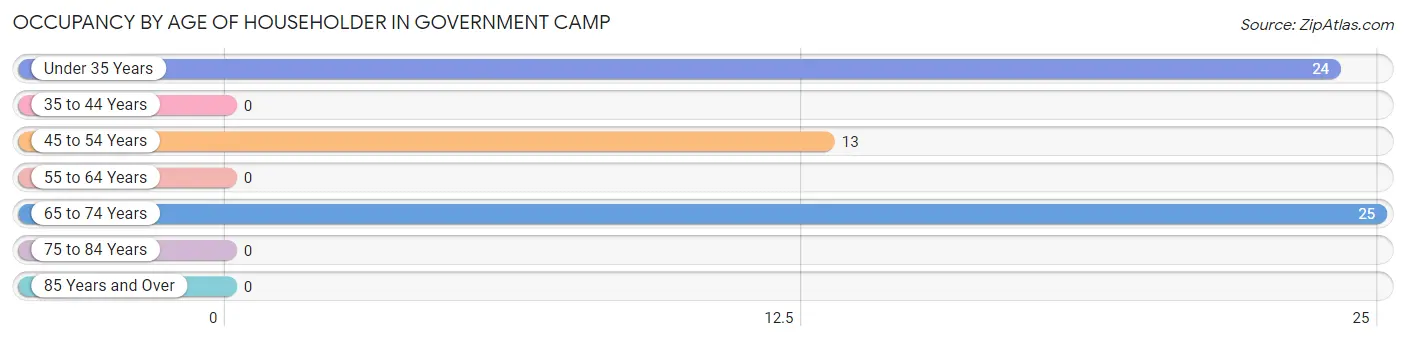
| Age Bracket | # Households | % Households |
| Under 35 Years | 24 | 38.7% |
| 35 to 44 Years | 0 | 0.0% |
| 45 to 54 Years | 13 | 21.0% |
| 55 to 64 Years | 0 | 0.0% |
| 65 to 74 Years | 25 | 40.3% |
| 75 to 84 Years | 0 | 0.0% |
| 85 Years and Over | 0 | 0.0% |
| Total | 62 | 100.0% |
Housing Finances in Government Camp
Median Income by Occupancy in Government Camp
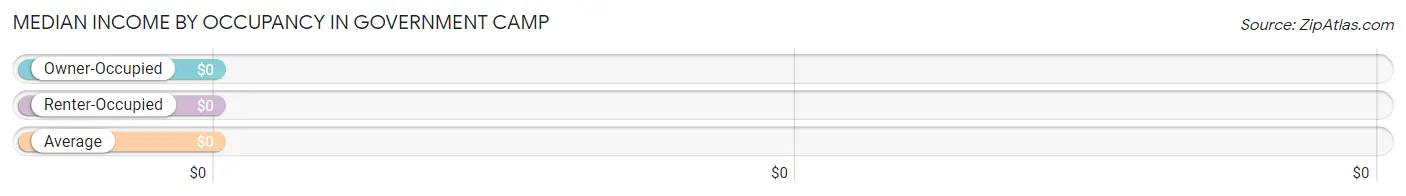
| Occupancy Type | # Households | Median Income |
| Owner-Occupied | 25 (40.3%) | $0 |
| Renter-Occupied | 37 (59.7%) | $0 |
| Average | 62 (100.0%) | $0 |
Occupancy by Householder Income Bracket in Government Camp
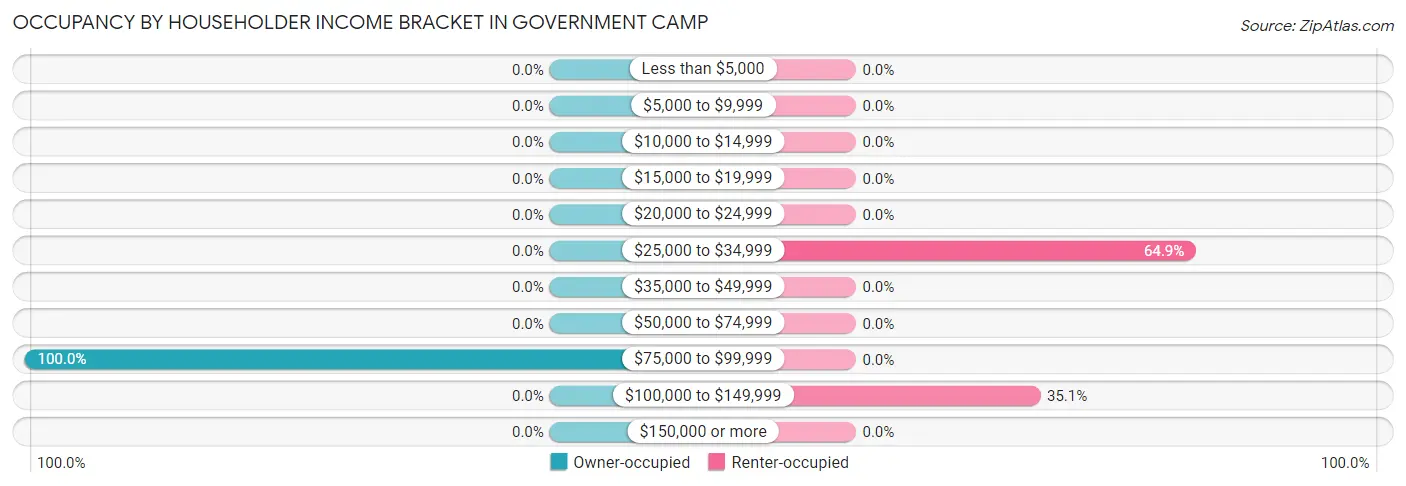
| Income Bracket | Owner-occupied | Renter-occupied |
| Less than $5,000 | 0 (0.0%) | 0 (0.0%) |
| $5,000 to $9,999 | 0 (0.0%) | 0 (0.0%) |
| $10,000 to $14,999 | 0 (0.0%) | 0 (0.0%) |
| $15,000 to $19,999 | 0 (0.0%) | 0 (0.0%) |
| $20,000 to $24,999 | 0 (0.0%) | 0 (0.0%) |
| $25,000 to $34,999 | 0 (0.0%) | 24 (64.9%) |
| $35,000 to $49,999 | 0 (0.0%) | 0 (0.0%) |
| $50,000 to $74,999 | 0 (0.0%) | 0 (0.0%) |
| $75,000 to $99,999 | 25 (100.0%) | 0 (0.0%) |
| $100,000 to $149,999 | 0 (0.0%) | 13 (35.1%) |
| $150,000 or more | 0 (0.0%) | 0 (0.0%) |
| Total | 25 (100.0%) | 37 (100.0%) |
Monthly Housing Cost Tiers in Government Camp
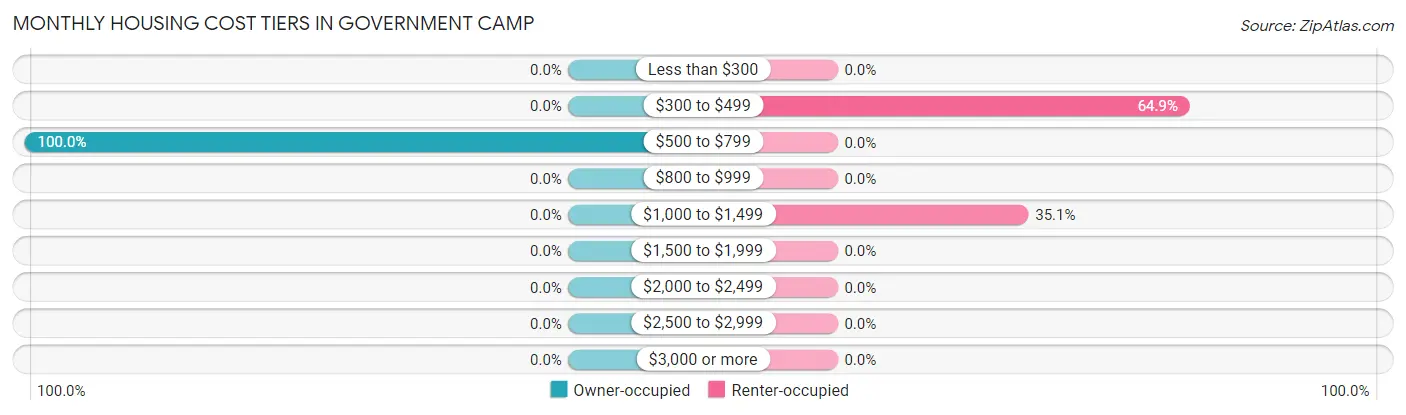
| Monthly Cost | Owner-occupied | Renter-occupied |
| Less than $300 | 0 (0.0%) | 0 (0.0%) |
| $300 to $499 | 0 (0.0%) | 24 (64.9%) |
| $500 to $799 | 25 (100.0%) | 0 (0.0%) |
| $800 to $999 | 0 (0.0%) | 0 (0.0%) |
| $1,000 to $1,499 | 0 (0.0%) | 13 (35.1%) |
| $1,500 to $1,999 | 0 (0.0%) | 0 (0.0%) |
| $2,000 to $2,499 | 0 (0.0%) | 0 (0.0%) |
| $2,500 to $2,999 | 0 (0.0%) | 0 (0.0%) |
| $3,000 or more | 0 (0.0%) | 0 (0.0%) |
| Total | 25 (100.0%) | 37 (100.0%) |
Physical Housing Characteristics in Government Camp
Housing Structures in Government Camp
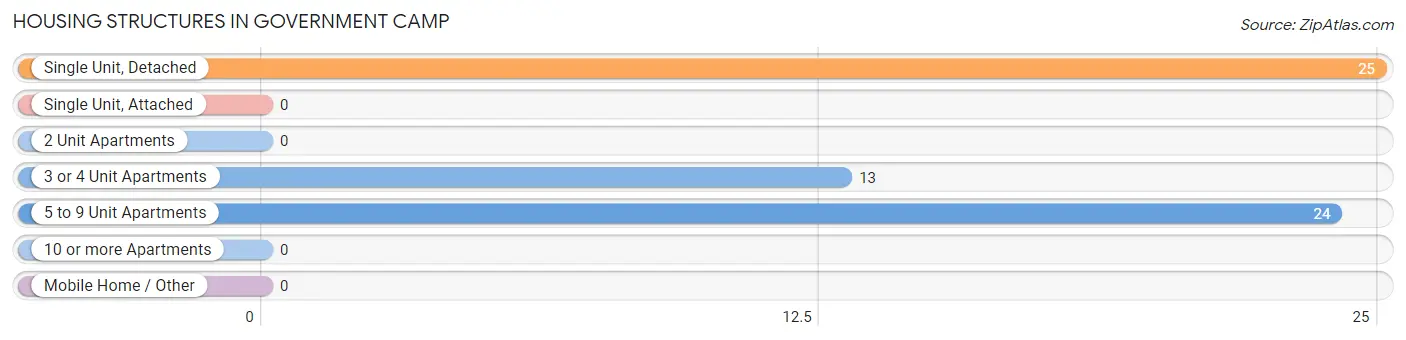
| Structure Type | # Housing Units | % Housing Units |
| Single Unit, Detached | 25 | 40.3% |
| Single Unit, Attached | 0 | 0.0% |
| 2 Unit Apartments | 0 | 0.0% |
| 3 or 4 Unit Apartments | 13 | 21.0% |
| 5 to 9 Unit Apartments | 24 | 38.7% |
| 10 or more Apartments | 0 | 0.0% |
| Mobile Home / Other | 0 | 0.0% |
| Total | 62 | 100.0% |
Housing Structures by Occupancy in Government Camp

| Structure Type | Owner-occupied | Renter-occupied |
| Single Unit, Detached | 25 (100.0%) | 0 (0.0%) |
| Single Unit, Attached | 0 (0.0%) | 0 (0.0%) |
| 2 Unit Apartments | 0 (0.0%) | 0 (0.0%) |
| 3 or 4 Unit Apartments | 0 (0.0%) | 13 (100.0%) |
| 5 to 9 Unit Apartments | 0 (0.0%) | 24 (100.0%) |
| 10 or more Apartments | 0 (0.0%) | 0 (0.0%) |
| Mobile Home / Other | 0 (0.0%) | 0 (0.0%) |
| Total | 25 (40.3%) | 37 (59.7%) |
Housing Structures by Number of Rooms in Government Camp
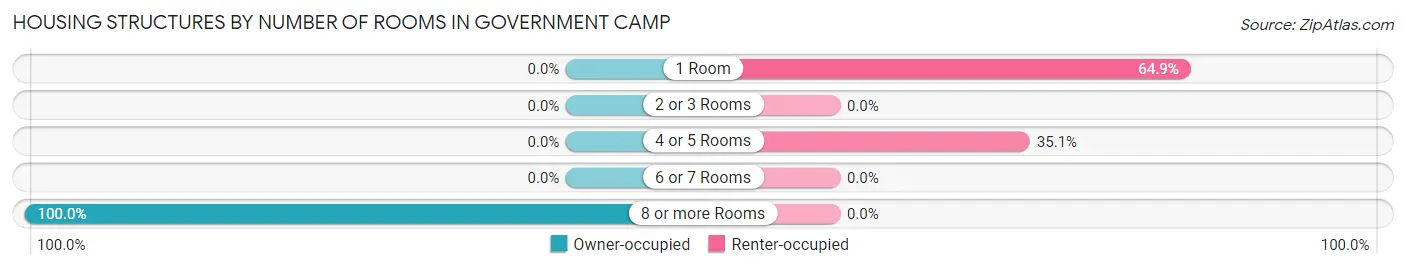
| Number of Rooms | Owner-occupied | Renter-occupied |
| 1 Room | 0 (0.0%) | 24 (64.9%) |
| 2 or 3 Rooms | 0 (0.0%) | 0 (0.0%) |
| 4 or 5 Rooms | 0 (0.0%) | 13 (35.1%) |
| 6 or 7 Rooms | 0 (0.0%) | 0 (0.0%) |
| 8 or more Rooms | 25 (100.0%) | 0 (0.0%) |
| Total | 25 (100.0%) | 37 (100.0%) |
Housing Structure by Heating Type in Government Camp
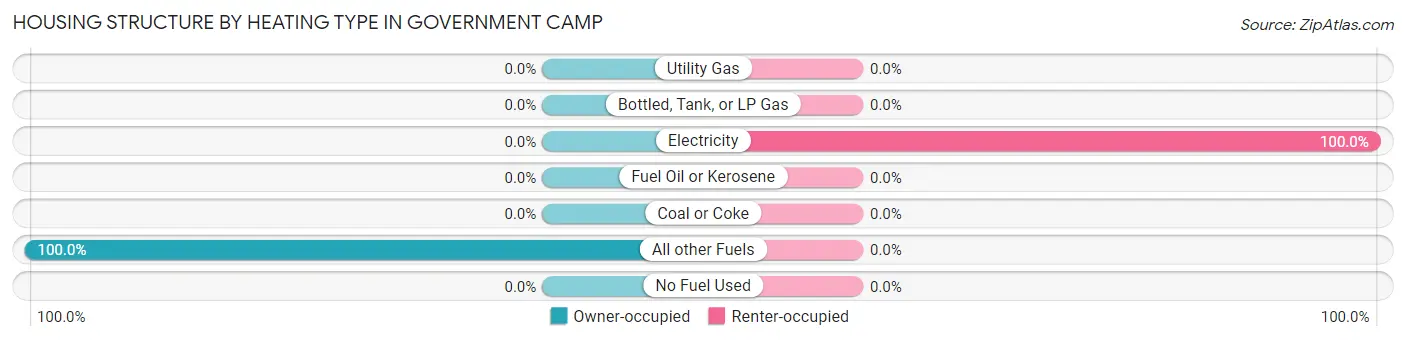
| Heating Type | Owner-occupied | Renter-occupied |
| Utility Gas | 0 (0.0%) | 0 (0.0%) |
| Bottled, Tank, or LP Gas | 0 (0.0%) | 0 (0.0%) |
| Electricity | 0 (0.0%) | 37 (100.0%) |
| Fuel Oil or Kerosene | 0 (0.0%) | 0 (0.0%) |
| Coal or Coke | 0 (0.0%) | 0 (0.0%) |
| All other Fuels | 25 (100.0%) | 0 (0.0%) |
| No Fuel Used | 0 (0.0%) | 0 (0.0%) |
| Total | 25 (100.0%) | 37 (100.0%) |
Household Vehicle Usage in Government Camp
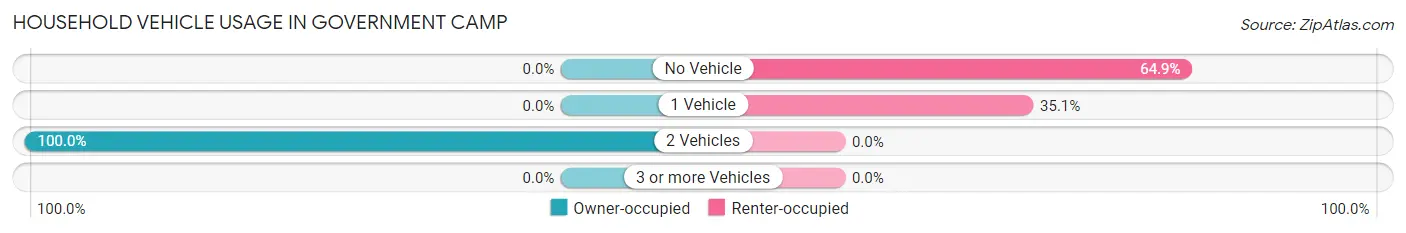
| Vehicles per Household | Owner-occupied | Renter-occupied |
| No Vehicle | 0 (0.0%) | 24 (64.9%) |
| 1 Vehicle | 0 (0.0%) | 13 (35.1%) |
| 2 Vehicles | 25 (100.0%) | 0 (0.0%) |
| 3 or more Vehicles | 0 (0.0%) | 0 (0.0%) |
| Total | 25 (100.0%) | 37 (100.0%) |
Real Estate & Mortgages in Government Camp
Real Estate and Mortgage Overview in Government Camp
| Characteristic | Without Mortgage | With Mortgage |
| Housing Units | 25 | 0 |
| Median Property Value | - | - |
| Median Household Income | - | - |
| Monthly Housing Costs | - | - |
| Real Estate Taxes | - | - |
Property Value by Mortgage Status in Government Camp
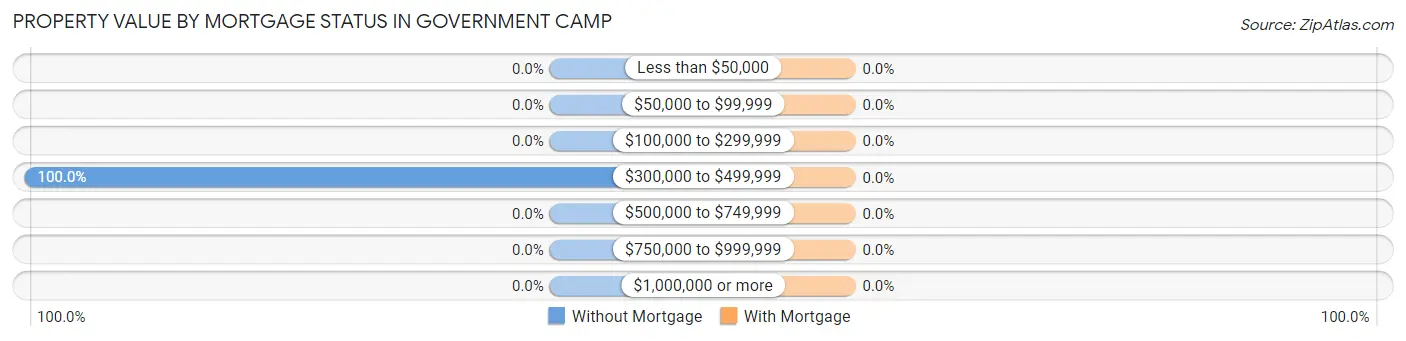
| Property Value | Without Mortgage | With Mortgage |
| Less than $50,000 | 0 (0.0%) | 0 (0.0%) |
| $50,000 to $99,999 | 0 (0.0%) | 0 (0.0%) |
| $100,000 to $299,999 | 0 (0.0%) | 0 (0.0%) |
| $300,000 to $499,999 | 25 (100.0%) | 0 (0.0%) |
| $500,000 to $749,999 | 0 (0.0%) | 0 (0.0%) |
| $750,000 to $999,999 | 0 (0.0%) | 0 (0.0%) |
| $1,000,000 or more | 0 (0.0%) | 0 (0.0%) |
| Total | 25 (100.0%) | 0 (0.0%) |
Household Income by Mortgage Status in Government Camp
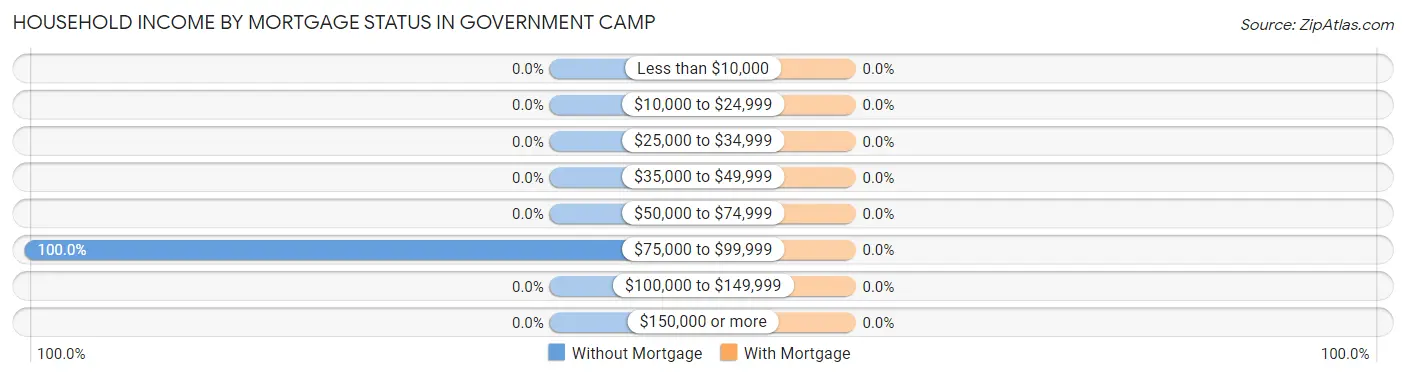
| Household Income | Without Mortgage | With Mortgage |
| Less than $10,000 | 0 (0.0%) | 0 (0.0%) |
| $10,000 to $24,999 | 0 (0.0%) | 0 (0.0%) |
| $25,000 to $34,999 | 0 (0.0%) | 0 (0.0%) |
| $35,000 to $49,999 | 0 (0.0%) | 0 (0.0%) |
| $50,000 to $74,999 | 0 (0.0%) | 0 (0.0%) |
| $75,000 to $99,999 | 25 (100.0%) | 0 (0.0%) |
| $100,000 to $149,999 | 0 (0.0%) | 0 (0.0%) |
| $150,000 or more | 0 (0.0%) | 0 (0.0%) |
| Total | 25 (100.0%) | 0 (0.0%) |
Property Value to Household Income Ratio in Government Camp
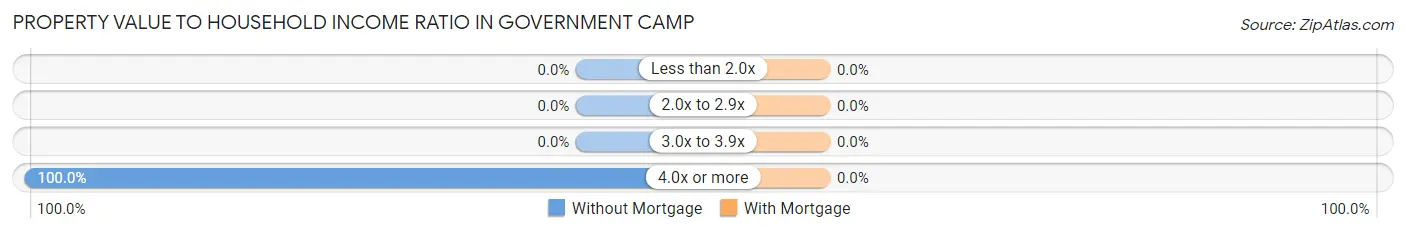
| Value-to-Income Ratio | Without Mortgage | With Mortgage |
| Less than 2.0x | 0 (0.0%) | 0 (0.0%) |
| 2.0x to 2.9x | 0 (0.0%) | 0 (0.0%) |
| 3.0x to 3.9x | 0 (0.0%) | 0 (0.0%) |
| 4.0x or more | 25 (100.0%) | 0 (0.0%) |
| Total | 25 (100.0%) | 0 (0.0%) |
Real Estate Taxes by Mortgage Status in Government Camp
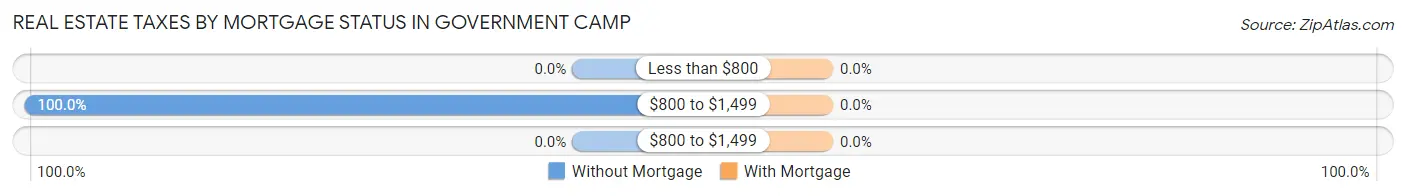
| Property Taxes | Without Mortgage | With Mortgage |
| Less than $800 | 0 (0.0%) | 0 (0.0%) |
| $800 to $1,499 | 25 (100.0%) | 0 (0.0%) |
| $800 to $1,499 | 0 (0.0%) | 0 (0.0%) |
| Total | 25 (100.0%) | 0 (0.0%) |
Health & Disability in Government Camp
Health Insurance Coverage by Age in Government Camp
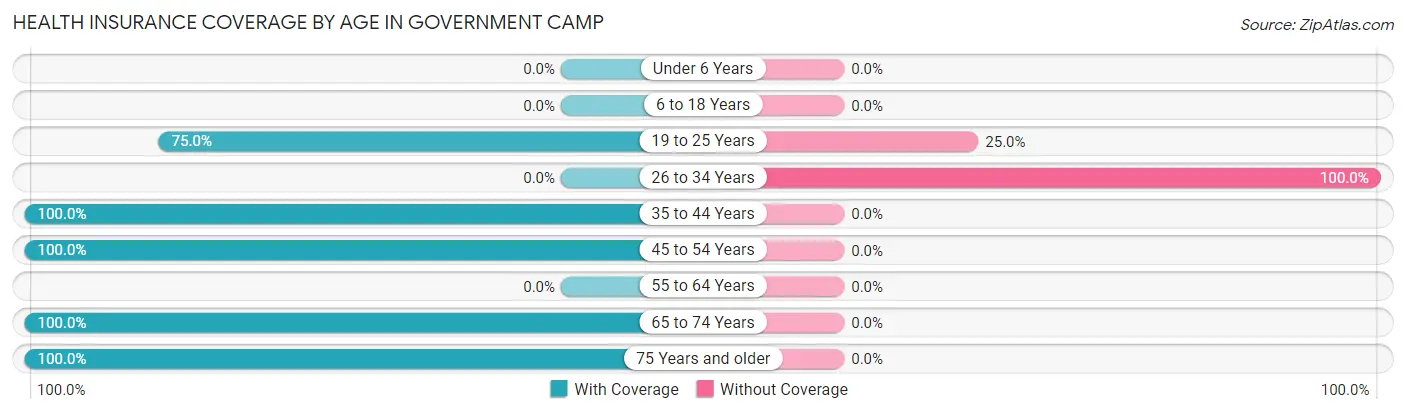
| Age Bracket | With Coverage | Without Coverage |
| Under 6 Years | 0 (0.0%) | 0 (0.0%) |
| 6 to 18 Years | 0 (0.0%) | 0 (0.0%) |
| 19 to 25 Years | 6 (75.0%) | 2 (25.0%) |
| 26 to 34 Years | 0 (0.0%) | 26 (100.0%) |
| 35 to 44 Years | 2 (100.0%) | 0 (0.0%) |
| 45 to 54 Years | 13 (100.0%) | 0 (0.0%) |
| 55 to 64 Years | 0 (0.0%) | 0 (0.0%) |
| 65 to 74 Years | 25 (100.0%) | 0 (0.0%) |
| 75 Years and older | 27 (100.0%) | 0 (0.0%) |
| Total | 73 (72.3%) | 28 (27.7%) |
Health Insurance Coverage by Citizenship Status in Government Camp
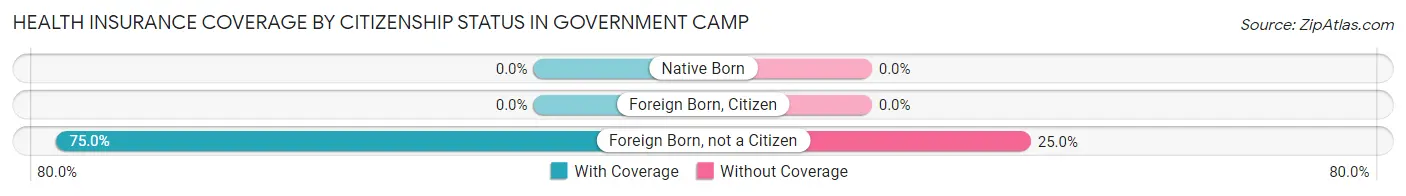
| Citizenship Status | With Coverage | Without Coverage |
| Native Born | 0 (0.0%) | 0 (0.0%) |
| Foreign Born, Citizen | 0 (0.0%) | 0 (0.0%) |
| Foreign Born, not a Citizen | 6 (75.0%) | 2 (25.0%) |
Health Insurance Coverage by Household Income in Government Camp
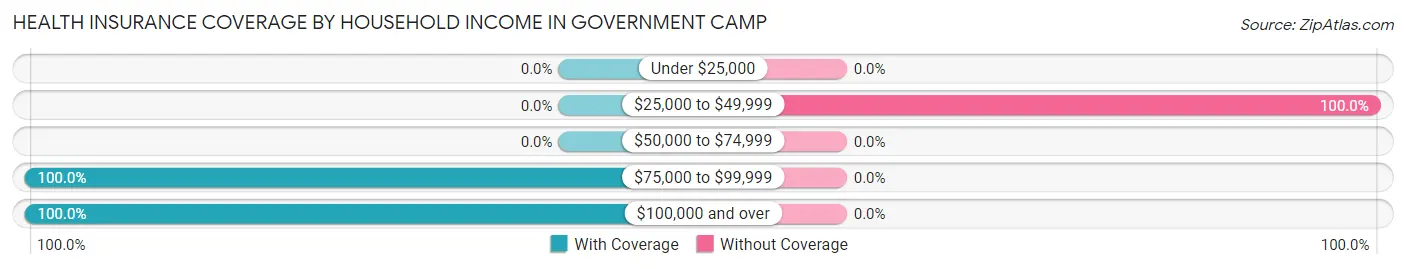
| Household Income | With Coverage | Without Coverage |
| Under $25,000 | 0 (0.0%) | 0 (0.0%) |
| $25,000 to $49,999 | 0 (0.0%) | 24 (100.0%) |
| $50,000 to $74,999 | 0 (0.0%) | 0 (0.0%) |
| $75,000 to $99,999 | 48 (100.0%) | 0 (0.0%) |
| $100,000 and over | 13 (100.0%) | 0 (0.0%) |
Public vs Private Health Insurance Coverage by Age in Government Camp
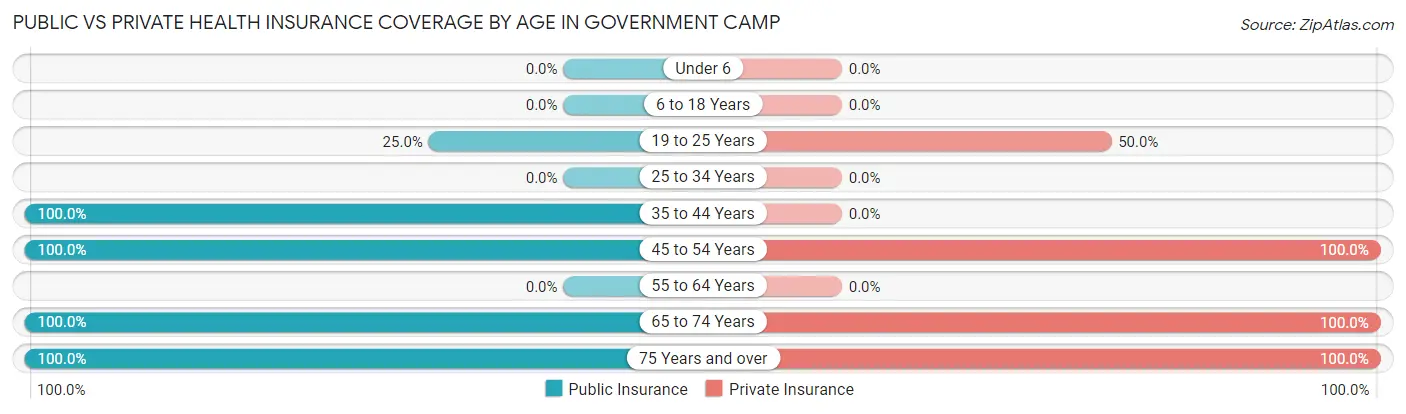
| Age Bracket | Public Insurance | Private Insurance |
| Under 6 | 0 (0.0%) | 0 (0.0%) |
| 6 to 18 Years | 0 (0.0%) | 0 (0.0%) |
| 19 to 25 Years | 2 (25.0%) | 4 (50.0%) |
| 25 to 34 Years | 0 (0.0%) | 0 (0.0%) |
| 35 to 44 Years | 2 (100.0%) | 0 (0.0%) |
| 45 to 54 Years | 13 (100.0%) | 13 (100.0%) |
| 55 to 64 Years | 0 (0.0%) | 0 (0.0%) |
| 65 to 74 Years | 25 (100.0%) | 25 (100.0%) |
| 75 Years and over | 27 (100.0%) | 27 (100.0%) |
| Total | 69 (68.3%) | 69 (68.3%) |
Disability Status by Sex by Age in Government Camp
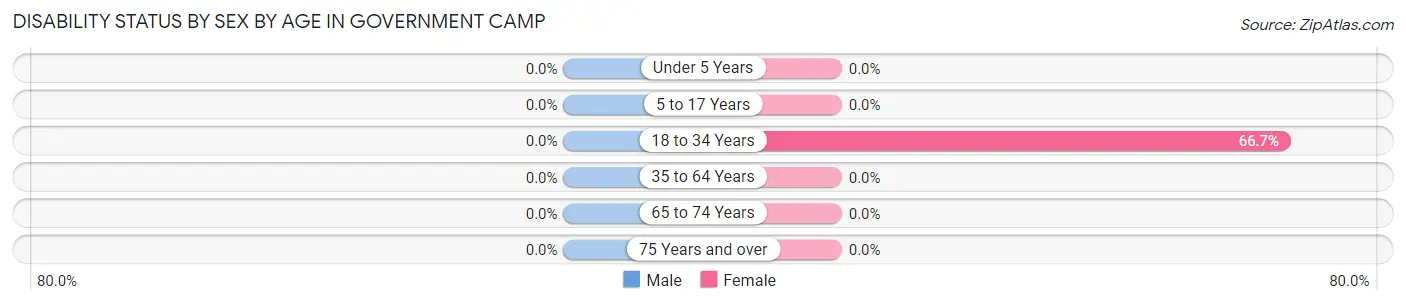
| Age Bracket | Male | Female |
| Under 5 Years | 0 (0.0%) | 0 (0.0%) |
| 5 to 17 Years | 0 (0.0%) | 0 (0.0%) |
| 18 to 34 Years | 0 (0.0%) | 4 (66.7%) |
| 35 to 64 Years | 0 (0.0%) | 0 (0.0%) |
| 65 to 74 Years | 0 (0.0%) | 0 (0.0%) |
| 75 Years and over | 0 (0.0%) | 0 (0.0%) |
Disability Class by Sex by Age in Government Camp
Disability Class: Hearing Difficulty
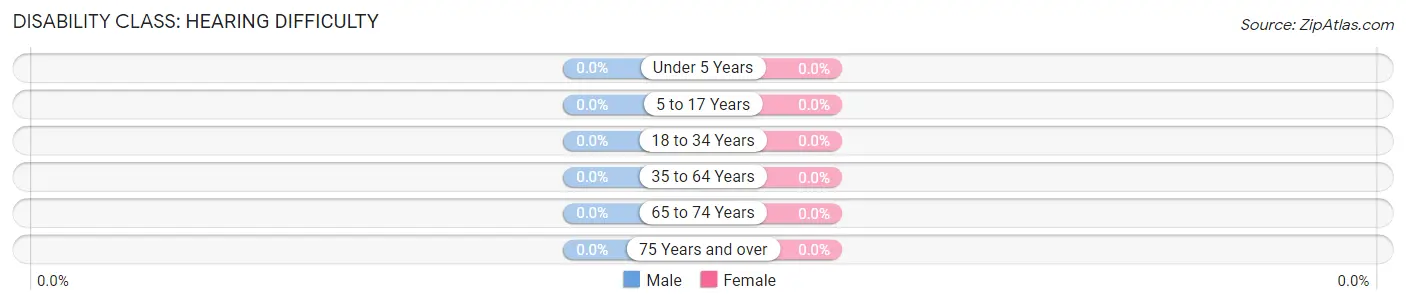
| Age Bracket | Male | Female |
| Under 5 Years | 0 (0.0%) | 0 (0.0%) |
| 5 to 17 Years | 0 (0.0%) | 0 (0.0%) |
| 18 to 34 Years | 0 (0.0%) | 0 (0.0%) |
| 35 to 64 Years | 0 (0.0%) | 0 (0.0%) |
| 65 to 74 Years | 0 (0.0%) | 0 (0.0%) |
| 75 Years and over | 0 (0.0%) | 0 (0.0%) |
Disability Class: Vision Difficulty
| Age Bracket | Male | Female |
| Under 5 Years | 0 (0.0%) | 0 (0.0%) |
| 5 to 17 Years | 0 (0.0%) | 0 (0.0%) |
| 18 to 34 Years | 0 (0.0%) | 0 (0.0%) |
| 35 to 64 Years | 0 (0.0%) | 0 (0.0%) |
| 65 to 74 Years | 0 (0.0%) | 0 (0.0%) |
| 75 Years and over | 0 (0.0%) | 0 (0.0%) |
Disability Class: Cognitive Difficulty
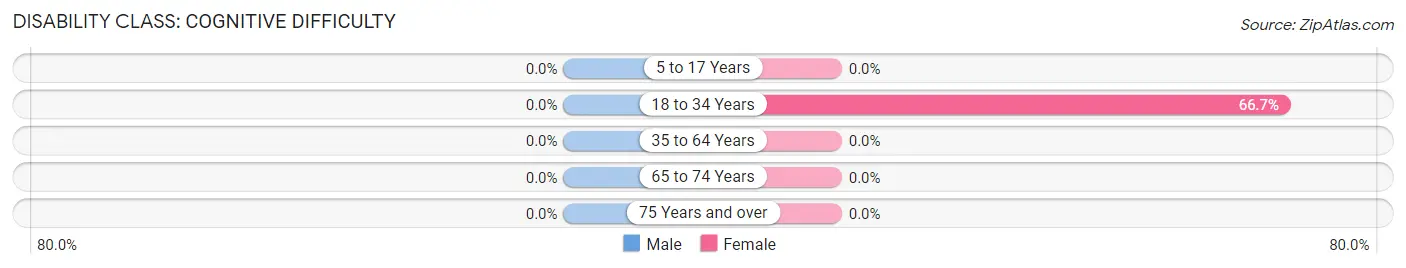
| Age Bracket | Male | Female |
| 5 to 17 Years | 0 (0.0%) | 0 (0.0%) |
| 18 to 34 Years | 0 (0.0%) | 4 (66.7%) |
| 35 to 64 Years | 0 (0.0%) | 0 (0.0%) |
| 65 to 74 Years | 0 (0.0%) | 0 (0.0%) |
| 75 Years and over | 0 (0.0%) | 0 (0.0%) |
Disability Class: Ambulatory Difficulty
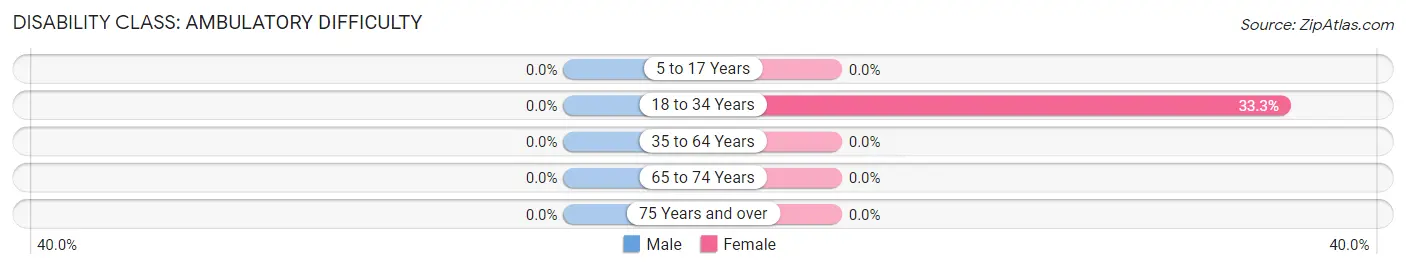
| Age Bracket | Male | Female |
| 5 to 17 Years | 0 (0.0%) | 0 (0.0%) |
| 18 to 34 Years | 0 (0.0%) | 2 (33.3%) |
| 35 to 64 Years | 0 (0.0%) | 0 (0.0%) |
| 65 to 74 Years | 0 (0.0%) | 0 (0.0%) |
| 75 Years and over | 0 (0.0%) | 0 (0.0%) |
Disability Class: Self-Care Difficulty
| Age Bracket | Male | Female |
| 5 to 17 Years | 0 (0.0%) | 0 (0.0%) |
| 18 to 34 Years | 0 (0.0%) | 0 (0.0%) |
| 35 to 64 Years | 0 (0.0%) | 0 (0.0%) |
| 65 to 74 Years | 0 (0.0%) | 0 (0.0%) |
| 75 Years and over | 0 (0.0%) | 0 (0.0%) |
Technology Access in Government Camp
Computing Device Access in Government Camp
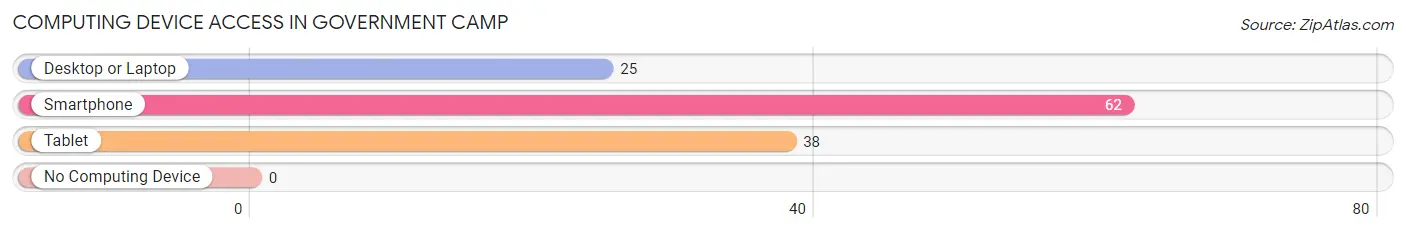
| Device Type | # Households | % Households |
| Desktop or Laptop | 25 | 40.3% |
| Smartphone | 62 | 100.0% |
| Tablet | 38 | 61.3% |
| No Computing Device | 0 | 0.0% |
| Total | 62 | 100.0% |
Internet Access in Government Camp
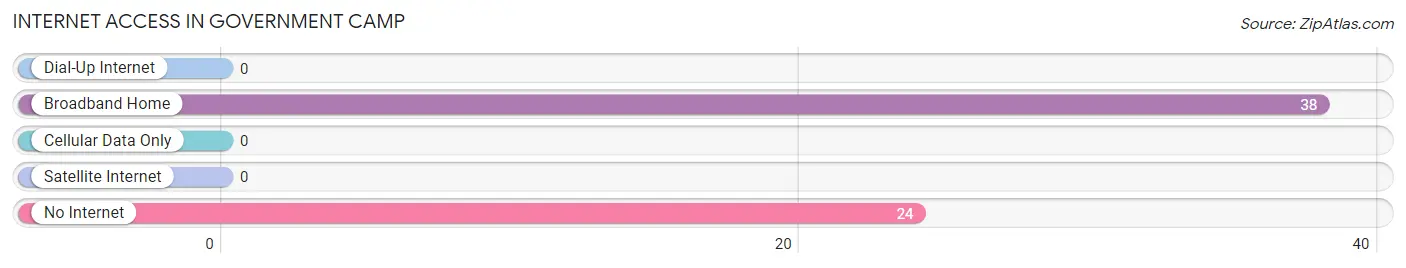
| Internet Type | # Households | % Households |
| Dial-Up Internet | 0 | 0.0% |
| Broadband Home | 38 | 61.3% |
| Cellular Data Only | 0 | 0.0% |
| Satellite Internet | 0 | 0.0% |
| No Internet | 24 | 38.7% |
| Total | 62 | 100.0% |
Government Camp Summary
History
Government Camp is an unincorporated community located in Clackamas County, Oregon, United States. It is located on the south side of Mount Hood, approximately 50 miles east of Portland. The community was established in the late 1800s as a logging camp and was named after the U.S. Government's timber claim in the area.
The first settlers in the area were the Native Americans, who had lived in the area for thousands of years. The first European settlers arrived in the area in the early 1800s, and the first permanent settlement was established in 1845. The area was originally known as "Camp Settlement" and was later renamed "Government Camp" in 1883.
The area was initially used for logging, and the first sawmill was built in 1883. The logging industry was the main source of income for the area until the early 1900s, when tourism began to take off. The area became a popular destination for outdoor recreation, and the first ski resort was built in 1927.
The area has been a popular tourist destination ever since, and it is now home to several ski resorts, including Mt. Hood Skibowl, Timberline Lodge, and Mt. Hood Meadows. The area is also home to several restaurants, shops, and lodging establishments.
Geography
Government Camp is located in Clackamas County, Oregon, approximately 50 miles east of Portland. It is situated on the south side of Mount Hood, at an elevation of 3,500 feet. The area is surrounded by the Mount Hood National Forest and is home to several ski resorts, including Mt. Hood Skibowl, Timberline Lodge, and Mt. Hood Meadows.
The area has a humid continental climate, with warm summers and cold winters. The average annual temperature is 45°F, and the average annual precipitation is 33 inches.
Economy
The economy of Government Camp is largely based on tourism. The area is home to several ski resorts, restaurants, shops, and lodging establishments. The ski resorts are the main source of income for the area, and they attract thousands of visitors each year.
In addition to tourism, the area is also home to several small businesses, including a lumber mill, a sawmill, and a woodworking shop. The area is also home to several farms, which produce hay, vegetables, and other crops.
Demographics
As of the 2010 census, the population of Government Camp was 545. The racial makeup of the town was 97.3% White, 0.2% African American, 0.2% Native American, 0.7% Asian, 0.2% Pacific Islander, 0.2% from other races, and 1.2% from two or more races. Hispanic or Latino of any race were 1.3% of the population.
The median household income in Government Camp was $45,000, and the median family income was $50,000. The per capita income was $20,000. About 10.3% of families and 14.2% of the population were below the poverty line, including 18.2% of those under age 18 and none of those age 65 or over.
Common Questions
What is Per Capita Income in Government Camp?
Per Capita income in Government Camp is $45,703.
What is Inequality or Gini Index in Government Camp?
Inequality or Gini Index in Government Camp is 0.28.
What is the Total Population of Government Camp?
Total Population of Government Camp is 101.
What is the Total Male Population of Government Camp?
Total Male Population of Government Camp is 66.
What is the Total Female Population of Government Camp?
Total Female Population of Government Camp is 35.
What is the Ratio of Males per 100 Females in Government Camp?
There are 188.57 Males per 100 Females in Government Camp.
What is the Ratio of Females per 100 Males in Government Camp?
There are 53.03 Females per 100 Males in Government Camp.
What is the Median Population Age in Government Camp?
Median Population Age in Government Camp is 72.1 Years.
What is the Average Family Size in Government Camp
Average Family Size in Government Camp is 1.9 People.
What is the Average Household Size in Government Camp
Average Household Size in Government Camp is 1.4 People.
How Large is the Labor Force in Government Camp?
There are 49 People in the Labor Forcein in Government Camp.
What is the Percentage of People in the Labor Force in Government Camp?
48.5% of People are in the Labor Force in Government Camp.
What is the Unemployment Rate in Government Camp?
Unemployment Rate in Government Camp is 4.1%.