Glide, OR Map & Demographics
Glide Map
Glide Overview
$31,903
PER CAPITA INCOME
$78,810
AVG FAMILY INCOME
$69,875
AVG HOUSEHOLD INCOME
0.33
INEQUALITY / GINI INDEX
1,523
TOTAL POPULATION
801
MALE POPULATION
722
FEMALE POPULATION
110.94
MALES / 100 FEMALES
90.14
FEMALES / 100 MALES
58.5
MEDIAN AGE
2.7
AVG FAMILY SIZE
2.5
AVG HOUSEHOLD SIZE
641
LABOR FORCE [ PEOPLE ]
47.2%
PERCENT IN LABOR FORCE
7.5%
UNEMPLOYMENT RATE
Glide Zip Codes
Glide Area Codes
Income in Glide
Income Overview in Glide
Per Capita Income in Glide is $31,903, while median incomes of families and households are $78,810 and $69,875 respectively.
| Characteristic | Number | Measure |
| Per Capita Income | 1,523 | $31,903 |
| Median Family Income | 514 | $78,810 |
| Mean Family Income | 514 | $89,497 |
| Median Household Income | 600 | $69,875 |
| Mean Household Income | 600 | $82,773 |
| Income Deficit | 514 | $0 |
| Wage / Income Gap (%) | 1,523 | 0.00% |
| Wage / Income Gap ($) | 1,523 | 100.00¢ per $1 |
| Gini / Inequality Index | 1,523 | 0.33 |
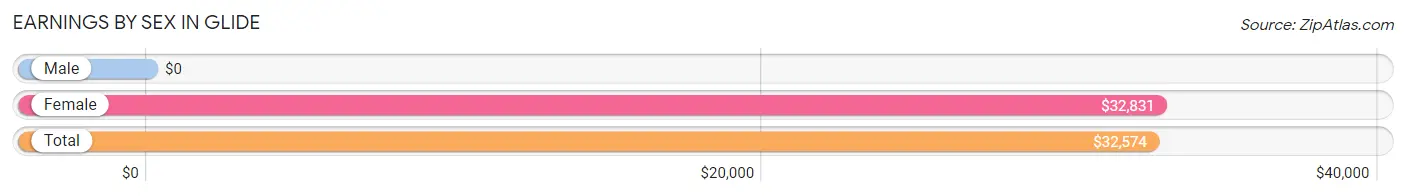
Earnings by Sex in Glide
| Sex | Number | Average Earnings |
| Male | 322 (48.2%) | $0 |
| Female | 346 (51.8%) | $32,831 |
| Total | 668 (100.0%) | $32,574 |
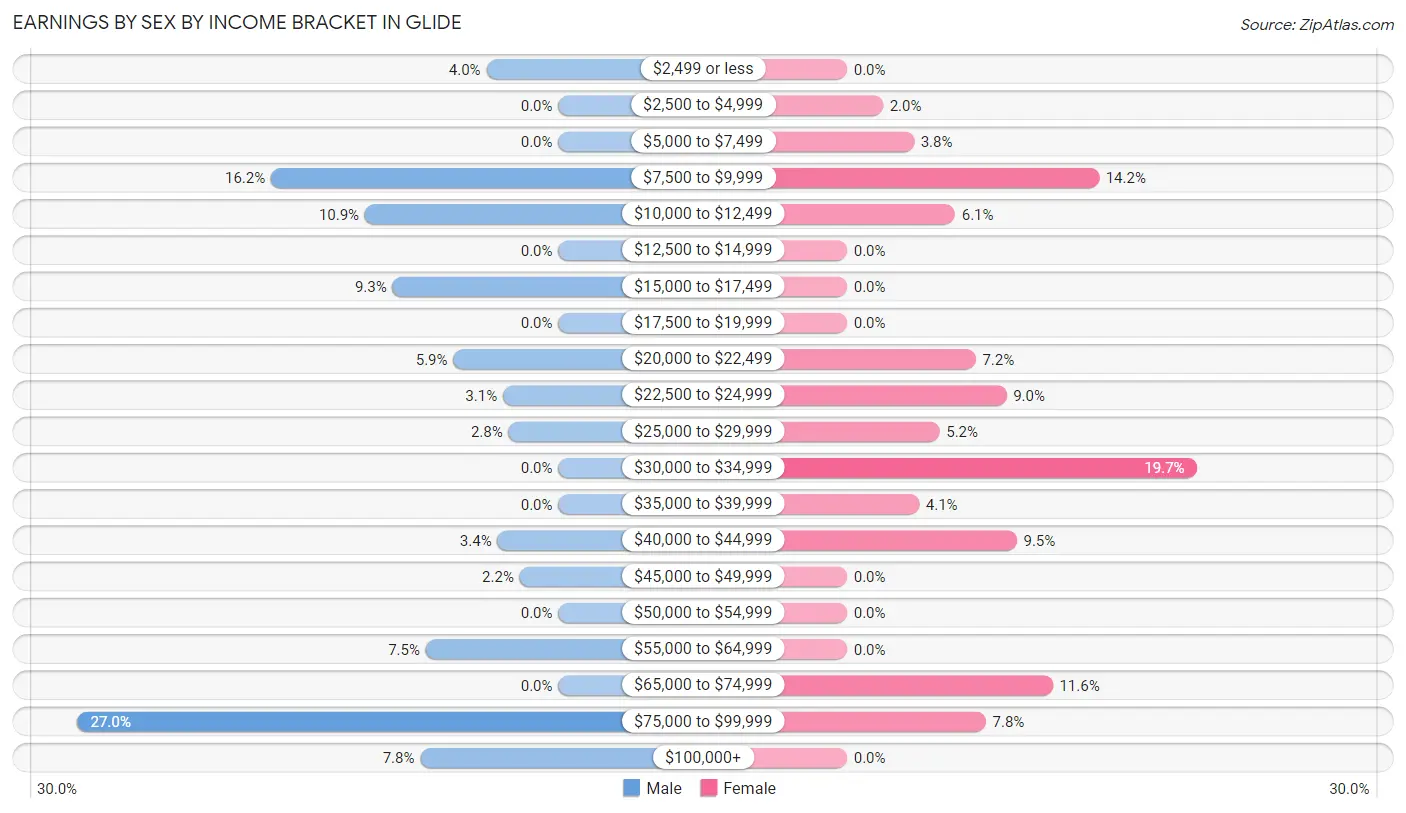
Earnings by Sex by Income Bracket in Glide
The most common earnings brackets in Glide are $75,000 to $99,999 for men (87 | 27.0%) and $30,000 to $34,999 for women (68 | 19.7%).
| Income | Male | Female |
| $2,499 or less | 13 (4.0%) | 0 (0.0%) |
| $2,500 to $4,999 | 0 (0.0%) | 7 (2.0%) |
| $5,000 to $7,499 | 0 (0.0%) | 13 (3.8%) |
| $7,500 to $9,999 | 52 (16.2%) | 49 (14.2%) |
| $10,000 to $12,499 | 35 (10.9%) | 21 (6.1%) |
| $12,500 to $14,999 | 0 (0.0%) | 0 (0.0%) |
| $15,000 to $17,499 | 30 (9.3%) | 0 (0.0%) |
| $17,500 to $19,999 | 0 (0.0%) | 0 (0.0%) |
| $20,000 to $22,499 | 19 (5.9%) | 25 (7.2%) |
| $22,500 to $24,999 | 10 (3.1%) | 31 (9.0%) |
| $25,000 to $29,999 | 9 (2.8%) | 18 (5.2%) |
| $30,000 to $34,999 | 0 (0.0%) | 68 (19.7%) |
| $35,000 to $39,999 | 0 (0.0%) | 14 (4.1%) |
| $40,000 to $44,999 | 11 (3.4%) | 33 (9.5%) |
| $45,000 to $49,999 | 7 (2.2%) | 0 (0.0%) |
| $50,000 to $54,999 | 0 (0.0%) | 0 (0.0%) |
| $55,000 to $64,999 | 24 (7.4%) | 0 (0.0%) |
| $65,000 to $74,999 | 0 (0.0%) | 40 (11.6%) |
| $75,000 to $99,999 | 87 (27.0%) | 27 (7.8%) |
| $100,000+ | 25 (7.8%) | 0 (0.0%) |
| Total | 322 (100.0%) | 346 (100.0%) |
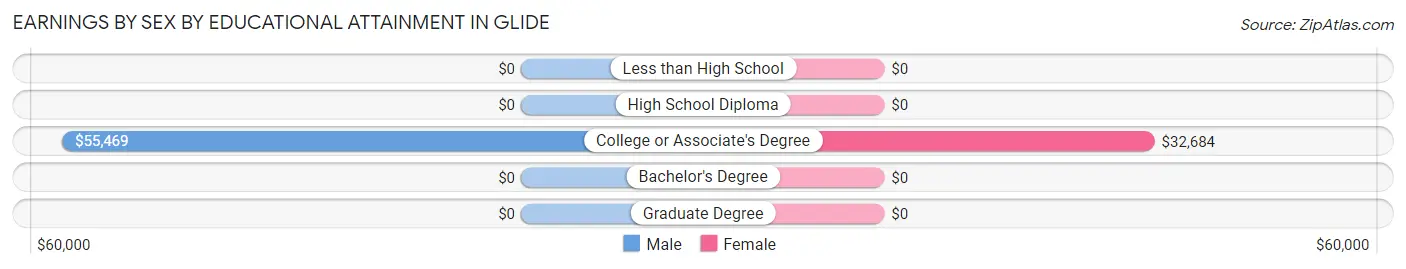
Earnings by Sex by Educational Attainment in Glide
Average earnings in Glide are $57,031 for men and $33,842 for women, a difference of 40.7%. Men with an educational attainment of college or associate's degree enjoy the highest average annual earnings of $55,469, while those with college or associate's degree education earn the least with $55,469. Women with an educational attainment of college or associate's degree earn the most with the average annual earnings of $32,684, while those with college or associate's degree education have the smallest earnings of $32,684.
| Educational Attainment | Male Income | Female Income |
| Less than High School | - | - |
| High School Diploma | - | - |
| College or Associate's Degree | $55,469 | $32,684 |
| Bachelor's Degree | - | - |
| Graduate Degree | - | - |
| Total | $57,031 | $33,842 |
Family Income in Glide
Family Income Brackets in Glide
According to the Glide family income data, there are 142 families falling into the $50,000 to $74,999 income range, which is the most common income bracket and makes up 27.6% of all families.
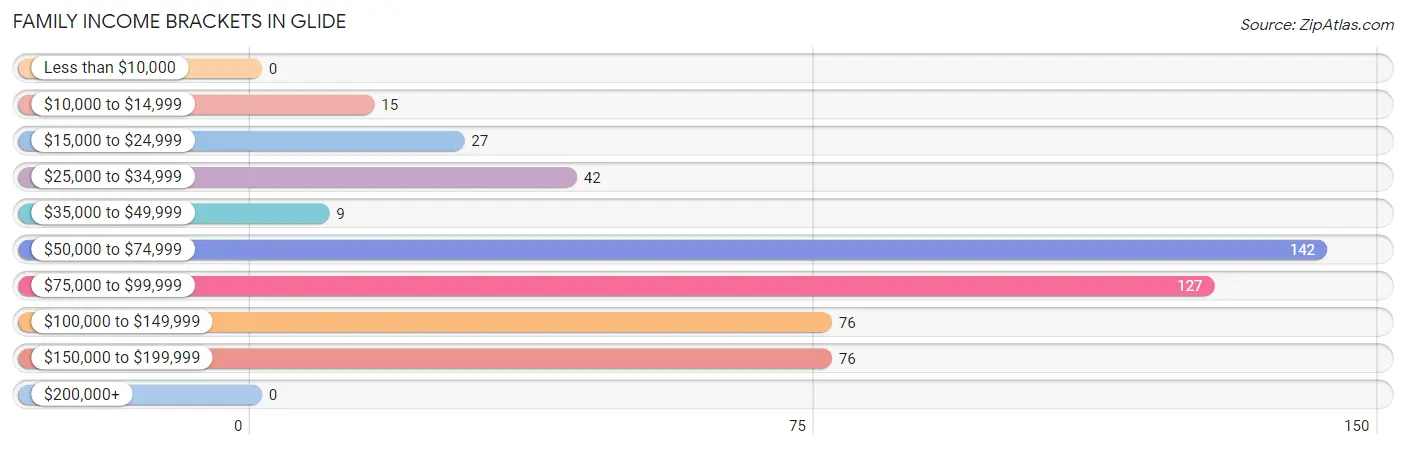
| Income Bracket | # Families | % Families |
| Less than $10,000 | 0 | 0.0% |
| $10,000 to $14,999 | 15 | 2.9% |
| $15,000 to $24,999 | 27 | 5.3% |
| $25,000 to $34,999 | 42 | 8.2% |
| $35,000 to $49,999 | 9 | 1.8% |
| $50,000 to $74,999 | 142 | 27.6% |
| $75,000 to $99,999 | 127 | 24.7% |
| $100,000 to $149,999 | 76 | 14.8% |
| $150,000 to $199,999 | 76 | 14.8% |
| $200,000+ | 0 | 0.0% |
Family Income by Famaliy Size in Glide
2-person families (354 | 68.9%) account for the highest median family income in Glide with $77,738 per family, while 2-person families (354 | 68.9%) have the highest median income of $38,869 per family member.
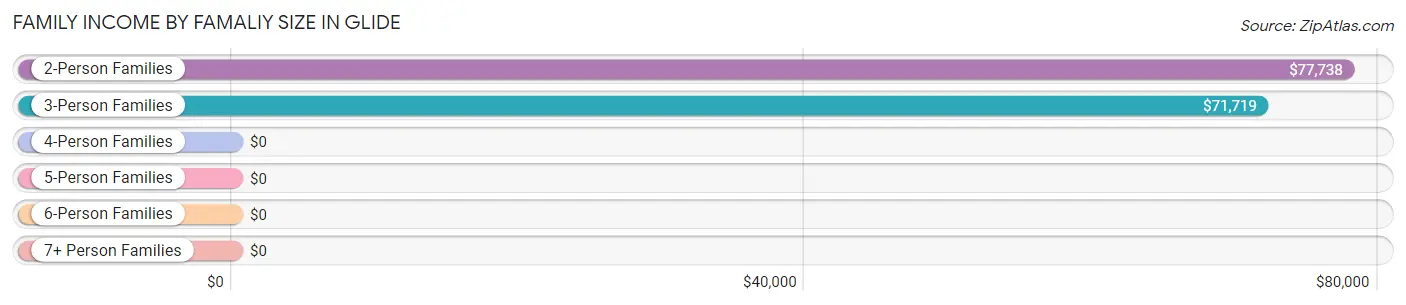
| Income Bracket | # Families | Median Income |
| 2-Person Families | 354 (68.9%) | $77,738 |
| 3-Person Families | 41 (8.0%) | $71,719 |
| 4-Person Families | 64 (12.4%) | $0 |
| 5-Person Families | 28 (5.4%) | $0 |
| 6-Person Families | 27 (5.2%) | $0 |
| 7+ Person Families | 0 (0.0%) | $0 |
| Total | 514 (100.0%) | $78,810 |
Family Income by Number of Earners in Glide
The median family income in Glide is $78,810, with families comprising 3+ earners (59) having the highest median family income of $186,082, while families with no earners (219) have the lowest median family income of $56,641, accounting for 11.5% and 42.6% of families, respectively.
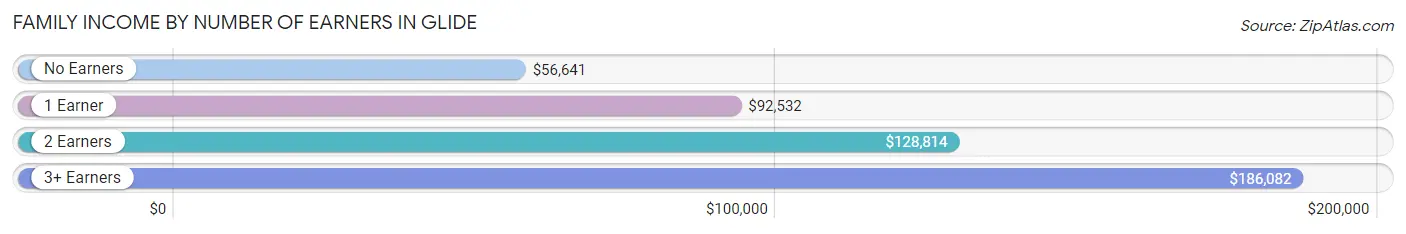
| Number of Earners | # Families | Median Income |
| No Earners | 219 (42.6%) | $56,641 |
| 1 Earner | 103 (20.0%) | $92,532 |
| 2 Earners | 133 (25.9%) | $128,814 |
| 3+ Earners | 59 (11.5%) | $186,082 |
| Total | 514 (100.0%) | $78,810 |
Household Income in Glide
Household Income Brackets in Glide
With 170 households falling in the category, the $50,000 to $74,999 income range is the most frequent in Glide, accounting for 28.3% of all households.
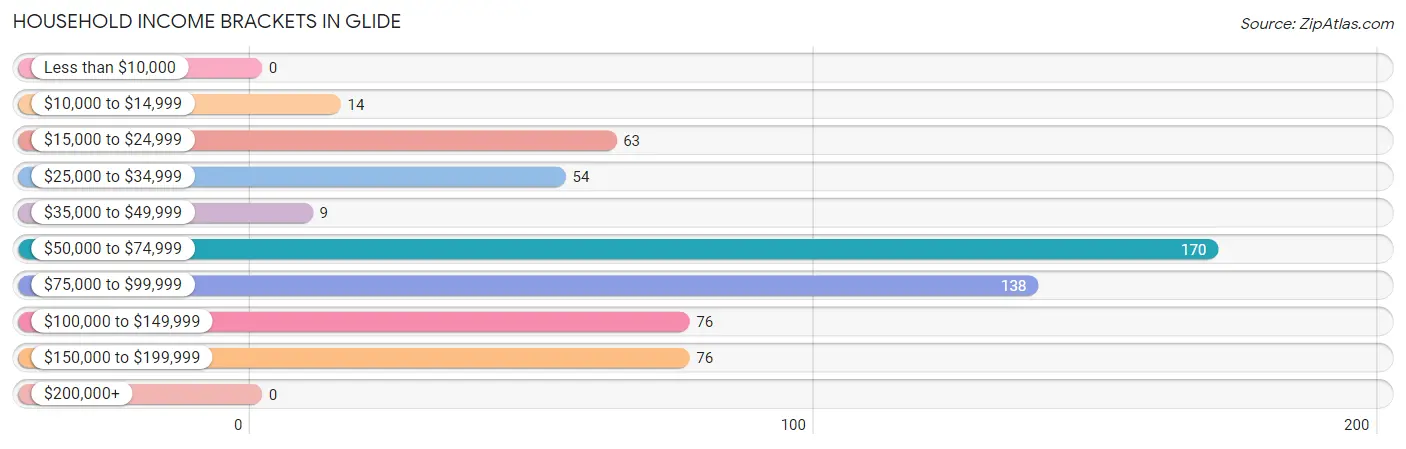
| Income Bracket | # Households | % Households |
| Less than $10,000 | 0 | 0.0% |
| $10,000 to $14,999 | 14 | 2.3% |
| $15,000 to $24,999 | 63 | 10.5% |
| $25,000 to $34,999 | 54 | 9.0% |
| $35,000 to $49,999 | 9 | 1.5% |
| $50,000 to $74,999 | 170 | 28.3% |
| $75,000 to $99,999 | 138 | 23.0% |
| $100,000 to $149,999 | 76 | 12.7% |
| $150,000 to $199,999 | 76 | 12.7% |
| $200,000+ | 0 | 0.0% |
Household Income by Householder Age in Glide
The median household income in Glide is $69,875, with the highest median household income of $128,718 found in the 45 to 64 years age bracket for the primary householder. A total of 218 households (36.3%) fall into this category. Meanwhile, the 15 to 24 years age bracket for the primary householder has the lowest median household income of $0, with 51 households (8.5%) in this group.
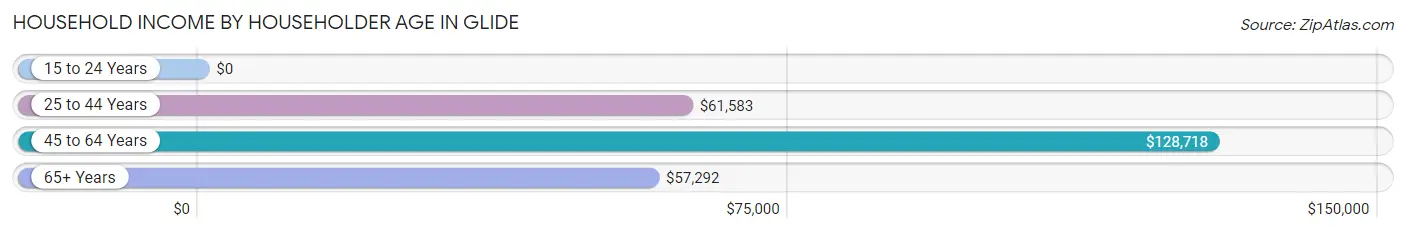
| Income Bracket | # Households | Median Income |
| 15 to 24 Years | 51 (8.5%) | $0 |
| 25 to 44 Years | 67 (11.2%) | $61,583 |
| 45 to 64 Years | 218 (36.3%) | $128,718 |
| 65+ Years | 264 (44.0%) | $57,292 |
| Total | 600 (100.0%) | $69,875 |
Poverty in Glide
Income Below Poverty by Sex and Age in Glide
With 17.5% poverty level for males and 12.7% for females among the residents of Glide, 16 and 17 year old males and 35 to 44 year old females are the most vulnerable to poverty, with 14 males (100.0%) and 15 females (100.0%) in their respective age groups living below the poverty level.
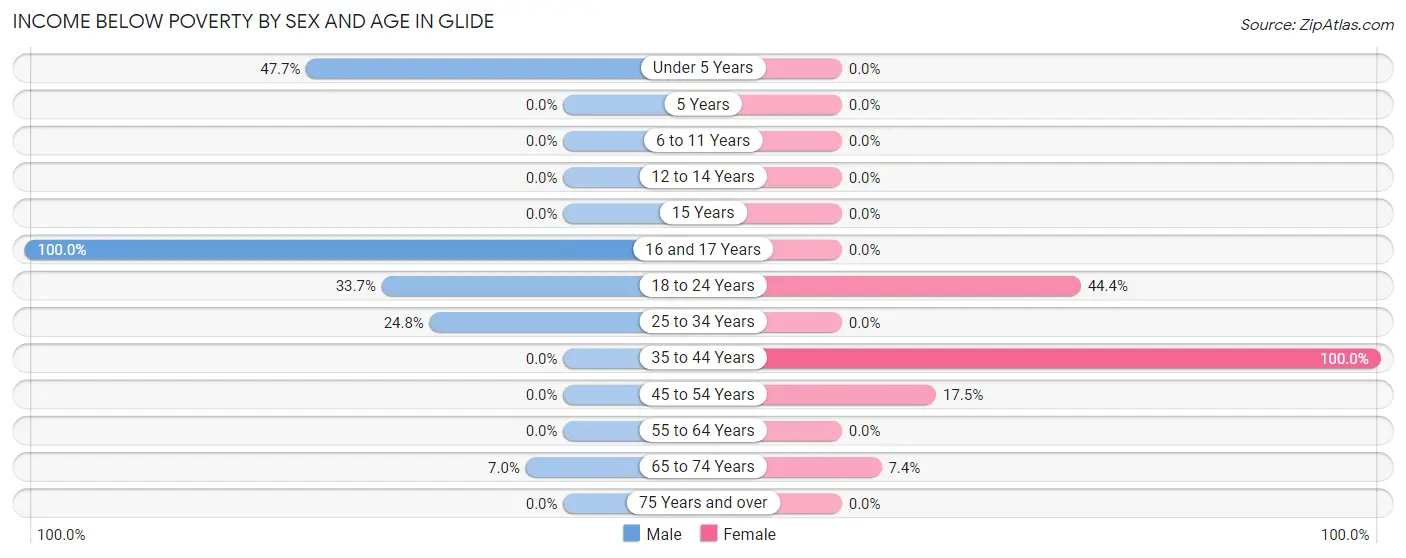
| Age Bracket | Male | Female |
| Under 5 Years | 52 (47.7%) | 0 (0.0%) |
| 5 Years | 0 (0.0%) | 0 (0.0%) |
| 6 to 11 Years | 0 (0.0%) | 0 (0.0%) |
| 12 to 14 Years | 0 (0.0%) | 0 (0.0%) |
| 15 Years | 0 (0.0%) | 0 (0.0%) |
| 16 and 17 Years | 14 (100.0%) | 0 (0.0%) |
| 18 to 24 Years | 30 (33.7%) | 51 (44.4%) |
| 25 to 34 Years | 32 (24.8%) | 0 (0.0%) |
| 35 to 44 Years | 0 (0.0%) | 15 (100.0%) |
| 45 to 54 Years | 0 (0.0%) | 14 (17.5%) |
| 55 to 64 Years | 0 (0.0%) | 0 (0.0%) |
| 65 to 74 Years | 12 (7.0%) | 12 (7.4%) |
| 75 Years and over | 0 (0.0%) | 0 (0.0%) |
| Total | 140 (17.5%) | 92 (12.7%) |
Income Above Poverty by Sex and Age in Glide
According to the poverty statistics in Glide, males aged 45 to 54 years and females aged under 5 years are the age groups that are most secure financially, with 100.0% of males and 100.0% of females in these age groups living above the poverty line.
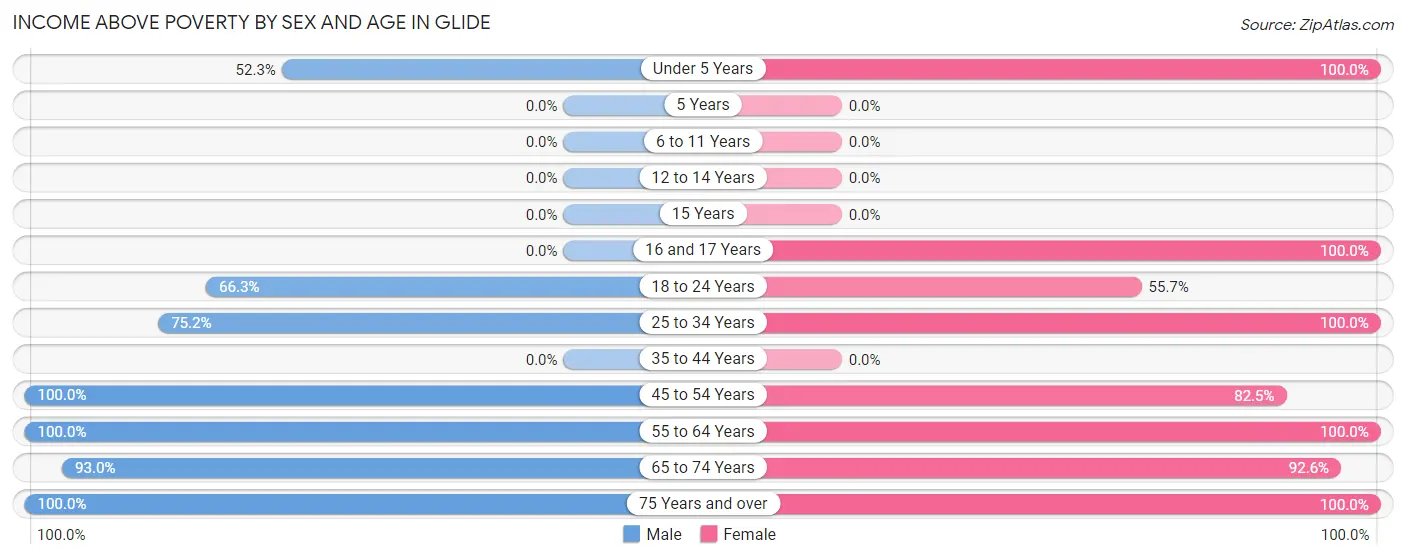
| Age Bracket | Male | Female |
| Under 5 Years | 57 (52.3%) | 57 (100.0%) |
| 5 Years | 0 (0.0%) | 0 (0.0%) |
| 6 to 11 Years | 0 (0.0%) | 0 (0.0%) |
| 12 to 14 Years | 0 (0.0%) | 0 (0.0%) |
| 15 Years | 0 (0.0%) | 0 (0.0%) |
| 16 and 17 Years | 0 (0.0%) | 21 (100.0%) |
| 18 to 24 Years | 59 (66.3%) | 64 (55.6%) |
| 25 to 34 Years | 97 (75.2%) | 30 (100.0%) |
| 35 to 44 Years | 0 (0.0%) | 0 (0.0%) |
| 45 to 54 Years | 58 (100.0%) | 66 (82.5%) |
| 55 to 64 Years | 133 (100.0%) | 139 (100.0%) |
| 65 to 74 Years | 160 (93.0%) | 151 (92.6%) |
| 75 Years and over | 97 (100.0%) | 102 (100.0%) |
| Total | 661 (82.5%) | 630 (87.3%) |
Income Below Poverty Among Married-Couple Families in Glide
The poverty statistics for married-couple families in Glide show that 5.5% or 27 of the total 491 families live below the poverty line. Families with 1 or 2 children have the highest poverty rate of 16.3%, comprising of 15 families. On the other hand, families with no children have the lowest poverty rate of 3.0%, which includes 12 families.
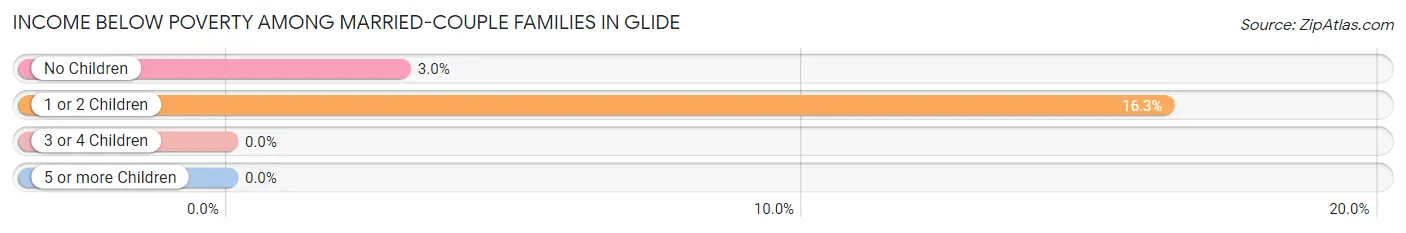
| Children | Above Poverty | Below Poverty |
| No Children | 387 (97.0%) | 12 (3.0%) |
| 1 or 2 Children | 77 (83.7%) | 15 (16.3%) |
| 3 or 4 Children | 0 (0.0%) | 0 (0.0%) |
| 5 or more Children | 0 (0.0%) | 0 (0.0%) |
| Total | 464 (94.5%) | 27 (5.5%) |
Income Below Poverty Among Single-Parent Households in Glide
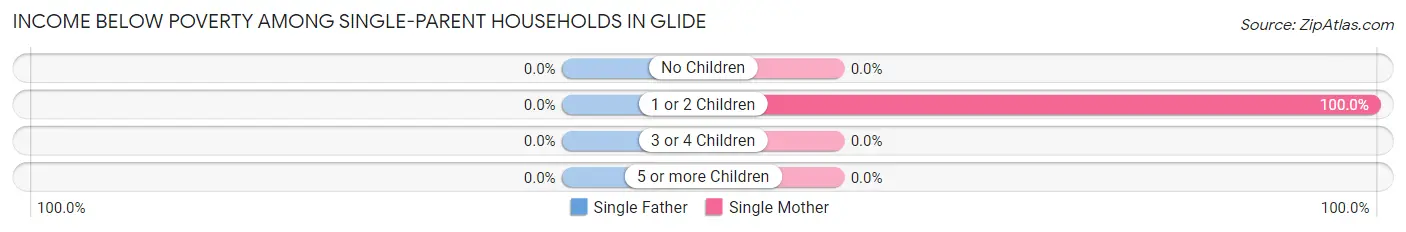
| Children | Single Father | Single Mother |
| No Children | 0 (0.0%) | 0 (0.0%) |
| 1 or 2 Children | 0 (0.0%) | 15 (100.0%) |
| 3 or 4 Children | 0 (0.0%) | 0 (0.0%) |
| 5 or more Children | 0 (0.0%) | 0 (0.0%) |
| Total | 0 (0.0%) | 15 (65.2%) |
Income Below Poverty Among Married-Couple vs Single-Parent Households in Glide
The poverty data for Glide shows that 27 of the married-couple family households (5.5%) and 15 of the single-parent households (65.2%) are living below the poverty level. Within the married-couple family households, those with 1 or 2 children have the highest poverty rate, with 15 households (16.3%) falling below the poverty line. Among the single-parent households, those with 1 or 2 children have the highest poverty rate, with 15 household (100.0%) living below poverty.
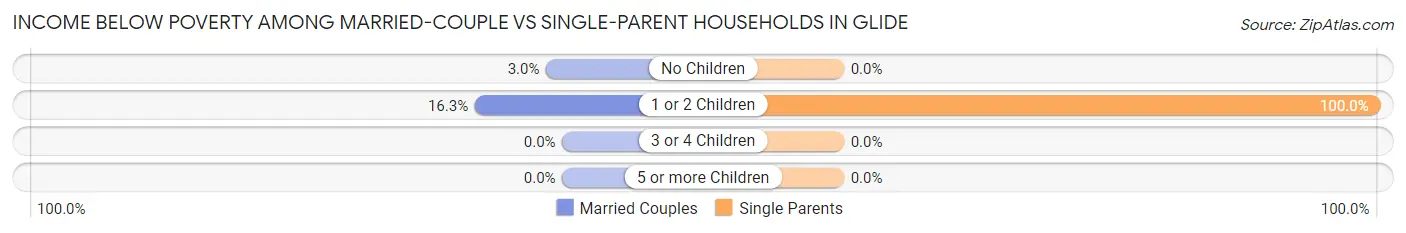
| Children | Married-Couple Families | Single-Parent Households |
| No Children | 12 (3.0%) | 0 (0.0%) |
| 1 or 2 Children | 15 (16.3%) | 15 (100.0%) |
| 3 or 4 Children | 0 (0.0%) | 0 (0.0%) |
| 5 or more Children | 0 (0.0%) | 0 (0.0%) |
| Total | 27 (5.5%) | 15 (65.2%) |
Race in Glide
The most populous races in Glide are White / Caucasian (1,263 | 82.9%), Two or more Races (202 | 13.3%), and Hispanic or Latino (166 | 10.9%).
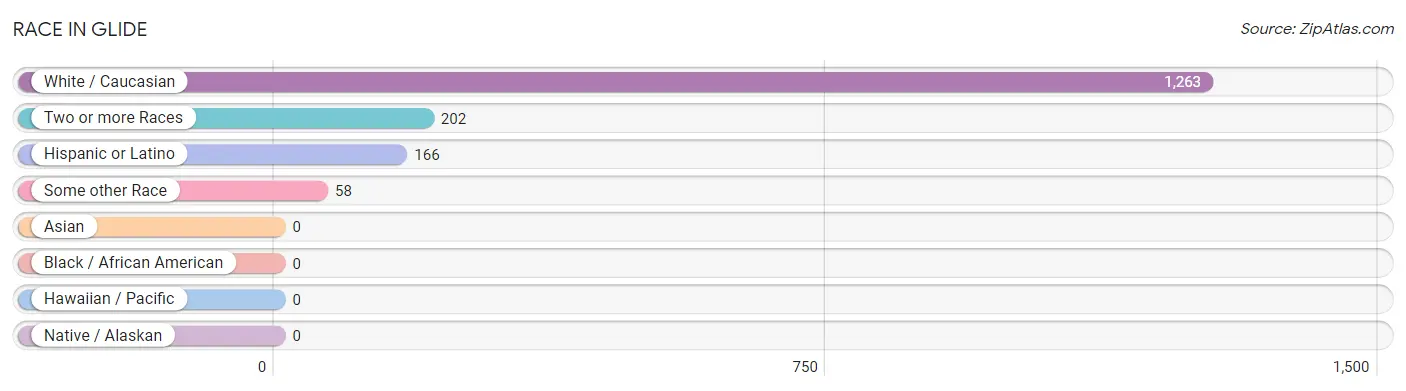
| Race | # Population | % Population |
| Asian | 0 | 0.0% |
| Black / African American | 0 | 0.0% |
| Hawaiian / Pacific | 0 | 0.0% |
| Hispanic or Latino | 166 | 10.9% |
| Native / Alaskan | 0 | 0.0% |
| White / Caucasian | 1,263 | 82.9% |
| Two or more Races | 202 | 13.3% |
| Some other Race | 58 | 3.8% |
| Total | 1,523 | 100.0% |
Ancestry in Glide
The most populous ancestries reported in Glide are Irish (234 | 15.4%), German (206 | 13.5%), English (147 | 9.7%), Swedish (102 | 6.7%), and American (95 | 6.2%), together accounting for 51.5% of all Glide residents.
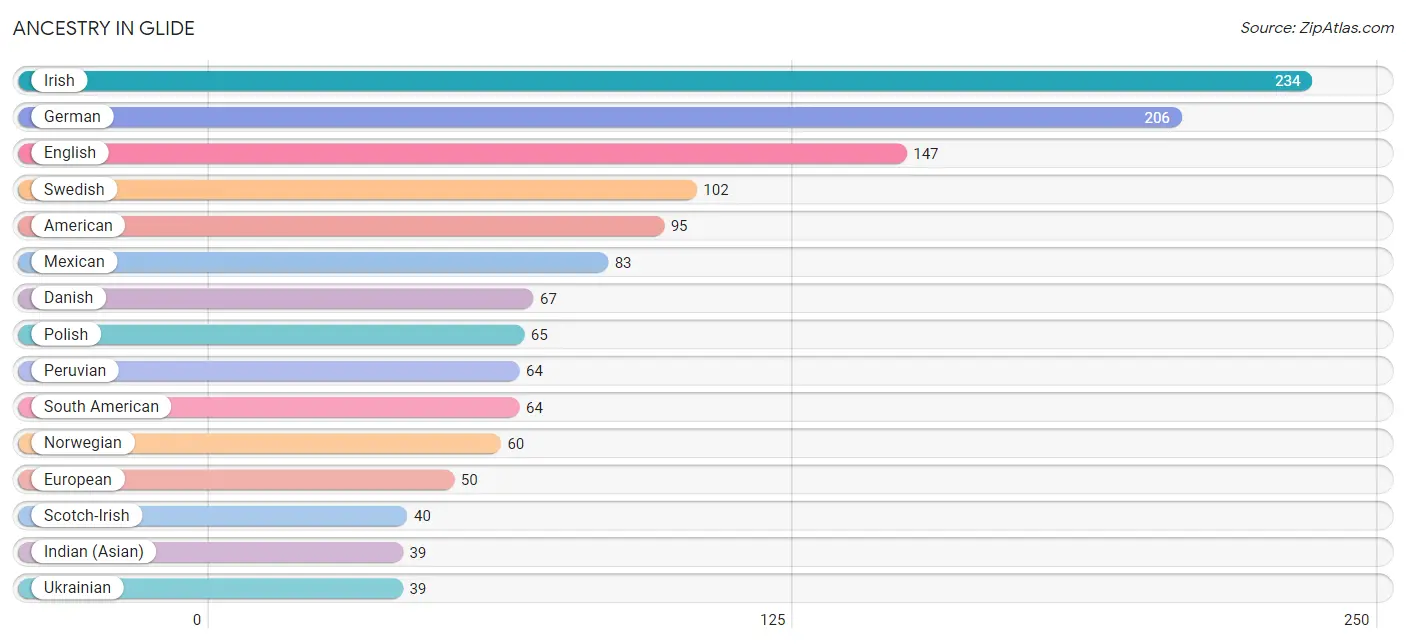
| Ancestry | # Population | % Population |
| American | 95 | 6.2% |
| Austrian | 11 | 0.7% |
| Central American | 19 | 1.3% |
| Cherokee | 14 | 0.9% |
| Danish | 67 | 4.4% |
| Dutch | 11 | 0.7% |
| English | 147 | 9.7% |
| European | 50 | 3.3% |
| French | 12 | 0.8% |
| German | 206 | 13.5% |
| Icelander | 11 | 0.7% |
| Indian (Asian) | 39 | 2.6% |
| Irish | 234 | 15.4% |
| Italian | 12 | 0.8% |
| Korean | 25 | 1.6% |
| Mexican | 83 | 5.4% |
| Norwegian | 60 | 3.9% |
| Peruvian | 64 | 4.2% |
| Polish | 65 | 4.3% |
| Russian | 13 | 0.9% |
| Salvadoran | 19 | 1.3% |
| Scotch-Irish | 40 | 2.6% |
| Scottish | 37 | 2.4% |
| South American | 64 | 4.2% |
| Swedish | 102 | 6.7% |
| Ukrainian | 39 | 2.6% |
| Welsh | 10 | 0.7% | View All 27 Rows |
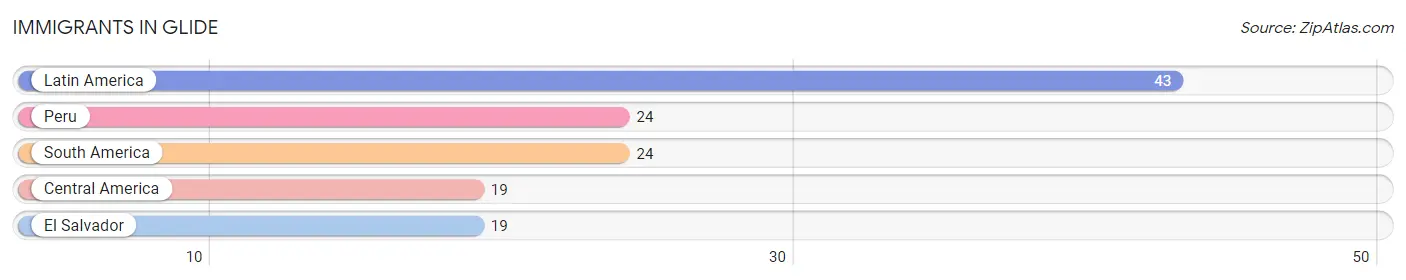
Immigrants in Glide
The most numerous immigrant groups reported in Glide came from Latin America (43 | 2.8%), Peru (24 | 1.6%), South America (24 | 1.6%), Central America (19 | 1.3%), and El Salvador (19 | 1.3%), together accounting for 8.5% of all Glide residents.
| Immigration Origin | # Population | % Population |
| Central America | 19 | 1.3% |
| El Salvador | 19 | 1.3% |
| Latin America | 43 | 2.8% |
| Peru | 24 | 1.6% |
| South America | 24 | 1.6% | View All 5 Rows |
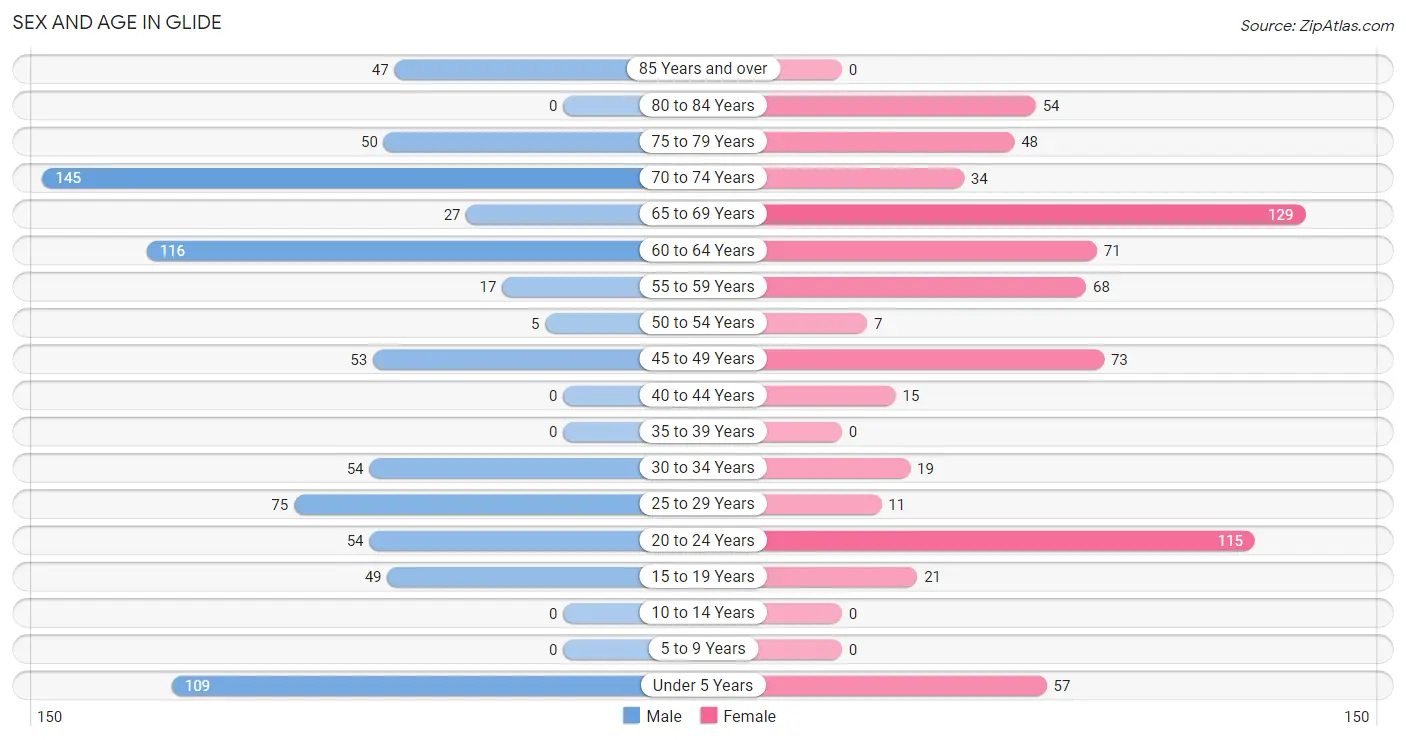
Sex and Age in Glide
Sex and Age in Glide
The most populous age groups in Glide are 70 to 74 Years (145 | 18.1%) for men and 65 to 69 Years (129 | 17.9%) for women.
| Age Bracket | Male | Female |
| Under 5 Years | 109 (13.6%) | 57 (7.9%) |
| 5 to 9 Years | 0 (0.0%) | 0 (0.0%) |
| 10 to 14 Years | 0 (0.0%) | 0 (0.0%) |
| 15 to 19 Years | 49 (6.1%) | 21 (2.9%) |
| 20 to 24 Years | 54 (6.7%) | 115 (15.9%) |
| 25 to 29 Years | 75 (9.4%) | 11 (1.5%) |
| 30 to 34 Years | 54 (6.7%) | 19 (2.6%) |
| 35 to 39 Years | 0 (0.0%) | 0 (0.0%) |
| 40 to 44 Years | 0 (0.0%) | 15 (2.1%) |
| 45 to 49 Years | 53 (6.6%) | 73 (10.1%) |
| 50 to 54 Years | 5 (0.6%) | 7 (1.0%) |
| 55 to 59 Years | 17 (2.1%) | 68 (9.4%) |
| 60 to 64 Years | 116 (14.5%) | 71 (9.8%) |
| 65 to 69 Years | 27 (3.4%) | 129 (17.9%) |
| 70 to 74 Years | 145 (18.1%) | 34 (4.7%) |
| 75 to 79 Years | 50 (6.2%) | 48 (6.7%) |
| 80 to 84 Years | 0 (0.0%) | 54 (7.5%) |
| 85 Years and over | 47 (5.9%) | 0 (0.0%) |
| Total | 801 (100.0%) | 722 (100.0%) |
Families and Households in Glide
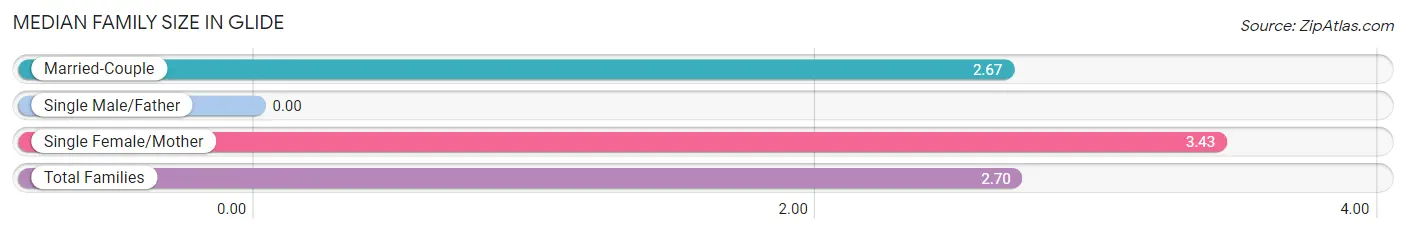
Median Family Size in Glide
| Family Type | # Families | Family Size |
| Married-Couple | 491 (95.5%) | 2.67 |
| Single Male/Father | 0 (0.0%) | - |
| Single Female/Mother | 23 (4.5%) | 3.43 |
| Total Families | 514 (100.0%) | 2.70 |
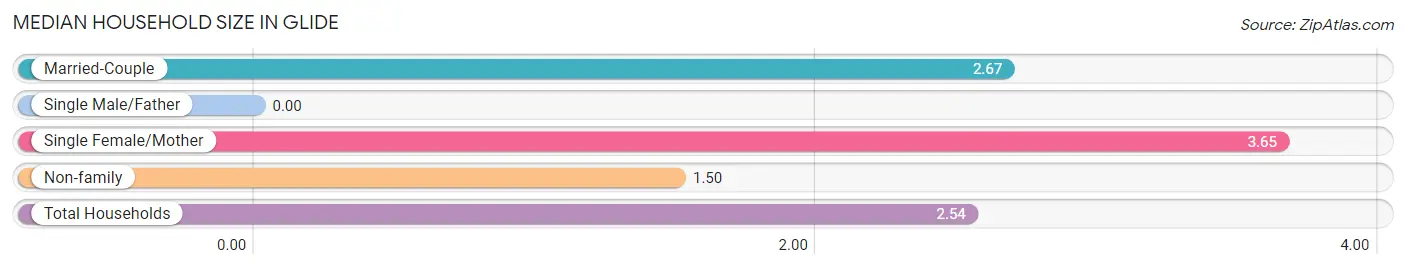
Median Household Size in Glide
| Household Type | # Households | Household Size |
| Married-Couple | 491 (81.8%) | 2.67 |
| Single Male/Father | 0 (0.0%) | - |
| Single Female/Mother | 23 (3.8%) | 3.65 |
| Non-family | 86 (14.3%) | 1.50 |
| Total Households | 600 (100.0%) | 2.54 |
Household Size by Marriage Status in Glide
Out of a total of 600 households in Glide, 514 (85.7%) are family households, while 86 (14.3%) are nonfamily households. The most numerous type of family households are 2-person households, comprising 354, and the most common type of nonfamily households are 2-person households, comprising 50.
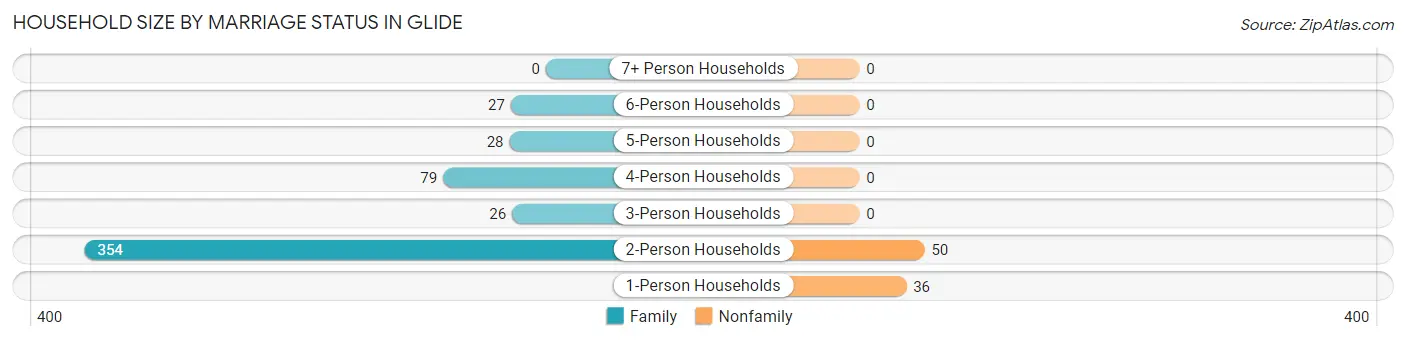
| Household Size | Family Households | Nonfamily Households |
| 1-Person Households | - | 36 (6.0%) |
| 2-Person Households | 354 (59.0%) | 50 (8.3%) |
| 3-Person Households | 26 (4.3%) | 0 (0.0%) |
| 4-Person Households | 79 (13.2%) | 0 (0.0%) |
| 5-Person Households | 28 (4.7%) | 0 (0.0%) |
| 6-Person Households | 27 (4.5%) | 0 (0.0%) |
| 7+ Person Households | 0 (0.0%) | 0 (0.0%) |
| Total | 514 (85.7%) | 86 (14.3%) |
Female Fertility in Glide
Fertility by Age in Glide
Average fertility rate in Glide is 189.0 births per 1,000 women. Women in the age bracket of 20 to 34 years have the highest fertility rate with 331.0 births per 1,000 women. Women in the age bracket of 20 to 34 years acount for 100.0% of all women with births.
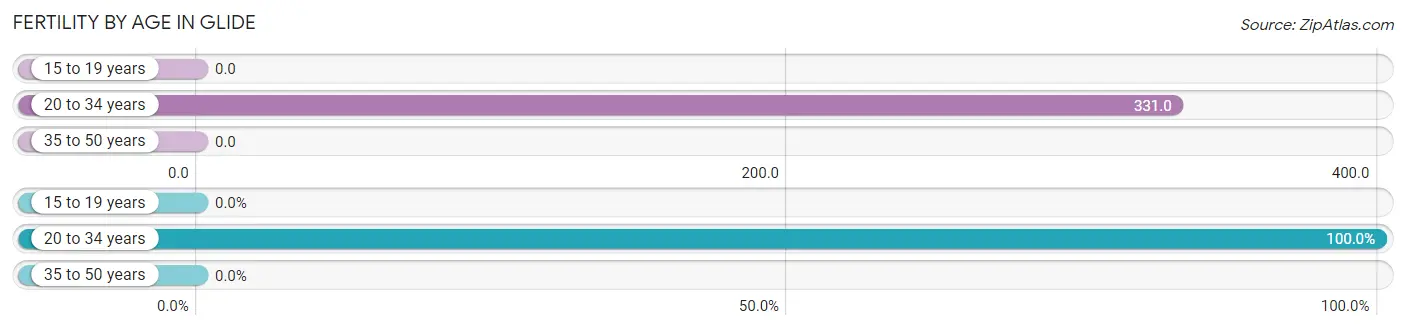
| Age Bracket | Women with Births | Births / 1,000 Women |
| 15 to 19 years | 0 (0.0%) | 0.0 |
| 20 to 34 years | 48 (100.0%) | 331.0 |
| 35 to 50 years | 0 (0.0%) | 0.0 |
| Total | 48 (100.0%) | 189.0 |
Fertility by Age by Marriage Status in Glide
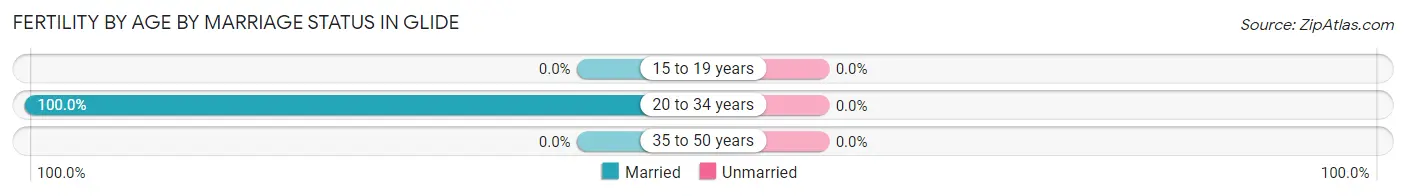
| Age Bracket | Married | Unmarried |
| 15 to 19 years | 0 (0.0%) | 0 (0.0%) |
| 20 to 34 years | 48 (100.0%) | 0 (0.0%) |
| 35 to 50 years | 0 (0.0%) | 0 (0.0%) |
| Total | 48 (100.0%) | 0 (0.0%) |
Fertility by Education in Glide
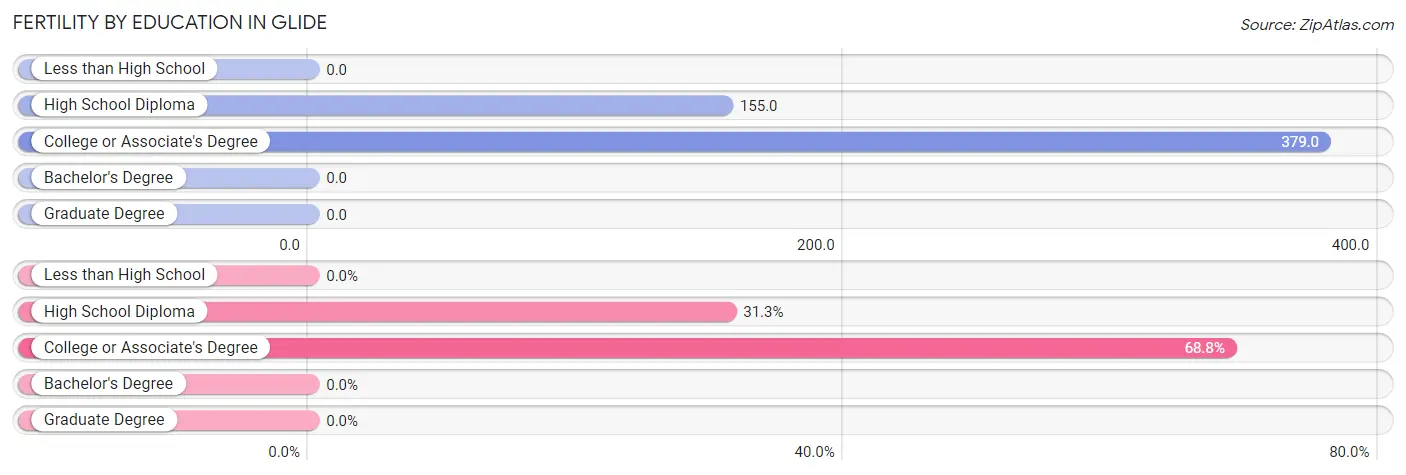
| Educational Attainment | Women with Births | Births / 1,000 Women |
| Less than High School | 0 (0.0%) | 0.0 |
| High School Diploma | 15 (31.2%) | 155.0 |
| College or Associate's Degree | 33 (68.8%) | 379.0 |
| Bachelor's Degree | 0 (0.0%) | 0.0 |
| Graduate Degree | 0 (0.0%) | 0.0 |
| Total | 48 (100.0%) | 189.0 |
Fertility by Education by Marriage Status in Glide
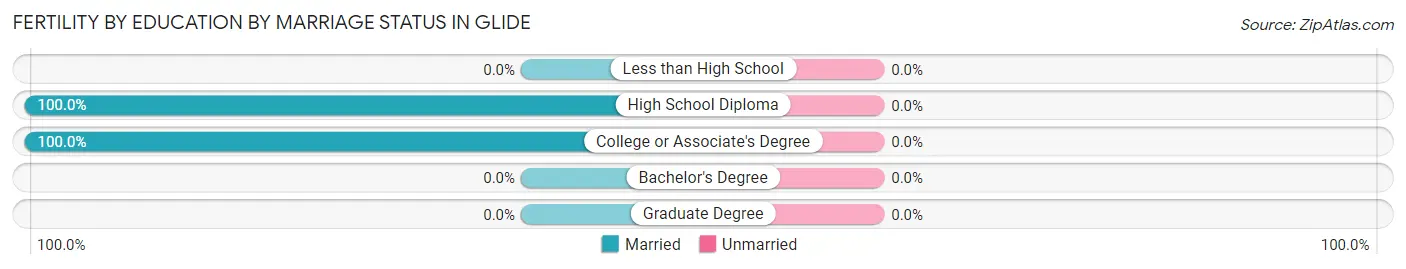
| Educational Attainment | Married | Unmarried |
| Less than High School | 0 (0.0%) | 0 (0.0%) |
| High School Diploma | 15 (100.0%) | 0 (0.0%) |
| College or Associate's Degree | 33 (100.0%) | 0 (0.0%) |
| Bachelor's Degree | 0 (0.0%) | 0 (0.0%) |
| Graduate Degree | 0 (0.0%) | 0 (0.0%) |
| Total | 48 (100.0%) | 0 (0.0%) |
Employment Characteristics in Glide
Employment by Class of Employer in Glide
Among the 582 employed individuals in Glide, private company employees (332 | 57.0%), self-employed (not incorporated) (96 | 16.5%), and local government employees (64 | 11.0%) make up the most common classes of employment.
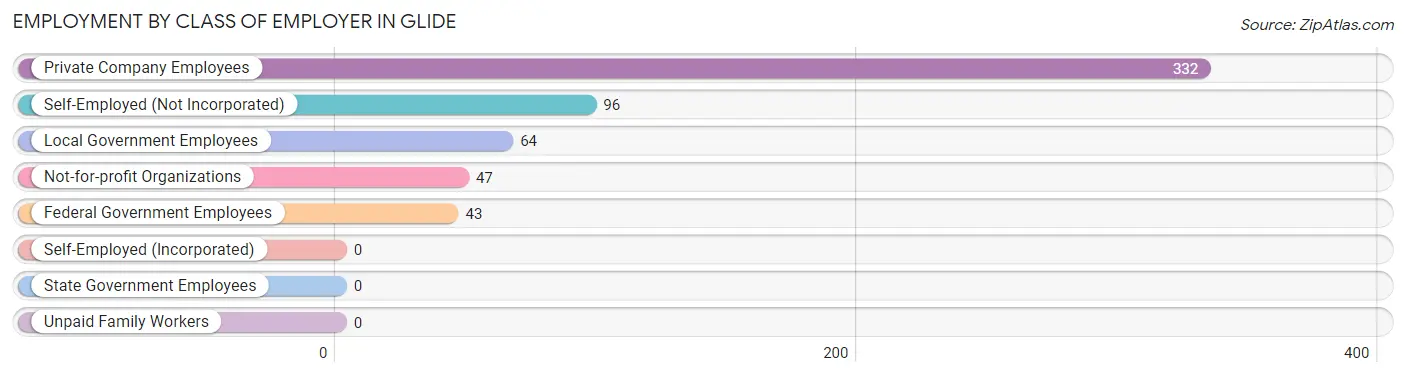
| Employer Class | # Employees | % Employees |
| Private Company Employees | 332 | 57.0% |
| Self-Employed (Incorporated) | 0 | 0.0% |
| Self-Employed (Not Incorporated) | 96 | 16.5% |
| Not-for-profit Organizations | 47 | 8.1% |
| Local Government Employees | 64 | 11.0% |
| State Government Employees | 0 | 0.0% |
| Federal Government Employees | 43 | 7.4% |
| Unpaid Family Workers | 0 | 0.0% |
| Total | 582 | 100.0% |
Employment Status by Age in Glide
According to the labor force statistics for Glide, out of the total population over 16 years of age (1,357), 47.2% or 641 individuals are in the labor force, with 7.5% or 48 of them unemployed. The age group with the highest labor force participation rate is 55 to 59 years, with 100.0% or 85 individuals in the labor force. Within the labor force, the 16 to 19 years age range has the highest percentage of unemployed individuals, with 62.5% or 35 of them being unemployed.
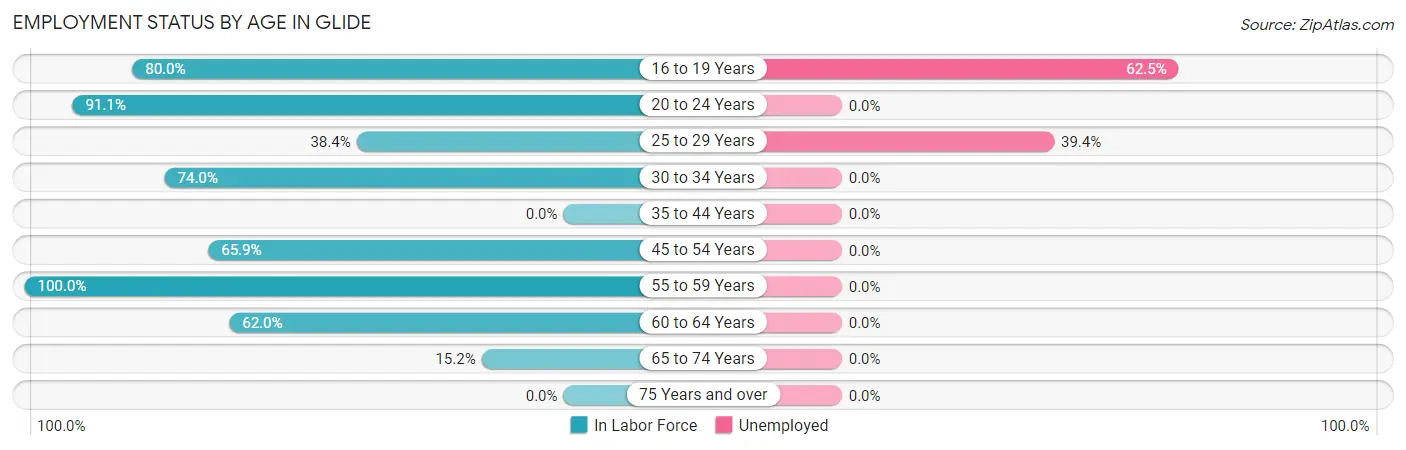
| Age Bracket | In Labor Force | Unemployed |
| 16 to 19 Years | 56 (80.0%) | 35 (62.5%) |
| 20 to 24 Years | 154 (91.1%) | 0 (0.0%) |
| 25 to 29 Years | 33 (38.4%) | 13 (39.4%) |
| 30 to 34 Years | 54 (74.0%) | 0 (0.0%) |
| 35 to 44 Years | 0 (0.0%) | 0 (0.0%) |
| 45 to 54 Years | 91 (65.9%) | 0 (0.0%) |
| 55 to 59 Years | 85 (100.0%) | 0 (0.0%) |
| 60 to 64 Years | 116 (62.0%) | 0 (0.0%) |
| 65 to 74 Years | 51 (15.2%) | 0 (0.0%) |
| 75 Years and over | 0 (0.0%) | 0 (0.0%) |
| Total | 641 (47.2%) | 48 (7.5%) |
Employment Status by Educational Attainment in Glide
According to labor force statistics for Glide, 64.9% of individuals (379) out of the total population between 25 and 64 years of age (584) are in the labor force, with 3.4% or 13 of them being unemployed. The group with the highest labor force participation rate are those with the educational attainment of bachelor's degree or higher, with 100.0% or 88 individuals in the labor force. Within the labor force, individuals with high school diploma education have the highest percentage of unemployment, with 13.7% or 13 of them being unemployed.
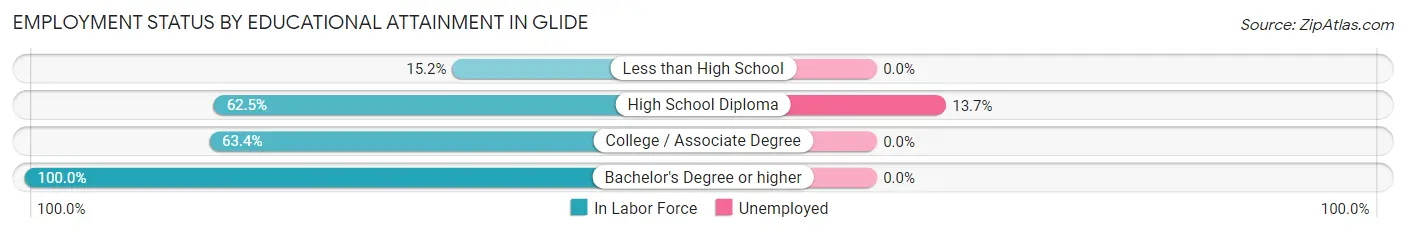
| Educational Attainment | In Labor Force | Unemployed |
| Less than High School | 7 (15.2%) | 0 (0.0%) |
| High School Diploma | 95 (62.5%) | 21 (13.7%) |
| College / Associate Degree | 189 (63.4%) | 0 (0.0%) |
| Bachelor's Degree or higher | 88 (100.0%) | 0 (0.0%) |
| Total | 379 (64.9%) | 20 (3.4%) |
Employment Occupations by Sex in Glide
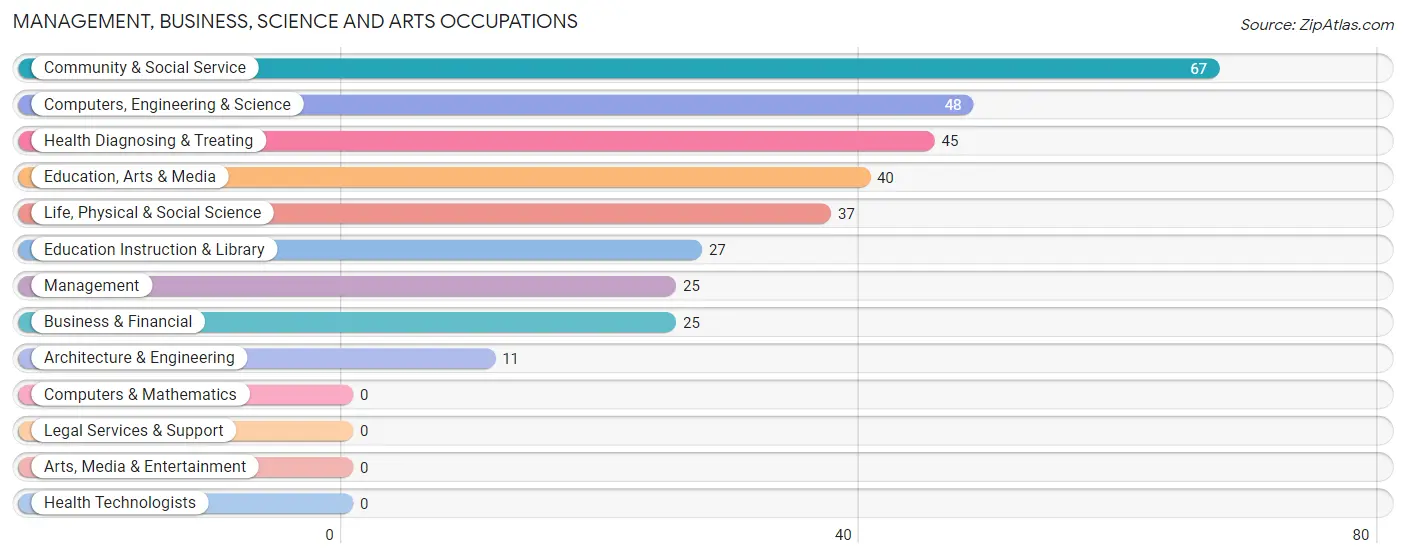
Management, Business, Science and Arts Occupations
The most common Management, Business, Science and Arts occupations in Glide are Community & Social Service (67 | 11.3%), Computers, Engineering & Science (48 | 8.1%), Health Diagnosing & Treating (45 | 7.6%), Education, Arts & Media (40 | 6.8%), and Life, Physical & Social Science (37 | 6.2%).
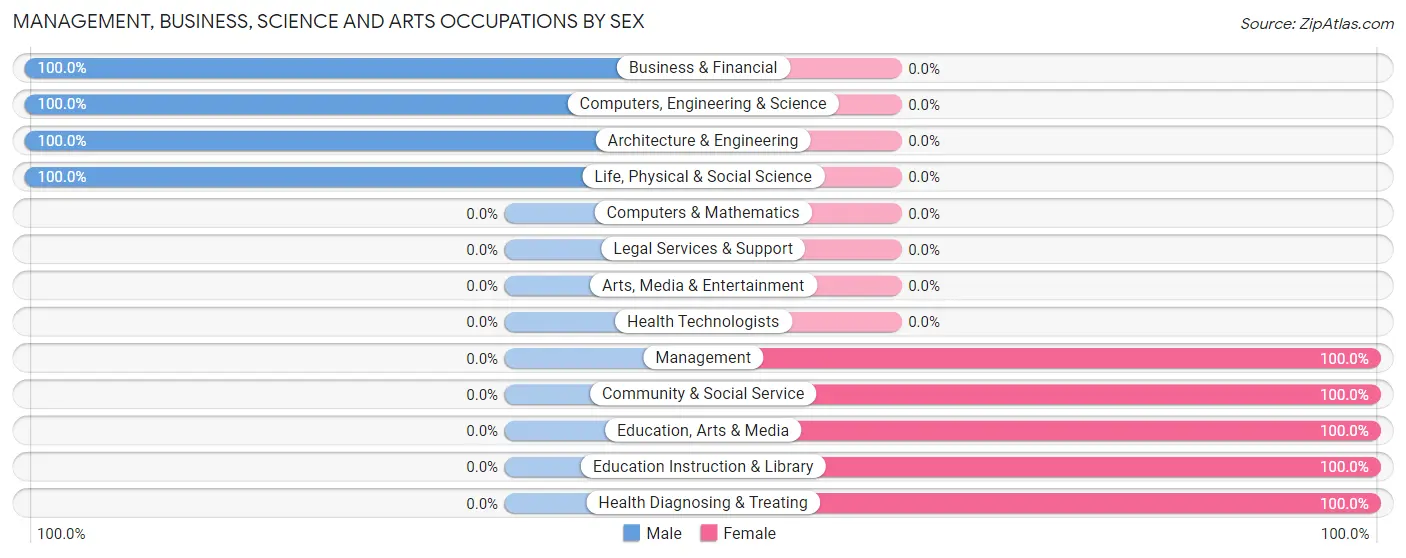
Management, Business, Science and Arts Occupations by Sex
Within the Management, Business, Science and Arts occupations in Glide, the most male-oriented occupations are Business & Financial (100.0%), Computers, Engineering & Science (100.0%), and Architecture & Engineering (100.0%), while the most female-oriented occupations are Management (100.0%), Community & Social Service (100.0%), and Education, Arts & Media (100.0%).
| Occupation | Male | Female |
| Management | 0 (0.0%) | 25 (100.0%) |
| Business & Financial | 25 (100.0%) | 0 (0.0%) |
| Computers, Engineering & Science | 48 (100.0%) | 0 (0.0%) |
| Computers & Mathematics | 0 (0.0%) | 0 (0.0%) |
| Architecture & Engineering | 11 (100.0%) | 0 (0.0%) |
| Life, Physical & Social Science | 37 (100.0%) | 0 (0.0%) |
| Community & Social Service | 0 (0.0%) | 67 (100.0%) |
| Education, Arts & Media | 0 (0.0%) | 40 (100.0%) |
| Legal Services & Support | 0 (0.0%) | 0 (0.0%) |
| Education Instruction & Library | 0 (0.0%) | 27 (100.0%) |
| Arts, Media & Entertainment | 0 (0.0%) | 0 (0.0%) |
| Health Diagnosing & Treating | 0 (0.0%) | 45 (100.0%) |
| Health Technologists | 0 (0.0%) | 0 (0.0%) |
| Total (Category) | 73 (34.8%) | 137 (65.2%) |
| Total (Overall) | 246 (41.5%) | 346 (58.5%) |
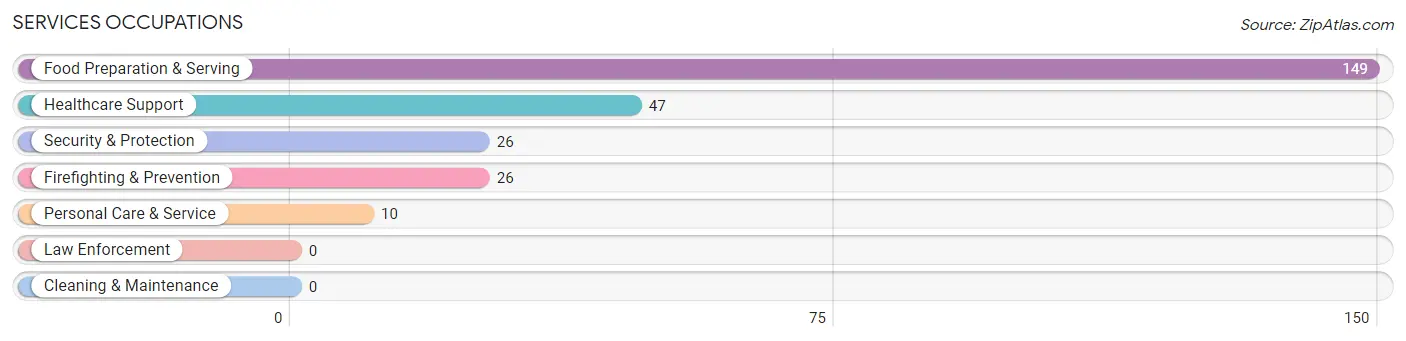
Services Occupations
The most common Services occupations in Glide are Food Preparation & Serving (149 | 25.2%), Healthcare Support (47 | 7.9%), Security & Protection (26 | 4.4%), Firefighting & Prevention (26 | 4.4%), and Personal Care & Service (10 | 1.7%).
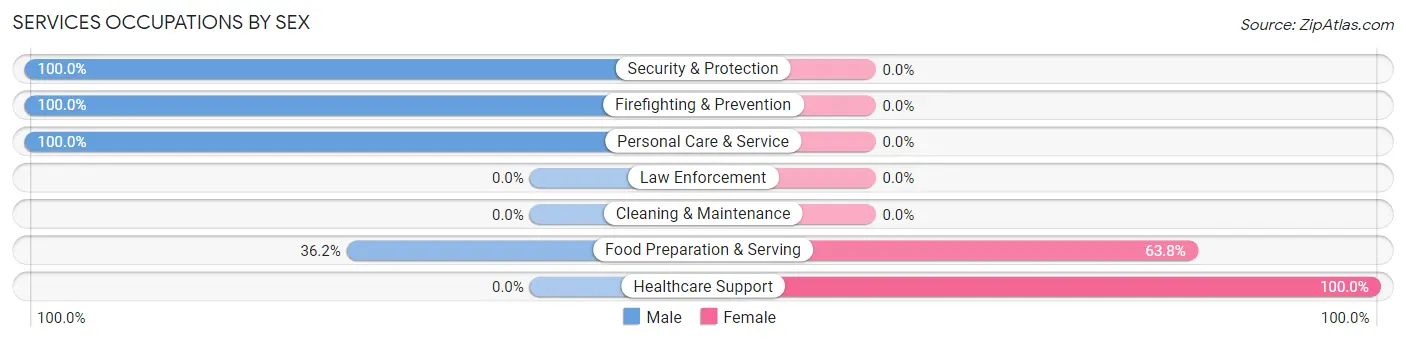
Services Occupations by Sex
Within the Services occupations in Glide, the most male-oriented occupations are Security & Protection (100.0%), Firefighting & Prevention (100.0%), and Personal Care & Service (100.0%), while the most female-oriented occupations are Healthcare Support (100.0%), and Food Preparation & Serving (63.8%).
| Occupation | Male | Female |
| Healthcare Support | 0 (0.0%) | 47 (100.0%) |
| Security & Protection | 26 (100.0%) | 0 (0.0%) |
| Firefighting & Prevention | 26 (100.0%) | 0 (0.0%) |
| Law Enforcement | 0 (0.0%) | 0 (0.0%) |
| Food Preparation & Serving | 54 (36.2%) | 95 (63.8%) |
| Cleaning & Maintenance | 0 (0.0%) | 0 (0.0%) |
| Personal Care & Service | 10 (100.0%) | 0 (0.0%) |
| Total (Category) | 90 (38.8%) | 142 (61.2%) |
| Total (Overall) | 246 (41.5%) | 346 (58.5%) |
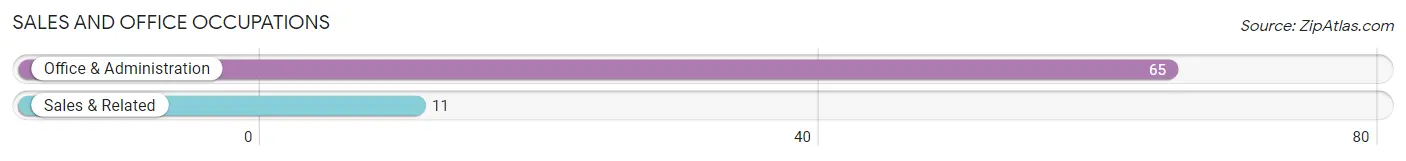
Sales and Office Occupations
The most common Sales and Office occupations in Glide are Office & Administration (65 | 11.0%), and Sales & Related (11 | 1.9%).
Sales and Office Occupations by Sex
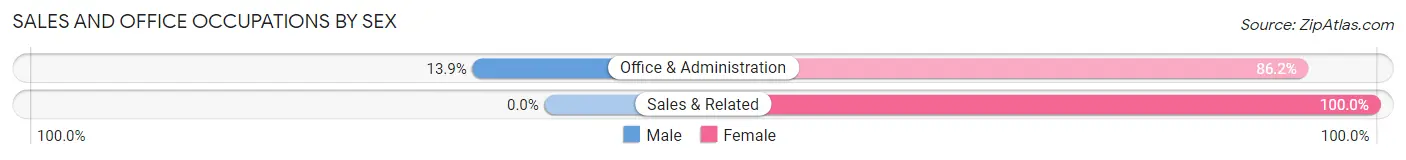
| Occupation | Male | Female |
| Sales & Related | 0 (0.0%) | 11 (100.0%) |
| Office & Administration | 9 (13.9%) | 56 (86.2%) |
| Total (Category) | 9 (11.8%) | 67 (88.2%) |
| Total (Overall) | 246 (41.5%) | 346 (58.5%) |
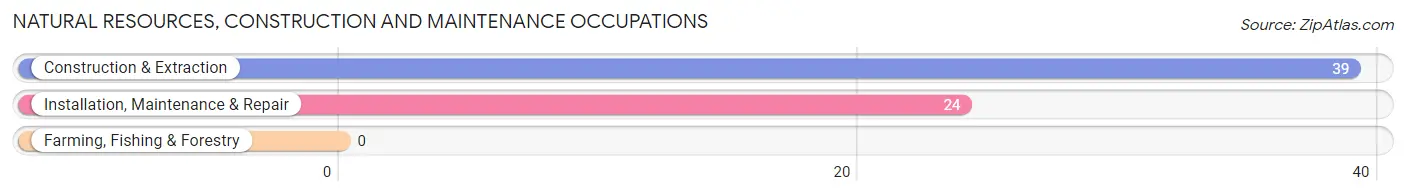
Natural Resources, Construction and Maintenance Occupations
The most common Natural Resources, Construction and Maintenance occupations in Glide are Construction & Extraction (39 | 6.6%), and Installation, Maintenance & Repair (24 | 4.1%).
Natural Resources, Construction and Maintenance Occupations by Sex
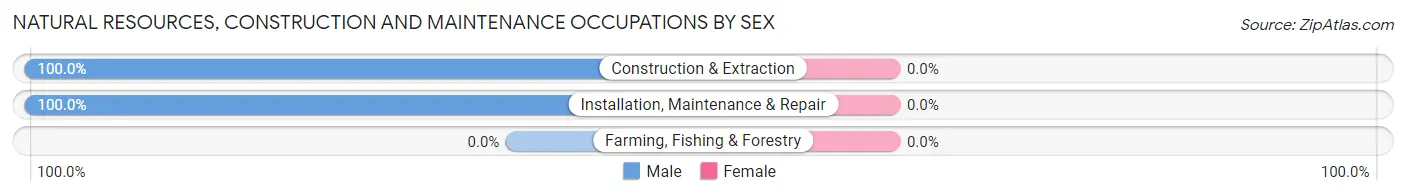
| Occupation | Male | Female |
| Farming, Fishing & Forestry | 0 (0.0%) | 0 (0.0%) |
| Construction & Extraction | 39 (100.0%) | 0 (0.0%) |
| Installation, Maintenance & Repair | 24 (100.0%) | 0 (0.0%) |
| Total (Category) | 63 (100.0%) | 0 (0.0%) |
| Total (Overall) | 246 (41.5%) | 346 (58.5%) |
Production, Transportation and Moving Occupations
The most common Production, Transportation and Moving occupations in Glide are , and Production (11 | 1.9%).
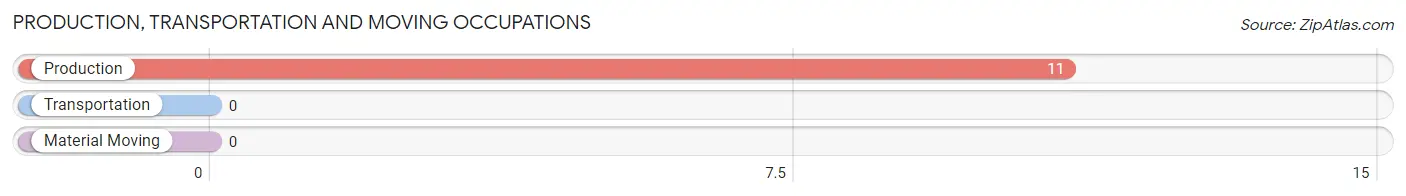
Production, Transportation and Moving Occupations by Sex
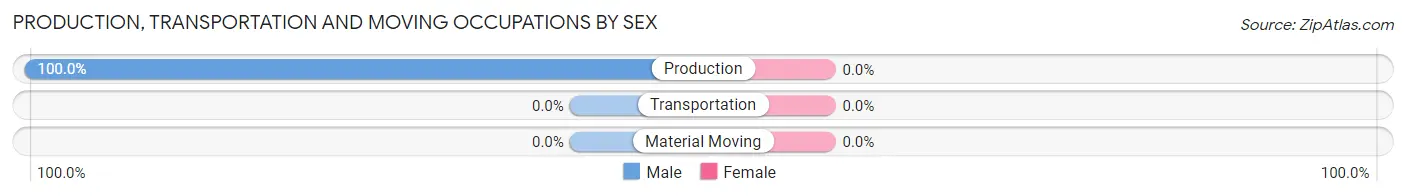
| Occupation | Male | Female |
| Production | 11 (100.0%) | 0 (0.0%) |
| Transportation | 0 (0.0%) | 0 (0.0%) |
| Material Moving | 0 (0.0%) | 0 (0.0%) |
| Total (Category) | 11 (100.0%) | 0 (0.0%) |
| Total (Overall) | 246 (41.5%) | 346 (58.5%) |
Employment Industries by Sex in Glide
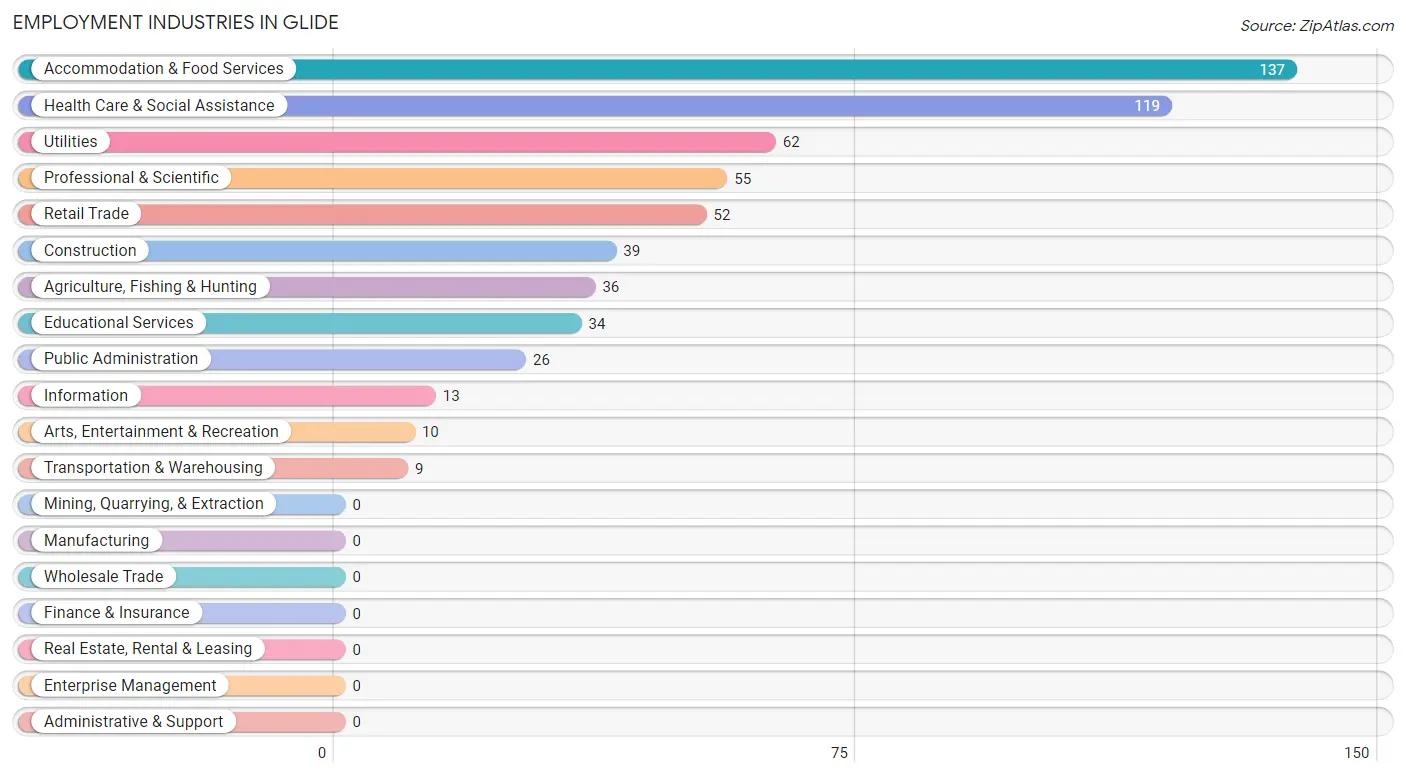
Employment Industries in Glide
The major employment industries in Glide include Accommodation & Food Services (137 | 23.1%), Health Care & Social Assistance (119 | 20.1%), Utilities (62 | 10.5%), Professional & Scientific (55 | 9.3%), and Retail Trade (52 | 8.8%).
Employment Industries by Sex in Glide
The Glide industries that see more men than women are Construction (100.0%), Transportation & Warehousing (100.0%), and Utilities (100.0%), whereas the industries that tend to have a higher number of women are Agriculture, Fishing & Hunting (100.0%), Information (100.0%), and Educational Services (100.0%).
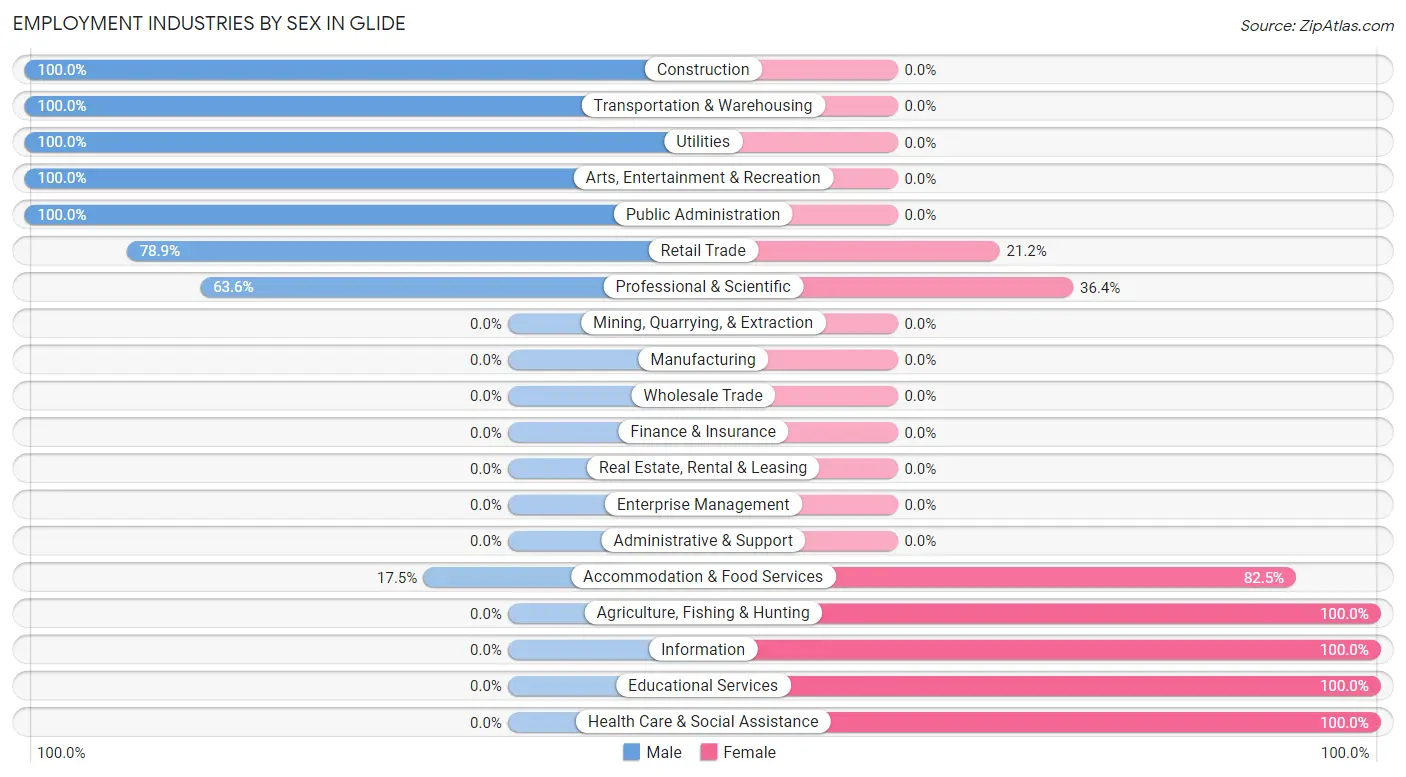
| Industry | Male | Female |
| Agriculture, Fishing & Hunting | 0 (0.0%) | 36 (100.0%) |
| Mining, Quarrying, & Extraction | 0 (0.0%) | 0 (0.0%) |
| Construction | 39 (100.0%) | 0 (0.0%) |
| Manufacturing | 0 (0.0%) | 0 (0.0%) |
| Wholesale Trade | 0 (0.0%) | 0 (0.0%) |
| Retail Trade | 41 (78.8%) | 11 (21.1%) |
| Transportation & Warehousing | 9 (100.0%) | 0 (0.0%) |
| Utilities | 62 (100.0%) | 0 (0.0%) |
| Information | 0 (0.0%) | 13 (100.0%) |
| Finance & Insurance | 0 (0.0%) | 0 (0.0%) |
| Real Estate, Rental & Leasing | 0 (0.0%) | 0 (0.0%) |
| Professional & Scientific | 35 (63.6%) | 20 (36.4%) |
| Enterprise Management | 0 (0.0%) | 0 (0.0%) |
| Administrative & Support | 0 (0.0%) | 0 (0.0%) |
| Educational Services | 0 (0.0%) | 34 (100.0%) |
| Health Care & Social Assistance | 0 (0.0%) | 119 (100.0%) |
| Arts, Entertainment & Recreation | 10 (100.0%) | 0 (0.0%) |
| Accommodation & Food Services | 24 (17.5%) | 113 (82.5%) |
| Public Administration | 26 (100.0%) | 0 (0.0%) |
| Total | 246 (41.5%) | 346 (58.5%) |
Education in Glide
School Enrollment in Glide
The most common levels of schooling among the 158 students in Glide are college / undergraduate (123 | 77.8%), and high school (35 | 22.2%).
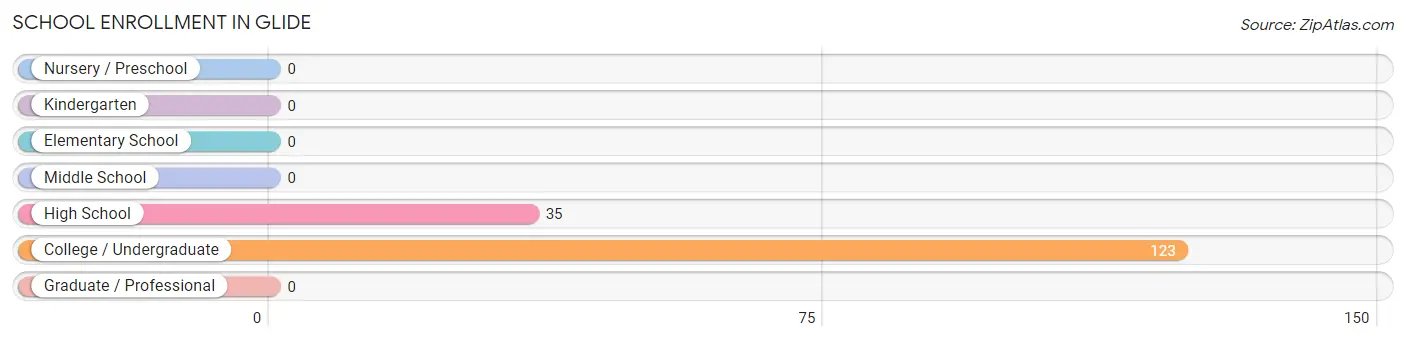
| School Level | # Students | % Students |
| Nursery / Preschool | 0 | 0.0% |
| Kindergarten | 0 | 0.0% |
| Elementary School | 0 | 0.0% |
| Middle School | 0 | 0.0% |
| High School | 35 | 22.2% |
| College / Undergraduate | 123 | 77.8% |
| Graduate / Professional | 0 | 0.0% |
| Total | 158 | 100.0% |
School Enrollment by Age by Funding Source in Glide
Out of a total of 158 students who are enrolled in schools in Glide, 21 (13.3%) attend a private institution, while the remaining 137 (86.7%) are enrolled in public schools. The age group of 15 to 17 year olds has the highest likelihood of being enrolled in private schools, with 21 (60.0% in the age bracket) enrolled. Conversely, the age group of 18 to 19 year olds has the lowest likelihood of being enrolled in a private school, with 35 (100.0% in the age bracket) attending a public institution.
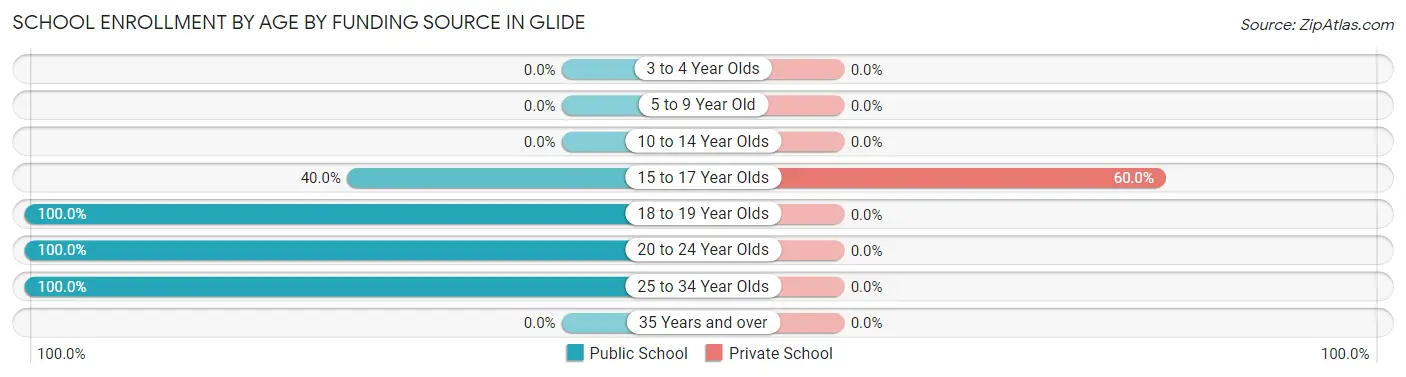
| Age Bracket | Public School | Private School |
| 3 to 4 Year Olds | 0 (0.0%) | 0 (0.0%) |
| 5 to 9 Year Old | 0 (0.0%) | 0 (0.0%) |
| 10 to 14 Year Olds | 0 (0.0%) | 0 (0.0%) |
| 15 to 17 Year Olds | 14 (40.0%) | 21 (60.0%) |
| 18 to 19 Year Olds | 35 (100.0%) | 0 (0.0%) |
| 20 to 24 Year Olds | 60 (100.0%) | 0 (0.0%) |
| 25 to 34 Year Olds | 28 (100.0%) | 0 (0.0%) |
| 35 Years and over | 0 (0.0%) | 0 (0.0%) |
| Total | 137 (86.7%) | 21 (13.3%) |
Educational Attainment by Field of Study in Glide
Literature & languages (51 | 32.1%), physical & health sciences (39 | 24.5%), bio, nature & agricultural (37 | 23.3%), liberal arts & history (12 | 7.5%), and social sciences (11 | 6.9%) are the most common fields of study among 159 individuals in Glide who have obtained a bachelor's degree or higher.
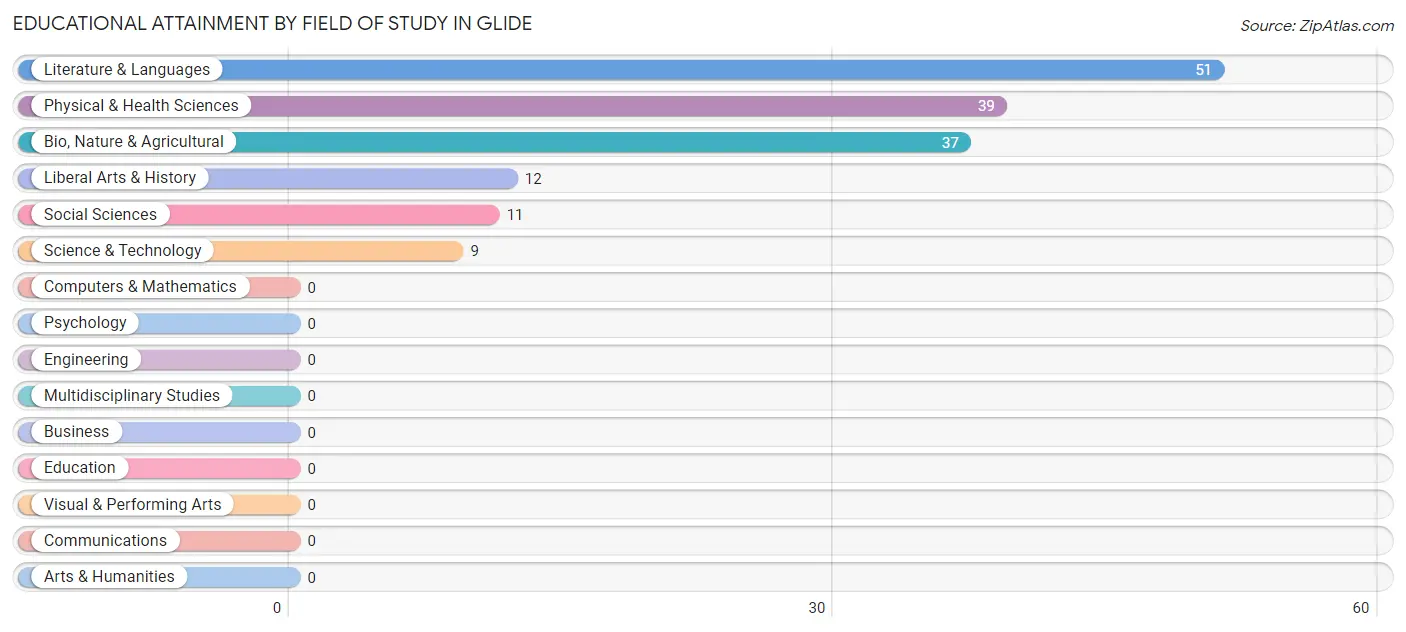
| Field of Study | # Graduates | % Graduates |
| Computers & Mathematics | 0 | 0.0% |
| Bio, Nature & Agricultural | 37 | 23.3% |
| Physical & Health Sciences | 39 | 24.5% |
| Psychology | 0 | 0.0% |
| Social Sciences | 11 | 6.9% |
| Engineering | 0 | 0.0% |
| Multidisciplinary Studies | 0 | 0.0% |
| Science & Technology | 9 | 5.7% |
| Business | 0 | 0.0% |
| Education | 0 | 0.0% |
| Literature & Languages | 51 | 32.1% |
| Liberal Arts & History | 12 | 7.5% |
| Visual & Performing Arts | 0 | 0.0% |
| Communications | 0 | 0.0% |
| Arts & Humanities | 0 | 0.0% |
| Total | 159 | 100.0% |
Transportation & Commute in Glide
Vehicle Availability by Sex in Glide
The most prevalent vehicle ownership categories in Glide are males with 3 vehicles (87, accounting for 36.9%) and females with 3 vehicles (122, making up 25.1%).
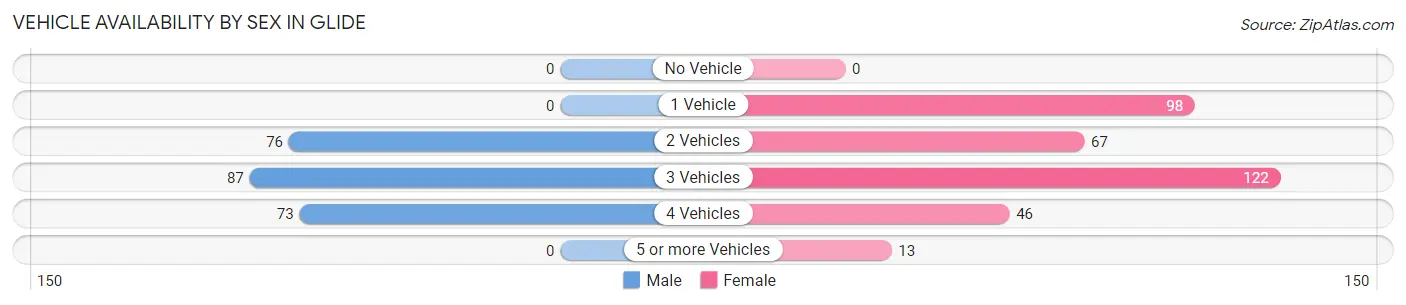
| Vehicles Available | Male | Female |
| No Vehicle | 0 (0.0%) | 0 (0.0%) |
| 1 Vehicle | 0 (0.0%) | 98 (28.3%) |
| 2 Vehicles | 76 (32.2%) | 67 (19.4%) |
| 3 Vehicles | 87 (36.9%) | 122 (35.3%) |
| 4 Vehicles | 73 (30.9%) | 46 (13.3%) |
| 5 or more Vehicles | 0 (0.0%) | 13 (3.8%) |
| Total | 236 (100.0%) | 346 (100.0%) |
Commute Time in Glide
The most frequently occuring commute durations in Glide are 10 to 14 minutes (136 commuters, 26.9%), 5 to 9 minutes (115 commuters, 22.8%), and 60 to 89 minutes (69 commuters, 13.7%).
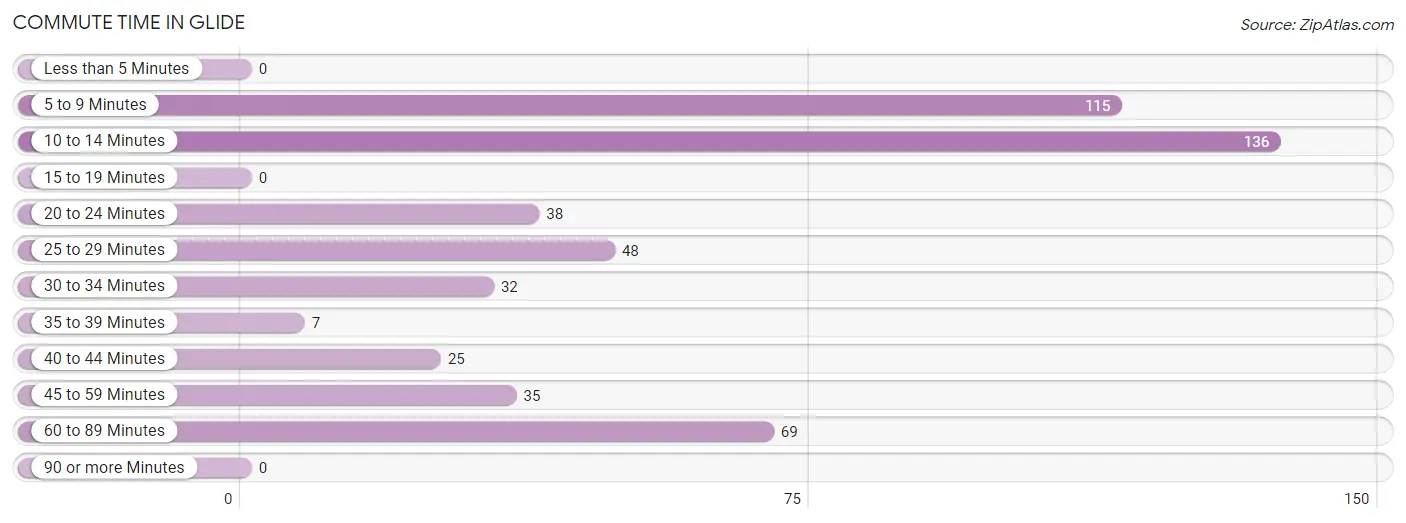
| Commute Time | # Commuters | % Commuters |
| Less than 5 Minutes | 0 | 0.0% |
| 5 to 9 Minutes | 115 | 22.8% |
| 10 to 14 Minutes | 136 | 26.9% |
| 15 to 19 Minutes | 0 | 0.0% |
| 20 to 24 Minutes | 38 | 7.5% |
| 25 to 29 Minutes | 48 | 9.5% |
| 30 to 34 Minutes | 32 | 6.3% |
| 35 to 39 Minutes | 7 | 1.4% |
| 40 to 44 Minutes | 25 | 5.0% |
| 45 to 59 Minutes | 35 | 6.9% |
| 60 to 89 Minutes | 69 | 13.7% |
| 90 or more Minutes | 0 | 0.0% |
Commute Time by Sex in Glide
The most common commute times in Glide are 10 to 14 minutes (69 commuters, 34.7%) for males and 5 to 9 minutes (91 commuters, 29.7%) for females.
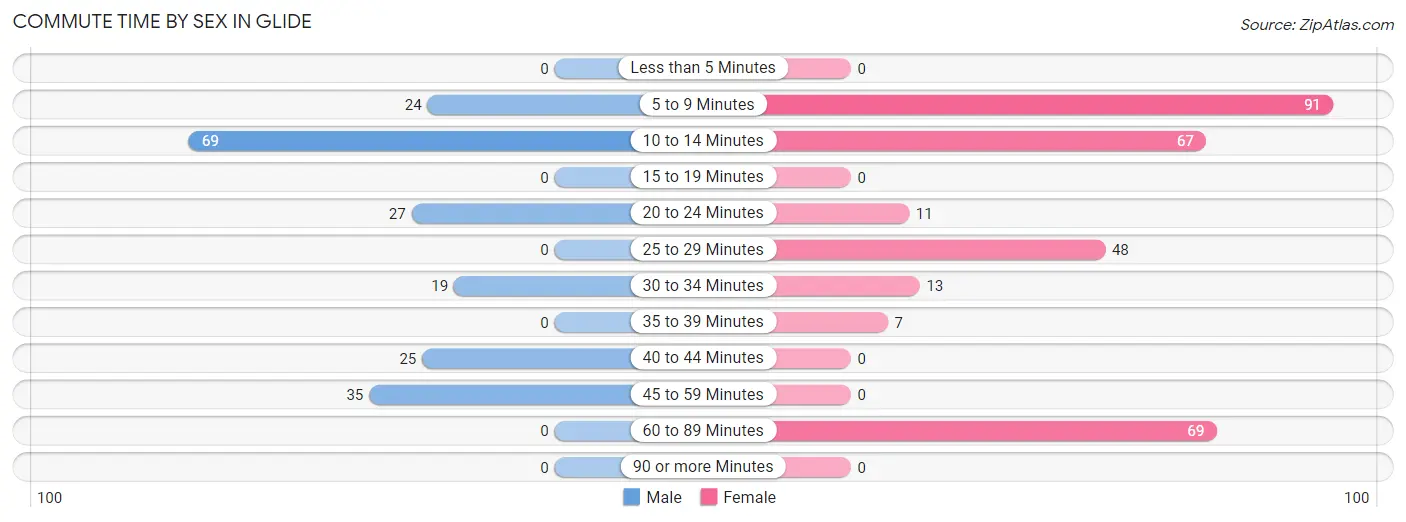
| Commute Time | Male | Female |
| Less than 5 Minutes | 0 (0.0%) | 0 (0.0%) |
| 5 to 9 Minutes | 24 (12.1%) | 91 (29.7%) |
| 10 to 14 Minutes | 69 (34.7%) | 67 (21.9%) |
| 15 to 19 Minutes | 0 (0.0%) | 0 (0.0%) |
| 20 to 24 Minutes | 27 (13.6%) | 11 (3.6%) |
| 25 to 29 Minutes | 0 (0.0%) | 48 (15.7%) |
| 30 to 34 Minutes | 19 (9.6%) | 13 (4.3%) |
| 35 to 39 Minutes | 0 (0.0%) | 7 (2.3%) |
| 40 to 44 Minutes | 25 (12.6%) | 0 (0.0%) |
| 45 to 59 Minutes | 35 (17.6%) | 0 (0.0%) |
| 60 to 89 Minutes | 0 (0.0%) | 69 (22.6%) |
| 90 or more Minutes | 0 (0.0%) | 0 (0.0%) |
Time of Departure to Work by Sex in Glide
The most frequent times of departure to work in Glide are 6:30 AM to 6:59 AM (80, 40.2%) for males and 7:30 AM to 7:59 AM (115, 37.6%) for females.
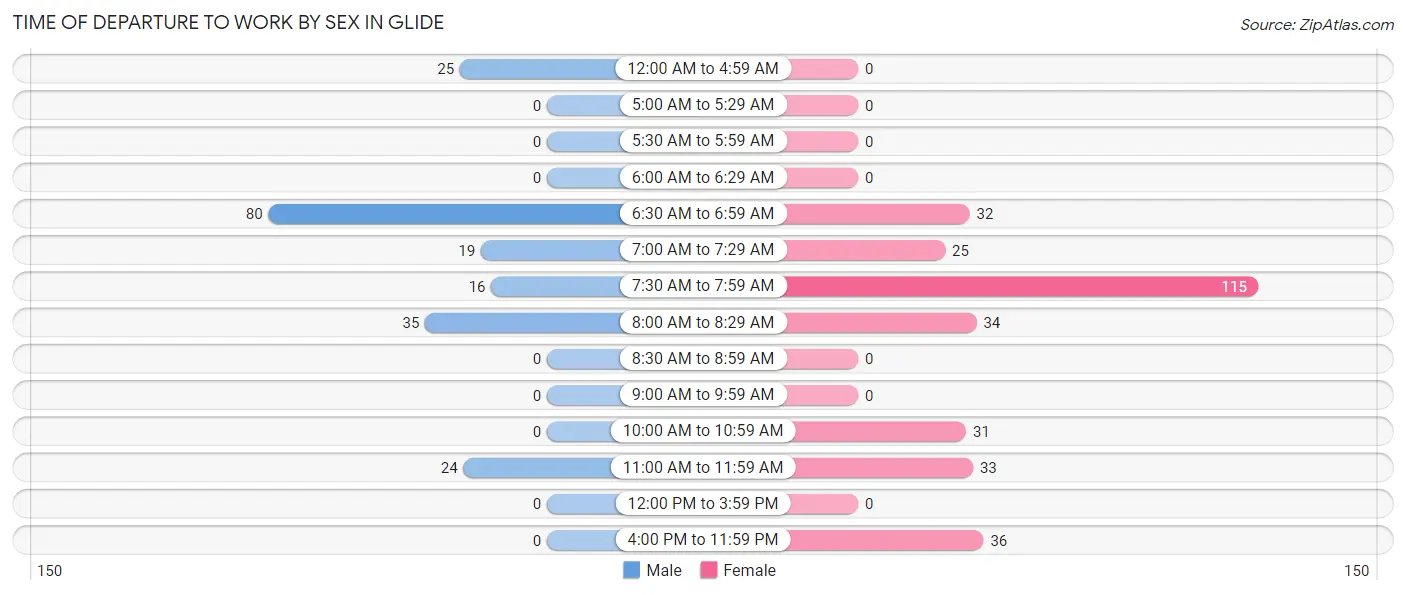
| Time of Departure | Male | Female |
| 12:00 AM to 4:59 AM | 25 (12.6%) | 0 (0.0%) |
| 5:00 AM to 5:29 AM | 0 (0.0%) | 0 (0.0%) |
| 5:30 AM to 5:59 AM | 0 (0.0%) | 0 (0.0%) |
| 6:00 AM to 6:29 AM | 0 (0.0%) | 0 (0.0%) |
| 6:30 AM to 6:59 AM | 80 (40.2%) | 32 (10.5%) |
| 7:00 AM to 7:29 AM | 19 (9.6%) | 25 (8.2%) |
| 7:30 AM to 7:59 AM | 16 (8.0%) | 115 (37.6%) |
| 8:00 AM to 8:29 AM | 35 (17.6%) | 34 (11.1%) |
| 8:30 AM to 8:59 AM | 0 (0.0%) | 0 (0.0%) |
| 9:00 AM to 9:59 AM | 0 (0.0%) | 0 (0.0%) |
| 10:00 AM to 10:59 AM | 0 (0.0%) | 31 (10.1%) |
| 11:00 AM to 11:59 AM | 24 (12.1%) | 33 (10.8%) |
| 12:00 PM to 3:59 PM | 0 (0.0%) | 0 (0.0%) |
| 4:00 PM to 11:59 PM | 0 (0.0%) | 36 (11.8%) |
| Total | 199 (100.0%) | 306 (100.0%) |
Housing Occupancy in Glide
Occupancy by Ownership in Glide
Of the total 600 dwellings in Glide, owner-occupied units account for 499 (83.2%), while renter-occupied units make up 101 (16.8%).
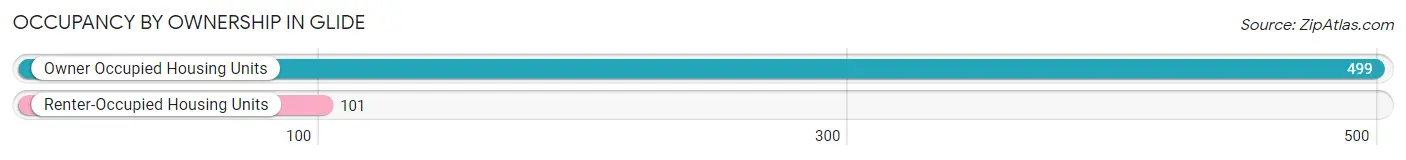
| Occupancy | # Housing Units | % Housing Units |
| Owner Occupied Housing Units | 499 | 83.2% |
| Renter-Occupied Housing Units | 101 | 16.8% |
| Total Occupied Housing Units | 600 | 100.0% |
Occupancy by Household Size in Glide
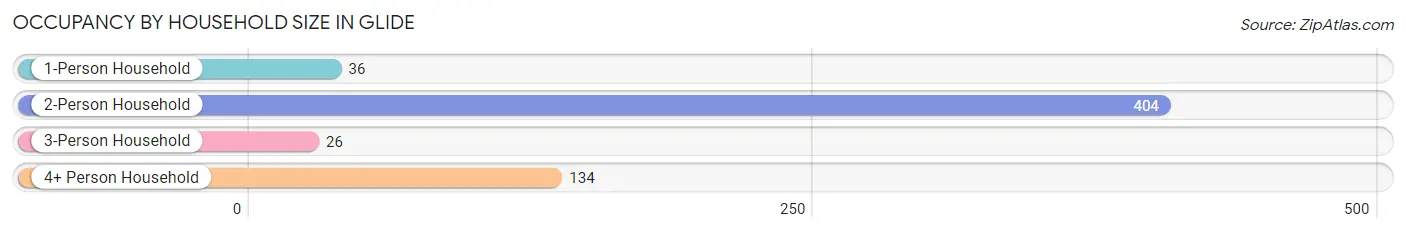
| Household Size | # Housing Units | % Housing Units |
| 1-Person Household | 36 | 6.0% |
| 2-Person Household | 404 | 67.3% |
| 3-Person Household | 26 | 4.3% |
| 4+ Person Household | 134 | 22.3% |
| Total Housing Units | 600 | 100.0% |
Occupancy by Ownership by Household Size in Glide
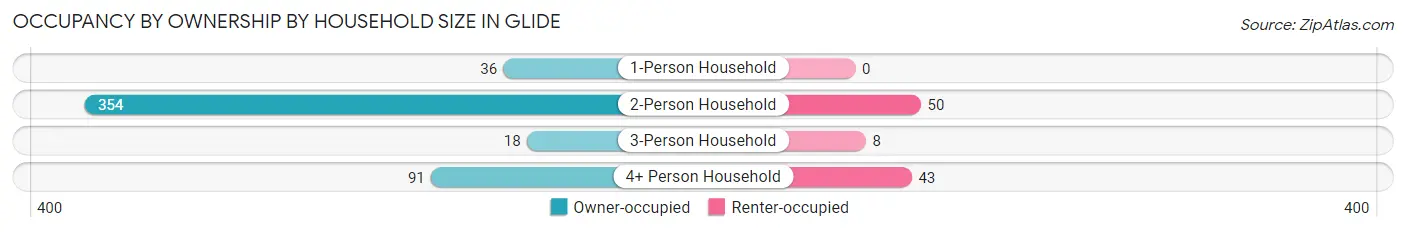
| Household Size | Owner-occupied | Renter-occupied |
| 1-Person Household | 36 (100.0%) | 0 (0.0%) |
| 2-Person Household | 354 (87.6%) | 50 (12.4%) |
| 3-Person Household | 18 (69.2%) | 8 (30.8%) |
| 4+ Person Household | 91 (67.9%) | 43 (32.1%) |
| Total Housing Units | 499 (83.2%) | 101 (16.8%) |
Occupancy by Educational Attainment in Glide
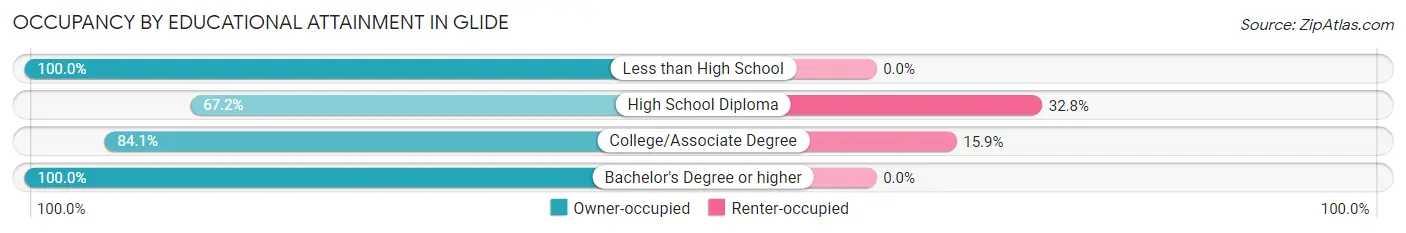
| Household Size | Owner-occupied | Renter-occupied |
| Less than High School | 11 (100.0%) | 0 (0.0%) |
| High School Diploma | 90 (67.2%) | 44 (32.8%) |
| College/Associate Degree | 302 (84.1%) | 57 (15.9%) |
| Bachelor's Degree or higher | 96 (100.0%) | 0 (0.0%) |
Occupancy by Age of Householder in Glide
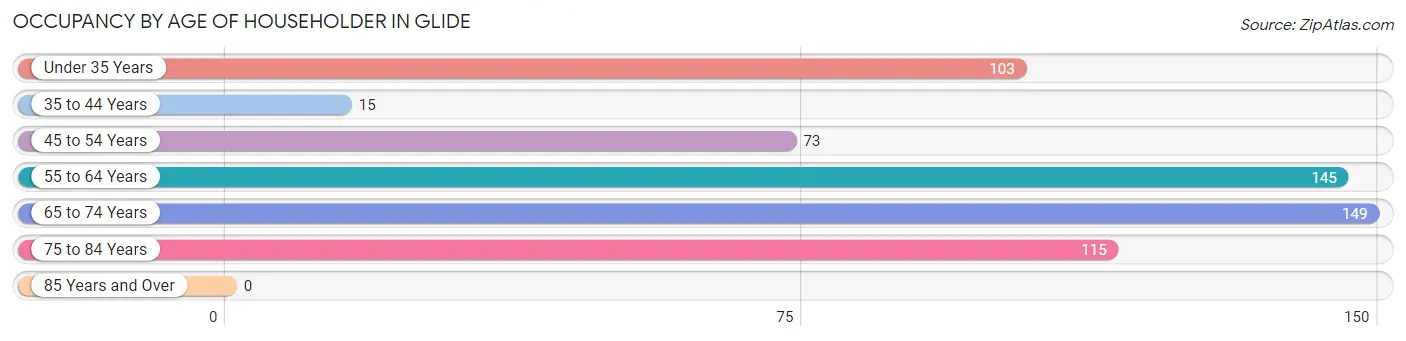
| Age Bracket | # Households | % Households |
| Under 35 Years | 103 | 17.2% |
| 35 to 44 Years | 15 | 2.5% |
| 45 to 54 Years | 73 | 12.2% |
| 55 to 64 Years | 145 | 24.2% |
| 65 to 74 Years | 149 | 24.8% |
| 75 to 84 Years | 115 | 19.2% |
| 85 Years and Over | 0 | 0.0% |
| Total | 600 | 100.0% |
Housing Finances in Glide
Median Income by Occupancy in Glide
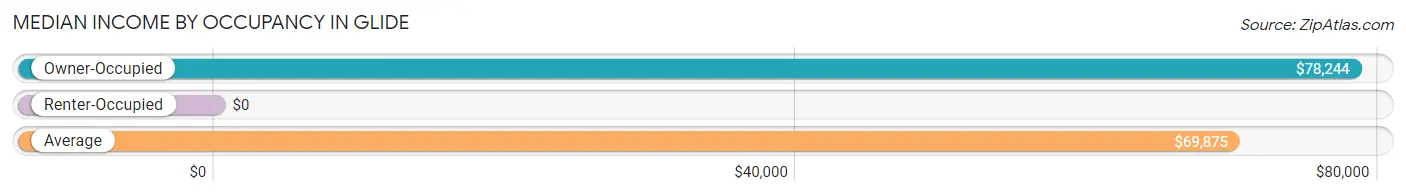
| Occupancy Type | # Households | Median Income |
| Owner-Occupied | 499 (83.2%) | $78,244 |
| Renter-Occupied | 101 (16.8%) | $0 |
| Average | 600 (100.0%) | $69,875 |
Occupancy by Householder Income Bracket in Glide
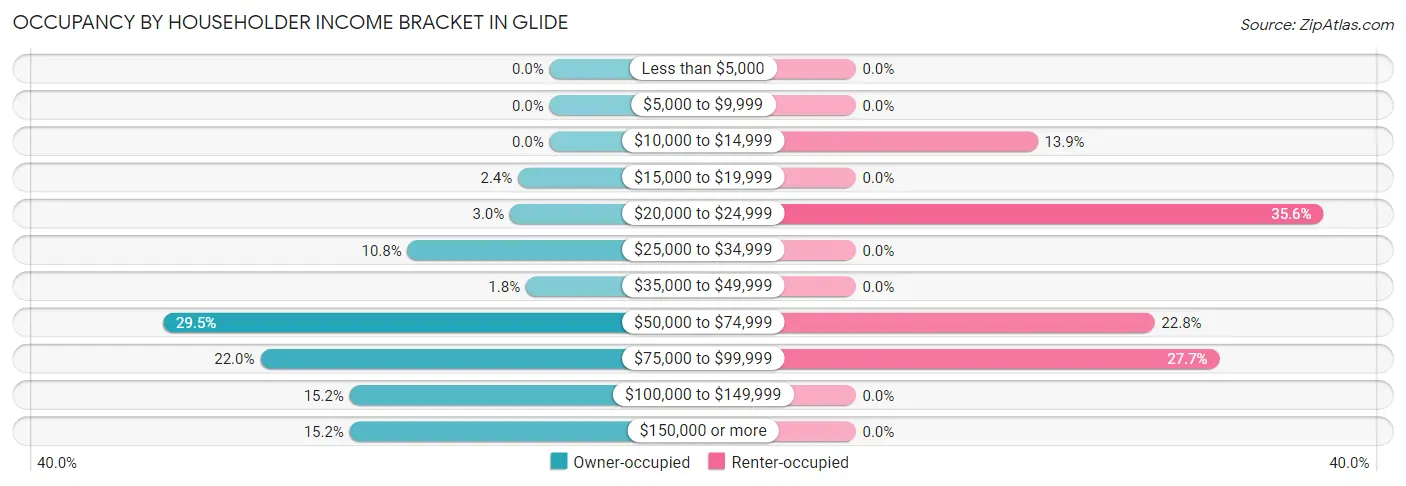
| Income Bracket | Owner-occupied | Renter-occupied |
| Less than $5,000 | 0 (0.0%) | 0 (0.0%) |
| $5,000 to $9,999 | 0 (0.0%) | 0 (0.0%) |
| $10,000 to $14,999 | 0 (0.0%) | 14 (13.9%) |
| $15,000 to $19,999 | 12 (2.4%) | 0 (0.0%) |
| $20,000 to $24,999 | 15 (3.0%) | 36 (35.6%) |
| $25,000 to $34,999 | 54 (10.8%) | 0 (0.0%) |
| $35,000 to $49,999 | 9 (1.8%) | 0 (0.0%) |
| $50,000 to $74,999 | 147 (29.5%) | 23 (22.8%) |
| $75,000 to $99,999 | 110 (22.0%) | 28 (27.7%) |
| $100,000 to $149,999 | 76 (15.2%) | 0 (0.0%) |
| $150,000 or more | 76 (15.2%) | 0 (0.0%) |
| Total | 499 (100.0%) | 101 (100.0%) |
Monthly Housing Cost Tiers in Glide
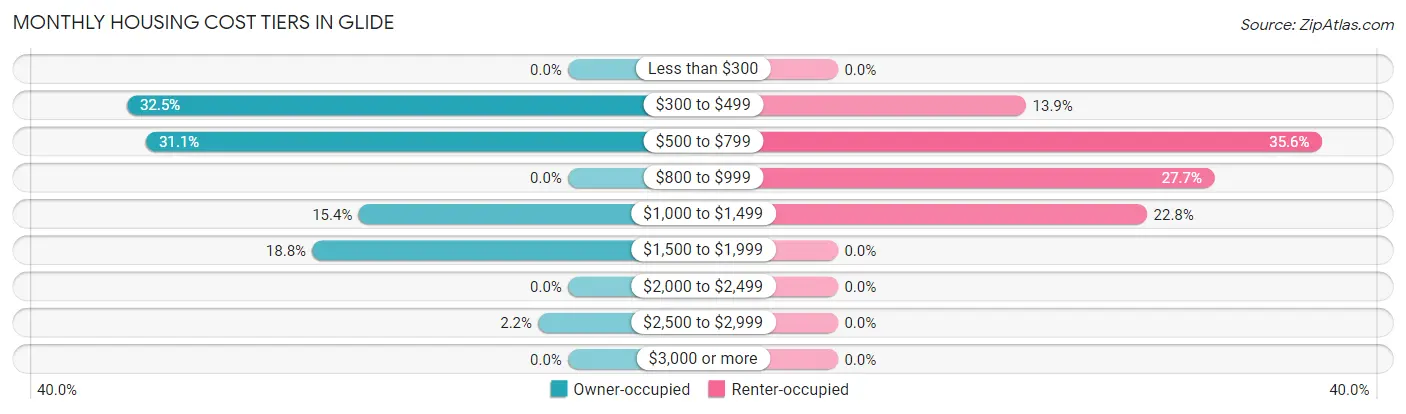
| Monthly Cost | Owner-occupied | Renter-occupied |
| Less than $300 | 0 (0.0%) | 0 (0.0%) |
| $300 to $499 | 162 (32.5%) | 14 (13.9%) |
| $500 to $799 | 155 (31.1%) | 36 (35.6%) |
| $800 to $999 | 0 (0.0%) | 28 (27.7%) |
| $1,000 to $1,499 | 77 (15.4%) | 23 (22.8%) |
| $1,500 to $1,999 | 94 (18.8%) | 0 (0.0%) |
| $2,000 to $2,499 | 0 (0.0%) | 0 (0.0%) |
| $2,500 to $2,999 | 11 (2.2%) | 0 (0.0%) |
| $3,000 or more | 0 (0.0%) | 0 (0.0%) |
| Total | 499 (100.0%) | 101 (100.0%) |
Physical Housing Characteristics in Glide
Housing Structures in Glide
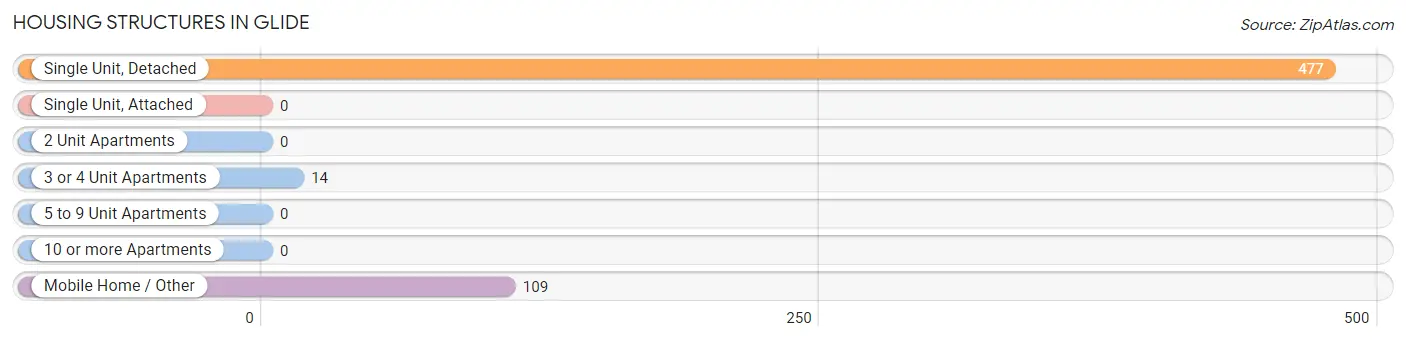
| Structure Type | # Housing Units | % Housing Units |
| Single Unit, Detached | 477 | 79.5% |
| Single Unit, Attached | 0 | 0.0% |
| 2 Unit Apartments | 0 | 0.0% |
| 3 or 4 Unit Apartments | 14 | 2.3% |
| 5 to 9 Unit Apartments | 0 | 0.0% |
| 10 or more Apartments | 0 | 0.0% |
| Mobile Home / Other | 109 | 18.2% |
| Total | 600 | 100.0% |
Housing Structures by Occupancy in Glide
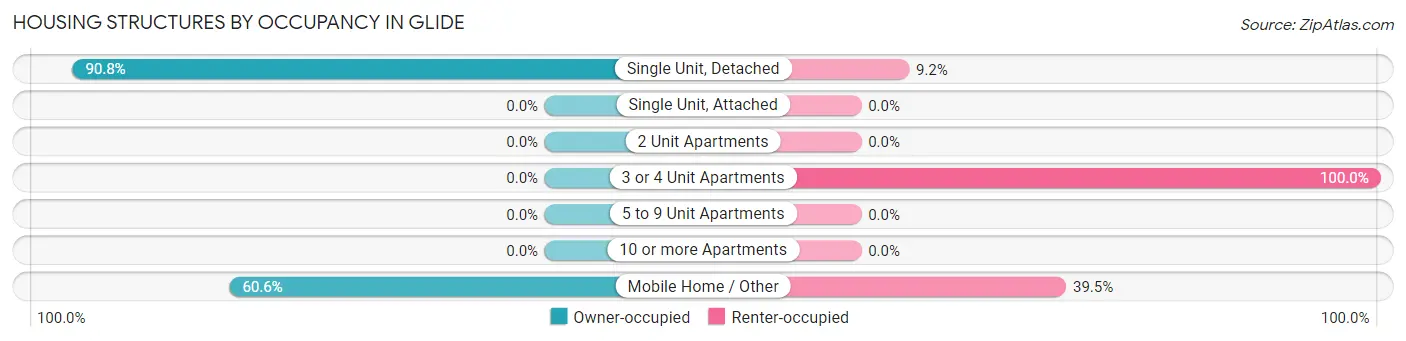
| Structure Type | Owner-occupied | Renter-occupied |
| Single Unit, Detached | 433 (90.8%) | 44 (9.2%) |
| Single Unit, Attached | 0 (0.0%) | 0 (0.0%) |
| 2 Unit Apartments | 0 (0.0%) | 0 (0.0%) |
| 3 or 4 Unit Apartments | 0 (0.0%) | 14 (100.0%) |
| 5 to 9 Unit Apartments | 0 (0.0%) | 0 (0.0%) |
| 10 or more Apartments | 0 (0.0%) | 0 (0.0%) |
| Mobile Home / Other | 66 (60.6%) | 43 (39.5%) |
| Total | 499 (83.2%) | 101 (16.8%) |
Housing Structures by Number of Rooms in Glide
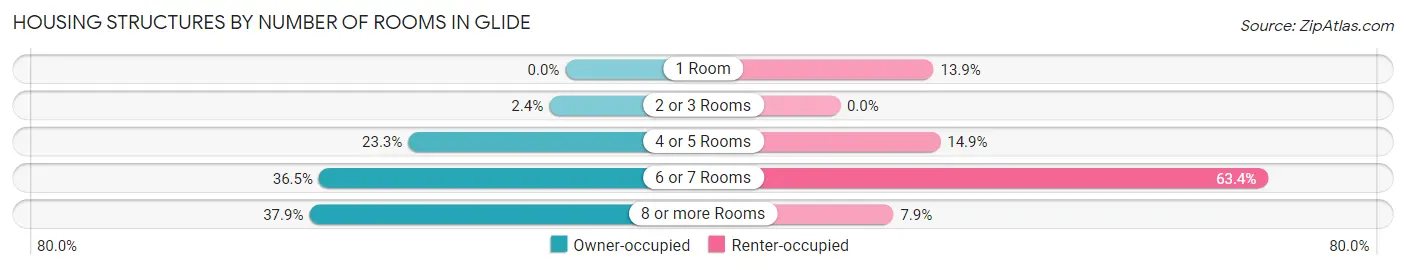
| Number of Rooms | Owner-occupied | Renter-occupied |
| 1 Room | 0 (0.0%) | 14 (13.9%) |
| 2 or 3 Rooms | 12 (2.4%) | 0 (0.0%) |
| 4 or 5 Rooms | 116 (23.3%) | 15 (14.8%) |
| 6 or 7 Rooms | 182 (36.5%) | 64 (63.4%) |
| 8 or more Rooms | 189 (37.9%) | 8 (7.9%) |
| Total | 499 (100.0%) | 101 (100.0%) |
Housing Structure by Heating Type in Glide
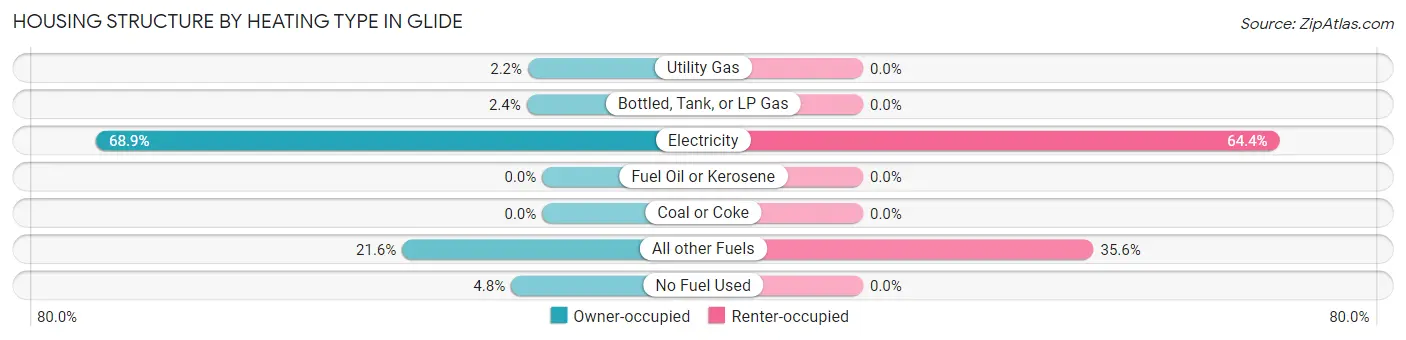
| Heating Type | Owner-occupied | Renter-occupied |
| Utility Gas | 11 (2.2%) | 0 (0.0%) |
| Bottled, Tank, or LP Gas | 12 (2.4%) | 0 (0.0%) |
| Electricity | 344 (68.9%) | 65 (64.4%) |
| Fuel Oil or Kerosene | 0 (0.0%) | 0 (0.0%) |
| Coal or Coke | 0 (0.0%) | 0 (0.0%) |
| All other Fuels | 108 (21.6%) | 36 (35.6%) |
| No Fuel Used | 24 (4.8%) | 0 (0.0%) |
| Total | 499 (100.0%) | 101 (100.0%) |
Household Vehicle Usage in Glide
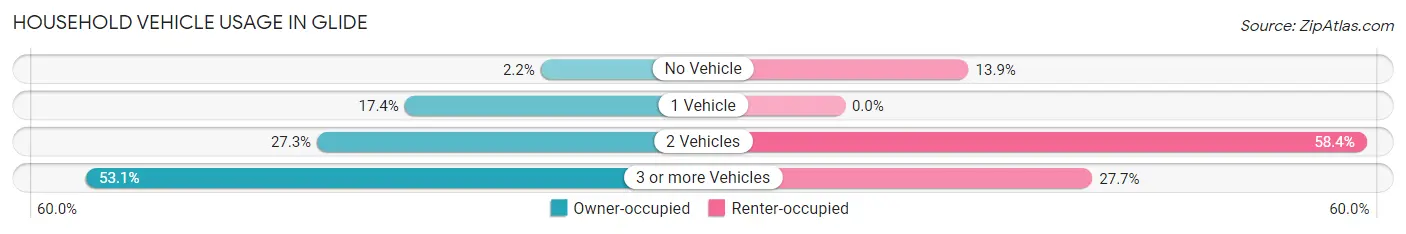
| Vehicles per Household | Owner-occupied | Renter-occupied |
| No Vehicle | 11 (2.2%) | 14 (13.9%) |
| 1 Vehicle | 87 (17.4%) | 0 (0.0%) |
| 2 Vehicles | 136 (27.3%) | 59 (58.4%) |
| 3 or more Vehicles | 265 (53.1%) | 28 (27.7%) |
| Total | 499 (100.0%) | 101 (100.0%) |
Real Estate & Mortgages in Glide
Real Estate and Mortgage Overview in Glide
| Characteristic | Without Mortgage | With Mortgage |
| Housing Units | 293 | 206 |
| Median Property Value | $388,200 | $342,900 |
| Median Household Income | $56,580 | $38 |
| Monthly Housing Costs | $483 | $0 |
| Real Estate Taxes | $2,266 | $0 |
Property Value by Mortgage Status in Glide
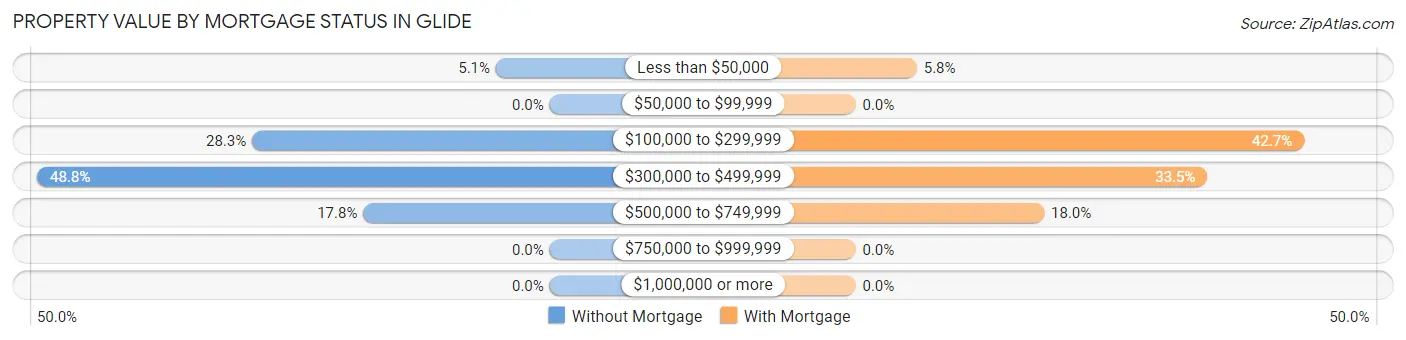
| Property Value | Without Mortgage | With Mortgage |
| Less than $50,000 | 15 (5.1%) | 12 (5.8%) |
| $50,000 to $99,999 | 0 (0.0%) | 0 (0.0%) |
| $100,000 to $299,999 | 83 (28.3%) | 88 (42.7%) |
| $300,000 to $499,999 | 143 (48.8%) | 69 (33.5%) |
| $500,000 to $749,999 | 52 (17.7%) | 37 (18.0%) |
| $750,000 to $999,999 | 0 (0.0%) | 0 (0.0%) |
| $1,000,000 or more | 0 (0.0%) | 0 (0.0%) |
| Total | 293 (100.0%) | 206 (100.0%) |
Household Income by Mortgage Status in Glide
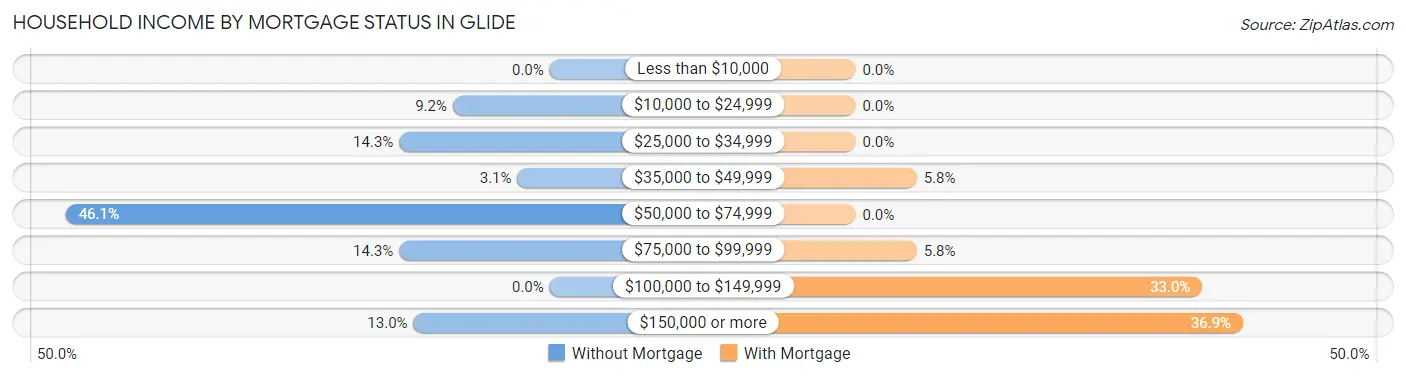
| Household Income | Without Mortgage | With Mortgage |
| Less than $10,000 | 0 (0.0%) | 0 (0.0%) |
| $10,000 to $24,999 | 27 (9.2%) | 0 (0.0%) |
| $25,000 to $34,999 | 42 (14.3%) | 0 (0.0%) |
| $35,000 to $49,999 | 9 (3.1%) | 12 (5.8%) |
| $50,000 to $74,999 | 135 (46.1%) | 0 (0.0%) |
| $75,000 to $99,999 | 42 (14.3%) | 12 (5.8%) |
| $100,000 to $149,999 | 0 (0.0%) | 68 (33.0%) |
| $150,000 or more | 38 (13.0%) | 76 (36.9%) |
| Total | 293 (100.0%) | 206 (100.0%) |
Property Value to Household Income Ratio in Glide
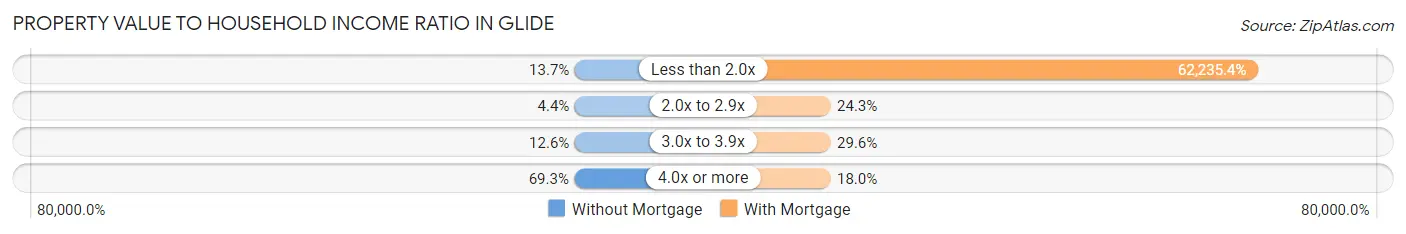
| Value-to-Income Ratio | Without Mortgage | With Mortgage |
| Less than 2.0x | 40 (13.7%) | 128,205 (62,235.4%) |
| 2.0x to 2.9x | 13 (4.4%) | 50 (24.3%) |
| 3.0x to 3.9x | 37 (12.6%) | 61 (29.6%) |
| 4.0x or more | 203 (69.3%) | 37 (18.0%) |
| Total | 293 (100.0%) | 206 (100.0%) |
Real Estate Taxes by Mortgage Status in Glide
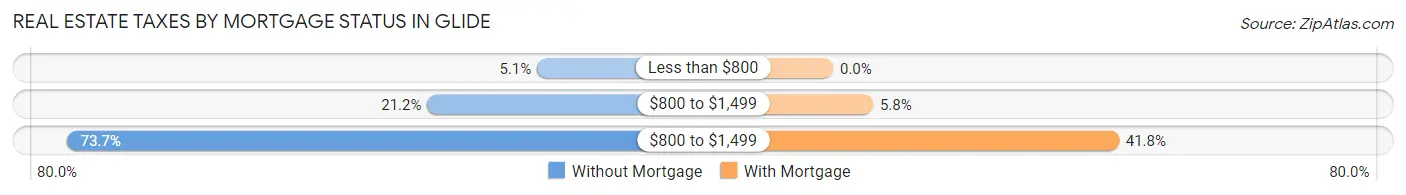
| Property Taxes | Without Mortgage | With Mortgage |
| Less than $800 | 15 (5.1%) | 0 (0.0%) |
| $800 to $1,499 | 62 (21.2%) | 12 (5.8%) |
| $800 to $1,499 | 216 (73.7%) | 86 (41.7%) |
| Total | 293 (100.0%) | 206 (100.0%) |
Health & Disability in Glide
Health Insurance Coverage by Age in Glide
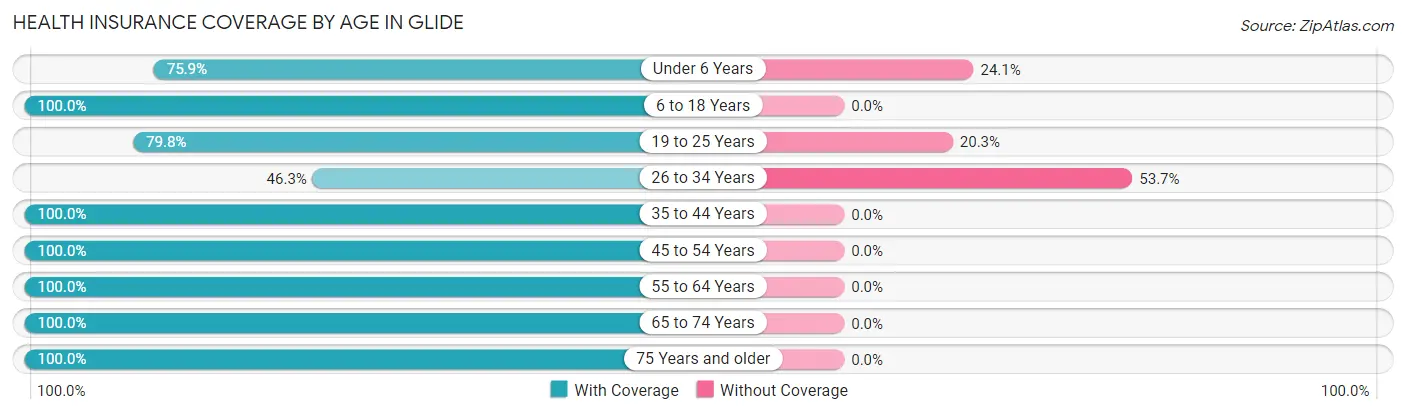
| Age Bracket | With Coverage | Without Coverage |
| Under 6 Years | 126 (75.9%) | 40 (24.1%) |
| 6 to 18 Years | 35 (100.0%) | 0 (0.0%) |
| 19 to 25 Years | 193 (79.7%) | 49 (20.3%) |
| 26 to 34 Years | 56 (46.3%) | 65 (53.7%) |
| 35 to 44 Years | 15 (100.0%) | 0 (0.0%) |
| 45 to 54 Years | 138 (100.0%) | 0 (0.0%) |
| 55 to 64 Years | 272 (100.0%) | 0 (0.0%) |
| 65 to 74 Years | 335 (100.0%) | 0 (0.0%) |
| 75 Years and older | 199 (100.0%) | 0 (0.0%) |
| Total | 1,369 (89.9%) | 154 (10.1%) |
Health Insurance Coverage by Citizenship Status in Glide
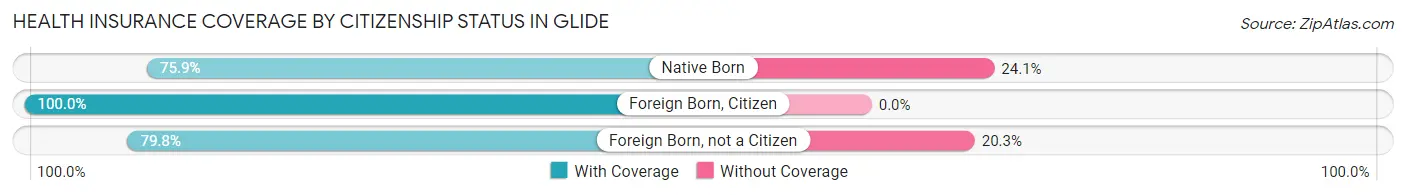
| Citizenship Status | With Coverage | Without Coverage |
| Native Born | 126 (75.9%) | 40 (24.1%) |
| Foreign Born, Citizen | 35 (100.0%) | 0 (0.0%) |
| Foreign Born, not a Citizen | 193 (79.7%) | 49 (20.3%) |
Health Insurance Coverage by Household Income in Glide
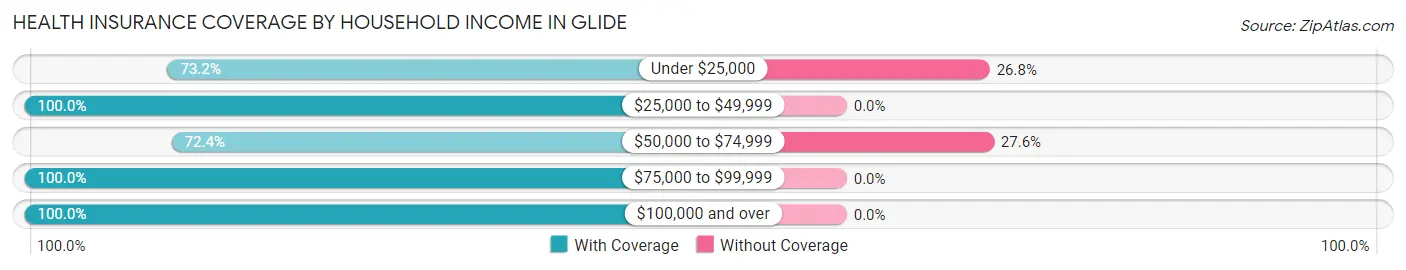
| Household Income | With Coverage | Without Coverage |
| Under $25,000 | 134 (73.2%) | 49 (26.8%) |
| $25,000 to $49,999 | 118 (100.0%) | 0 (0.0%) |
| $50,000 to $74,999 | 276 (72.4%) | 105 (27.6%) |
| $75,000 to $99,999 | 381 (100.0%) | 0 (0.0%) |
| $100,000 and over | 460 (100.0%) | 0 (0.0%) |
Public vs Private Health Insurance Coverage by Age in Glide
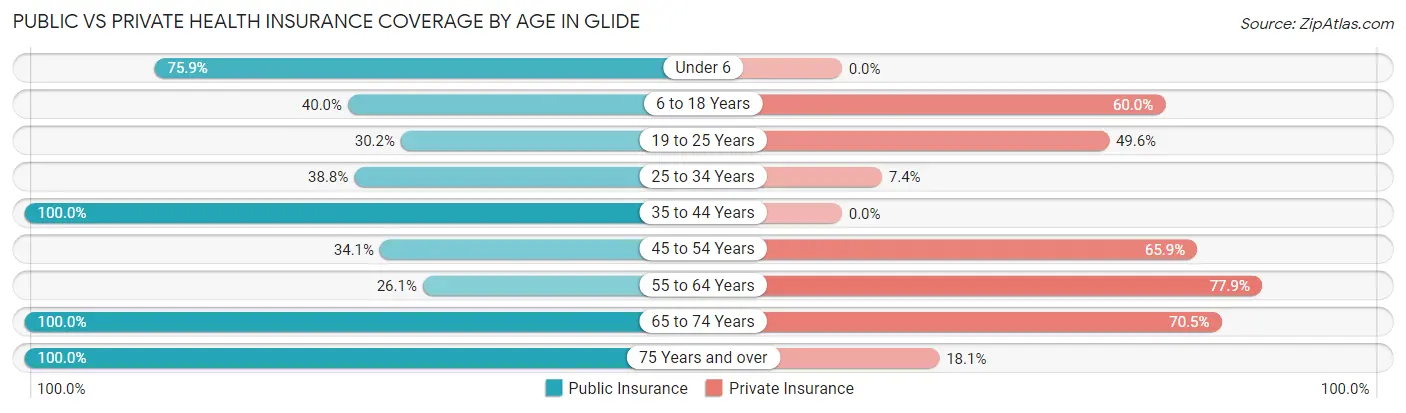
| Age Bracket | Public Insurance | Private Insurance |
| Under 6 | 126 (75.9%) | 0 (0.0%) |
| 6 to 18 Years | 14 (40.0%) | 21 (60.0%) |
| 19 to 25 Years | 73 (30.2%) | 120 (49.6%) |
| 25 to 34 Years | 47 (38.8%) | 9 (7.4%) |
| 35 to 44 Years | 15 (100.0%) | 0 (0.0%) |
| 45 to 54 Years | 47 (34.1%) | 91 (65.9%) |
| 55 to 64 Years | 71 (26.1%) | 212 (77.9%) |
| 65 to 74 Years | 335 (100.0%) | 236 (70.5%) |
| 75 Years and over | 199 (100.0%) | 36 (18.1%) |
| Total | 927 (60.9%) | 725 (47.6%) |
Disability Status by Sex by Age in Glide
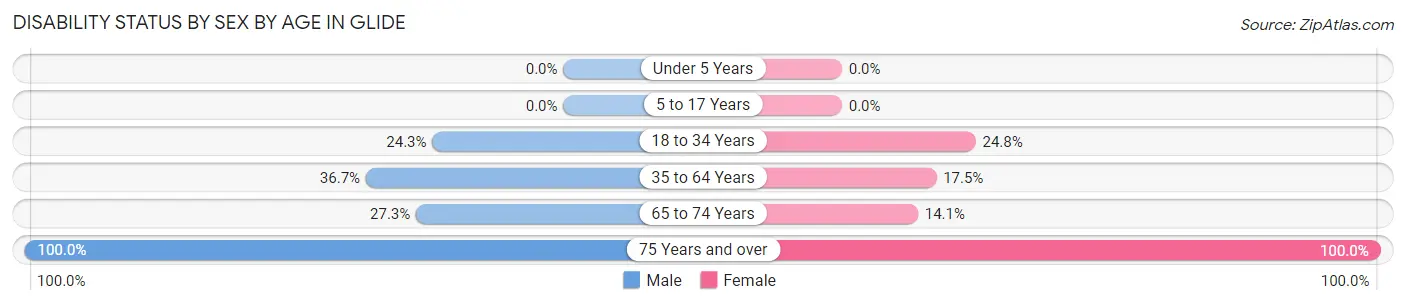
| Age Bracket | Male | Female |
| Under 5 Years | 0 (0.0%) | 0 (0.0%) |
| 5 to 17 Years | 0 (0.0%) | 0 (0.0%) |
| 18 to 34 Years | 53 (24.3%) | 36 (24.8%) |
| 35 to 64 Years | 70 (36.6%) | 41 (17.5%) |
| 65 to 74 Years | 47 (27.3%) | 23 (14.1%) |
| 75 Years and over | 97 (100.0%) | 102 (100.0%) |
Disability Class by Sex by Age in Glide
Disability Class: Hearing Difficulty
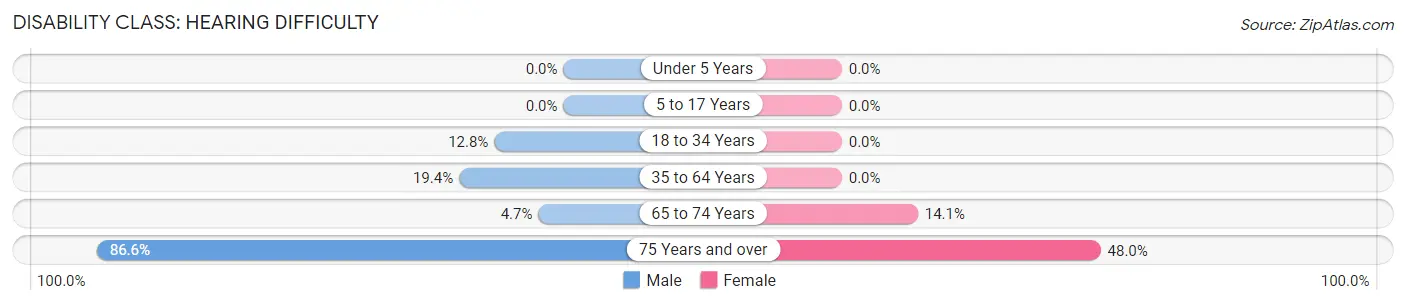
| Age Bracket | Male | Female |
| Under 5 Years | 0 (0.0%) | 0 (0.0%) |
| 5 to 17 Years | 0 (0.0%) | 0 (0.0%) |
| 18 to 34 Years | 28 (12.8%) | 0 (0.0%) |
| 35 to 64 Years | 37 (19.4%) | 0 (0.0%) |
| 65 to 74 Years | 8 (4.6%) | 23 (14.1%) |
| 75 Years and over | 84 (86.6%) | 49 (48.0%) |
Disability Class: Vision Difficulty
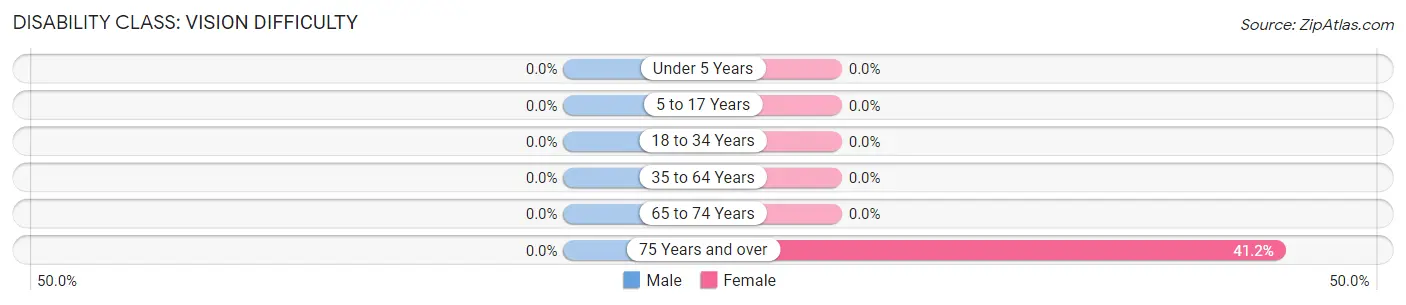
| Age Bracket | Male | Female |
| Under 5 Years | 0 (0.0%) | 0 (0.0%) |
| 5 to 17 Years | 0 (0.0%) | 0 (0.0%) |
| 18 to 34 Years | 0 (0.0%) | 0 (0.0%) |
| 35 to 64 Years | 0 (0.0%) | 0 (0.0%) |
| 65 to 74 Years | 0 (0.0%) | 0 (0.0%) |
| 75 Years and over | 0 (0.0%) | 42 (41.2%) |
Disability Class: Cognitive Difficulty
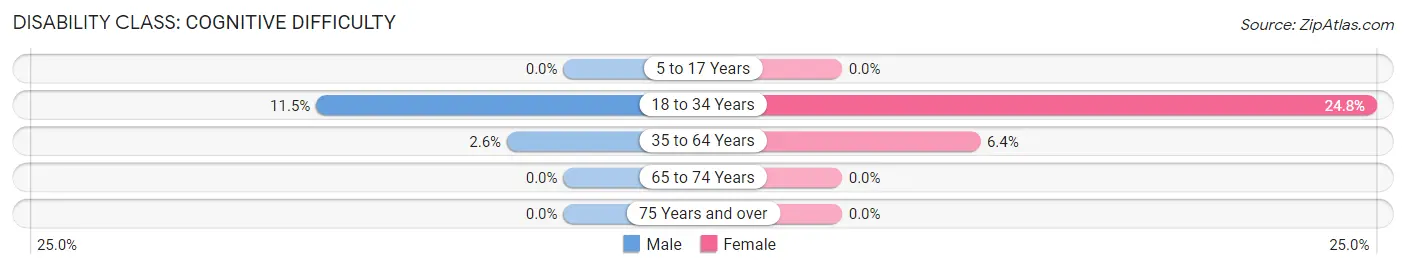
| Age Bracket | Male | Female |
| 5 to 17 Years | 0 (0.0%) | 0 (0.0%) |
| 18 to 34 Years | 25 (11.5%) | 36 (24.8%) |
| 35 to 64 Years | 5 (2.6%) | 15 (6.4%) |
| 65 to 74 Years | 0 (0.0%) | 0 (0.0%) |
| 75 Years and over | 0 (0.0%) | 0 (0.0%) |
Disability Class: Ambulatory Difficulty
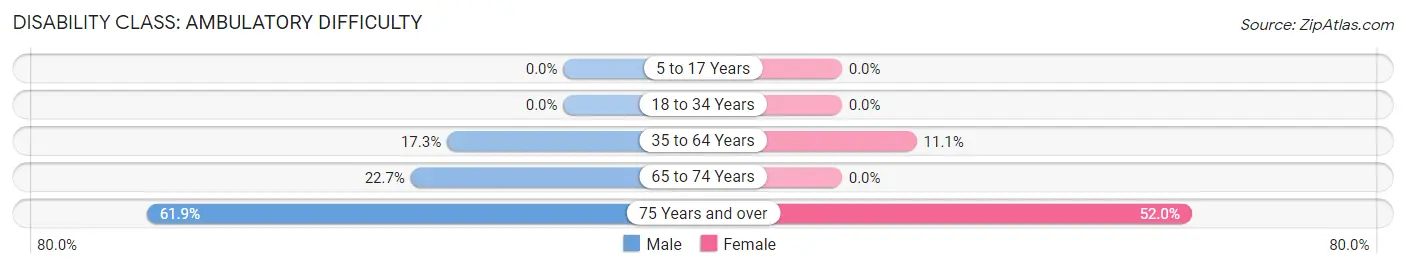
| Age Bracket | Male | Female |
| 5 to 17 Years | 0 (0.0%) | 0 (0.0%) |
| 18 to 34 Years | 0 (0.0%) | 0 (0.0%) |
| 35 to 64 Years | 33 (17.3%) | 26 (11.1%) |
| 65 to 74 Years | 39 (22.7%) | 0 (0.0%) |
| 75 Years and over | 60 (61.9%) | 53 (52.0%) |
Disability Class: Self-Care Difficulty
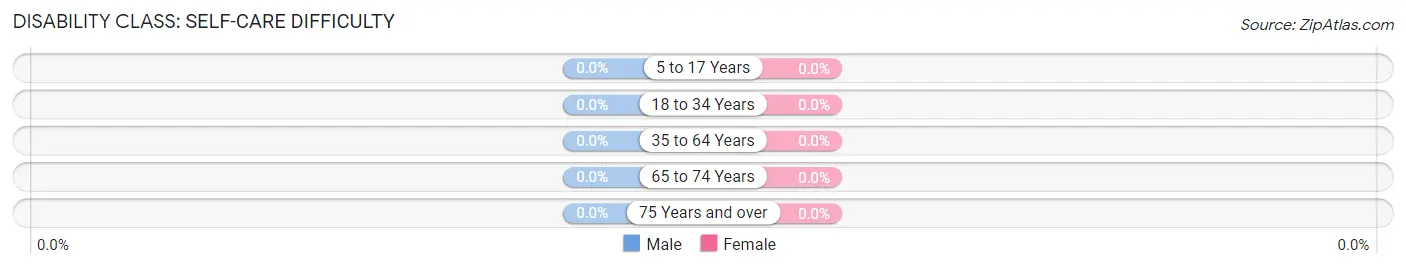
| Age Bracket | Male | Female |
| 5 to 17 Years | 0 (0.0%) | 0 (0.0%) |
| 18 to 34 Years | 0 (0.0%) | 0 (0.0%) |
| 35 to 64 Years | 0 (0.0%) | 0 (0.0%) |
| 65 to 74 Years | 0 (0.0%) | 0 (0.0%) |
| 75 Years and over | 0 (0.0%) | 0 (0.0%) |
Technology Access in Glide
Computing Device Access in Glide
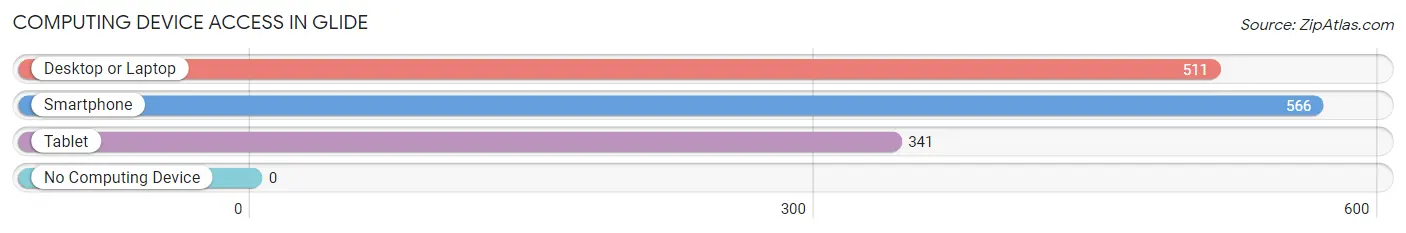
| Device Type | # Households | % Households |
| Desktop or Laptop | 511 | 85.2% |
| Smartphone | 566 | 94.3% |
| Tablet | 341 | 56.8% |
| No Computing Device | 0 | 0.0% |
| Total | 600 | 100.0% |
Internet Access in Glide
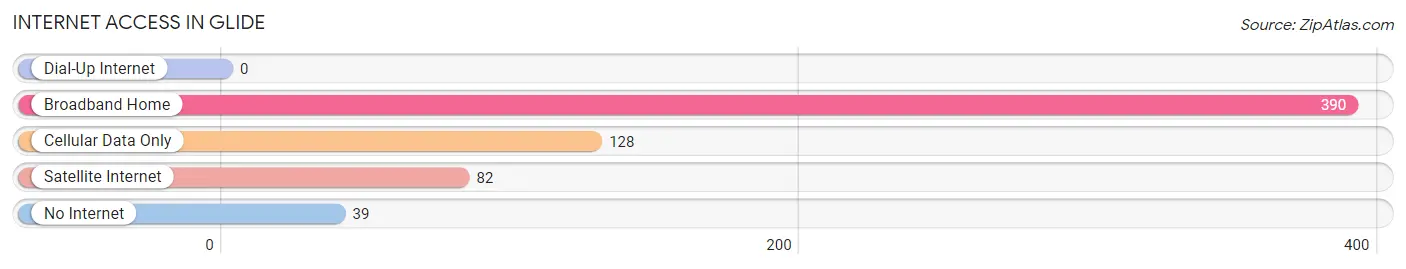
| Internet Type | # Households | % Households |
| Dial-Up Internet | 0 | 0.0% |
| Broadband Home | 390 | 65.0% |
| Cellular Data Only | 128 | 21.3% |
| Satellite Internet | 82 | 13.7% |
| No Internet | 39 | 6.5% |
| Total | 600 | 100.0% |
Glide Summary
Glide, Oregon is a small unincorporated community located in Douglas County, Oregon. It is situated on the North Umpqua River, approximately 25 miles east of Roseburg. The population of Glide was 1,845 in the 2000 census.
History
Glide was first settled in the late 1800s by a group of settlers from the Midwest. The town was originally called “Glideville”, but the name was changed to Glide in 1891. The town was named after the nearby Glide Creek, which was named for the way the water glided over the rocks in the creek.
The first post office in Glide was established in 1891. The town was incorporated in 1895. In the early 1900s, Glide was a thriving logging and mill town. The town had a sawmill, a shingle mill, a planing mill, and a box factory. The town also had a hotel, a general store, a blacksmith shop, and a livery stable.
In the 1920s, Glide began to decline as the logging industry moved away from the area. The town’s population decreased and many of the businesses closed. In the 1940s, Glide was revitalized by the construction of the North Umpqua Hydroelectric Project. The project brought jobs and new businesses to the area.
Geography
Glide is located in the foothills of the Cascade Mountains in the Umpqua National Forest. The town is situated on the North Umpqua River, approximately 25 miles east of Roseburg. The town is surrounded by lush forests and is home to many species of wildlife.
The climate in Glide is mild and temperate. The average high temperature in the summer is around 80 degrees Fahrenheit and the average low temperature in the winter is around 30 degrees Fahrenheit.
Economy
The economy of Glide is largely based on tourism and recreation. The town is home to several campgrounds, fishing spots, and hiking trails. The North Umpqua Hydroelectric Project also provides jobs for many of the town’s residents.
Demographics
As of the 2000 census, the population of Glide was 1,845. The racial makeup of the town was 95.3% White, 0.3% African American, 0.7% Native American, 0.3% Asian, 0.1% Pacific Islander, 0.7% from other races, and 2.6% from two or more races. Hispanic or Latino of any race were 2.2% of the population.
The median income for a household in Glide was $30,938, and the median income for a family was $35,625. The per capita income for the town was $15,945. About 11.2% of families and 14.2% of the population were below the poverty line, including 17.2% of those under age 18 and 8.3% of those age 65 or over.
Glide is a small, rural community with a rich history and a strong sense of community. The town is surrounded by beautiful forests and is home to many species of wildlife. The economy of Glide is largely based on tourism and recreation, and the town is home to several campgrounds, fishing spots, and hiking trails. The population of Glide is diverse, with a mix of races and ethnicities.
Common Questions
What is Per Capita Income in Glide?
Per Capita income in Glide is $31,903.
What is the Median Family Income in Glide?
Median Family Income in Glide is $78,810.
What is the Median Household income in Glide?
Median Household Income in Glide is $69,875.
What is Inequality or Gini Index in Glide?
Inequality or Gini Index in Glide is 0.33.
What is the Total Population of Glide?
Total Population of Glide is 1,523.
What is the Total Male Population of Glide?
Total Male Population of Glide is 801.
What is the Total Female Population of Glide?
Total Female Population of Glide is 722.
What is the Ratio of Males per 100 Females in Glide?
There are 110.94 Males per 100 Females in Glide.
What is the Ratio of Females per 100 Males in Glide?
There are 90.14 Females per 100 Males in Glide.
What is the Median Population Age in Glide?
Median Population Age in Glide is 58.5 Years.
What is the Average Family Size in Glide
Average Family Size in Glide is 2.7 People.
What is the Average Household Size in Glide
Average Household Size in Glide is 2.5 People.
How Large is the Labor Force in Glide?
There are 641 People in the Labor Forcein in Glide.
What is the Percentage of People in the Labor Force in Glide?
47.2% of People are in the Labor Force in Glide.
What is the Unemployment Rate in Glide?
Unemployment Rate in Glide is 7.5%.