Zip Codes with the Highest Percentage of Population Employed in Arts, Entertainment & Recreation in Eugene, OR
RELATED REPORTS & OPTIONS
Arts, Entertainment & Recreation
Eugene
Compare Zip Codes
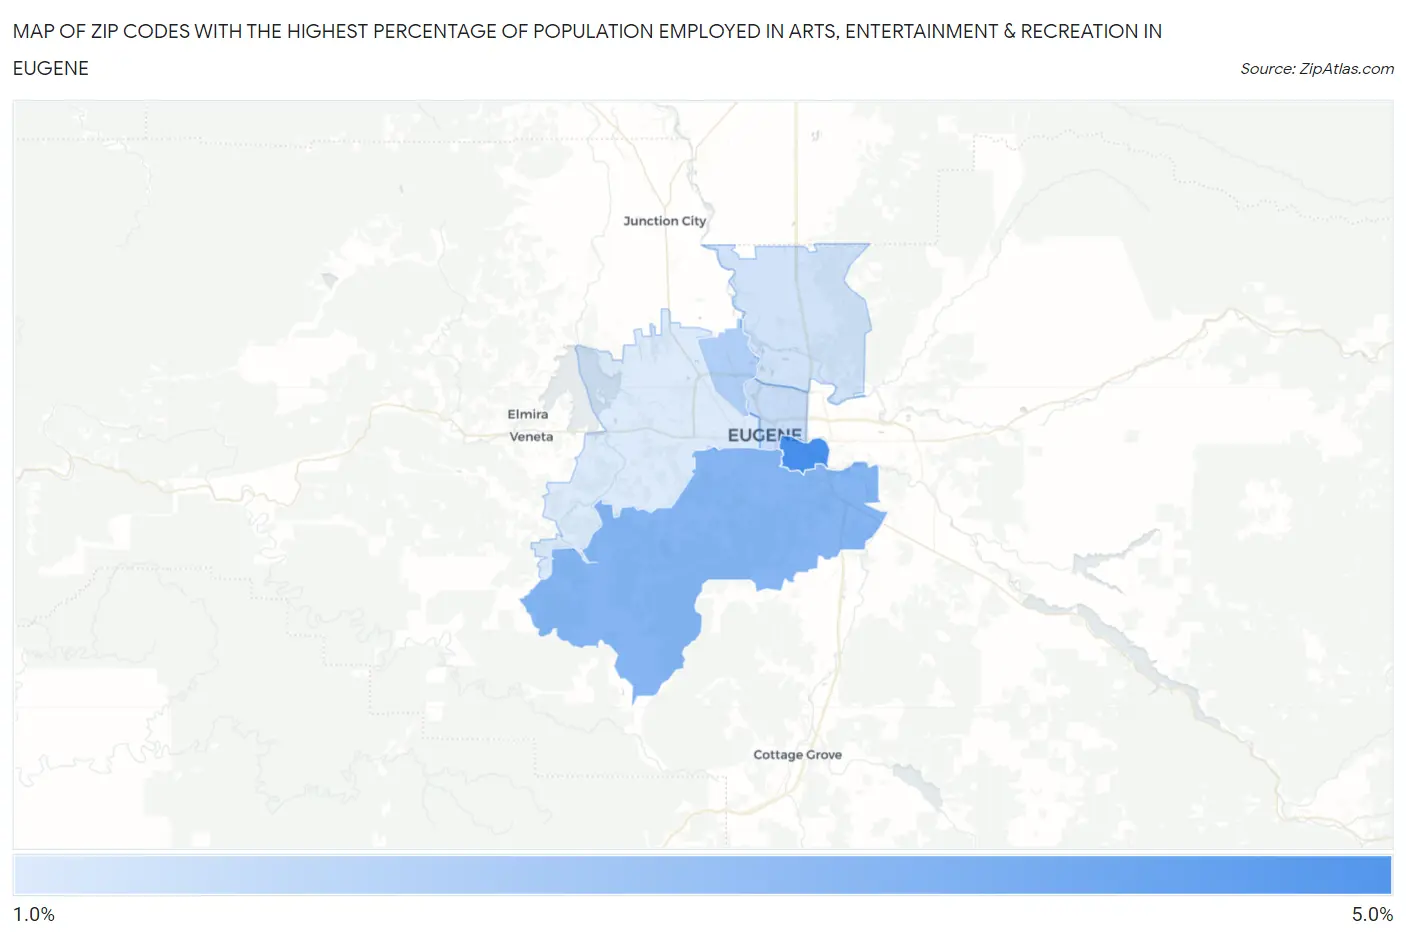
Map of Zip Codes with the Highest Percentage of Population Employed in Arts, Entertainment & Recreation in Eugene
0.0%
5.0%
Zip Codes with the Highest Percentage of Population Employed in Arts, Entertainment & Recreation in Eugene, OR
| Zip Code | % Employed | vs State | vs National | |
| 1. | 97403 | 4.5% | 2.1%(+2.37)#54 | 2.1%(+2.38)#2,785 |
| 2. | 97405 | 3.2% | 2.1%(+1.13)#78 | 2.1%(+1.14)#4,724 |
| 3. | 97404 | 2.3% | 2.1%(+0.239)#117 | 2.1%(+0.251)#7,967 |
| 4. | 97401 | 1.9% | 2.1%(-0.224)#152 | 2.1%(-0.212)#10,551 |
| 5. | 97408 | 1.7% | 2.1%(-0.423)#171 | 2.1%(-0.411)#11,931 |
| 6. | 97402 | 1.5% | 2.1%(-0.634)#194 | 2.1%(-0.622)#13,519 |
1
Common Questions
What are the Top 5 Zip Codes with the Highest Percentage of Population Employed in Arts, Entertainment & Recreation in Eugene, OR?
Top 5 Zip Codes with the Highest Percentage of Population Employed in Arts, Entertainment & Recreation in Eugene, OR are:
What zip code has the Highest Percentage of Population Employed in Arts, Entertainment & Recreation in Eugene, OR?
97403 has the Highest Percentage of Population Employed in Arts, Entertainment & Recreation in Eugene, OR with 4.5%.
What is the Percentage of Population Employed in Arts, Entertainment & Recreation in Eugene, OR?
Percentage of Population Employed in Arts, Entertainment & Recreation in Eugene is 2.2%.
What is the Percentage of Population Employed in Arts, Entertainment & Recreation in Oregon?
Percentage of Population Employed in Arts, Entertainment & Recreation in Oregon is 2.1%.
What is the Percentage of Population Employed in Arts, Entertainment & Recreation in the United States?
Percentage of Population Employed in Arts, Entertainment & Recreation in the United States is 2.1%.