Estacada, OR Map & Demographics
Estacada Map
Estacada Overview
$26,964
PER CAPITA INCOME
$85,854
AVG FAMILY INCOME
$78,594
AVG HOUSEHOLD INCOME
11.7%
WAGE / INCOME GAP [ % ]
88.3¢/ $1
WAGE / INCOME GAP [ $ ]
0.36
INEQUALITY / GINI INDEX
4,619
TOTAL POPULATION
2,244
MALE POPULATION
2,375
FEMALE POPULATION
94.48
MALES / 100 FEMALES
105.84
FEMALES / 100 MALES
35.0
MEDIAN AGE
3.5
AVG FAMILY SIZE
3.0
AVG HOUSEHOLD SIZE
2,143
LABOR FORCE [ PEOPLE ]
59.7%
PERCENT IN LABOR FORCE
6.1%
UNEMPLOYMENT RATE
Estacada Zip Codes
Estacada Area Codes
Income in Estacada
Income Overview in Estacada
Per Capita Income in Estacada is $26,964, while median incomes of families and households are $85,854 and $78,594 respectively.
| Characteristic | Number | Measure |
| Per Capita Income | 4,619 | $26,964 |
| Median Family Income | 1,112 | $85,854 |
| Mean Family Income | 1,112 | $89,825 |
| Median Household Income | 1,516 | $78,594 |
| Mean Household Income | 1,516 | $82,259 |
| Income Deficit | 1,112 | $0 |
| Wage / Income Gap (%) | 4,619 | 11.67% |
| Wage / Income Gap ($) | 4,619 | 88.33¢ per $1 |
| Gini / Inequality Index | 4,619 | 0.36 |
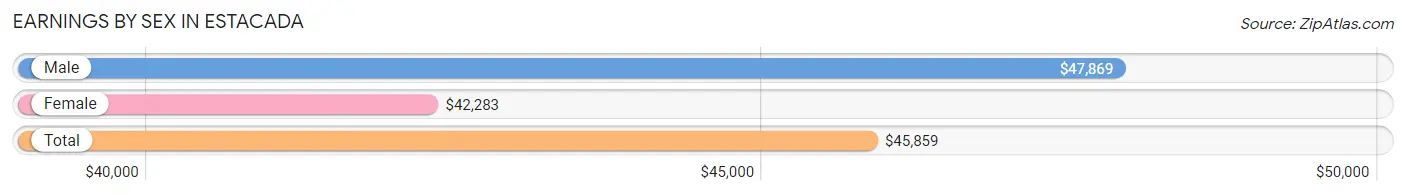
Earnings by Sex in Estacada
Average Earnings in Estacada are $45,859, $47,869 for men and $42,283 for women, a difference of 11.7%.
| Sex | Number | Average Earnings |
| Male | 1,291 (59.8%) | $47,869 |
| Female | 868 (40.2%) | $42,283 |
| Total | 2,159 (100.0%) | $45,859 |
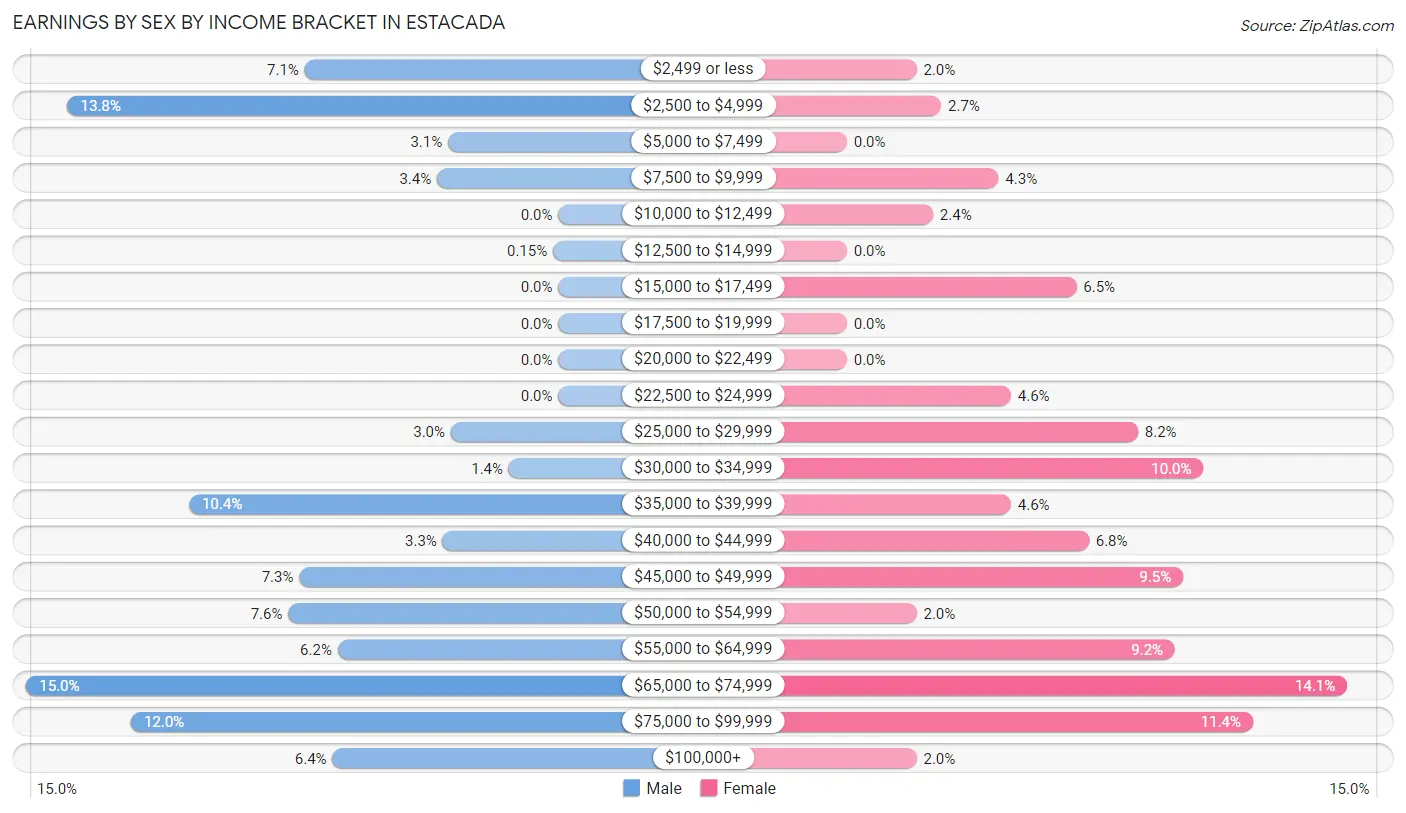
Earnings by Sex by Income Bracket in Estacada
The most common earnings brackets in Estacada are $65,000 to $74,999 for men (193 | 14.9%) and $65,000 to $74,999 for women (122 | 14.1%).
| Income | Male | Female |
| $2,499 or less | 92 (7.1%) | 17 (2.0%) |
| $2,500 to $4,999 | 178 (13.8%) | 23 (2.6%) |
| $5,000 to $7,499 | 40 (3.1%) | 0 (0.0%) |
| $7,500 to $9,999 | 44 (3.4%) | 37 (4.3%) |
| $10,000 to $12,499 | 0 (0.0%) | 21 (2.4%) |
| $12,500 to $14,999 | 2 (0.2%) | 0 (0.0%) |
| $15,000 to $17,499 | 0 (0.0%) | 56 (6.5%) |
| $17,500 to $19,999 | 0 (0.0%) | 0 (0.0%) |
| $20,000 to $22,499 | 0 (0.0%) | 0 (0.0%) |
| $22,500 to $24,999 | 0 (0.0%) | 40 (4.6%) |
| $25,000 to $29,999 | 39 (3.0%) | 71 (8.2%) |
| $30,000 to $34,999 | 18 (1.4%) | 87 (10.0%) |
| $35,000 to $39,999 | 134 (10.4%) | 40 (4.6%) |
| $40,000 to $44,999 | 42 (3.3%) | 59 (6.8%) |
| $45,000 to $49,999 | 94 (7.3%) | 82 (9.5%) |
| $50,000 to $54,999 | 98 (7.6%) | 17 (2.0%) |
| $55,000 to $64,999 | 80 (6.2%) | 80 (9.2%) |
| $65,000 to $74,999 | 193 (14.9%) | 122 (14.1%) |
| $75,000 to $99,999 | 155 (12.0%) | 99 (11.4%) |
| $100,000+ | 82 (6.4%) | 17 (2.0%) |
| Total | 1,291 (100.0%) | 868 (100.0%) |
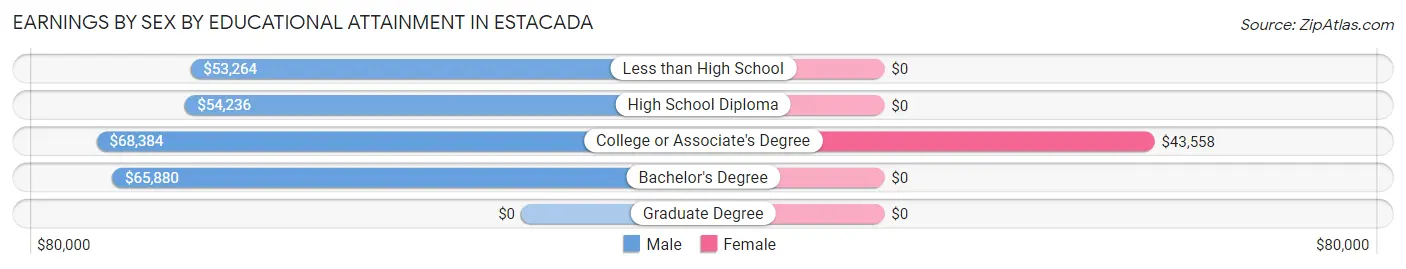
Earnings by Sex by Educational Attainment in Estacada
Average earnings in Estacada are $63,278 for men and $43,365 for women, a difference of 31.5%. Men with an educational attainment of college or associate's degree enjoy the highest average annual earnings of $68,384, while those with less than high school education earn the least with $53,264. Women with an educational attainment of college or associate's degree earn the most with the average annual earnings of $43,558, while those with college or associate's degree education have the smallest earnings of $43,558.
| Educational Attainment | Male Income | Female Income |
| Less than High School | $53,264 | $0 |
| High School Diploma | $54,236 | $0 |
| College or Associate's Degree | $68,384 | $43,558 |
| Bachelor's Degree | $65,880 | $0 |
| Graduate Degree | - | - |
| Total | $63,278 | $43,365 |
Family Income in Estacada
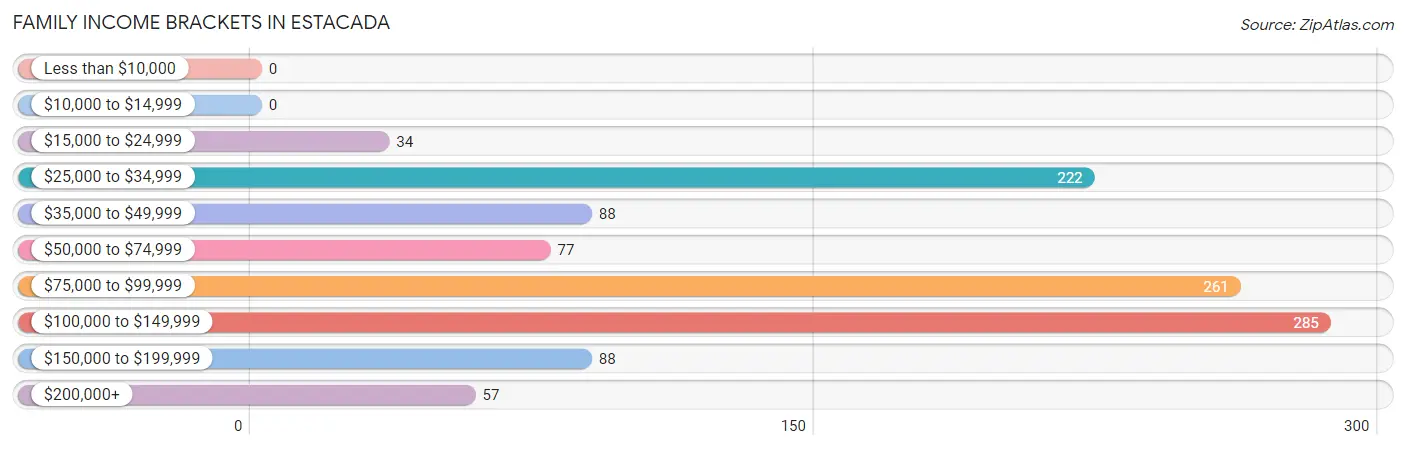
Family Income Brackets in Estacada
According to the Estacada family income data, there are 285 families falling into the $100,000 to $149,999 income range, which is the most common income bracket and makes up 25.6% of all families.
| Income Bracket | # Families | % Families |
| Less than $10,000 | 0 | 0.0% |
| $10,000 to $14,999 | 0 | 0.0% |
| $15,000 to $24,999 | 34 | 3.1% |
| $25,000 to $34,999 | 222 | 20.0% |
| $35,000 to $49,999 | 88 | 7.9% |
| $50,000 to $74,999 | 77 | 6.9% |
| $75,000 to $99,999 | 261 | 23.5% |
| $100,000 to $149,999 | 285 | 25.6% |
| $150,000 to $199,999 | 88 | 7.9% |
| $200,000+ | 57 | 5.1% |
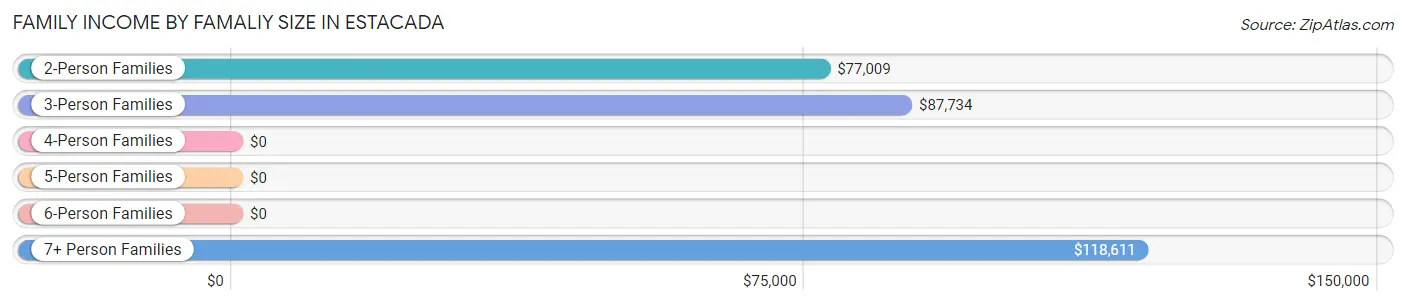
Family Income by Famaliy Size in Estacada
7+ person families (62 | 5.6%) account for the highest median family income in Estacada with $118,611 per family, while 2-person families (329 | 29.6%) have the highest median income of $38,504 per family member.
| Income Bracket | # Families | Median Income |
| 2-Person Families | 329 (29.6%) | $77,009 |
| 3-Person Families | 289 (26.0%) | $87,734 |
| 4-Person Families | 348 (31.3%) | $0 |
| 5-Person Families | 16 (1.4%) | $0 |
| 6-Person Families | 68 (6.1%) | $0 |
| 7+ Person Families | 62 (5.6%) | $118,611 |
| Total | 1,112 (100.0%) | $85,854 |
Family Income by Number of Earners in Estacada
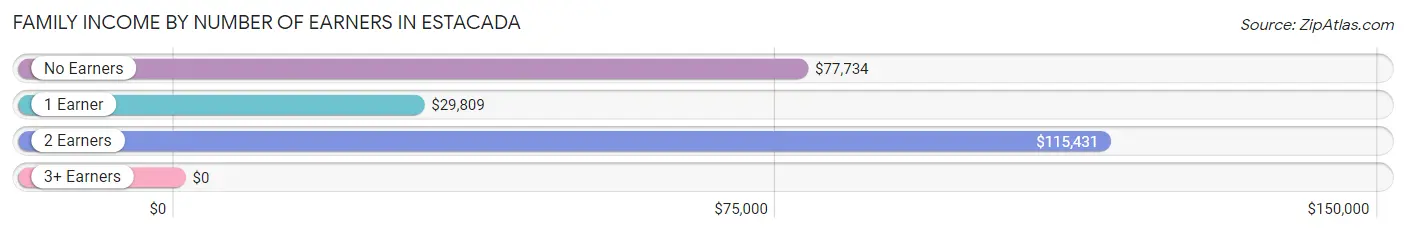
| Number of Earners | # Families | Median Income |
| No Earners | 141 (12.7%) | $77,734 |
| 1 Earner | 334 (30.0%) | $29,809 |
| 2 Earners | 570 (51.3%) | $115,431 |
| 3+ Earners | 67 (6.0%) | $0 |
| Total | 1,112 (100.0%) | $85,854 |
Household Income in Estacada
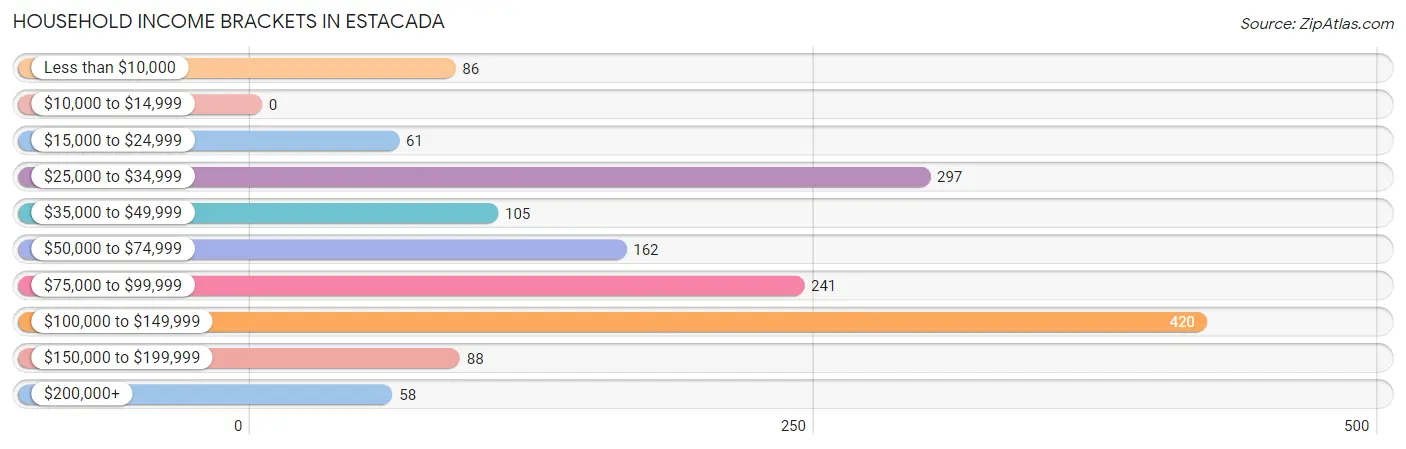
Household Income Brackets in Estacada
With 420 households falling in the category, the $100,000 to $149,999 income range is the most frequent in Estacada, accounting for 27.7% of all households.
| Income Bracket | # Households | % Households |
| Less than $10,000 | 86 | 5.7% |
| $10,000 to $14,999 | 0 | 0.0% |
| $15,000 to $24,999 | 61 | 4.0% |
| $25,000 to $34,999 | 297 | 19.6% |
| $35,000 to $49,999 | 105 | 6.9% |
| $50,000 to $74,999 | 162 | 10.7% |
| $75,000 to $99,999 | 241 | 15.9% |
| $100,000 to $149,999 | 420 | 27.7% |
| $150,000 to $199,999 | 88 | 5.8% |
| $200,000+ | 58 | 3.8% |
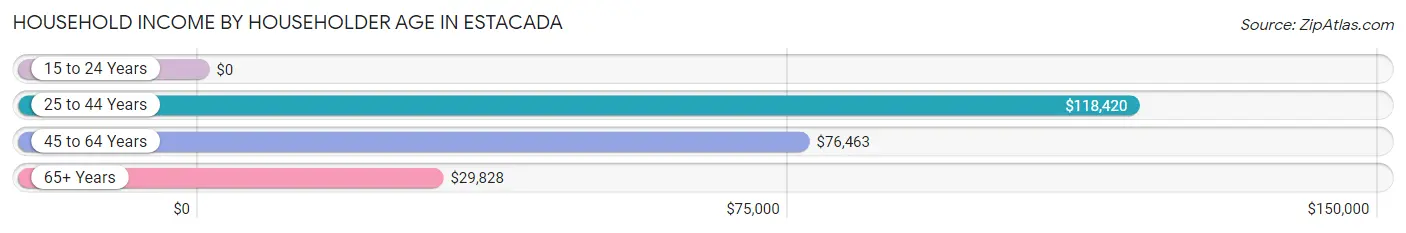
Household Income by Householder Age in Estacada
The median household income in Estacada is $78,594, with the highest median household income of $118,420 found in the 25 to 44 years age bracket for the primary householder. A total of 579 households (38.2%) fall into this category. Meanwhile, the 15 to 24 years age bracket for the primary householder has the lowest median household income of $0, with 16 households (1.1%) in this group.
| Income Bracket | # Households | Median Income |
| 15 to 24 Years | 16 (1.1%) | $0 |
| 25 to 44 Years | 579 (38.2%) | $118,420 |
| 45 to 64 Years | 440 (29.0%) | $76,463 |
| 65+ Years | 481 (31.7%) | $29,828 |
| Total | 1,516 (100.0%) | $78,594 |
Poverty in Estacada
Income Below Poverty by Sex and Age in Estacada
With 19.3% poverty level for males and 20.8% for females among the residents of Estacada, 55 to 64 year old males and 75 year old and over females are the most vulnerable to poverty, with 200 males (57.8%) and 171 females (68.7%) in their respective age groups living below the poverty level.
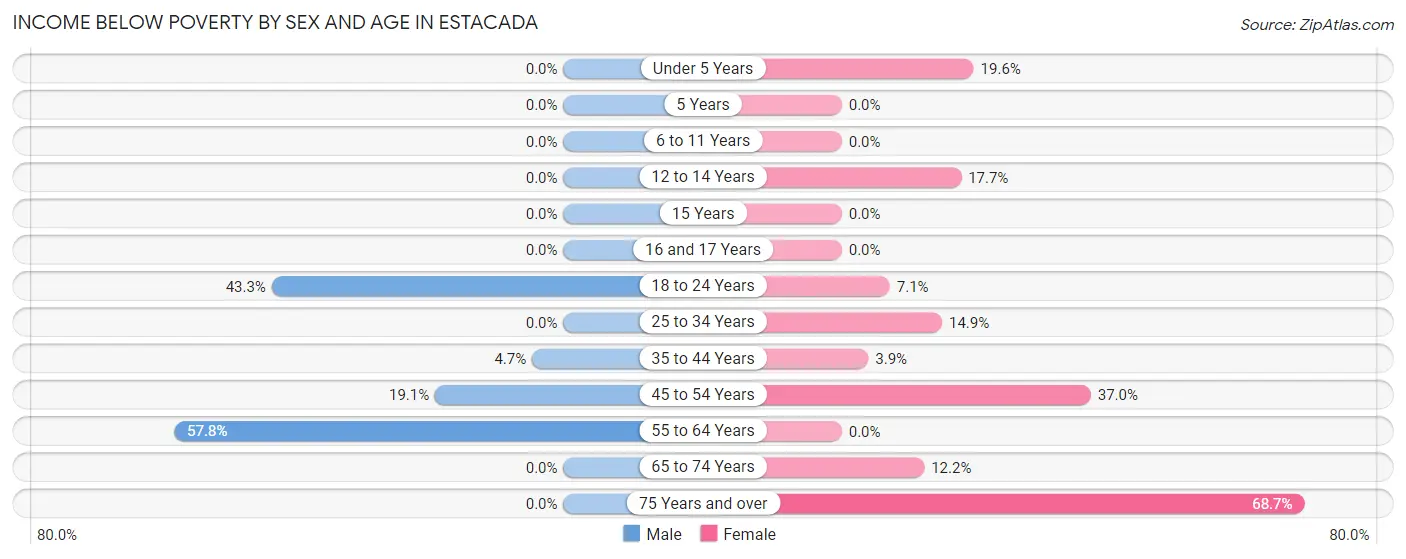
| Age Bracket | Male | Female |
| Under 5 Years | 0 (0.0%) | 37 (19.6%) |
| 5 Years | 0 (0.0%) | 0 (0.0%) |
| 6 to 11 Years | 0 (0.0%) | 0 (0.0%) |
| 12 to 14 Years | 0 (0.0%) | 36 (17.7%) |
| 15 Years | 0 (0.0%) | 0 (0.0%) |
| 16 and 17 Years | 0 (0.0%) | 0 (0.0%) |
| 18 to 24 Years | 178 (43.3%) | 3 (7.1%) |
| 25 to 34 Years | 0 (0.0%) | 53 (14.9%) |
| 35 to 44 Years | 16 (4.6%) | 8 (3.9%) |
| 45 to 54 Years | 40 (19.1%) | 156 (37.0%) |
| 55 to 64 Years | 200 (57.8%) | 0 (0.0%) |
| 65 to 74 Years | 0 (0.0%) | 30 (12.2%) |
| 75 Years and over | 0 (0.0%) | 171 (68.7%) |
| Total | 434 (19.3%) | 494 (20.8%) |
Income Above Poverty by Sex and Age in Estacada
According to the poverty statistics in Estacada, males aged under 5 years and females aged 5 years are the age groups that are most secure financially, with 100.0% of males and 100.0% of females in these age groups living above the poverty line.
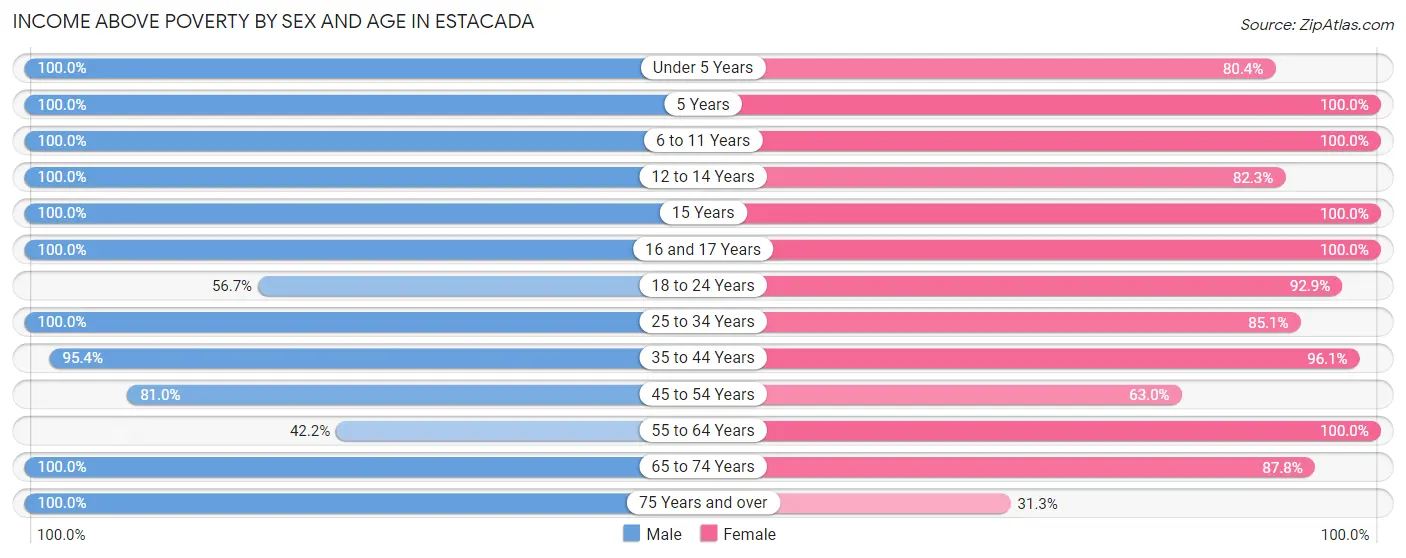
| Age Bracket | Male | Female |
| Under 5 Years | 100 (100.0%) | 152 (80.4%) |
| 5 Years | 45 (100.0%) | 17 (100.0%) |
| 6 to 11 Years | 112 (100.0%) | 201 (100.0%) |
| 12 to 14 Years | 60 (100.0%) | 167 (82.3%) |
| 15 Years | 28 (100.0%) | 74 (100.0%) |
| 16 and 17 Years | 87 (100.0%) | 97 (100.0%) |
| 18 to 24 Years | 233 (56.7%) | 39 (92.9%) |
| 25 to 34 Years | 286 (100.0%) | 303 (85.1%) |
| 35 to 44 Years | 328 (95.4%) | 195 (96.1%) |
| 45 to 54 Years | 170 (80.9%) | 266 (63.0%) |
| 55 to 64 Years | 146 (42.2%) | 77 (100.0%) |
| 65 to 74 Years | 141 (100.0%) | 215 (87.8%) |
| 75 Years and over | 74 (100.0%) | 78 (31.3%) |
| Total | 1,810 (80.7%) | 1,881 (79.2%) |
Income Below Poverty Among Married-Couple Families in Estacada
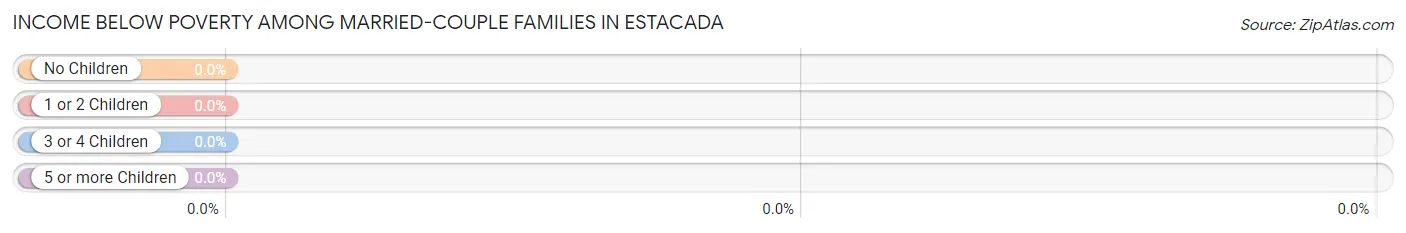
| Children | Above Poverty | Below Poverty |
| No Children | 345 (100.0%) | 0 (0.0%) |
| 1 or 2 Children | 249 (100.0%) | 0 (0.0%) |
| 3 or 4 Children | 95 (100.0%) | 0 (0.0%) |
| 5 or more Children | 51 (100.0%) | 0 (0.0%) |
| Total | 740 (100.0%) | 0 (0.0%) |
Income Below Poverty Among Single-Parent Households in Estacada
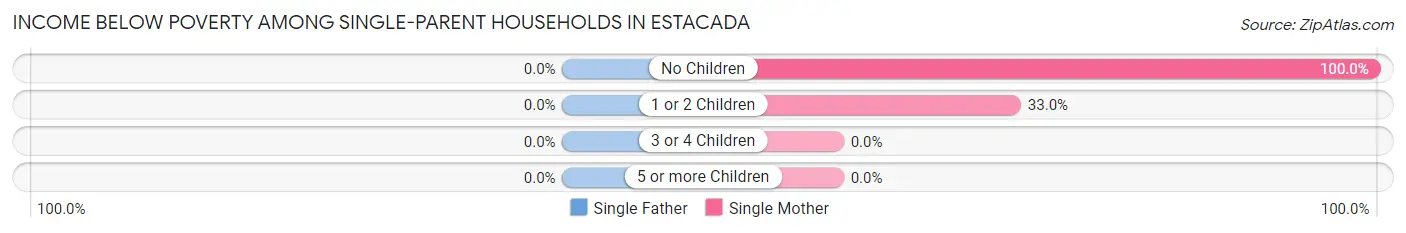
| Children | Single Father | Single Mother |
| No Children | 0 (0.0%) | 144 (100.0%) |
| 1 or 2 Children | 0 (0.0%) | 34 (33.0%) |
| 3 or 4 Children | 0 (0.0%) | 0 (0.0%) |
| 5 or more Children | 0 (0.0%) | 0 (0.0%) |
| Total | 0 (0.0%) | 178 (72.1%) |
Income Below Poverty Among Married-Couple vs Single-Parent Households in Estacada
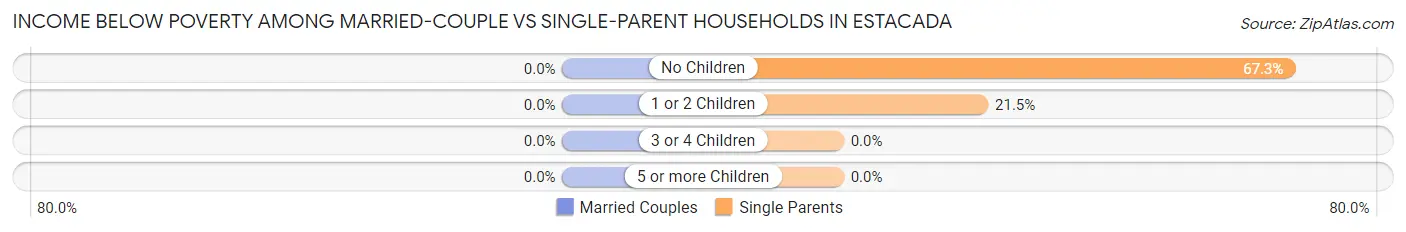
| Children | Married-Couple Families | Single-Parent Households |
| No Children | 0 (0.0%) | 144 (67.3%) |
| 1 or 2 Children | 0 (0.0%) | 34 (21.5%) |
| 3 or 4 Children | 0 (0.0%) | 0 (0.0%) |
| 5 or more Children | 0 (0.0%) | 0 (0.0%) |
| Total | 0 (0.0%) | 178 (47.8%) |
Race in Estacada
The most populous races in Estacada are White / Caucasian (4,294 | 93.0%), Two or more Races (179 | 3.9%), and Asian (61 | 1.3%).
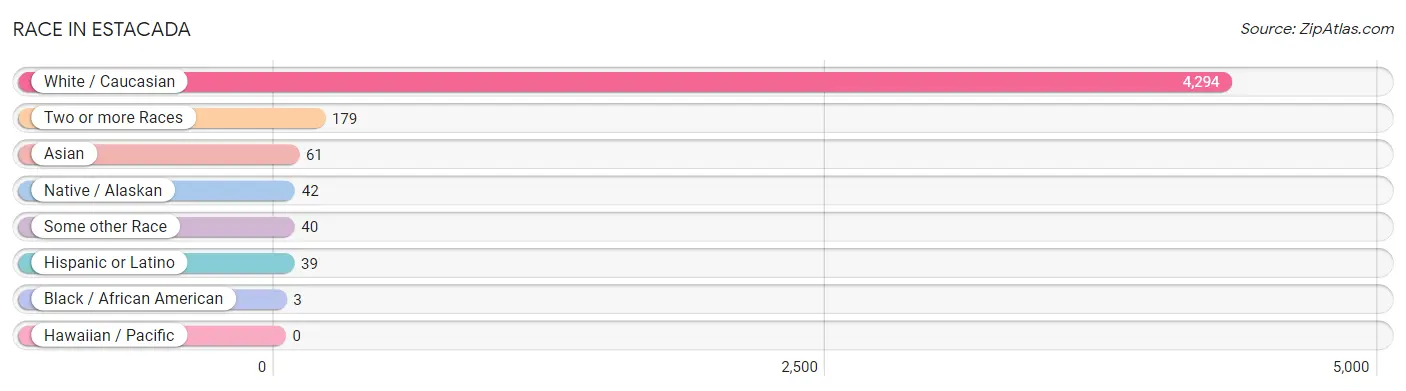
| Race | # Population | % Population |
| Asian | 61 | 1.3% |
| Black / African American | 3 | 0.1% |
| Hawaiian / Pacific | 0 | 0.0% |
| Hispanic or Latino | 39 | 0.8% |
| Native / Alaskan | 42 | 0.9% |
| White / Caucasian | 4,294 | 93.0% |
| Two or more Races | 179 | 3.9% |
| Some other Race | 40 | 0.9% |
| Total | 4,619 | 100.0% |
Ancestry in Estacada
The most populous ancestries reported in Estacada are American (1,014 | 22.0%), Irish (1,005 | 21.8%), German (849 | 18.4%), English (415 | 9.0%), and Scandinavian (315 | 6.8%), together accounting for 77.9% of all Estacada residents.
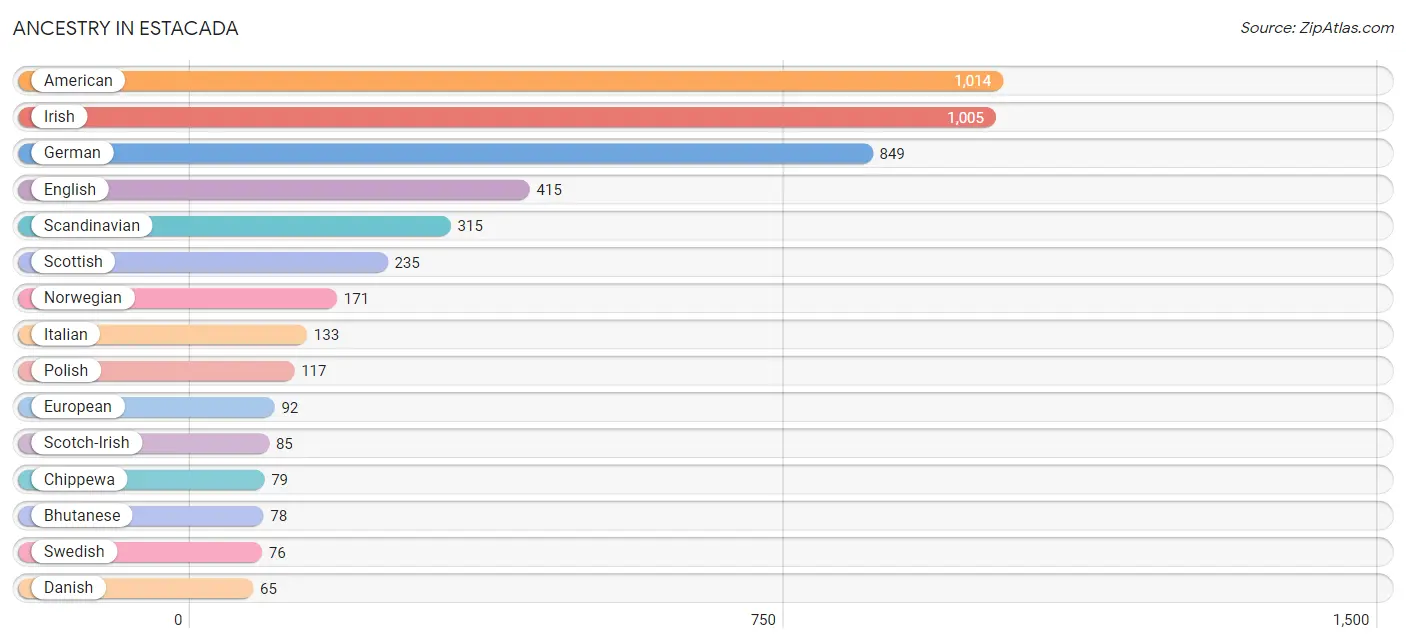
| Ancestry | # Population | % Population |
| American | 1,014 | 22.0% |
| Arab | 39 | 0.8% |
| Bhutanese | 78 | 1.7% |
| British | 64 | 1.4% |
| Burmese | 40 | 0.9% |
| Chippewa | 79 | 1.7% |
| Croatian | 20 | 0.4% |
| Danish | 65 | 1.4% |
| Dutch | 38 | 0.8% |
| English | 415 | 9.0% |
| European | 92 | 2.0% |
| French | 30 | 0.6% |
| German | 849 | 18.4% |
| Hungarian | 28 | 0.6% |
| Iraqi | 21 | 0.4% |
| Irish | 1,005 | 21.8% |
| Italian | 133 | 2.9% |
| Japanese | 18 | 0.4% |
| Kiowa | 4 | 0.1% |
| Korean | 3 | 0.1% |
| Lebanese | 18 | 0.4% |
| Mexican | 39 | 0.8% |
| Northern European | 40 | 0.9% |
| Norwegian | 171 | 3.7% |
| Polish | 117 | 2.5% |
| Romanian | 21 | 0.4% |
| Scandinavian | 315 | 6.8% |
| Scotch-Irish | 85 | 1.8% |
| Scottish | 235 | 5.1% |
| South African | 17 | 0.4% |
| Subsaharan African | 17 | 0.4% |
| Swedish | 76 | 1.7% |
| Welsh | 28 | 0.6% | View All 33 Rows |
Immigrants in Estacada
The most numerous immigrant groups reported in Estacada came from Europe (54 | 1.2%), Asia (40 | 0.9%), Eastern Asia (40 | 0.9%), Korea (40 | 0.9%), and Eastern Europe (21 | 0.4%), together accounting for 4.2% of all Estacada residents.
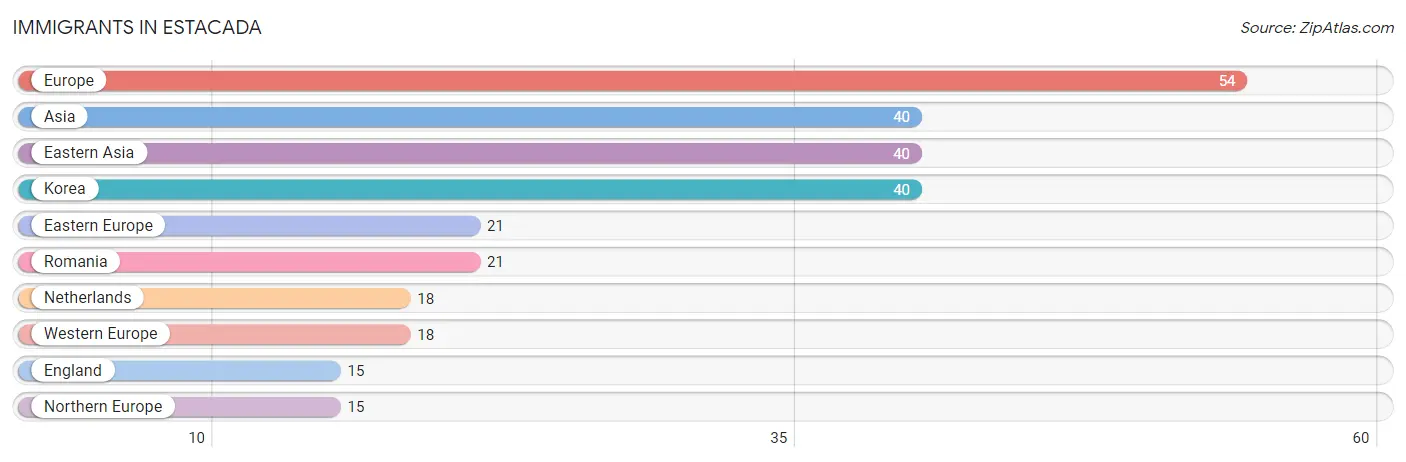
| Immigration Origin | # Population | % Population |
| Asia | 40 | 0.9% |
| Eastern Asia | 40 | 0.9% |
| Eastern Europe | 21 | 0.4% |
| England | 15 | 0.3% |
| Europe | 54 | 1.2% |
| Korea | 40 | 0.9% |
| Netherlands | 18 | 0.4% |
| Northern Europe | 15 | 0.3% |
| Romania | 21 | 0.4% |
| Western Europe | 18 | 0.4% | View All 10 Rows |
Sex and Age in Estacada
Sex and Age in Estacada
The most populous age groups in Estacada are 15 to 19 Years (370 | 16.5%) for men and 10 to 14 Years (275 | 11.6%) for women.
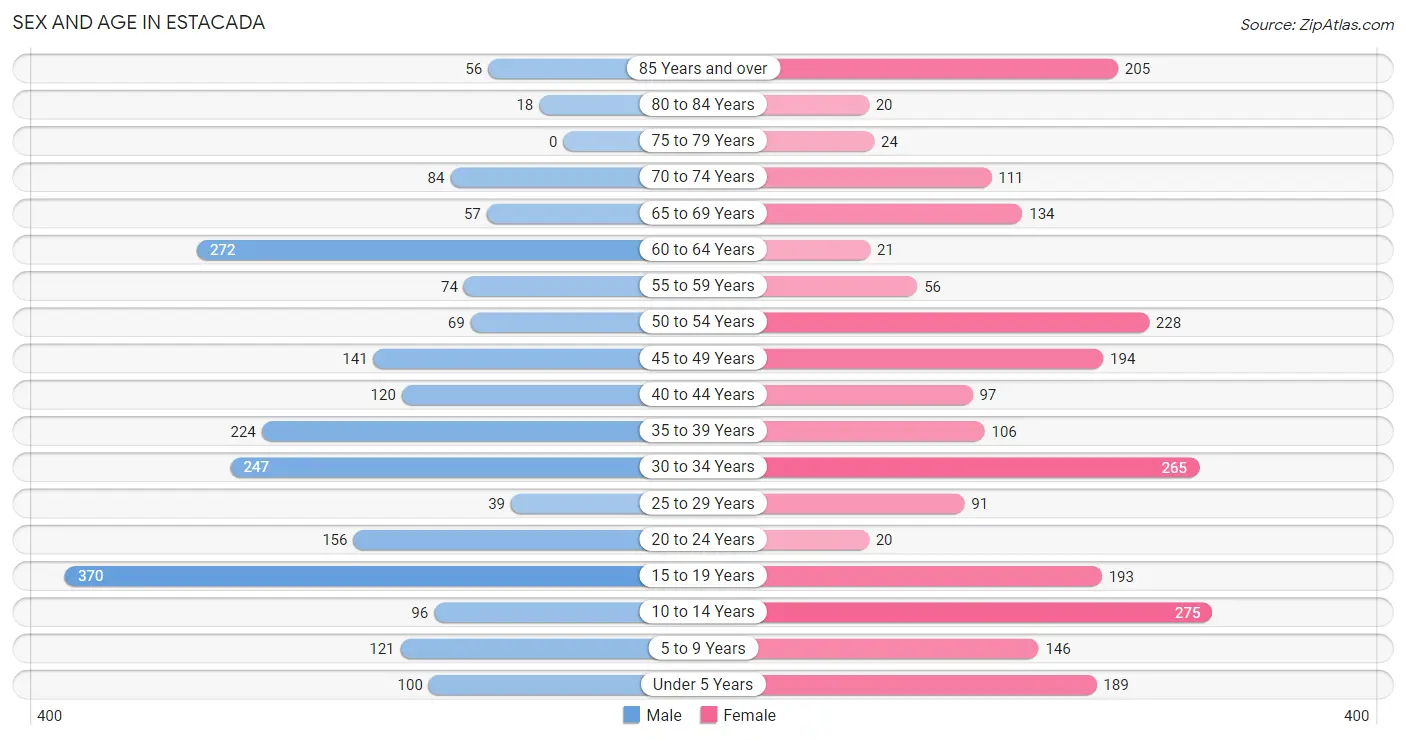
| Age Bracket | Male | Female |
| Under 5 Years | 100 (4.5%) | 189 (8.0%) |
| 5 to 9 Years | 121 (5.4%) | 146 (6.1%) |
| 10 to 14 Years | 96 (4.3%) | 275 (11.6%) |
| 15 to 19 Years | 370 (16.5%) | 193 (8.1%) |
| 20 to 24 Years | 156 (7.0%) | 20 (0.8%) |
| 25 to 29 Years | 39 (1.7%) | 91 (3.8%) |
| 30 to 34 Years | 247 (11.0%) | 265 (11.2%) |
| 35 to 39 Years | 224 (10.0%) | 106 (4.5%) |
| 40 to 44 Years | 120 (5.3%) | 97 (4.1%) |
| 45 to 49 Years | 141 (6.3%) | 194 (8.2%) |
| 50 to 54 Years | 69 (3.1%) | 228 (9.6%) |
| 55 to 59 Years | 74 (3.3%) | 56 (2.4%) |
| 60 to 64 Years | 272 (12.1%) | 21 (0.9%) |
| 65 to 69 Years | 57 (2.5%) | 134 (5.6%) |
| 70 to 74 Years | 84 (3.7%) | 111 (4.7%) |
| 75 to 79 Years | 0 (0.0%) | 24 (1.0%) |
| 80 to 84 Years | 18 (0.8%) | 20 (0.8%) |
| 85 Years and over | 56 (2.5%) | 205 (8.6%) |
| Total | 2,244 (100.0%) | 2,375 (100.0%) |
Families and Households in Estacada
Median Family Size in Estacada
The median family size in Estacada is 3.51 persons per family, with single female/mother families (247 | 22.2%) accounting for the largest median family size of 3.76 persons per family. On the other hand, single male/father families (125 | 11.2%) represent the smallest median family size with 2.70 persons per family.
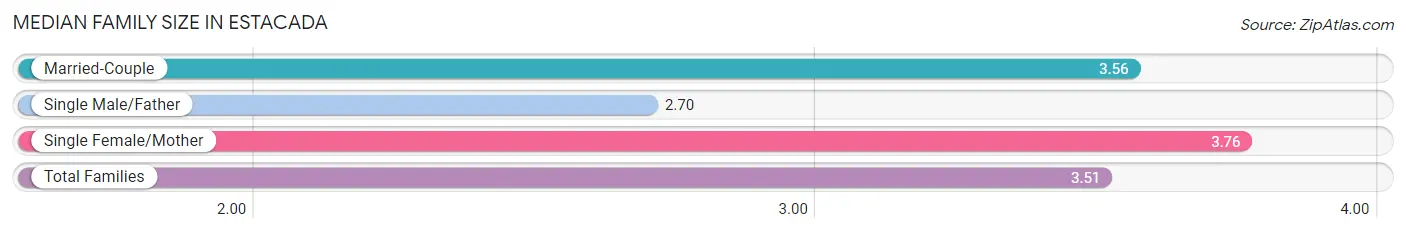
| Family Type | # Families | Family Size |
| Married-Couple | 740 (66.5%) | 3.56 |
| Single Male/Father | 125 (11.2%) | 2.70 |
| Single Female/Mother | 247 (22.2%) | 3.76 |
| Total Families | 1,112 (100.0%) | 3.51 |
Median Household Size in Estacada
The median household size in Estacada is 3.03 persons per household, with single female/mother households (247 | 16.3%) accounting for the largest median household size of 3.89 persons per household. non-family households (404 | 26.7%) represent the smallest median household size with 1.22 persons per household.
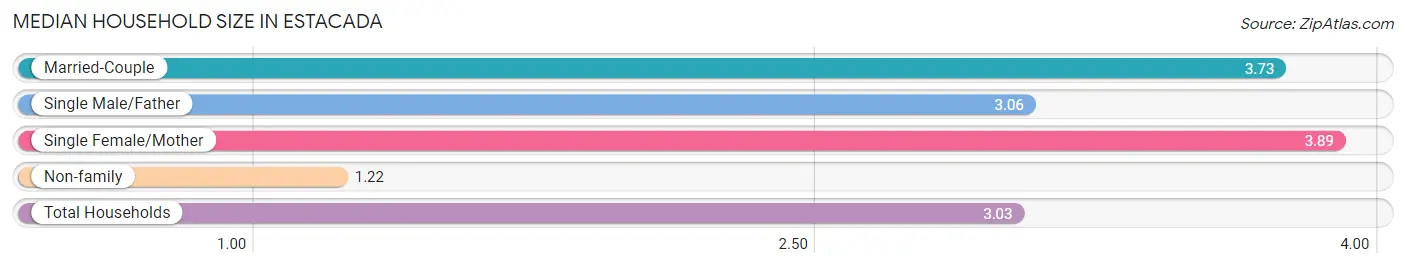
| Household Type | # Households | Household Size |
| Married-Couple | 740 (48.8%) | 3.73 |
| Single Male/Father | 125 (8.3%) | 3.06 |
| Single Female/Mother | 247 (16.3%) | 3.89 |
| Non-family | 404 (26.7%) | 1.22 |
| Total Households | 1,516 (100.0%) | 3.03 |
Household Size by Marriage Status in Estacada
Out of a total of 1,516 households in Estacada, 1,112 (73.4%) are family households, while 404 (26.7%) are nonfamily households. The most numerous type of family households are 4-person households, comprising 331, and the most common type of nonfamily households are 1-person households, comprising 366.
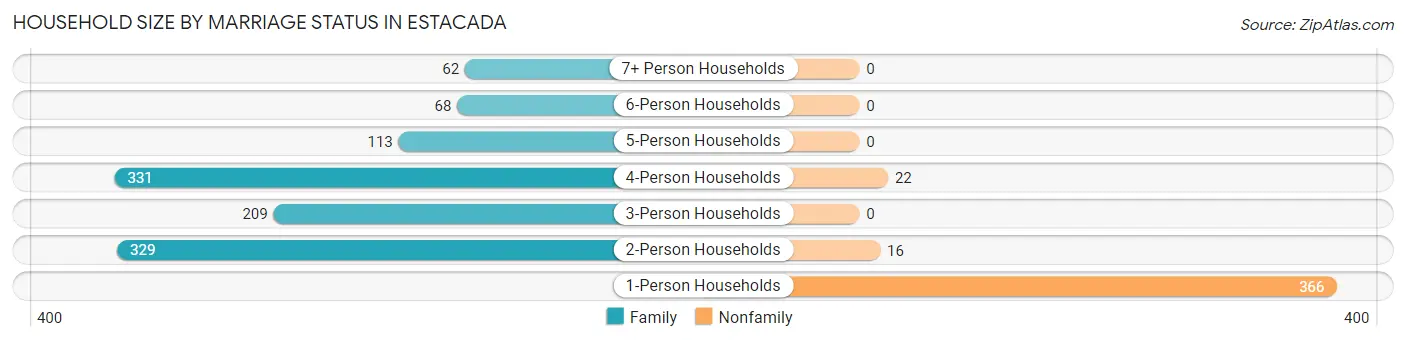
| Household Size | Family Households | Nonfamily Households |
| 1-Person Households | - | 366 (24.1%) |
| 2-Person Households | 329 (21.7%) | 16 (1.1%) |
| 3-Person Households | 209 (13.8%) | 0 (0.0%) |
| 4-Person Households | 331 (21.8%) | 22 (1.5%) |
| 5-Person Households | 113 (7.4%) | 0 (0.0%) |
| 6-Person Households | 68 (4.5%) | 0 (0.0%) |
| 7+ Person Households | 62 (4.1%) | 0 (0.0%) |
| Total | 1,112 (73.4%) | 404 (26.7%) |
Female Fertility in Estacada
Fertility by Age in Estacada
Average fertility rate in Estacada is 18.0 births per 1,000 women. Women in the age bracket of 20 to 34 years have the highest fertility rate with 48.0 births per 1,000 women. Women in the age bracket of 20 to 34 years acount for 100.0% of all women with births.
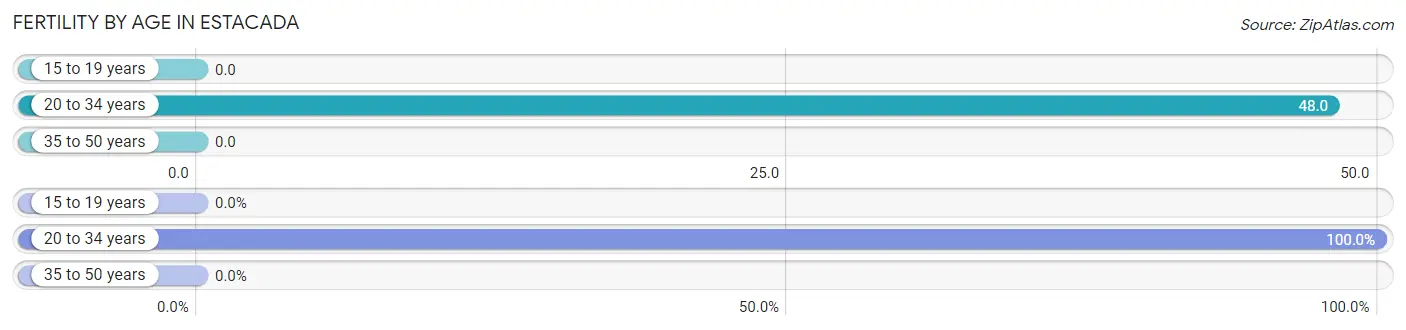
| Age Bracket | Women with Births | Births / 1,000 Women |
| 15 to 19 years | 0 (0.0%) | 0.0 |
| 20 to 34 years | 18 (100.0%) | 48.0 |
| 35 to 50 years | 0 (0.0%) | 0.0 |
| Total | 18 (100.0%) | 18.0 |
Fertility by Age by Marriage Status in Estacada
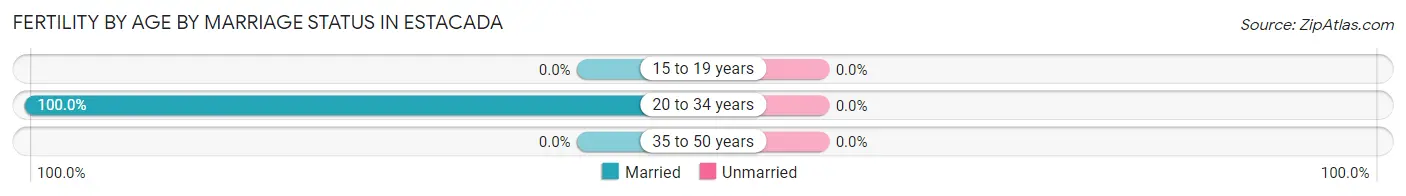
| Age Bracket | Married | Unmarried |
| 15 to 19 years | 0 (0.0%) | 0 (0.0%) |
| 20 to 34 years | 18 (100.0%) | 0 (0.0%) |
| 35 to 50 years | 0 (0.0%) | 0 (0.0%) |
| Total | 18 (100.0%) | 0 (0.0%) |
Fertility by Education in Estacada
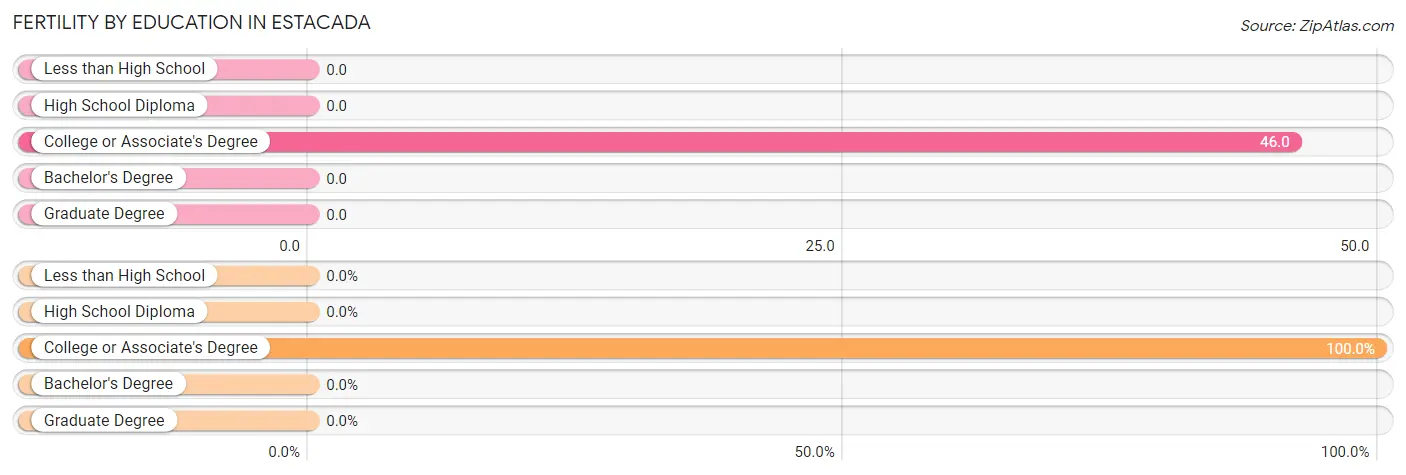
| Educational Attainment | Women with Births | Births / 1,000 Women |
| Less than High School | 0 (0.0%) | 0.0 |
| High School Diploma | 0 (0.0%) | 0.0 |
| College or Associate's Degree | 18 (100.0%) | 46.0 |
| Bachelor's Degree | 0 (0.0%) | 0.0 |
| Graduate Degree | 0 (0.0%) | 0.0 |
| Total | 18 (100.0%) | 18.0 |
Fertility by Education by Marriage Status in Estacada
| Educational Attainment | Married | Unmarried |
| Less than High School | 0 (0.0%) | 0 (0.0%) |
| High School Diploma | 0 (0.0%) | 0 (0.0%) |
| College or Associate's Degree | 18 (100.0%) | 0 (0.0%) |
| Bachelor's Degree | 0 (0.0%) | 0 (0.0%) |
| Graduate Degree | 0 (0.0%) | 0 (0.0%) |
| Total | 18 (100.0%) | 0 (0.0%) |
Employment Characteristics in Estacada
Employment by Class of Employer in Estacada
Among the 1,906 employed individuals in Estacada, private company employees (1,513 | 79.4%), federal government employees (151 | 7.9%), and self-employed (incorporated) (77 | 4.0%) make up the most common classes of employment.
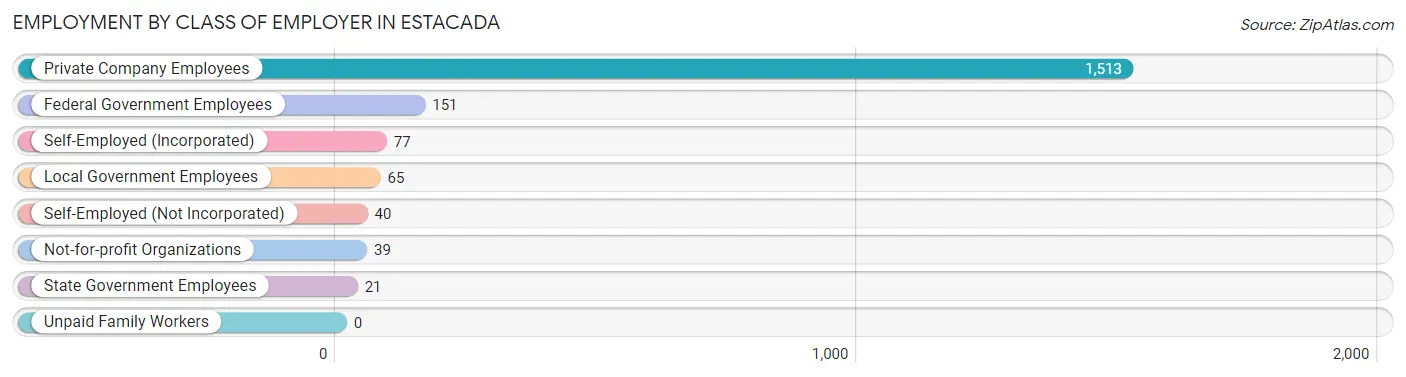
| Employer Class | # Employees | % Employees |
| Private Company Employees | 1,513 | 79.4% |
| Self-Employed (Incorporated) | 77 | 4.0% |
| Self-Employed (Not Incorporated) | 40 | 2.1% |
| Not-for-profit Organizations | 39 | 2.1% |
| Local Government Employees | 65 | 3.4% |
| State Government Employees | 21 | 1.1% |
| Federal Government Employees | 151 | 7.9% |
| Unpaid Family Workers | 0 | 0.0% |
| Total | 1,906 | 100.0% |
Employment Status by Age in Estacada
According to the labor force statistics for Estacada, out of the total population over 16 years of age (3,590), 59.7% or 2,143 individuals are in the labor force, with 6.1% or 131 of them unemployed. The age group with the highest labor force participation rate is 55 to 59 years, with 100.0% or 130 individuals in the labor force. Within the labor force, the 16 to 19 years age range has the highest percentage of unemployed individuals, with 23.7% or 77 of them being unemployed.
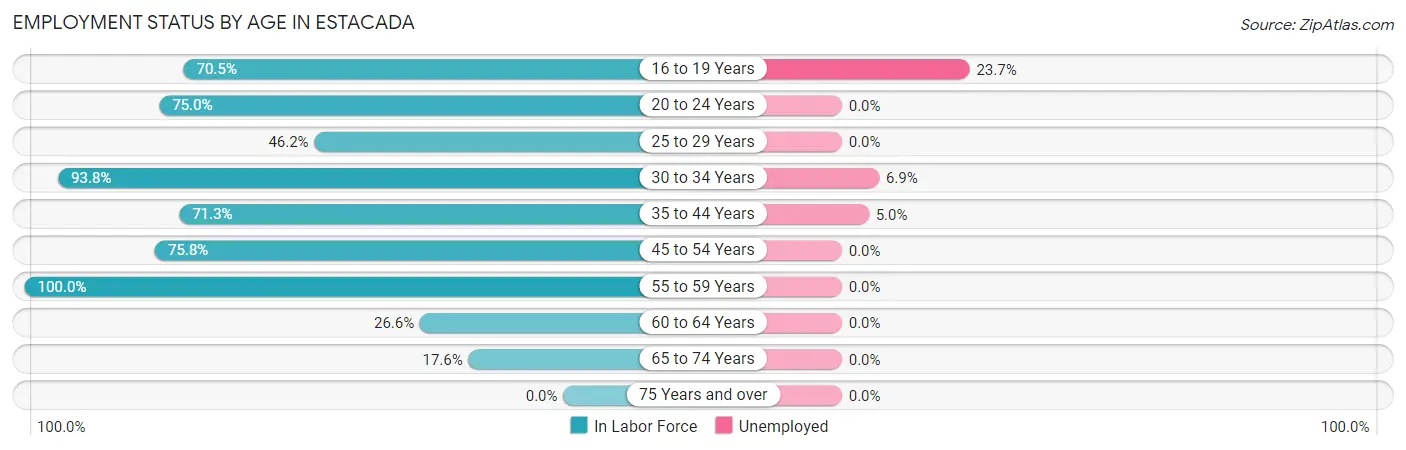
| Age Bracket | In Labor Force | Unemployed |
| 16 to 19 Years | 325 (70.5%) | 77 (23.7%) |
| 20 to 24 Years | 132 (75.0%) | 0 (0.0%) |
| 25 to 29 Years | 60 (46.2%) | 0 (0.0%) |
| 30 to 34 Years | 480 (93.8%) | 33 (6.9%) |
| 35 to 44 Years | 390 (71.3%) | 20 (5.0%) |
| 45 to 54 Years | 479 (75.8%) | 0 (0.0%) |
| 55 to 59 Years | 130 (100.0%) | 0 (0.0%) |
| 60 to 64 Years | 78 (26.6%) | 0 (0.0%) |
| 65 to 74 Years | 68 (17.6%) | 0 (0.0%) |
| 75 Years and over | 0 (0.0%) | 0 (0.0%) |
| Total | 2,143 (59.7%) | 131 (6.1%) |
Employment Status by Educational Attainment in Estacada
According to labor force statistics for Estacada, 72.1% of individuals (1,618) out of the total population between 25 and 64 years of age (2,244) are in the labor force, with 3.2% or 52 of them being unemployed. The group with the highest labor force participation rate are those with the educational attainment of bachelor's degree or higher, with 81.5% or 251 individuals in the labor force. Within the labor force, individuals with less than high school education have the highest percentage of unemployment, with 24.4% or 33 of them being unemployed.
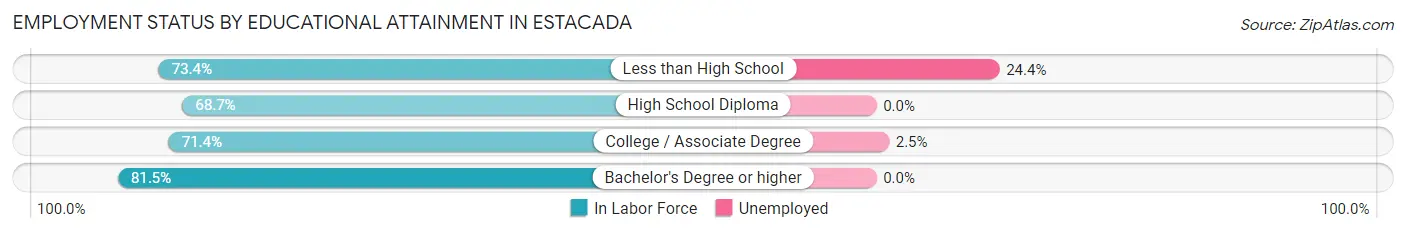
| Educational Attainment | In Labor Force | Unemployed |
| Less than High School | 135 (73.4%) | 45 (24.4%) |
| High School Diploma | 495 (68.7%) | 0 (0.0%) |
| College / Associate Degree | 736 (71.4%) | 26 (2.5%) |
| Bachelor's Degree or higher | 251 (81.5%) | 0 (0.0%) |
| Total | 1,618 (72.1%) | 72 (3.2%) |
Employment Occupations by Sex in Estacada
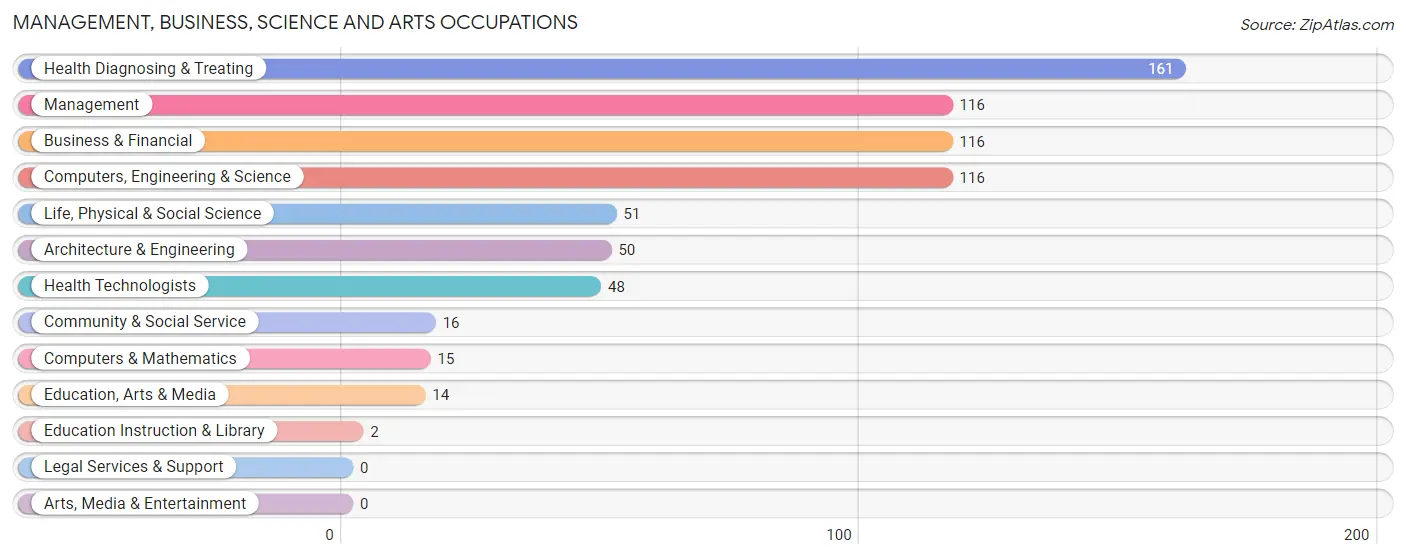
Management, Business, Science and Arts Occupations
The most common Management, Business, Science and Arts occupations in Estacada are Health Diagnosing & Treating (161 | 8.1%), Management (116 | 5.8%), Business & Financial (116 | 5.8%), Computers, Engineering & Science (116 | 5.8%), and Life, Physical & Social Science (51 | 2.6%).
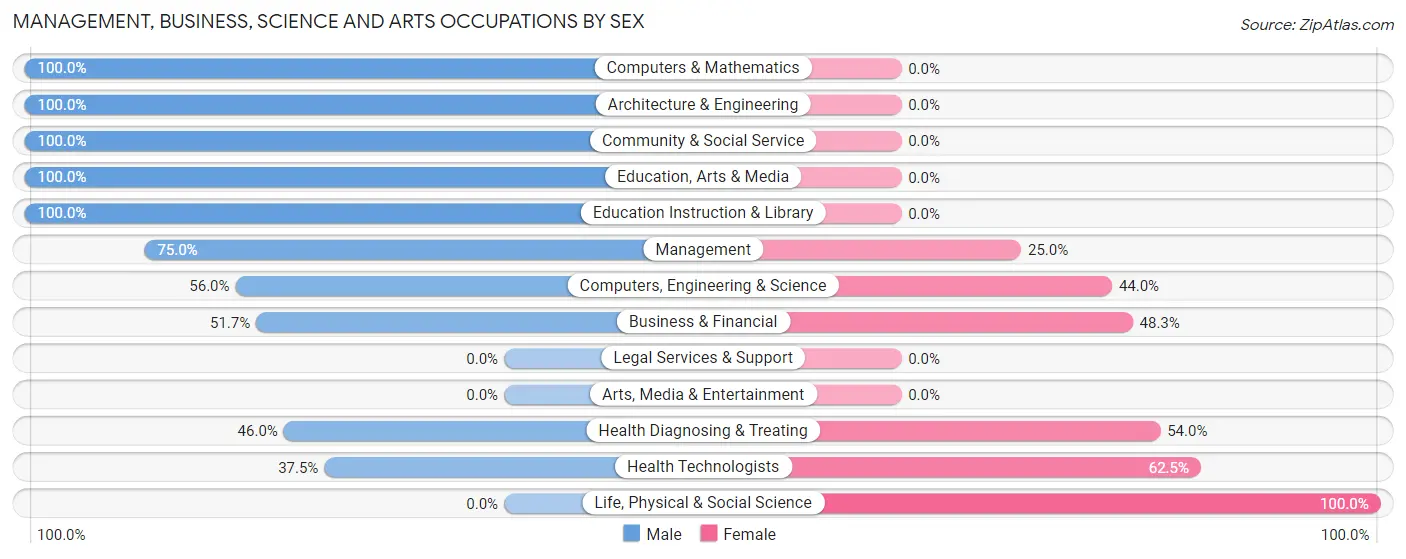
Management, Business, Science and Arts Occupations by Sex
Within the Management, Business, Science and Arts occupations in Estacada, the most male-oriented occupations are Computers & Mathematics (100.0%), Architecture & Engineering (100.0%), and Community & Social Service (100.0%), while the most female-oriented occupations are Life, Physical & Social Science (100.0%), Health Technologists (62.5%), and Health Diagnosing & Treating (54.0%).
| Occupation | Male | Female |
| Management | 87 (75.0%) | 29 (25.0%) |
| Business & Financial | 60 (51.7%) | 56 (48.3%) |
| Computers, Engineering & Science | 65 (56.0%) | 51 (44.0%) |
| Computers & Mathematics | 15 (100.0%) | 0 (0.0%) |
| Architecture & Engineering | 50 (100.0%) | 0 (0.0%) |
| Life, Physical & Social Science | 0 (0.0%) | 51 (100.0%) |
| Community & Social Service | 16 (100.0%) | 0 (0.0%) |
| Education, Arts & Media | 14 (100.0%) | 0 (0.0%) |
| Legal Services & Support | 0 (0.0%) | 0 (0.0%) |
| Education Instruction & Library | 2 (100.0%) | 0 (0.0%) |
| Arts, Media & Entertainment | 0 (0.0%) | 0 (0.0%) |
| Health Diagnosing & Treating | 74 (46.0%) | 87 (54.0%) |
| Health Technologists | 18 (37.5%) | 30 (62.5%) |
| Total (Category) | 302 (57.5%) | 223 (42.5%) |
| Total (Overall) | 1,222 (61.6%) | 763 (38.4%) |
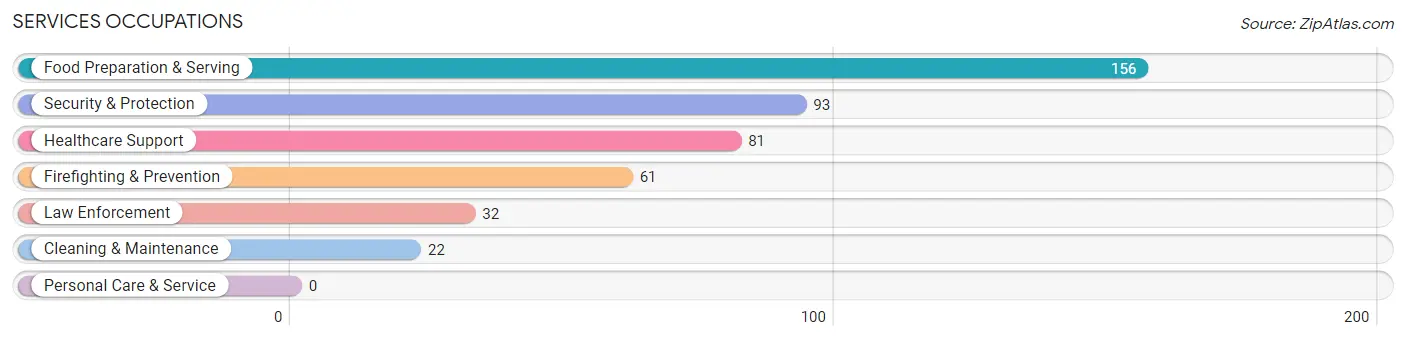
Services Occupations
The most common Services occupations in Estacada are Food Preparation & Serving (156 | 7.9%), Security & Protection (93 | 4.7%), Healthcare Support (81 | 4.1%), Firefighting & Prevention (61 | 3.1%), and Law Enforcement (32 | 1.6%).
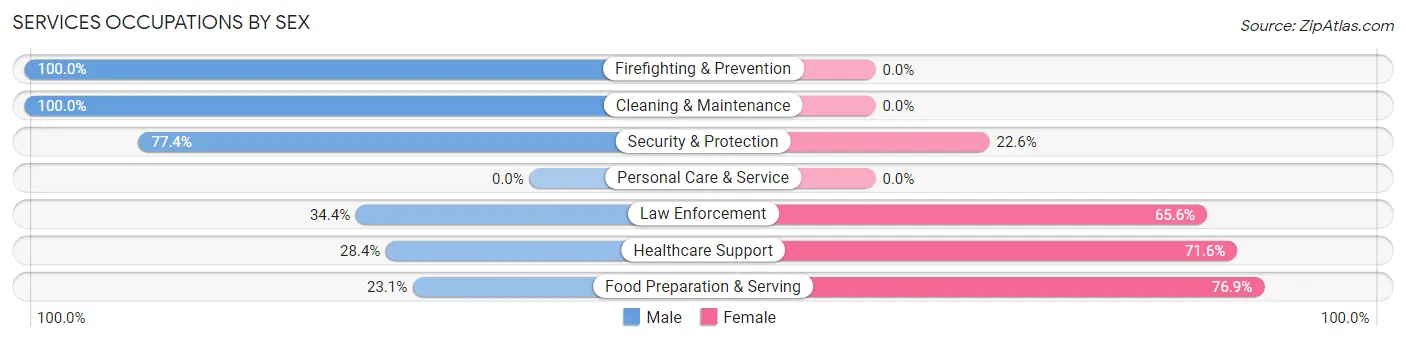
Services Occupations by Sex
Within the Services occupations in Estacada, the most male-oriented occupations are Firefighting & Prevention (100.0%), Cleaning & Maintenance (100.0%), and Security & Protection (77.4%), while the most female-oriented occupations are Food Preparation & Serving (76.9%), Healthcare Support (71.6%), and Law Enforcement (65.6%).
| Occupation | Male | Female |
| Healthcare Support | 23 (28.4%) | 58 (71.6%) |
| Security & Protection | 72 (77.4%) | 21 (22.6%) |
| Firefighting & Prevention | 61 (100.0%) | 0 (0.0%) |
| Law Enforcement | 11 (34.4%) | 21 (65.6%) |
| Food Preparation & Serving | 36 (23.1%) | 120 (76.9%) |
| Cleaning & Maintenance | 22 (100.0%) | 0 (0.0%) |
| Personal Care & Service | 0 (0.0%) | 0 (0.0%) |
| Total (Category) | 153 (43.5%) | 199 (56.5%) |
| Total (Overall) | 1,222 (61.6%) | 763 (38.4%) |
Sales and Office Occupations
The most common Sales and Office occupations in Estacada are Office & Administration (289 | 14.6%), and Sales & Related (69 | 3.5%).
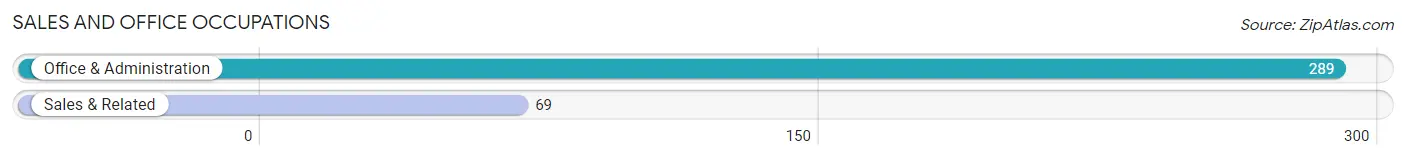
Sales and Office Occupations by Sex

| Occupation | Male | Female |
| Sales & Related | 37 (53.6%) | 32 (46.4%) |
| Office & Administration | 42 (14.5%) | 247 (85.5%) |
| Total (Category) | 79 (22.1%) | 279 (77.9%) |
| Total (Overall) | 1,222 (61.6%) | 763 (38.4%) |
Natural Resources, Construction and Maintenance Occupations
The most common Natural Resources, Construction and Maintenance occupations in Estacada are Construction & Extraction (134 | 6.8%), and Installation, Maintenance & Repair (52 | 2.6%).
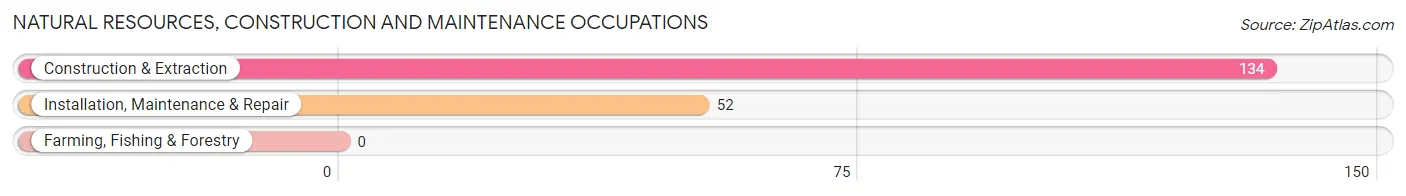
Natural Resources, Construction and Maintenance Occupations by Sex
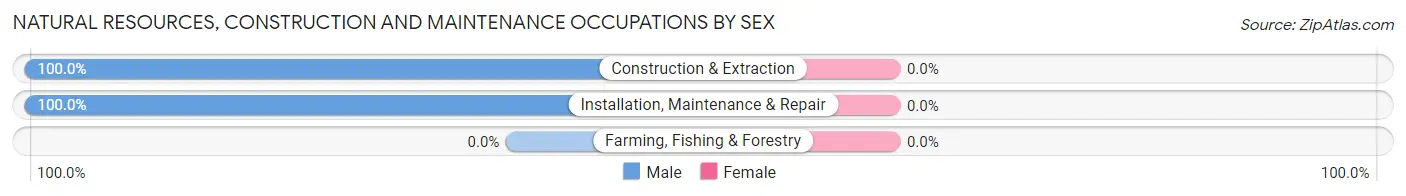
| Occupation | Male | Female |
| Farming, Fishing & Forestry | 0 (0.0%) | 0 (0.0%) |
| Construction & Extraction | 134 (100.0%) | 0 (0.0%) |
| Installation, Maintenance & Repair | 52 (100.0%) | 0 (0.0%) |
| Total (Category) | 186 (100.0%) | 0 (0.0%) |
| Total (Overall) | 1,222 (61.6%) | 763 (38.4%) |
Production, Transportation and Moving Occupations
The most common Production, Transportation and Moving occupations in Estacada are Production (301 | 15.2%), Transportation (141 | 7.1%), and Material Moving (122 | 6.1%).
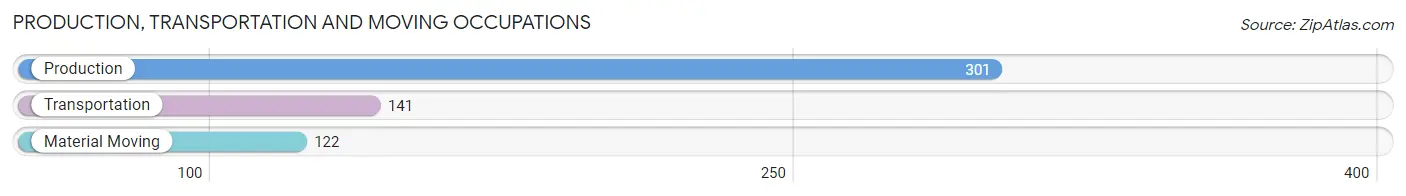
Production, Transportation and Moving Occupations by Sex
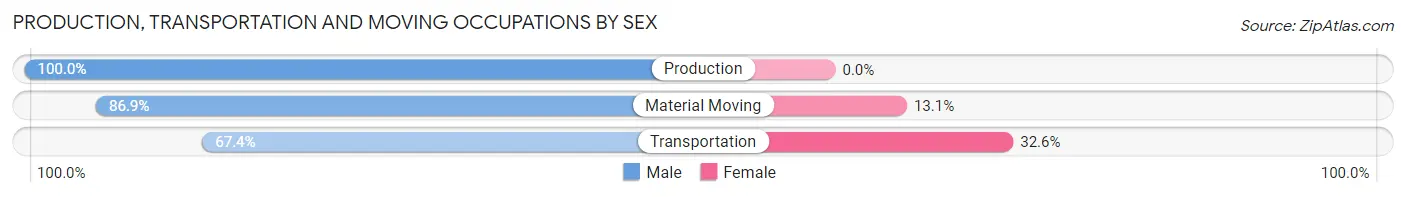
| Occupation | Male | Female |
| Production | 301 (100.0%) | 0 (0.0%) |
| Transportation | 95 (67.4%) | 46 (32.6%) |
| Material Moving | 106 (86.9%) | 16 (13.1%) |
| Total (Category) | 502 (89.0%) | 62 (11.0%) |
| Total (Overall) | 1,222 (61.6%) | 763 (38.4%) |
Employment Industries by Sex in Estacada
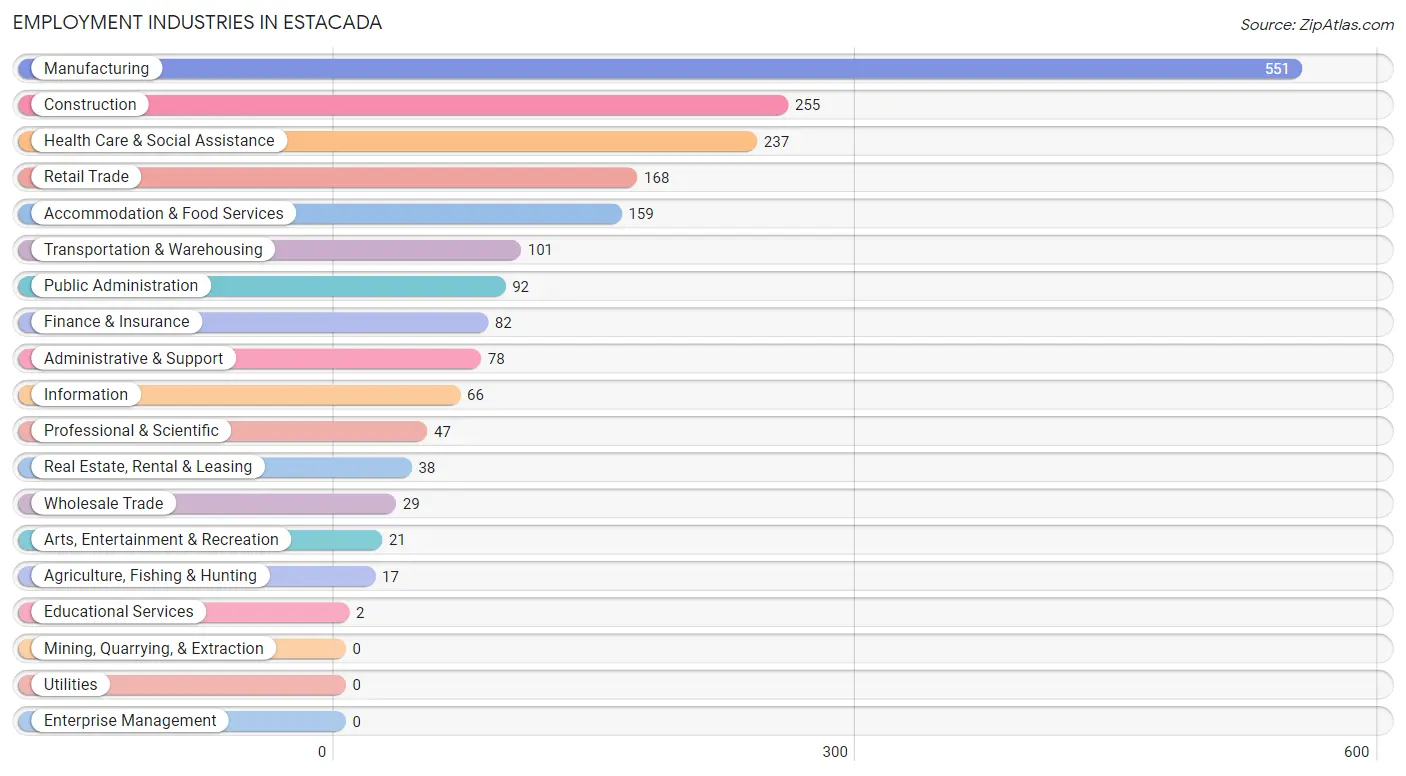
Employment Industries in Estacada
The major employment industries in Estacada include Manufacturing (551 | 27.8%), Construction (255 | 12.9%), Health Care & Social Assistance (237 | 11.9%), Retail Trade (168 | 8.5%), and Accommodation & Food Services (159 | 8.0%).
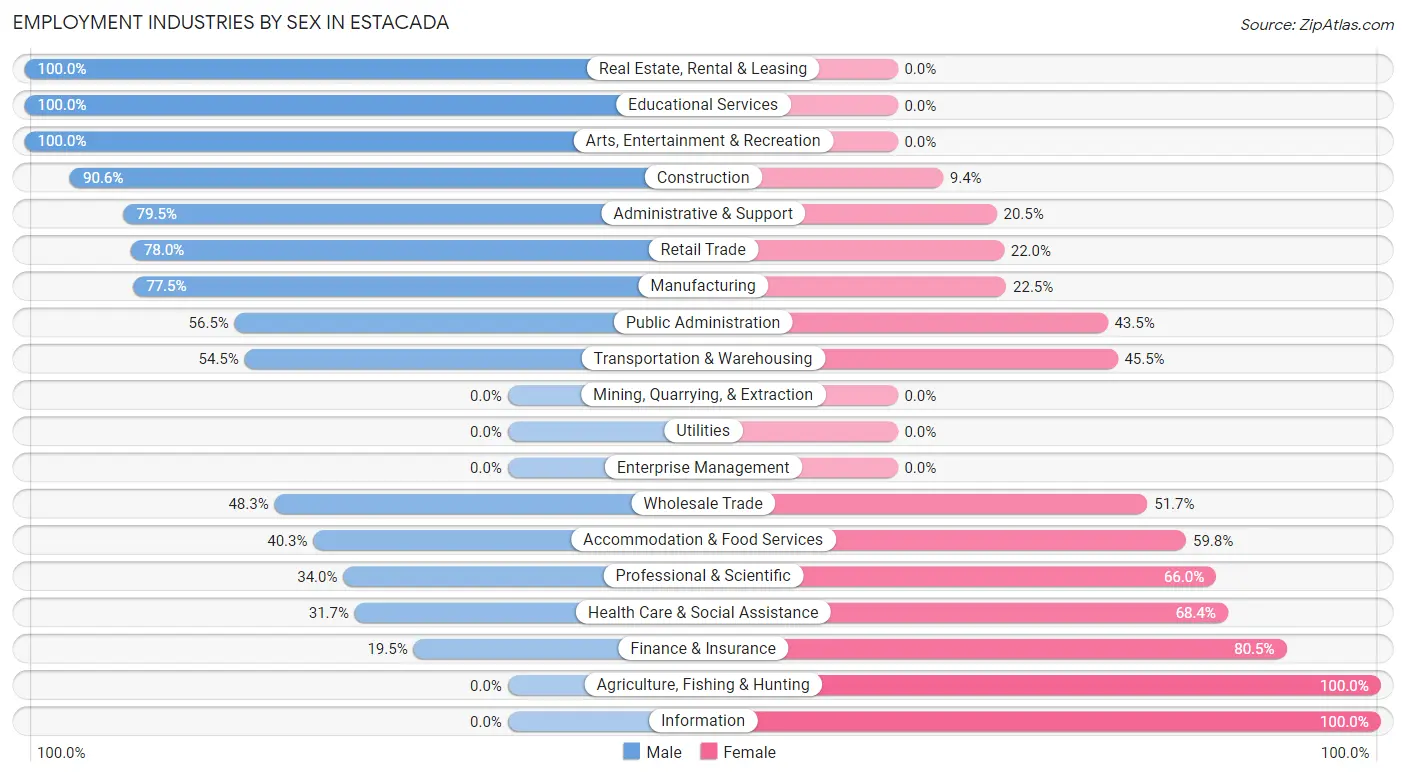
Employment Industries by Sex in Estacada
The Estacada industries that see more men than women are Real Estate, Rental & Leasing (100.0%), Educational Services (100.0%), and Arts, Entertainment & Recreation (100.0%), whereas the industries that tend to have a higher number of women are Agriculture, Fishing & Hunting (100.0%), Information (100.0%), and Finance & Insurance (80.5%).
| Industry | Male | Female |
| Agriculture, Fishing & Hunting | 0 (0.0%) | 17 (100.0%) |
| Mining, Quarrying, & Extraction | 0 (0.0%) | 0 (0.0%) |
| Construction | 231 (90.6%) | 24 (9.4%) |
| Manufacturing | 427 (77.5%) | 124 (22.5%) |
| Wholesale Trade | 14 (48.3%) | 15 (51.7%) |
| Retail Trade | 131 (78.0%) | 37 (22.0%) |
| Transportation & Warehousing | 55 (54.5%) | 46 (45.5%) |
| Utilities | 0 (0.0%) | 0 (0.0%) |
| Information | 0 (0.0%) | 66 (100.0%) |
| Finance & Insurance | 16 (19.5%) | 66 (80.5%) |
| Real Estate, Rental & Leasing | 38 (100.0%) | 0 (0.0%) |
| Professional & Scientific | 16 (34.0%) | 31 (66.0%) |
| Enterprise Management | 0 (0.0%) | 0 (0.0%) |
| Administrative & Support | 62 (79.5%) | 16 (20.5%) |
| Educational Services | 2 (100.0%) | 0 (0.0%) |
| Health Care & Social Assistance | 75 (31.7%) | 162 (68.3%) |
| Arts, Entertainment & Recreation | 21 (100.0%) | 0 (0.0%) |
| Accommodation & Food Services | 64 (40.3%) | 95 (59.8%) |
| Public Administration | 52 (56.5%) | 40 (43.5%) |
| Total | 1,222 (61.6%) | 763 (38.4%) |
Education in Estacada
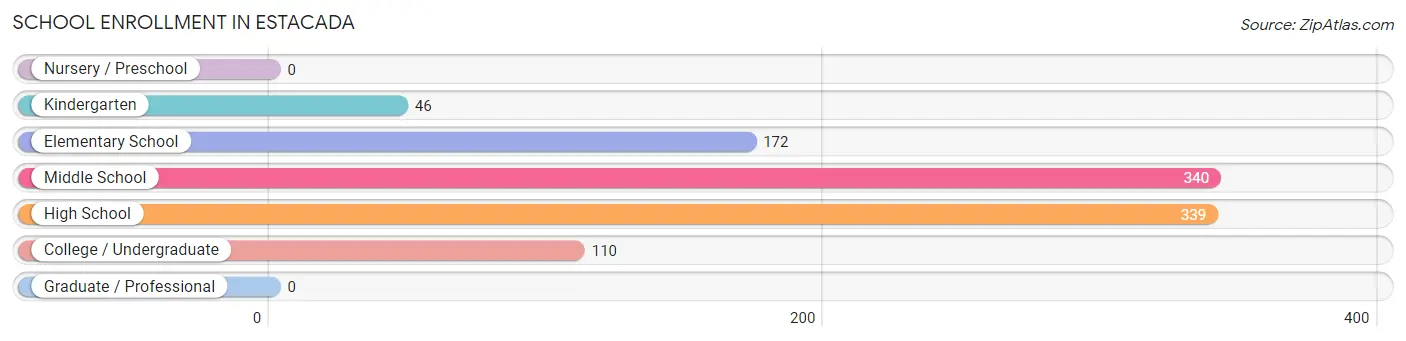
School Enrollment in Estacada
The most common levels of schooling among the 1,007 students in Estacada are middle school (340 | 33.8%), high school (339 | 33.7%), and elementary school (172 | 17.1%).
| School Level | # Students | % Students |
| Nursery / Preschool | 0 | 0.0% |
| Kindergarten | 46 | 4.6% |
| Elementary School | 172 | 17.1% |
| Middle School | 340 | 33.8% |
| High School | 339 | 33.7% |
| College / Undergraduate | 110 | 10.9% |
| Graduate / Professional | 0 | 0.0% |
| Total | 1,007 | 100.0% |
School Enrollment by Age by Funding Source in Estacada
Out of a total of 1,007 students who are enrolled in schools in Estacada, 145 (14.4%) attend a private institution, while the remaining 862 (85.6%) are enrolled in public schools. The age group of 35 years and over has the highest likelihood of being enrolled in private schools, with 16 (33.3% in the age bracket) enrolled. Conversely, the age group of 18 to 19 year olds has the lowest likelihood of being enrolled in a private school, with 44 (100.0% in the age bracket) attending a public institution.
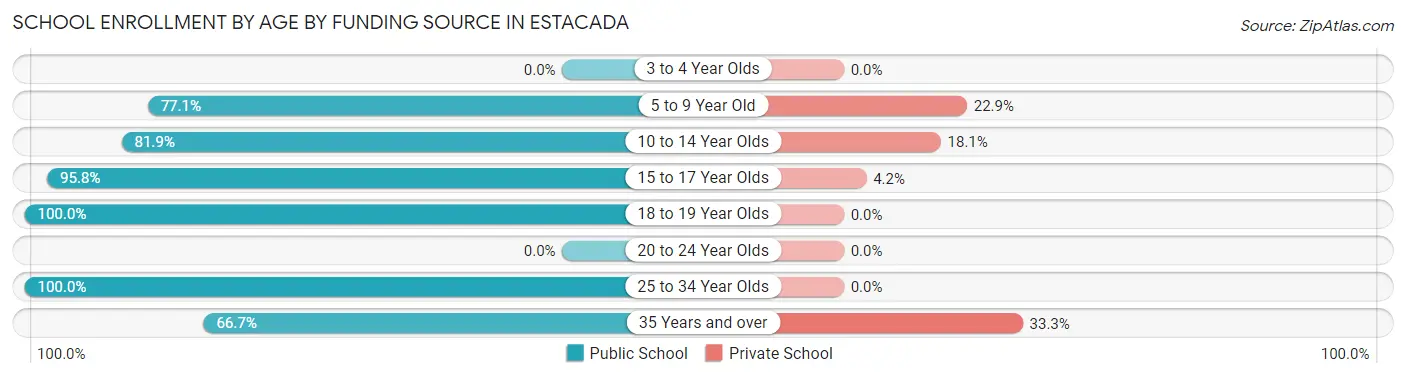
| Age Bracket | Public School | Private School |
| 3 to 4 Year Olds | 0 (0.0%) | 0 (0.0%) |
| 5 to 9 Year Old | 168 (77.1%) | 50 (22.9%) |
| 10 to 14 Year Olds | 304 (81.9%) | 67 (18.1%) |
| 15 to 17 Year Olds | 274 (95.8%) | 12 (4.2%) |
| 18 to 19 Year Olds | 44 (100.0%) | 0 (0.0%) |
| 20 to 24 Year Olds | 0 (0.0%) | 0 (0.0%) |
| 25 to 34 Year Olds | 40 (100.0%) | 0 (0.0%) |
| 35 Years and over | 32 (66.7%) | 16 (33.3%) |
| Total | 862 (85.6%) | 145 (14.4%) |
Educational Attainment by Field of Study in Estacada
Psychology (93 | 17.9%), education (71 | 13.7%), liberal arts & history (69 | 13.3%), arts & humanities (67 | 12.9%), and social sciences (57 | 11.0%) are the most common fields of study among 518 individuals in Estacada who have obtained a bachelor's degree or higher.
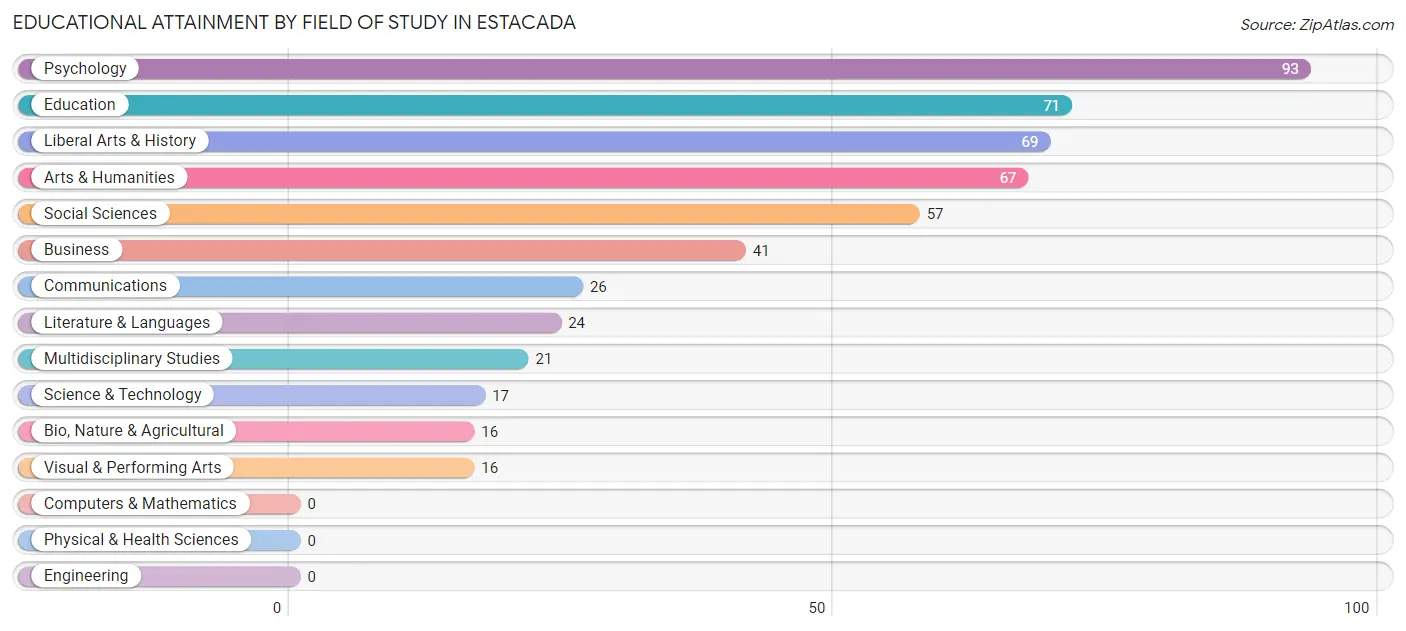
| Field of Study | # Graduates | % Graduates |
| Computers & Mathematics | 0 | 0.0% |
| Bio, Nature & Agricultural | 16 | 3.1% |
| Physical & Health Sciences | 0 | 0.0% |
| Psychology | 93 | 17.9% |
| Social Sciences | 57 | 11.0% |
| Engineering | 0 | 0.0% |
| Multidisciplinary Studies | 21 | 4.1% |
| Science & Technology | 17 | 3.3% |
| Business | 41 | 7.9% |
| Education | 71 | 13.7% |
| Literature & Languages | 24 | 4.6% |
| Liberal Arts & History | 69 | 13.3% |
| Visual & Performing Arts | 16 | 3.1% |
| Communications | 26 | 5.0% |
| Arts & Humanities | 67 | 12.9% |
| Total | 518 | 100.0% |
Transportation & Commute in Estacada
Vehicle Availability by Sex in Estacada
The most prevalent vehicle ownership categories in Estacada are males with 3 vehicles (433, accounting for 36.8%) and females with 3 vehicles (235, making up 59.4%).
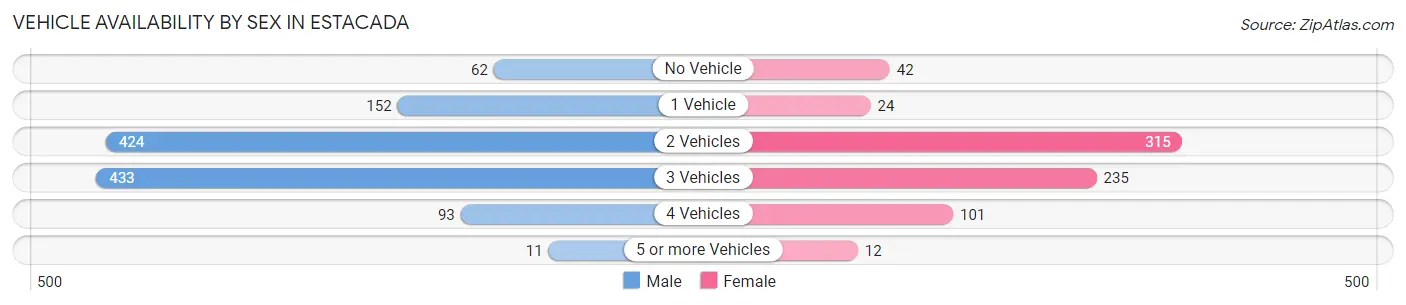
| Vehicles Available | Male | Female |
| No Vehicle | 62 (5.3%) | 42 (5.8%) |
| 1 Vehicle | 152 (12.9%) | 24 (3.3%) |
| 2 Vehicles | 424 (36.1%) | 315 (43.2%) |
| 3 Vehicles | 433 (36.8%) | 235 (32.2%) |
| 4 Vehicles | 93 (7.9%) | 101 (13.9%) |
| 5 or more Vehicles | 11 (0.9%) | 12 (1.7%) |
| Total | 1,175 (100.0%) | 729 (100.0%) |
Commute Time in Estacada
The most frequently occuring commute durations in Estacada are 30 to 34 minutes (502 commuters, 28.8%), 10 to 14 minutes (216 commuters, 12.4%), and 40 to 44 minutes (199 commuters, 11.4%).
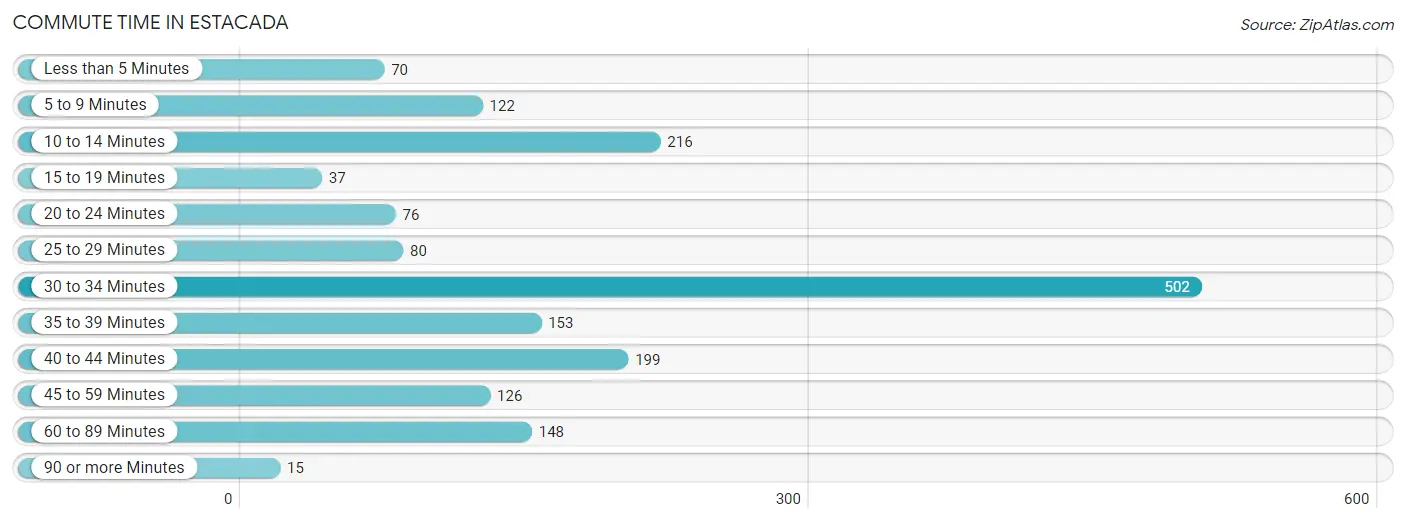
| Commute Time | # Commuters | % Commuters |
| Less than 5 Minutes | 70 | 4.0% |
| 5 to 9 Minutes | 122 | 7.0% |
| 10 to 14 Minutes | 216 | 12.4% |
| 15 to 19 Minutes | 37 | 2.1% |
| 20 to 24 Minutes | 76 | 4.4% |
| 25 to 29 Minutes | 80 | 4.6% |
| 30 to 34 Minutes | 502 | 28.8% |
| 35 to 39 Minutes | 153 | 8.8% |
| 40 to 44 Minutes | 199 | 11.4% |
| 45 to 59 Minutes | 126 | 7.2% |
| 60 to 89 Minutes | 148 | 8.5% |
| 90 or more Minutes | 15 | 0.9% |
Commute Time by Sex in Estacada
The most common commute times in Estacada are 30 to 34 minutes (355 commuters, 31.2%) for males and 10 to 14 minutes (147 commuters, 24.3%) for females.
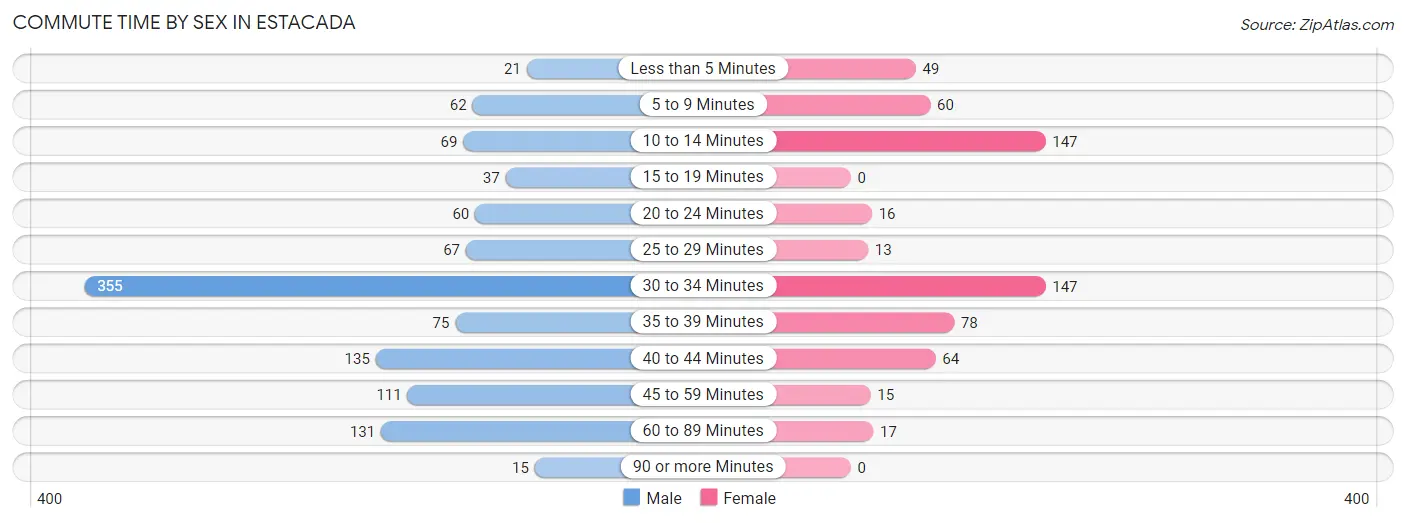
| Commute Time | Male | Female |
| Less than 5 Minutes | 21 (1.8%) | 49 (8.1%) |
| 5 to 9 Minutes | 62 (5.4%) | 60 (9.9%) |
| 10 to 14 Minutes | 69 (6.1%) | 147 (24.3%) |
| 15 to 19 Minutes | 37 (3.3%) | 0 (0.0%) |
| 20 to 24 Minutes | 60 (5.3%) | 16 (2.6%) |
| 25 to 29 Minutes | 67 (5.9%) | 13 (2.1%) |
| 30 to 34 Minutes | 355 (31.2%) | 147 (24.3%) |
| 35 to 39 Minutes | 75 (6.6%) | 78 (12.9%) |
| 40 to 44 Minutes | 135 (11.9%) | 64 (10.6%) |
| 45 to 59 Minutes | 111 (9.8%) | 15 (2.5%) |
| 60 to 89 Minutes | 131 (11.5%) | 17 (2.8%) |
| 90 or more Minutes | 15 (1.3%) | 0 (0.0%) |
Time of Departure to Work by Sex in Estacada
The most frequent times of departure to work in Estacada are 4:00 PM to 11:59 PM (189, 16.6%) for males and 7:30 AM to 7:59 AM (138, 22.8%) for females.
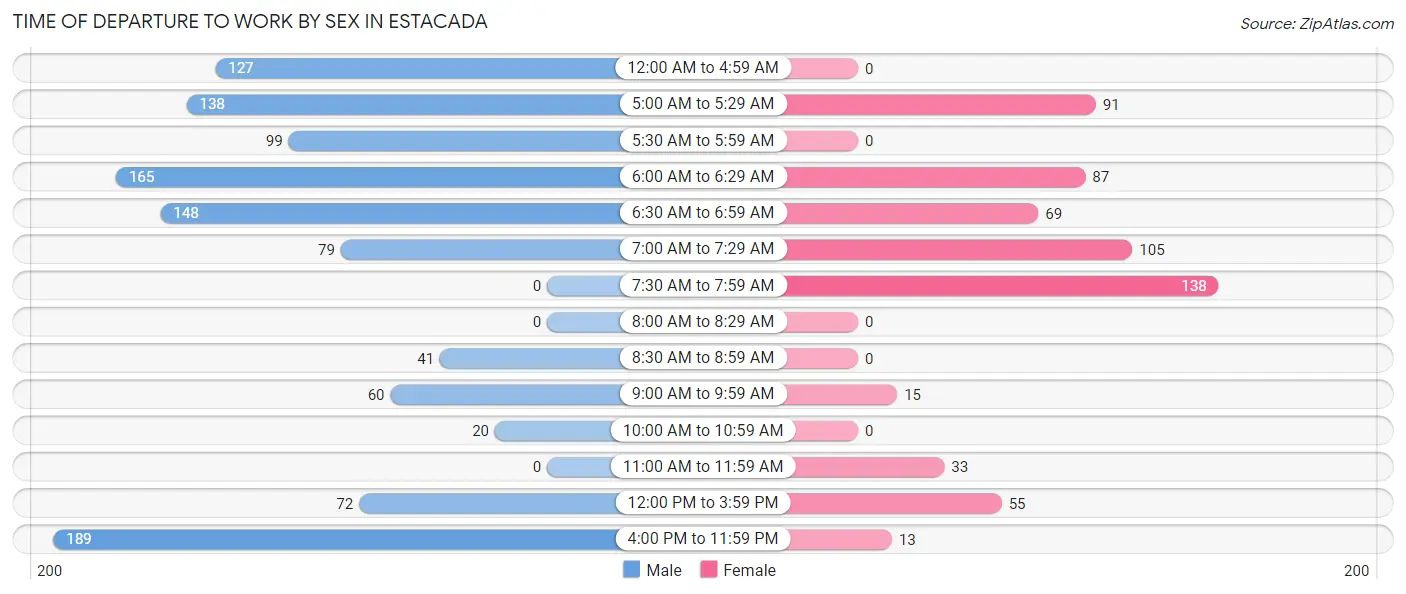
| Time of Departure | Male | Female |
| 12:00 AM to 4:59 AM | 127 (11.2%) | 0 (0.0%) |
| 5:00 AM to 5:29 AM | 138 (12.1%) | 91 (15.0%) |
| 5:30 AM to 5:59 AM | 99 (8.7%) | 0 (0.0%) |
| 6:00 AM to 6:29 AM | 165 (14.5%) | 87 (14.4%) |
| 6:30 AM to 6:59 AM | 148 (13.0%) | 69 (11.4%) |
| 7:00 AM to 7:29 AM | 79 (6.9%) | 105 (17.3%) |
| 7:30 AM to 7:59 AM | 0 (0.0%) | 138 (22.8%) |
| 8:00 AM to 8:29 AM | 0 (0.0%) | 0 (0.0%) |
| 8:30 AM to 8:59 AM | 41 (3.6%) | 0 (0.0%) |
| 9:00 AM to 9:59 AM | 60 (5.3%) | 15 (2.5%) |
| 10:00 AM to 10:59 AM | 20 (1.8%) | 0 (0.0%) |
| 11:00 AM to 11:59 AM | 0 (0.0%) | 33 (5.4%) |
| 12:00 PM to 3:59 PM | 72 (6.3%) | 55 (9.1%) |
| 4:00 PM to 11:59 PM | 189 (16.6%) | 13 (2.1%) |
| Total | 1,138 (100.0%) | 606 (100.0%) |
Housing Occupancy in Estacada
Occupancy by Ownership in Estacada
Of the total 1,516 dwellings in Estacada, owner-occupied units account for 1,320 (87.1%), while renter-occupied units make up 196 (12.9%).
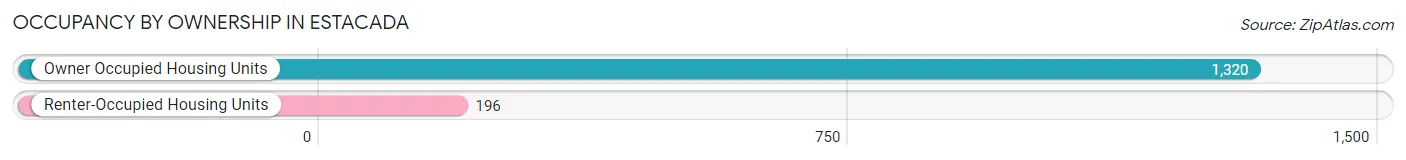
| Occupancy | # Housing Units | % Housing Units |
| Owner Occupied Housing Units | 1,320 | 87.1% |
| Renter-Occupied Housing Units | 196 | 12.9% |
| Total Occupied Housing Units | 1,516 | 100.0% |
Occupancy by Household Size in Estacada
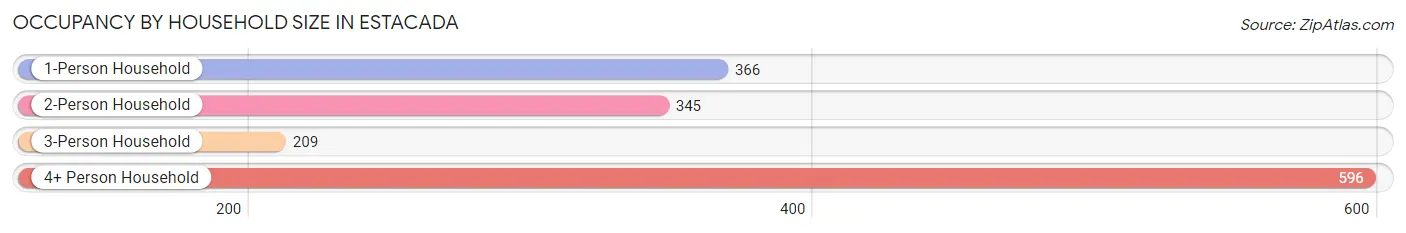
| Household Size | # Housing Units | % Housing Units |
| 1-Person Household | 366 | 24.1% |
| 2-Person Household | 345 | 22.8% |
| 3-Person Household | 209 | 13.8% |
| 4+ Person Household | 596 | 39.3% |
| Total Housing Units | 1,516 | 100.0% |
Occupancy by Ownership by Household Size in Estacada
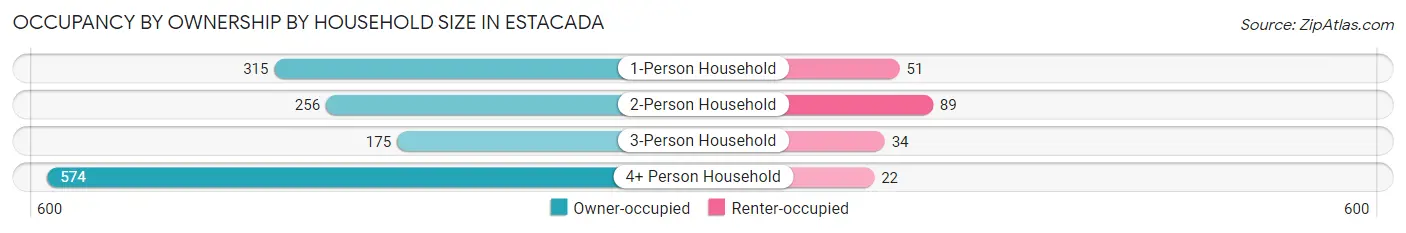
| Household Size | Owner-occupied | Renter-occupied |
| 1-Person Household | 315 (86.1%) | 51 (13.9%) |
| 2-Person Household | 256 (74.2%) | 89 (25.8%) |
| 3-Person Household | 175 (83.7%) | 34 (16.3%) |
| 4+ Person Household | 574 (96.3%) | 22 (3.7%) |
| Total Housing Units | 1,320 (87.1%) | 196 (12.9%) |
Occupancy by Educational Attainment in Estacada
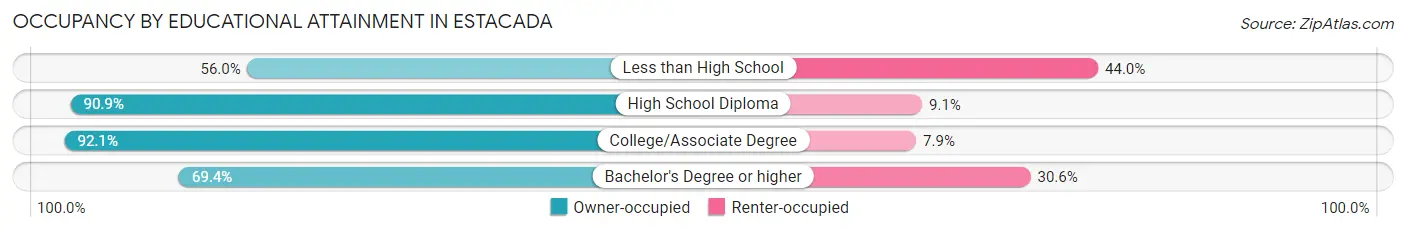
| Household Size | Owner-occupied | Renter-occupied |
| Less than High School | 42 (56.0%) | 33 (44.0%) |
| High School Diploma | 559 (90.9%) | 56 (9.1%) |
| College/Associate Degree | 592 (92.1%) | 51 (7.9%) |
| Bachelor's Degree or higher | 127 (69.4%) | 56 (30.6%) |
Occupancy by Age of Householder in Estacada
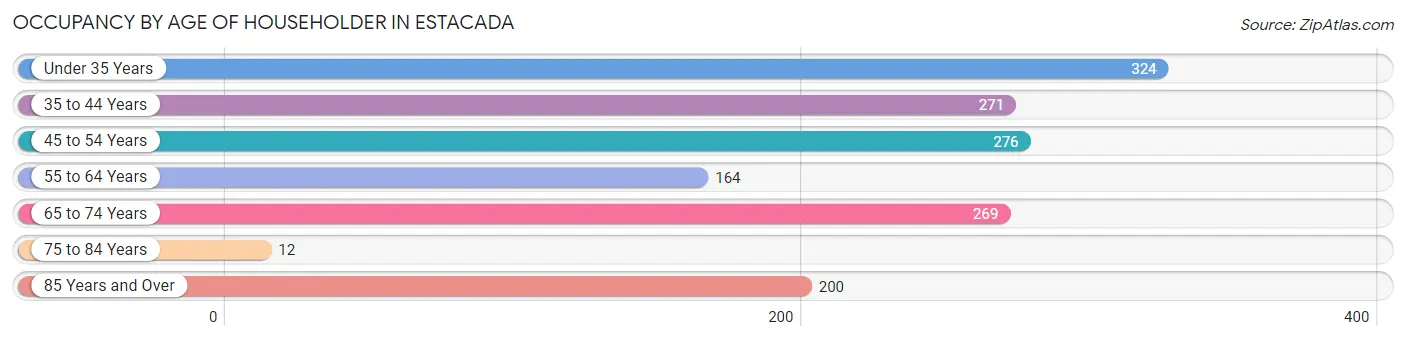
| Age Bracket | # Households | % Households |
| Under 35 Years | 324 | 21.4% |
| 35 to 44 Years | 271 | 17.9% |
| 45 to 54 Years | 276 | 18.2% |
| 55 to 64 Years | 164 | 10.8% |
| 65 to 74 Years | 269 | 17.7% |
| 75 to 84 Years | 12 | 0.8% |
| 85 Years and Over | 200 | 13.2% |
| Total | 1,516 | 100.0% |
Housing Finances in Estacada
Median Income by Occupancy in Estacada
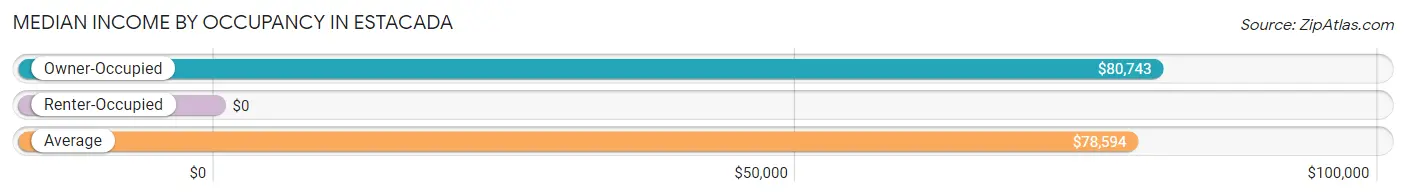
| Occupancy Type | # Households | Median Income |
| Owner-Occupied | 1,320 (87.1%) | $80,743 |
| Renter-Occupied | 196 (12.9%) | $0 |
| Average | 1,516 (100.0%) | $78,594 |
Occupancy by Householder Income Bracket in Estacada
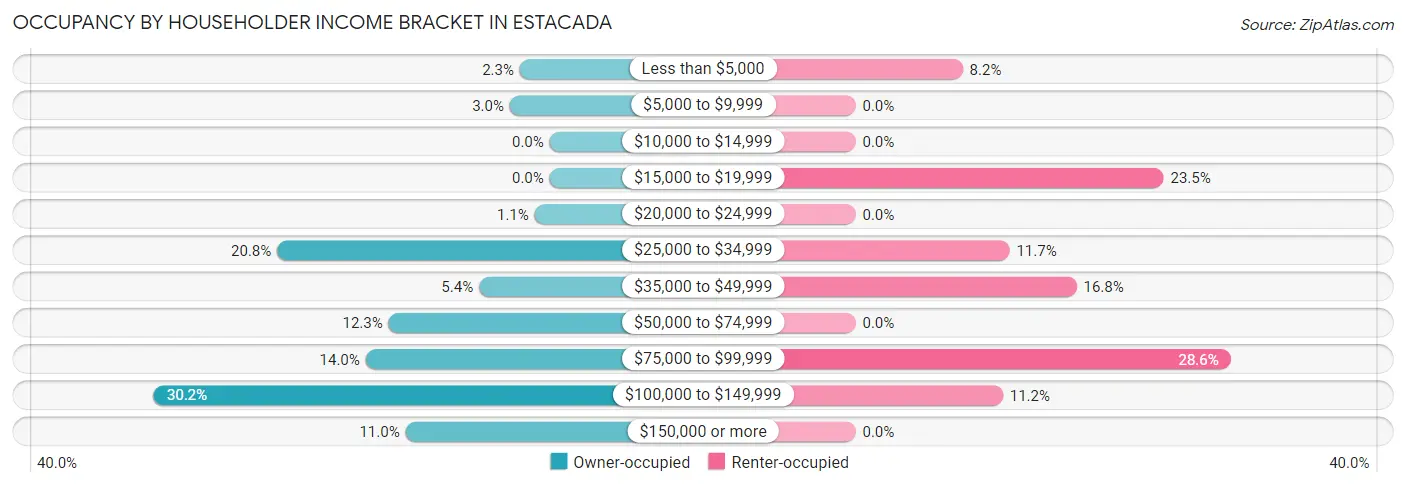
| Income Bracket | Owner-occupied | Renter-occupied |
| Less than $5,000 | 30 (2.3%) | 16 (8.2%) |
| $5,000 to $9,999 | 40 (3.0%) | 0 (0.0%) |
| $10,000 to $14,999 | 0 (0.0%) | 0 (0.0%) |
| $15,000 to $19,999 | 0 (0.0%) | 46 (23.5%) |
| $20,000 to $24,999 | 15 (1.1%) | 0 (0.0%) |
| $25,000 to $34,999 | 274 (20.8%) | 23 (11.7%) |
| $35,000 to $49,999 | 71 (5.4%) | 33 (16.8%) |
| $50,000 to $74,999 | 162 (12.3%) | 0 (0.0%) |
| $75,000 to $99,999 | 185 (14.0%) | 56 (28.6%) |
| $100,000 to $149,999 | 398 (30.1%) | 22 (11.2%) |
| $150,000 or more | 145 (11.0%) | 0 (0.0%) |
| Total | 1,320 (100.0%) | 196 (100.0%) |
Monthly Housing Cost Tiers in Estacada
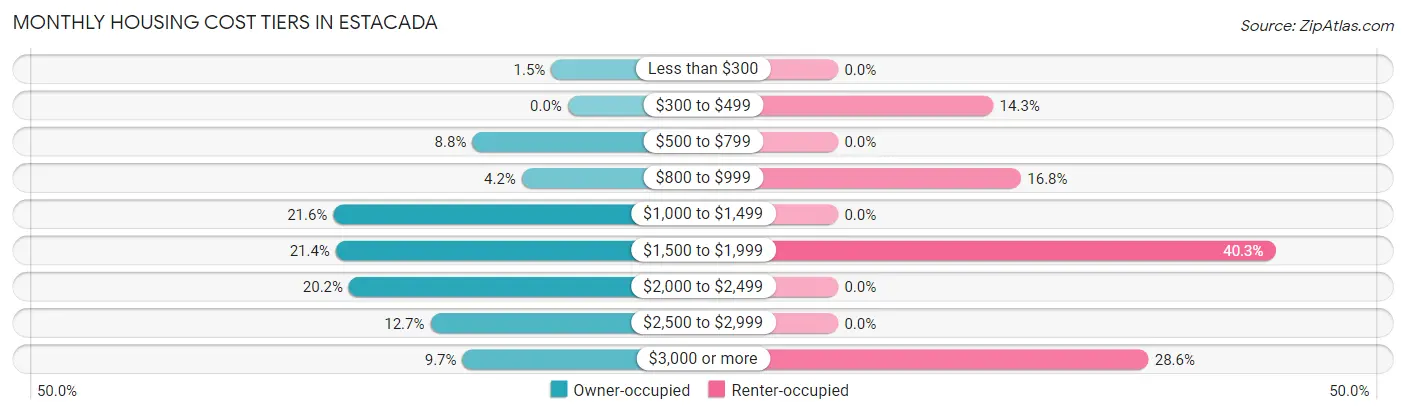
| Monthly Cost | Owner-occupied | Renter-occupied |
| Less than $300 | 20 (1.5%) | 0 (0.0%) |
| $300 to $499 | 0 (0.0%) | 28 (14.3%) |
| $500 to $799 | 116 (8.8%) | 0 (0.0%) |
| $800 to $999 | 56 (4.2%) | 33 (16.8%) |
| $1,000 to $1,499 | 285 (21.6%) | 0 (0.0%) |
| $1,500 to $1,999 | 282 (21.4%) | 79 (40.3%) |
| $2,000 to $2,499 | 266 (20.2%) | 0 (0.0%) |
| $2,500 to $2,999 | 167 (12.7%) | 0 (0.0%) |
| $3,000 or more | 128 (9.7%) | 56 (28.6%) |
| Total | 1,320 (100.0%) | 196 (100.0%) |
Physical Housing Characteristics in Estacada
Housing Structures in Estacada
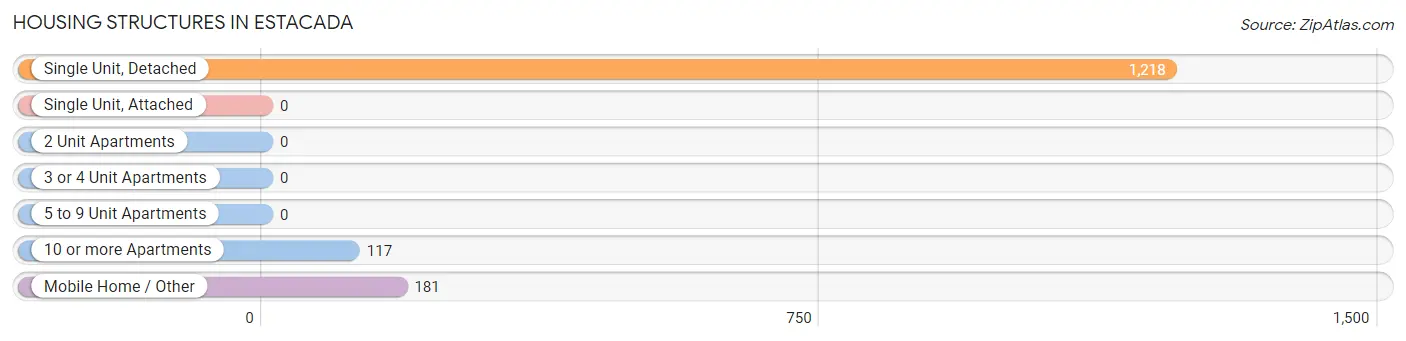
| Structure Type | # Housing Units | % Housing Units |
| Single Unit, Detached | 1,218 | 80.3% |
| Single Unit, Attached | 0 | 0.0% |
| 2 Unit Apartments | 0 | 0.0% |
| 3 or 4 Unit Apartments | 0 | 0.0% |
| 5 to 9 Unit Apartments | 0 | 0.0% |
| 10 or more Apartments | 117 | 7.7% |
| Mobile Home / Other | 181 | 11.9% |
| Total | 1,516 | 100.0% |
Housing Structures by Occupancy in Estacada
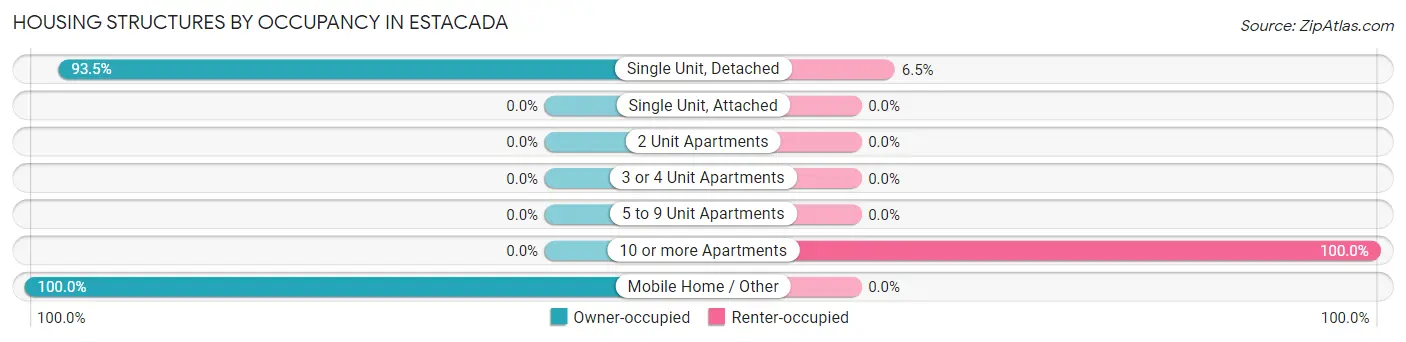
| Structure Type | Owner-occupied | Renter-occupied |
| Single Unit, Detached | 1,139 (93.5%) | 79 (6.5%) |
| Single Unit, Attached | 0 (0.0%) | 0 (0.0%) |
| 2 Unit Apartments | 0 (0.0%) | 0 (0.0%) |
| 3 or 4 Unit Apartments | 0 (0.0%) | 0 (0.0%) |
| 5 to 9 Unit Apartments | 0 (0.0%) | 0 (0.0%) |
| 10 or more Apartments | 0 (0.0%) | 117 (100.0%) |
| Mobile Home / Other | 181 (100.0%) | 0 (0.0%) |
| Total | 1,320 (87.1%) | 196 (12.9%) |
Housing Structures by Number of Rooms in Estacada
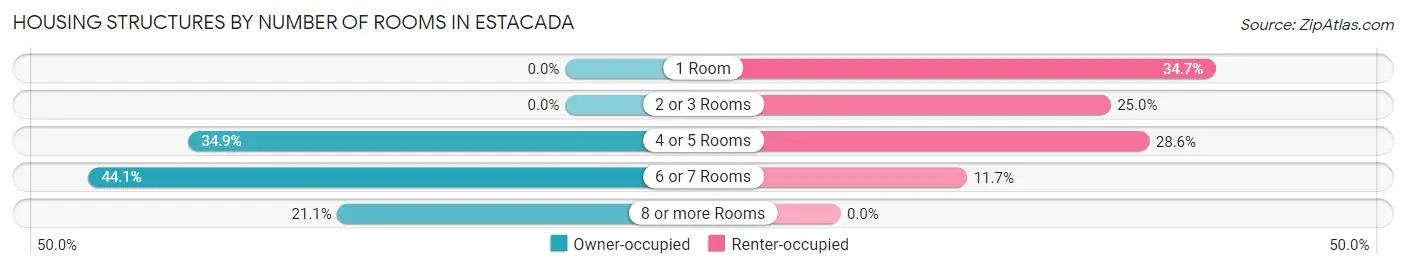
| Number of Rooms | Owner-occupied | Renter-occupied |
| 1 Room | 0 (0.0%) | 68 (34.7%) |
| 2 or 3 Rooms | 0 (0.0%) | 49 (25.0%) |
| 4 or 5 Rooms | 460 (34.8%) | 56 (28.6%) |
| 6 or 7 Rooms | 582 (44.1%) | 23 (11.7%) |
| 8 or more Rooms | 278 (21.1%) | 0 (0.0%) |
| Total | 1,320 (100.0%) | 196 (100.0%) |
Housing Structure by Heating Type in Estacada
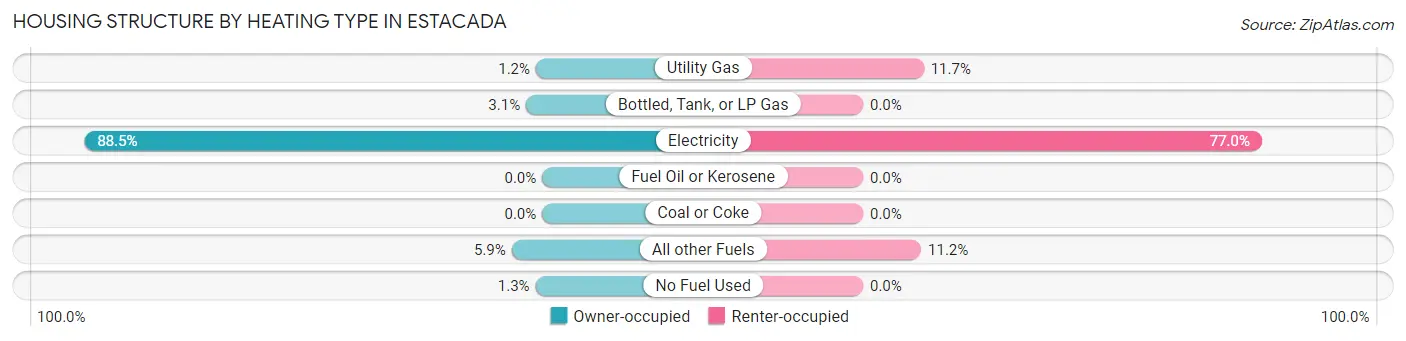
| Heating Type | Owner-occupied | Renter-occupied |
| Utility Gas | 16 (1.2%) | 23 (11.7%) |
| Bottled, Tank, or LP Gas | 41 (3.1%) | 0 (0.0%) |
| Electricity | 1,168 (88.5%) | 151 (77.0%) |
| Fuel Oil or Kerosene | 0 (0.0%) | 0 (0.0%) |
| Coal or Coke | 0 (0.0%) | 0 (0.0%) |
| All other Fuels | 78 (5.9%) | 22 (11.2%) |
| No Fuel Used | 17 (1.3%) | 0 (0.0%) |
| Total | 1,320 (100.0%) | 196 (100.0%) |
Household Vehicle Usage in Estacada
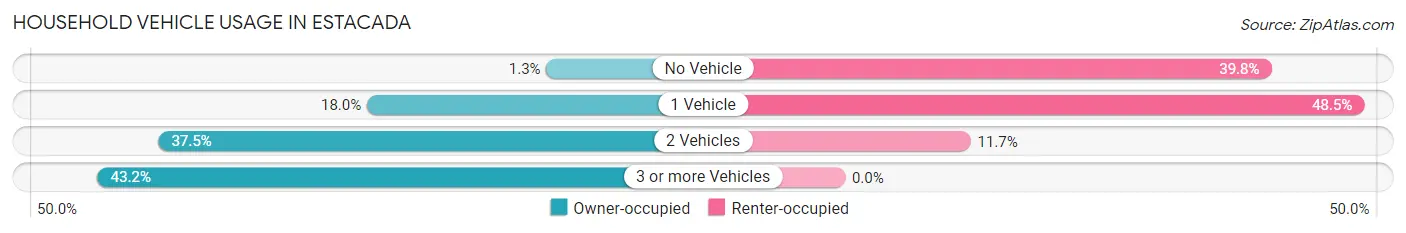
| Vehicles per Household | Owner-occupied | Renter-occupied |
| No Vehicle | 17 (1.3%) | 78 (39.8%) |
| 1 Vehicle | 238 (18.0%) | 95 (48.5%) |
| 2 Vehicles | 495 (37.5%) | 23 (11.7%) |
| 3 or more Vehicles | 570 (43.2%) | 0 (0.0%) |
| Total | 1,320 (100.0%) | 196 (100.0%) |
Real Estate & Mortgages in Estacada
Real Estate and Mortgage Overview in Estacada
| Characteristic | Without Mortgage | With Mortgage |
| Housing Units | 175 | 1,145 |
| Median Property Value | $381,100 | $433,300 |
| Median Household Income | $80,304 | $125 |
| Monthly Housing Costs | $648 | $128 |
| Real Estate Taxes | $3,306 | $0 |
Property Value by Mortgage Status in Estacada
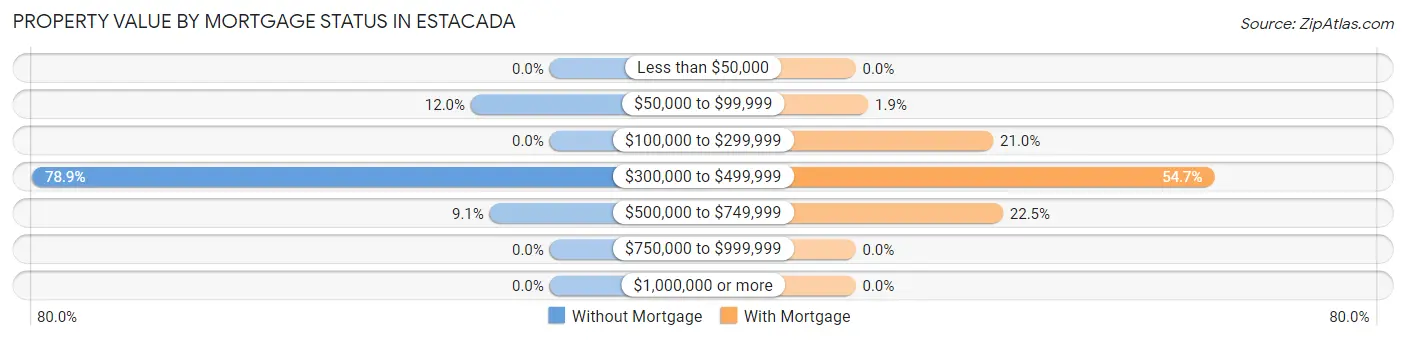
| Property Value | Without Mortgage | With Mortgage |
| Less than $50,000 | 0 (0.0%) | 0 (0.0%) |
| $50,000 to $99,999 | 21 (12.0%) | 22 (1.9%) |
| $100,000 to $299,999 | 0 (0.0%) | 240 (21.0%) |
| $300,000 to $499,999 | 138 (78.9%) | 626 (54.7%) |
| $500,000 to $749,999 | 16 (9.1%) | 257 (22.5%) |
| $750,000 to $999,999 | 0 (0.0%) | 0 (0.0%) |
| $1,000,000 or more | 0 (0.0%) | 0 (0.0%) |
| Total | 175 (100.0%) | 1,145 (100.0%) |
Household Income by Mortgage Status in Estacada
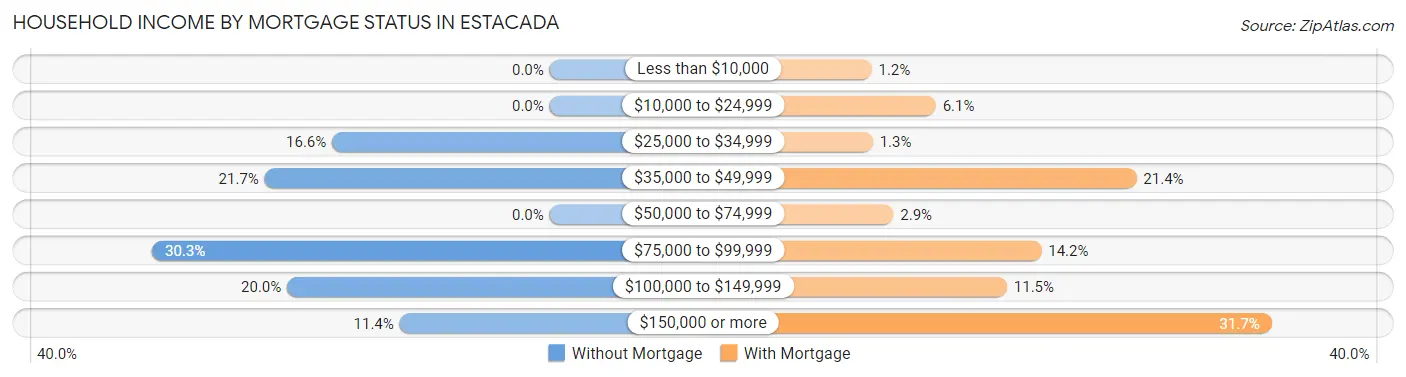
| Household Income | Without Mortgage | With Mortgage |
| Less than $10,000 | 0 (0.0%) | 14 (1.2%) |
| $10,000 to $24,999 | 0 (0.0%) | 70 (6.1%) |
| $25,000 to $34,999 | 29 (16.6%) | 15 (1.3%) |
| $35,000 to $49,999 | 38 (21.7%) | 245 (21.4%) |
| $50,000 to $74,999 | 0 (0.0%) | 33 (2.9%) |
| $75,000 to $99,999 | 53 (30.3%) | 162 (14.1%) |
| $100,000 to $149,999 | 35 (20.0%) | 132 (11.5%) |
| $150,000 or more | 20 (11.4%) | 363 (31.7%) |
| Total | 175 (100.0%) | 1,145 (100.0%) |
Property Value to Household Income Ratio in Estacada
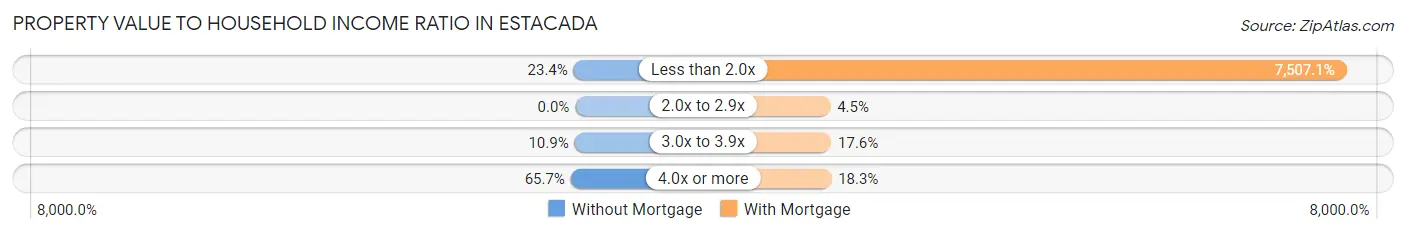
| Value-to-Income Ratio | Without Mortgage | With Mortgage |
| Less than 2.0x | 41 (23.4%) | 85,956 (7,507.1%) |
| 2.0x to 2.9x | 0 (0.0%) | 51 (4.4%) |
| 3.0x to 3.9x | 19 (10.9%) | 201 (17.5%) |
| 4.0x or more | 115 (65.7%) | 210 (18.3%) |
| Total | 175 (100.0%) | 1,145 (100.0%) |
Real Estate Taxes by Mortgage Status in Estacada
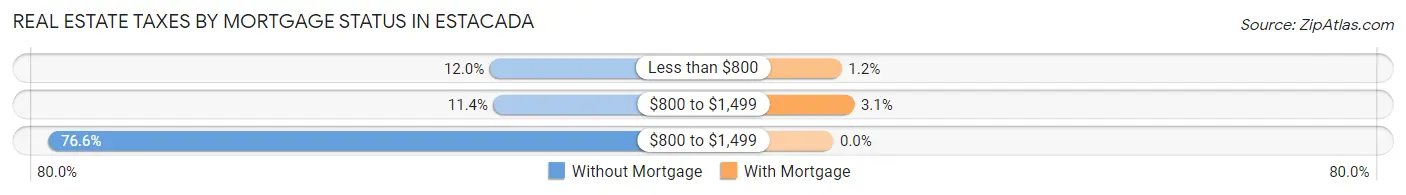
| Property Taxes | Without Mortgage | With Mortgage |
| Less than $800 | 21 (12.0%) | 14 (1.2%) |
| $800 to $1,499 | 20 (11.4%) | 35 (3.1%) |
| $800 to $1,499 | 134 (76.6%) | 0 (0.0%) |
| Total | 175 (100.0%) | 1,145 (100.0%) |
Health & Disability in Estacada
Health Insurance Coverage by Age in Estacada
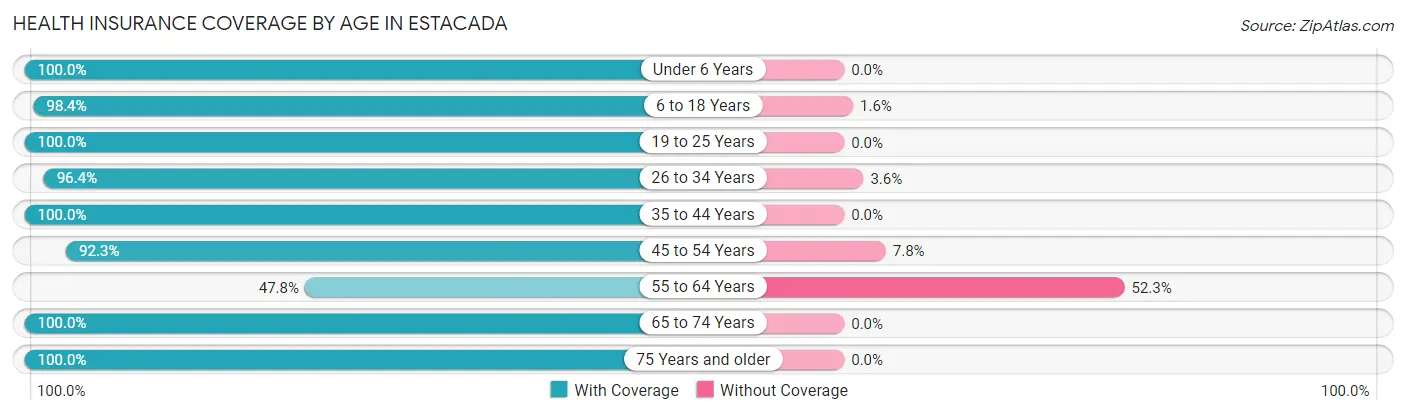
| Age Bracket | With Coverage | Without Coverage |
| Under 6 Years | 351 (100.0%) | 0 (0.0%) |
| 6 to 18 Years | 1,081 (98.4%) | 18 (1.6%) |
| 19 to 25 Years | 216 (100.0%) | 0 (0.0%) |
| 26 to 34 Years | 619 (96.4%) | 23 (3.6%) |
| 35 to 44 Years | 518 (100.0%) | 0 (0.0%) |
| 45 to 54 Years | 583 (92.2%) | 49 (7.7%) |
| 55 to 64 Years | 202 (47.7%) | 221 (52.2%) |
| 65 to 74 Years | 386 (100.0%) | 0 (0.0%) |
| 75 Years and older | 323 (100.0%) | 0 (0.0%) |
| Total | 4,279 (93.2%) | 311 (6.8%) |
Health Insurance Coverage by Citizenship Status in Estacada
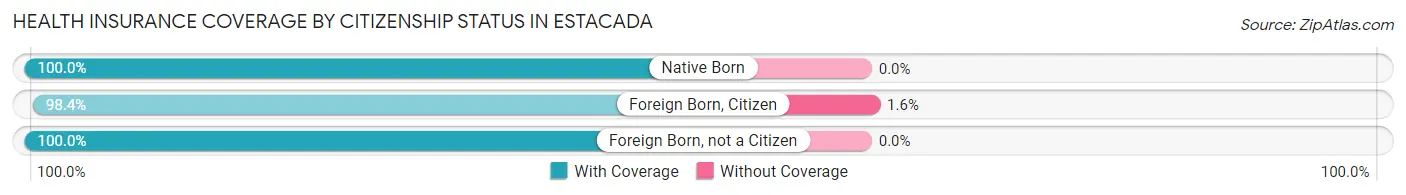
| Citizenship Status | With Coverage | Without Coverage |
| Native Born | 351 (100.0%) | 0 (0.0%) |
| Foreign Born, Citizen | 1,081 (98.4%) | 18 (1.6%) |
| Foreign Born, not a Citizen | 216 (100.0%) | 0 (0.0%) |
Health Insurance Coverage by Household Income in Estacada
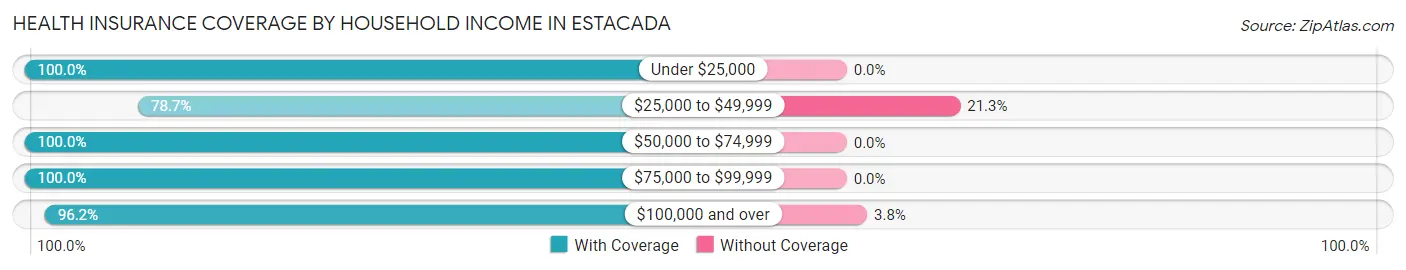
| Household Income | With Coverage | Without Coverage |
| Under $25,000 | 220 (100.0%) | 0 (0.0%) |
| $25,000 to $49,999 | 826 (78.7%) | 223 (21.3%) |
| $50,000 to $74,999 | 380 (100.0%) | 0 (0.0%) |
| $75,000 to $99,999 | 603 (100.0%) | 0 (0.0%) |
| $100,000 and over | 2,227 (96.2%) | 88 (3.8%) |
Public vs Private Health Insurance Coverage by Age in Estacada
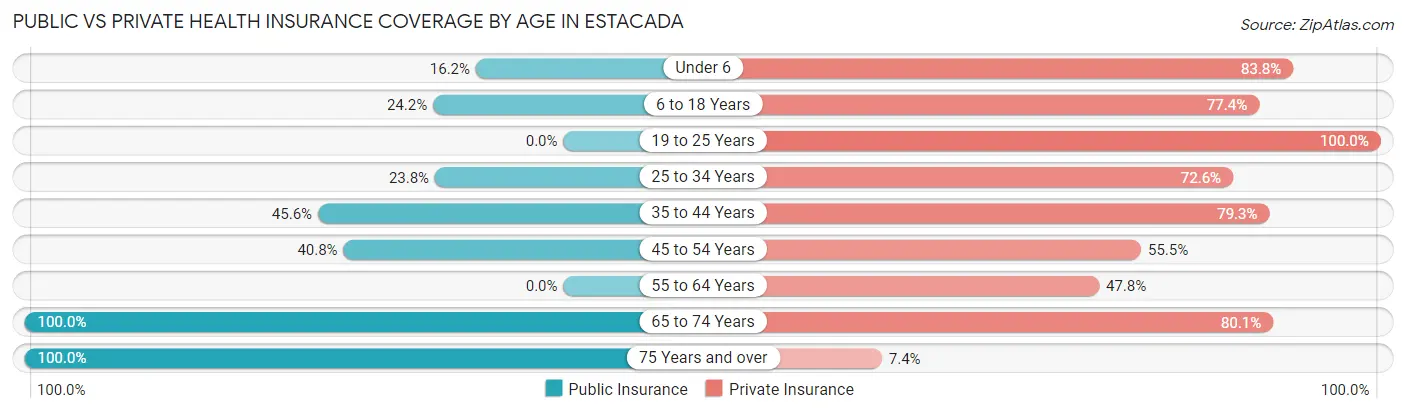
| Age Bracket | Public Insurance | Private Insurance |
| Under 6 | 57 (16.2%) | 294 (83.8%) |
| 6 to 18 Years | 266 (24.2%) | 851 (77.4%) |
| 19 to 25 Years | 0 (0.0%) | 216 (100.0%) |
| 25 to 34 Years | 153 (23.8%) | 466 (72.6%) |
| 35 to 44 Years | 236 (45.6%) | 411 (79.3%) |
| 45 to 54 Years | 258 (40.8%) | 351 (55.5%) |
| 55 to 64 Years | 0 (0.0%) | 202 (47.7%) |
| 65 to 74 Years | 386 (100.0%) | 309 (80.0%) |
| 75 Years and over | 323 (100.0%) | 24 (7.4%) |
| Total | 1,679 (36.6%) | 3,124 (68.1%) |
Disability Status by Sex by Age in Estacada
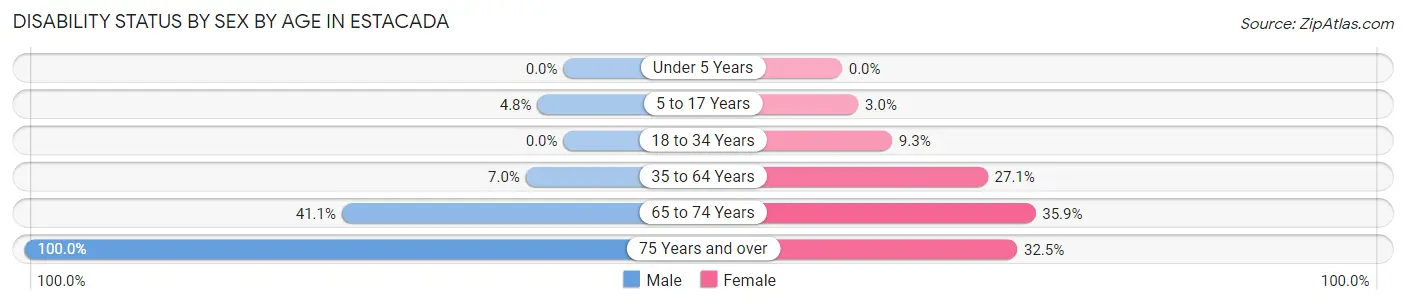
| Age Bracket | Male | Female |
| Under 5 Years | 0 (0.0%) | 0 (0.0%) |
| 5 to 17 Years | 16 (4.8%) | 18 (3.0%) |
| 18 to 34 Years | 0 (0.0%) | 37 (9.3%) |
| 35 to 64 Years | 61 (7.0%) | 190 (27.1%) |
| 65 to 74 Years | 58 (41.1%) | 88 (35.9%) |
| 75 Years and over | 74 (100.0%) | 81 (32.5%) |
Disability Class by Sex by Age in Estacada
Disability Class: Hearing Difficulty
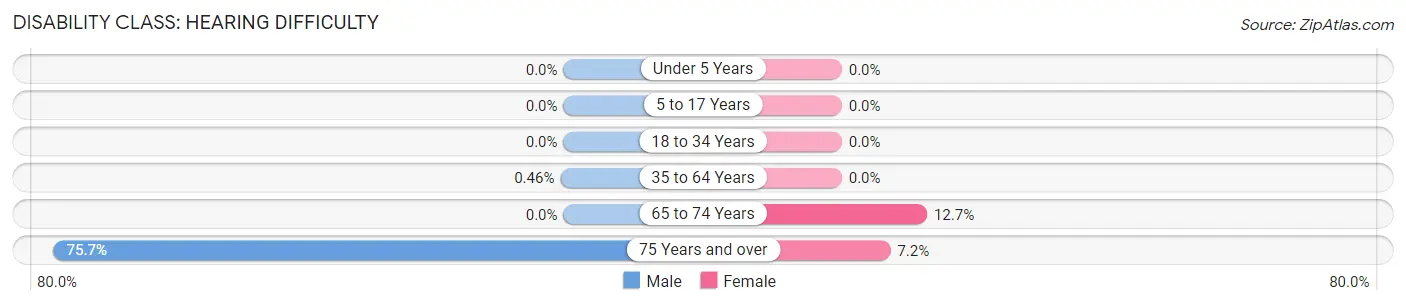
| Age Bracket | Male | Female |
| Under 5 Years | 0 (0.0%) | 0 (0.0%) |
| 5 to 17 Years | 0 (0.0%) | 0 (0.0%) |
| 18 to 34 Years | 0 (0.0%) | 0 (0.0%) |
| 35 to 64 Years | 4 (0.5%) | 0 (0.0%) |
| 65 to 74 Years | 0 (0.0%) | 31 (12.7%) |
| 75 Years and over | 56 (75.7%) | 18 (7.2%) |
Disability Class: Vision Difficulty
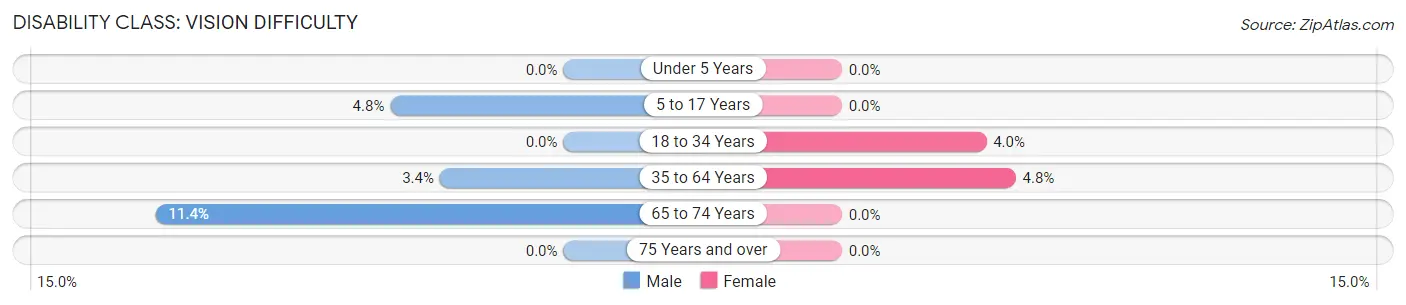
| Age Bracket | Male | Female |
| Under 5 Years | 0 (0.0%) | 0 (0.0%) |
| 5 to 17 Years | 16 (4.8%) | 0 (0.0%) |
| 18 to 34 Years | 0 (0.0%) | 16 (4.0%) |
| 35 to 64 Years | 30 (3.4%) | 34 (4.8%) |
| 65 to 74 Years | 16 (11.4%) | 0 (0.0%) |
| 75 Years and over | 0 (0.0%) | 0 (0.0%) |
Disability Class: Cognitive Difficulty
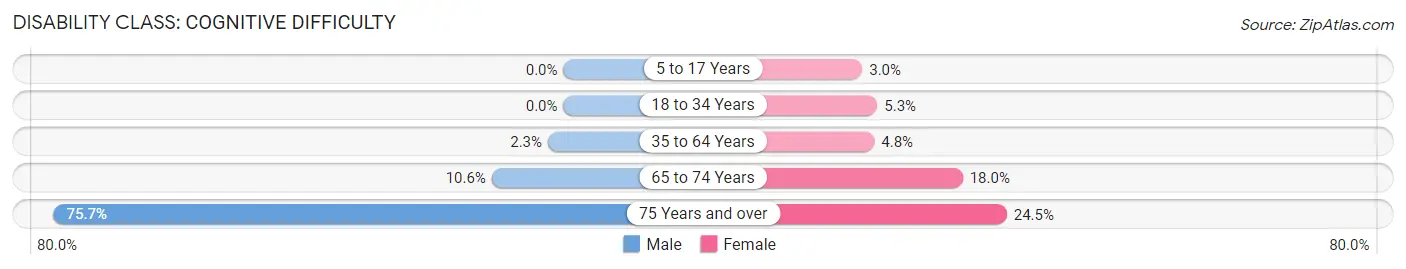
| Age Bracket | Male | Female |
| 5 to 17 Years | 0 (0.0%) | 18 (3.0%) |
| 18 to 34 Years | 0 (0.0%) | 21 (5.3%) |
| 35 to 64 Years | 20 (2.3%) | 34 (4.8%) |
| 65 to 74 Years | 15 (10.6%) | 44 (18.0%) |
| 75 Years and over | 56 (75.7%) | 61 (24.5%) |
Disability Class: Ambulatory Difficulty
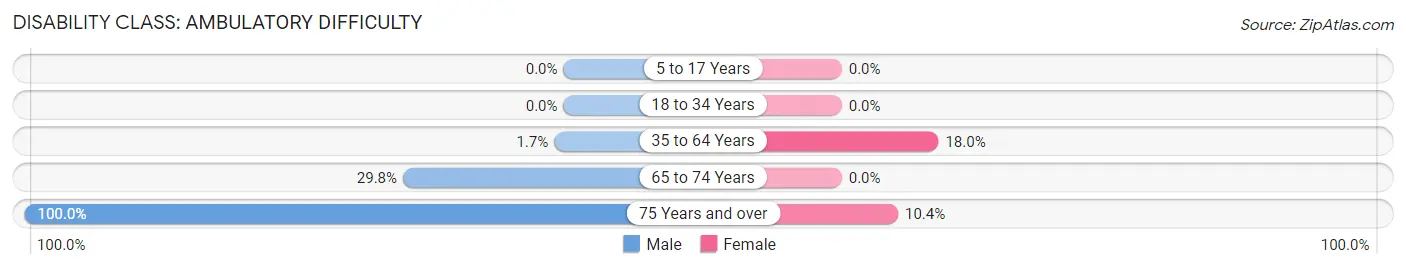
| Age Bracket | Male | Female |
| 5 to 17 Years | 0 (0.0%) | 0 (0.0%) |
| 18 to 34 Years | 0 (0.0%) | 0 (0.0%) |
| 35 to 64 Years | 15 (1.7%) | 126 (17.9%) |
| 65 to 74 Years | 42 (29.8%) | 0 (0.0%) |
| 75 Years and over | 74 (100.0%) | 26 (10.4%) |
Disability Class: Self-Care Difficulty
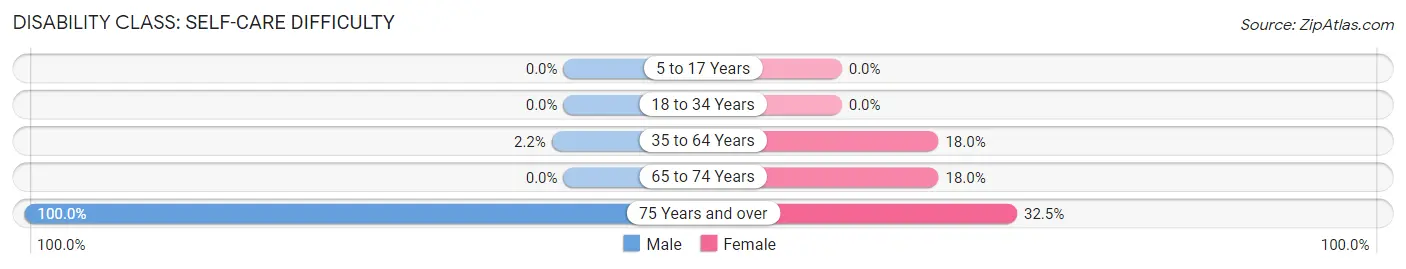
| Age Bracket | Male | Female |
| 5 to 17 Years | 0 (0.0%) | 0 (0.0%) |
| 18 to 34 Years | 0 (0.0%) | 0 (0.0%) |
| 35 to 64 Years | 19 (2.2%) | 126 (17.9%) |
| 65 to 74 Years | 0 (0.0%) | 44 (18.0%) |
| 75 Years and over | 74 (100.0%) | 81 (32.5%) |
Technology Access in Estacada
Computing Device Access in Estacada
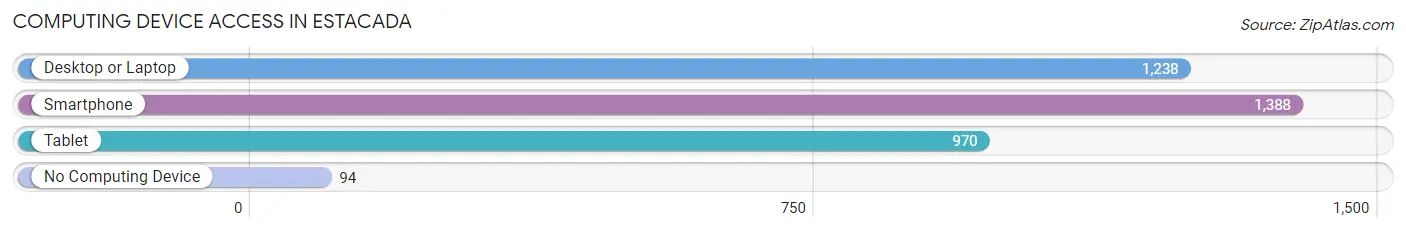
| Device Type | # Households | % Households |
| Desktop or Laptop | 1,238 | 81.7% |
| Smartphone | 1,388 | 91.6% |
| Tablet | 970 | 64.0% |
| No Computing Device | 94 | 6.2% |
| Total | 1,516 | 100.0% |
Internet Access in Estacada
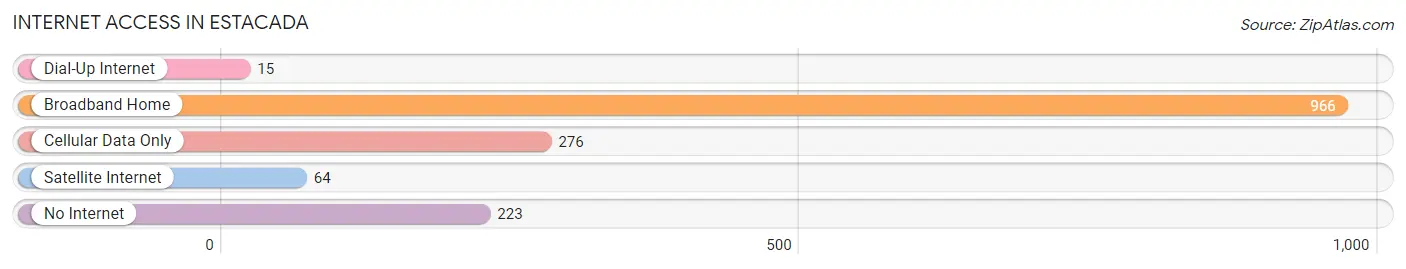
| Internet Type | # Households | % Households |
| Dial-Up Internet | 15 | 1.0% |
| Broadband Home | 966 | 63.7% |
| Cellular Data Only | 276 | 18.2% |
| Satellite Internet | 64 | 4.2% |
| No Internet | 223 | 14.7% |
| Total | 1,516 | 100.0% |
Estacada Summary
Estacada is a small city located in Clackamas County, Oregon, United States. It is situated on the banks of the Clackamas River, approximately 30 miles southeast of Portland. The city is part of the Portland metropolitan area and has a population of 2,695 as of the 2010 census.
History
Estacada was founded in 1884 by a group of settlers from the Midwest. The city was originally known as "The Dalles", but was later renamed Estacada, which is derived from the Spanish word for "stake". The city was incorporated in 1905 and has since grown to become a popular destination for outdoor recreation and tourism.
Geography
Estacada is located in the foothills of the Cascade Mountains, at an elevation of 830 feet. The city is situated on the banks of the Clackamas River, which is a major tributary of the Willamette River. The city is surrounded by lush forests and is home to several parks and recreational areas, including Milo McIver State Park and the Clackamas River Wildlife Area.
Economy
Estacada's economy is largely based on tourism and outdoor recreation. The city is home to several popular attractions, including the Estacada Timber Festival, the Estacada Summer Festival, and the Estacada Farmers Market. The city is also home to several wineries and breweries, as well as a number of restaurants and shops.
Demographics
As of the 2010 census, Estacada had a population of 2,695. The racial makeup of the city was 94.3% White, 0.7% African American, 0.7% Native American, 0.7% Asian, 0.2% Pacific Islander, 1.2% from other races, and 2.1% from two or more races. Hispanic or Latino of any race were 4.2% of the population.
Estacada is a small city with a diverse population. The median household income in Estacada is $50,945, and the median family income is $58,906. The median age of the city's population is 38.7 years. The city has a high rate of homeownership, with 73.3% of the population owning their own homes.
Estacada is a small city with a rich history and a vibrant economy. The city is home to a diverse population and is a popular destination for outdoor recreation and tourism. Estacada is a great place to live, work, and play.
Common Questions
What is Per Capita Income in Estacada?
Per Capita income in Estacada is $26,964.
What is the Median Family Income in Estacada?
Median Family Income in Estacada is $85,854.
What is the Median Household income in Estacada?
Median Household Income in Estacada is $78,594.
What is Income or Wage Gap in Estacada?
Income or Wage Gap in Estacada is 11.7%.
Women in Estacada earn 88.3 cents for every dollar earned by a man.
What is Inequality or Gini Index in Estacada?
Inequality or Gini Index in Estacada is 0.36.
What is the Total Population of Estacada?
Total Population of Estacada is 4,619.
What is the Total Male Population of Estacada?
Total Male Population of Estacada is 2,244.
What is the Total Female Population of Estacada?
Total Female Population of Estacada is 2,375.
What is the Ratio of Males per 100 Females in Estacada?
There are 94.48 Males per 100 Females in Estacada.
What is the Ratio of Females per 100 Males in Estacada?
There are 105.84 Females per 100 Males in Estacada.
What is the Median Population Age in Estacada?
Median Population Age in Estacada is 35.0 Years.
What is the Average Family Size in Estacada
Average Family Size in Estacada is 3.5 People.
What is the Average Household Size in Estacada
Average Household Size in Estacada is 3.0 People.
How Large is the Labor Force in Estacada?
There are 2,143 People in the Labor Forcein in Estacada.
What is the Percentage of People in the Labor Force in Estacada?
59.7% of People are in the Labor Force in Estacada.
What is the Unemployment Rate in Estacada?
Unemployment Rate in Estacada is 6.1%.