Dufur, OR Map & Demographics
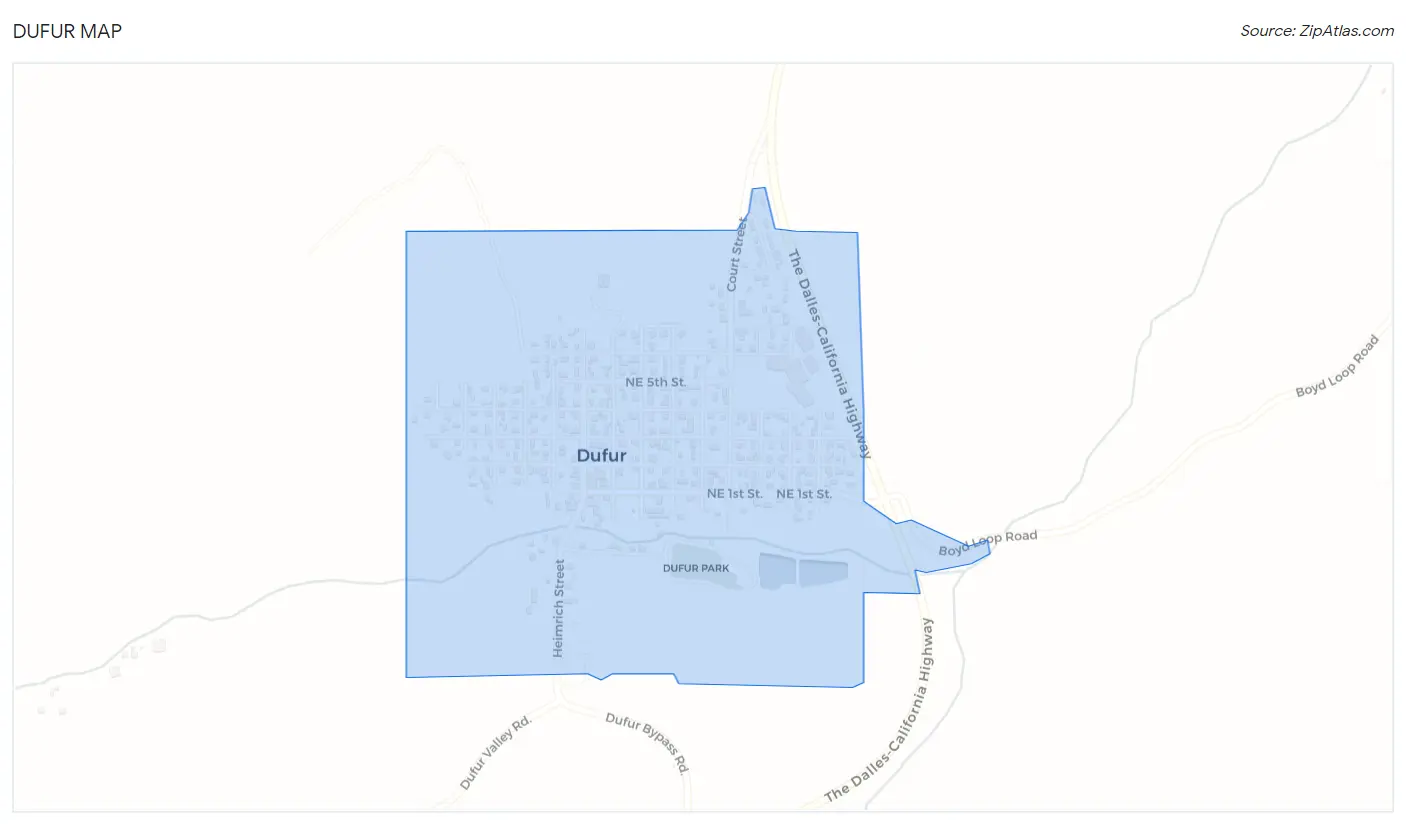
Dufur Map
Dufur Overview
$32,701
PER CAPITA INCOME
$95,417
AVG FAMILY INCOME
$74,321
AVG HOUSEHOLD INCOME
6.8%
WAGE / INCOME GAP [ % ]
93.2¢/ $1
WAGE / INCOME GAP [ $ ]
0.35
INEQUALITY / GINI INDEX
857
TOTAL POPULATION
530
MALE POPULATION
327
FEMALE POPULATION
162.08
MALES / 100 FEMALES
61.70
FEMALES / 100 MALES
37.0
MEDIAN AGE
3.0
AVG FAMILY SIZE
2.4
AVG HOUSEHOLD SIZE
361
LABOR FORCE [ PEOPLE ]
56.9%
PERCENT IN LABOR FORCE
3.3%
UNEMPLOYMENT RATE
Dufur Zip Codes
Dufur Area Codes
Income in Dufur
Income Overview in Dufur
Per Capita Income in Dufur is $32,701, while median incomes of families and households are $95,417 and $74,321 respectively.
| Characteristic | Number | Measure |
| Per Capita Income | 857 | $32,701 |
| Median Family Income | 225 | $95,417 |
| Mean Family Income | 225 | $105,993 |
| Median Household Income | 351 | $74,321 |
| Mean Household Income | 351 | $84,934 |
| Income Deficit | 225 | $0 |
| Wage / Income Gap (%) | 857 | 6.80% |
| Wage / Income Gap ($) | 857 | 93.20¢ per $1 |
| Gini / Inequality Index | 857 | 0.35 |
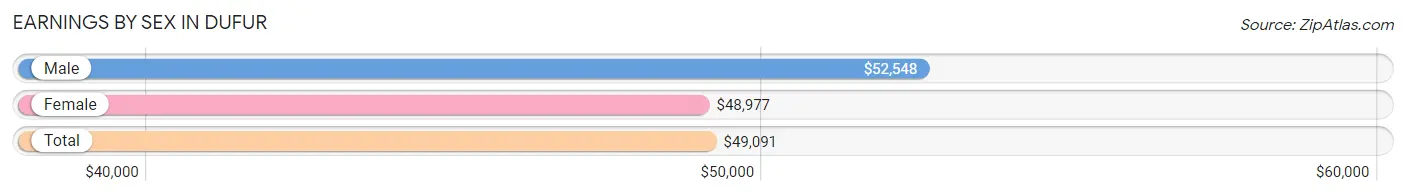
Earnings by Sex in Dufur
Average Earnings in Dufur are $49,091, $52,548 for men and $48,977 for women, a difference of 6.8%.
| Sex | Number | Average Earnings |
| Male | 215 (53.7%) | $52,548 |
| Female | 185 (46.3%) | $48,977 |
| Total | 400 (100.0%) | $49,091 |
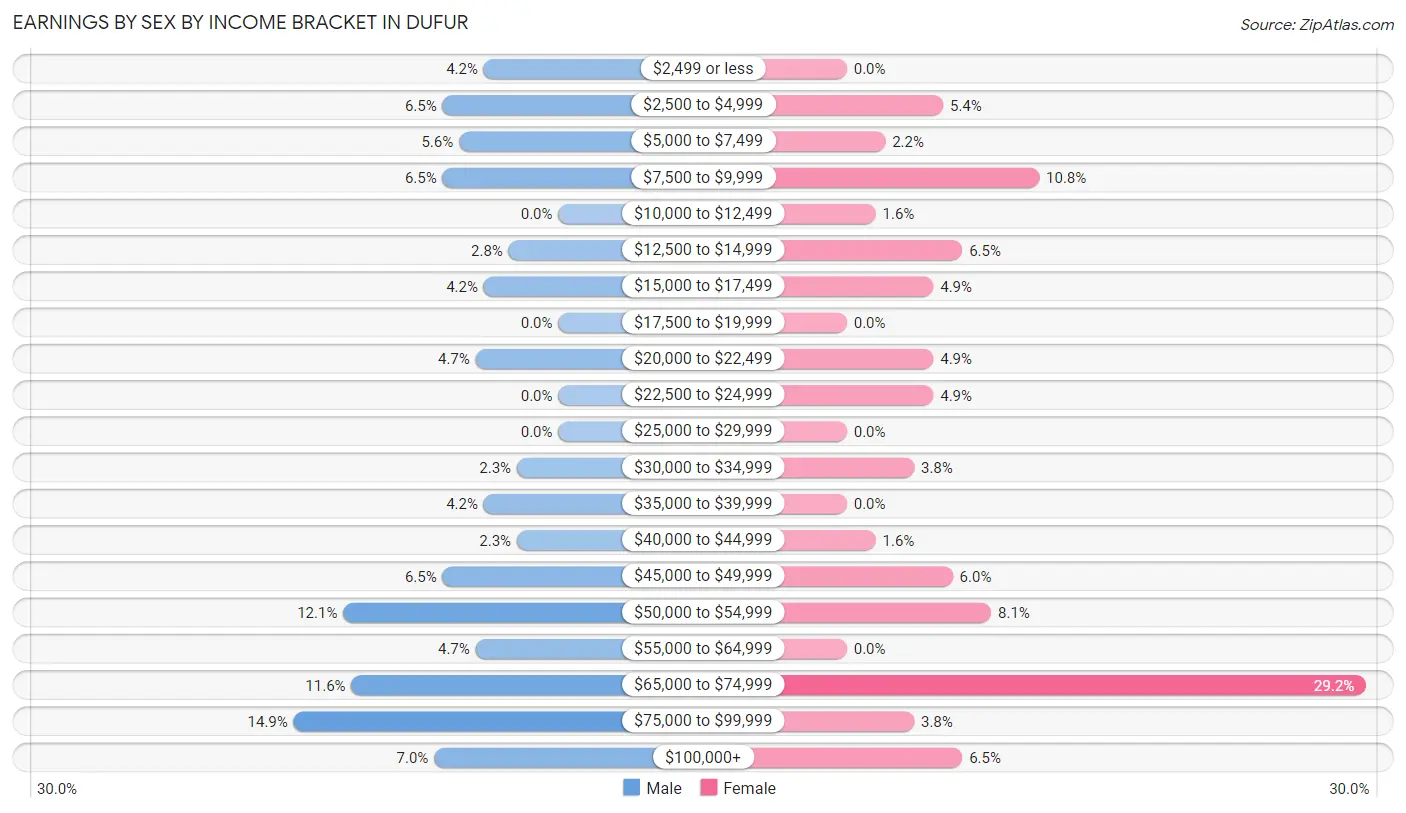
Earnings by Sex by Income Bracket in Dufur
The most common earnings brackets in Dufur are $75,000 to $99,999 for men (32 | 14.9%) and $65,000 to $74,999 for women (54 | 29.2%).
| Income | Male | Female |
| $2,499 or less | 9 (4.2%) | 0 (0.0%) |
| $2,500 to $4,999 | 14 (6.5%) | 10 (5.4%) |
| $5,000 to $7,499 | 12 (5.6%) | 4 (2.2%) |
| $7,500 to $9,999 | 14 (6.5%) | 20 (10.8%) |
| $10,000 to $12,499 | 0 (0.0%) | 3 (1.6%) |
| $12,500 to $14,999 | 6 (2.8%) | 12 (6.5%) |
| $15,000 to $17,499 | 9 (4.2%) | 9 (4.9%) |
| $17,500 to $19,999 | 0 (0.0%) | 0 (0.0%) |
| $20,000 to $22,499 | 10 (4.6%) | 9 (4.9%) |
| $22,500 to $24,999 | 0 (0.0%) | 9 (4.9%) |
| $25,000 to $29,999 | 0 (0.0%) | 0 (0.0%) |
| $30,000 to $34,999 | 5 (2.3%) | 7 (3.8%) |
| $35,000 to $39,999 | 9 (4.2%) | 0 (0.0%) |
| $40,000 to $44,999 | 5 (2.3%) | 3 (1.6%) |
| $45,000 to $49,999 | 14 (6.5%) | 11 (5.9%) |
| $50,000 to $54,999 | 26 (12.1%) | 15 (8.1%) |
| $55,000 to $64,999 | 10 (4.6%) | 0 (0.0%) |
| $65,000 to $74,999 | 25 (11.6%) | 54 (29.2%) |
| $75,000 to $99,999 | 32 (14.9%) | 7 (3.8%) |
| $100,000+ | 15 (7.0%) | 12 (6.5%) |
| Total | 215 (100.0%) | 185 (100.0%) |
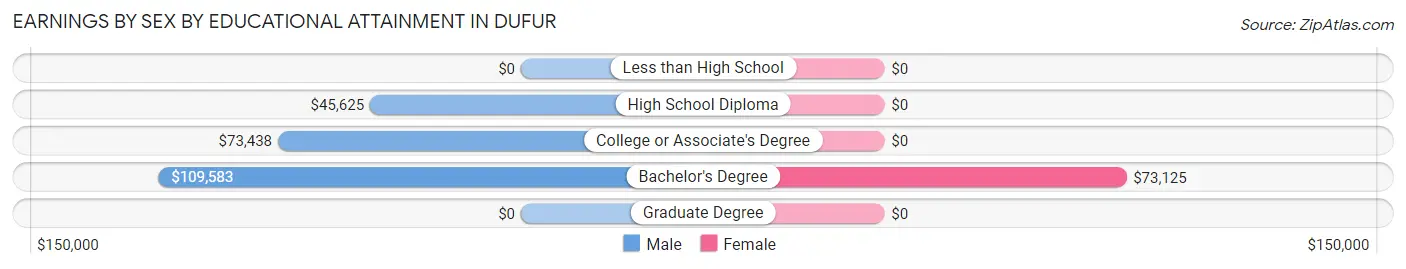
Earnings by Sex by Educational Attainment in Dufur
Average earnings in Dufur are $55,375 for men and $65,357 for women, a difference of 15.3%. Men with an educational attainment of bachelor's degree enjoy the highest average annual earnings of $109,583, while those with high school diploma education earn the least with $45,625. Women with an educational attainment of bachelor's degree earn the most with the average annual earnings of $73,125, while those with bachelor's degree education have the smallest earnings of $73,125.
| Educational Attainment | Male Income | Female Income |
| Less than High School | - | - |
| High School Diploma | $45,625 | $0 |
| College or Associate's Degree | $73,438 | $0 |
| Bachelor's Degree | $109,583 | $73,125 |
| Graduate Degree | - | - |
| Total | $55,375 | $65,357 |
Family Income in Dufur
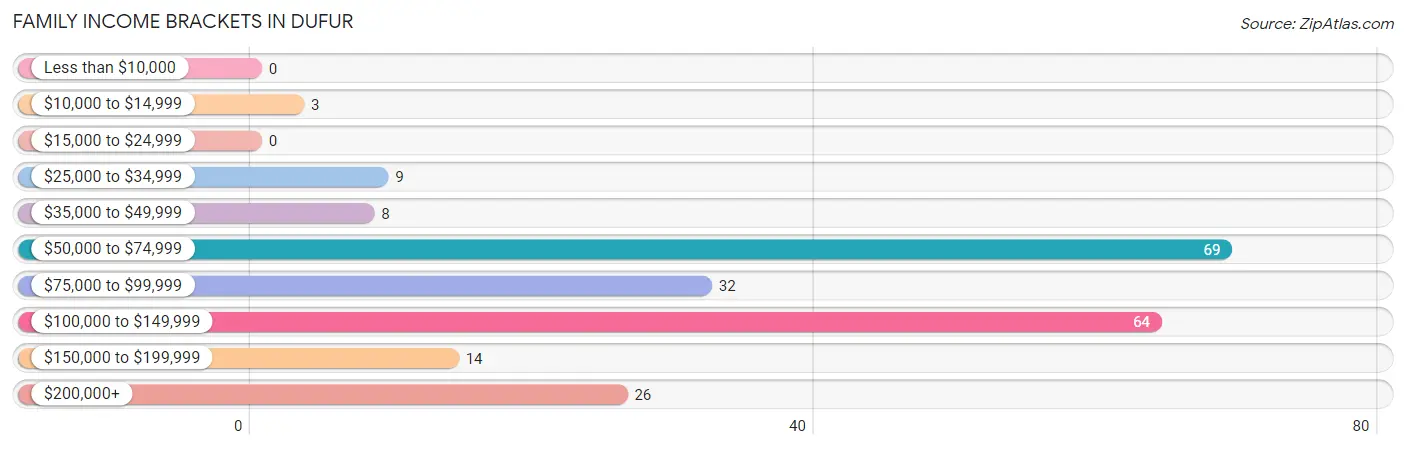
Family Income Brackets in Dufur
According to the Dufur family income data, there are 69 families falling into the $50,000 to $74,999 income range, which is the most common income bracket and makes up 30.7% of all families.
| Income Bracket | # Families | % Families |
| Less than $10,000 | 0 | 0.0% |
| $10,000 to $14,999 | 3 | 1.3% |
| $15,000 to $24,999 | 0 | 0.0% |
| $25,000 to $34,999 | 9 | 4.0% |
| $35,000 to $49,999 | 8 | 3.6% |
| $50,000 to $74,999 | 69 | 30.7% |
| $75,000 to $99,999 | 32 | 14.2% |
| $100,000 to $149,999 | 64 | 28.4% |
| $150,000 to $199,999 | 14 | 6.2% |
| $200,000+ | 26 | 11.6% |
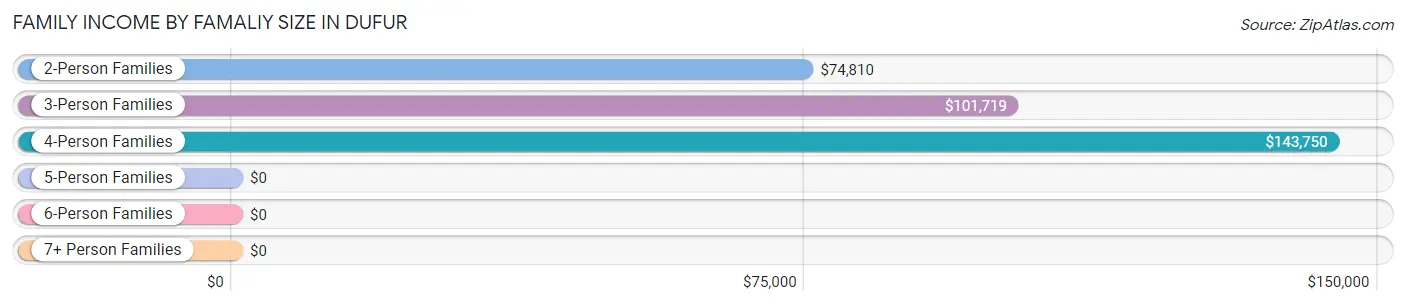
Family Income by Famaliy Size in Dufur
4-person families (19 | 8.4%) account for the highest median family income in Dufur with $143,750 per family, while 2-person families (135 | 60.0%) have the highest median income of $37,405 per family member.
| Income Bracket | # Families | Median Income |
| 2-Person Families | 135 (60.0%) | $74,810 |
| 3-Person Families | 35 (15.6%) | $101,719 |
| 4-Person Families | 19 (8.4%) | $143,750 |
| 5-Person Families | 24 (10.7%) | $0 |
| 6-Person Families | 3 (1.3%) | $0 |
| 7+ Person Families | 9 (4.0%) | $0 |
| Total | 225 (100.0%) | $95,417 |
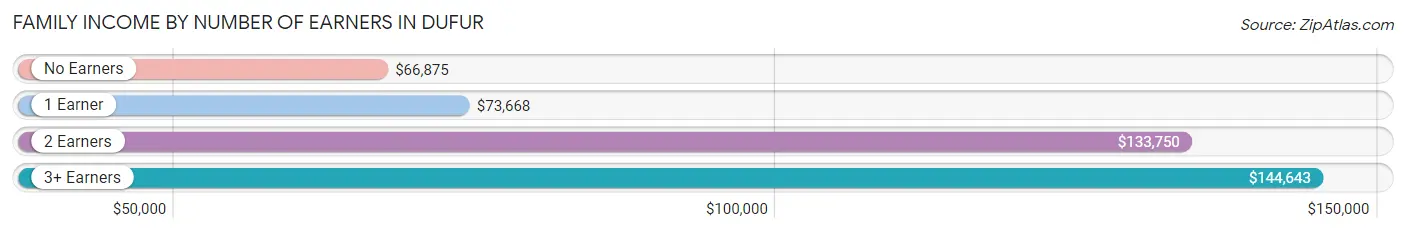
Family Income by Number of Earners in Dufur
The median family income in Dufur is $95,417, with families comprising 3+ earners (26) having the highest median family income of $144,643, while families with no earners (16) have the lowest median family income of $66,875, accounting for 11.6% and 7.1% of families, respectively.
| Number of Earners | # Families | Median Income |
| No Earners | 16 (7.1%) | $66,875 |
| 1 Earner | 109 (48.4%) | $73,668 |
| 2 Earners | 74 (32.9%) | $133,750 |
| 3+ Earners | 26 (11.6%) | $144,643 |
| Total | 225 (100.0%) | $95,417 |
Household Income in Dufur
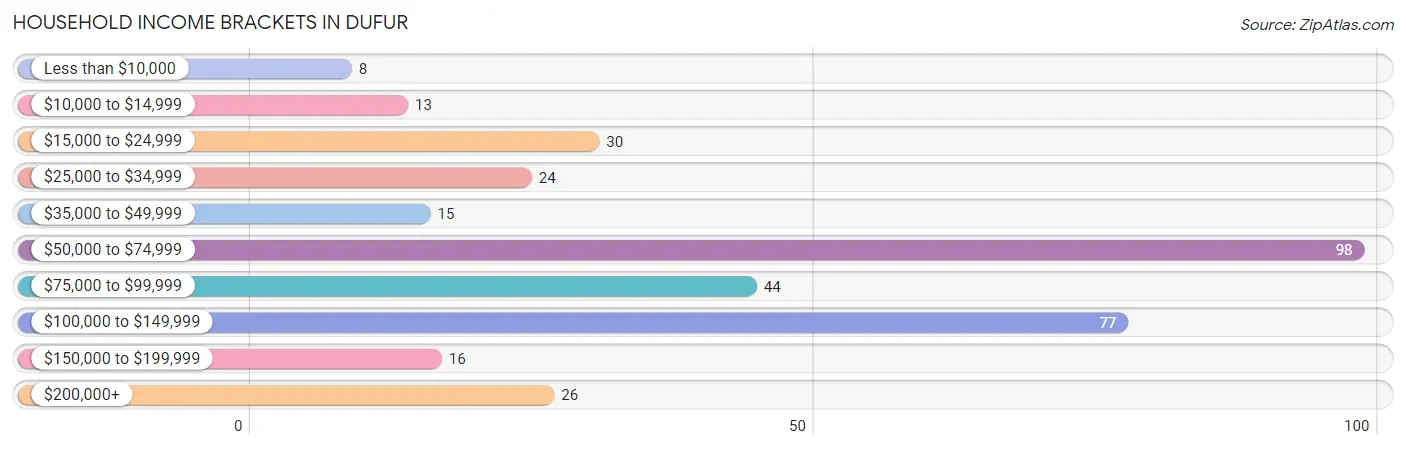
Household Income Brackets in Dufur
With 98 households falling in the category, the $50,000 to $74,999 income range is the most frequent in Dufur, accounting for 27.9% of all households. In contrast, only 8 households (2.3%) fall into the less than $10,000 income bracket, making it the least populous group.
| Income Bracket | # Households | % Households |
| Less than $10,000 | 8 | 2.3% |
| $10,000 to $14,999 | 13 | 3.7% |
| $15,000 to $24,999 | 30 | 8.5% |
| $25,000 to $34,999 | 24 | 6.8% |
| $35,000 to $49,999 | 15 | 4.3% |
| $50,000 to $74,999 | 98 | 27.9% |
| $75,000 to $99,999 | 44 | 12.5% |
| $100,000 to $149,999 | 77 | 21.9% |
| $150,000 to $199,999 | 16 | 4.6% |
| $200,000+ | 26 | 7.4% |
Household Income by Householder Age in Dufur
The median household income in Dufur is $74,321, with the highest median household income of $76,250 found in the 25 to 44 years age bracket for the primary householder. A total of 82 households (23.4%) fall into this category. Meanwhile, the 15 to 24 years age bracket for the primary householder has the lowest median household income of $0, with 12 households (3.4%) in this group.
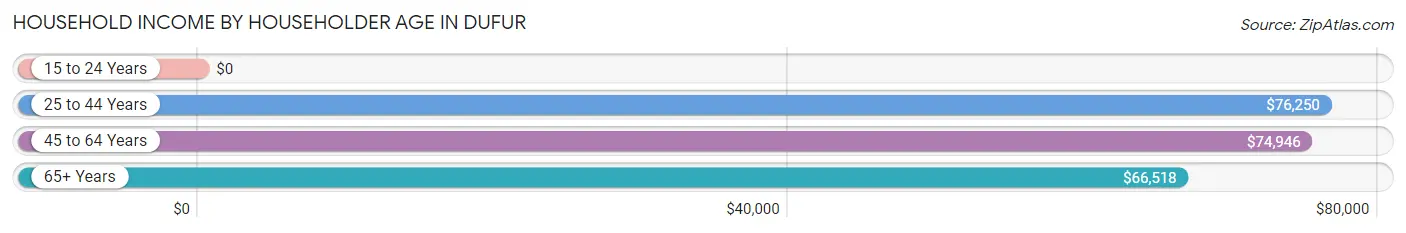
| Income Bracket | # Households | Median Income |
| 15 to 24 Years | 12 (3.4%) | $0 |
| 25 to 44 Years | 82 (23.4%) | $76,250 |
| 45 to 64 Years | 136 (38.8%) | $74,946 |
| 65+ Years | 121 (34.5%) | $66,518 |
| Total | 351 (100.0%) | $74,321 |
Poverty in Dufur
Income Below Poverty by Sex and Age in Dufur
With 7.0% poverty level for males and 2.8% for females among the residents of Dufur, 18 to 24 year old males and 6 to 11 year old females are the most vulnerable to poverty, with 12 males (28.6%) and 3 females (15.8%) in their respective age groups living below the poverty level.
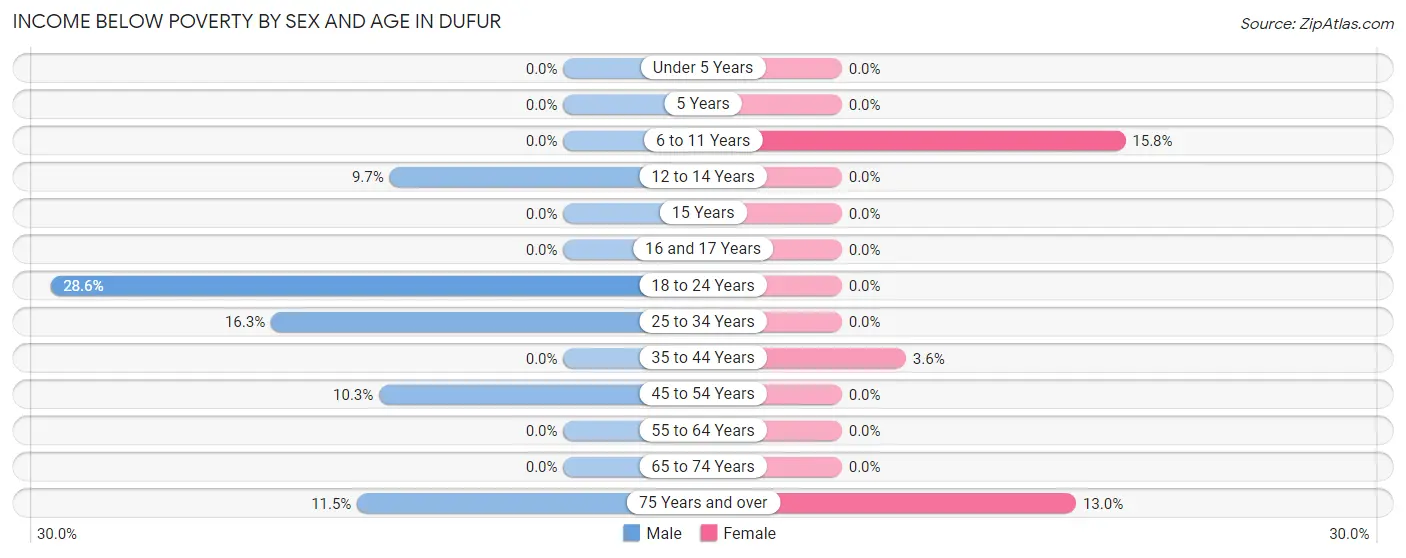
| Age Bracket | Male | Female |
| Under 5 Years | 0 (0.0%) | 0 (0.0%) |
| 5 Years | 0 (0.0%) | 0 (0.0%) |
| 6 to 11 Years | 0 (0.0%) | 3 (15.8%) |
| 12 to 14 Years | 3 (9.7%) | 0 (0.0%) |
| 15 Years | 0 (0.0%) | 0 (0.0%) |
| 16 and 17 Years | 0 (0.0%) | 0 (0.0%) |
| 18 to 24 Years | 12 (28.6%) | 0 (0.0%) |
| 25 to 34 Years | 7 (16.3%) | 0 (0.0%) |
| 35 to 44 Years | 0 (0.0%) | 3 (3.6%) |
| 45 to 54 Years | 8 (10.3%) | 0 (0.0%) |
| 55 to 64 Years | 0 (0.0%) | 0 (0.0%) |
| 65 to 74 Years | 0 (0.0%) | 0 (0.0%) |
| 75 Years and over | 7 (11.5%) | 3 (13.0%) |
| Total | 37 (7.0%) | 9 (2.8%) |
Income Above Poverty by Sex and Age in Dufur
According to the poverty statistics in Dufur, males aged under 5 years and females aged under 5 years are the age groups that are most secure financially, with 100.0% of males and 100.0% of females in these age groups living above the poverty line.
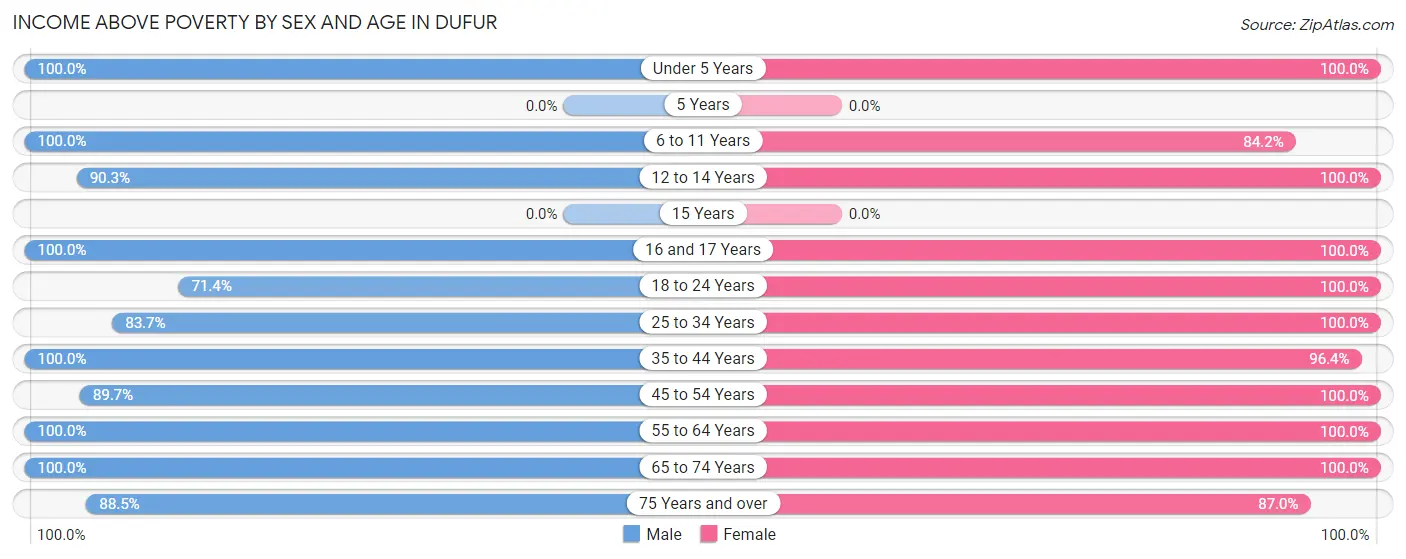
| Age Bracket | Male | Female |
| Under 5 Years | 58 (100.0%) | 21 (100.0%) |
| 5 Years | 0 (0.0%) | 0 (0.0%) |
| 6 to 11 Years | 66 (100.0%) | 16 (84.2%) |
| 12 to 14 Years | 28 (90.3%) | 28 (100.0%) |
| 15 Years | 0 (0.0%) | 0 (0.0%) |
| 16 and 17 Years | 14 (100.0%) | 14 (100.0%) |
| 18 to 24 Years | 30 (71.4%) | 30 (100.0%) |
| 25 to 34 Years | 36 (83.7%) | 30 (100.0%) |
| 35 to 44 Years | 38 (100.0%) | 81 (96.4%) |
| 45 to 54 Years | 70 (89.7%) | 14 (100.0%) |
| 55 to 64 Years | 43 (100.0%) | 53 (100.0%) |
| 65 to 74 Years | 56 (100.0%) | 11 (100.0%) |
| 75 Years and over | 54 (88.5%) | 20 (87.0%) |
| Total | 493 (93.0%) | 318 (97.3%) |
Income Below Poverty Among Married-Couple Families in Dufur
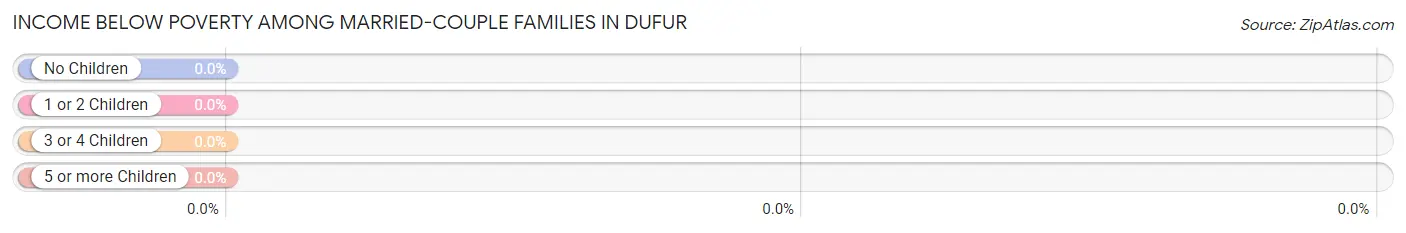
| Children | Above Poverty | Below Poverty |
| No Children | 114 (100.0%) | 0 (0.0%) |
| 1 or 2 Children | 26 (100.0%) | 0 (0.0%) |
| 3 or 4 Children | 20 (100.0%) | 0 (0.0%) |
| 5 or more Children | 7 (100.0%) | 0 (0.0%) |
| Total | 167 (100.0%) | 0 (0.0%) |
Income Below Poverty Among Single-Parent Households in Dufur
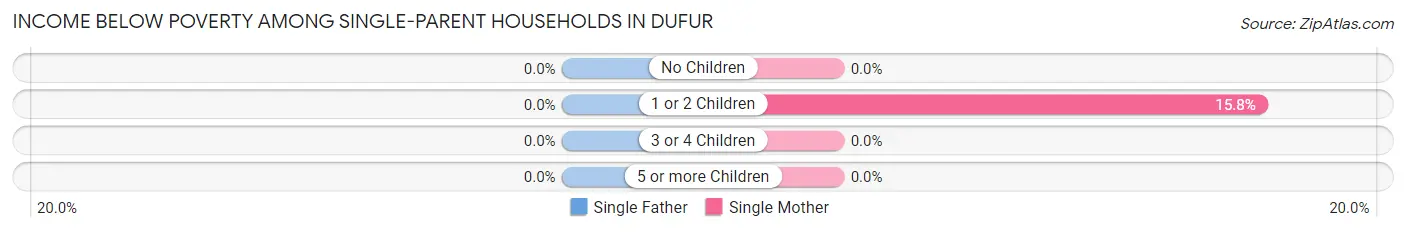
| Children | Single Father | Single Mother |
| No Children | 0 (0.0%) | 0 (0.0%) |
| 1 or 2 Children | 0 (0.0%) | 3 (15.8%) |
| 3 or 4 Children | 0 (0.0%) | 0 (0.0%) |
| 5 or more Children | 0 (0.0%) | 0 (0.0%) |
| Total | 0 (0.0%) | 3 (10.3%) |
Income Below Poverty Among Married-Couple vs Single-Parent Households in Dufur
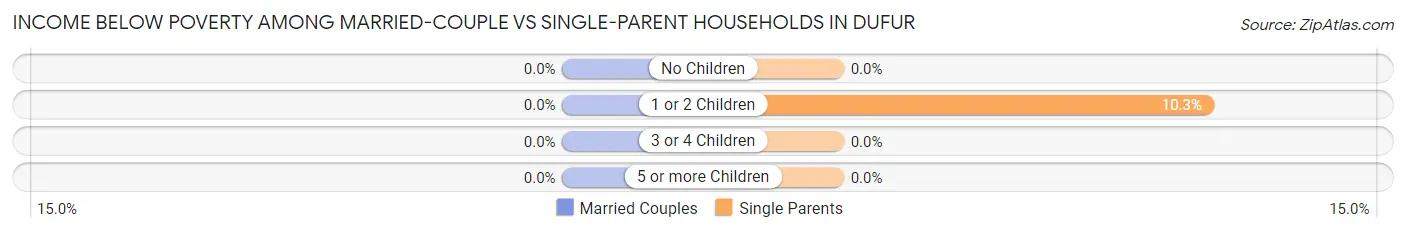
| Children | Married-Couple Families | Single-Parent Households |
| No Children | 0 (0.0%) | 0 (0.0%) |
| 1 or 2 Children | 0 (0.0%) | 3 (10.3%) |
| 3 or 4 Children | 0 (0.0%) | 0 (0.0%) |
| 5 or more Children | 0 (0.0%) | 0 (0.0%) |
| Total | 0 (0.0%) | 3 (5.2%) |
Race in Dufur
The most populous races in Dufur are White / Caucasian (724 | 84.5%), Two or more Races (132 | 15.4%), and Hispanic or Latino (55 | 6.4%).
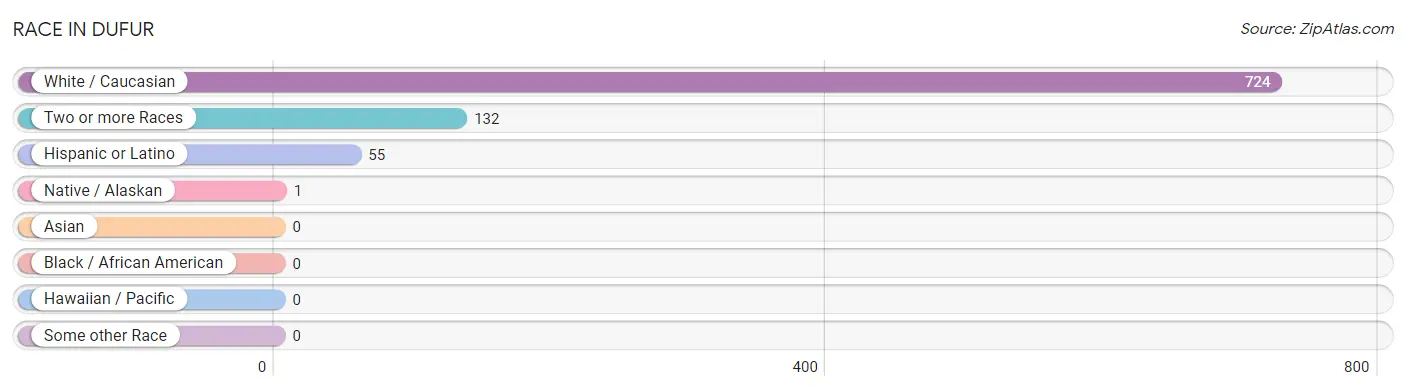
| Race | # Population | % Population |
| Asian | 0 | 0.0% |
| Black / African American | 0 | 0.0% |
| Hawaiian / Pacific | 0 | 0.0% |
| Hispanic or Latino | 55 | 6.4% |
| Native / Alaskan | 1 | 0.1% |
| White / Caucasian | 724 | 84.5% |
| Two or more Races | 132 | 15.4% |
| Some other Race | 0 | 0.0% |
| Total | 857 | 100.0% |
Ancestry in Dufur
The most populous ancestries reported in Dufur are German (146 | 17.0%), English (121 | 14.1%), Irish (99 | 11.6%), Central American (55 | 6.4%), and Salvadoran (55 | 6.4%), together accounting for 55.5% of all Dufur residents.
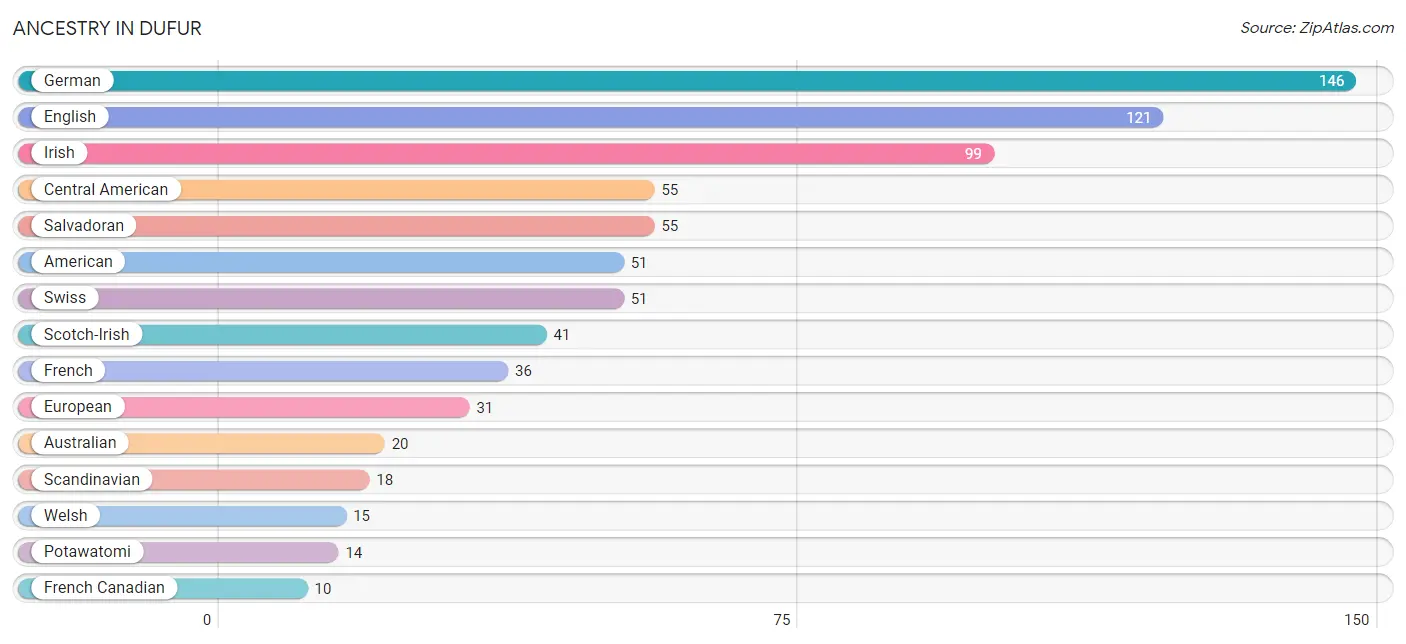
| Ancestry | # Population | % Population |
| American | 51 | 5.9% |
| Australian | 20 | 2.3% |
| British | 5 | 0.6% |
| Central American | 55 | 6.4% |
| Cherokee | 6 | 0.7% |
| Chippewa | 6 | 0.7% |
| Dutch | 3 | 0.4% |
| English | 121 | 14.1% |
| European | 31 | 3.6% |
| French | 36 | 4.2% |
| French Canadian | 10 | 1.2% |
| German | 146 | 17.0% |
| Irish | 99 | 11.6% |
| Italian | 5 | 0.6% |
| Native Hawaiian | 6 | 0.7% |
| New Zealander | 8 | 0.9% |
| Norwegian | 3 | 0.4% |
| Potawatomi | 14 | 1.6% |
| Russian | 7 | 0.8% |
| Salvadoran | 55 | 6.4% |
| Scandinavian | 18 | 2.1% |
| Scotch-Irish | 41 | 4.8% |
| Sioux | 9 | 1.1% |
| Swedish | 1 | 0.1% |
| Swiss | 51 | 5.9% |
| Welsh | 15 | 1.8% | View All 26 Rows |
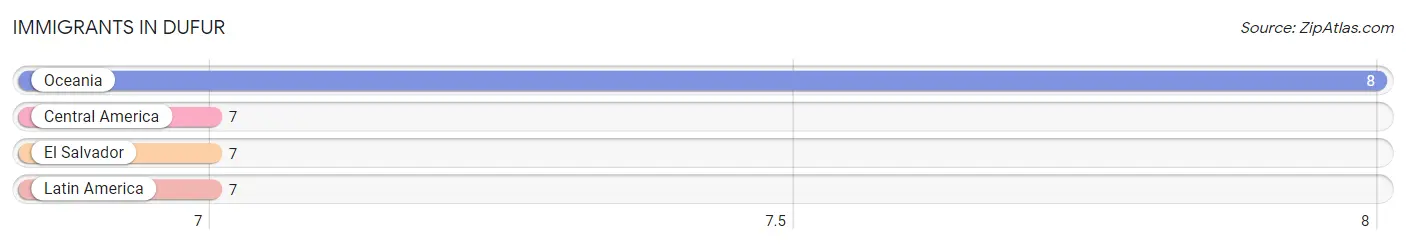
Immigrants in Dufur
The most numerous immigrant groups reported in Dufur came from Oceania (8 | 0.9%), Central America (7 | 0.8%), El Salvador (7 | 0.8%), and Latin America (7 | 0.8%), together accounting for 3.4% of all Dufur residents.
| Immigration Origin | # Population | % Population |
| Central America | 7 | 0.8% |
| El Salvador | 7 | 0.8% |
| Latin America | 7 | 0.8% |
| Oceania | 8 | 0.9% | View All 4 Rows |
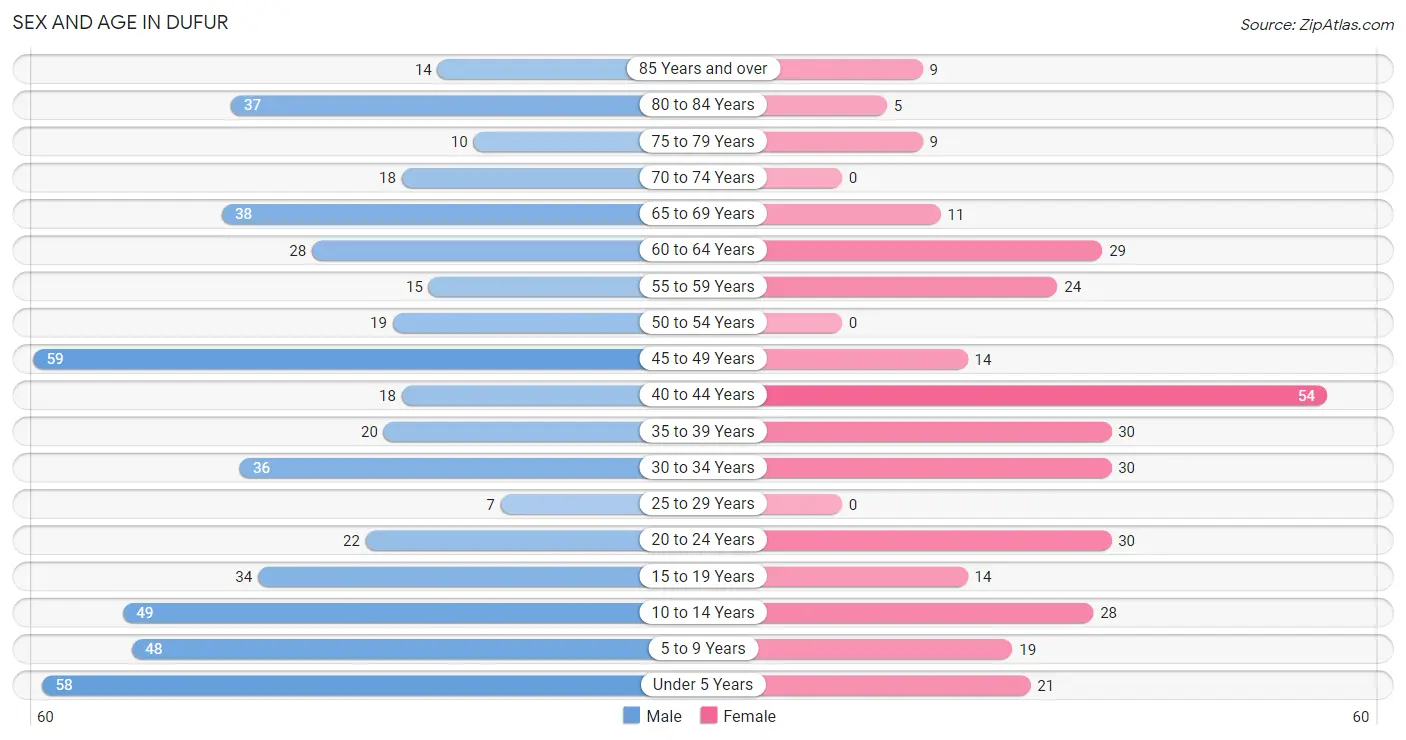
Sex and Age in Dufur
Sex and Age in Dufur
The most populous age groups in Dufur are 45 to 49 Years (59 | 11.1%) for men and 40 to 44 Years (54 | 16.5%) for women.
| Age Bracket | Male | Female |
| Under 5 Years | 58 (10.9%) | 21 (6.4%) |
| 5 to 9 Years | 48 (9.1%) | 19 (5.8%) |
| 10 to 14 Years | 49 (9.2%) | 28 (8.6%) |
| 15 to 19 Years | 34 (6.4%) | 14 (4.3%) |
| 20 to 24 Years | 22 (4.2%) | 30 (9.2%) |
| 25 to 29 Years | 7 (1.3%) | 0 (0.0%) |
| 30 to 34 Years | 36 (6.8%) | 30 (9.2%) |
| 35 to 39 Years | 20 (3.8%) | 30 (9.2%) |
| 40 to 44 Years | 18 (3.4%) | 54 (16.5%) |
| 45 to 49 Years | 59 (11.1%) | 14 (4.3%) |
| 50 to 54 Years | 19 (3.6%) | 0 (0.0%) |
| 55 to 59 Years | 15 (2.8%) | 24 (7.3%) |
| 60 to 64 Years | 28 (5.3%) | 29 (8.9%) |
| 65 to 69 Years | 38 (7.2%) | 11 (3.4%) |
| 70 to 74 Years | 18 (3.4%) | 0 (0.0%) |
| 75 to 79 Years | 10 (1.9%) | 9 (2.8%) |
| 80 to 84 Years | 37 (7.0%) | 5 (1.5%) |
| 85 Years and over | 14 (2.6%) | 9 (2.8%) |
| Total | 530 (100.0%) | 327 (100.0%) |
Families and Households in Dufur
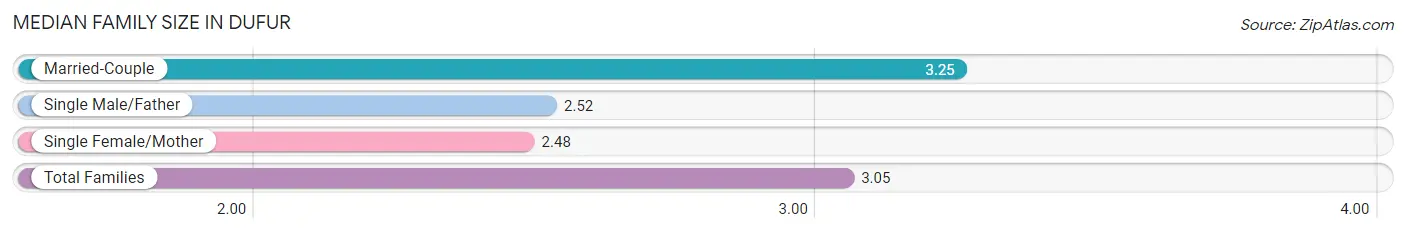
Median Family Size in Dufur
The median family size in Dufur is 3.05 persons per family, with married-couple families (167 | 74.2%) accounting for the largest median family size of 3.25 persons per family. On the other hand, single female/mother families (29 | 12.9%) represent the smallest median family size with 2.48 persons per family.
| Family Type | # Families | Family Size |
| Married-Couple | 167 (74.2%) | 3.25 |
| Single Male/Father | 29 (12.9%) | 2.52 |
| Single Female/Mother | 29 (12.9%) | 2.48 |
| Total Families | 225 (100.0%) | 3.05 |
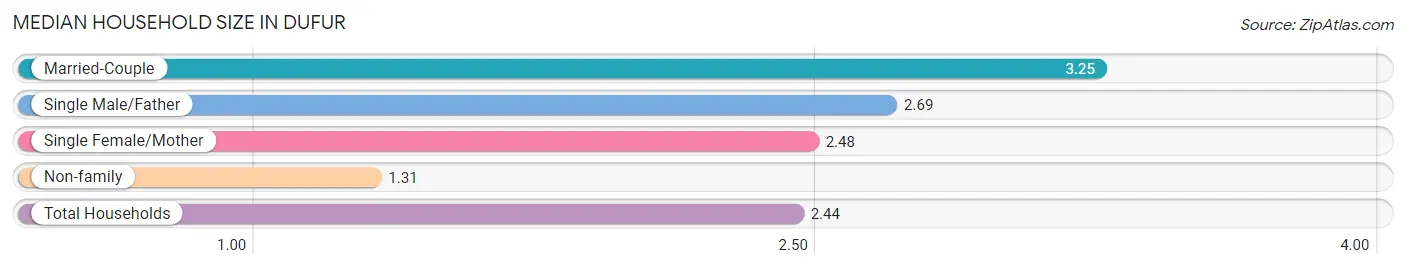
Median Household Size in Dufur
The median household size in Dufur is 2.44 persons per household, with married-couple households (167 | 47.6%) accounting for the largest median household size of 3.25 persons per household. non-family households (126 | 35.9%) represent the smallest median household size with 1.31 persons per household.
| Household Type | # Households | Household Size |
| Married-Couple | 167 (47.6%) | 3.25 |
| Single Male/Father | 29 (8.3%) | 2.69 |
| Single Female/Mother | 29 (8.3%) | 2.48 |
| Non-family | 126 (35.9%) | 1.31 |
| Total Households | 351 (100.0%) | 2.44 |
Household Size by Marriage Status in Dufur
Out of a total of 351 households in Dufur, 225 (64.1%) are family households, while 126 (35.9%) are nonfamily households. The most numerous type of family households are 2-person households, comprising 135, and the most common type of nonfamily households are 1-person households, comprising 95.
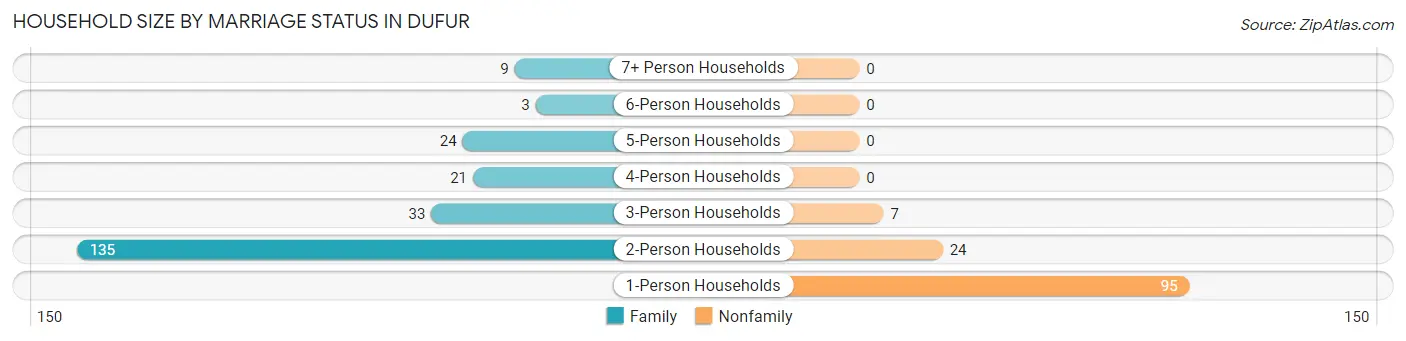
| Household Size | Family Households | Nonfamily Households |
| 1-Person Households | - | 95 (27.1%) |
| 2-Person Households | 135 (38.5%) | 24 (6.8%) |
| 3-Person Households | 33 (9.4%) | 7 (2.0%) |
| 4-Person Households | 21 (6.0%) | 0 (0.0%) |
| 5-Person Households | 24 (6.8%) | 0 (0.0%) |
| 6-Person Households | 3 (0.9%) | 0 (0.0%) |
| 7+ Person Households | 9 (2.6%) | 0 (0.0%) |
| Total | 225 (64.1%) | 126 (35.9%) |
Female Fertility in Dufur
Fertility by Age in Dufur
Average fertility rate in Dufur is 17.0 births per 1,000 women. Women in the age bracket of 20 to 34 years have the highest fertility rate with 50.0 births per 1,000 women. Women in the age bracket of 20 to 34 years acount for 100.0% of all women with births.
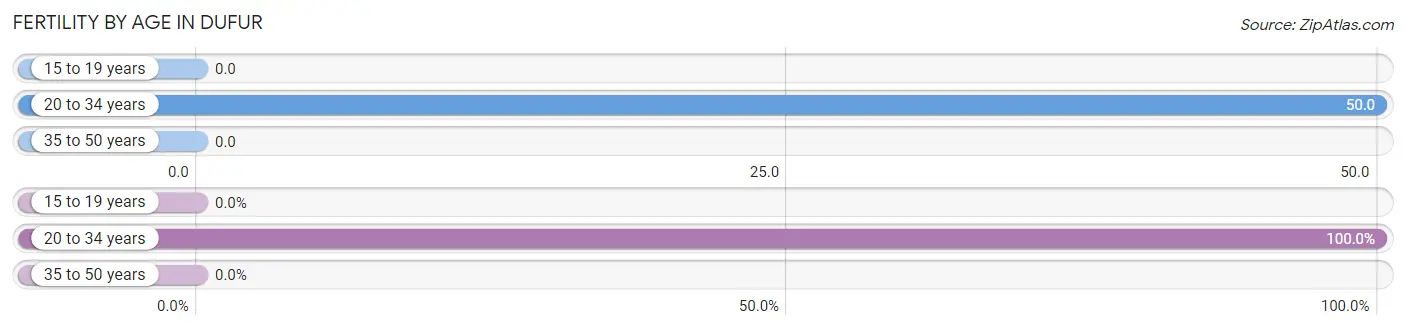
| Age Bracket | Women with Births | Births / 1,000 Women |
| 15 to 19 years | 0 (0.0%) | 0.0 |
| 20 to 34 years | 3 (100.0%) | 50.0 |
| 35 to 50 years | 0 (0.0%) | 0.0 |
| Total | 3 (100.0%) | 17.0 |
Fertility by Age by Marriage Status in Dufur
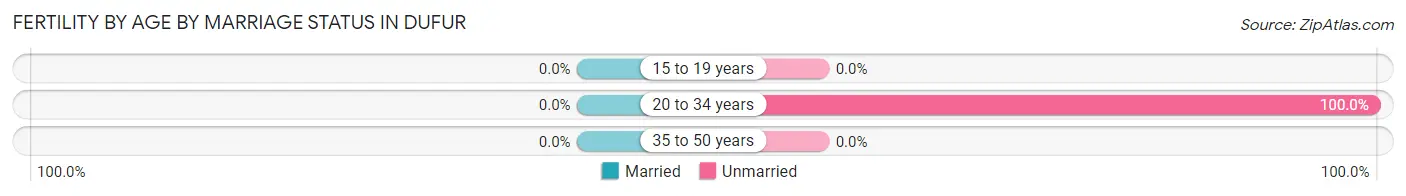
| Age Bracket | Married | Unmarried |
| 15 to 19 years | 0 (0.0%) | 0 (0.0%) |
| 20 to 34 years | 0 (0.0%) | 3 (100.0%) |
| 35 to 50 years | 0 (0.0%) | 0 (0.0%) |
| Total | 0 (0.0%) | 3 (100.0%) |
Fertility by Education in Dufur
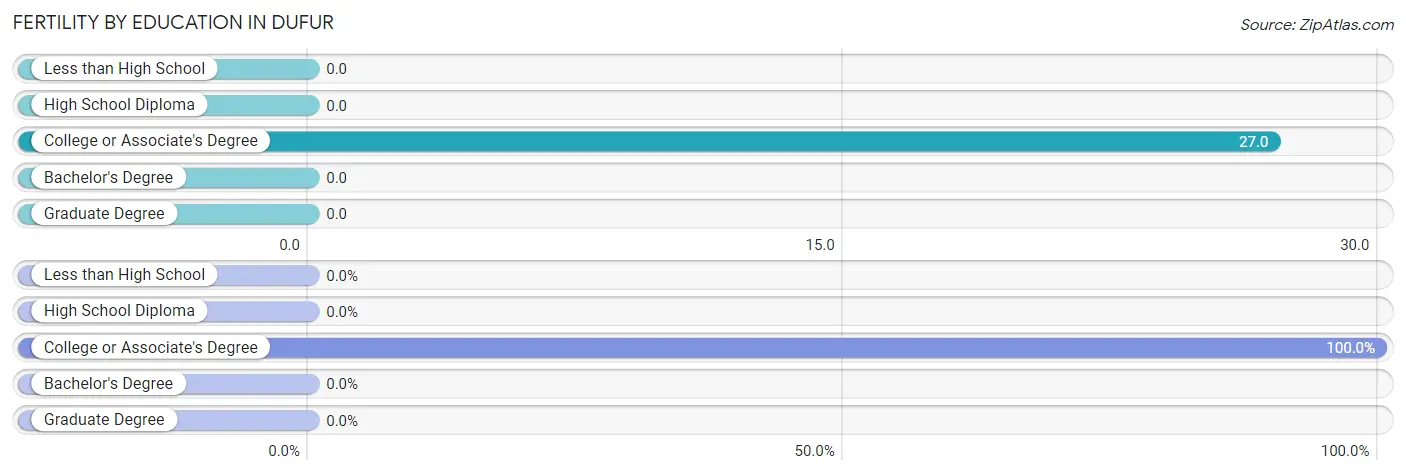
| Educational Attainment | Women with Births | Births / 1,000 Women |
| Less than High School | 0 (0.0%) | 0.0 |
| High School Diploma | 0 (0.0%) | 0.0 |
| College or Associate's Degree | 3 (100.0%) | 27.0 |
| Bachelor's Degree | 0 (0.0%) | 0.0 |
| Graduate Degree | 0 (0.0%) | 0.0 |
| Total | 3 (100.0%) | 17.0 |
Fertility by Education by Marriage Status in Dufur
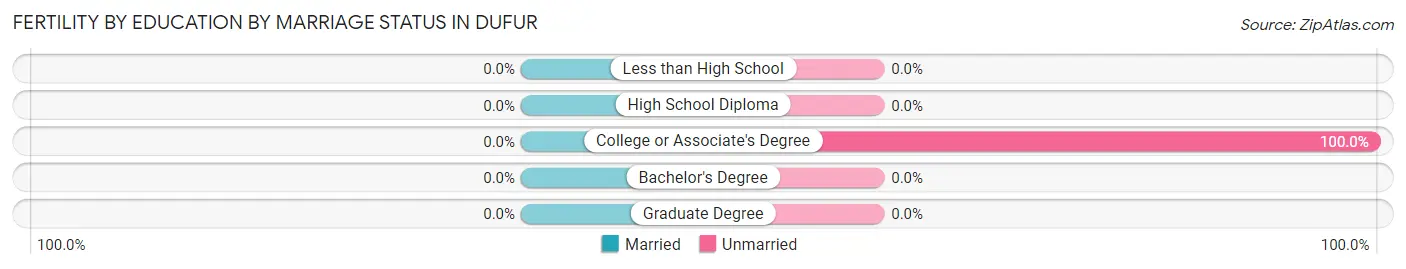
| Educational Attainment | Married | Unmarried |
| Less than High School | 0 (0.0%) | 0 (0.0%) |
| High School Diploma | 0 (0.0%) | 0 (0.0%) |
| College or Associate's Degree | 0 (0.0%) | 3 (100.0%) |
| Bachelor's Degree | 0 (0.0%) | 0 (0.0%) |
| Graduate Degree | 0 (0.0%) | 0 (0.0%) |
| Total | 0 (0.0%) | 3 (100.0%) |
Employment Characteristics in Dufur
Employment by Class of Employer in Dufur
Among the 338 employed individuals in Dufur, private company employees (182 | 53.8%), not-for-profit organizations (51 | 15.1%), and state government employees (42 | 12.4%) make up the most common classes of employment.
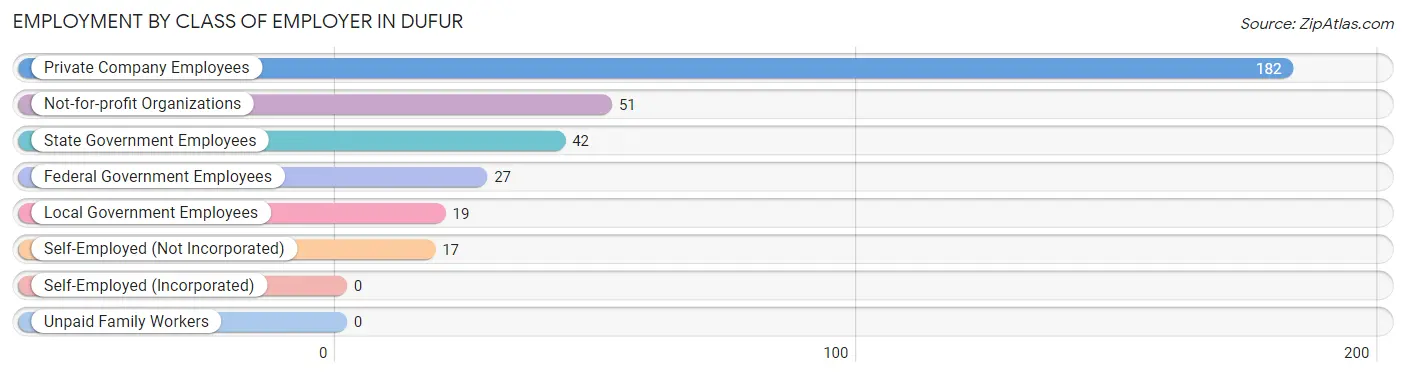
| Employer Class | # Employees | % Employees |
| Private Company Employees | 182 | 53.8% |
| Self-Employed (Incorporated) | 0 | 0.0% |
| Self-Employed (Not Incorporated) | 17 | 5.0% |
| Not-for-profit Organizations | 51 | 15.1% |
| Local Government Employees | 19 | 5.6% |
| State Government Employees | 42 | 12.4% |
| Federal Government Employees | 27 | 8.0% |
| Unpaid Family Workers | 0 | 0.0% |
| Total | 338 | 100.0% |
Employment Status by Age in Dufur
According to the labor force statistics for Dufur, out of the total population over 16 years of age (634), 56.9% or 361 individuals are in the labor force, with 3.3% or 12 of them unemployed. The age group with the highest labor force participation rate is 30 to 34 years, with 100.0% or 66 individuals in the labor force. Within the labor force, the 20 to 24 years age range has the highest percentage of unemployed individuals, with 24.5% or 12 of them being unemployed.
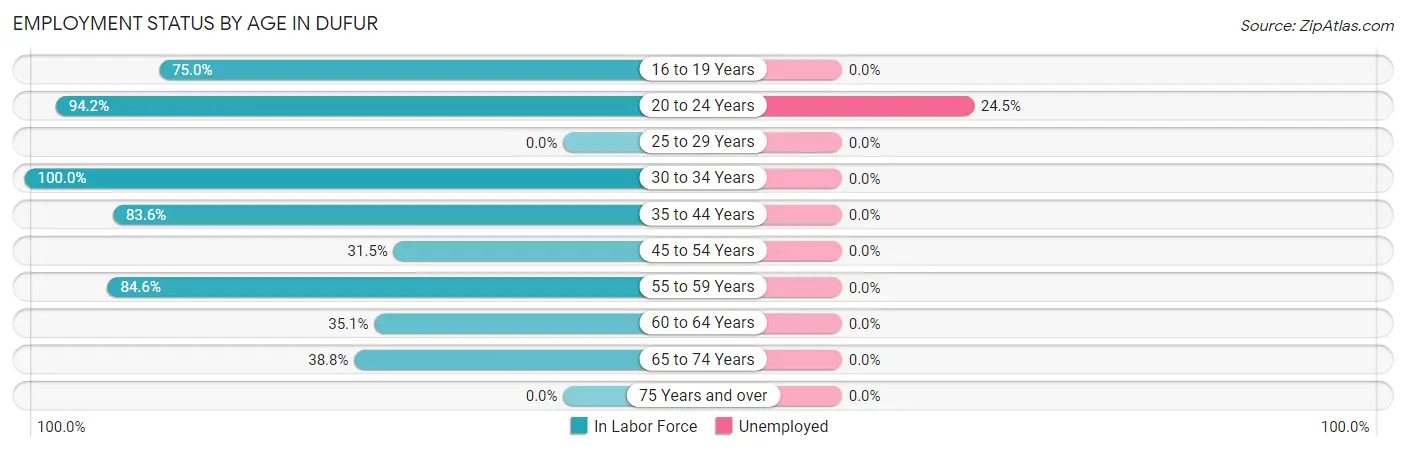
| Age Bracket | In Labor Force | Unemployed |
| 16 to 19 Years | 36 (75.0%) | 0 (0.0%) |
| 20 to 24 Years | 49 (94.2%) | 12 (24.5%) |
| 25 to 29 Years | 0 (0.0%) | 0 (0.0%) |
| 30 to 34 Years | 66 (100.0%) | 0 (0.0%) |
| 35 to 44 Years | 102 (83.6%) | 0 (0.0%) |
| 45 to 54 Years | 29 (31.5%) | 0 (0.0%) |
| 55 to 59 Years | 33 (84.6%) | 0 (0.0%) |
| 60 to 64 Years | 20 (35.1%) | 0 (0.0%) |
| 65 to 74 Years | 26 (38.8%) | 0 (0.0%) |
| 75 Years and over | 0 (0.0%) | 0 (0.0%) |
| Total | 361 (56.9%) | 12 (3.3%) |
Employment Status by Educational Attainment in Dufur
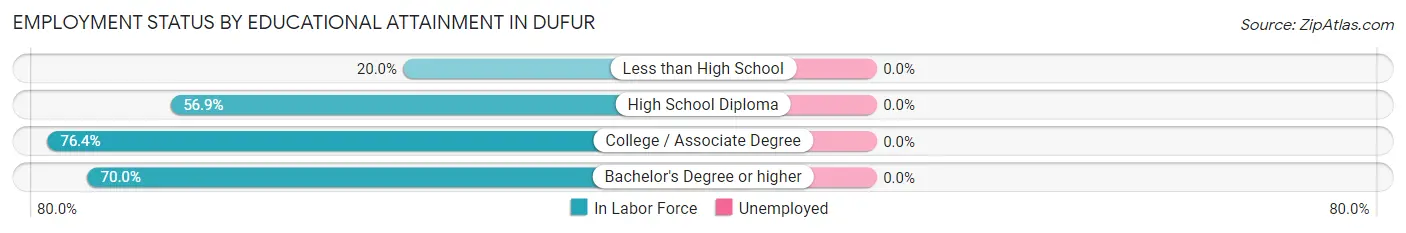
| Educational Attainment | In Labor Force | Unemployed |
| Less than High School | 10 (20.0%) | 0 (0.0%) |
| High School Diploma | 29 (56.9%) | 0 (0.0%) |
| College / Associate Degree | 162 (76.4%) | 0 (0.0%) |
| Bachelor's Degree or higher | 49 (70.0%) | 0 (0.0%) |
| Total | 250 (65.3%) | 0 (0.0%) |
Employment Occupations by Sex in Dufur
Management, Business, Science and Arts Occupations
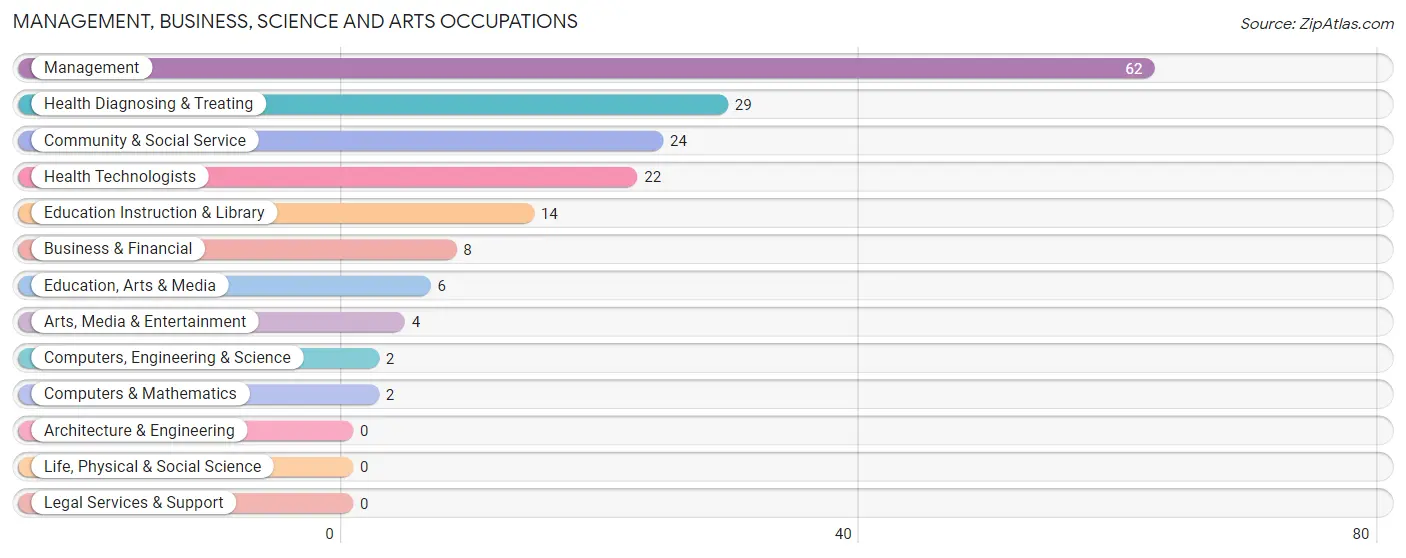
The most common Management, Business, Science and Arts occupations in Dufur are Management (62 | 17.8%), Health Diagnosing & Treating (29 | 8.3%), Community & Social Service (24 | 6.9%), Health Technologists (22 | 6.3%), and Education Instruction & Library (14 | 4.0%).
Management, Business, Science and Arts Occupations by Sex
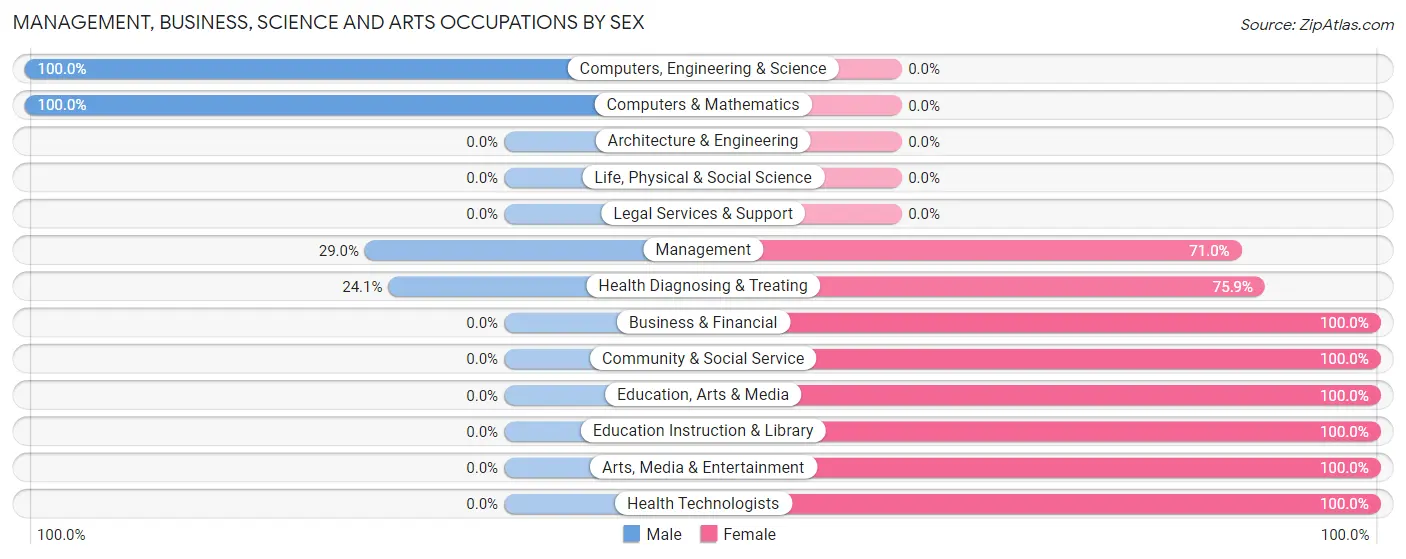
Within the Management, Business, Science and Arts occupations in Dufur, the most male-oriented occupations are Computers, Engineering & Science (100.0%), Computers & Mathematics (100.0%), and Management (29.0%), while the most female-oriented occupations are Business & Financial (100.0%), Community & Social Service (100.0%), and Education, Arts & Media (100.0%).
| Occupation | Male | Female |
| Management | 18 (29.0%) | 44 (71.0%) |
| Business & Financial | 0 (0.0%) | 8 (100.0%) |
| Computers, Engineering & Science | 2 (100.0%) | 0 (0.0%) |
| Computers & Mathematics | 2 (100.0%) | 0 (0.0%) |
| Architecture & Engineering | 0 (0.0%) | 0 (0.0%) |
| Life, Physical & Social Science | 0 (0.0%) | 0 (0.0%) |
| Community & Social Service | 0 (0.0%) | 24 (100.0%) |
| Education, Arts & Media | 0 (0.0%) | 6 (100.0%) |
| Legal Services & Support | 0 (0.0%) | 0 (0.0%) |
| Education Instruction & Library | 0 (0.0%) | 14 (100.0%) |
| Arts, Media & Entertainment | 0 (0.0%) | 4 (100.0%) |
| Health Diagnosing & Treating | 7 (24.1%) | 22 (75.9%) |
| Health Technologists | 0 (0.0%) | 22 (100.0%) |
| Total (Category) | 27 (21.6%) | 98 (78.4%) |
| Total (Overall) | 174 (49.9%) | 175 (50.1%) |
Services Occupations
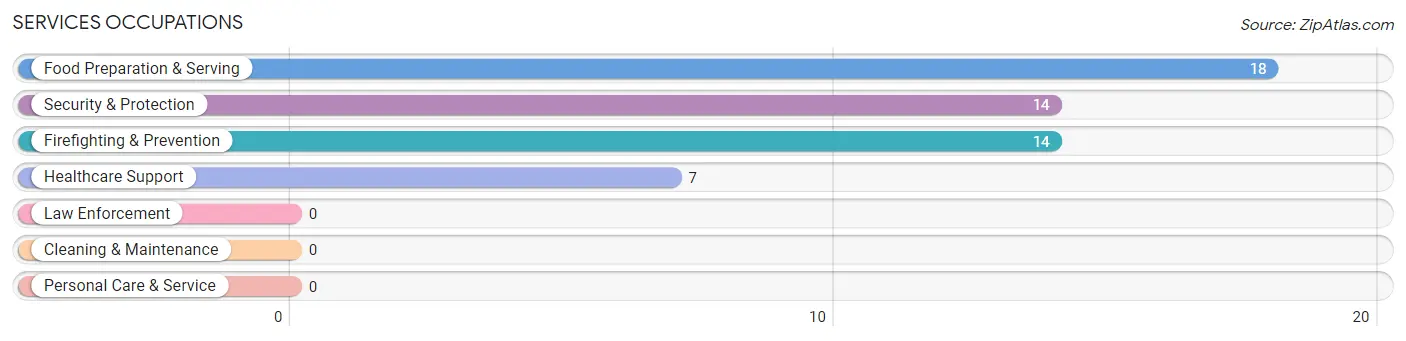
The most common Services occupations in Dufur are Food Preparation & Serving (18 | 5.2%), Security & Protection (14 | 4.0%), Firefighting & Prevention (14 | 4.0%), and Healthcare Support (7 | 2.0%).
Services Occupations by Sex
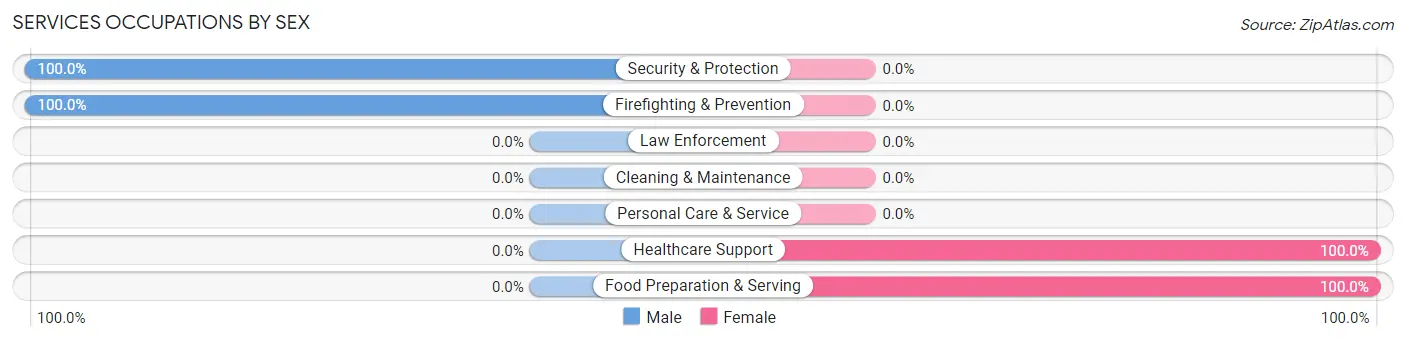
Within the Services occupations in Dufur, the most male-oriented occupations are Security & Protection (100.0%), and Firefighting & Prevention (100.0%), while the most female-oriented occupations are Healthcare Support (100.0%), and Food Preparation & Serving (100.0%).
| Occupation | Male | Female |
| Healthcare Support | 0 (0.0%) | 7 (100.0%) |
| Security & Protection | 14 (100.0%) | 0 (0.0%) |
| Firefighting & Prevention | 14 (100.0%) | 0 (0.0%) |
| Law Enforcement | 0 (0.0%) | 0 (0.0%) |
| Food Preparation & Serving | 0 (0.0%) | 18 (100.0%) |
| Cleaning & Maintenance | 0 (0.0%) | 0 (0.0%) |
| Personal Care & Service | 0 (0.0%) | 0 (0.0%) |
| Total (Category) | 14 (35.9%) | 25 (64.1%) |
| Total (Overall) | 174 (49.9%) | 175 (50.1%) |
Sales and Office Occupations
The most common Sales and Office occupations in Dufur are Sales & Related (57 | 16.3%), and Office & Administration (29 | 8.3%).
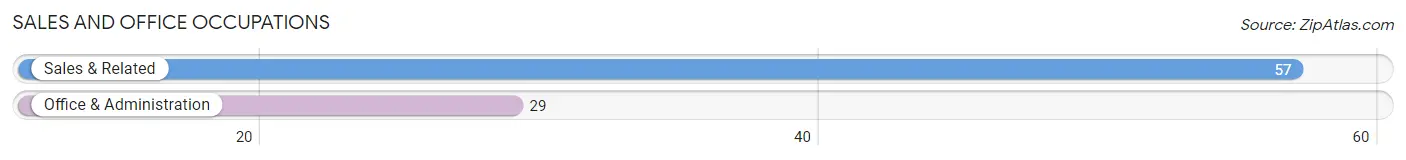
Sales and Office Occupations by Sex
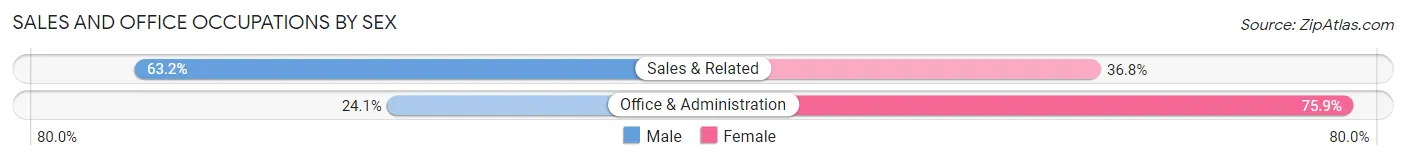
| Occupation | Male | Female |
| Sales & Related | 36 (63.2%) | 21 (36.8%) |
| Office & Administration | 7 (24.1%) | 22 (75.9%) |
| Total (Category) | 43 (50.0%) | 43 (50.0%) |
| Total (Overall) | 174 (49.9%) | 175 (50.1%) |
Natural Resources, Construction and Maintenance Occupations
The most common Natural Resources, Construction and Maintenance occupations in Dufur are Installation, Maintenance & Repair (30 | 8.6%), Farming, Fishing & Forestry (13 | 3.7%), and Construction & Extraction (12 | 3.4%).
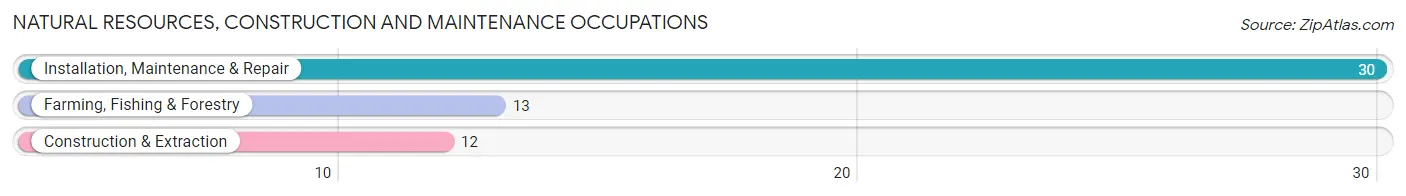
Natural Resources, Construction and Maintenance Occupations by Sex
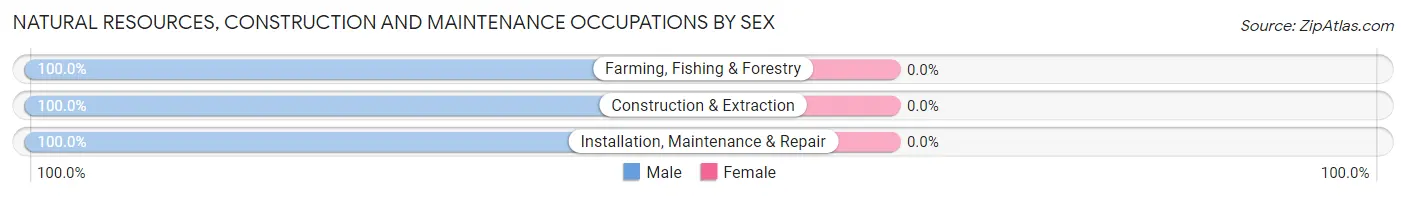
| Occupation | Male | Female |
| Farming, Fishing & Forestry | 13 (100.0%) | 0 (0.0%) |
| Construction & Extraction | 12 (100.0%) | 0 (0.0%) |
| Installation, Maintenance & Repair | 30 (100.0%) | 0 (0.0%) |
| Total (Category) | 55 (100.0%) | 0 (0.0%) |
| Total (Overall) | 174 (49.9%) | 175 (50.1%) |
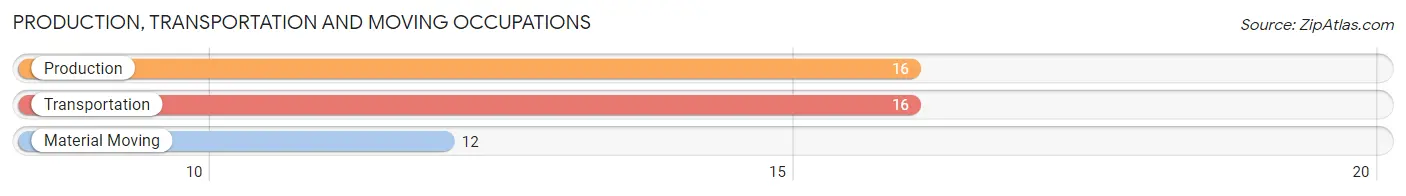
Production, Transportation and Moving Occupations
The most common Production, Transportation and Moving occupations in Dufur are Production (16 | 4.6%), Transportation (16 | 4.6%), and Material Moving (12 | 3.4%).
Production, Transportation and Moving Occupations by Sex
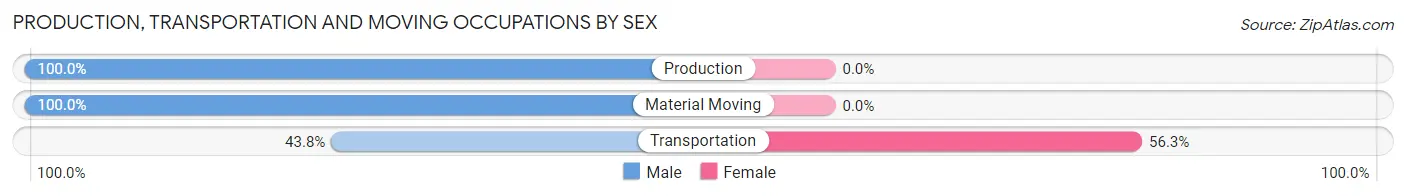
| Occupation | Male | Female |
| Production | 16 (100.0%) | 0 (0.0%) |
| Transportation | 7 (43.8%) | 9 (56.2%) |
| Material Moving | 12 (100.0%) | 0 (0.0%) |
| Total (Category) | 35 (79.5%) | 9 (20.4%) |
| Total (Overall) | 174 (49.9%) | 175 (50.1%) |
Employment Industries by Sex in Dufur
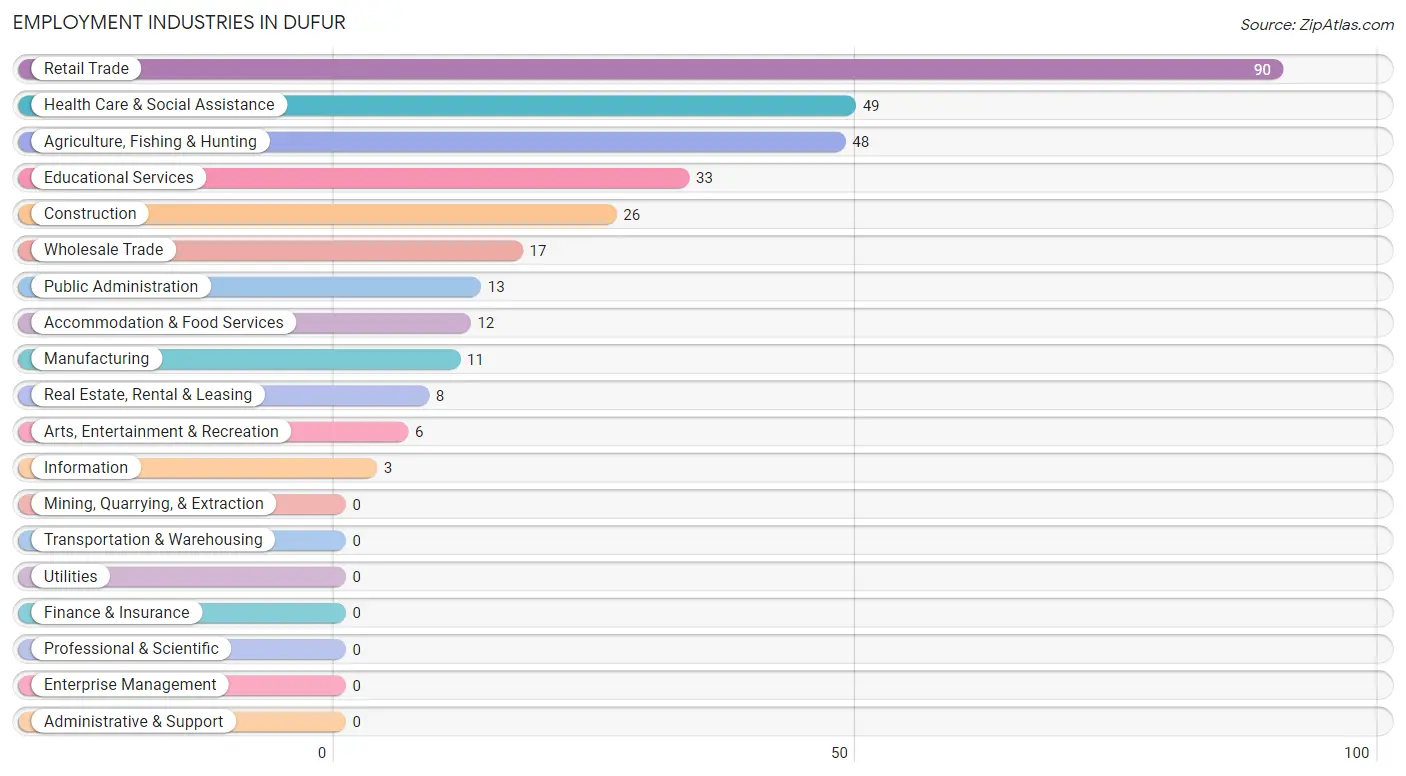
Employment Industries in Dufur
The major employment industries in Dufur include Retail Trade (90 | 25.8%), Health Care & Social Assistance (49 | 14.0%), Agriculture, Fishing & Hunting (48 | 13.8%), Educational Services (33 | 9.5%), and Construction (26 | 7.4%).
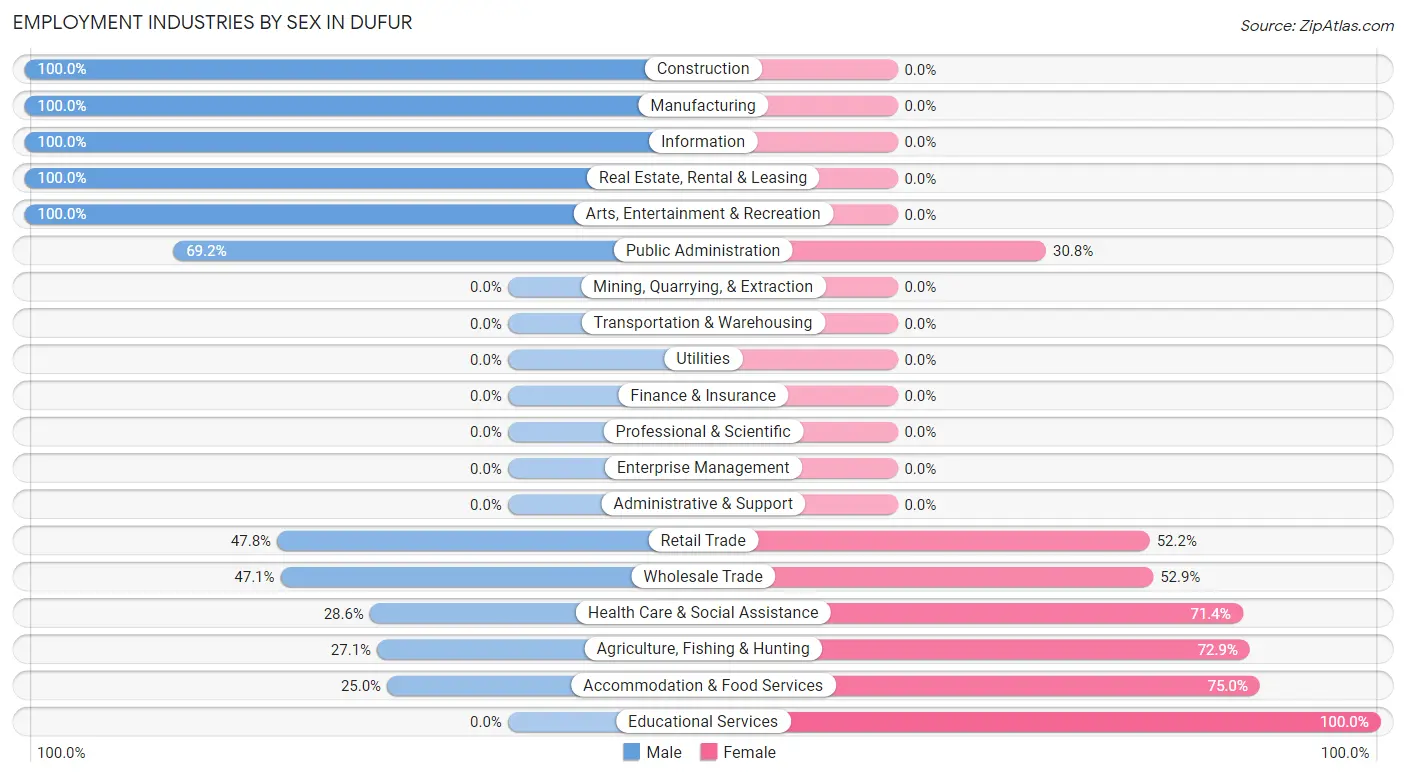
Employment Industries by Sex in Dufur
The Dufur industries that see more men than women are Construction (100.0%), Manufacturing (100.0%), and Information (100.0%), whereas the industries that tend to have a higher number of women are Educational Services (100.0%), Accommodation & Food Services (75.0%), and Agriculture, Fishing & Hunting (72.9%).
| Industry | Male | Female |
| Agriculture, Fishing & Hunting | 13 (27.1%) | 35 (72.9%) |
| Mining, Quarrying, & Extraction | 0 (0.0%) | 0 (0.0%) |
| Construction | 26 (100.0%) | 0 (0.0%) |
| Manufacturing | 11 (100.0%) | 0 (0.0%) |
| Wholesale Trade | 8 (47.1%) | 9 (52.9%) |
| Retail Trade | 43 (47.8%) | 47 (52.2%) |
| Transportation & Warehousing | 0 (0.0%) | 0 (0.0%) |
| Utilities | 0 (0.0%) | 0 (0.0%) |
| Information | 3 (100.0%) | 0 (0.0%) |
| Finance & Insurance | 0 (0.0%) | 0 (0.0%) |
| Real Estate, Rental & Leasing | 8 (100.0%) | 0 (0.0%) |
| Professional & Scientific | 0 (0.0%) | 0 (0.0%) |
| Enterprise Management | 0 (0.0%) | 0 (0.0%) |
| Administrative & Support | 0 (0.0%) | 0 (0.0%) |
| Educational Services | 0 (0.0%) | 33 (100.0%) |
| Health Care & Social Assistance | 14 (28.6%) | 35 (71.4%) |
| Arts, Entertainment & Recreation | 6 (100.0%) | 0 (0.0%) |
| Accommodation & Food Services | 3 (25.0%) | 9 (75.0%) |
| Public Administration | 9 (69.2%) | 4 (30.8%) |
| Total | 174 (49.9%) | 175 (50.1%) |
Education in Dufur
School Enrollment in Dufur
The most common levels of schooling among the 240 students in Dufur are elementary school (85 | 35.4%), middle school (51 | 21.2%), and college / undergraduate (39 | 16.3%).
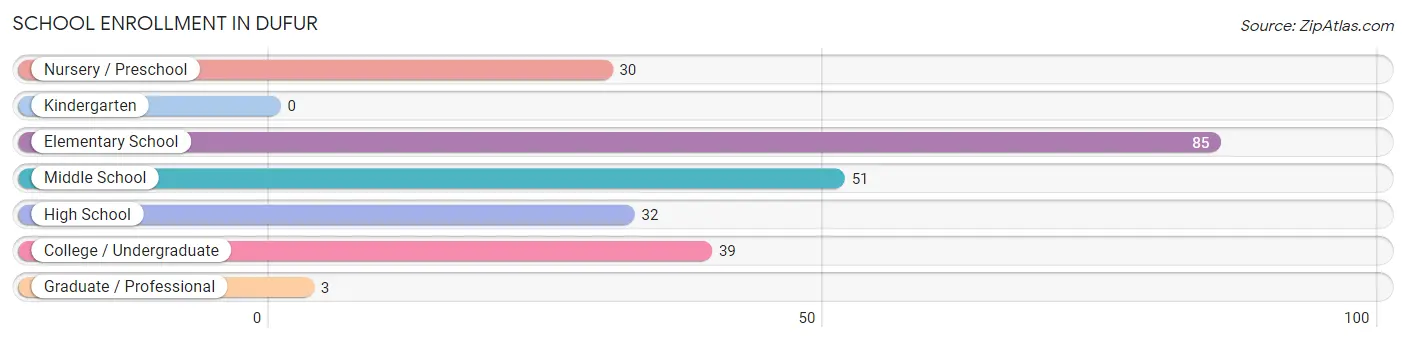
| School Level | # Students | % Students |
| Nursery / Preschool | 30 | 12.5% |
| Kindergarten | 0 | 0.0% |
| Elementary School | 85 | 35.4% |
| Middle School | 51 | 21.2% |
| High School | 32 | 13.3% |
| College / Undergraduate | 39 | 16.3% |
| Graduate / Professional | 3 | 1.3% |
| Total | 240 | 100.0% |
School Enrollment by Age by Funding Source in Dufur
Out of a total of 240 students who are enrolled in schools in Dufur, 9 (3.8%) attend a private institution, while the remaining 231 (96.2%) are enrolled in public schools. The age group of 35 years and over has the highest likelihood of being enrolled in private schools, with 3 (50.0% in the age bracket) enrolled. Conversely, the age group of 3 to 4 year olds has the lowest likelihood of being enrolled in a private school, with 30 (100.0% in the age bracket) attending a public institution.
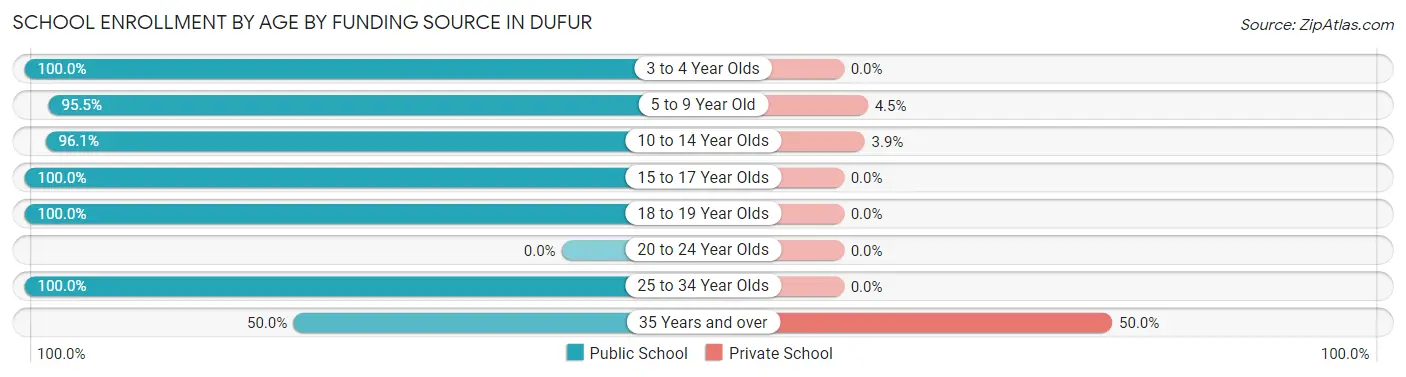
| Age Bracket | Public School | Private School |
| 3 to 4 Year Olds | 30 (100.0%) | 0 (0.0%) |
| 5 to 9 Year Old | 64 (95.5%) | 3 (4.5%) |
| 10 to 14 Year Olds | 74 (96.1%) | 3 (3.9%) |
| 15 to 17 Year Olds | 28 (100.0%) | 0 (0.0%) |
| 18 to 19 Year Olds | 12 (100.0%) | 0 (0.0%) |
| 20 to 24 Year Olds | 0 (0.0%) | 0 (0.0%) |
| 25 to 34 Year Olds | 20 (100.0%) | 0 (0.0%) |
| 35 Years and over | 3 (50.0%) | 3 (50.0%) |
| Total | 231 (96.3%) | 9 (3.8%) |
Educational Attainment by Field of Study in Dufur
Education (47 | 34.8%), science & technology (24 | 17.8%), arts & humanities (19 | 14.1%), communications (14 | 10.4%), and physical & health sciences (8 | 5.9%) are the most common fields of study among 135 individuals in Dufur who have obtained a bachelor's degree or higher.
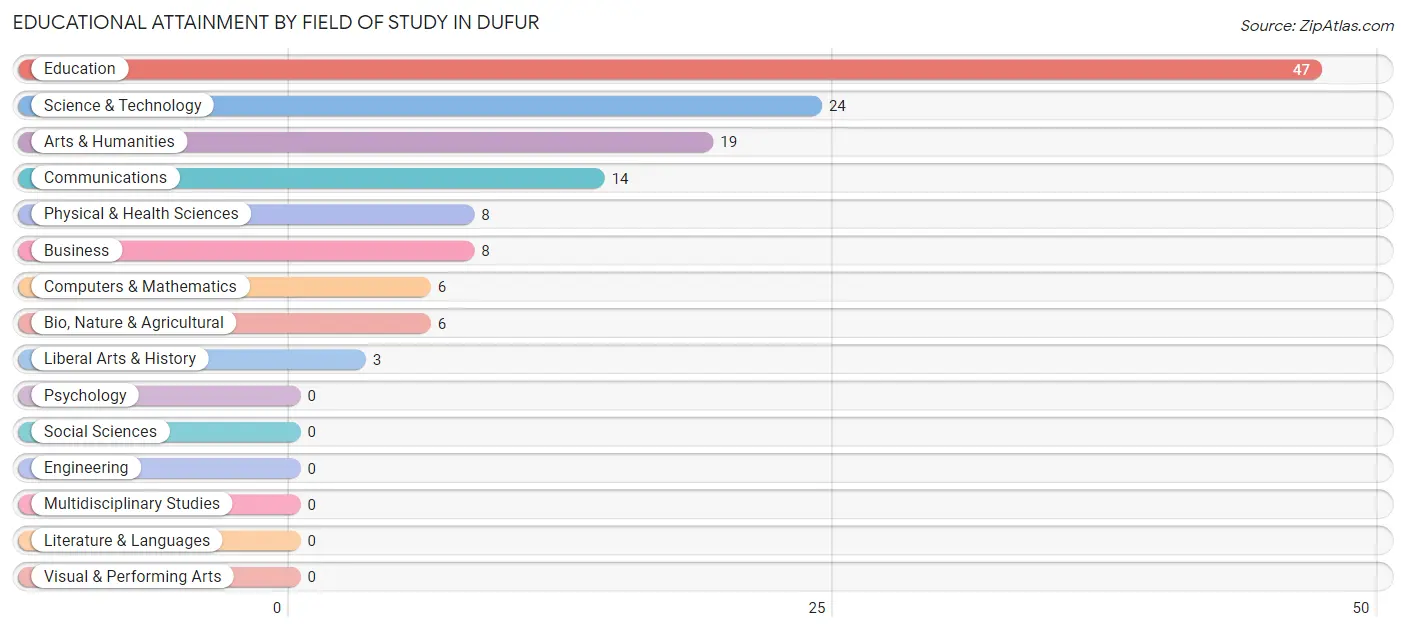
| Field of Study | # Graduates | % Graduates |
| Computers & Mathematics | 6 | 4.4% |
| Bio, Nature & Agricultural | 6 | 4.4% |
| Physical & Health Sciences | 8 | 5.9% |
| Psychology | 0 | 0.0% |
| Social Sciences | 0 | 0.0% |
| Engineering | 0 | 0.0% |
| Multidisciplinary Studies | 0 | 0.0% |
| Science & Technology | 24 | 17.8% |
| Business | 8 | 5.9% |
| Education | 47 | 34.8% |
| Literature & Languages | 0 | 0.0% |
| Liberal Arts & History | 3 | 2.2% |
| Visual & Performing Arts | 0 | 0.0% |
| Communications | 14 | 10.4% |
| Arts & Humanities | 19 | 14.1% |
| Total | 135 | 100.0% |
Transportation & Commute in Dufur
Vehicle Availability by Sex in Dufur
The most prevalent vehicle ownership categories in Dufur are males with 2 vehicles (78, accounting for 47.8%) and females with 2 vehicles (66, making up 44.6%).
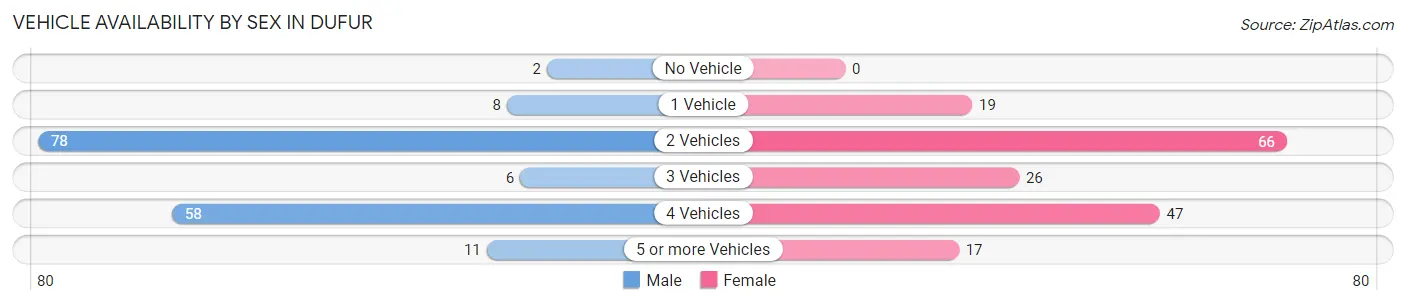
| Vehicles Available | Male | Female |
| No Vehicle | 2 (1.2%) | 0 (0.0%) |
| 1 Vehicle | 8 (4.9%) | 19 (10.9%) |
| 2 Vehicles | 78 (47.8%) | 66 (37.7%) |
| 3 Vehicles | 6 (3.7%) | 26 (14.9%) |
| 4 Vehicles | 58 (35.6%) | 47 (26.9%) |
| 5 or more Vehicles | 11 (6.8%) | 17 (9.7%) |
| Total | 163 (100.0%) | 175 (100.0%) |
Commute Time in Dufur
The most frequently occuring commute durations in Dufur are less than 5 minutes (88 commuters, 27.9%), 15 to 19 minutes (68 commuters, 21.5%), and 20 to 24 minutes (56 commuters, 17.7%).
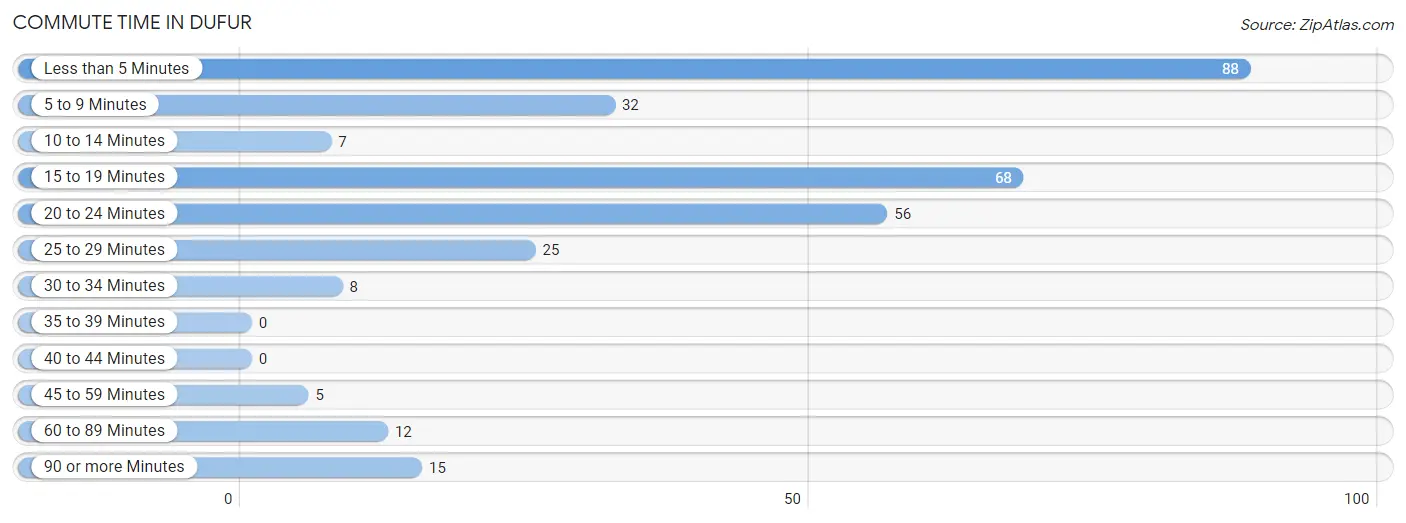
| Commute Time | # Commuters | % Commuters |
| Less than 5 Minutes | 88 | 27.9% |
| 5 to 9 Minutes | 32 | 10.1% |
| 10 to 14 Minutes | 7 | 2.2% |
| 15 to 19 Minutes | 68 | 21.5% |
| 20 to 24 Minutes | 56 | 17.7% |
| 25 to 29 Minutes | 25 | 7.9% |
| 30 to 34 Minutes | 8 | 2.5% |
| 35 to 39 Minutes | 0 | 0.0% |
| 40 to 44 Minutes | 0 | 0.0% |
| 45 to 59 Minutes | 5 | 1.6% |
| 60 to 89 Minutes | 12 | 3.8% |
| 90 or more Minutes | 15 | 4.8% |
Commute Time by Sex in Dufur
The most common commute times in Dufur are 20 to 24 minutes (41 commuters, 26.8%) for males and less than 5 minutes (48 commuters, 29.4%) for females.
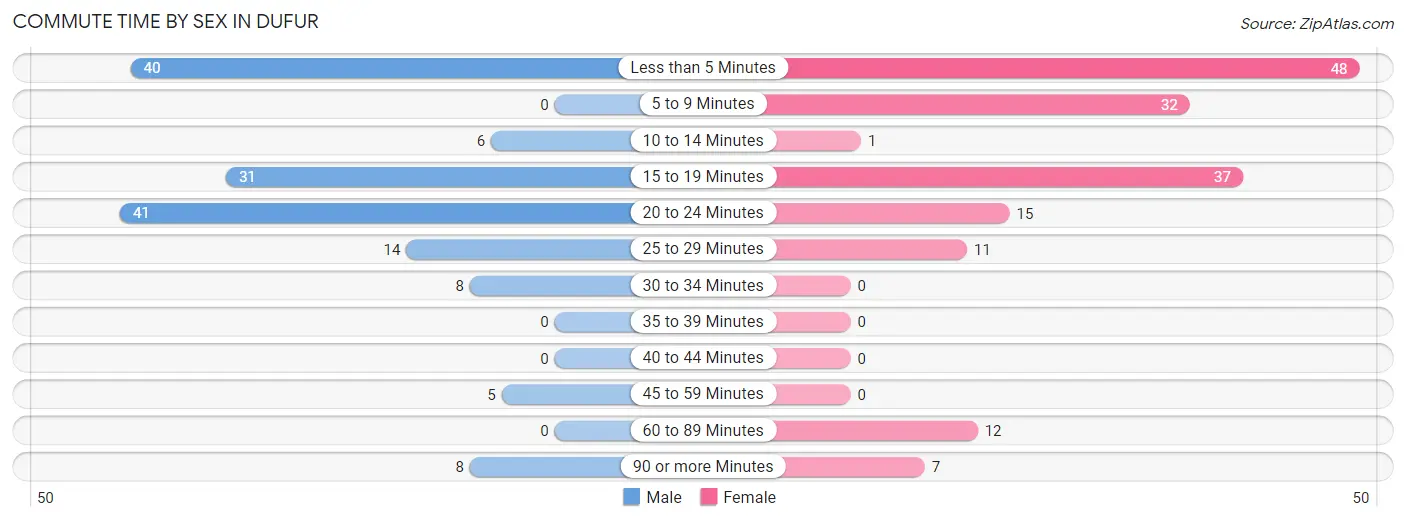
| Commute Time | Male | Female |
| Less than 5 Minutes | 40 (26.1%) | 48 (29.4%) |
| 5 to 9 Minutes | 0 (0.0%) | 32 (19.6%) |
| 10 to 14 Minutes | 6 (3.9%) | 1 (0.6%) |
| 15 to 19 Minutes | 31 (20.3%) | 37 (22.7%) |
| 20 to 24 Minutes | 41 (26.8%) | 15 (9.2%) |
| 25 to 29 Minutes | 14 (9.1%) | 11 (6.8%) |
| 30 to 34 Minutes | 8 (5.2%) | 0 (0.0%) |
| 35 to 39 Minutes | 0 (0.0%) | 0 (0.0%) |
| 40 to 44 Minutes | 0 (0.0%) | 0 (0.0%) |
| 45 to 59 Minutes | 5 (3.3%) | 0 (0.0%) |
| 60 to 89 Minutes | 0 (0.0%) | 12 (7.4%) |
| 90 or more Minutes | 8 (5.2%) | 7 (4.3%) |
Time of Departure to Work by Sex in Dufur
The most frequent times of departure to work in Dufur are 6:30 AM to 6:59 AM (32, 20.9%) for males and 8:30 AM to 8:59 AM (36, 22.1%) for females.
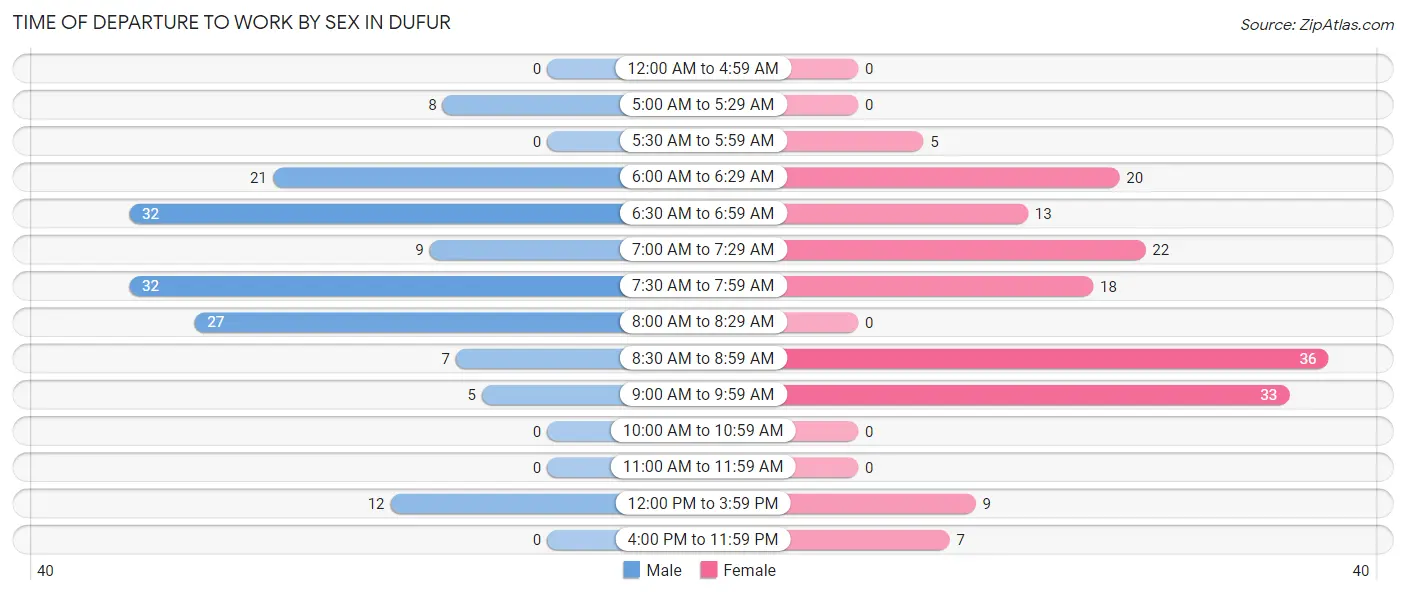
| Time of Departure | Male | Female |
| 12:00 AM to 4:59 AM | 0 (0.0%) | 0 (0.0%) |
| 5:00 AM to 5:29 AM | 8 (5.2%) | 0 (0.0%) |
| 5:30 AM to 5:59 AM | 0 (0.0%) | 5 (3.1%) |
| 6:00 AM to 6:29 AM | 21 (13.7%) | 20 (12.3%) |
| 6:30 AM to 6:59 AM | 32 (20.9%) | 13 (8.0%) |
| 7:00 AM to 7:29 AM | 9 (5.9%) | 22 (13.5%) |
| 7:30 AM to 7:59 AM | 32 (20.9%) | 18 (11.0%) |
| 8:00 AM to 8:29 AM | 27 (17.6%) | 0 (0.0%) |
| 8:30 AM to 8:59 AM | 7 (4.6%) | 36 (22.1%) |
| 9:00 AM to 9:59 AM | 5 (3.3%) | 33 (20.3%) |
| 10:00 AM to 10:59 AM | 0 (0.0%) | 0 (0.0%) |
| 11:00 AM to 11:59 AM | 0 (0.0%) | 0 (0.0%) |
| 12:00 PM to 3:59 PM | 12 (7.8%) | 9 (5.5%) |
| 4:00 PM to 11:59 PM | 0 (0.0%) | 7 (4.3%) |
| Total | 153 (100.0%) | 163 (100.0%) |
Housing Occupancy in Dufur
Occupancy by Ownership in Dufur
Of the total 351 dwellings in Dufur, owner-occupied units account for 235 (66.9%), while renter-occupied units make up 116 (33.1%).
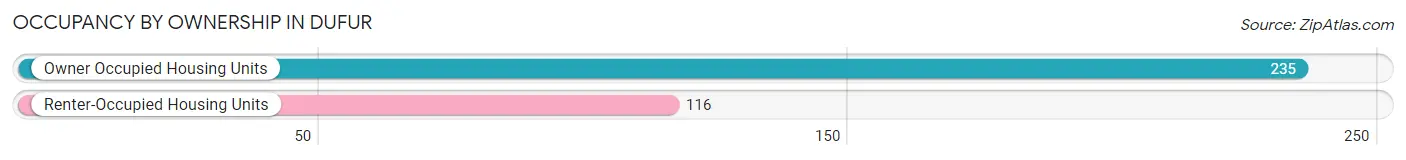
| Occupancy | # Housing Units | % Housing Units |
| Owner Occupied Housing Units | 235 | 66.9% |
| Renter-Occupied Housing Units | 116 | 33.1% |
| Total Occupied Housing Units | 351 | 100.0% |
Occupancy by Household Size in Dufur
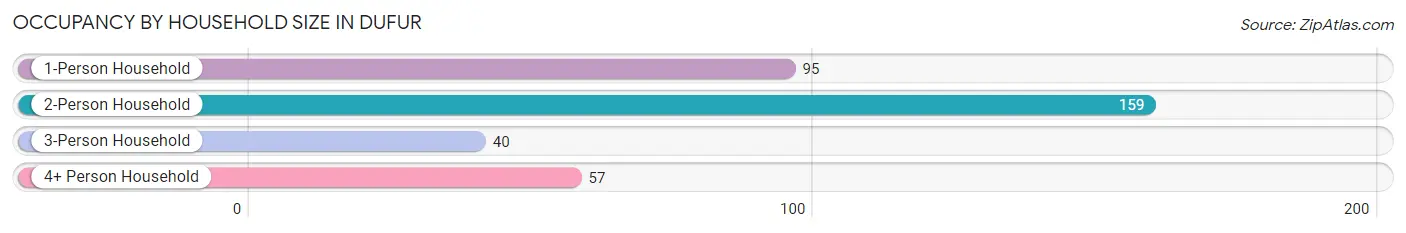
| Household Size | # Housing Units | % Housing Units |
| 1-Person Household | 95 | 27.1% |
| 2-Person Household | 159 | 45.3% |
| 3-Person Household | 40 | 11.4% |
| 4+ Person Household | 57 | 16.2% |
| Total Housing Units | 351 | 100.0% |
Occupancy by Ownership by Household Size in Dufur
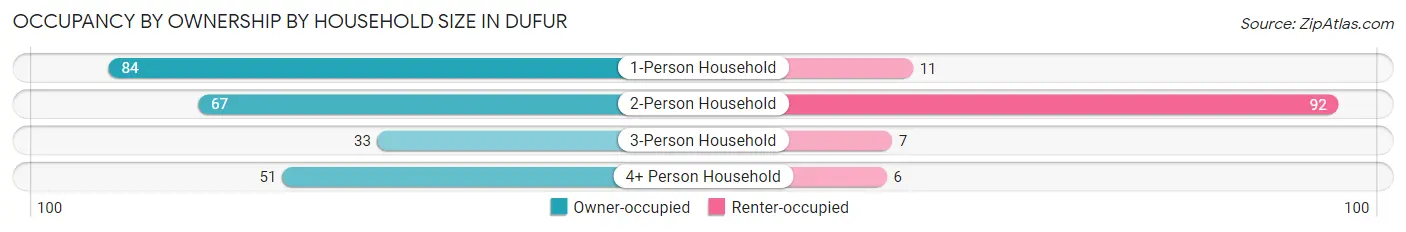
| Household Size | Owner-occupied | Renter-occupied |
| 1-Person Household | 84 (88.4%) | 11 (11.6%) |
| 2-Person Household | 67 (42.1%) | 92 (57.9%) |
| 3-Person Household | 33 (82.5%) | 7 (17.5%) |
| 4+ Person Household | 51 (89.5%) | 6 (10.5%) |
| Total Housing Units | 235 (66.9%) | 116 (33.1%) |
Occupancy by Educational Attainment in Dufur
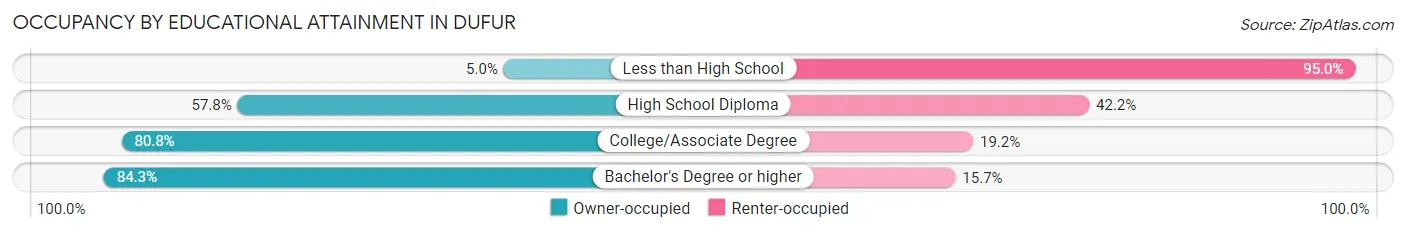
| Household Size | Owner-occupied | Renter-occupied |
| Less than High School | 2 (5.0%) | 38 (95.0%) |
| High School Diploma | 52 (57.8%) | 38 (42.2%) |
| College/Associate Degree | 122 (80.8%) | 29 (19.2%) |
| Bachelor's Degree or higher | 59 (84.3%) | 11 (15.7%) |
Occupancy by Age of Householder in Dufur
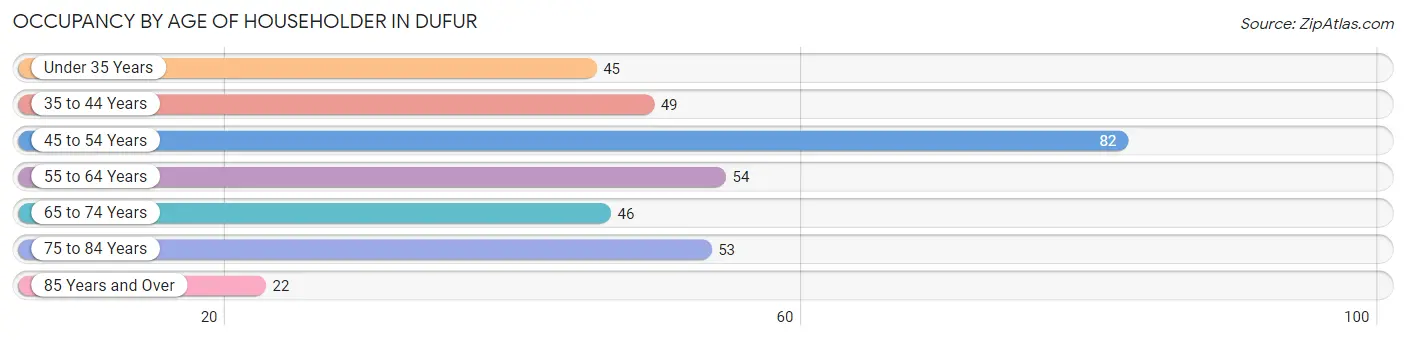
| Age Bracket | # Households | % Households |
| Under 35 Years | 45 | 12.8% |
| 35 to 44 Years | 49 | 14.0% |
| 45 to 54 Years | 82 | 23.4% |
| 55 to 64 Years | 54 | 15.4% |
| 65 to 74 Years | 46 | 13.1% |
| 75 to 84 Years | 53 | 15.1% |
| 85 Years and Over | 22 | 6.3% |
| Total | 351 | 100.0% |
Housing Finances in Dufur
Median Income by Occupancy in Dufur
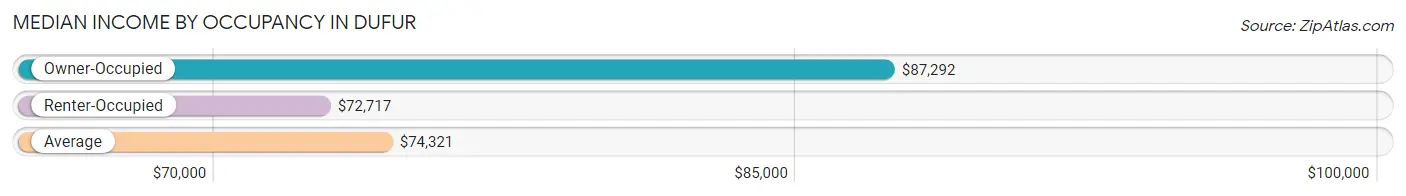
| Occupancy Type | # Households | Median Income |
| Owner-Occupied | 235 (66.9%) | $87,292 |
| Renter-Occupied | 116 (33.1%) | $72,717 |
| Average | 351 (100.0%) | $74,321 |
Occupancy by Householder Income Bracket in Dufur
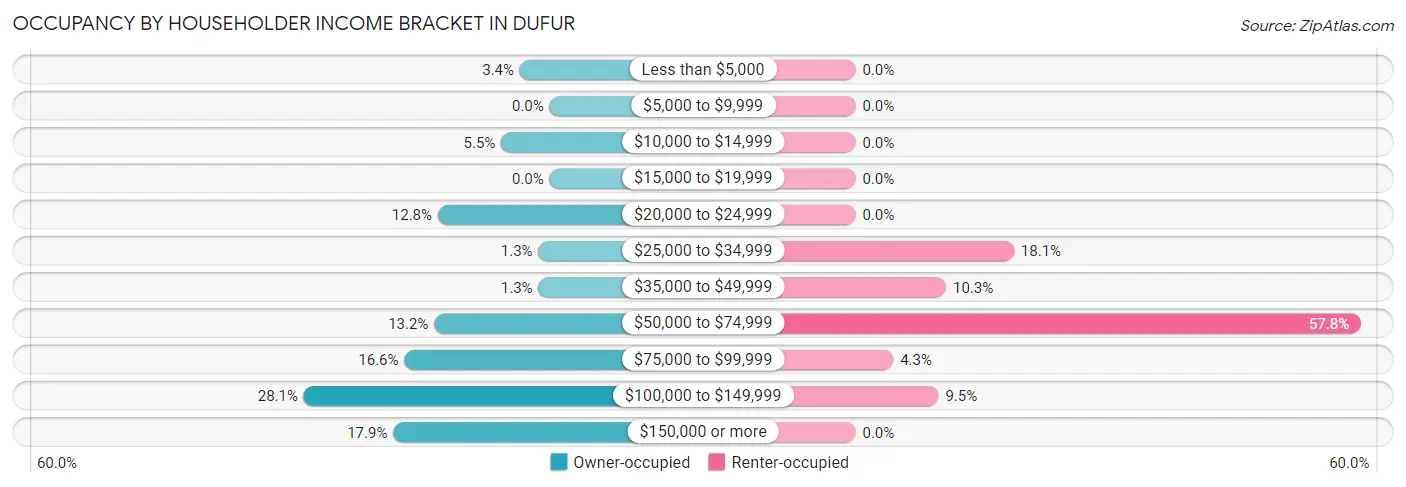
| Income Bracket | Owner-occupied | Renter-occupied |
| Less than $5,000 | 8 (3.4%) | 0 (0.0%) |
| $5,000 to $9,999 | 0 (0.0%) | 0 (0.0%) |
| $10,000 to $14,999 | 13 (5.5%) | 0 (0.0%) |
| $15,000 to $19,999 | 0 (0.0%) | 0 (0.0%) |
| $20,000 to $24,999 | 30 (12.8%) | 0 (0.0%) |
| $25,000 to $34,999 | 3 (1.3%) | 21 (18.1%) |
| $35,000 to $49,999 | 3 (1.3%) | 12 (10.3%) |
| $50,000 to $74,999 | 31 (13.2%) | 67 (57.8%) |
| $75,000 to $99,999 | 39 (16.6%) | 5 (4.3%) |
| $100,000 to $149,999 | 66 (28.1%) | 11 (9.5%) |
| $150,000 or more | 42 (17.9%) | 0 (0.0%) |
| Total | 235 (100.0%) | 116 (100.0%) |
Monthly Housing Cost Tiers in Dufur
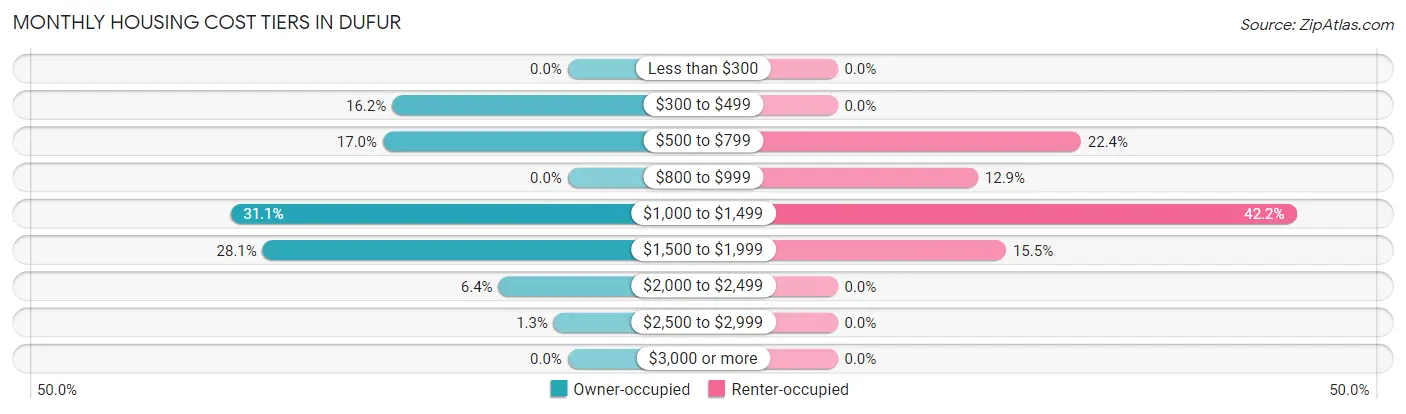
| Monthly Cost | Owner-occupied | Renter-occupied |
| Less than $300 | 0 (0.0%) | 0 (0.0%) |
| $300 to $499 | 38 (16.2%) | 0 (0.0%) |
| $500 to $799 | 40 (17.0%) | 26 (22.4%) |
| $800 to $999 | 0 (0.0%) | 15 (12.9%) |
| $1,000 to $1,499 | 73 (31.1%) | 49 (42.2%) |
| $1,500 to $1,999 | 66 (28.1%) | 18 (15.5%) |
| $2,000 to $2,499 | 15 (6.4%) | 0 (0.0%) |
| $2,500 to $2,999 | 3 (1.3%) | 0 (0.0%) |
| $3,000 or more | 0 (0.0%) | 0 (0.0%) |
| Total | 235 (100.0%) | 116 (100.0%) |
Physical Housing Characteristics in Dufur
Housing Structures in Dufur
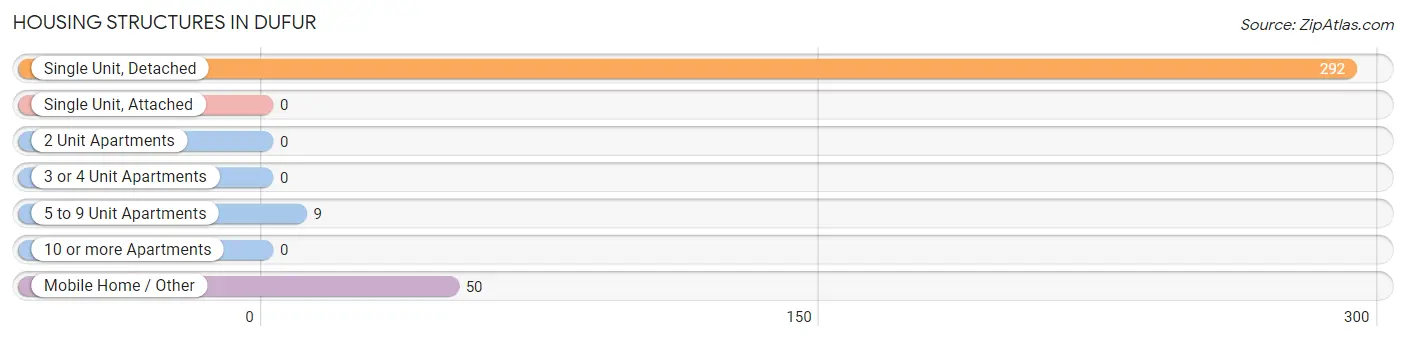
| Structure Type | # Housing Units | % Housing Units |
| Single Unit, Detached | 292 | 83.2% |
| Single Unit, Attached | 0 | 0.0% |
| 2 Unit Apartments | 0 | 0.0% |
| 3 or 4 Unit Apartments | 0 | 0.0% |
| 5 to 9 Unit Apartments | 9 | 2.6% |
| 10 or more Apartments | 0 | 0.0% |
| Mobile Home / Other | 50 | 14.2% |
| Total | 351 | 100.0% |
Housing Structures by Occupancy in Dufur
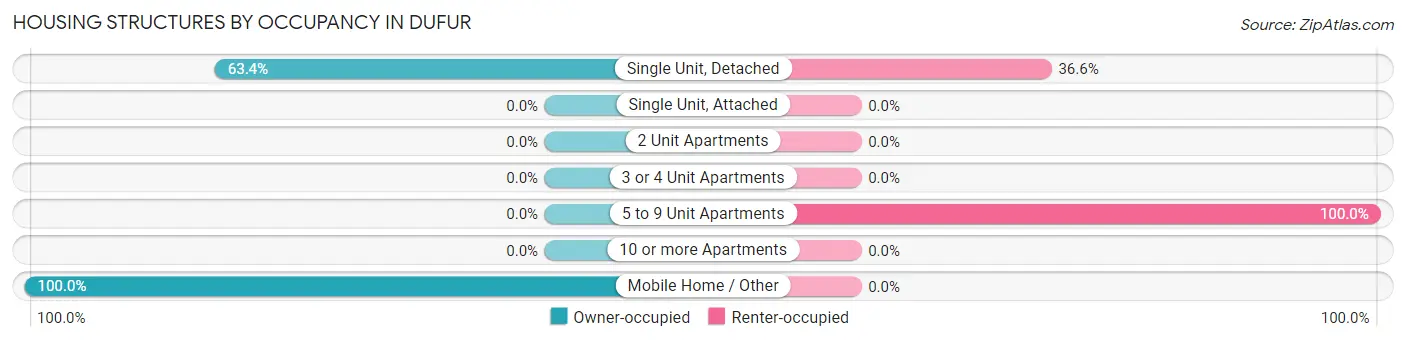
| Structure Type | Owner-occupied | Renter-occupied |
| Single Unit, Detached | 185 (63.4%) | 107 (36.6%) |
| Single Unit, Attached | 0 (0.0%) | 0 (0.0%) |
| 2 Unit Apartments | 0 (0.0%) | 0 (0.0%) |
| 3 or 4 Unit Apartments | 0 (0.0%) | 0 (0.0%) |
| 5 to 9 Unit Apartments | 0 (0.0%) | 9 (100.0%) |
| 10 or more Apartments | 0 (0.0%) | 0 (0.0%) |
| Mobile Home / Other | 50 (100.0%) | 0 (0.0%) |
| Total | 235 (66.9%) | 116 (33.1%) |
Housing Structures by Number of Rooms in Dufur
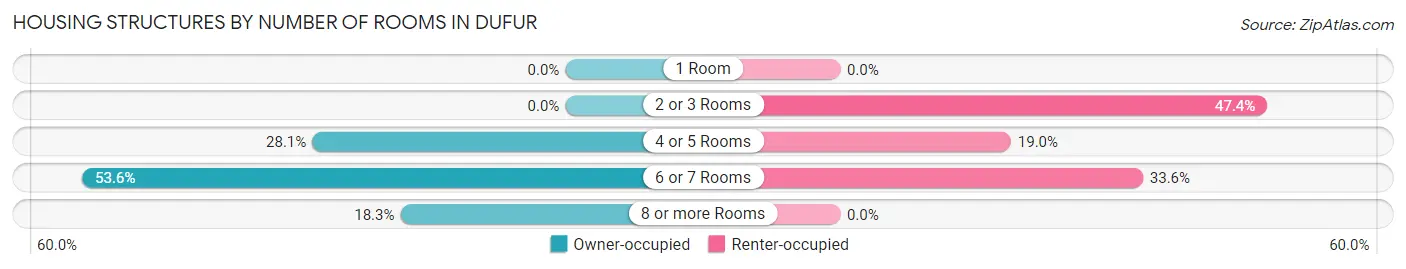
| Number of Rooms | Owner-occupied | Renter-occupied |
| 1 Room | 0 (0.0%) | 0 (0.0%) |
| 2 or 3 Rooms | 0 (0.0%) | 55 (47.4%) |
| 4 or 5 Rooms | 66 (28.1%) | 22 (19.0%) |
| 6 or 7 Rooms | 126 (53.6%) | 39 (33.6%) |
| 8 or more Rooms | 43 (18.3%) | 0 (0.0%) |
| Total | 235 (100.0%) | 116 (100.0%) |
Housing Structure by Heating Type in Dufur
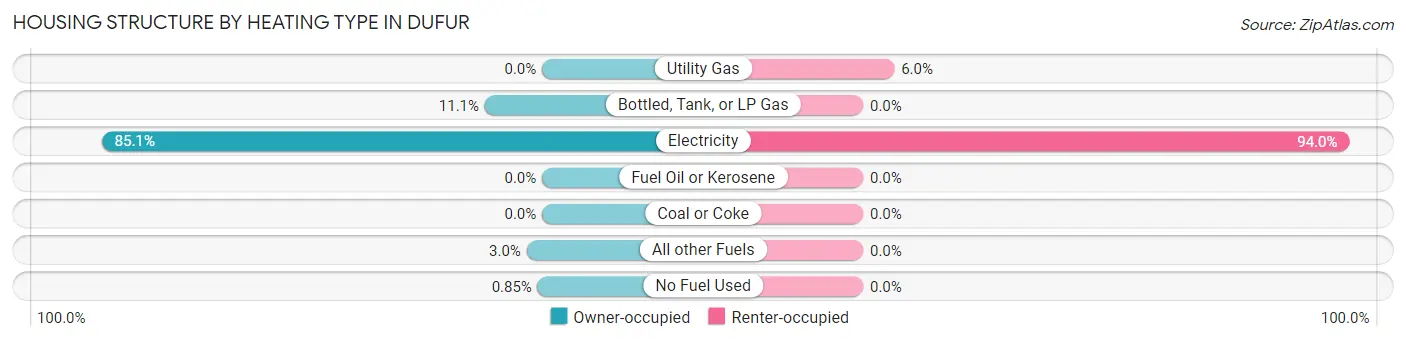
| Heating Type | Owner-occupied | Renter-occupied |
| Utility Gas | 0 (0.0%) | 7 (6.0%) |
| Bottled, Tank, or LP Gas | 26 (11.1%) | 0 (0.0%) |
| Electricity | 200 (85.1%) | 109 (94.0%) |
| Fuel Oil or Kerosene | 0 (0.0%) | 0 (0.0%) |
| Coal or Coke | 0 (0.0%) | 0 (0.0%) |
| All other Fuels | 7 (3.0%) | 0 (0.0%) |
| No Fuel Used | 2 (0.9%) | 0 (0.0%) |
| Total | 235 (100.0%) | 116 (100.0%) |
Household Vehicle Usage in Dufur
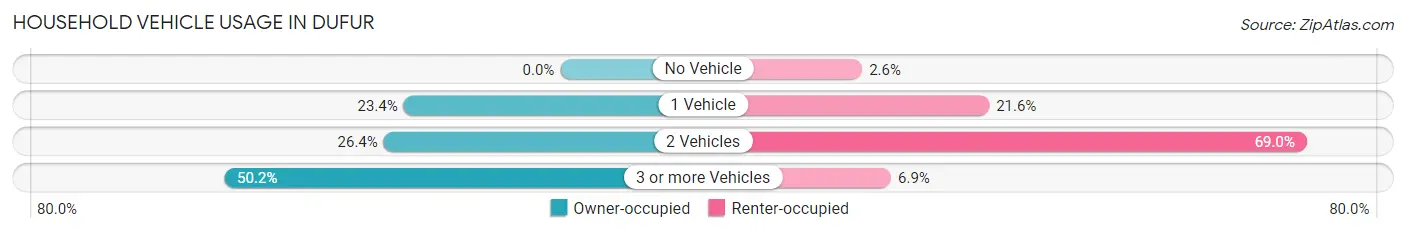
| Vehicles per Household | Owner-occupied | Renter-occupied |
| No Vehicle | 0 (0.0%) | 3 (2.6%) |
| 1 Vehicle | 55 (23.4%) | 25 (21.5%) |
| 2 Vehicles | 62 (26.4%) | 80 (69.0%) |
| 3 or more Vehicles | 118 (50.2%) | 8 (6.9%) |
| Total | 235 (100.0%) | 116 (100.0%) |
Real Estate & Mortgages in Dufur
Real Estate and Mortgage Overview in Dufur
| Characteristic | Without Mortgage | With Mortgage |
| Housing Units | 78 | 157 |
| Median Property Value | $243,100 | $328,800 |
| Median Household Income | $63,571 | $35 |
| Monthly Housing Costs | $503 | $0 |
| Real Estate Taxes | $2,552 | $0 |
Property Value by Mortgage Status in Dufur
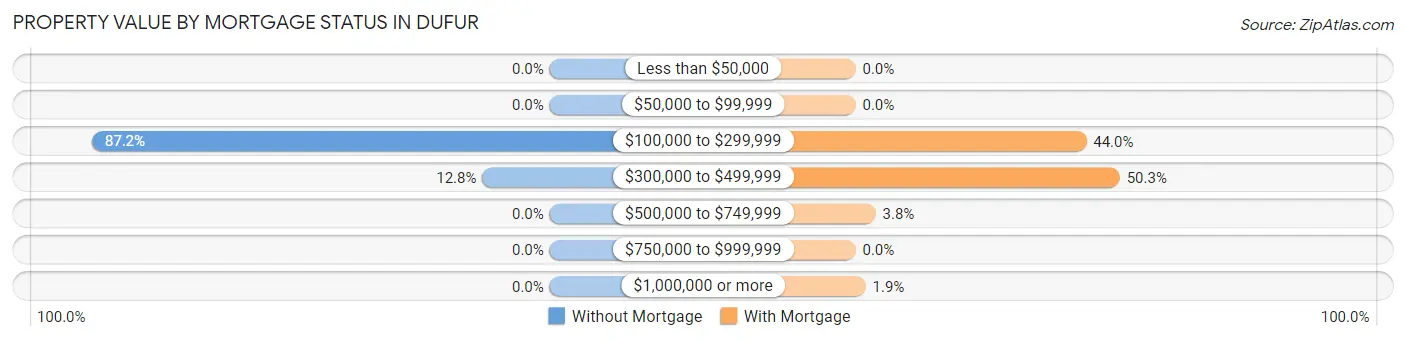
| Property Value | Without Mortgage | With Mortgage |
| Less than $50,000 | 0 (0.0%) | 0 (0.0%) |
| $50,000 to $99,999 | 0 (0.0%) | 0 (0.0%) |
| $100,000 to $299,999 | 68 (87.2%) | 69 (44.0%) |
| $300,000 to $499,999 | 10 (12.8%) | 79 (50.3%) |
| $500,000 to $749,999 | 0 (0.0%) | 6 (3.8%) |
| $750,000 to $999,999 | 0 (0.0%) | 0 (0.0%) |
| $1,000,000 or more | 0 (0.0%) | 3 (1.9%) |
| Total | 78 (100.0%) | 157 (100.0%) |
Household Income by Mortgage Status in Dufur
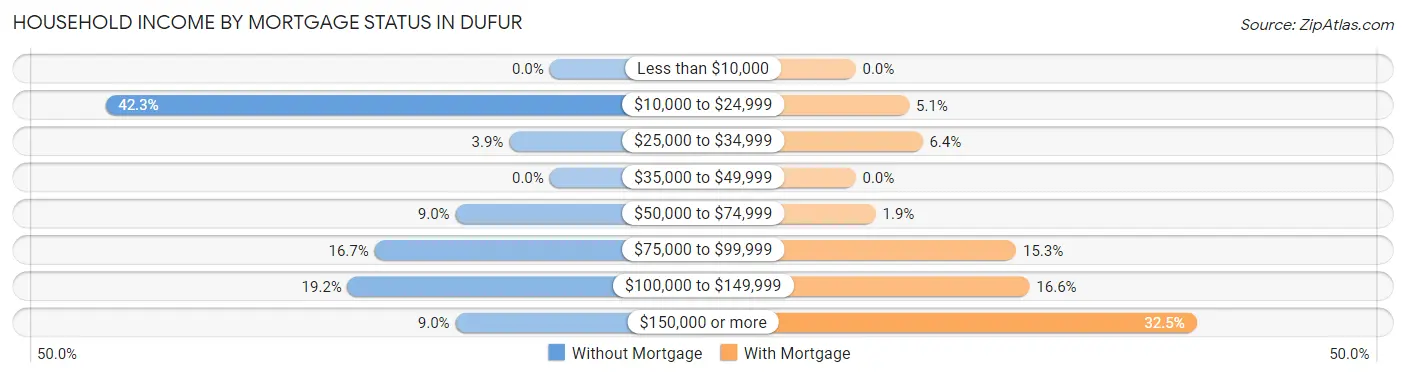
| Household Income | Without Mortgage | With Mortgage |
| Less than $10,000 | 0 (0.0%) | 0 (0.0%) |
| $10,000 to $24,999 | 33 (42.3%) | 8 (5.1%) |
| $25,000 to $34,999 | 3 (3.8%) | 10 (6.4%) |
| $35,000 to $49,999 | 0 (0.0%) | 0 (0.0%) |
| $50,000 to $74,999 | 7 (9.0%) | 3 (1.9%) |
| $75,000 to $99,999 | 13 (16.7%) | 24 (15.3%) |
| $100,000 to $149,999 | 15 (19.2%) | 26 (16.6%) |
| $150,000 or more | 7 (9.0%) | 51 (32.5%) |
| Total | 78 (100.0%) | 157 (100.0%) |
Property Value to Household Income Ratio in Dufur
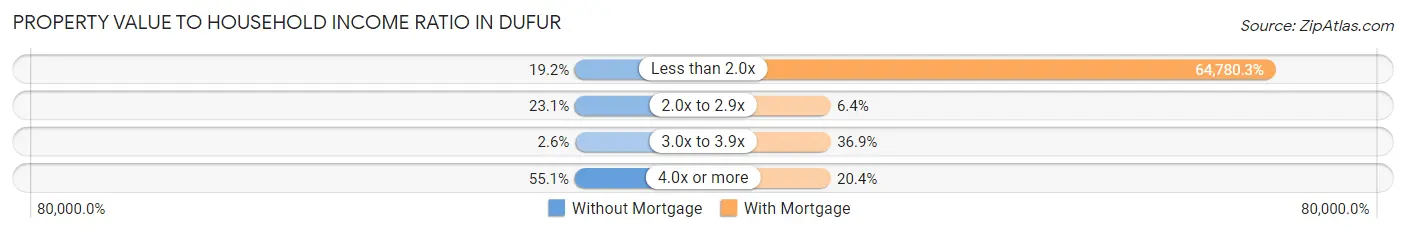
| Value-to-Income Ratio | Without Mortgage | With Mortgage |
| Less than 2.0x | 15 (19.2%) | 101,705 (64,780.3%) |
| 2.0x to 2.9x | 18 (23.1%) | 10 (6.4%) |
| 3.0x to 3.9x | 2 (2.6%) | 58 (36.9%) |
| 4.0x or more | 43 (55.1%) | 32 (20.4%) |
| Total | 78 (100.0%) | 157 (100.0%) |
Real Estate Taxes by Mortgage Status in Dufur
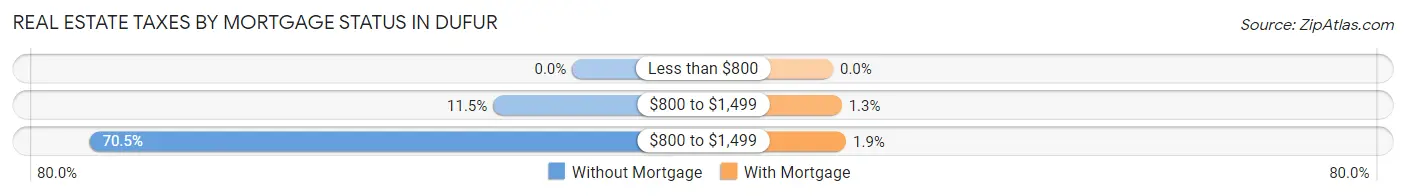
| Property Taxes | Without Mortgage | With Mortgage |
| Less than $800 | 0 (0.0%) | 0 (0.0%) |
| $800 to $1,499 | 9 (11.5%) | 2 (1.3%) |
| $800 to $1,499 | 55 (70.5%) | 3 (1.9%) |
| Total | 78 (100.0%) | 157 (100.0%) |
Health & Disability in Dufur
Health Insurance Coverage by Age in Dufur
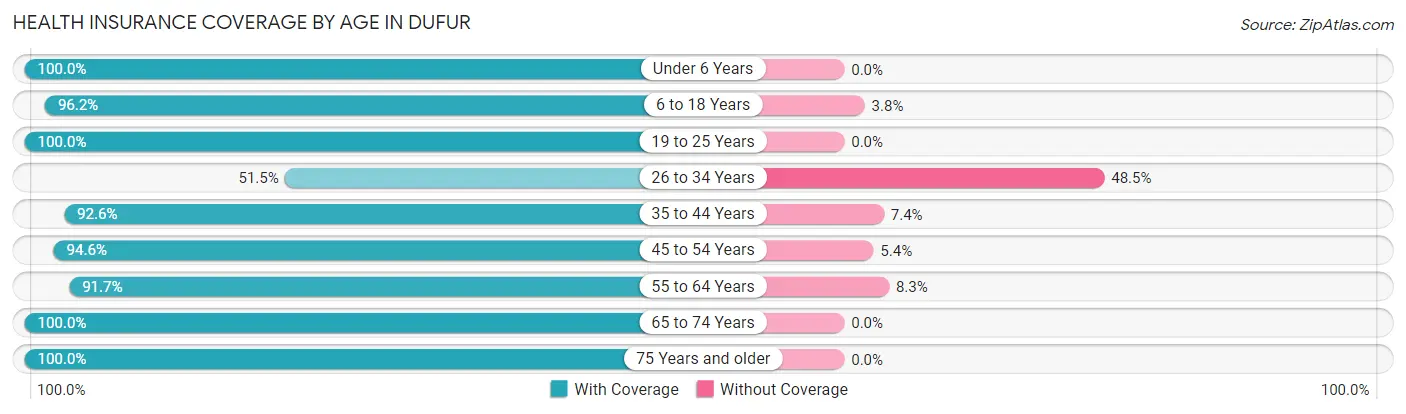
| Age Bracket | With Coverage | Without Coverage |
| Under 6 Years | 79 (100.0%) | 0 (0.0%) |
| 6 to 18 Years | 177 (96.2%) | 7 (3.8%) |
| 19 to 25 Years | 67 (100.0%) | 0 (0.0%) |
| 26 to 34 Years | 34 (51.5%) | 32 (48.5%) |
| 35 to 44 Years | 113 (92.6%) | 9 (7.4%) |
| 45 to 54 Years | 87 (94.6%) | 5 (5.4%) |
| 55 to 64 Years | 88 (91.7%) | 8 (8.3%) |
| 65 to 74 Years | 67 (100.0%) | 0 (0.0%) |
| 75 Years and older | 84 (100.0%) | 0 (0.0%) |
| Total | 796 (92.9%) | 61 (7.1%) |
Health Insurance Coverage by Citizenship Status in Dufur
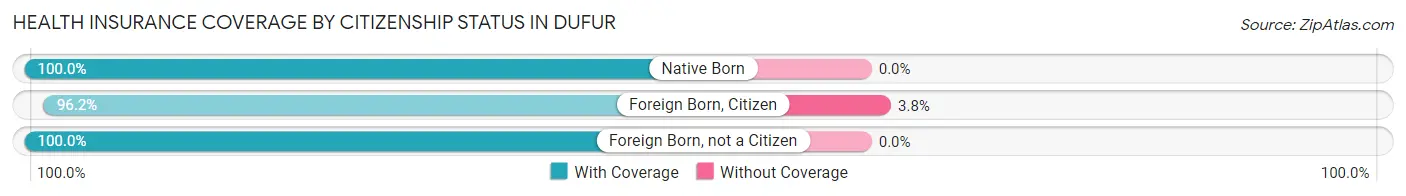
| Citizenship Status | With Coverage | Without Coverage |
| Native Born | 79 (100.0%) | 0 (0.0%) |
| Foreign Born, Citizen | 177 (96.2%) | 7 (3.8%) |
| Foreign Born, not a Citizen | 67 (100.0%) | 0 (0.0%) |
Health Insurance Coverage by Household Income in Dufur
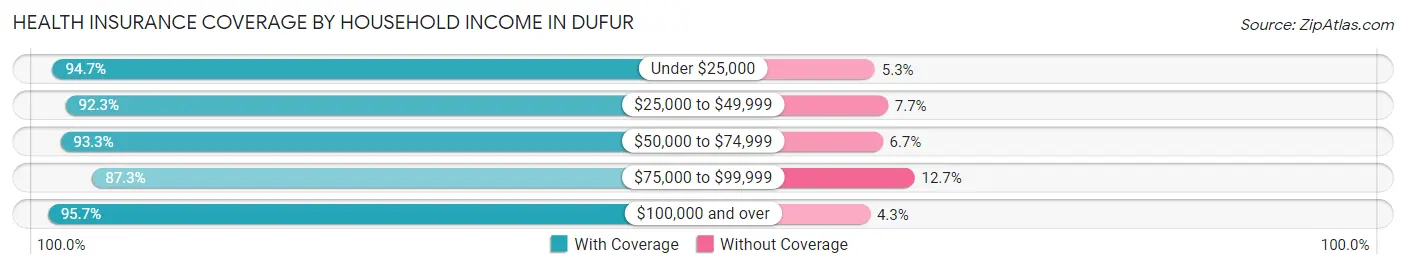
| Household Income | With Coverage | Without Coverage |
| Under $25,000 | 54 (94.7%) | 3 (5.3%) |
| $25,000 to $49,999 | 72 (92.3%) | 6 (7.7%) |
| $50,000 to $74,999 | 167 (93.3%) | 12 (6.7%) |
| $75,000 to $99,999 | 172 (87.3%) | 25 (12.7%) |
| $100,000 and over | 331 (95.7%) | 15 (4.3%) |
Public vs Private Health Insurance Coverage by Age in Dufur
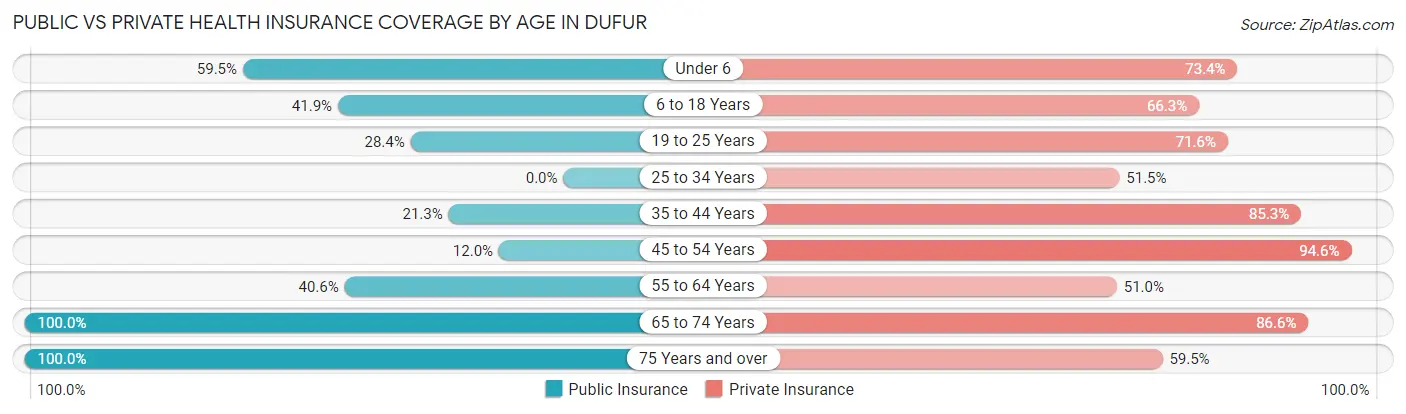
| Age Bracket | Public Insurance | Private Insurance |
| Under 6 | 47 (59.5%) | 58 (73.4%) |
| 6 to 18 Years | 77 (41.8%) | 122 (66.3%) |
| 19 to 25 Years | 19 (28.4%) | 48 (71.6%) |
| 25 to 34 Years | 0 (0.0%) | 34 (51.5%) |
| 35 to 44 Years | 26 (21.3%) | 104 (85.3%) |
| 45 to 54 Years | 11 (12.0%) | 87 (94.6%) |
| 55 to 64 Years | 39 (40.6%) | 49 (51.0%) |
| 65 to 74 Years | 67 (100.0%) | 58 (86.6%) |
| 75 Years and over | 84 (100.0%) | 50 (59.5%) |
| Total | 370 (43.2%) | 610 (71.2%) |
Disability Status by Sex by Age in Dufur
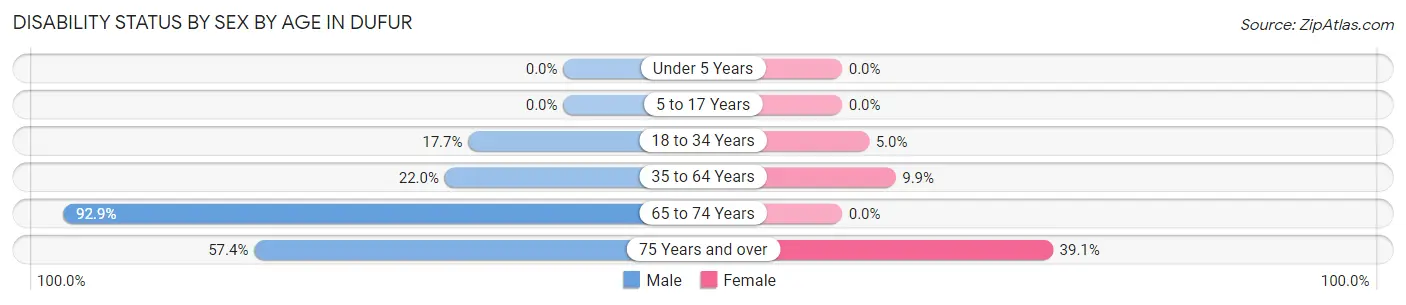
| Age Bracket | Male | Female |
| Under 5 Years | 0 (0.0%) | 0 (0.0%) |
| 5 to 17 Years | 0 (0.0%) | 0 (0.0%) |
| 18 to 34 Years | 15 (17.6%) | 3 (5.0%) |
| 35 to 64 Years | 35 (22.0%) | 15 (9.9%) |
| 65 to 74 Years | 52 (92.9%) | 0 (0.0%) |
| 75 Years and over | 35 (57.4%) | 9 (39.1%) |
Disability Class by Sex by Age in Dufur
Disability Class: Hearing Difficulty
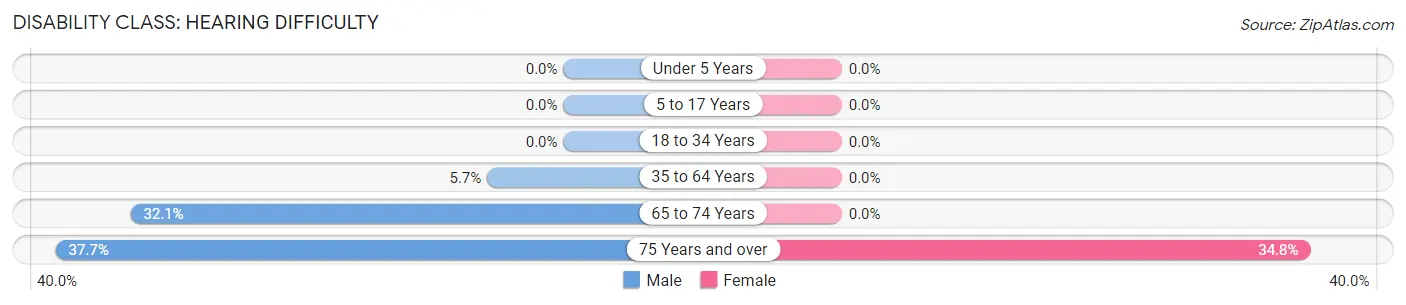
| Age Bracket | Male | Female |
| Under 5 Years | 0 (0.0%) | 0 (0.0%) |
| 5 to 17 Years | 0 (0.0%) | 0 (0.0%) |
| 18 to 34 Years | 0 (0.0%) | 0 (0.0%) |
| 35 to 64 Years | 9 (5.7%) | 0 (0.0%) |
| 65 to 74 Years | 18 (32.1%) | 0 (0.0%) |
| 75 Years and over | 23 (37.7%) | 8 (34.8%) |
Disability Class: Vision Difficulty
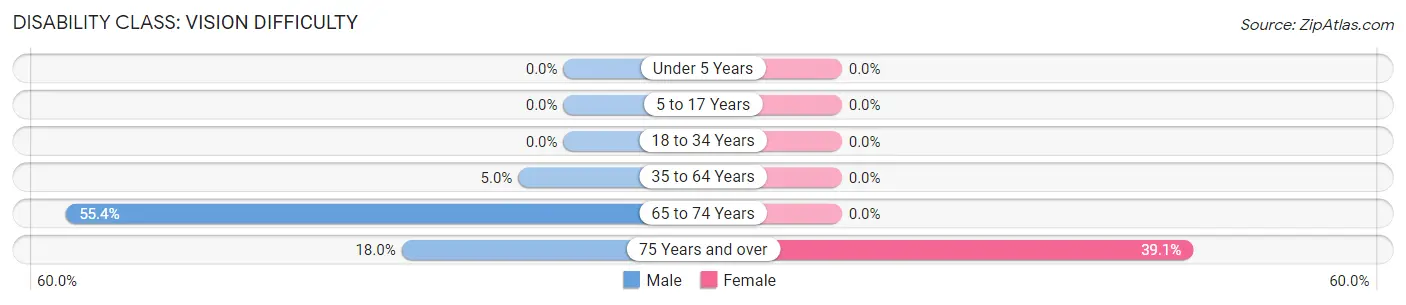
| Age Bracket | Male | Female |
| Under 5 Years | 0 (0.0%) | 0 (0.0%) |
| 5 to 17 Years | 0 (0.0%) | 0 (0.0%) |
| 18 to 34 Years | 0 (0.0%) | 0 (0.0%) |
| 35 to 64 Years | 8 (5.0%) | 0 (0.0%) |
| 65 to 74 Years | 31 (55.4%) | 0 (0.0%) |
| 75 Years and over | 11 (18.0%) | 9 (39.1%) |
Disability Class: Cognitive Difficulty
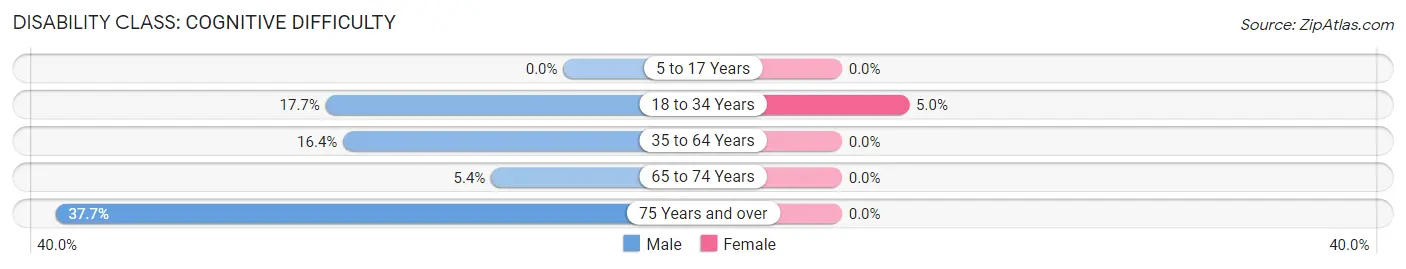
| Age Bracket | Male | Female |
| 5 to 17 Years | 0 (0.0%) | 0 (0.0%) |
| 18 to 34 Years | 15 (17.6%) | 3 (5.0%) |
| 35 to 64 Years | 26 (16.4%) | 0 (0.0%) |
| 65 to 74 Years | 3 (5.4%) | 0 (0.0%) |
| 75 Years and over | 23 (37.7%) | 0 (0.0%) |
Disability Class: Ambulatory Difficulty
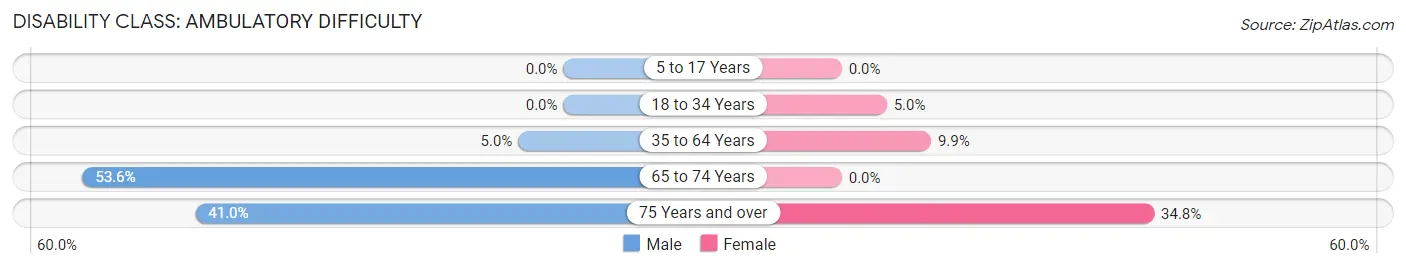
| Age Bracket | Male | Female |
| 5 to 17 Years | 0 (0.0%) | 0 (0.0%) |
| 18 to 34 Years | 0 (0.0%) | 3 (5.0%) |
| 35 to 64 Years | 8 (5.0%) | 15 (9.9%) |
| 65 to 74 Years | 30 (53.6%) | 0 (0.0%) |
| 75 Years and over | 25 (41.0%) | 8 (34.8%) |
Disability Class: Self-Care Difficulty
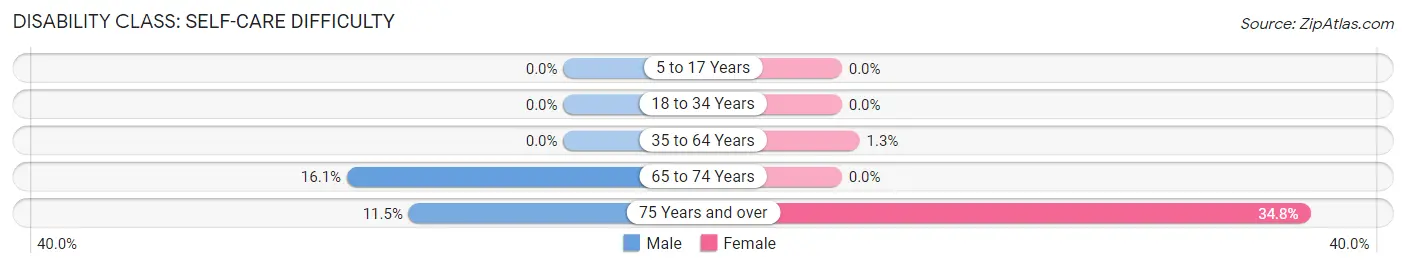
| Age Bracket | Male | Female |
| 5 to 17 Years | 0 (0.0%) | 0 (0.0%) |
| 18 to 34 Years | 0 (0.0%) | 0 (0.0%) |
| 35 to 64 Years | 0 (0.0%) | 2 (1.3%) |
| 65 to 74 Years | 9 (16.1%) | 0 (0.0%) |
| 75 Years and over | 7 (11.5%) | 8 (34.8%) |
Technology Access in Dufur
Computing Device Access in Dufur
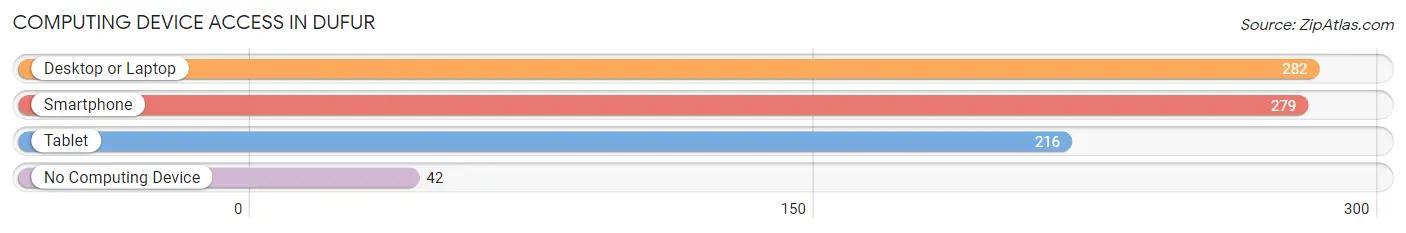
| Device Type | # Households | % Households |
| Desktop or Laptop | 282 | 80.3% |
| Smartphone | 279 | 79.5% |
| Tablet | 216 | 61.5% |
| No Computing Device | 42 | 12.0% |
| Total | 351 | 100.0% |
Internet Access in Dufur
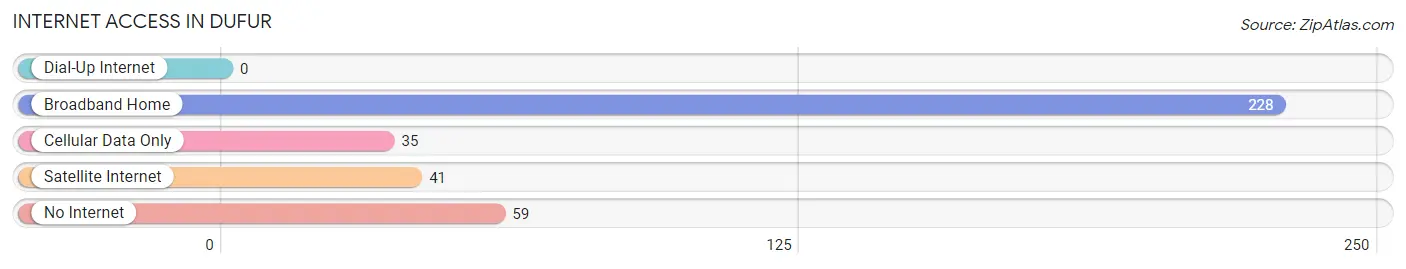
| Internet Type | # Households | % Households |
| Dial-Up Internet | 0 | 0.0% |
| Broadband Home | 228 | 65.0% |
| Cellular Data Only | 35 | 10.0% |
| Satellite Internet | 41 | 11.7% |
| No Internet | 59 | 16.8% |
| Total | 351 | 100.0% |
Dufur Summary
Dufur is a small unincorporated community located in Wasco County, Oregon, United States. It is situated in the foothills of the Cascade Mountains, approximately 20 miles east of The Dalles. The population of Dufur was estimated to be 590 in 2019.
History
Dufur was founded in 1871 by William Dufur, a pioneer from Missouri. He was the first settler in the area and established a homestead on the banks of the Deschutes River. The town was originally called Dufurville, but the name was changed to Dufur in 1887.
The town grew rapidly in the late 19th century, becoming a major shipping point for the surrounding agricultural region. The Oregon Central Railroad arrived in 1882, connecting Dufur to The Dalles and Portland. The railroad also brought tourists to the area, and Dufur became a popular destination for fishing and hunting.
In the early 20th century, Dufur was a thriving community with a population of over 1,000. The town had several stores, a hotel, a bank, a post office, and a school. The town also had a newspaper, the Dufur Times, which was published from 1906 to 1915.
Geography
Dufur is located in the foothills of the Cascade Mountains, approximately 20 miles east of The Dalles. The town is situated on the banks of the Deschutes River, which flows through the area. The surrounding area is mostly agricultural, with rolling hills and open fields.
The climate in Dufur is semi-arid, with hot summers and cold winters. The average annual temperature is 54°F, and the average annual precipitation is 11.5 inches.
Economy
The economy of Dufur is largely based on agriculture. The surrounding area is home to several farms and ranches, which produce a variety of crops and livestock. The town also has several small businesses, including a grocery store, a hardware store, and a restaurant.
The town is also home to several wineries, which produce a variety of wines from local grapes. The nearby Deschutes River is a popular destination for fishing and rafting, and the area is also home to several campgrounds and recreational areas.
Demographics
The population of Dufur was estimated to be 590 in 2019. The town is predominantly white, with a small Hispanic population. The median household income is $45,000, and the median home value is $175,000. The town has a poverty rate of 15.3%, and the unemployment rate is 4.2%.
Conclusion
Dufur is a small unincorporated community located in Wasco County, Oregon. It was founded in 1871 by William Dufur, and the town grew rapidly in the late 19th century. The economy of Dufur is largely based on agriculture, and the town is also home to several wineries and recreational areas. The population of Dufur was estimated to be 590 in 2019, and the median household income is $45,000.
Common Questions
What is Per Capita Income in Dufur?
Per Capita income in Dufur is $32,701.
What is the Median Family Income in Dufur?
Median Family Income in Dufur is $95,417.
What is the Median Household income in Dufur?
Median Household Income in Dufur is $74,321.
What is Income or Wage Gap in Dufur?
Income or Wage Gap in Dufur is 6.8%.
Women in Dufur earn 93.2 cents for every dollar earned by a man.
What is Inequality or Gini Index in Dufur?
Inequality or Gini Index in Dufur is 0.35.
What is the Total Population of Dufur?
Total Population of Dufur is 857.
What is the Total Male Population of Dufur?
Total Male Population of Dufur is 530.
What is the Total Female Population of Dufur?
Total Female Population of Dufur is 327.
What is the Ratio of Males per 100 Females in Dufur?
There are 162.08 Males per 100 Females in Dufur.
What is the Ratio of Females per 100 Males in Dufur?
There are 61.70 Females per 100 Males in Dufur.
What is the Median Population Age in Dufur?
Median Population Age in Dufur is 37.0 Years.
What is the Average Family Size in Dufur
Average Family Size in Dufur is 3.0 People.
What is the Average Household Size in Dufur
Average Household Size in Dufur is 2.4 People.
How Large is the Labor Force in Dufur?
There are 361 People in the Labor Forcein in Dufur.
What is the Percentage of People in the Labor Force in Dufur?
56.9% of People are in the Labor Force in Dufur.
What is the Unemployment Rate in Dufur?
Unemployment Rate in Dufur is 3.3%.