Detroit, OR Map & Demographics
Detroit Map
Detroit Overview
$49,761
PER CAPITA INCOME
$120,625
AVG FAMILY INCOME
$58,750
AVG HOUSEHOLD INCOME
0.47
INEQUALITY / GINI INDEX
102
TOTAL POPULATION
56
MALE POPULATION
46
FEMALE POPULATION
121.74
MALES / 100 FEMALES
82.14
FEMALES / 100 MALES
59.5
MEDIAN AGE
2.8
AVG FAMILY SIZE
1.9
AVG HOUSEHOLD SIZE
40
LABOR FORCE [ PEOPLE ]
47.6%
PERCENT IN LABOR FORCE
Detroit Zip Codes
Detroit Area Codes
Income in Detroit
Income Overview in Detroit
Per Capita Income in Detroit is $49,761, while median incomes of families and households are $120,625 and $58,750 respectively.
| Characteristic | Number | Measure |
| Per Capita Income | 102 | $49,761 |
| Median Family Income | 27 | $120,625 |
| Mean Family Income | 27 | $117,500 |
| Median Household Income | 53 | $58,750 |
| Mean Household Income | 53 | $94,981 |
| Income Deficit | 27 | $0 |
| Wage / Income Gap (%) | 102 | 0.00% |
| Wage / Income Gap ($) | 102 | 100.00¢ per $1 |
| Gini / Inequality Index | 102 | 0.47 |
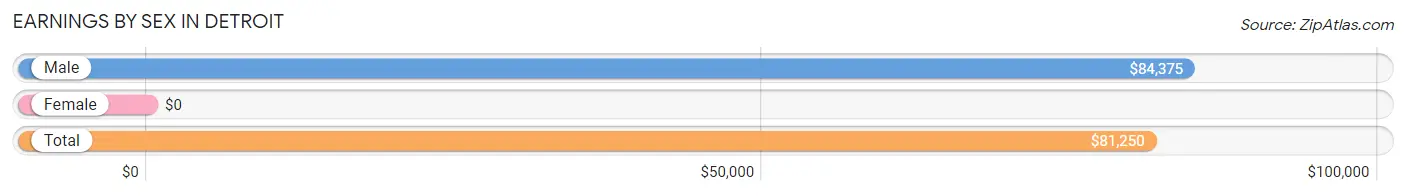
Earnings by Sex in Detroit
| Sex | Number | Average Earnings |
| Male | 25 (62.5%) | $84,375 |
| Female | 15 (37.5%) | $0 |
| Total | 40 (100.0%) | $81,250 |
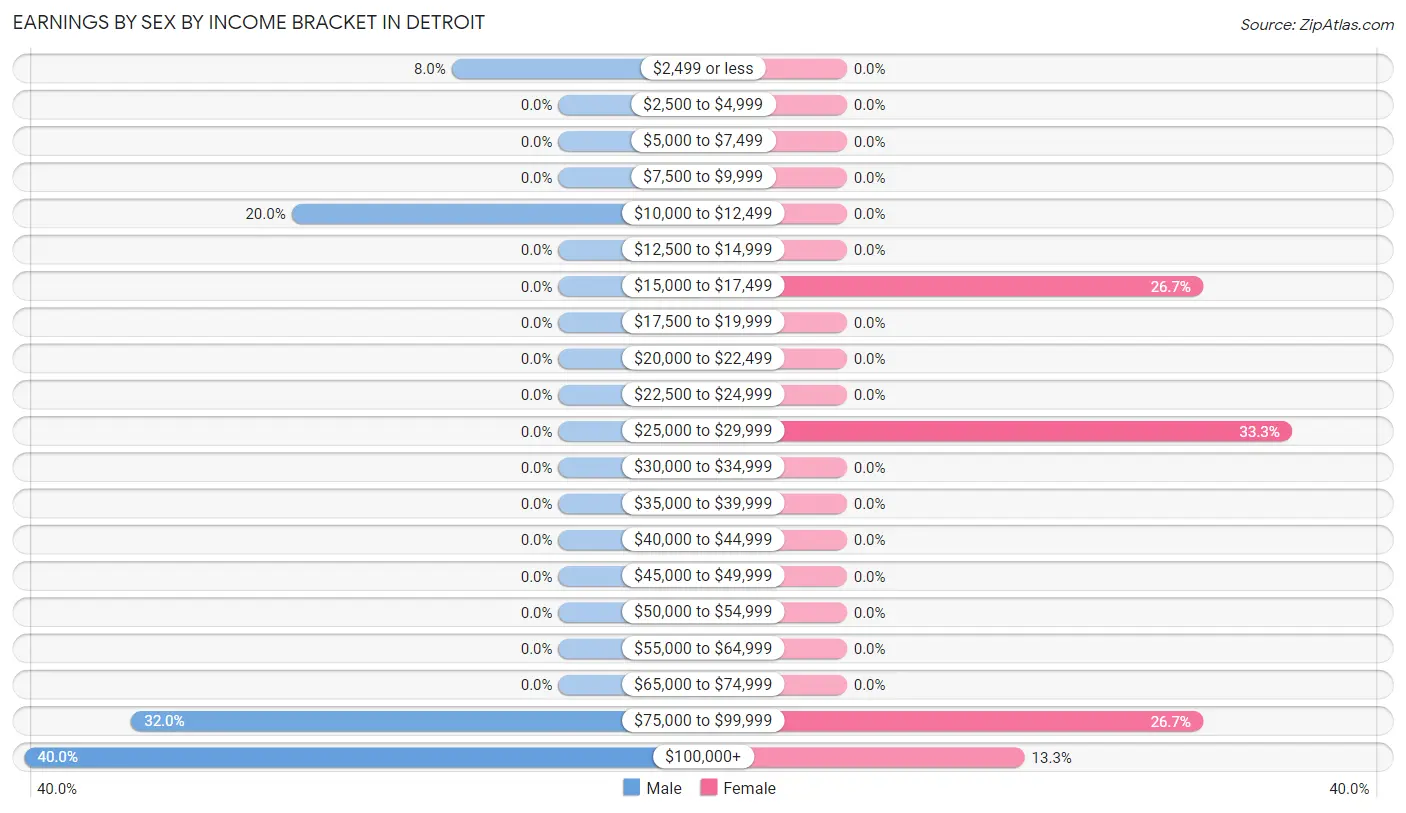
Earnings by Sex by Income Bracket in Detroit
The most common earnings brackets in Detroit are $100,000+ for men (10 | 40.0%) and $25,000 to $29,999 for women (5 | 33.3%).
| Income | Male | Female |
| $2,499 or less | 2 (8.0%) | 0 (0.0%) |
| $2,500 to $4,999 | 0 (0.0%) | 0 (0.0%) |
| $5,000 to $7,499 | 0 (0.0%) | 0 (0.0%) |
| $7,500 to $9,999 | 0 (0.0%) | 0 (0.0%) |
| $10,000 to $12,499 | 5 (20.0%) | 0 (0.0%) |
| $12,500 to $14,999 | 0 (0.0%) | 0 (0.0%) |
| $15,000 to $17,499 | 0 (0.0%) | 4 (26.7%) |
| $17,500 to $19,999 | 0 (0.0%) | 0 (0.0%) |
| $20,000 to $22,499 | 0 (0.0%) | 0 (0.0%) |
| $22,500 to $24,999 | 0 (0.0%) | 0 (0.0%) |
| $25,000 to $29,999 | 0 (0.0%) | 5 (33.3%) |
| $30,000 to $34,999 | 0 (0.0%) | 0 (0.0%) |
| $35,000 to $39,999 | 0 (0.0%) | 0 (0.0%) |
| $40,000 to $44,999 | 0 (0.0%) | 0 (0.0%) |
| $45,000 to $49,999 | 0 (0.0%) | 0 (0.0%) |
| $50,000 to $54,999 | 0 (0.0%) | 0 (0.0%) |
| $55,000 to $64,999 | 0 (0.0%) | 0 (0.0%) |
| $65,000 to $74,999 | 0 (0.0%) | 0 (0.0%) |
| $75,000 to $99,999 | 8 (32.0%) | 4 (26.7%) |
| $100,000+ | 10 (40.0%) | 2 (13.3%) |
| Total | 25 (100.0%) | 15 (100.0%) |
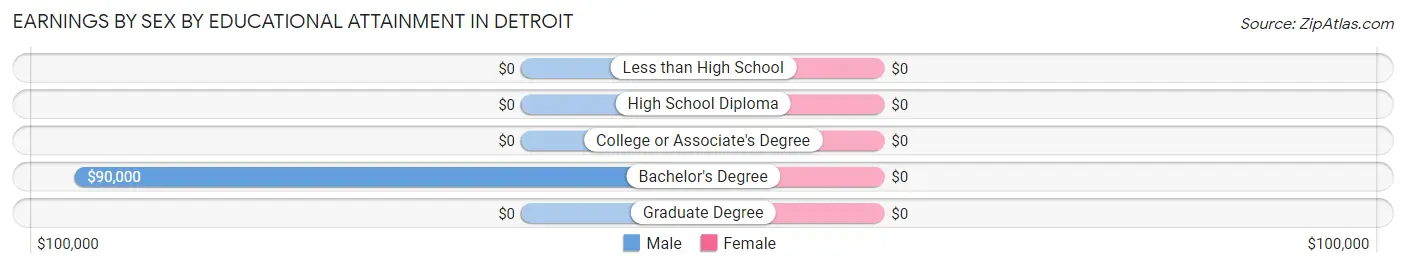
Earnings by Sex by Educational Attainment in Detroit
| Educational Attainment | Male Income | Female Income |
| Less than High School | - | - |
| High School Diploma | - | - |
| College or Associate's Degree | - | - |
| Bachelor's Degree | $90,000 | $0 |
| Graduate Degree | - | - |
| Total | $98,750 | $0 |
Family Income in Detroit
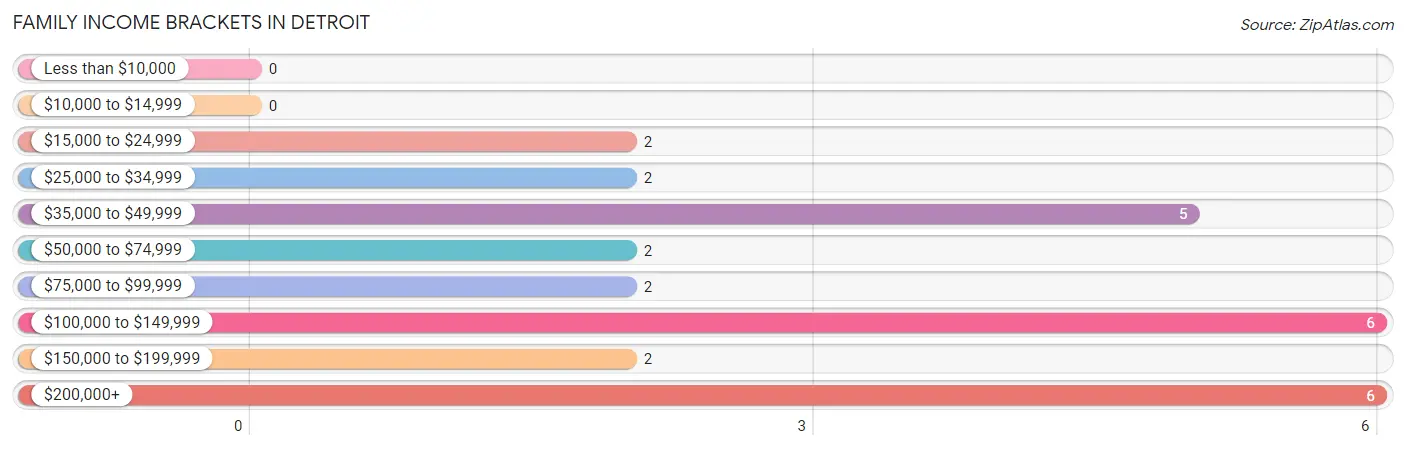
Family Income Brackets in Detroit
According to the Detroit family income data, there are 6 families falling into the $100,000 to $149,999 income range, which is the most common income bracket and makes up 22.2% of all families.
| Income Bracket | # Families | % Families |
| Less than $10,000 | 0 | 0.0% |
| $10,000 to $14,999 | 0 | 0.0% |
| $15,000 to $24,999 | 2 | 7.4% |
| $25,000 to $34,999 | 2 | 7.4% |
| $35,000 to $49,999 | 5 | 18.5% |
| $50,000 to $74,999 | 2 | 7.4% |
| $75,000 to $99,999 | 2 | 7.4% |
| $100,000 to $149,999 | 6 | 22.2% |
| $150,000 to $199,999 | 2 | 7.4% |
| $200,000+ | 6 | 22.2% |
Family Income by Famaliy Size in Detroit
| Income Bracket | # Families | Median Income |
| 2-Person Families | 21 (77.8%) | $0 |
| 3-Person Families | 2 (7.4%) | $0 |
| 4-Person Families | 0 (0.0%) | $0 |
| 5-Person Families | 0 (0.0%) | $0 |
| 6-Person Families | 4 (14.8%) | $0 |
| 7+ Person Families | 0 (0.0%) | $0 |
| Total | 27 (100.0%) | $120,625 |
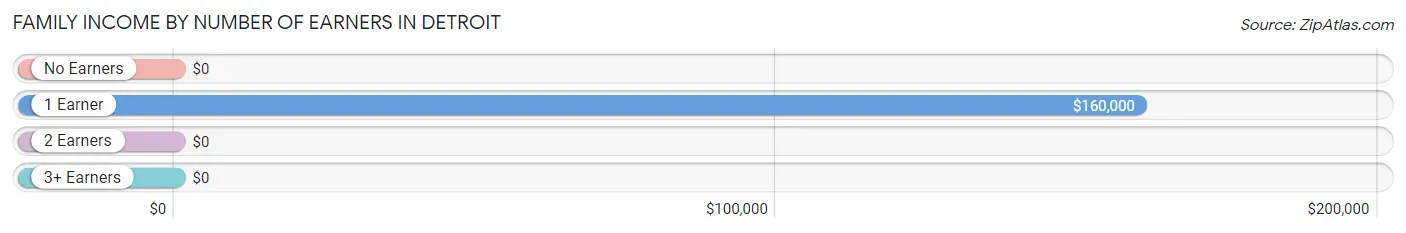
Family Income by Number of Earners in Detroit
| Number of Earners | # Families | Median Income |
| No Earners | 11 (40.7%) | $0 |
| 1 Earner | 8 (29.6%) | $160,000 |
| 2 Earners | 6 (22.2%) | $0 |
| 3+ Earners | 2 (7.4%) | $0 |
| Total | 27 (100.0%) | $120,625 |
Household Income in Detroit
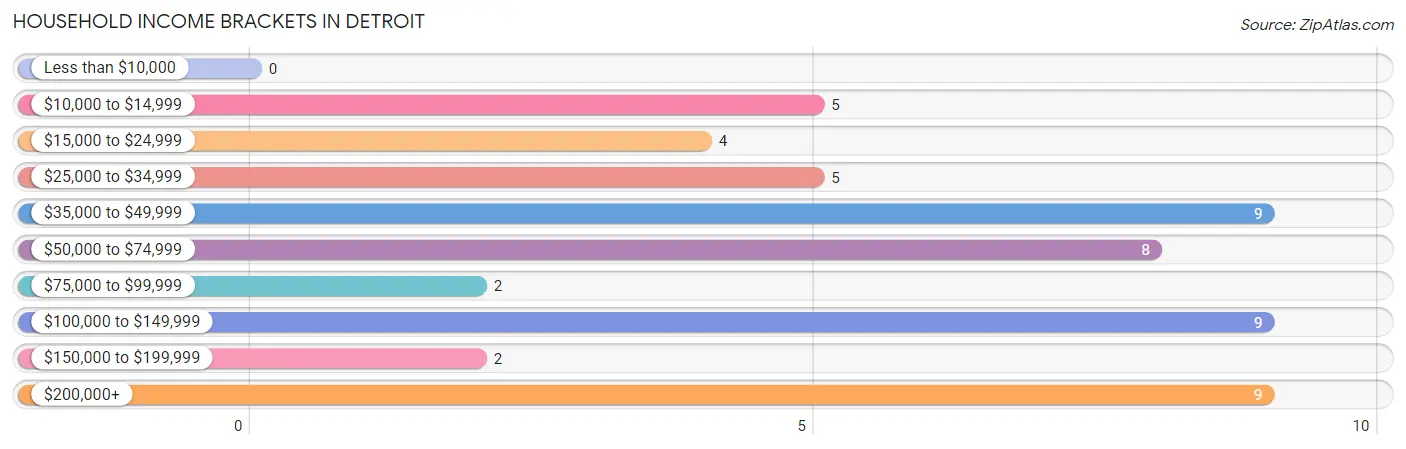
Household Income Brackets in Detroit
With 9 households falling in the category, the $35,000 to $49,999 income range is the most frequent in Detroit, accounting for 17.0% of all households.
| Income Bracket | # Households | % Households |
| Less than $10,000 | 0 | 0.0% |
| $10,000 to $14,999 | 5 | 9.4% |
| $15,000 to $24,999 | 4 | 7.5% |
| $25,000 to $34,999 | 5 | 9.4% |
| $35,000 to $49,999 | 9 | 17.0% |
| $50,000 to $74,999 | 8 | 15.1% |
| $75,000 to $99,999 | 2 | 3.8% |
| $100,000 to $149,999 | 9 | 17.0% |
| $150,000 to $199,999 | 2 | 3.8% |
| $200,000+ | 9 | 17.0% |
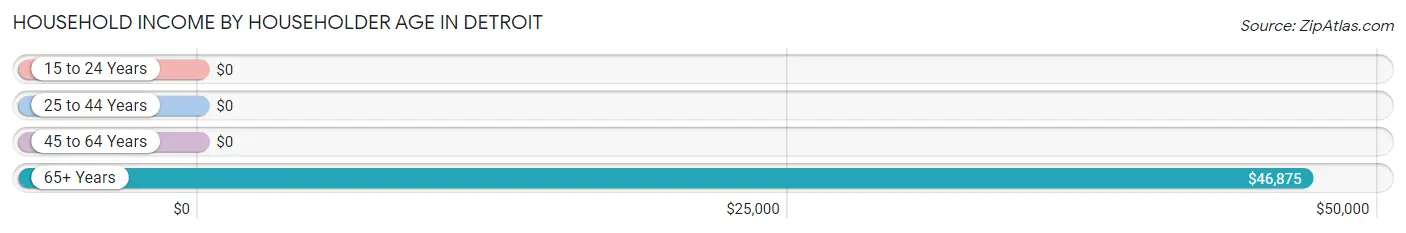
Household Income by Householder Age in Detroit
The median household income in Detroit is $58,750, with the highest median household income of $46,875 found in the 65+ years age bracket for the primary householder. A total of 25 households (47.2%) fall into this category.
| Income Bracket | # Households | Median Income |
| 15 to 24 Years | 0 (0.0%) | $0 |
| 25 to 44 Years | 5 (9.4%) | $0 |
| 45 to 64 Years | 23 (43.4%) | $0 |
| 65+ Years | 25 (47.2%) | $46,875 |
| Total | 53 (100.0%) | $58,750 |
Poverty in Detroit
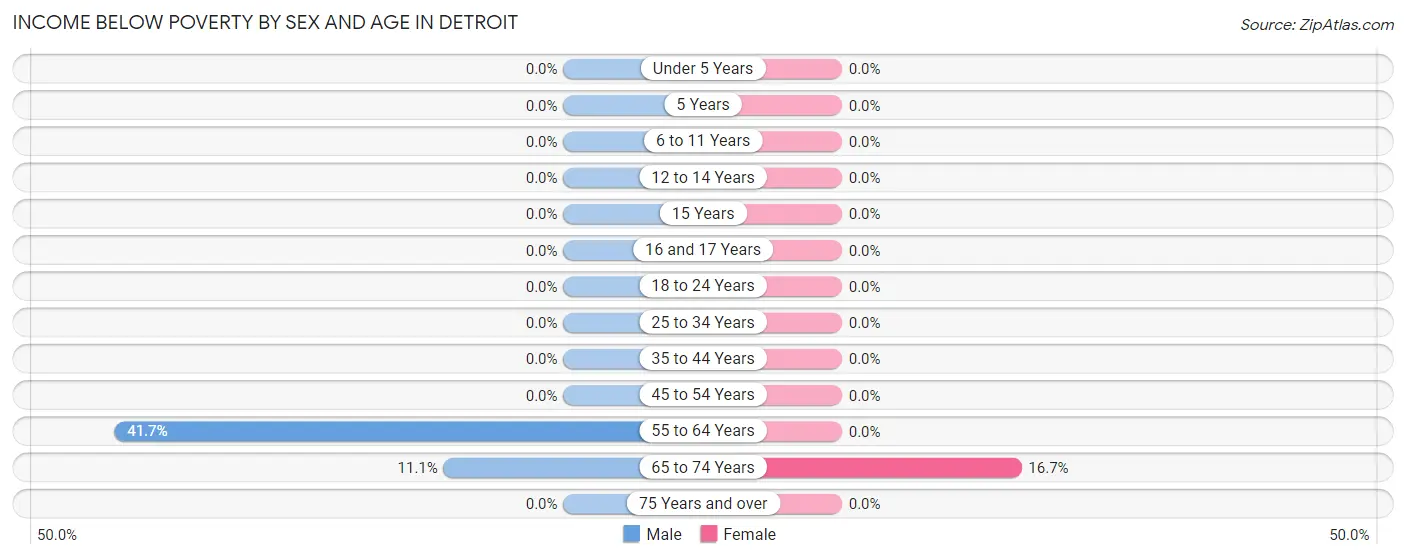
Income Below Poverty by Sex and Age in Detroit
With 12.5% poverty level for males and 6.5% for females among the residents of Detroit, 55 to 64 year old males and 65 to 74 year old females are the most vulnerable to poverty, with 5 males (41.7%) and 3 females (16.7%) in their respective age groups living below the poverty level.
| Age Bracket | Male | Female |
| Under 5 Years | 0 (0.0%) | 0 (0.0%) |
| 5 Years | 0 (0.0%) | 0 (0.0%) |
| 6 to 11 Years | 0 (0.0%) | 0 (0.0%) |
| 12 to 14 Years | 0 (0.0%) | 0 (0.0%) |
| 15 Years | 0 (0.0%) | 0 (0.0%) |
| 16 and 17 Years | 0 (0.0%) | 0 (0.0%) |
| 18 to 24 Years | 0 (0.0%) | 0 (0.0%) |
| 25 to 34 Years | 0 (0.0%) | 0 (0.0%) |
| 35 to 44 Years | 0 (0.0%) | 0 (0.0%) |
| 45 to 54 Years | 0 (0.0%) | 0 (0.0%) |
| 55 to 64 Years | 5 (41.7%) | 0 (0.0%) |
| 65 to 74 Years | 2 (11.1%) | 3 (16.7%) |
| 75 Years and over | 0 (0.0%) | 0 (0.0%) |
| Total | 7 (12.5%) | 3 (6.5%) |
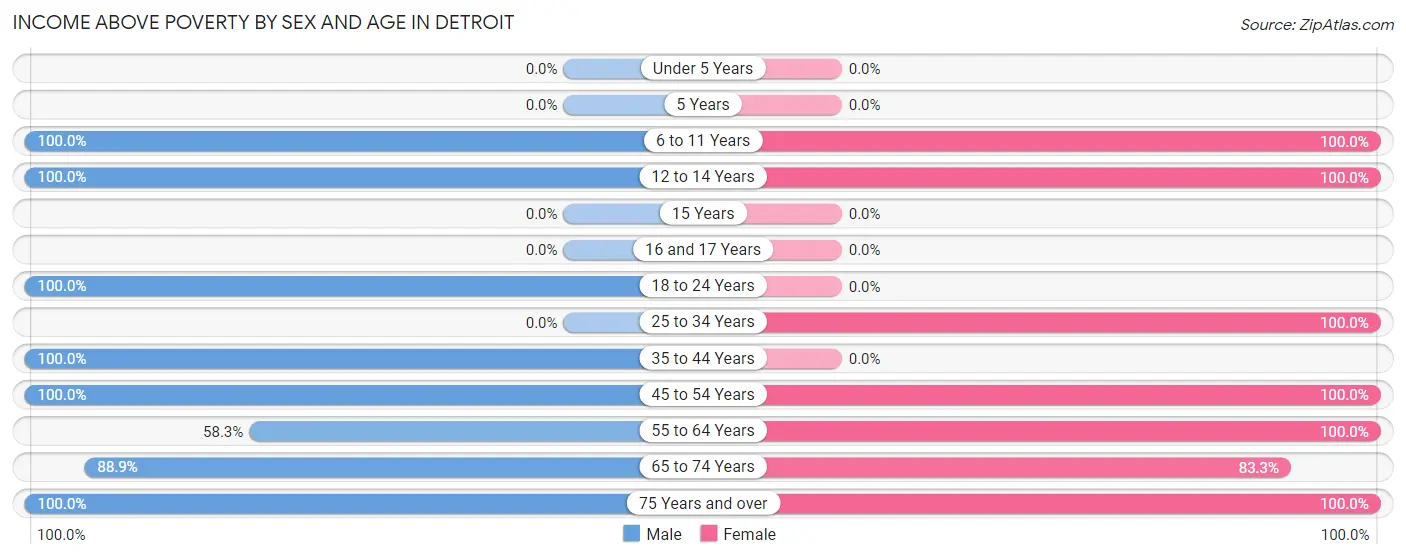
Income Above Poverty by Sex and Age in Detroit
According to the poverty statistics in Detroit, males aged 6 to 11 years and females aged 6 to 11 years are the age groups that are most secure financially, with 100.0% of males and 100.0% of females in these age groups living above the poverty line.
| Age Bracket | Male | Female |
| Under 5 Years | 0 (0.0%) | 0 (0.0%) |
| 5 Years | 0 (0.0%) | 0 (0.0%) |
| 6 to 11 Years | 4 (100.0%) | 4 (100.0%) |
| 12 to 14 Years | 5 (100.0%) | 5 (100.0%) |
| 15 Years | 0 (0.0%) | 0 (0.0%) |
| 16 and 17 Years | 0 (0.0%) | 0 (0.0%) |
| 18 to 24 Years | 3 (100.0%) | 0 (0.0%) |
| 25 to 34 Years | 0 (0.0%) | 2 (100.0%) |
| 35 to 44 Years | 3 (100.0%) | 0 (0.0%) |
| 45 to 54 Years | 9 (100.0%) | 2 (100.0%) |
| 55 to 64 Years | 7 (58.3%) | 10 (100.0%) |
| 65 to 74 Years | 16 (88.9%) | 15 (83.3%) |
| 75 Years and over | 2 (100.0%) | 5 (100.0%) |
| Total | 49 (87.5%) | 43 (93.5%) |
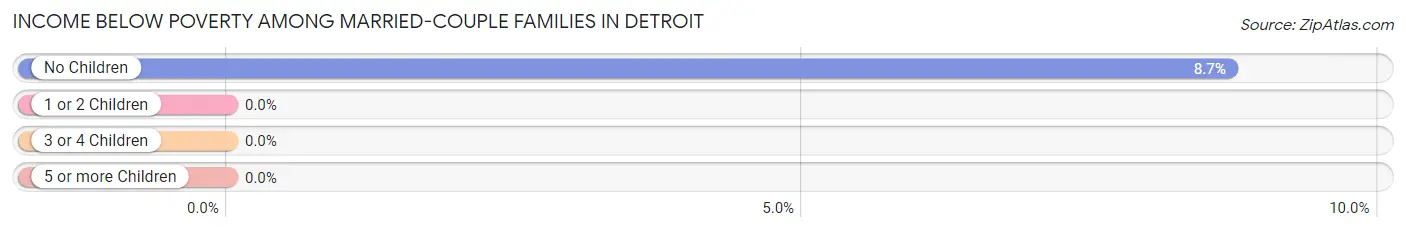
Income Below Poverty Among Married-Couple Families in Detroit
The poverty statistics for married-couple families in Detroit show that 7.4% or 2 of the total 27 families live below the poverty line. Families with no children have the highest poverty rate of 8.7%, comprising of 2 families. On the other hand, families with 3 or 4 children have the lowest poverty rate of 0.0%, which includes 0 families.
| Children | Above Poverty | Below Poverty |
| No Children | 21 (91.3%) | 2 (8.7%) |
| 1 or 2 Children | 0 (0.0%) | 0 (0.0%) |
| 3 or 4 Children | 4 (100.0%) | 0 (0.0%) |
| 5 or more Children | 0 (0.0%) | 0 (0.0%) |
| Total | 25 (92.6%) | 2 (7.4%) |
Income Below Poverty Among Single-Parent Households in Detroit
| Children | Single Father | Single Mother |
| No Children | 0 (0.0%) | 0 (0.0%) |
| 1 or 2 Children | 0 (0.0%) | 0 (0.0%) |
| 3 or 4 Children | 0 (0.0%) | 0 (0.0%) |
| 5 or more Children | 0 (0.0%) | 0 (0.0%) |
| Total | 0 (0.0%) | 0 (0.0%) |
Income Below Poverty Among Married-Couple vs Single-Parent Households in Detroit
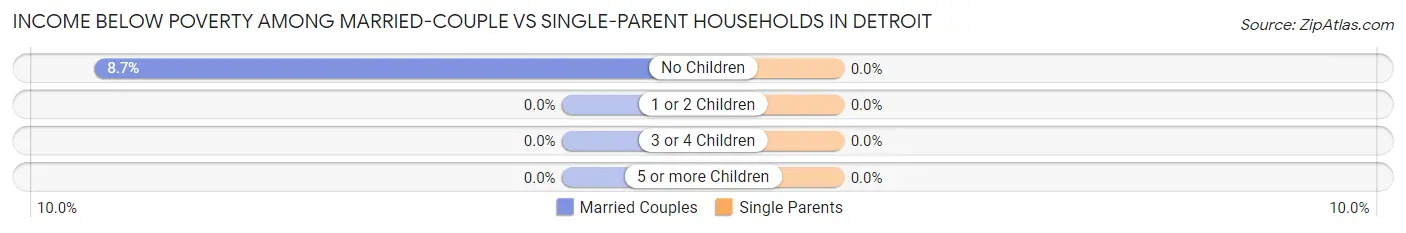
| Children | Married-Couple Families | Single-Parent Households |
| No Children | 2 (8.7%) | 0 (0.0%) |
| 1 or 2 Children | 0 (0.0%) | 0 (0.0%) |
| 3 or 4 Children | 0 (0.0%) | 0 (0.0%) |
| 5 or more Children | 0 (0.0%) | 0 (0.0%) |
| Total | 2 (7.4%) | 0 (0.0%) |
Race in Detroit
The most populous races in Detroit are White / Caucasian (98 | 96.1%), and Two or more Races (4 | 3.9%).
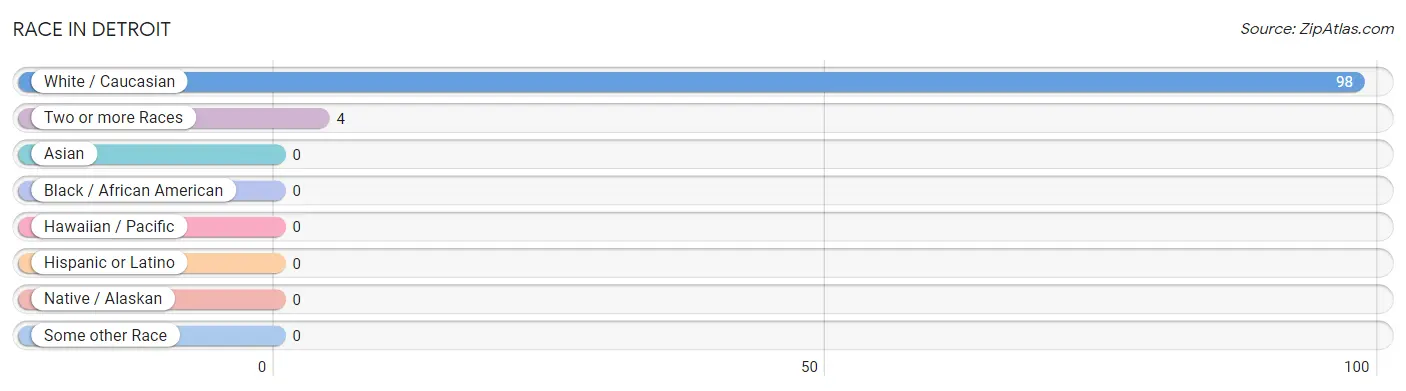
| Race | # Population | % Population |
| Asian | 0 | 0.0% |
| Black / African American | 0 | 0.0% |
| Hawaiian / Pacific | 0 | 0.0% |
| Hispanic or Latino | 0 | 0.0% |
| Native / Alaskan | 0 | 0.0% |
| White / Caucasian | 98 | 96.1% |
| Two or more Races | 4 | 3.9% |
| Some other Race | 0 | 0.0% |
| Total | 102 | 100.0% |
Ancestry in Detroit
The most populous ancestries reported in Detroit are English (27 | 26.5%), Irish (18 | 17.6%), German (16 | 15.7%), French (6 | 5.9%), and Scottish (6 | 5.9%), together accounting for 71.6% of all Detroit residents.
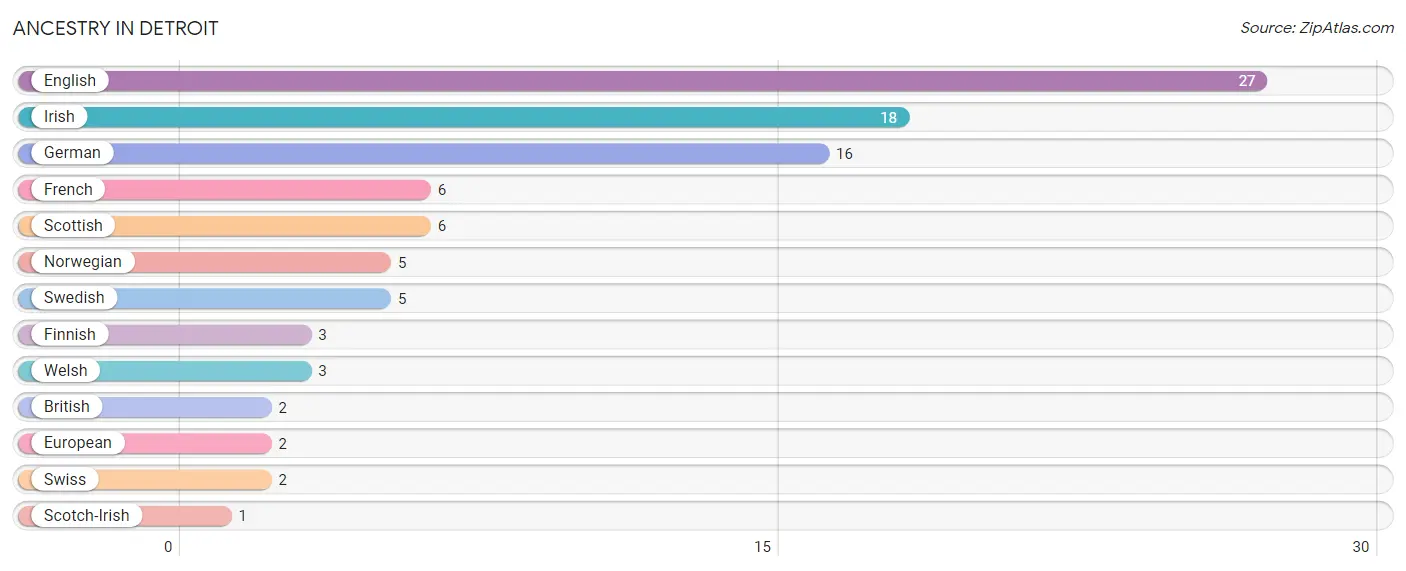
| Ancestry | # Population | % Population |
| British | 2 | 2.0% |
| English | 27 | 26.5% |
| European | 2 | 2.0% |
| Finnish | 3 | 2.9% |
| French | 6 | 5.9% |
| German | 16 | 15.7% |
| Irish | 18 | 17.6% |
| Norwegian | 5 | 4.9% |
| Scotch-Irish | 1 | 1.0% |
| Scottish | 6 | 5.9% |
| Swedish | 5 | 4.9% |
| Swiss | 2 | 2.0% |
| Welsh | 3 | 2.9% | View All 13 Rows |
Immigrants in Detroit

| Immigration Origin | # Population | % Population | View All 0 Rows |
Sex and Age in Detroit
Sex and Age in Detroit
The most populous age groups in Detroit are 65 to 69 Years (14 | 25.0%) for men and 65 to 69 Years (12 | 26.1%) for women.
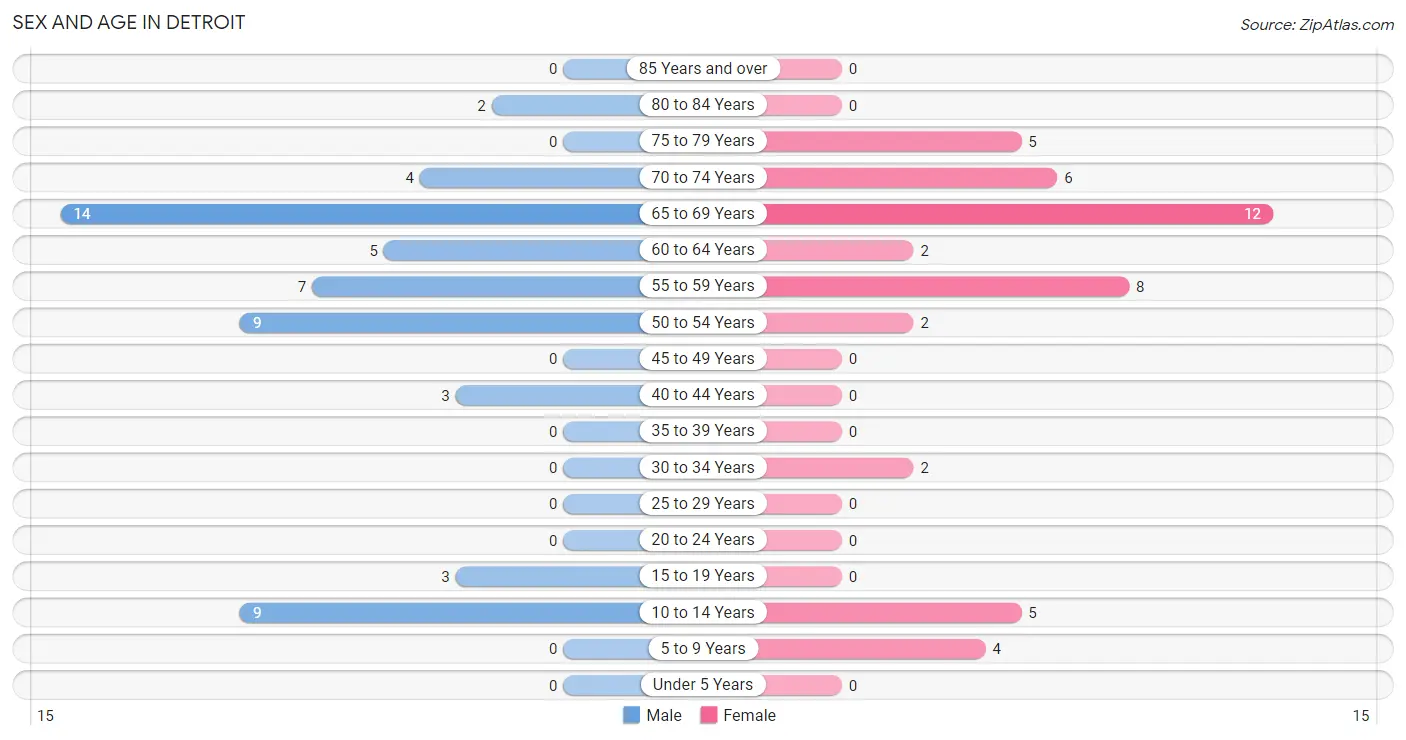
| Age Bracket | Male | Female |
| Under 5 Years | 0 (0.0%) | 0 (0.0%) |
| 5 to 9 Years | 0 (0.0%) | 4 (8.7%) |
| 10 to 14 Years | 9 (16.1%) | 5 (10.9%) |
| 15 to 19 Years | 3 (5.4%) | 0 (0.0%) |
| 20 to 24 Years | 0 (0.0%) | 0 (0.0%) |
| 25 to 29 Years | 0 (0.0%) | 0 (0.0%) |
| 30 to 34 Years | 0 (0.0%) | 2 (4.3%) |
| 35 to 39 Years | 0 (0.0%) | 0 (0.0%) |
| 40 to 44 Years | 3 (5.4%) | 0 (0.0%) |
| 45 to 49 Years | 0 (0.0%) | 0 (0.0%) |
| 50 to 54 Years | 9 (16.1%) | 2 (4.3%) |
| 55 to 59 Years | 7 (12.5%) | 8 (17.4%) |
| 60 to 64 Years | 5 (8.9%) | 2 (4.3%) |
| 65 to 69 Years | 14 (25.0%) | 12 (26.1%) |
| 70 to 74 Years | 4 (7.1%) | 6 (13.0%) |
| 75 to 79 Years | 0 (0.0%) | 5 (10.9%) |
| 80 to 84 Years | 2 (3.6%) | 0 (0.0%) |
| 85 Years and over | 0 (0.0%) | 0 (0.0%) |
| Total | 56 (100.0%) | 46 (100.0%) |
Families and Households in Detroit
Median Family Size in Detroit
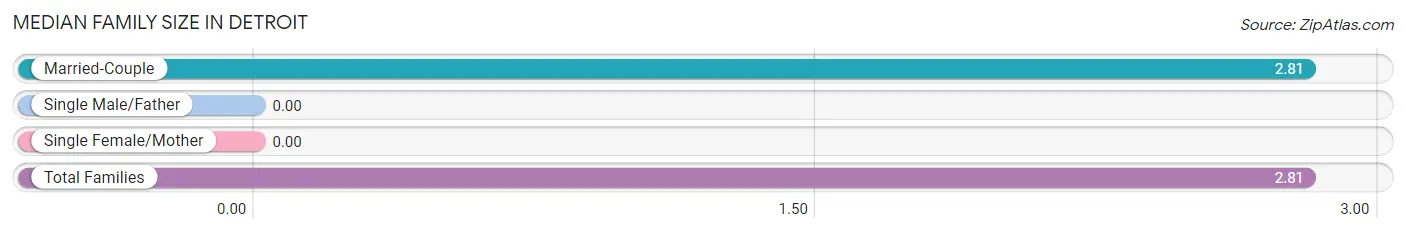
| Family Type | # Families | Family Size |
| Married-Couple | 27 (100.0%) | 2.81 |
| Single Male/Father | 0 (0.0%) | - |
| Single Female/Mother | 0 (0.0%) | - |
| Total Families | 27 (100.0%) | 2.81 |
Median Household Size in Detroit
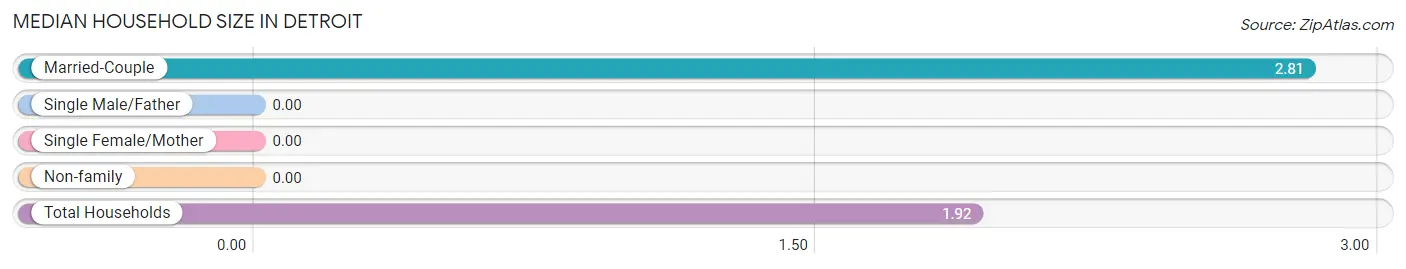
| Household Type | # Households | Household Size |
| Married-Couple | 27 (50.9%) | 2.81 |
| Single Male/Father | 0 (0.0%) | - |
| Single Female/Mother | 0 (0.0%) | - |
| Non-family | 26 (49.1%) | - |
| Total Households | 53 (100.0%) | 1.92 |
Household Size by Marriage Status in Detroit
Out of a total of 53 households in Detroit, 27 (50.9%) are family households, while 26 (49.1%) are nonfamily households. The most numerous type of family households are 2-person households, comprising 21, and the most common type of nonfamily households are 1-person households, comprising 26.
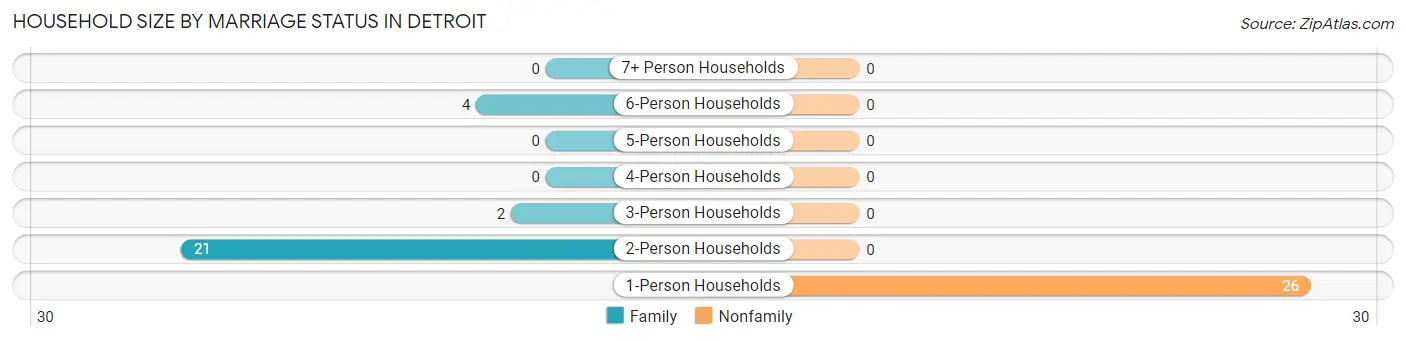
| Household Size | Family Households | Nonfamily Households |
| 1-Person Households | - | 26 (49.1%) |
| 2-Person Households | 21 (39.6%) | 0 (0.0%) |
| 3-Person Households | 2 (3.8%) | 0 (0.0%) |
| 4-Person Households | 0 (0.0%) | 0 (0.0%) |
| 5-Person Households | 0 (0.0%) | 0 (0.0%) |
| 6-Person Households | 4 (7.5%) | 0 (0.0%) |
| 7+ Person Households | 0 (0.0%) | 0 (0.0%) |
| Total | 27 (50.9%) | 26 (49.1%) |
Female Fertility in Detroit
Fertility by Age in Detroit
| Age Bracket | Women with Births | Births / 1,000 Women |
| 15 to 19 years | 0 (0.0%) | 0.0 |
| 20 to 34 years | 0 (0.0%) | 0.0 |
| 35 to 50 years | 0 (0.0%) | 0.0 |
| Total | 0 (0.0%) | 0.0 |
Fertility by Age by Marriage Status in Detroit
| Age Bracket | Married | Unmarried |
| 15 to 19 years | 0 (0.0%) | 0 (0.0%) |
| 20 to 34 years | 0 (0.0%) | 0 (0.0%) |
| 35 to 50 years | 0 (0.0%) | 0 (0.0%) |
| Total | 0 (0.0%) | 0 (0.0%) |
Fertility by Education in Detroit
| Educational Attainment | Women with Births | Births / 1,000 Women |
| Less than High School | 0 (0.0%) | 0.0 |
| High School Diploma | 0 (0.0%) | 0.0 |
| College or Associate's Degree | 0 (0.0%) | 0.0 |
| Bachelor's Degree | 0 (0.0%) | 0.0 |
| Graduate Degree | 0 (0.0%) | 0.0 |
| Total | 0 (0.0%) | 0.0 |
Fertility by Education by Marriage Status in Detroit
| Educational Attainment | Married | Unmarried |
| Less than High School | 0 (0.0%) | 0 (0.0%) |
| High School Diploma | 0 (0.0%) | 0 (0.0%) |
| College or Associate's Degree | 0 (0.0%) | 0 (0.0%) |
| Bachelor's Degree | 0 (0.0%) | 0 (0.0%) |
| Graduate Degree | 0 (0.0%) | 0 (0.0%) |
| Total | 0 (0.0%) | 0 (0.0%) |
Employment Characteristics in Detroit
Employment by Class of Employer in Detroit
Among the 40 employed individuals in Detroit, private company employees (17 | 42.5%), self-employed (incorporated) (8 | 20.0%), and self-employed (not incorporated) (7 | 17.5%) make up the most common classes of employment.
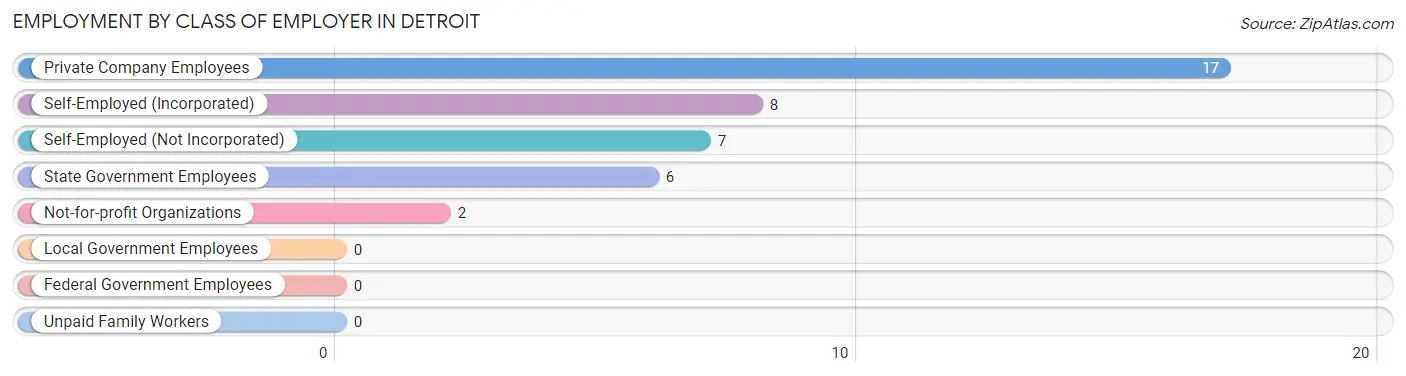
| Employer Class | # Employees | % Employees |
| Private Company Employees | 17 | 42.5% |
| Self-Employed (Incorporated) | 8 | 20.0% |
| Self-Employed (Not Incorporated) | 7 | 17.5% |
| Not-for-profit Organizations | 2 | 5.0% |
| Local Government Employees | 0 | 0.0% |
| State Government Employees | 6 | 15.0% |
| Federal Government Employees | 0 | 0.0% |
| Unpaid Family Workers | 0 | 0.0% |
| Total | 40 | 100.0% |
Employment Status by Age in Detroit
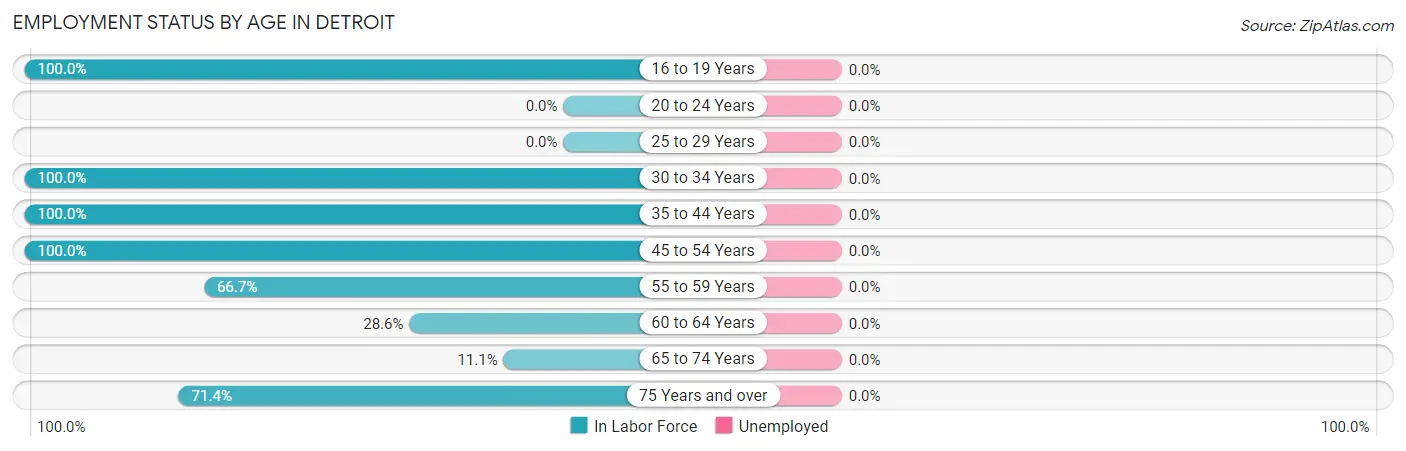
| Age Bracket | In Labor Force | Unemployed |
| 16 to 19 Years | 3 (100.0%) | 0 (0.0%) |
| 20 to 24 Years | 0 (0.0%) | 0 (0.0%) |
| 25 to 29 Years | 0 (0.0%) | 0 (0.0%) |
| 30 to 34 Years | 2 (100.0%) | 0 (0.0%) |
| 35 to 44 Years | 3 (100.0%) | 0 (0.0%) |
| 45 to 54 Years | 11 (100.0%) | 0 (0.0%) |
| 55 to 59 Years | 10 (66.7%) | 0 (0.0%) |
| 60 to 64 Years | 2 (28.6%) | 0 (0.0%) |
| 65 to 74 Years | 4 (11.1%) | 0 (0.0%) |
| 75 Years and over | 5 (71.4%) | 0 (0.0%) |
| Total | 40 (47.6%) | 0 (0.0%) |
Employment Status by Educational Attainment in Detroit
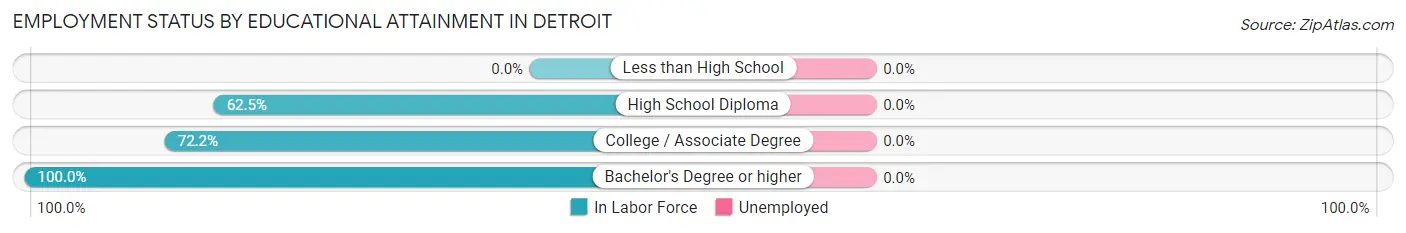
| Educational Attainment | In Labor Force | Unemployed |
| Less than High School | 0 (0.0%) | 0 (0.0%) |
| High School Diploma | 5 (62.5%) | 0 (0.0%) |
| College / Associate Degree | 13 (72.2%) | 0 (0.0%) |
| Bachelor's Degree or higher | 10 (100.0%) | 0 (0.0%) |
| Total | 28 (73.7%) | 0 (0.0%) |
Employment Occupations by Sex in Detroit
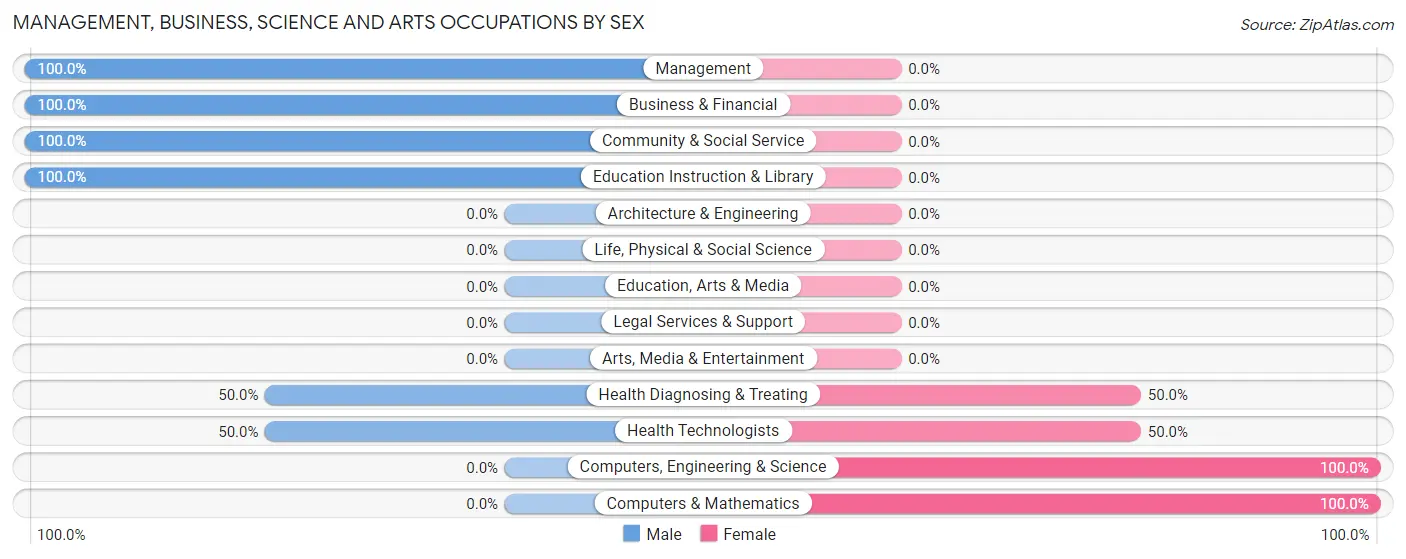
Management, Business, Science and Arts Occupations
The most common Management, Business, Science and Arts occupations in Detroit are Management (13 | 32.5%), Computers, Engineering & Science (4 | 10.0%), Computers & Mathematics (4 | 10.0%), Health Diagnosing & Treating (4 | 10.0%), and Health Technologists (4 | 10.0%).
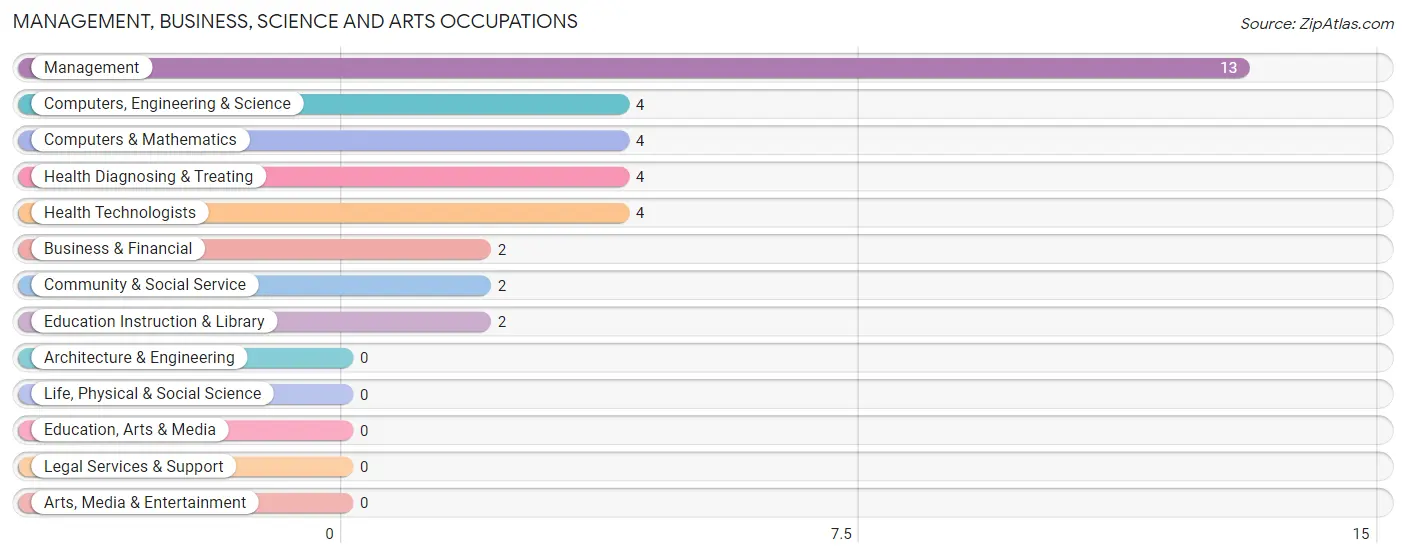
Management, Business, Science and Arts Occupations by Sex
Within the Management, Business, Science and Arts occupations in Detroit, the most male-oriented occupations are Management (100.0%), Business & Financial (100.0%), and Community & Social Service (100.0%), while the most female-oriented occupations are Computers, Engineering & Science (100.0%), Computers & Mathematics (100.0%), and Health Diagnosing & Treating (50.0%).
| Occupation | Male | Female |
| Management | 13 (100.0%) | 0 (0.0%) |
| Business & Financial | 2 (100.0%) | 0 (0.0%) |
| Computers, Engineering & Science | 0 (0.0%) | 4 (100.0%) |
| Computers & Mathematics | 0 (0.0%) | 4 (100.0%) |
| Architecture & Engineering | 0 (0.0%) | 0 (0.0%) |
| Life, Physical & Social Science | 0 (0.0%) | 0 (0.0%) |
| Community & Social Service | 2 (100.0%) | 0 (0.0%) |
| Education, Arts & Media | 0 (0.0%) | 0 (0.0%) |
| Legal Services & Support | 0 (0.0%) | 0 (0.0%) |
| Education Instruction & Library | 2 (100.0%) | 0 (0.0%) |
| Arts, Media & Entertainment | 0 (0.0%) | 0 (0.0%) |
| Health Diagnosing & Treating | 2 (50.0%) | 2 (50.0%) |
| Health Technologists | 2 (50.0%) | 2 (50.0%) |
| Total (Category) | 19 (76.0%) | 6 (24.0%) |
| Total (Overall) | 25 (62.5%) | 15 (37.5%) |
Services Occupations
The most common Services occupations in Detroit are Food Preparation & Serving (2 | 5.0%), Cleaning & Maintenance (2 | 5.0%), and Personal Care & Service (2 | 5.0%).
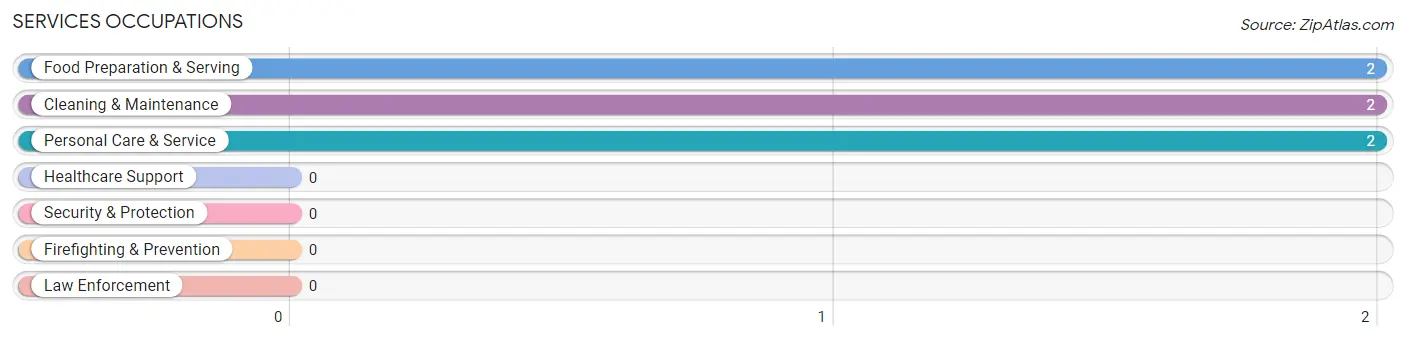
Services Occupations by Sex
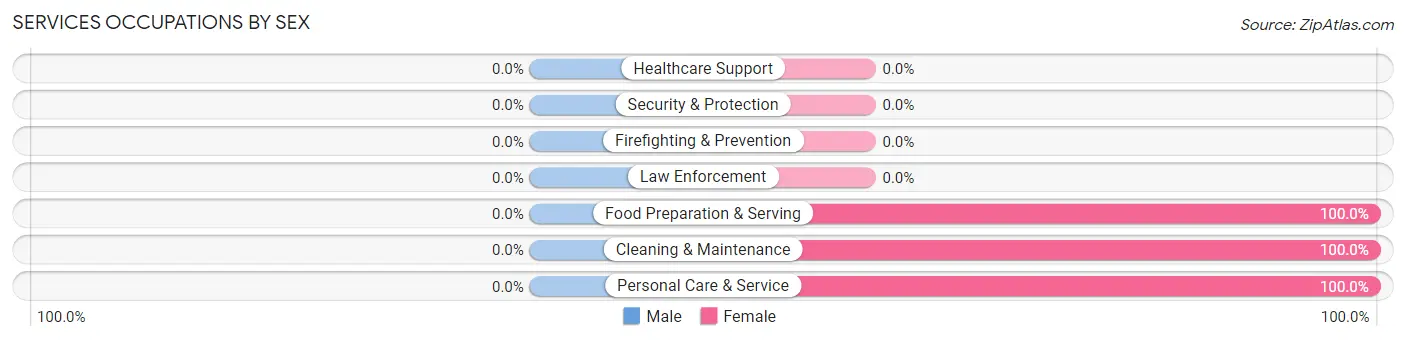
| Occupation | Male | Female |
| Healthcare Support | 0 (0.0%) | 0 (0.0%) |
| Security & Protection | 0 (0.0%) | 0 (0.0%) |
| Firefighting & Prevention | 0 (0.0%) | 0 (0.0%) |
| Law Enforcement | 0 (0.0%) | 0 (0.0%) |
| Food Preparation & Serving | 0 (0.0%) | 2 (100.0%) |
| Cleaning & Maintenance | 0 (0.0%) | 2 (100.0%) |
| Personal Care & Service | 0 (0.0%) | 2 (100.0%) |
| Total (Category) | 0 (0.0%) | 6 (100.0%) |
| Total (Overall) | 25 (62.5%) | 15 (37.5%) |
Sales and Office Occupations

Sales and Office Occupations by Sex

| Occupation | Male | Female |
| Sales & Related | 0 (0.0%) | 0 (0.0%) |
| Office & Administration | 0 (0.0%) | 0 (0.0%) |
| Total (Category) | 0 (0.0%) | 0 (0.0%) |
| Total (Overall) | 25 (62.5%) | 15 (37.5%) |
Natural Resources, Construction and Maintenance Occupations

Natural Resources, Construction and Maintenance Occupations by Sex
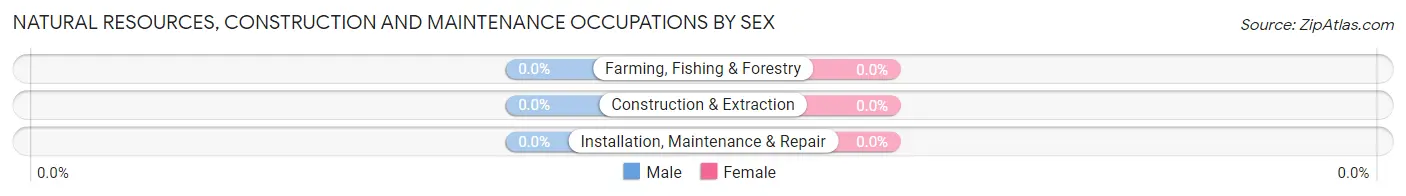
| Occupation | Male | Female |
| Farming, Fishing & Forestry | 0 (0.0%) | 0 (0.0%) |
| Construction & Extraction | 0 (0.0%) | 0 (0.0%) |
| Installation, Maintenance & Repair | 0 (0.0%) | 0 (0.0%) |
| Total (Category) | 0 (0.0%) | 0 (0.0%) |
| Total (Overall) | 25 (62.5%) | 15 (37.5%) |
Production, Transportation and Moving Occupations
The most common Production, Transportation and Moving occupations in Detroit are Transportation (6 | 15.0%), and Material Moving (3 | 7.5%).
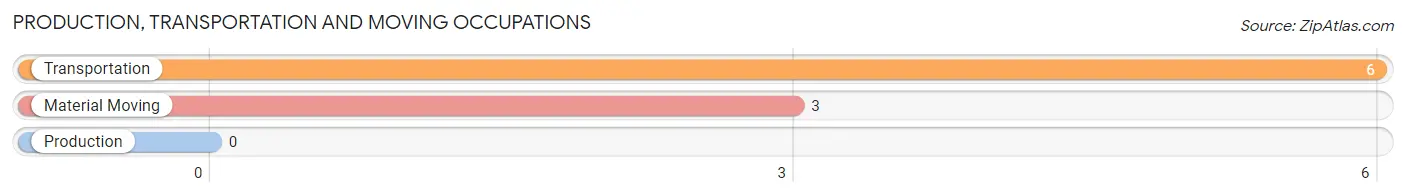
Production, Transportation and Moving Occupations by Sex
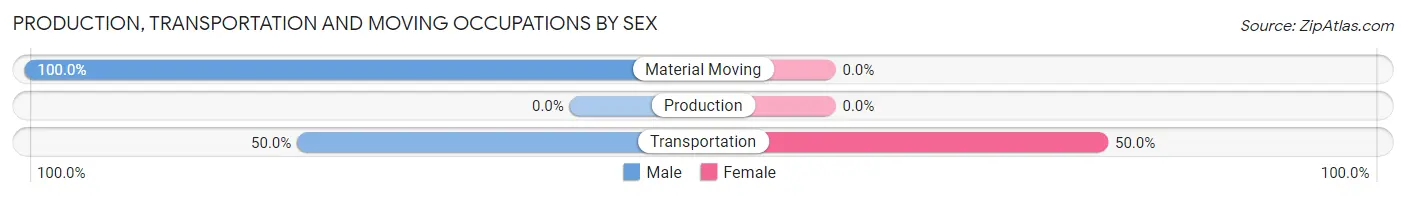
| Occupation | Male | Female |
| Production | 0 (0.0%) | 0 (0.0%) |
| Transportation | 3 (50.0%) | 3 (50.0%) |
| Material Moving | 3 (100.0%) | 0 (0.0%) |
| Total (Category) | 6 (66.7%) | 3 (33.3%) |
| Total (Overall) | 25 (62.5%) | 15 (37.5%) |
Employment Industries by Sex in Detroit
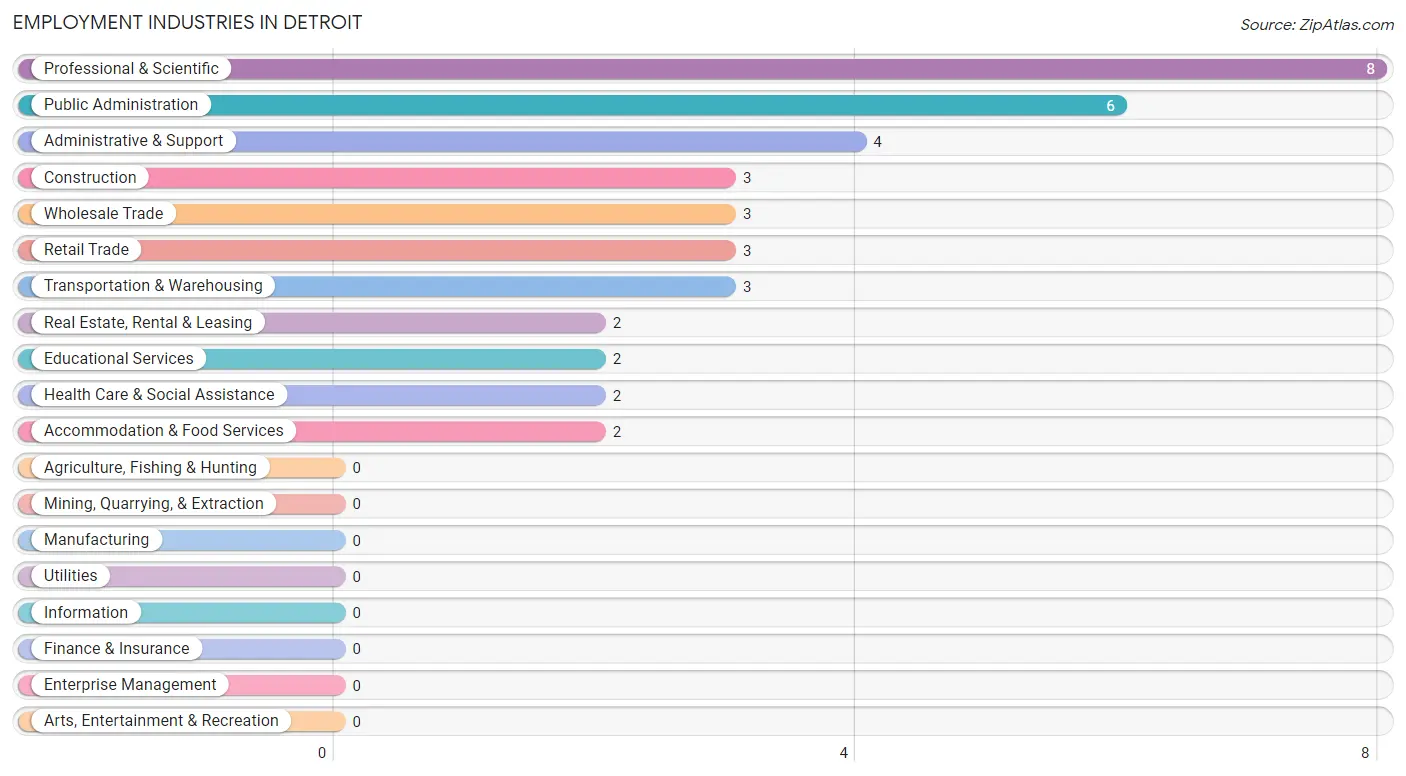
Employment Industries in Detroit
The major employment industries in Detroit include Professional & Scientific (8 | 20.0%), Public Administration (6 | 15.0%), Administrative & Support (4 | 10.0%), Construction (3 | 7.5%), and Wholesale Trade (3 | 7.5%).
Employment Industries by Sex in Detroit
The Detroit industries that see more men than women are Construction (100.0%), Wholesale Trade (100.0%), and Transportation & Warehousing (100.0%), whereas the industries that tend to have a higher number of women are Retail Trade (100.0%), Health Care & Social Assistance (100.0%), and Accommodation & Food Services (100.0%).
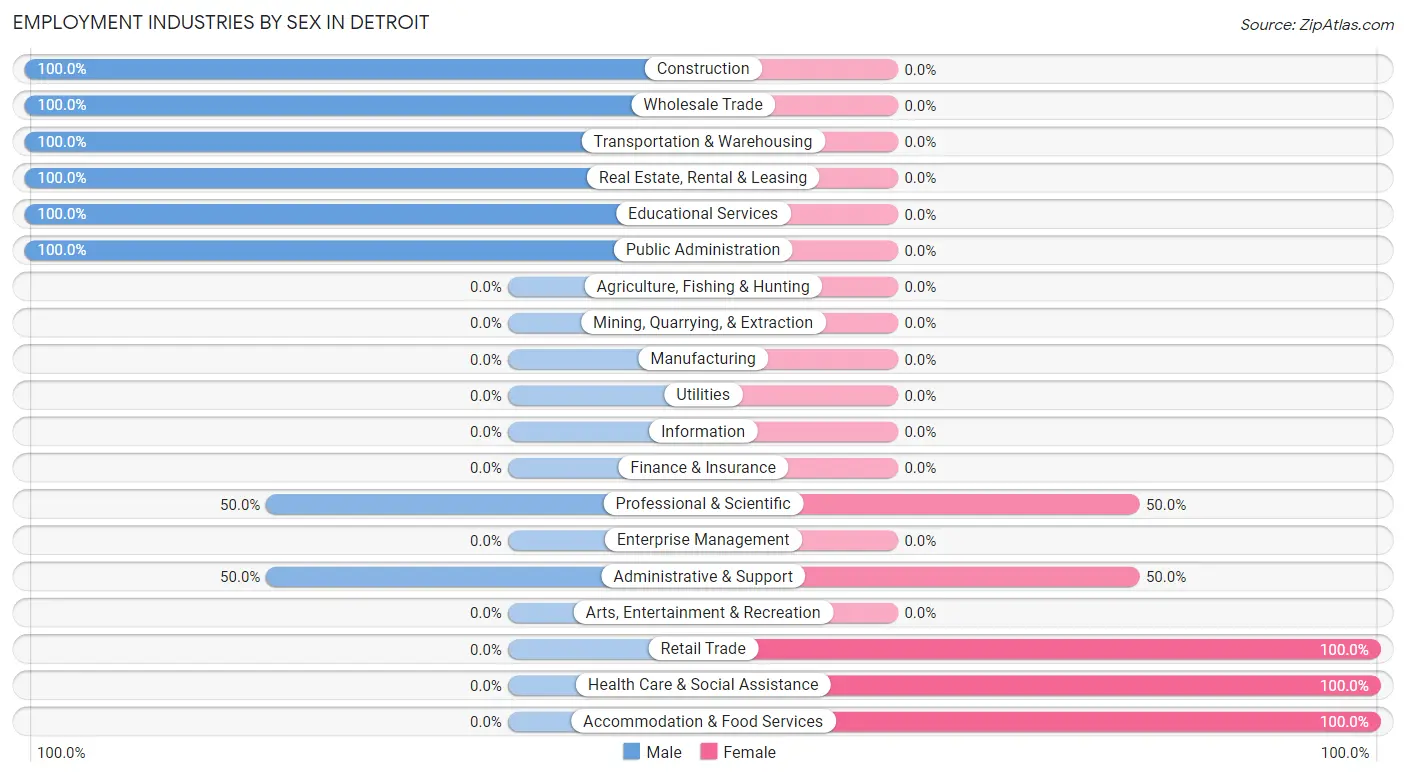
| Industry | Male | Female |
| Agriculture, Fishing & Hunting | 0 (0.0%) | 0 (0.0%) |
| Mining, Quarrying, & Extraction | 0 (0.0%) | 0 (0.0%) |
| Construction | 3 (100.0%) | 0 (0.0%) |
| Manufacturing | 0 (0.0%) | 0 (0.0%) |
| Wholesale Trade | 3 (100.0%) | 0 (0.0%) |
| Retail Trade | 0 (0.0%) | 3 (100.0%) |
| Transportation & Warehousing | 3 (100.0%) | 0 (0.0%) |
| Utilities | 0 (0.0%) | 0 (0.0%) |
| Information | 0 (0.0%) | 0 (0.0%) |
| Finance & Insurance | 0 (0.0%) | 0 (0.0%) |
| Real Estate, Rental & Leasing | 2 (100.0%) | 0 (0.0%) |
| Professional & Scientific | 4 (50.0%) | 4 (50.0%) |
| Enterprise Management | 0 (0.0%) | 0 (0.0%) |
| Administrative & Support | 2 (50.0%) | 2 (50.0%) |
| Educational Services | 2 (100.0%) | 0 (0.0%) |
| Health Care & Social Assistance | 0 (0.0%) | 2 (100.0%) |
| Arts, Entertainment & Recreation | 0 (0.0%) | 0 (0.0%) |
| Accommodation & Food Services | 0 (0.0%) | 2 (100.0%) |
| Public Administration | 6 (100.0%) | 0 (0.0%) |
| Total | 25 (62.5%) | 15 (37.5%) |
Education in Detroit
School Enrollment in Detroit
The most common levels of schooling among the 24 students in Detroit are middle school (10 | 41.7%), elementary school (8 | 33.3%), and high school (3 | 12.5%).
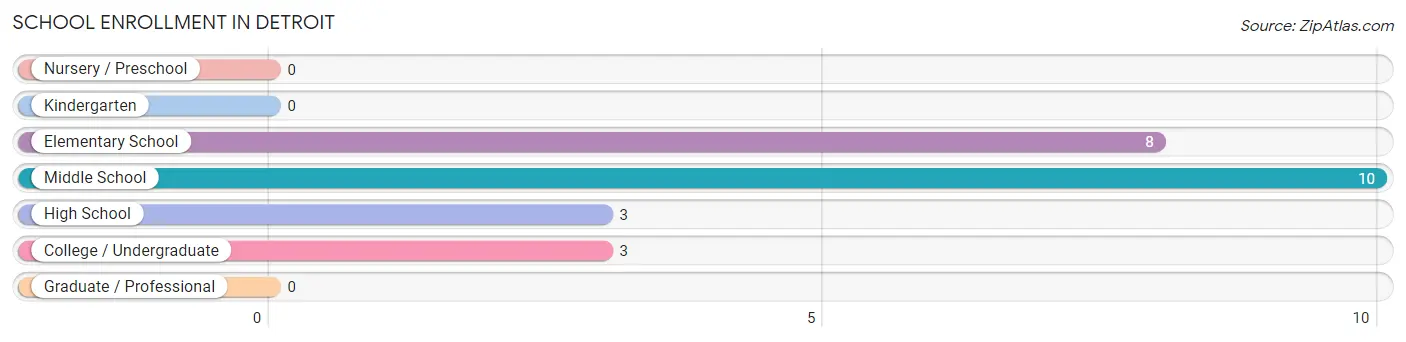
| School Level | # Students | % Students |
| Nursery / Preschool | 0 | 0.0% |
| Kindergarten | 0 | 0.0% |
| Elementary School | 8 | 33.3% |
| Middle School | 10 | 41.7% |
| High School | 3 | 12.5% |
| College / Undergraduate | 3 | 12.5% |
| Graduate / Professional | 0 | 0.0% |
| Total | 24 | 100.0% |
School Enrollment by Age by Funding Source in Detroit
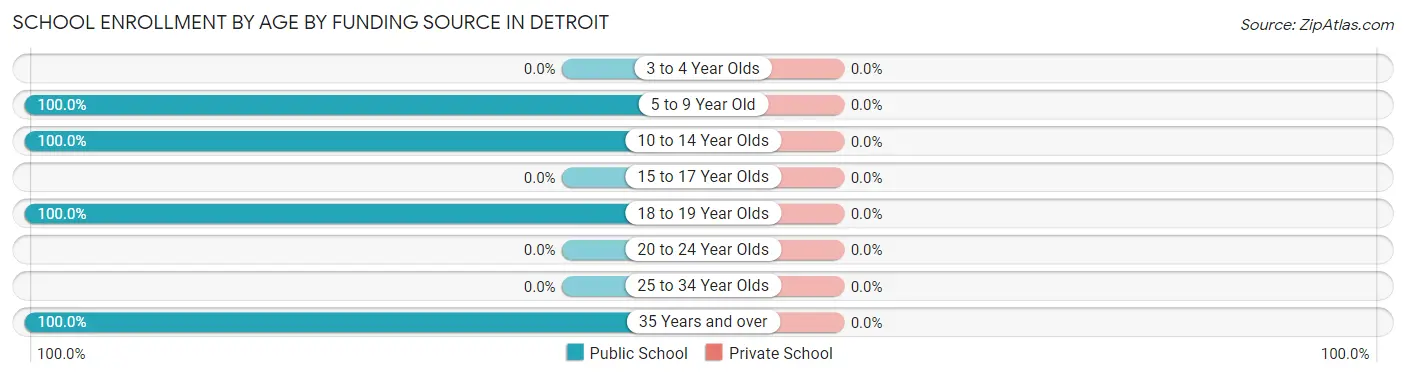
| Age Bracket | Public School | Private School |
| 3 to 4 Year Olds | 0 (0.0%) | 0 (0.0%) |
| 5 to 9 Year Old | 4 (100.0%) | 0 (0.0%) |
| 10 to 14 Year Olds | 14 (100.0%) | 0 (0.0%) |
| 15 to 17 Year Olds | 0 (0.0%) | 0 (0.0%) |
| 18 to 19 Year Olds | 3 (100.0%) | 0 (0.0%) |
| 20 to 24 Year Olds | 0 (0.0%) | 0 (0.0%) |
| 25 to 34 Year Olds | 0 (0.0%) | 0 (0.0%) |
| 35 Years and over | 3 (100.0%) | 0 (0.0%) |
| Total | 24 (100.0%) | 0 (0.0%) |
Educational Attainment by Field of Study in Detroit
Business (8 | 33.3%), science & technology (6 | 25.0%), education (4 | 16.7%), physical & health sciences (2 | 8.3%), and communications (2 | 8.3%) are the most common fields of study among 24 individuals in Detroit who have obtained a bachelor's degree or higher.
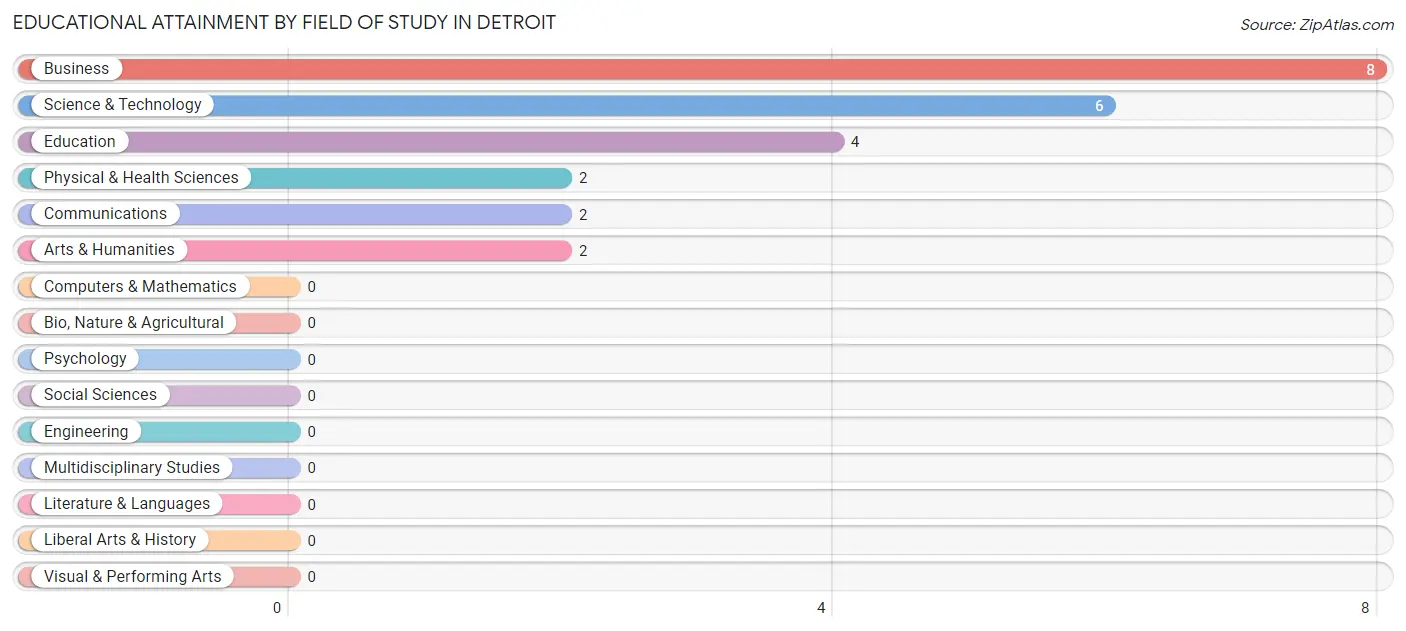
| Field of Study | # Graduates | % Graduates |
| Computers & Mathematics | 0 | 0.0% |
| Bio, Nature & Agricultural | 0 | 0.0% |
| Physical & Health Sciences | 2 | 8.3% |
| Psychology | 0 | 0.0% |
| Social Sciences | 0 | 0.0% |
| Engineering | 0 | 0.0% |
| Multidisciplinary Studies | 0 | 0.0% |
| Science & Technology | 6 | 25.0% |
| Business | 8 | 33.3% |
| Education | 4 | 16.7% |
| Literature & Languages | 0 | 0.0% |
| Liberal Arts & History | 0 | 0.0% |
| Visual & Performing Arts | 0 | 0.0% |
| Communications | 2 | 8.3% |
| Arts & Humanities | 2 | 8.3% |
| Total | 24 | 100.0% |
Transportation & Commute in Detroit
Vehicle Availability by Sex in Detroit
The most prevalent vehicle ownership categories in Detroit are males with 2 vehicles (14, accounting for 56.0%) and females with 2 vehicles (6, making up 93.3%).
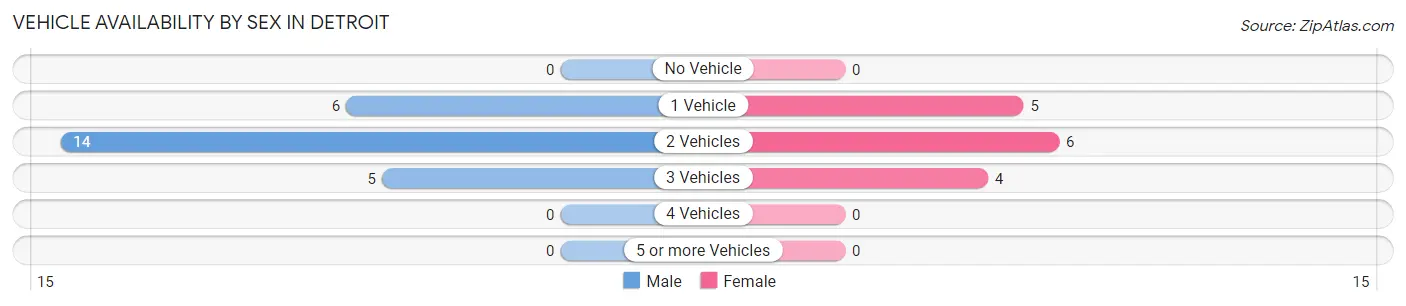
| Vehicles Available | Male | Female |
| No Vehicle | 0 (0.0%) | 0 (0.0%) |
| 1 Vehicle | 6 (24.0%) | 5 (33.3%) |
| 2 Vehicles | 14 (56.0%) | 6 (40.0%) |
| 3 Vehicles | 5 (20.0%) | 4 (26.7%) |
| 4 Vehicles | 0 (0.0%) | 0 (0.0%) |
| 5 or more Vehicles | 0 (0.0%) | 0 (0.0%) |
| Total | 25 (100.0%) | 15 (100.0%) |
Commute Time in Detroit
The most frequently occuring commute durations in Detroit are 5 to 9 minutes (9 commuters, 32.1%), 90 or more minutes (5 commuters, 17.9%), and 20 to 24 minutes (4 commuters, 14.3%).
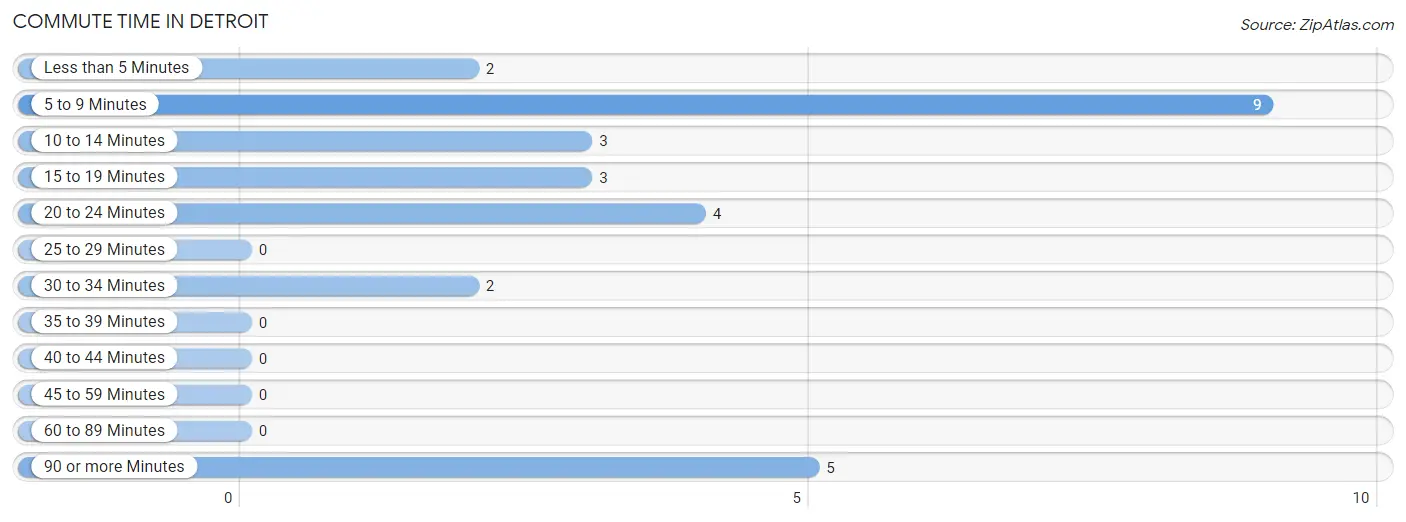
| Commute Time | # Commuters | % Commuters |
| Less than 5 Minutes | 2 | 7.1% |
| 5 to 9 Minutes | 9 | 32.1% |
| 10 to 14 Minutes | 3 | 10.7% |
| 15 to 19 Minutes | 3 | 10.7% |
| 20 to 24 Minutes | 4 | 14.3% |
| 25 to 29 Minutes | 0 | 0.0% |
| 30 to 34 Minutes | 2 | 7.1% |
| 35 to 39 Minutes | 0 | 0.0% |
| 40 to 44 Minutes | 0 | 0.0% |
| 45 to 59 Minutes | 0 | 0.0% |
| 60 to 89 Minutes | 0 | 0.0% |
| 90 or more Minutes | 5 | 17.9% |
Commute Time by Sex in Detroit
The most common commute times in Detroit are 5 to 9 minutes (6 commuters, 31.6%) for males and 5 to 9 minutes (3 commuters, 33.3%) for females.
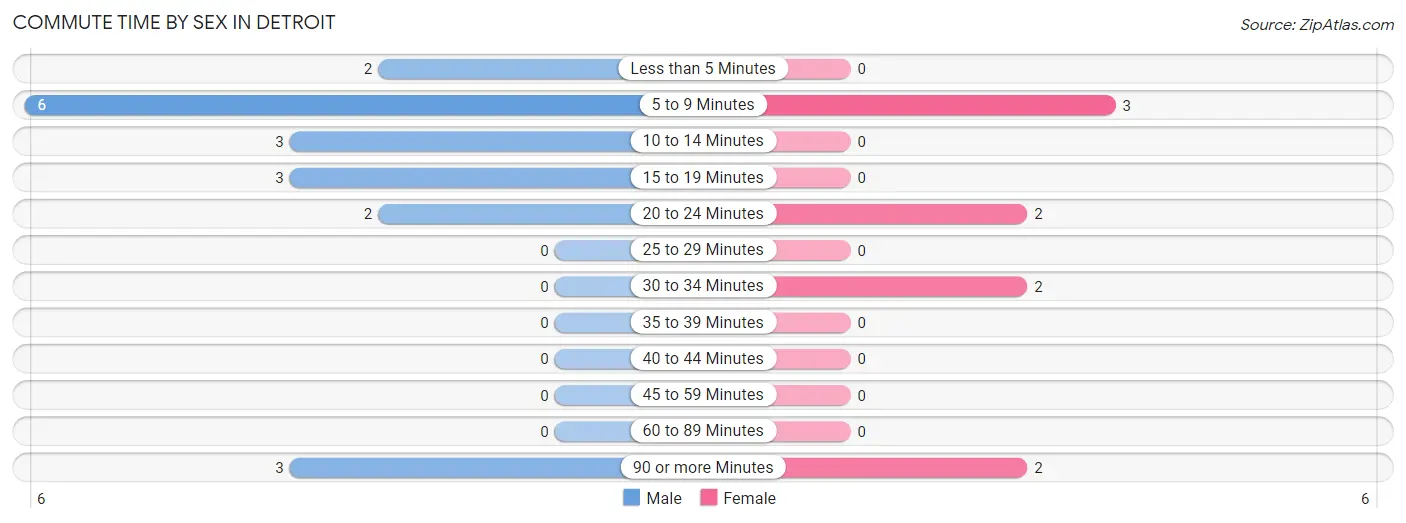
| Commute Time | Male | Female |
| Less than 5 Minutes | 2 (10.5%) | 0 (0.0%) |
| 5 to 9 Minutes | 6 (31.6%) | 3 (33.3%) |
| 10 to 14 Minutes | 3 (15.8%) | 0 (0.0%) |
| 15 to 19 Minutes | 3 (15.8%) | 0 (0.0%) |
| 20 to 24 Minutes | 2 (10.5%) | 2 (22.2%) |
| 25 to 29 Minutes | 0 (0.0%) | 0 (0.0%) |
| 30 to 34 Minutes | 0 (0.0%) | 2 (22.2%) |
| 35 to 39 Minutes | 0 (0.0%) | 0 (0.0%) |
| 40 to 44 Minutes | 0 (0.0%) | 0 (0.0%) |
| 45 to 59 Minutes | 0 (0.0%) | 0 (0.0%) |
| 60 to 89 Minutes | 0 (0.0%) | 0 (0.0%) |
| 90 or more Minutes | 3 (15.8%) | 2 (22.2%) |
Time of Departure to Work by Sex in Detroit
The most frequent times of departure to work in Detroit are 8:30 AM to 8:59 AM (4, 21.0%) for males and 6:00 AM to 6:29 AM (3, 33.3%) for females.
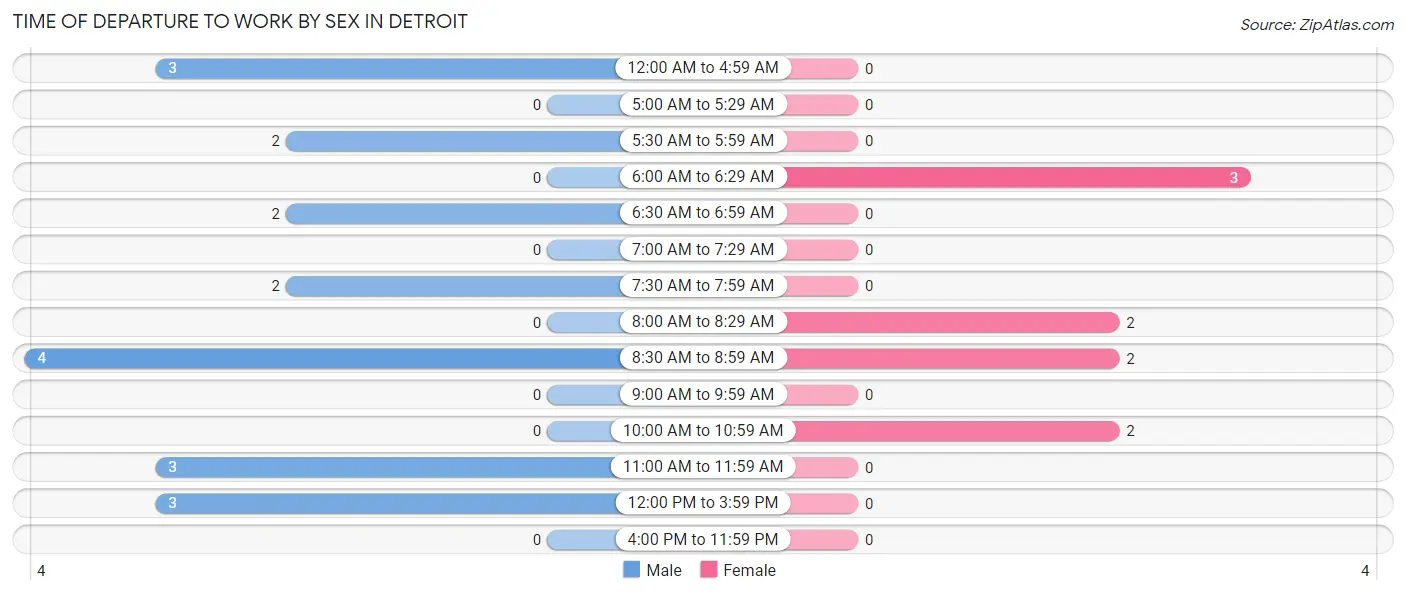
| Time of Departure | Male | Female |
| 12:00 AM to 4:59 AM | 3 (15.8%) | 0 (0.0%) |
| 5:00 AM to 5:29 AM | 0 (0.0%) | 0 (0.0%) |
| 5:30 AM to 5:59 AM | 2 (10.5%) | 0 (0.0%) |
| 6:00 AM to 6:29 AM | 0 (0.0%) | 3 (33.3%) |
| 6:30 AM to 6:59 AM | 2 (10.5%) | 0 (0.0%) |
| 7:00 AM to 7:29 AM | 0 (0.0%) | 0 (0.0%) |
| 7:30 AM to 7:59 AM | 2 (10.5%) | 0 (0.0%) |
| 8:00 AM to 8:29 AM | 0 (0.0%) | 2 (22.2%) |
| 8:30 AM to 8:59 AM | 4 (21.0%) | 2 (22.2%) |
| 9:00 AM to 9:59 AM | 0 (0.0%) | 0 (0.0%) |
| 10:00 AM to 10:59 AM | 0 (0.0%) | 2 (22.2%) |
| 11:00 AM to 11:59 AM | 3 (15.8%) | 0 (0.0%) |
| 12:00 PM to 3:59 PM | 3 (15.8%) | 0 (0.0%) |
| 4:00 PM to 11:59 PM | 0 (0.0%) | 0 (0.0%) |
| Total | 19 (100.0%) | 9 (100.0%) |
Housing Occupancy in Detroit
Occupancy by Ownership in Detroit
Of the total 53 dwellings in Detroit, owner-occupied units account for 48 (90.6%), while renter-occupied units make up 5 (9.4%).
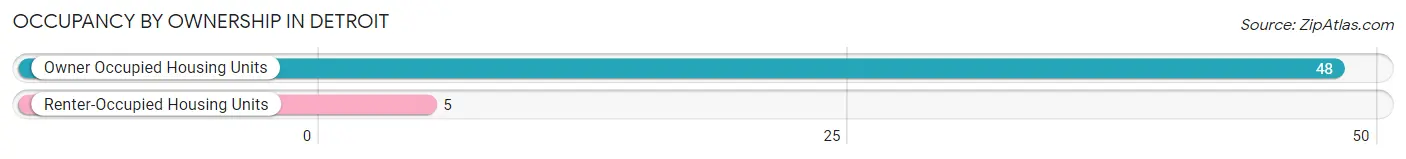
| Occupancy | # Housing Units | % Housing Units |
| Owner Occupied Housing Units | 48 | 90.6% |
| Renter-Occupied Housing Units | 5 | 9.4% |
| Total Occupied Housing Units | 53 | 100.0% |
Occupancy by Household Size in Detroit
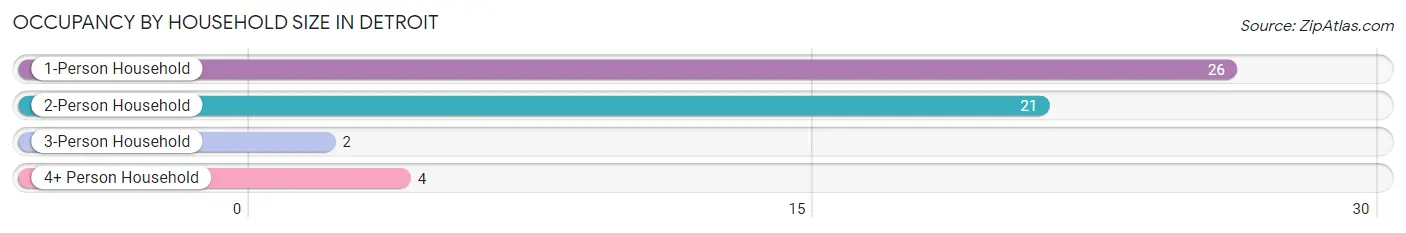
| Household Size | # Housing Units | % Housing Units |
| 1-Person Household | 26 | 49.1% |
| 2-Person Household | 21 | 39.6% |
| 3-Person Household | 2 | 3.8% |
| 4+ Person Household | 4 | 7.5% |
| Total Housing Units | 53 | 100.0% |
Occupancy by Ownership by Household Size in Detroit
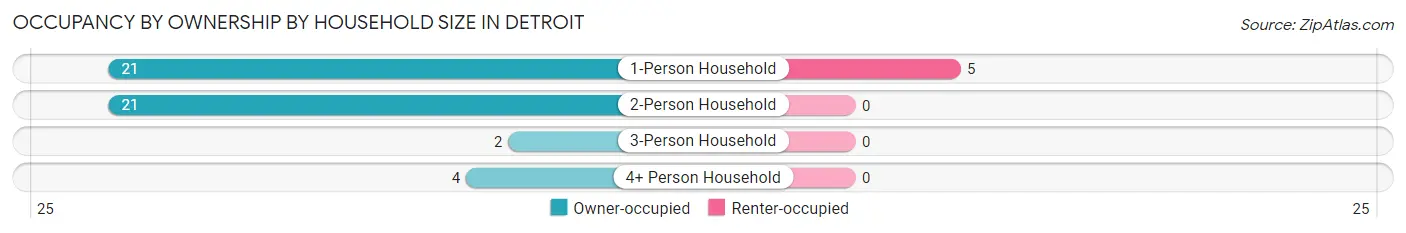
| Household Size | Owner-occupied | Renter-occupied |
| 1-Person Household | 21 (80.8%) | 5 (19.2%) |
| 2-Person Household | 21 (100.0%) | 0 (0.0%) |
| 3-Person Household | 2 (100.0%) | 0 (0.0%) |
| 4+ Person Household | 4 (100.0%) | 0 (0.0%) |
| Total Housing Units | 48 (90.6%) | 5 (9.4%) |
Occupancy by Educational Attainment in Detroit
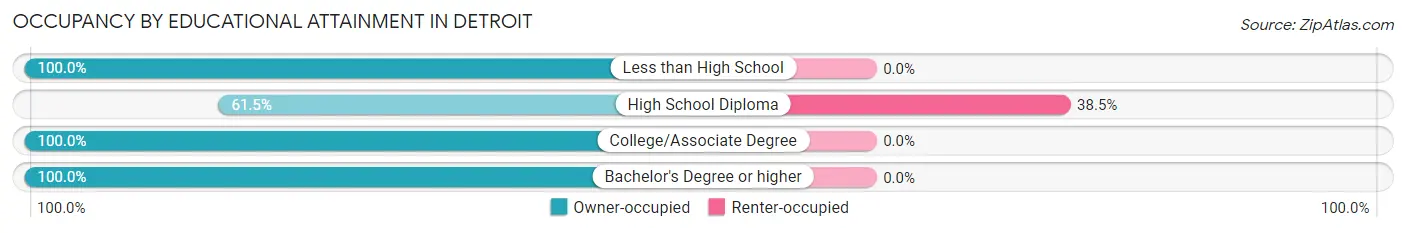
| Household Size | Owner-occupied | Renter-occupied |
| Less than High School | 2 (100.0%) | 0 (0.0%) |
| High School Diploma | 8 (61.5%) | 5 (38.5%) |
| College/Associate Degree | 20 (100.0%) | 0 (0.0%) |
| Bachelor's Degree or higher | 18 (100.0%) | 0 (0.0%) |
Occupancy by Age of Householder in Detroit
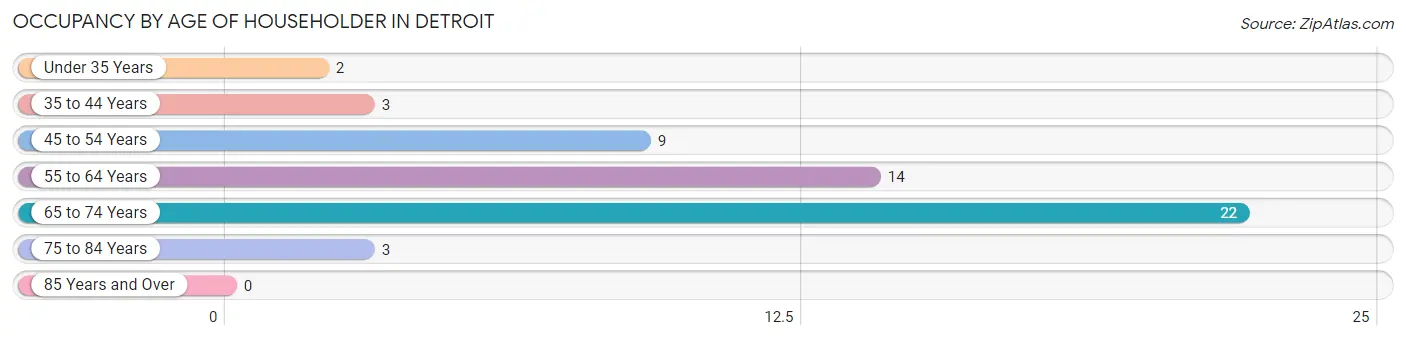
| Age Bracket | # Households | % Households |
| Under 35 Years | 2 | 3.8% |
| 35 to 44 Years | 3 | 5.7% |
| 45 to 54 Years | 9 | 17.0% |
| 55 to 64 Years | 14 | 26.4% |
| 65 to 74 Years | 22 | 41.5% |
| 75 to 84 Years | 3 | 5.7% |
| 85 Years and Over | 0 | 0.0% |
| Total | 53 | 100.0% |
Housing Finances in Detroit
Median Income by Occupancy in Detroit
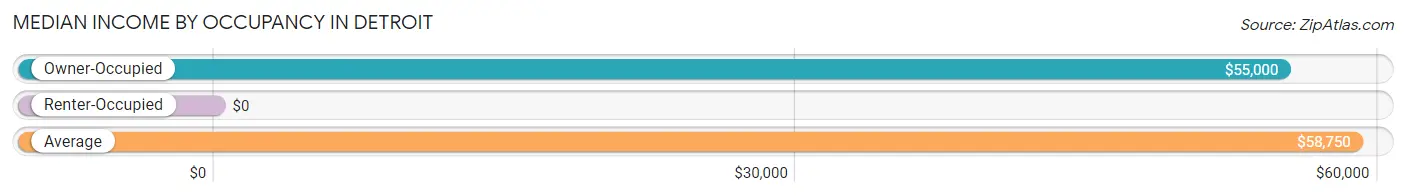
| Occupancy Type | # Households | Median Income |
| Owner-Occupied | 48 (90.6%) | $55,000 |
| Renter-Occupied | 5 (9.4%) | $0 |
| Average | 53 (100.0%) | $58,750 |
Occupancy by Householder Income Bracket in Detroit
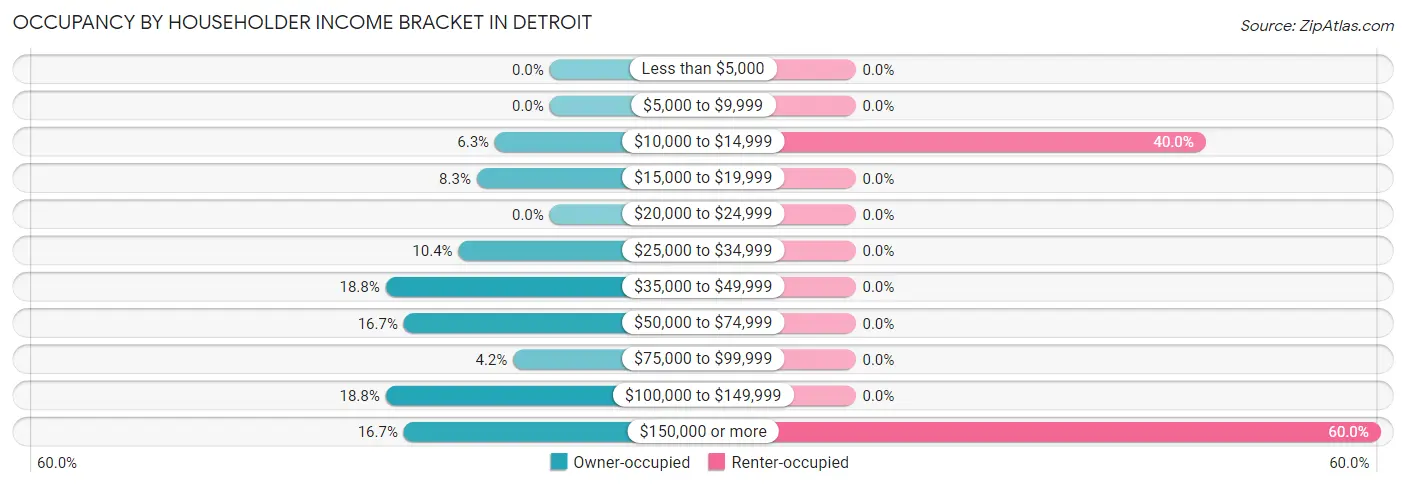
| Income Bracket | Owner-occupied | Renter-occupied |
| Less than $5,000 | 0 (0.0%) | 0 (0.0%) |
| $5,000 to $9,999 | 0 (0.0%) | 0 (0.0%) |
| $10,000 to $14,999 | 3 (6.2%) | 2 (40.0%) |
| $15,000 to $19,999 | 4 (8.3%) | 0 (0.0%) |
| $20,000 to $24,999 | 0 (0.0%) | 0 (0.0%) |
| $25,000 to $34,999 | 5 (10.4%) | 0 (0.0%) |
| $35,000 to $49,999 | 9 (18.8%) | 0 (0.0%) |
| $50,000 to $74,999 | 8 (16.7%) | 0 (0.0%) |
| $75,000 to $99,999 | 2 (4.2%) | 0 (0.0%) |
| $100,000 to $149,999 | 9 (18.8%) | 0 (0.0%) |
| $150,000 or more | 8 (16.7%) | 3 (60.0%) |
| Total | 48 (100.0%) | 5 (100.0%) |
Monthly Housing Cost Tiers in Detroit
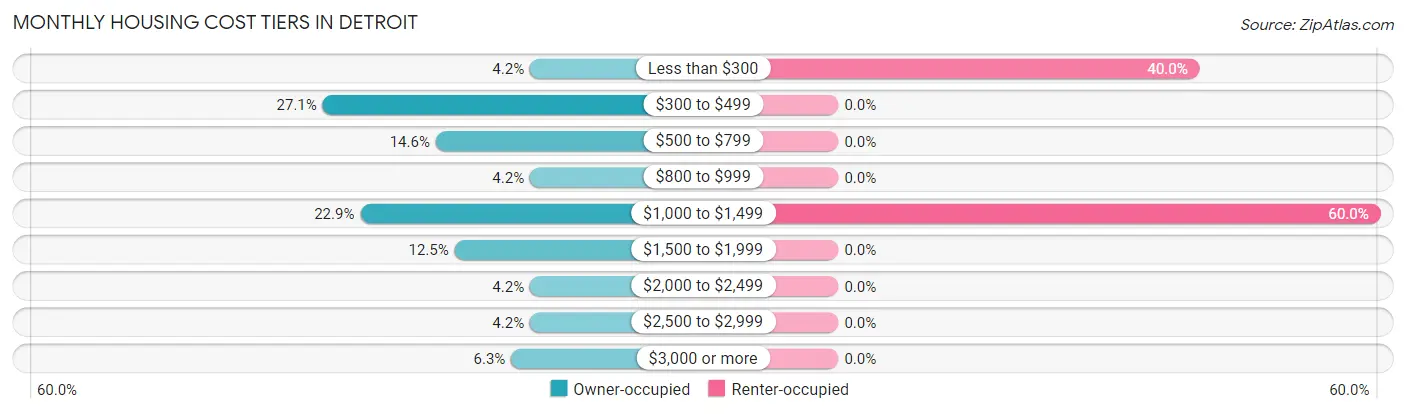
| Monthly Cost | Owner-occupied | Renter-occupied |
| Less than $300 | 2 (4.2%) | 2 (40.0%) |
| $300 to $499 | 13 (27.1%) | 0 (0.0%) |
| $500 to $799 | 7 (14.6%) | 0 (0.0%) |
| $800 to $999 | 2 (4.2%) | 0 (0.0%) |
| $1,000 to $1,499 | 11 (22.9%) | 3 (60.0%) |
| $1,500 to $1,999 | 6 (12.5%) | 0 (0.0%) |
| $2,000 to $2,499 | 2 (4.2%) | 0 (0.0%) |
| $2,500 to $2,999 | 2 (4.2%) | 0 (0.0%) |
| $3,000 or more | 3 (6.2%) | 0 (0.0%) |
| Total | 48 (100.0%) | 5 (100.0%) |
Physical Housing Characteristics in Detroit
Housing Structures in Detroit
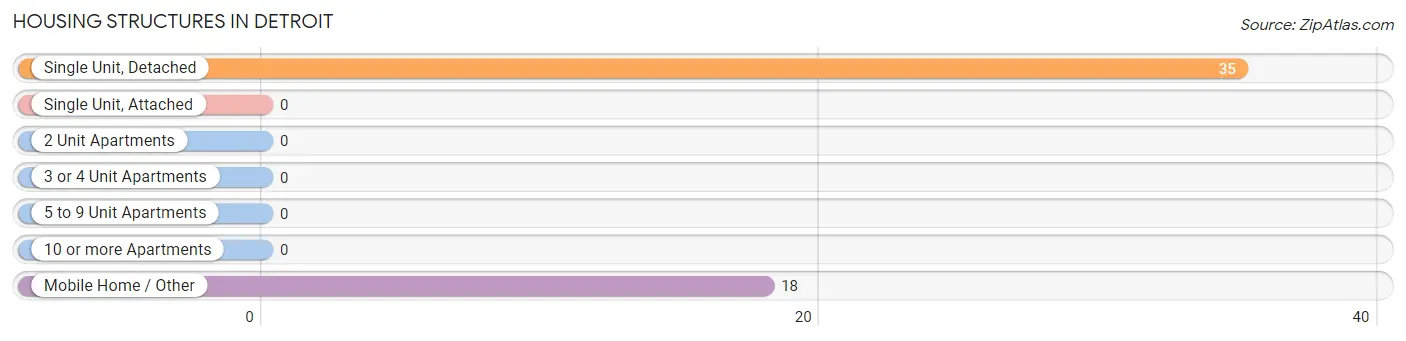
| Structure Type | # Housing Units | % Housing Units |
| Single Unit, Detached | 35 | 66.0% |
| Single Unit, Attached | 0 | 0.0% |
| 2 Unit Apartments | 0 | 0.0% |
| 3 or 4 Unit Apartments | 0 | 0.0% |
| 5 to 9 Unit Apartments | 0 | 0.0% |
| 10 or more Apartments | 0 | 0.0% |
| Mobile Home / Other | 18 | 34.0% |
| Total | 53 | 100.0% |
Housing Structures by Occupancy in Detroit
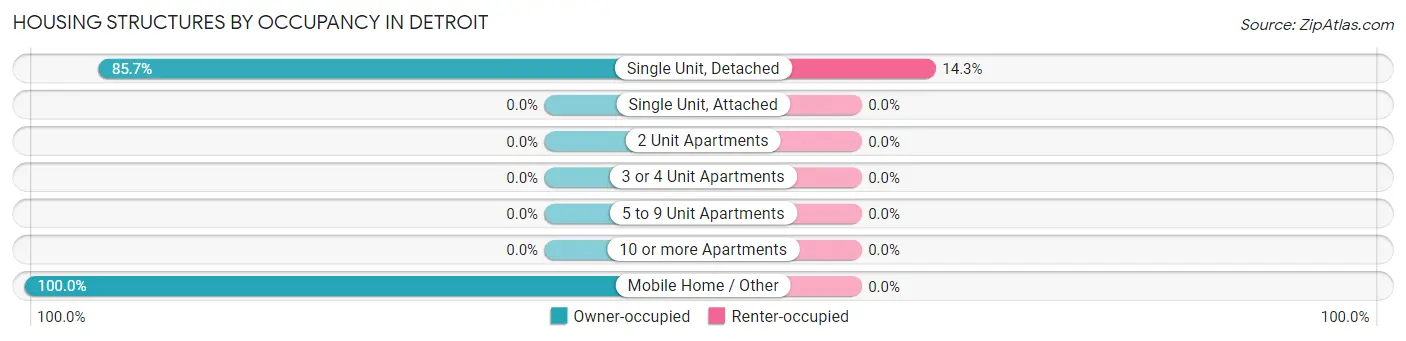
| Structure Type | Owner-occupied | Renter-occupied |
| Single Unit, Detached | 30 (85.7%) | 5 (14.3%) |
| Single Unit, Attached | 0 (0.0%) | 0 (0.0%) |
| 2 Unit Apartments | 0 (0.0%) | 0 (0.0%) |
| 3 or 4 Unit Apartments | 0 (0.0%) | 0 (0.0%) |
| 5 to 9 Unit Apartments | 0 (0.0%) | 0 (0.0%) |
| 10 or more Apartments | 0 (0.0%) | 0 (0.0%) |
| Mobile Home / Other | 18 (100.0%) | 0 (0.0%) |
| Total | 48 (90.6%) | 5 (9.4%) |
Housing Structures by Number of Rooms in Detroit
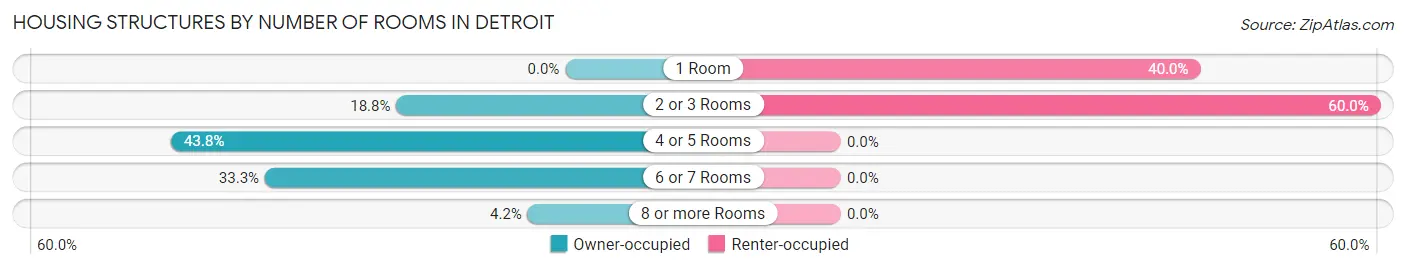
| Number of Rooms | Owner-occupied | Renter-occupied |
| 1 Room | 0 (0.0%) | 2 (40.0%) |
| 2 or 3 Rooms | 9 (18.8%) | 3 (60.0%) |
| 4 or 5 Rooms | 21 (43.8%) | 0 (0.0%) |
| 6 or 7 Rooms | 16 (33.3%) | 0 (0.0%) |
| 8 or more Rooms | 2 (4.2%) | 0 (0.0%) |
| Total | 48 (100.0%) | 5 (100.0%) |
Housing Structure by Heating Type in Detroit
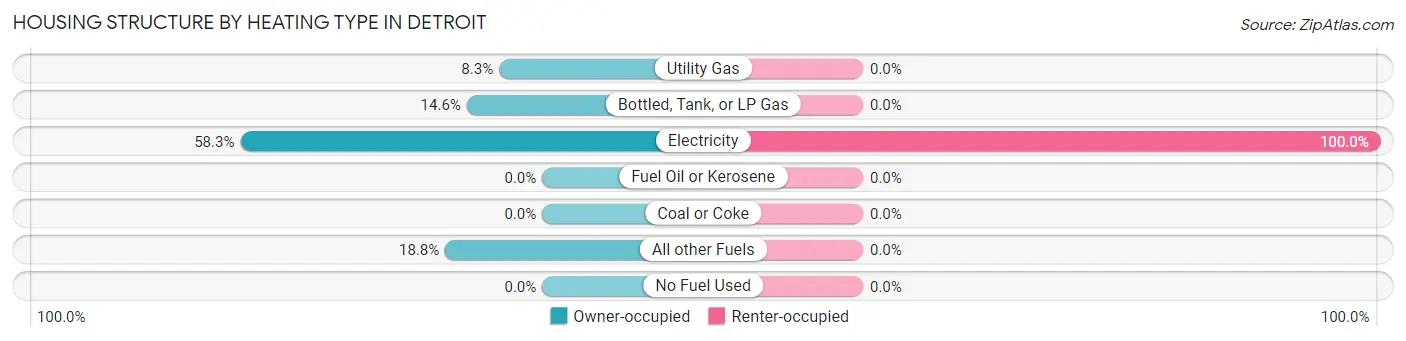
| Heating Type | Owner-occupied | Renter-occupied |
| Utility Gas | 4 (8.3%) | 0 (0.0%) |
| Bottled, Tank, or LP Gas | 7 (14.6%) | 0 (0.0%) |
| Electricity | 28 (58.3%) | 5 (100.0%) |
| Fuel Oil or Kerosene | 0 (0.0%) | 0 (0.0%) |
| Coal or Coke | 0 (0.0%) | 0 (0.0%) |
| All other Fuels | 9 (18.8%) | 0 (0.0%) |
| No Fuel Used | 0 (0.0%) | 0 (0.0%) |
| Total | 48 (100.0%) | 5 (100.0%) |
Household Vehicle Usage in Detroit
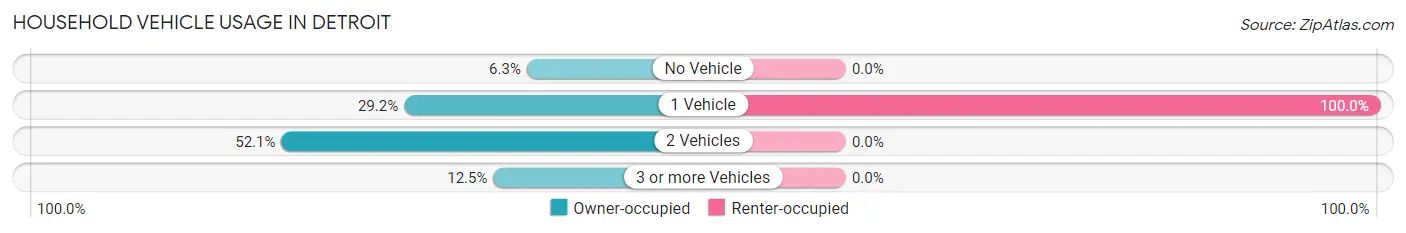
| Vehicles per Household | Owner-occupied | Renter-occupied |
| No Vehicle | 3 (6.2%) | 0 (0.0%) |
| 1 Vehicle | 14 (29.2%) | 5 (100.0%) |
| 2 Vehicles | 25 (52.1%) | 0 (0.0%) |
| 3 or more Vehicles | 6 (12.5%) | 0 (0.0%) |
| Total | 48 (100.0%) | 5 (100.0%) |
Real Estate & Mortgages in Detroit
Real Estate and Mortgage Overview in Detroit
| Characteristic | Without Mortgage | With Mortgage |
| Housing Units | 22 | 26 |
| Median Property Value | $221,400 | $0 |
| Median Household Income | - | - |
| Monthly Housing Costs | $450 | $3 |
| Real Estate Taxes | $1,300 | $0 |
Property Value by Mortgage Status in Detroit
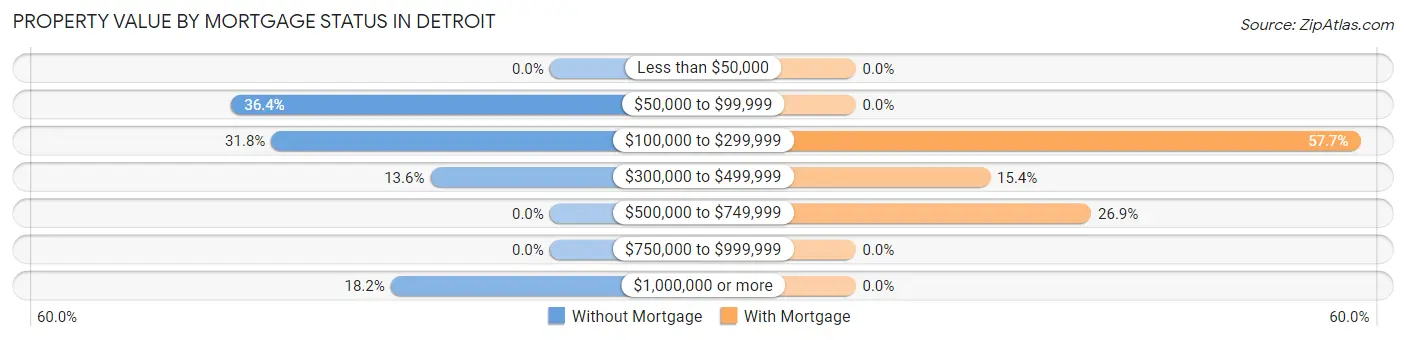
| Property Value | Without Mortgage | With Mortgage |
| Less than $50,000 | 0 (0.0%) | 0 (0.0%) |
| $50,000 to $99,999 | 8 (36.4%) | 0 (0.0%) |
| $100,000 to $299,999 | 7 (31.8%) | 15 (57.7%) |
| $300,000 to $499,999 | 3 (13.6%) | 4 (15.4%) |
| $500,000 to $749,999 | 0 (0.0%) | 7 (26.9%) |
| $750,000 to $999,999 | 0 (0.0%) | 0 (0.0%) |
| $1,000,000 or more | 4 (18.2%) | 0 (0.0%) |
| Total | 22 (100.0%) | 26 (100.0%) |
Household Income by Mortgage Status in Detroit
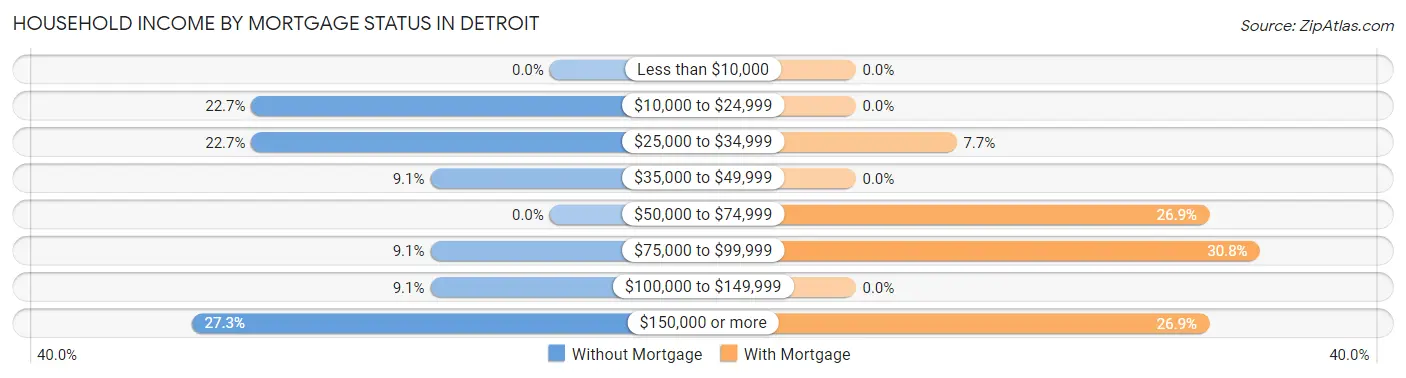
| Household Income | Without Mortgage | With Mortgage |
| Less than $10,000 | 0 (0.0%) | 0 (0.0%) |
| $10,000 to $24,999 | 5 (22.7%) | 0 (0.0%) |
| $25,000 to $34,999 | 5 (22.7%) | 2 (7.7%) |
| $35,000 to $49,999 | 2 (9.1%) | 0 (0.0%) |
| $50,000 to $74,999 | 0 (0.0%) | 7 (26.9%) |
| $75,000 to $99,999 | 2 (9.1%) | 8 (30.8%) |
| $100,000 to $149,999 | 2 (9.1%) | 0 (0.0%) |
| $150,000 or more | 6 (27.3%) | 7 (26.9%) |
| Total | 22 (100.0%) | 26 (100.0%) |
Property Value to Household Income Ratio in Detroit
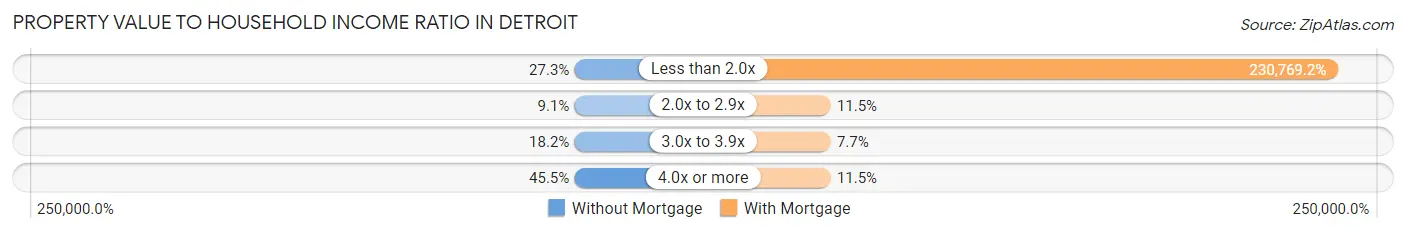
| Value-to-Income Ratio | Without Mortgage | With Mortgage |
| Less than 2.0x | 6 (27.3%) | 60,000 (230,769.2%) |
| 2.0x to 2.9x | 2 (9.1%) | 3 (11.5%) |
| 3.0x to 3.9x | 4 (18.2%) | 2 (7.7%) |
| 4.0x or more | 10 (45.5%) | 3 (11.5%) |
| Total | 22 (100.0%) | 26 (100.0%) |
Real Estate Taxes by Mortgage Status in Detroit
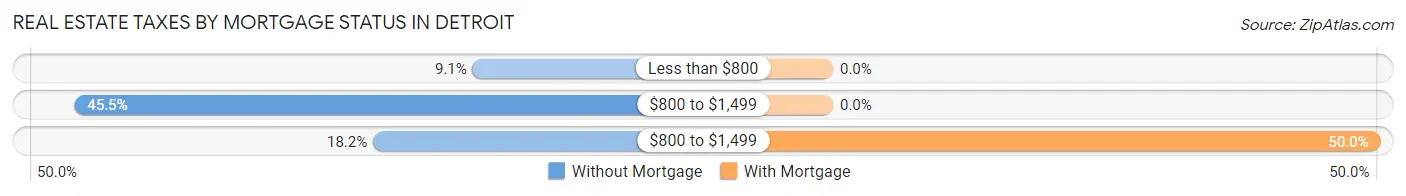
| Property Taxes | Without Mortgage | With Mortgage |
| Less than $800 | 2 (9.1%) | 0 (0.0%) |
| $800 to $1,499 | 10 (45.5%) | 0 (0.0%) |
| $800 to $1,499 | 4 (18.2%) | 13 (50.0%) |
| Total | 22 (100.0%) | 26 (100.0%) |
Health & Disability in Detroit
Health Insurance Coverage by Age in Detroit
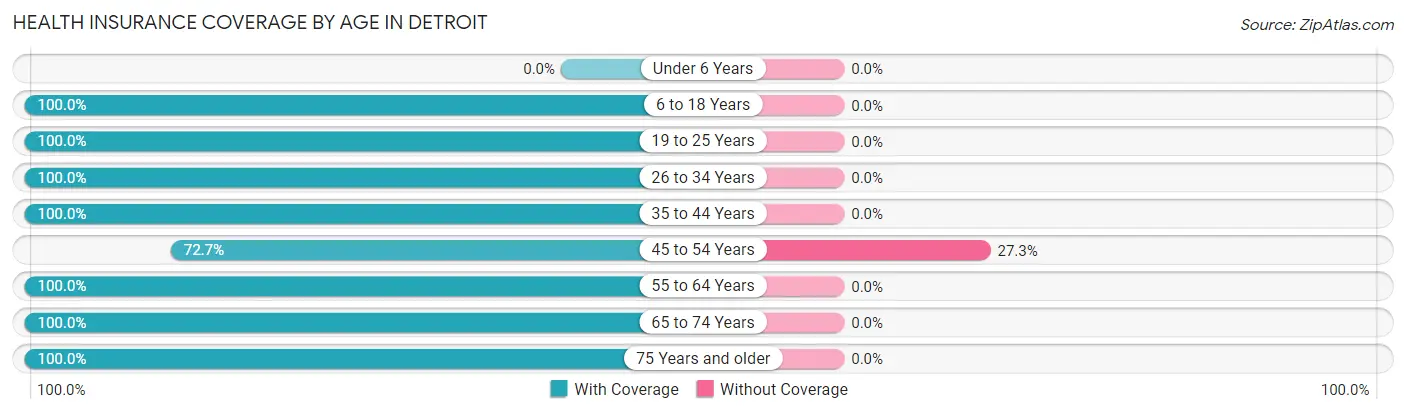
| Age Bracket | With Coverage | Without Coverage |
| Under 6 Years | 0 (0.0%) | 0 (0.0%) |
| 6 to 18 Years | 18 (100.0%) | 0 (0.0%) |
| 19 to 25 Years | 3 (100.0%) | 0 (0.0%) |
| 26 to 34 Years | 2 (100.0%) | 0 (0.0%) |
| 35 to 44 Years | 3 (100.0%) | 0 (0.0%) |
| 45 to 54 Years | 8 (72.7%) | 3 (27.3%) |
| 55 to 64 Years | 22 (100.0%) | 0 (0.0%) |
| 65 to 74 Years | 36 (100.0%) | 0 (0.0%) |
| 75 Years and older | 7 (100.0%) | 0 (0.0%) |
| Total | 99 (97.1%) | 3 (2.9%) |
Health Insurance Coverage by Citizenship Status in Detroit
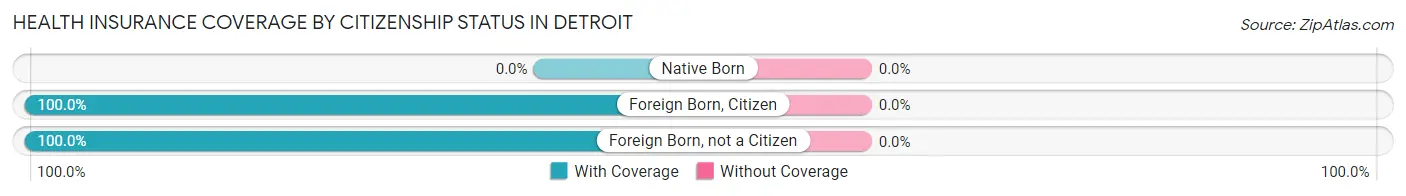
| Citizenship Status | With Coverage | Without Coverage |
| Native Born | 0 (0.0%) | 0 (0.0%) |
| Foreign Born, Citizen | 18 (100.0%) | 0 (0.0%) |
| Foreign Born, not a Citizen | 3 (100.0%) | 0 (0.0%) |
Health Insurance Coverage by Household Income in Detroit
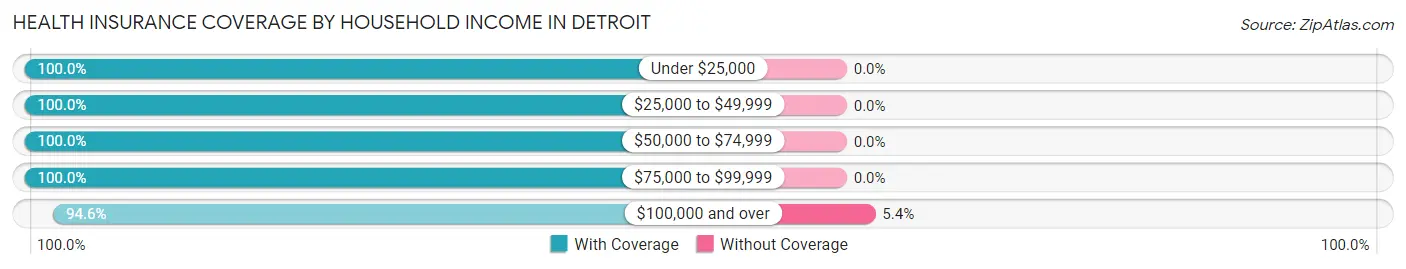
| Household Income | With Coverage | Without Coverage |
| Under $25,000 | 12 (100.0%) | 0 (0.0%) |
| $25,000 to $49,999 | 20 (100.0%) | 0 (0.0%) |
| $50,000 to $74,999 | 11 (100.0%) | 0 (0.0%) |
| $75,000 to $99,999 | 3 (100.0%) | 0 (0.0%) |
| $100,000 and over | 53 (94.6%) | 3 (5.4%) |
Public vs Private Health Insurance Coverage by Age in Detroit
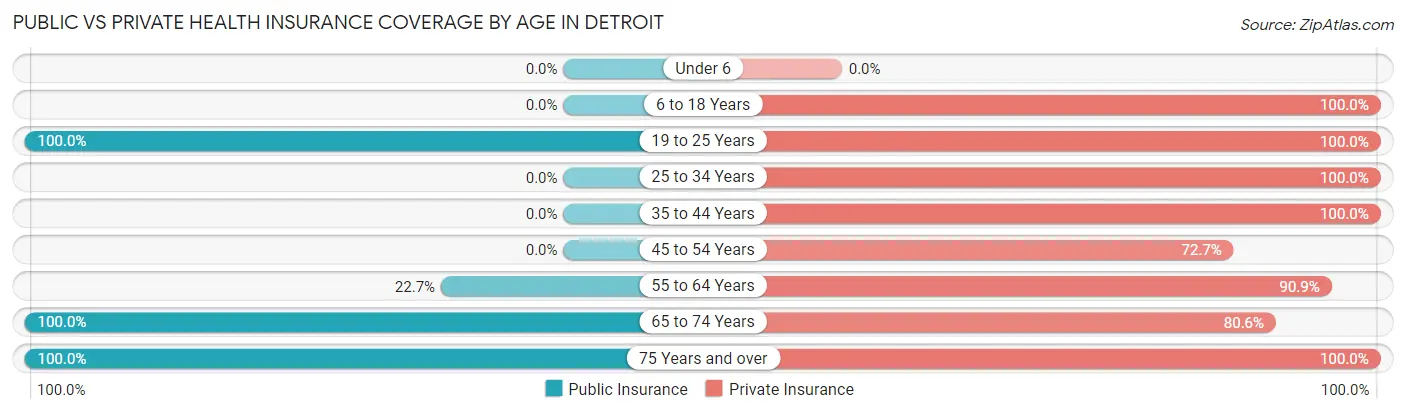
| Age Bracket | Public Insurance | Private Insurance |
| Under 6 | 0 (0.0%) | 0 (0.0%) |
| 6 to 18 Years | 0 (0.0%) | 18 (100.0%) |
| 19 to 25 Years | 3 (100.0%) | 3 (100.0%) |
| 25 to 34 Years | 0 (0.0%) | 2 (100.0%) |
| 35 to 44 Years | 0 (0.0%) | 3 (100.0%) |
| 45 to 54 Years | 0 (0.0%) | 8 (72.7%) |
| 55 to 64 Years | 5 (22.7%) | 20 (90.9%) |
| 65 to 74 Years | 36 (100.0%) | 29 (80.6%) |
| 75 Years and over | 7 (100.0%) | 7 (100.0%) |
| Total | 51 (50.0%) | 90 (88.2%) |
Disability Status by Sex by Age in Detroit
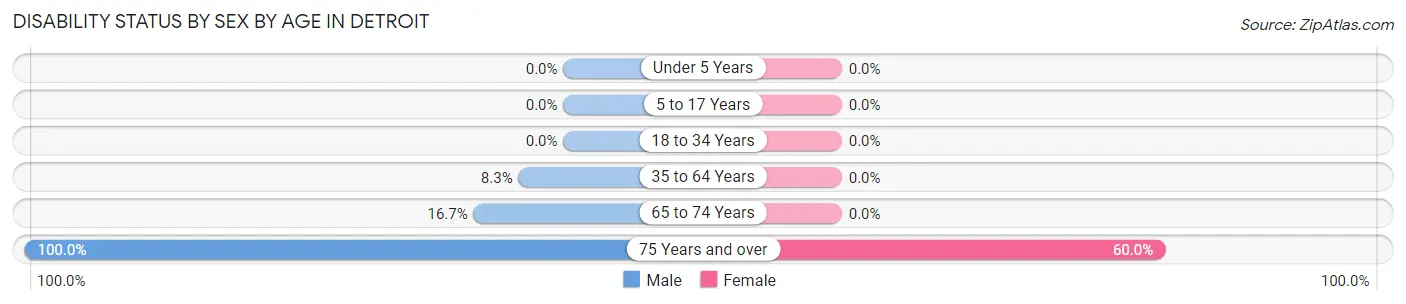
| Age Bracket | Male | Female |
| Under 5 Years | 0 (0.0%) | 0 (0.0%) |
| 5 to 17 Years | 0 (0.0%) | 0 (0.0%) |
| 18 to 34 Years | 0 (0.0%) | 0 (0.0%) |
| 35 to 64 Years | 2 (8.3%) | 0 (0.0%) |
| 65 to 74 Years | 3 (16.7%) | 0 (0.0%) |
| 75 Years and over | 2 (100.0%) | 3 (60.0%) |
Disability Class by Sex by Age in Detroit
Disability Class: Hearing Difficulty
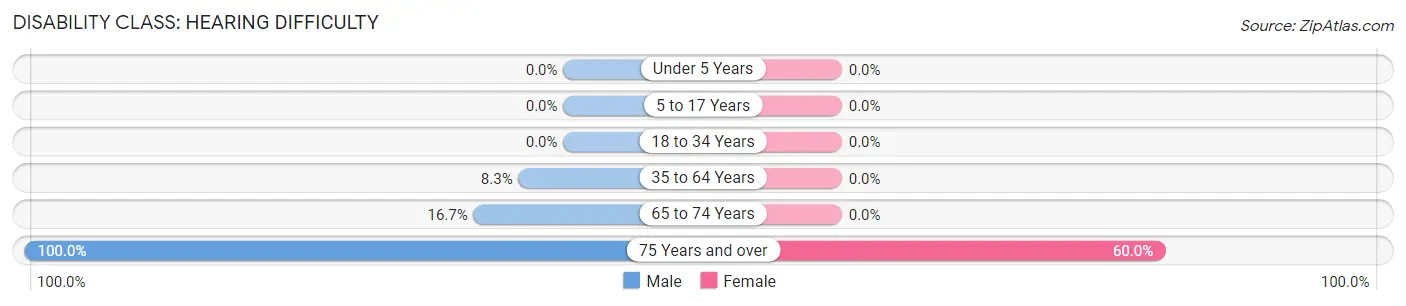
| Age Bracket | Male | Female |
| Under 5 Years | 0 (0.0%) | 0 (0.0%) |
| 5 to 17 Years | 0 (0.0%) | 0 (0.0%) |
| 18 to 34 Years | 0 (0.0%) | 0 (0.0%) |
| 35 to 64 Years | 2 (8.3%) | 0 (0.0%) |
| 65 to 74 Years | 3 (16.7%) | 0 (0.0%) |
| 75 Years and over | 2 (100.0%) | 3 (60.0%) |
Disability Class: Vision Difficulty
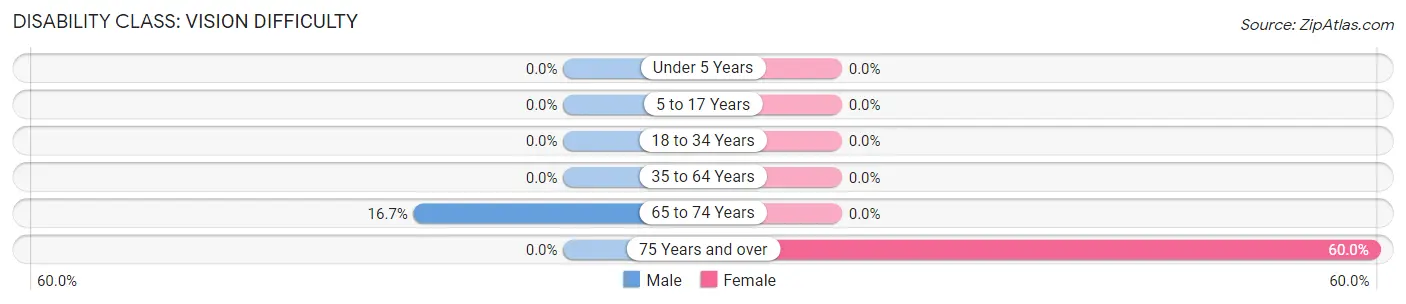
| Age Bracket | Male | Female |
| Under 5 Years | 0 (0.0%) | 0 (0.0%) |
| 5 to 17 Years | 0 (0.0%) | 0 (0.0%) |
| 18 to 34 Years | 0 (0.0%) | 0 (0.0%) |
| 35 to 64 Years | 0 (0.0%) | 0 (0.0%) |
| 65 to 74 Years | 3 (16.7%) | 0 (0.0%) |
| 75 Years and over | 0 (0.0%) | 3 (60.0%) |
Disability Class: Cognitive Difficulty
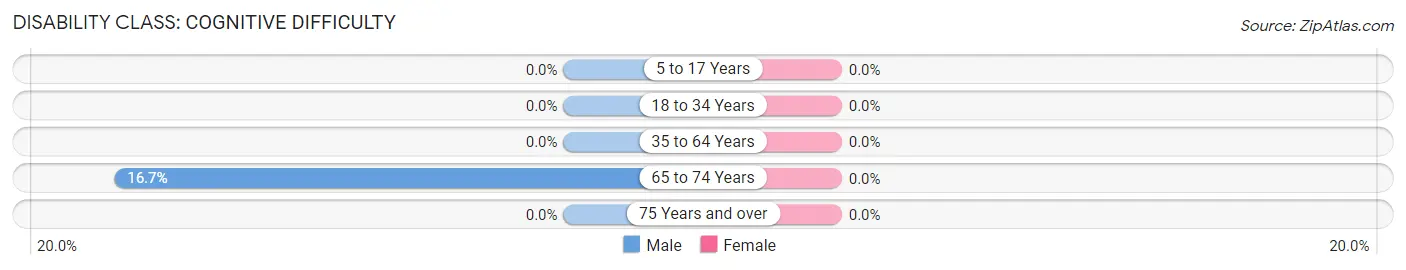
| Age Bracket | Male | Female |
| 5 to 17 Years | 0 (0.0%) | 0 (0.0%) |
| 18 to 34 Years | 0 (0.0%) | 0 (0.0%) |
| 35 to 64 Years | 0 (0.0%) | 0 (0.0%) |
| 65 to 74 Years | 3 (16.7%) | 0 (0.0%) |
| 75 Years and over | 0 (0.0%) | 0 (0.0%) |
Disability Class: Ambulatory Difficulty
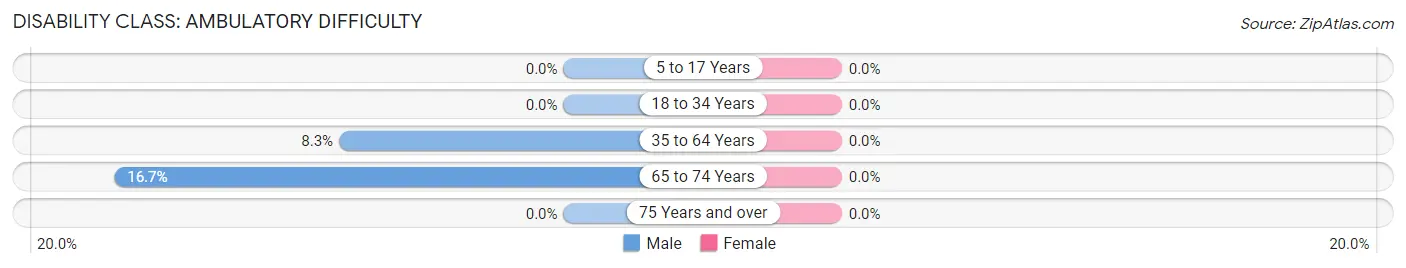
| Age Bracket | Male | Female |
| 5 to 17 Years | 0 (0.0%) | 0 (0.0%) |
| 18 to 34 Years | 0 (0.0%) | 0 (0.0%) |
| 35 to 64 Years | 2 (8.3%) | 0 (0.0%) |
| 65 to 74 Years | 3 (16.7%) | 0 (0.0%) |
| 75 Years and over | 0 (0.0%) | 0 (0.0%) |
Disability Class: Self-Care Difficulty

| Age Bracket | Male | Female |
| 5 to 17 Years | 0 (0.0%) | 0 (0.0%) |
| 18 to 34 Years | 0 (0.0%) | 0 (0.0%) |
| 35 to 64 Years | 0 (0.0%) | 0 (0.0%) |
| 65 to 74 Years | 3 (16.7%) | 0 (0.0%) |
| 75 Years and over | 0 (0.0%) | 0 (0.0%) |
Technology Access in Detroit
Computing Device Access in Detroit
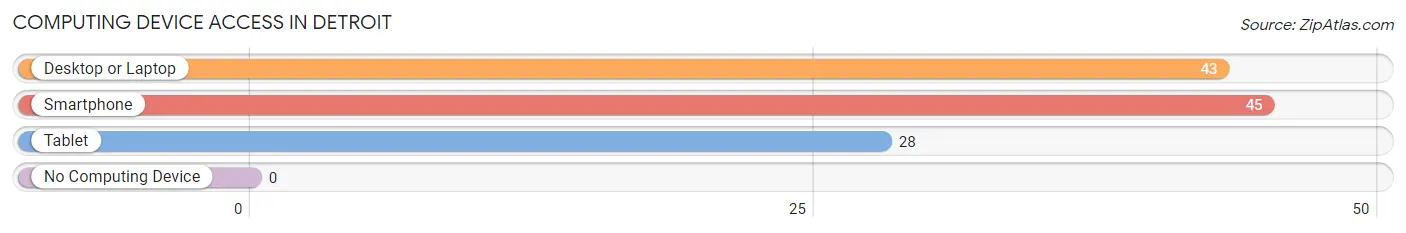
| Device Type | # Households | % Households |
| Desktop or Laptop | 43 | 81.1% |
| Smartphone | 45 | 84.9% |
| Tablet | 28 | 52.8% |
| No Computing Device | 0 | 0.0% |
| Total | 53 | 100.0% |
Internet Access in Detroit
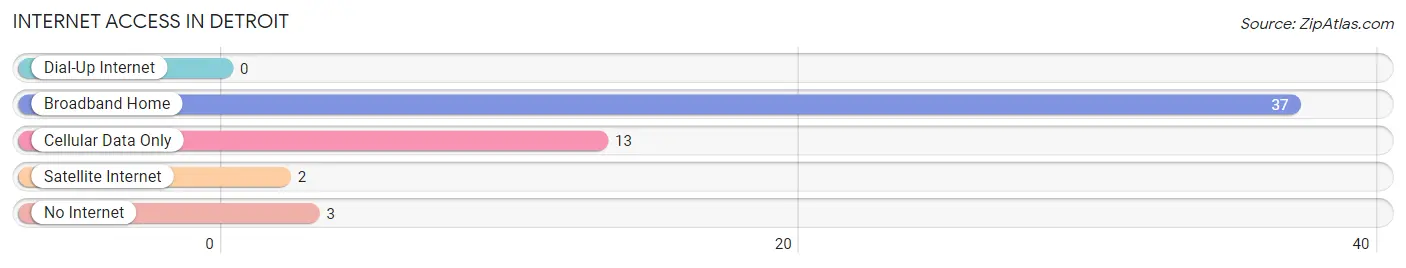
| Internet Type | # Households | % Households |
| Dial-Up Internet | 0 | 0.0% |
| Broadband Home | 37 | 69.8% |
| Cellular Data Only | 13 | 24.5% |
| Satellite Internet | 2 | 3.8% |
| No Internet | 3 | 5.7% |
| Total | 53 | 100.0% |
Detroit Summary
Detroit, Michigan is a major city located in the Midwestern United States. It is the largest city in the state of Michigan and the second-largest city in the Midwest, behind Chicago. Detroit is the seat of Wayne County and is the largest city on the United States–Canada border. It is a major port city on the Detroit River, one of the four major straits that connect the Great Lakes system.
History
The area that is now Detroit was first settled by the French in 1701, when Antoine de la Mothe Cadillac founded Fort Pontchartrain du Détroit. The city was incorporated in 1815 and became the capital of the Michigan Territory in 1805. Detroit was the site of the Battle of Detroit in 1812, during the War of 1812. The city was captured by the British and held until the end of the war.
In the 19th century, Detroit became an important industrial center, with the construction of the Detroit-Windsor Tunnel in 1855 and the opening of the first automobile assembly line in the world at the Ford Motor Company in 1903. Detroit was also the birthplace of the Motown sound, which became a major influence in popular music in the 1960s and 1970s.
In the 20th century, Detroit experienced a period of rapid growth and industrialization, becoming the fourth-largest city in the United States by 1950. However, the city's economy began to decline in the late 1960s and early 1970s, leading to a period of urban decay and population loss. In the 1980s and 1990s, the city began to experience a resurgence, with the construction of new sports stadiums, casinos, and other developments.
Geography
Detroit is located in southeastern Michigan, on the Detroit River, which connects Lake St. Clair and Lake Erie. The city is situated on the Detroit Plateau, a flat plain that rises from the river and is surrounded by hills and bluffs. The city is divided into several distinct neighborhoods, including Downtown, Midtown, Corktown, and the East Side.
The city has a total area of 143.8 square miles, of which 139.8 square miles is land and 4.0 square miles is water. The city is located in the humid continental climate zone, with hot, humid summers and cold, snowy winters.
Economy
Detroit is a major center for the automotive industry, with the headquarters of the Big Three automakers—Ford, General Motors, and Chrysler—all located in the city. The city is also home to numerous other automotive-related businesses, including suppliers, parts manufacturers, and research and development centers.
The city is also a major center for the health care industry, with several major hospitals and medical research centers located in the city. Other major industries in the city include finance, manufacturing, and tourism.
Demographics
As of the 2010 census, the population of Detroit was 713,777, making it the 18th-largest city in the United States. The city has a population density of 5,144 people per square mile. The racial makeup of the city was 82.7% African American, 10.6% White, 2.3% Asian, and 2.4% from other races.
The median household income in Detroit was $26,098 in 2010, and the median family income was $31,011. The city's poverty rate was 37.6%, and the unemployment rate was 16.3%. The city's population is largely concentrated in the downtown area, with the majority of the population living in the neighborhoods of Midtown, Corktown, and the East Side.
Common Questions
What is Per Capita Income in Detroit?
Per Capita income in Detroit is $49,761.
What is the Median Family Income in Detroit?
Median Family Income in Detroit is $120,625.
What is the Median Household income in Detroit?
Median Household Income in Detroit is $58,750.
What is Inequality or Gini Index in Detroit?
Inequality or Gini Index in Detroit is 0.47.
What is the Total Population of Detroit?
Total Population of Detroit is 102.
What is the Total Male Population of Detroit?
Total Male Population of Detroit is 56.
What is the Total Female Population of Detroit?
Total Female Population of Detroit is 46.
What is the Ratio of Males per 100 Females in Detroit?
There are 121.74 Males per 100 Females in Detroit.
What is the Ratio of Females per 100 Males in Detroit?
There are 82.14 Females per 100 Males in Detroit.
What is the Median Population Age in Detroit?
Median Population Age in Detroit is 59.5 Years.
What is the Average Family Size in Detroit
Average Family Size in Detroit is 2.8 People.
What is the Average Household Size in Detroit
Average Household Size in Detroit is 1.9 People.
How Large is the Labor Force in Detroit?
There are 40 People in the Labor Forcein in Detroit.
What is the Percentage of People in the Labor Force in Detroit?
47.6% of People are in the Labor Force in Detroit.