Columbia City, OR Map & Demographics
Columbia City Map
Columbia City Overview
$41,710
PER CAPITA INCOME
$106,518
AVG FAMILY INCOME
$96,379
AVG HOUSEHOLD INCOME
38.8%
WAGE / INCOME GAP [ % ]
61.2¢/ $1
WAGE / INCOME GAP [ $ ]
$10,139
FAMILY INCOME DEFICIT
0.33
INEQUALITY / GINI INDEX
1,773
TOTAL POPULATION
931
MALE POPULATION
842
FEMALE POPULATION
110.57
MALES / 100 FEMALES
90.44
FEMALES / 100 MALES
47.9
MEDIAN AGE
3.1
AVG FAMILY SIZE
2.6
AVG HOUSEHOLD SIZE
809
LABOR FORCE [ PEOPLE ]
56.7%
PERCENT IN LABOR FORCE
2.8%
UNEMPLOYMENT RATE
Columbia City Zip Codes
Columbia City Area Codes
Income in Columbia City
Income Overview in Columbia City
Per Capita Income in Columbia City is $41,710, while median incomes of families and households are $106,518 and $96,379 respectively.
| Characteristic | Number | Measure |
| Per Capita Income | 1,773 | $41,710 |
| Median Family Income | 481 | $106,518 |
| Mean Family Income | 481 | $112,865 |
| Median Household Income | 690 | $96,379 |
| Mean Household Income | 690 | $103,081 |
| Income Deficit | 481 | $10,139 |
| Wage / Income Gap (%) | 1,773 | 38.83% |
| Wage / Income Gap ($) | 1,773 | 61.17¢ per $1 |
| Gini / Inequality Index | 1,773 | 0.33 |
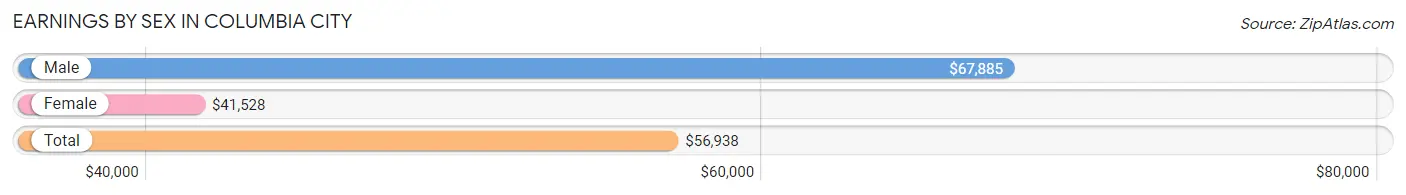
Earnings by Sex in Columbia City
Average Earnings in Columbia City are $56,938, $67,885 for men and $41,528 for women, a difference of 38.8%.
| Sex | Number | Average Earnings |
| Male | 516 (61.1%) | $67,885 |
| Female | 329 (38.9%) | $41,528 |
| Total | 845 (100.0%) | $56,938 |
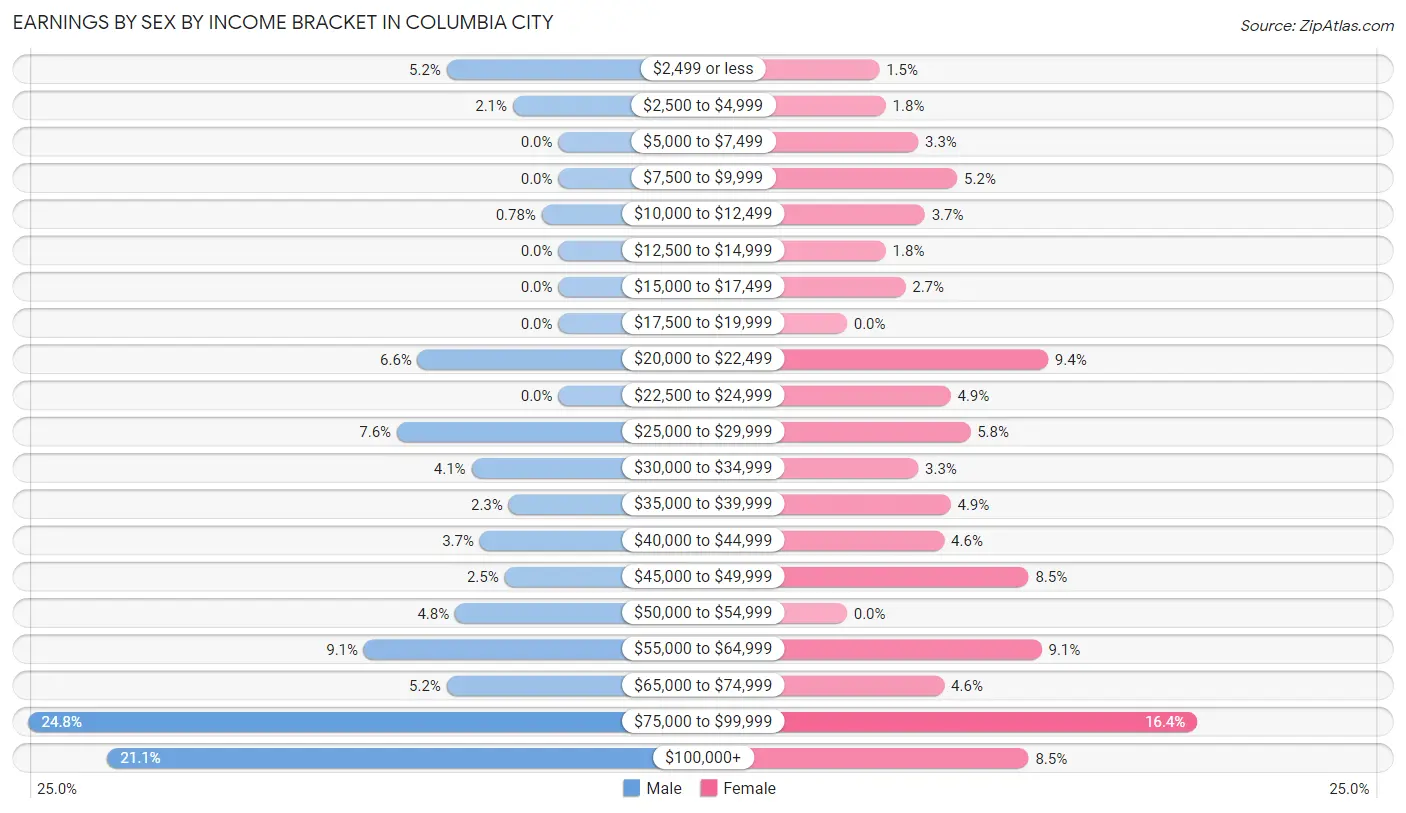
Earnings by Sex by Income Bracket in Columbia City
The most common earnings brackets in Columbia City are $75,000 to $99,999 for men (128 | 24.8%) and $75,000 to $99,999 for women (54 | 16.4%).
| Income | Male | Female |
| $2,499 or less | 27 (5.2%) | 5 (1.5%) |
| $2,500 to $4,999 | 11 (2.1%) | 6 (1.8%) |
| $5,000 to $7,499 | 0 (0.0%) | 11 (3.3%) |
| $7,500 to $9,999 | 0 (0.0%) | 17 (5.2%) |
| $10,000 to $12,499 | 4 (0.8%) | 12 (3.6%) |
| $12,500 to $14,999 | 0 (0.0%) | 6 (1.8%) |
| $15,000 to $17,499 | 0 (0.0%) | 9 (2.7%) |
| $17,500 to $19,999 | 0 (0.0%) | 0 (0.0%) |
| $20,000 to $22,499 | 34 (6.6%) | 31 (9.4%) |
| $22,500 to $24,999 | 0 (0.0%) | 16 (4.9%) |
| $25,000 to $29,999 | 39 (7.6%) | 19 (5.8%) |
| $30,000 to $34,999 | 21 (4.1%) | 11 (3.3%) |
| $35,000 to $39,999 | 12 (2.3%) | 16 (4.9%) |
| $40,000 to $44,999 | 19 (3.7%) | 15 (4.6%) |
| $45,000 to $49,999 | 13 (2.5%) | 28 (8.5%) |
| $50,000 to $54,999 | 25 (4.8%) | 0 (0.0%) |
| $55,000 to $64,999 | 47 (9.1%) | 30 (9.1%) |
| $65,000 to $74,999 | 27 (5.2%) | 15 (4.6%) |
| $75,000 to $99,999 | 128 (24.8%) | 54 (16.4%) |
| $100,000+ | 109 (21.1%) | 28 (8.5%) |
| Total | 516 (100.0%) | 329 (100.0%) |
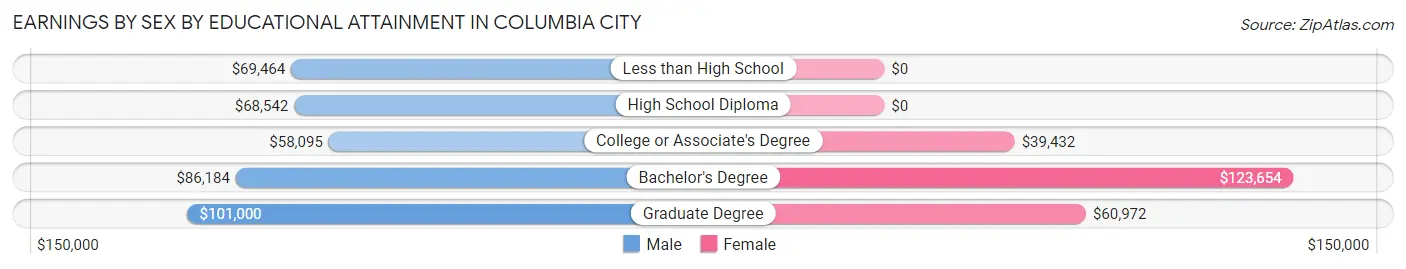
Earnings by Sex by Educational Attainment in Columbia City
Average earnings in Columbia City are $70,500 for men and $45,341 for women, a difference of 35.7%. Men with an educational attainment of graduate degree enjoy the highest average annual earnings of $101,000, while those with college or associate's degree education earn the least with $58,095. Women with an educational attainment of bachelor's degree earn the most with the average annual earnings of $123,654, while those with college or associate's degree education have the smallest earnings of $39,432.
| Educational Attainment | Male Income | Female Income |
| Less than High School | $69,464 | $0 |
| High School Diploma | $68,542 | $0 |
| College or Associate's Degree | $58,095 | $39,432 |
| Bachelor's Degree | $86,184 | $123,654 |
| Graduate Degree | $101,000 | $60,972 |
| Total | $70,500 | $45,341 |
Family Income in Columbia City
Family Income Brackets in Columbia City
According to the Columbia City family income data, there are 134 families falling into the $100,000 to $149,999 income range, which is the most common income bracket and makes up 27.9% of all families.
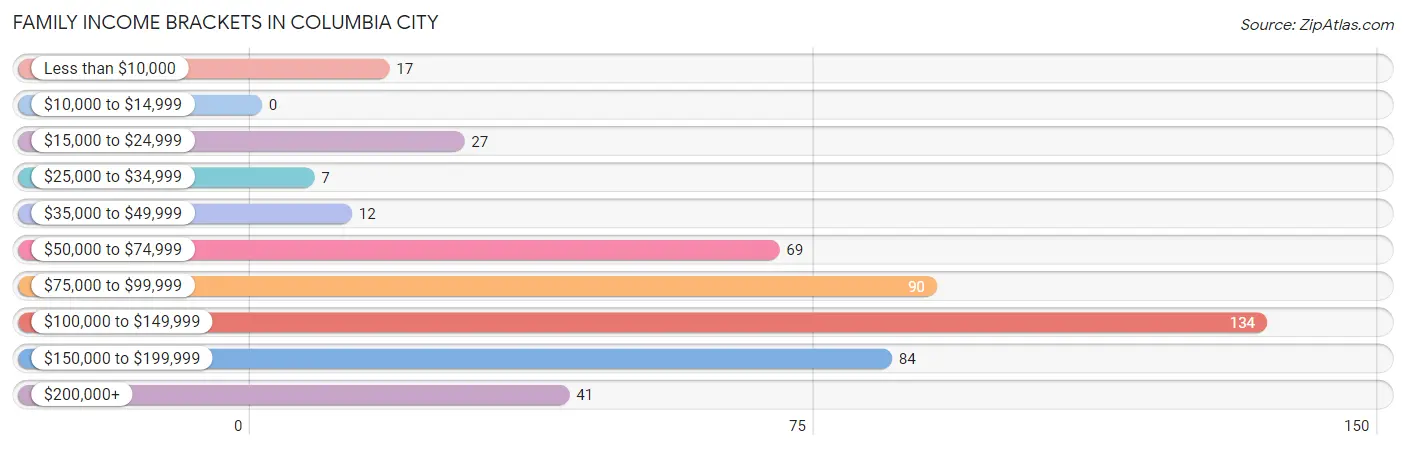
| Income Bracket | # Families | % Families |
| Less than $10,000 | 17 | 3.5% |
| $10,000 to $14,999 | 0 | 0.0% |
| $15,000 to $24,999 | 27 | 5.6% |
| $25,000 to $34,999 | 7 | 1.5% |
| $35,000 to $49,999 | 12 | 2.5% |
| $50,000 to $74,999 | 69 | 14.3% |
| $75,000 to $99,999 | 90 | 18.7% |
| $100,000 to $149,999 | 134 | 27.9% |
| $150,000 to $199,999 | 84 | 17.5% |
| $200,000+ | 41 | 8.5% |
Family Income by Famaliy Size in Columbia City
4-person families (116 | 24.1%) account for the highest median family income in Columbia City with $152,885 per family, while 2-person families (245 | 50.9%) have the highest median income of $49,792 per family member.
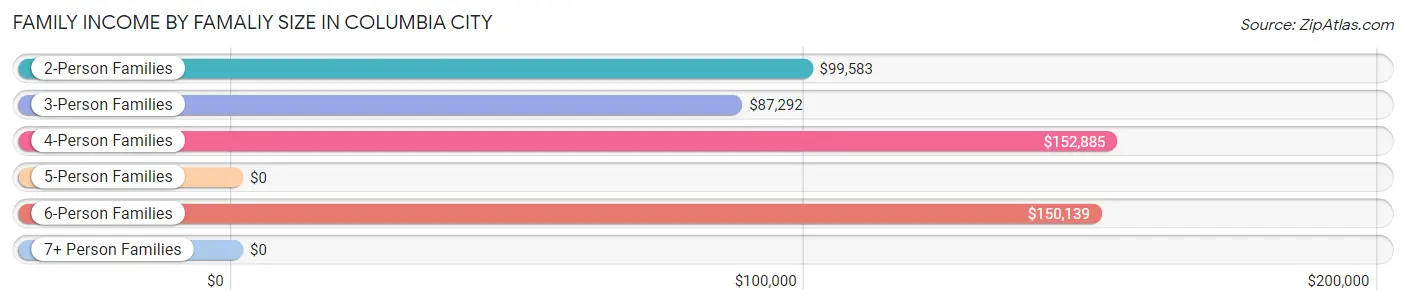
| Income Bracket | # Families | Median Income |
| 2-Person Families | 245 (50.9%) | $99,583 |
| 3-Person Families | 55 (11.4%) | $87,292 |
| 4-Person Families | 116 (24.1%) | $152,885 |
| 5-Person Families | 38 (7.9%) | $0 |
| 6-Person Families | 27 (5.6%) | $150,139 |
| 7+ Person Families | 0 (0.0%) | $0 |
| Total | 481 (100.0%) | $106,518 |
Family Income by Number of Earners in Columbia City
The median family income in Columbia City is $106,518, with families comprising 3+ earners (64) having the highest median family income of $166,786, while families with no earners (129) have the lowest median family income of $73,906, accounting for 13.3% and 26.8% of families, respectively.
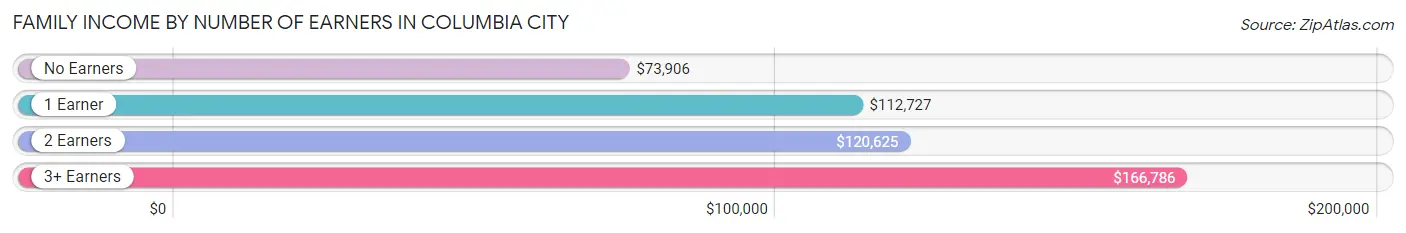
| Number of Earners | # Families | Median Income |
| No Earners | 129 (26.8%) | $73,906 |
| 1 Earner | 114 (23.7%) | $112,727 |
| 2 Earners | 174 (36.2%) | $120,625 |
| 3+ Earners | 64 (13.3%) | $166,786 |
| Total | 481 (100.0%) | $106,518 |
Household Income in Columbia City
Household Income Brackets in Columbia City
With 180 households falling in the category, the $100,000 to $149,999 income range is the most frequent in Columbia City, accounting for 26.1% of all households. In contrast, only 3 households (0.4%) fall into the $10,000 to $14,999 income bracket, making it the least populous group.
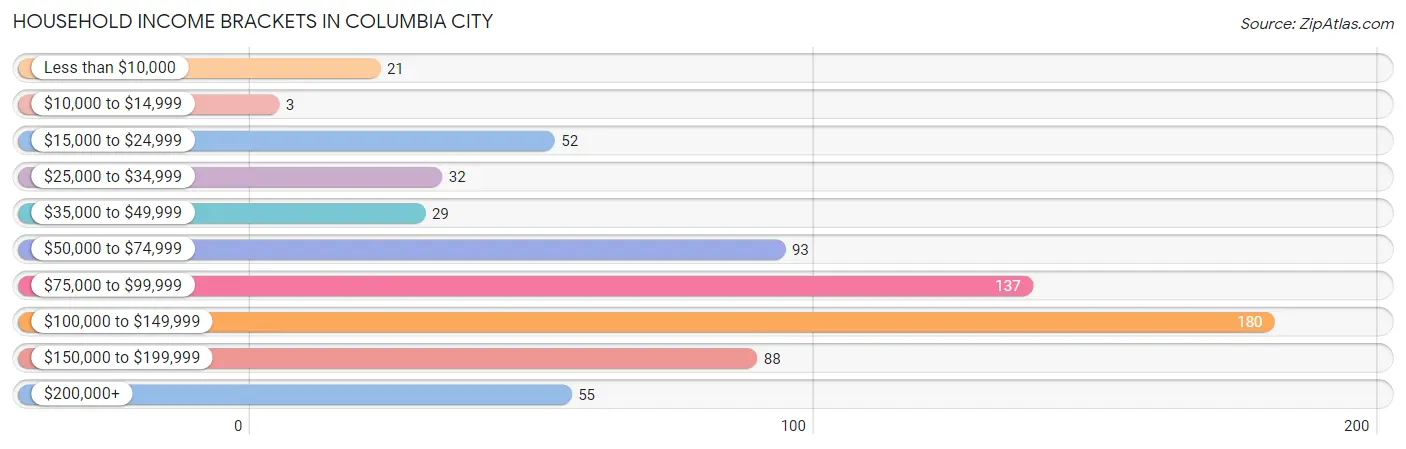
| Income Bracket | # Households | % Households |
| Less than $10,000 | 21 | 3.0% |
| $10,000 to $14,999 | 3 | 0.4% |
| $15,000 to $24,999 | 52 | 7.5% |
| $25,000 to $34,999 | 32 | 4.6% |
| $35,000 to $49,999 | 29 | 4.2% |
| $50,000 to $74,999 | 93 | 13.5% |
| $75,000 to $99,999 | 137 | 19.9% |
| $100,000 to $149,999 | 180 | 26.1% |
| $150,000 to $199,999 | 88 | 12.8% |
| $200,000+ | 55 | 8.0% |
Household Income by Householder Age in Columbia City
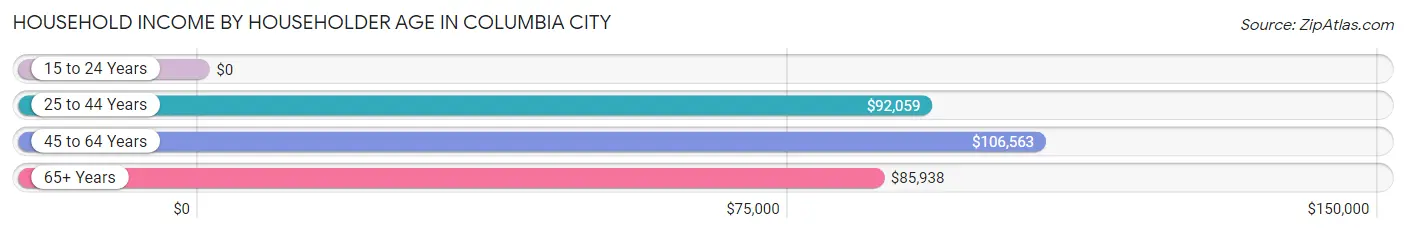
The median household income in Columbia City is $96,379, with the highest median household income of $106,563 found in the 45 to 64 years age bracket for the primary householder. A total of 291 households (42.2%) fall into this category.
| Income Bracket | # Households | Median Income |
| 15 to 24 Years | 0 (0.0%) | $0 |
| 25 to 44 Years | 132 (19.1%) | $92,059 |
| 45 to 64 Years | 291 (42.2%) | $106,563 |
| 65+ Years | 267 (38.7%) | $85,938 |
| Total | 690 (100.0%) | $96,379 |
Poverty in Columbia City
Income Below Poverty by Sex and Age in Columbia City
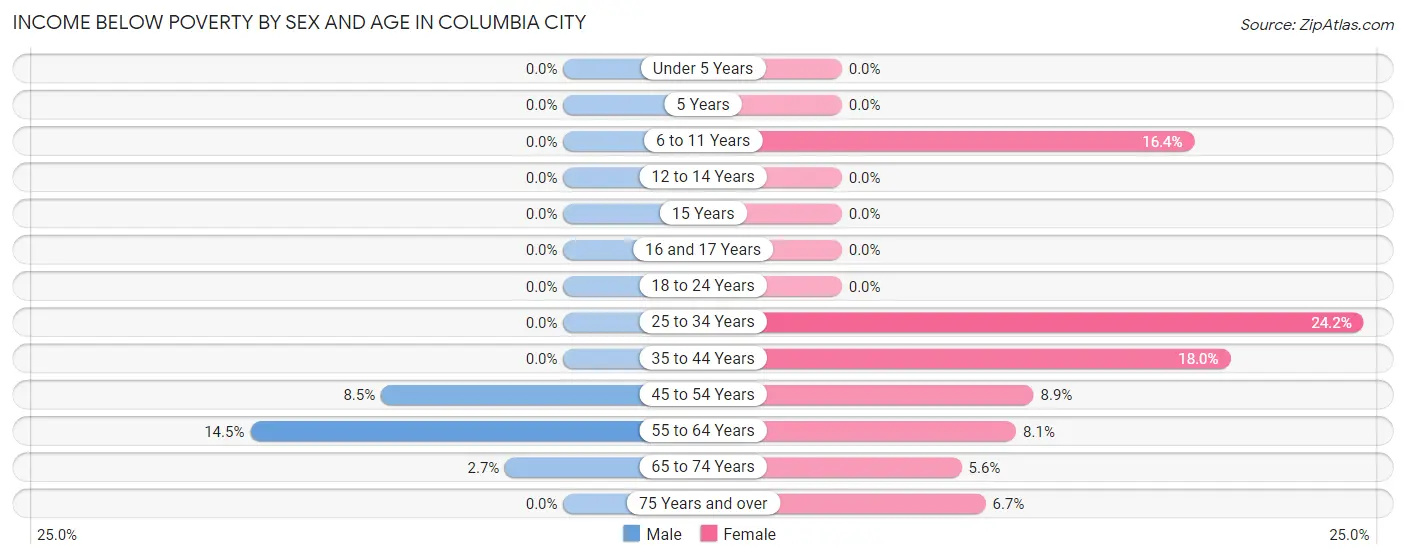
With 4.4% poverty level for males and 9.5% for females among the residents of Columbia City, 55 to 64 year old males and 25 to 34 year old females are the most vulnerable to poverty, with 25 males (14.5%) and 23 females (24.2%) in their respective age groups living below the poverty level.
| Age Bracket | Male | Female |
| Under 5 Years | 0 (0.0%) | 0 (0.0%) |
| 5 Years | 0 (0.0%) | 0 (0.0%) |
| 6 to 11 Years | 0 (0.0%) | 9 (16.4%) |
| 12 to 14 Years | 0 (0.0%) | 0 (0.0%) |
| 15 Years | 0 (0.0%) | 0 (0.0%) |
| 16 and 17 Years | 0 (0.0%) | 0 (0.0%) |
| 18 to 24 Years | 0 (0.0%) | 0 (0.0%) |
| 25 to 34 Years | 0 (0.0%) | 23 (24.2%) |
| 35 to 44 Years | 0 (0.0%) | 11 (18.0%) |
| 45 to 54 Years | 11 (8.5%) | 13 (8.9%) |
| 55 to 64 Years | 25 (14.5%) | 11 (8.1%) |
| 65 to 74 Years | 4 (2.7%) | 5 (5.6%) |
| 75 Years and over | 0 (0.0%) | 7 (6.7%) |
| Total | 40 (4.4%) | 79 (9.5%) |
Income Above Poverty by Sex and Age in Columbia City
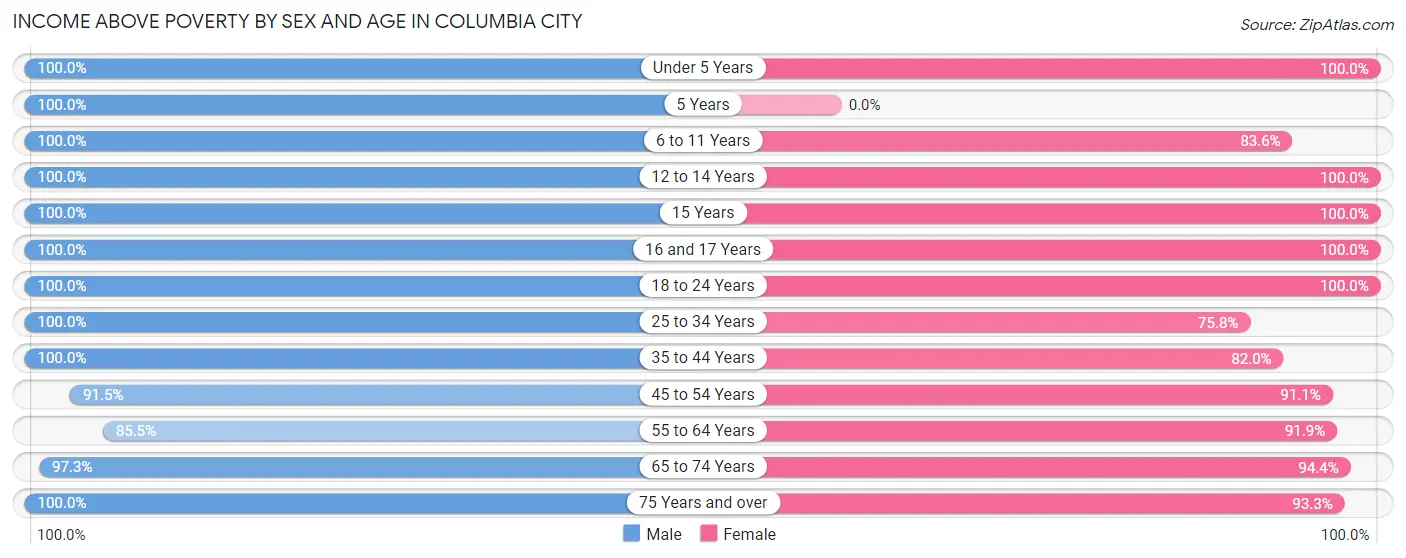
According to the poverty statistics in Columbia City, males aged under 5 years and females aged under 5 years are the age groups that are most secure financially, with 100.0% of males and 100.0% of females in these age groups living above the poverty line.
| Age Bracket | Male | Female |
| Under 5 Years | 34 (100.0%) | 30 (100.0%) |
| 5 Years | 10 (100.0%) | 0 (0.0%) |
| 6 to 11 Years | 65 (100.0%) | 46 (83.6%) |
| 12 to 14 Years | 25 (100.0%) | 36 (100.0%) |
| 15 Years | 30 (100.0%) | 40 (100.0%) |
| 16 and 17 Years | 34 (100.0%) | 21 (100.0%) |
| 18 to 24 Years | 31 (100.0%) | 20 (100.0%) |
| 25 to 34 Years | 99 (100.0%) | 72 (75.8%) |
| 35 to 44 Years | 70 (100.0%) | 50 (82.0%) |
| 45 to 54 Years | 119 (91.5%) | 133 (91.1%) |
| 55 to 64 Years | 147 (85.5%) | 125 (91.9%) |
| 65 to 74 Years | 144 (97.3%) | 85 (94.4%) |
| 75 Years and over | 68 (100.0%) | 98 (93.3%) |
| Total | 876 (95.6%) | 756 (90.5%) |
Income Below Poverty Among Married-Couple Families in Columbia City
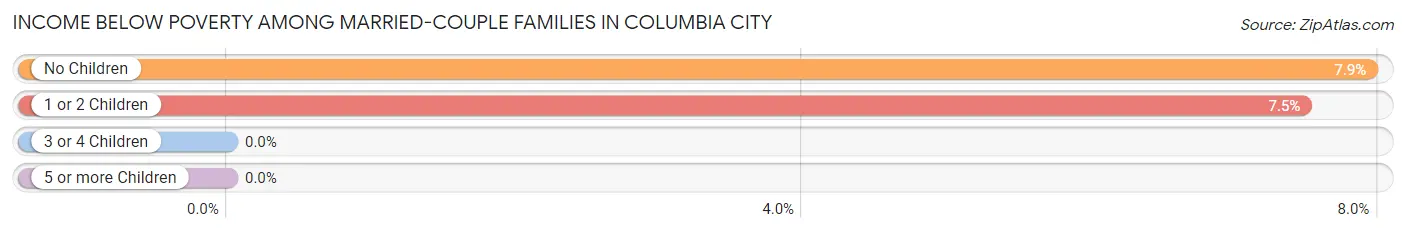
The poverty statistics for married-couple families in Columbia City show that 7.0% or 28 of the total 402 families live below the poverty line. Families with no children have the highest poverty rate of 7.9%, comprising of 17 families. On the other hand, families with 3 or 4 children have the lowest poverty rate of 0.0%, which includes 0 families.
| Children | Above Poverty | Below Poverty |
| No Children | 197 (92.1%) | 17 (7.9%) |
| 1 or 2 Children | 136 (92.5%) | 11 (7.5%) |
| 3 or 4 Children | 41 (100.0%) | 0 (0.0%) |
| 5 or more Children | 0 (0.0%) | 0 (0.0%) |
| Total | 374 (93.0%) | 28 (7.0%) |
Income Below Poverty Among Single-Parent Households in Columbia City
| Children | Single Father | Single Mother |
| No Children | 0 (0.0%) | 0 (0.0%) |
| 1 or 2 Children | 0 (0.0%) | 0 (0.0%) |
| 3 or 4 Children | 0 (0.0%) | 0 (0.0%) |
| 5 or more Children | 0 (0.0%) | 0 (0.0%) |
| Total | 0 (0.0%) | 0 (0.0%) |
Income Below Poverty Among Married-Couple vs Single-Parent Households in Columbia City
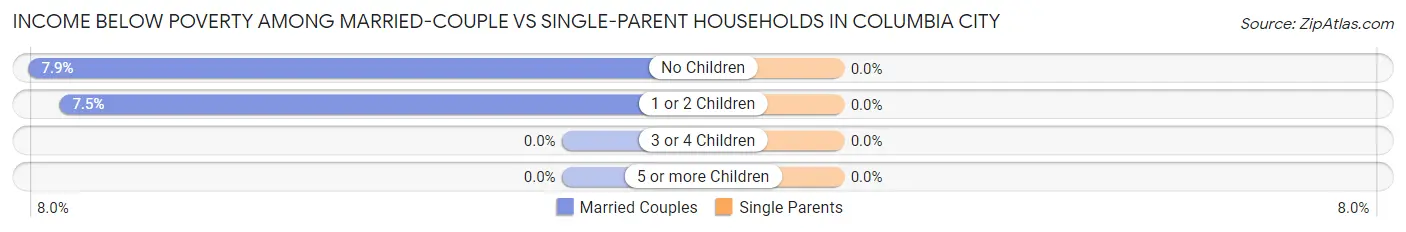
| Children | Married-Couple Families | Single-Parent Households |
| No Children | 17 (7.9%) | 0 (0.0%) |
| 1 or 2 Children | 11 (7.5%) | 0 (0.0%) |
| 3 or 4 Children | 0 (0.0%) | 0 (0.0%) |
| 5 or more Children | 0 (0.0%) | 0 (0.0%) |
| Total | 28 (7.0%) | 0 (0.0%) |
Race in Columbia City
The most populous races in Columbia City are White / Caucasian (1,625 | 91.6%), Hispanic or Latino (97 | 5.5%), and Two or more Races (57 | 3.2%).
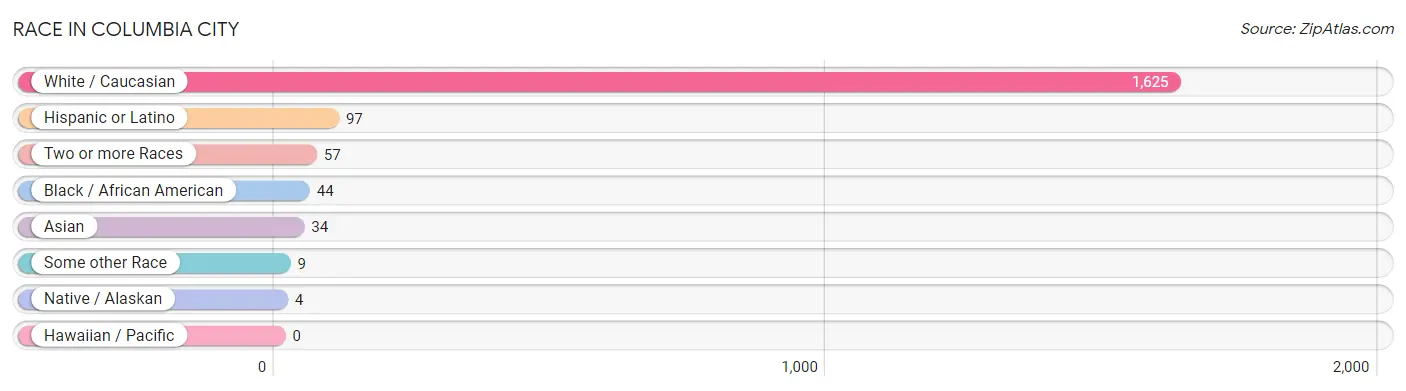
| Race | # Population | % Population |
| Asian | 34 | 1.9% |
| Black / African American | 44 | 2.5% |
| Hawaiian / Pacific | 0 | 0.0% |
| Hispanic or Latino | 97 | 5.5% |
| Native / Alaskan | 4 | 0.2% |
| White / Caucasian | 1,625 | 91.6% |
| Two or more Races | 57 | 3.2% |
| Some other Race | 9 | 0.5% |
| Total | 1,773 | 100.0% |
Ancestry in Columbia City
The most populous ancestries reported in Columbia City are German (288 | 16.2%), English (277 | 15.6%), Irish (218 | 12.3%), Scottish (114 | 6.4%), and American (77 | 4.3%), together accounting for 54.9% of all Columbia City residents.
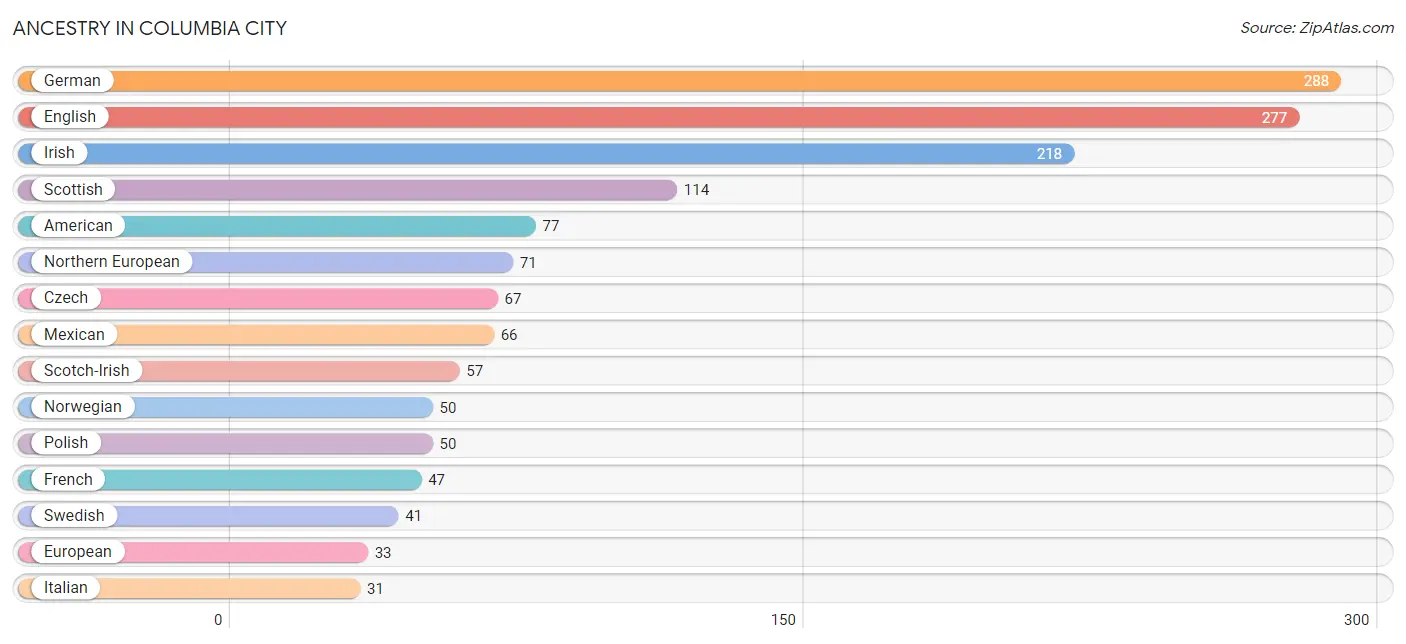
| Ancestry | # Population | % Population |
| American | 77 | 4.3% |
| Bhutanese | 25 | 1.4% |
| British | 3 | 0.2% |
| Choctaw | 5 | 0.3% |
| Czech | 67 | 3.8% |
| Danish | 13 | 0.7% |
| Dutch | 12 | 0.7% |
| English | 277 | 15.6% |
| European | 33 | 1.9% |
| Finnish | 18 | 1.0% |
| French | 47 | 2.6% |
| German | 288 | 16.2% |
| Greek | 8 | 0.4% |
| Hungarian | 12 | 0.7% |
| Indian (Asian) | 23 | 1.3% |
| Iranian | 5 | 0.3% |
| Irish | 218 | 12.3% |
| Italian | 31 | 1.8% |
| Korean | 19 | 1.1% |
| Lithuanian | 5 | 0.3% |
| Mexican | 66 | 3.7% |
| Navajo | 4 | 0.2% |
| Northern European | 71 | 4.0% |
| Norwegian | 50 | 2.8% |
| Polish | 50 | 2.8% |
| Portuguese | 3 | 0.2% |
| Puerto Rican | 3 | 0.2% |
| Scandinavian | 13 | 0.7% |
| Scotch-Irish | 57 | 3.2% |
| Scottish | 114 | 6.4% |
| Slavic | 4 | 0.2% |
| Swedish | 41 | 2.3% |
| Swiss | 10 | 0.6% |
| Thai | 8 | 0.4% |
| Turkish | 5 | 0.3% |
| Ukrainian | 17 | 1.0% |
| Welsh | 5 | 0.3% | View All 37 Rows |
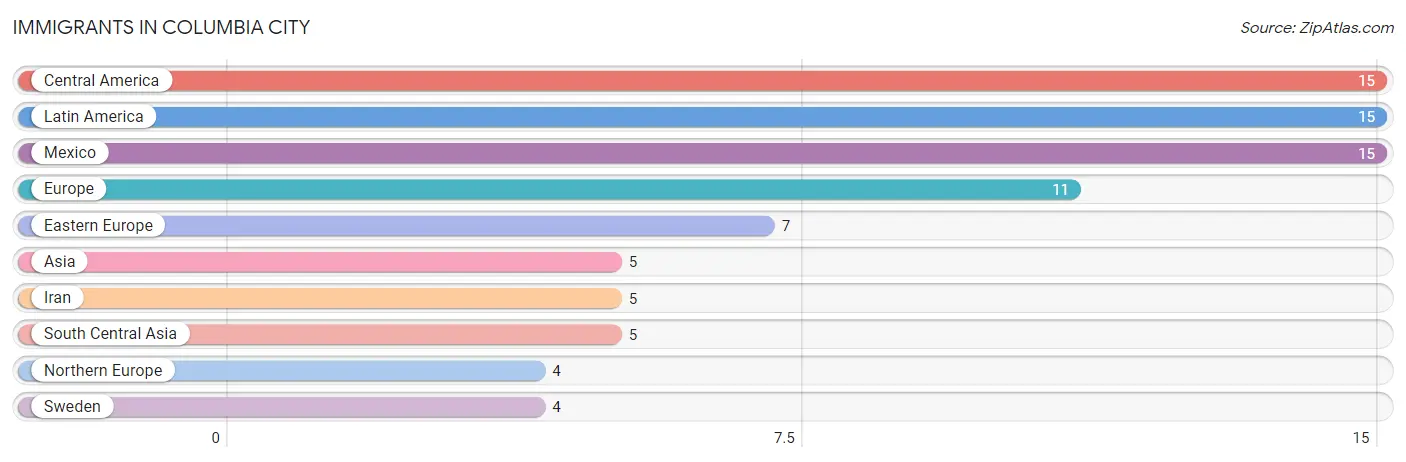
Immigrants in Columbia City
The most numerous immigrant groups reported in Columbia City came from Central America (15 | 0.9%), Latin America (15 | 0.9%), Mexico (15 | 0.9%), Europe (11 | 0.6%), and Eastern Europe (7 | 0.4%), together accounting for 3.6% of all Columbia City residents.
| Immigration Origin | # Population | % Population |
| Asia | 5 | 0.3% |
| Central America | 15 | 0.9% |
| Eastern Europe | 7 | 0.4% |
| Europe | 11 | 0.6% |
| Iran | 5 | 0.3% |
| Latin America | 15 | 0.9% |
| Mexico | 15 | 0.9% |
| Northern Europe | 4 | 0.2% |
| South Central Asia | 5 | 0.3% |
| Sweden | 4 | 0.2% | View All 10 Rows |
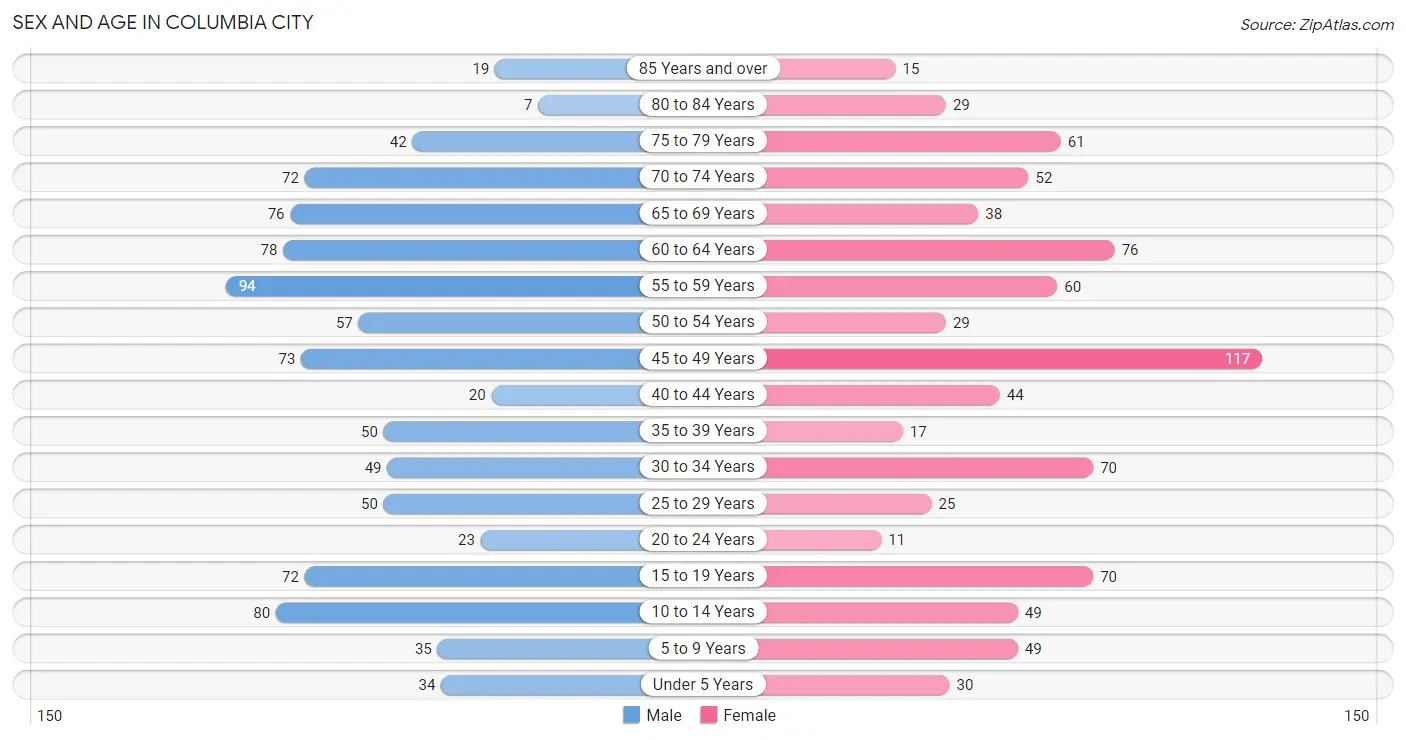
Sex and Age in Columbia City
Sex and Age in Columbia City
The most populous age groups in Columbia City are 55 to 59 Years (94 | 10.1%) for men and 45 to 49 Years (117 | 13.9%) for women.
| Age Bracket | Male | Female |
| Under 5 Years | 34 (3.6%) | 30 (3.6%) |
| 5 to 9 Years | 35 (3.8%) | 49 (5.8%) |
| 10 to 14 Years | 80 (8.6%) | 49 (5.8%) |
| 15 to 19 Years | 72 (7.7%) | 70 (8.3%) |
| 20 to 24 Years | 23 (2.5%) | 11 (1.3%) |
| 25 to 29 Years | 50 (5.4%) | 25 (3.0%) |
| 30 to 34 Years | 49 (5.3%) | 70 (8.3%) |
| 35 to 39 Years | 50 (5.4%) | 17 (2.0%) |
| 40 to 44 Years | 20 (2.1%) | 44 (5.2%) |
| 45 to 49 Years | 73 (7.8%) | 117 (13.9%) |
| 50 to 54 Years | 57 (6.1%) | 29 (3.4%) |
| 55 to 59 Years | 94 (10.1%) | 60 (7.1%) |
| 60 to 64 Years | 78 (8.4%) | 76 (9.0%) |
| 65 to 69 Years | 76 (8.2%) | 38 (4.5%) |
| 70 to 74 Years | 72 (7.7%) | 52 (6.2%) |
| 75 to 79 Years | 42 (4.5%) | 61 (7.2%) |
| 80 to 84 Years | 7 (0.7%) | 29 (3.4%) |
| 85 Years and over | 19 (2.0%) | 15 (1.8%) |
| Total | 931 (100.0%) | 842 (100.0%) |
Families and Households in Columbia City
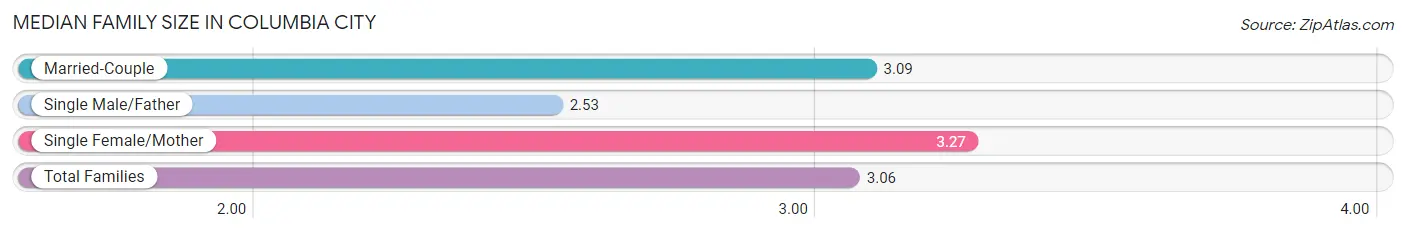
Median Family Size in Columbia City
The median family size in Columbia City is 3.06 persons per family, with single female/mother families (41 | 8.5%) accounting for the largest median family size of 3.27 persons per family. On the other hand, single male/father families (38 | 7.9%) represent the smallest median family size with 2.53 persons per family.
| Family Type | # Families | Family Size |
| Married-Couple | 402 (83.6%) | 3.09 |
| Single Male/Father | 38 (7.9%) | 2.53 |
| Single Female/Mother | 41 (8.5%) | 3.27 |
| Total Families | 481 (100.0%) | 3.06 |
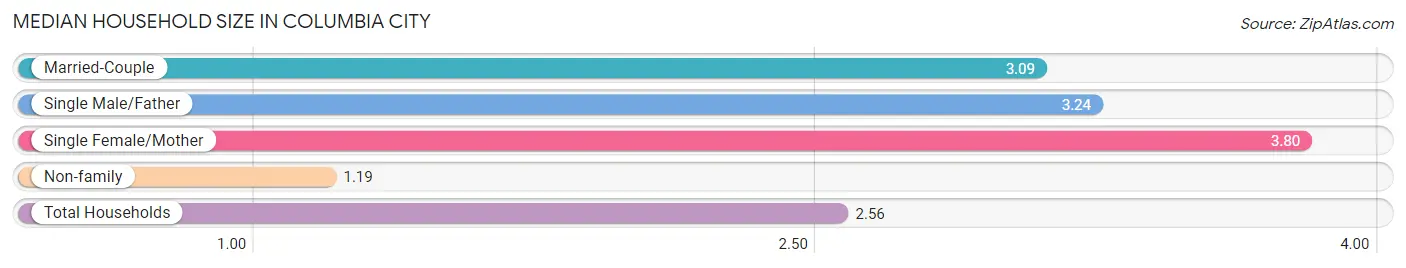
Median Household Size in Columbia City
The median household size in Columbia City is 2.56 persons per household, with single female/mother households (41 | 5.9%) accounting for the largest median household size of 3.8 persons per household. non-family households (209 | 30.3%) represent the smallest median household size with 1.19 persons per household.
| Household Type | # Households | Household Size |
| Married-Couple | 402 (58.3%) | 3.09 |
| Single Male/Father | 38 (5.5%) | 3.24 |
| Single Female/Mother | 41 (5.9%) | 3.80 |
| Non-family | 209 (30.3%) | 1.19 |
| Total Households | 690 (100.0%) | 2.56 |
Household Size by Marriage Status in Columbia City
Out of a total of 690 households in Columbia City, 481 (69.7%) are family households, while 209 (30.3%) are nonfamily households. The most numerous type of family households are 2-person households, comprising 231, and the most common type of nonfamily households are 1-person households, comprising 165.
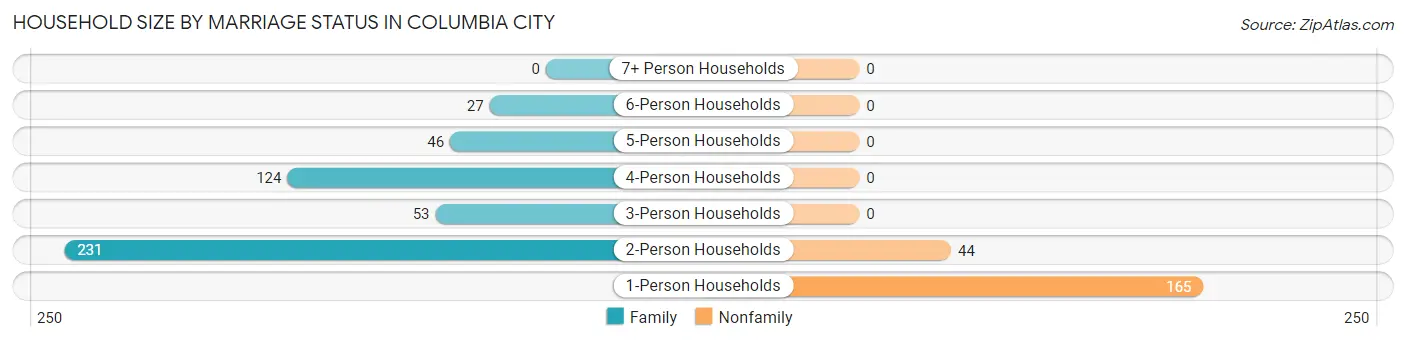
| Household Size | Family Households | Nonfamily Households |
| 1-Person Households | - | 165 (23.9%) |
| 2-Person Households | 231 (33.5%) | 44 (6.4%) |
| 3-Person Households | 53 (7.7%) | 0 (0.0%) |
| 4-Person Households | 124 (18.0%) | 0 (0.0%) |
| 5-Person Households | 46 (6.7%) | 0 (0.0%) |
| 6-Person Households | 27 (3.9%) | 0 (0.0%) |
| 7+ Person Households | 0 (0.0%) | 0 (0.0%) |
| Total | 481 (69.7%) | 209 (30.3%) |
Female Fertility in Columbia City
Fertility by Age in Columbia City
Average fertility rate in Columbia City is 61.0 births per 1,000 women. Women in the age bracket of 20 to 34 years have the highest fertility rate with 142.0 births per 1,000 women. Women in the age bracket of 20 to 34 years acount for 68.2% of all women with births.
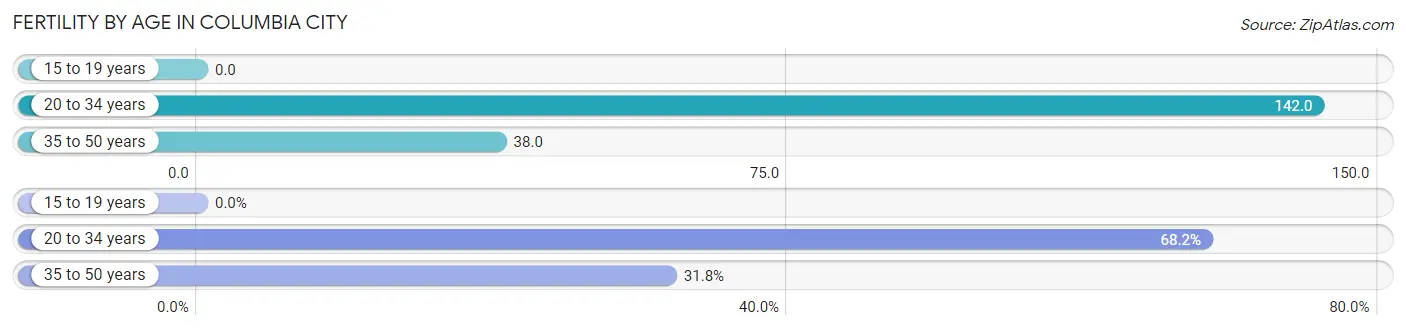
| Age Bracket | Women with Births | Births / 1,000 Women |
| 15 to 19 years | 0 (0.0%) | 0.0 |
| 20 to 34 years | 15 (68.2%) | 142.0 |
| 35 to 50 years | 7 (31.8%) | 38.0 |
| Total | 22 (100.0%) | 61.0 |
Fertility by Age by Marriage Status in Columbia City
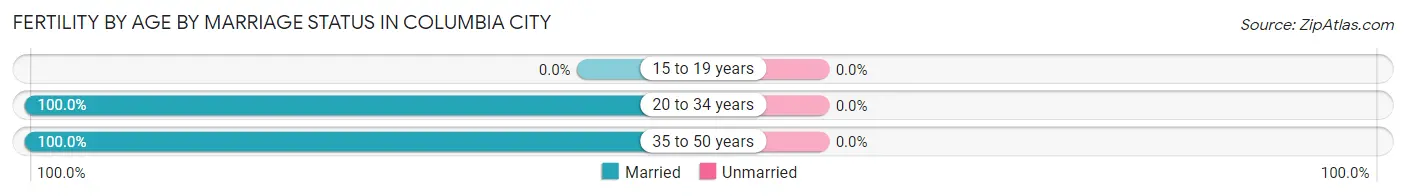
| Age Bracket | Married | Unmarried |
| 15 to 19 years | 0 (0.0%) | 0 (0.0%) |
| 20 to 34 years | 15 (100.0%) | 0 (0.0%) |
| 35 to 50 years | 7 (100.0%) | 0 (0.0%) |
| Total | 22 (100.0%) | 0 (0.0%) |
Fertility by Education in Columbia City
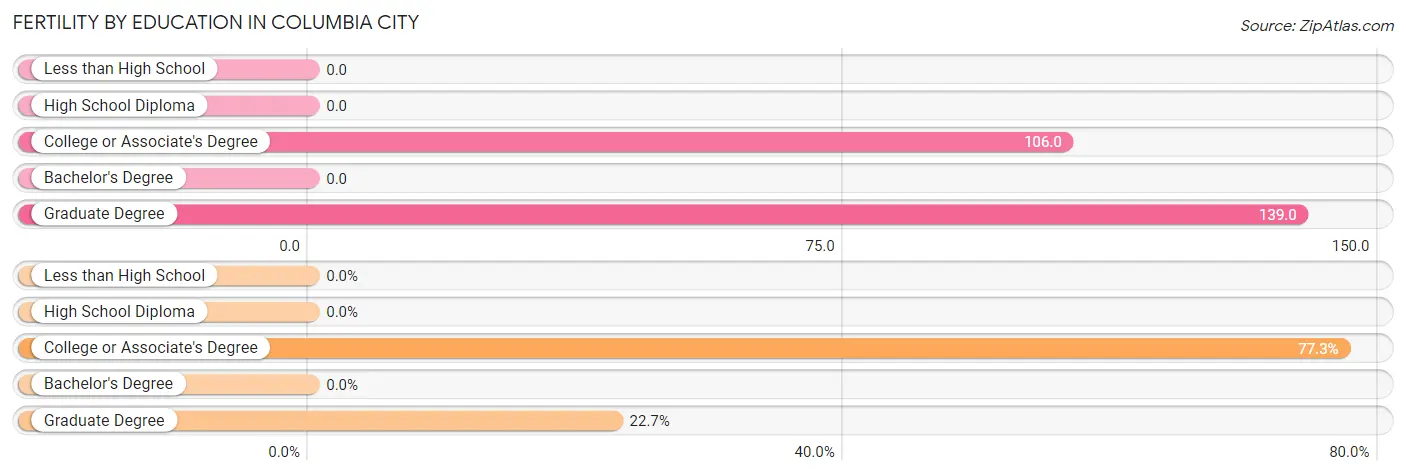
| Educational Attainment | Women with Births | Births / 1,000 Women |
| Less than High School | 0 (0.0%) | 0.0 |
| High School Diploma | 0 (0.0%) | 0.0 |
| College or Associate's Degree | 17 (77.3%) | 106.0 |
| Bachelor's Degree | 0 (0.0%) | 0.0 |
| Graduate Degree | 5 (22.7%) | 139.0 |
| Total | 22 (100.0%) | 61.0 |
Fertility by Education by Marriage Status in Columbia City
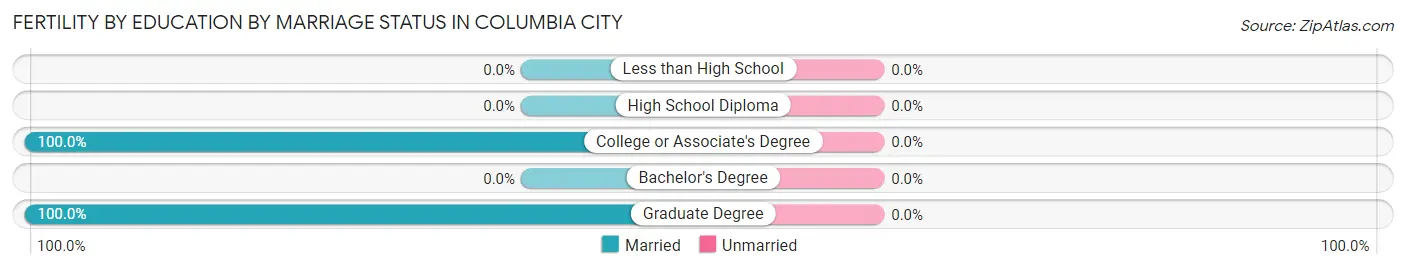
| Educational Attainment | Married | Unmarried |
| Less than High School | 0 (0.0%) | 0 (0.0%) |
| High School Diploma | 0 (0.0%) | 0 (0.0%) |
| College or Associate's Degree | 17 (100.0%) | 0 (0.0%) |
| Bachelor's Degree | 0 (0.0%) | 0 (0.0%) |
| Graduate Degree | 5 (100.0%) | 0 (0.0%) |
| Total | 22 (100.0%) | 0 (0.0%) |
Employment Characteristics in Columbia City
Employment by Class of Employer in Columbia City
Among the 775 employed individuals in Columbia City, private company employees (489 | 63.1%), local government employees (90 | 11.6%), and self-employed (not incorporated) (78 | 10.1%) make up the most common classes of employment.
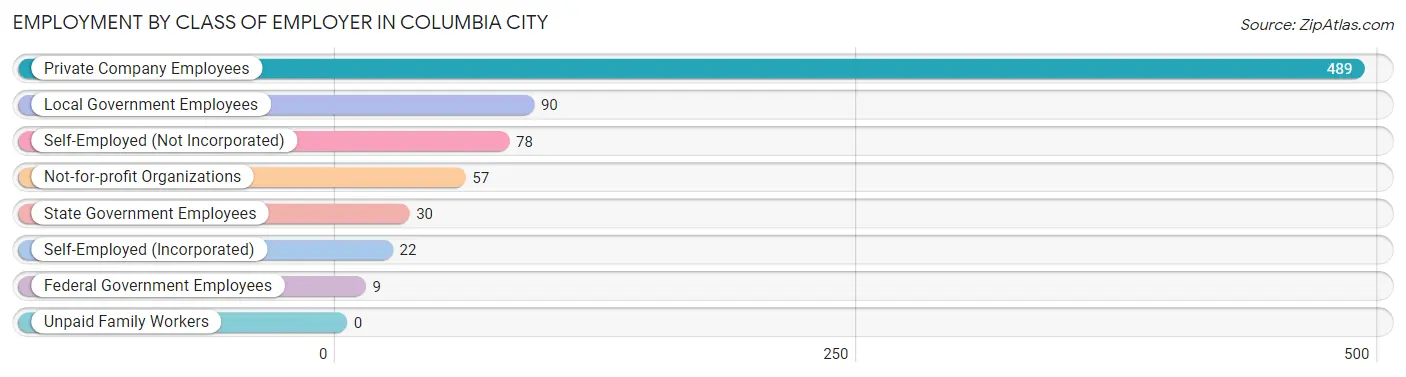
| Employer Class | # Employees | % Employees |
| Private Company Employees | 489 | 63.1% |
| Self-Employed (Incorporated) | 22 | 2.8% |
| Self-Employed (Not Incorporated) | 78 | 10.1% |
| Not-for-profit Organizations | 57 | 7.3% |
| Local Government Employees | 90 | 11.6% |
| State Government Employees | 30 | 3.9% |
| Federal Government Employees | 9 | 1.2% |
| Unpaid Family Workers | 0 | 0.0% |
| Total | 775 | 100.0% |
Employment Status by Age in Columbia City
According to the labor force statistics for Columbia City, out of the total population over 16 years of age (1,426), 56.7% or 809 individuals are in the labor force, with 2.8% or 23 of them unemployed. The age group with the highest labor force participation rate is 35 to 44 years, with 91.6% or 120 individuals in the labor force. Within the labor force, the 16 to 19 years age range has the highest percentage of unemployed individuals, with 19.2% or 5 of them being unemployed.
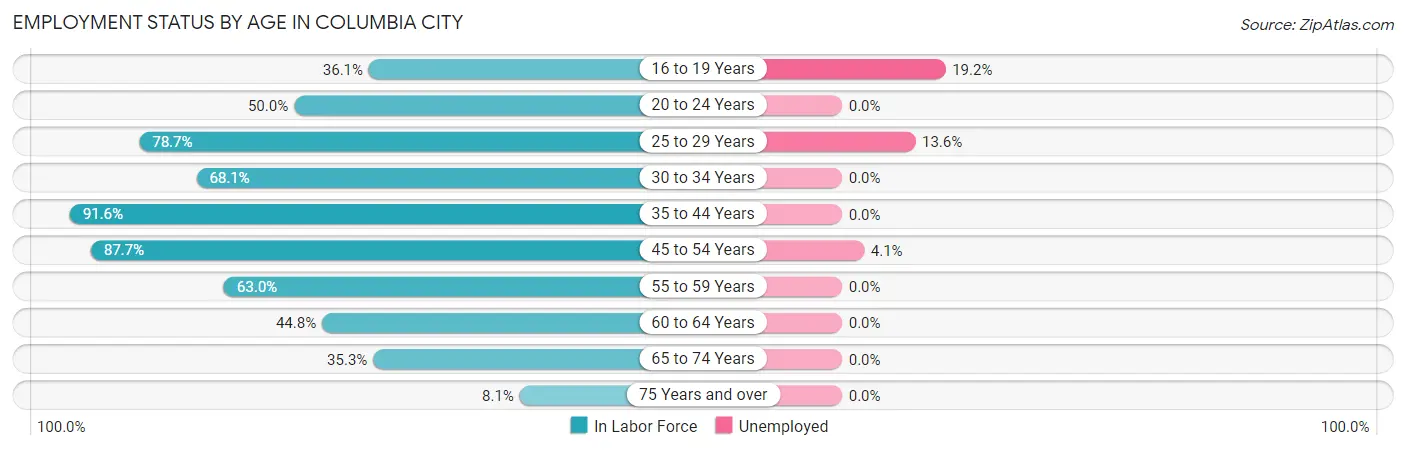
| Age Bracket | In Labor Force | Unemployed |
| 16 to 19 Years | 26 (36.1%) | 5 (19.2%) |
| 20 to 24 Years | 17 (50.0%) | 0 (0.0%) |
| 25 to 29 Years | 59 (78.7%) | 8 (13.6%) |
| 30 to 34 Years | 81 (68.1%) | 0 (0.0%) |
| 35 to 44 Years | 120 (91.6%) | 0 (0.0%) |
| 45 to 54 Years | 242 (87.7%) | 10 (4.1%) |
| 55 to 59 Years | 97 (63.0%) | 0 (0.0%) |
| 60 to 64 Years | 69 (44.8%) | 0 (0.0%) |
| 65 to 74 Years | 84 (35.3%) | 0 (0.0%) |
| 75 Years and over | 14 (8.1%) | 0 (0.0%) |
| Total | 809 (56.7%) | 23 (2.8%) |
Employment Status by Educational Attainment in Columbia City
According to labor force statistics for Columbia City, 73.5% of individuals (668) out of the total population between 25 and 64 years of age (909) are in the labor force, with 2.7% or 18 of them being unemployed. The group with the highest labor force participation rate are those with the educational attainment of college / associate degree, with 83.4% or 347 individuals in the labor force. Within the labor force, individuals with college / associate degree education have the highest percentage of unemployment, with 5.2% or 18 of them being unemployed.
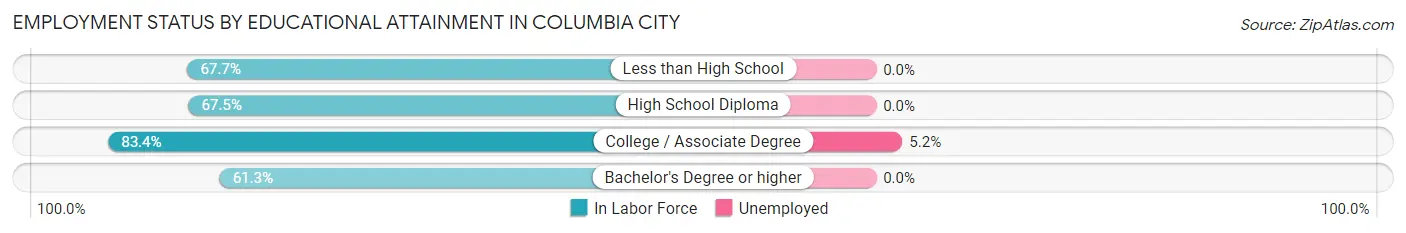
| Educational Attainment | In Labor Force | Unemployed |
| Less than High School | 44 (67.7%) | 0 (0.0%) |
| High School Diploma | 158 (67.5%) | 0 (0.0%) |
| College / Associate Degree | 347 (83.4%) | 22 (5.2%) |
| Bachelor's Degree or higher | 119 (61.3%) | 0 (0.0%) |
| Total | 668 (73.5%) | 25 (2.7%) |
Employment Occupations by Sex in Columbia City
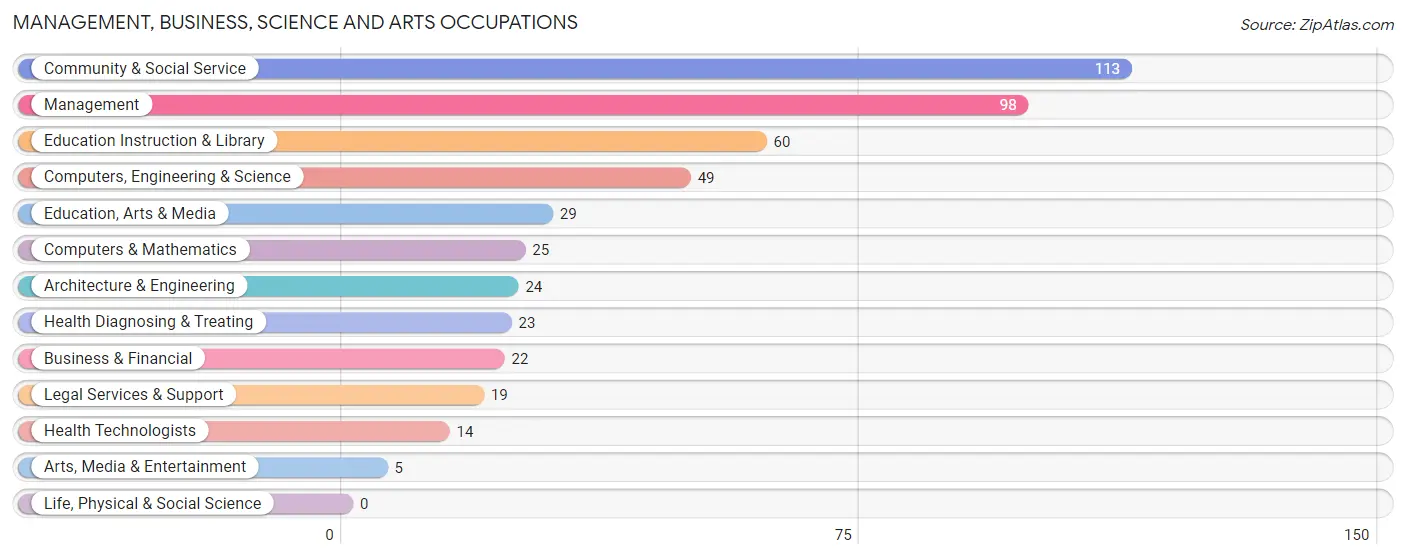
Management, Business, Science and Arts Occupations
The most common Management, Business, Science and Arts occupations in Columbia City are Community & Social Service (113 | 14.4%), Management (98 | 12.5%), Education Instruction & Library (60 | 7.6%), Computers, Engineering & Science (49 | 6.2%), and Education, Arts & Media (29 | 3.7%).
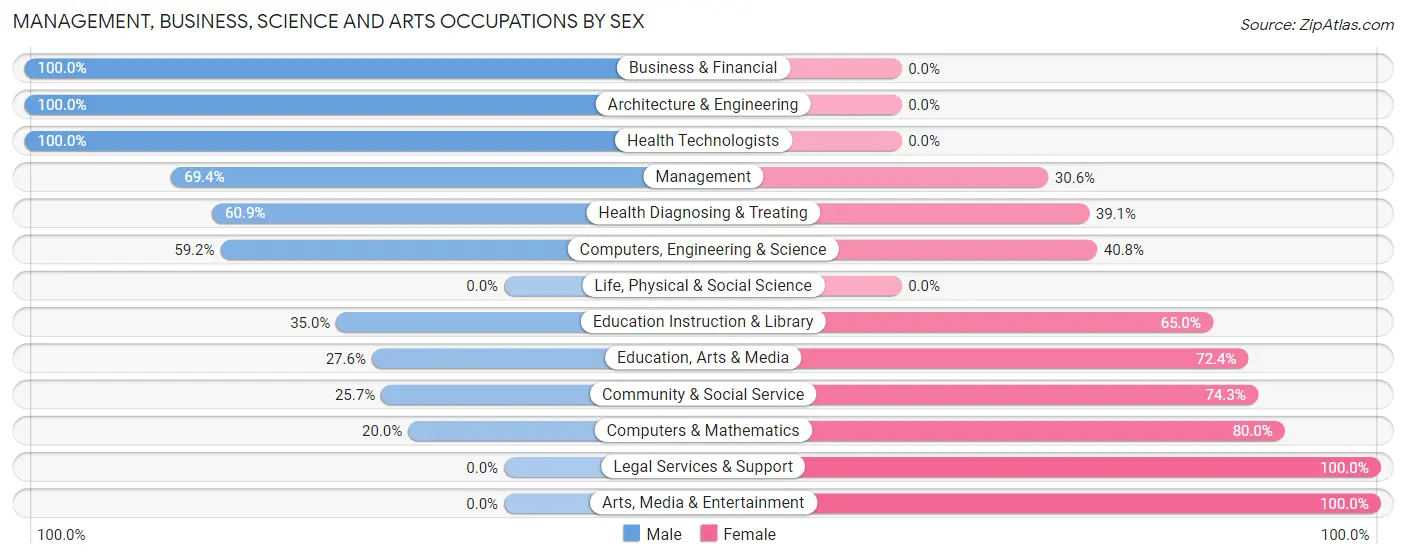
Management, Business, Science and Arts Occupations by Sex
Within the Management, Business, Science and Arts occupations in Columbia City, the most male-oriented occupations are Business & Financial (100.0%), Architecture & Engineering (100.0%), and Health Technologists (100.0%), while the most female-oriented occupations are Legal Services & Support (100.0%), Arts, Media & Entertainment (100.0%), and Computers & Mathematics (80.0%).
| Occupation | Male | Female |
| Management | 68 (69.4%) | 30 (30.6%) |
| Business & Financial | 22 (100.0%) | 0 (0.0%) |
| Computers, Engineering & Science | 29 (59.2%) | 20 (40.8%) |
| Computers & Mathematics | 5 (20.0%) | 20 (80.0%) |
| Architecture & Engineering | 24 (100.0%) | 0 (0.0%) |
| Life, Physical & Social Science | 0 (0.0%) | 0 (0.0%) |
| Community & Social Service | 29 (25.7%) | 84 (74.3%) |
| Education, Arts & Media | 8 (27.6%) | 21 (72.4%) |
| Legal Services & Support | 0 (0.0%) | 19 (100.0%) |
| Education Instruction & Library | 21 (35.0%) | 39 (65.0%) |
| Arts, Media & Entertainment | 0 (0.0%) | 5 (100.0%) |
| Health Diagnosing & Treating | 14 (60.9%) | 9 (39.1%) |
| Health Technologists | 14 (100.0%) | 0 (0.0%) |
| Total (Category) | 162 (53.1%) | 143 (46.9%) |
| Total (Overall) | 483 (61.5%) | 303 (38.6%) |
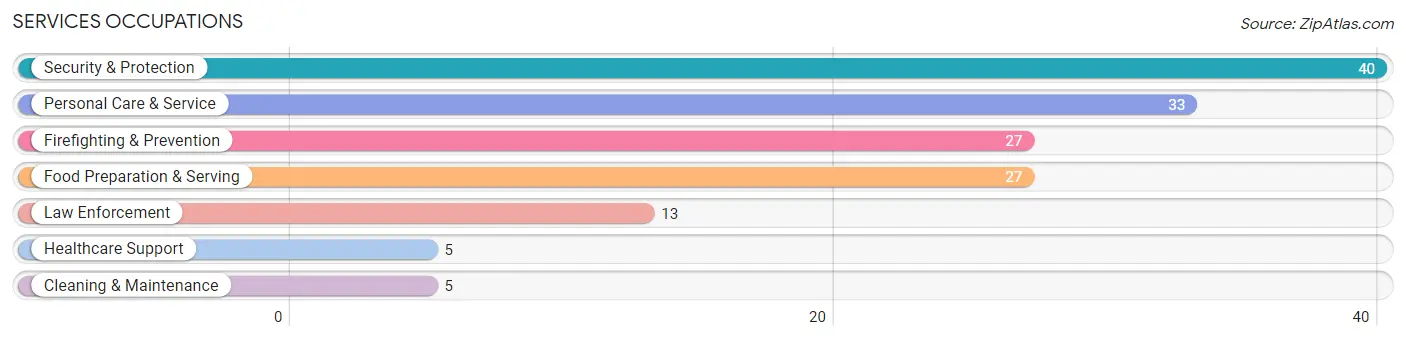
Services Occupations
The most common Services occupations in Columbia City are Security & Protection (40 | 5.1%), Personal Care & Service (33 | 4.2%), Firefighting & Prevention (27 | 3.4%), Food Preparation & Serving (27 | 3.4%), and Law Enforcement (13 | 1.7%).
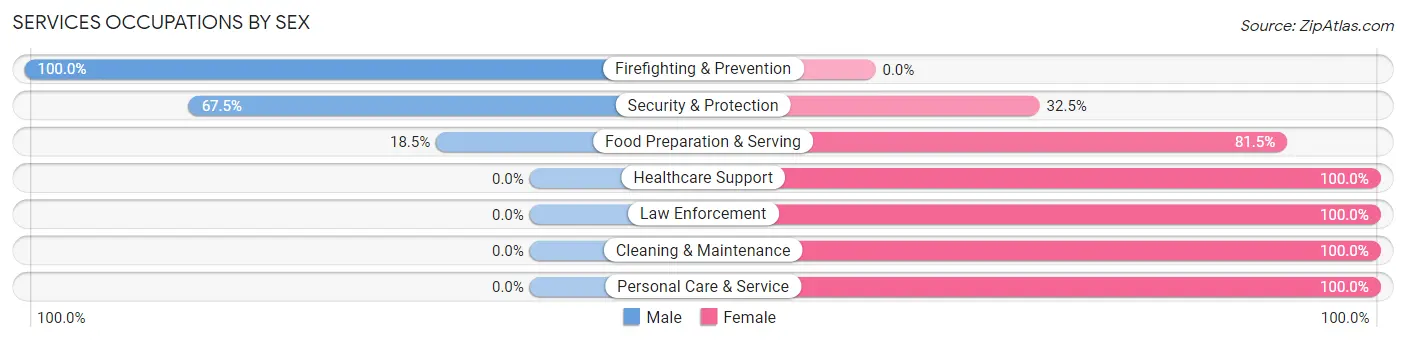
Services Occupations by Sex
Within the Services occupations in Columbia City, the most male-oriented occupations are Firefighting & Prevention (100.0%), Security & Protection (67.5%), and Food Preparation & Serving (18.5%), while the most female-oriented occupations are Healthcare Support (100.0%), Law Enforcement (100.0%), and Cleaning & Maintenance (100.0%).
| Occupation | Male | Female |
| Healthcare Support | 0 (0.0%) | 5 (100.0%) |
| Security & Protection | 27 (67.5%) | 13 (32.5%) |
| Firefighting & Prevention | 27 (100.0%) | 0 (0.0%) |
| Law Enforcement | 0 (0.0%) | 13 (100.0%) |
| Food Preparation & Serving | 5 (18.5%) | 22 (81.5%) |
| Cleaning & Maintenance | 0 (0.0%) | 5 (100.0%) |
| Personal Care & Service | 0 (0.0%) | 33 (100.0%) |
| Total (Category) | 32 (29.1%) | 78 (70.9%) |
| Total (Overall) | 483 (61.5%) | 303 (38.6%) |
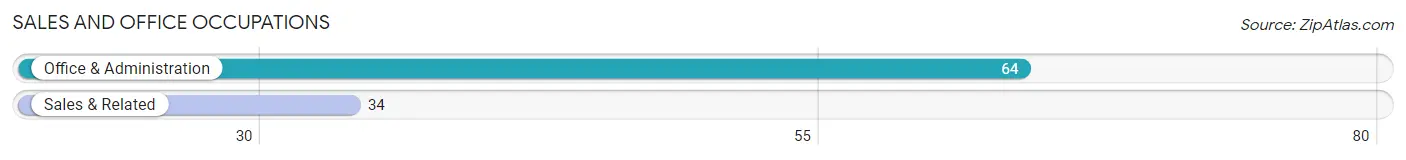
Sales and Office Occupations
The most common Sales and Office occupations in Columbia City are Office & Administration (64 | 8.1%), and Sales & Related (34 | 4.3%).
Sales and Office Occupations by Sex
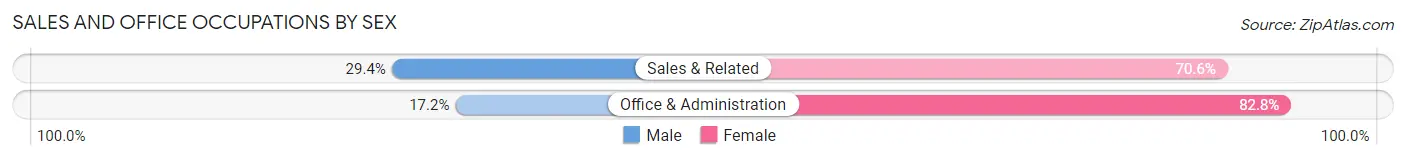
| Occupation | Male | Female |
| Sales & Related | 10 (29.4%) | 24 (70.6%) |
| Office & Administration | 11 (17.2%) | 53 (82.8%) |
| Total (Category) | 21 (21.4%) | 77 (78.6%) |
| Total (Overall) | 483 (61.5%) | 303 (38.6%) |
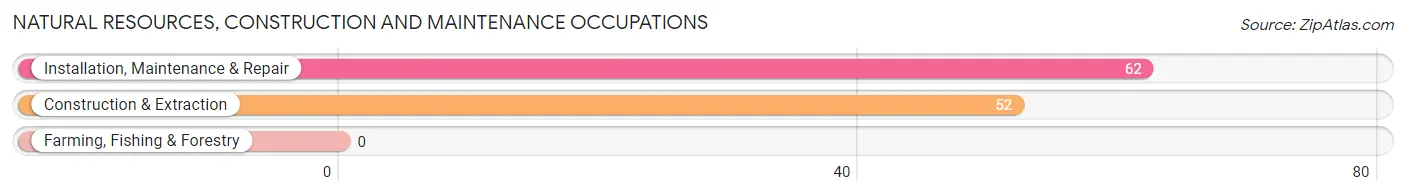
Natural Resources, Construction and Maintenance Occupations
The most common Natural Resources, Construction and Maintenance occupations in Columbia City are Installation, Maintenance & Repair (62 | 7.9%), and Construction & Extraction (52 | 6.6%).
Natural Resources, Construction and Maintenance Occupations by Sex
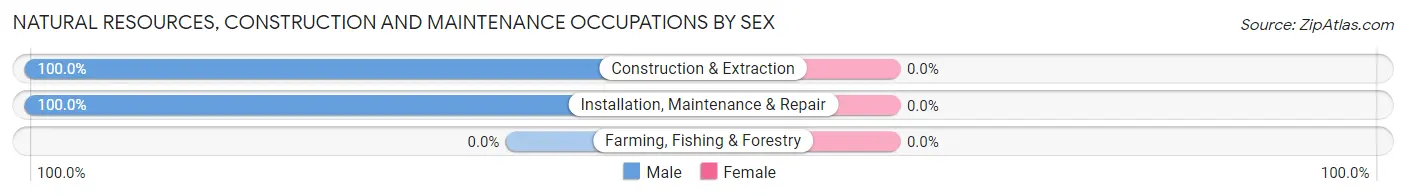
| Occupation | Male | Female |
| Farming, Fishing & Forestry | 0 (0.0%) | 0 (0.0%) |
| Construction & Extraction | 52 (100.0%) | 0 (0.0%) |
| Installation, Maintenance & Repair | 62 (100.0%) | 0 (0.0%) |
| Total (Category) | 114 (100.0%) | 0 (0.0%) |
| Total (Overall) | 483 (61.5%) | 303 (38.6%) |
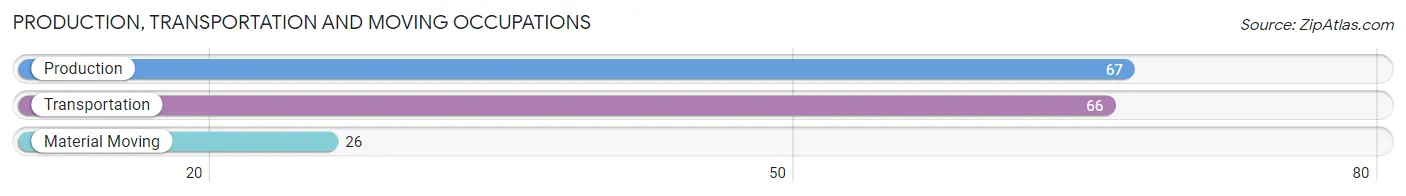
Production, Transportation and Moving Occupations
The most common Production, Transportation and Moving occupations in Columbia City are Production (67 | 8.5%), Transportation (66 | 8.4%), and Material Moving (26 | 3.3%).
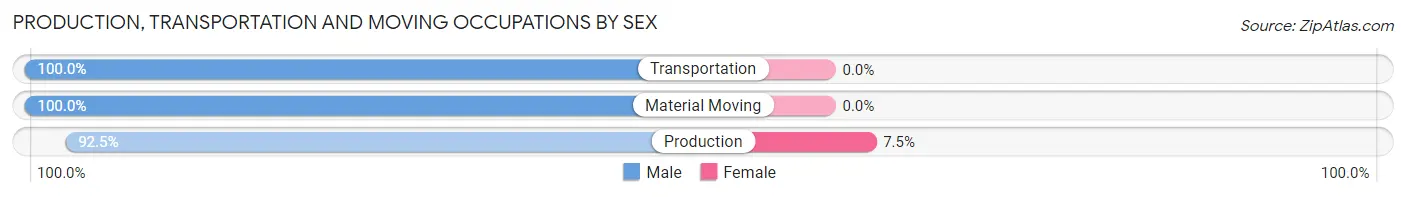
Production, Transportation and Moving Occupations by Sex
| Occupation | Male | Female |
| Production | 62 (92.5%) | 5 (7.5%) |
| Transportation | 66 (100.0%) | 0 (0.0%) |
| Material Moving | 26 (100.0%) | 0 (0.0%) |
| Total (Category) | 154 (96.9%) | 5 (3.1%) |
| Total (Overall) | 483 (61.5%) | 303 (38.6%) |
Employment Industries by Sex in Columbia City
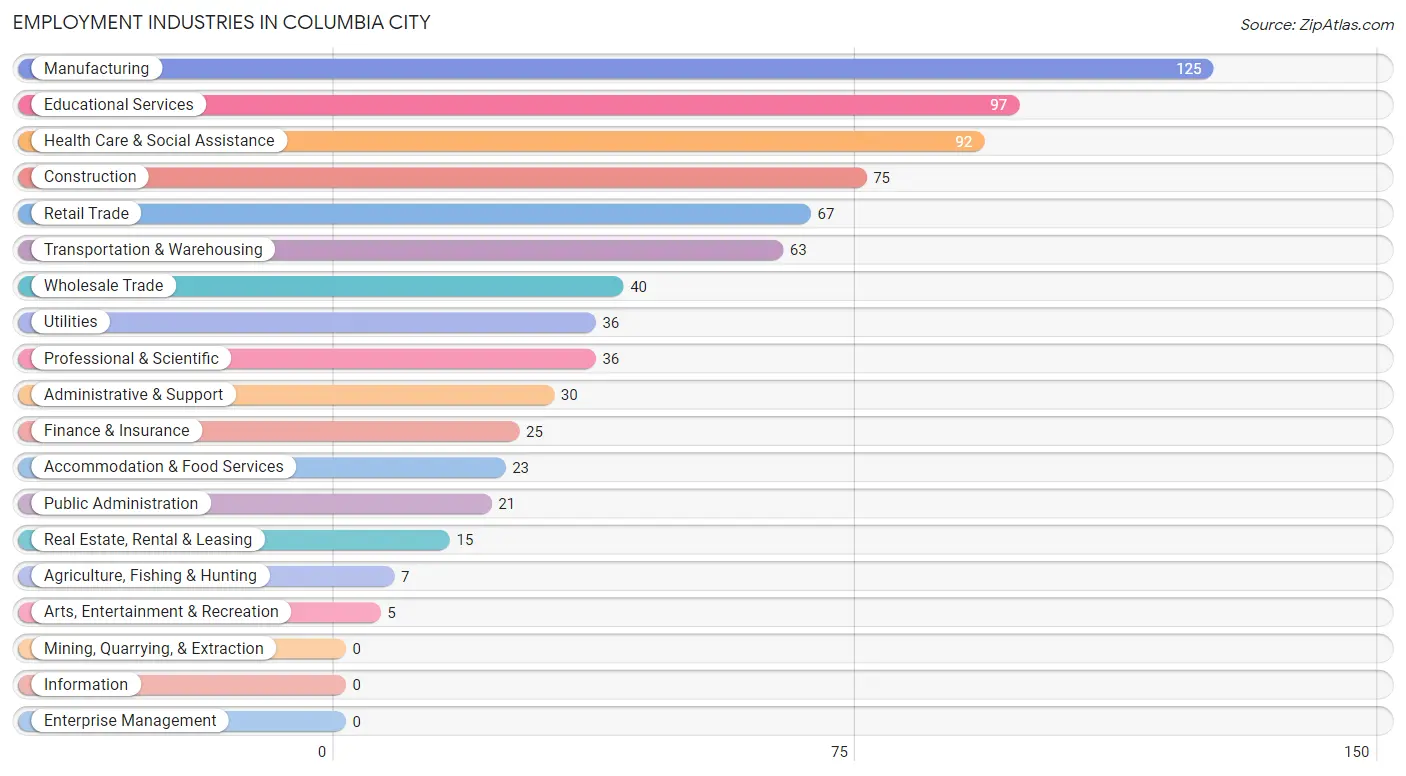
Employment Industries in Columbia City
The major employment industries in Columbia City include Manufacturing (125 | 15.9%), Educational Services (97 | 12.3%), Health Care & Social Assistance (92 | 11.7%), Construction (75 | 9.5%), and Retail Trade (67 | 8.5%).
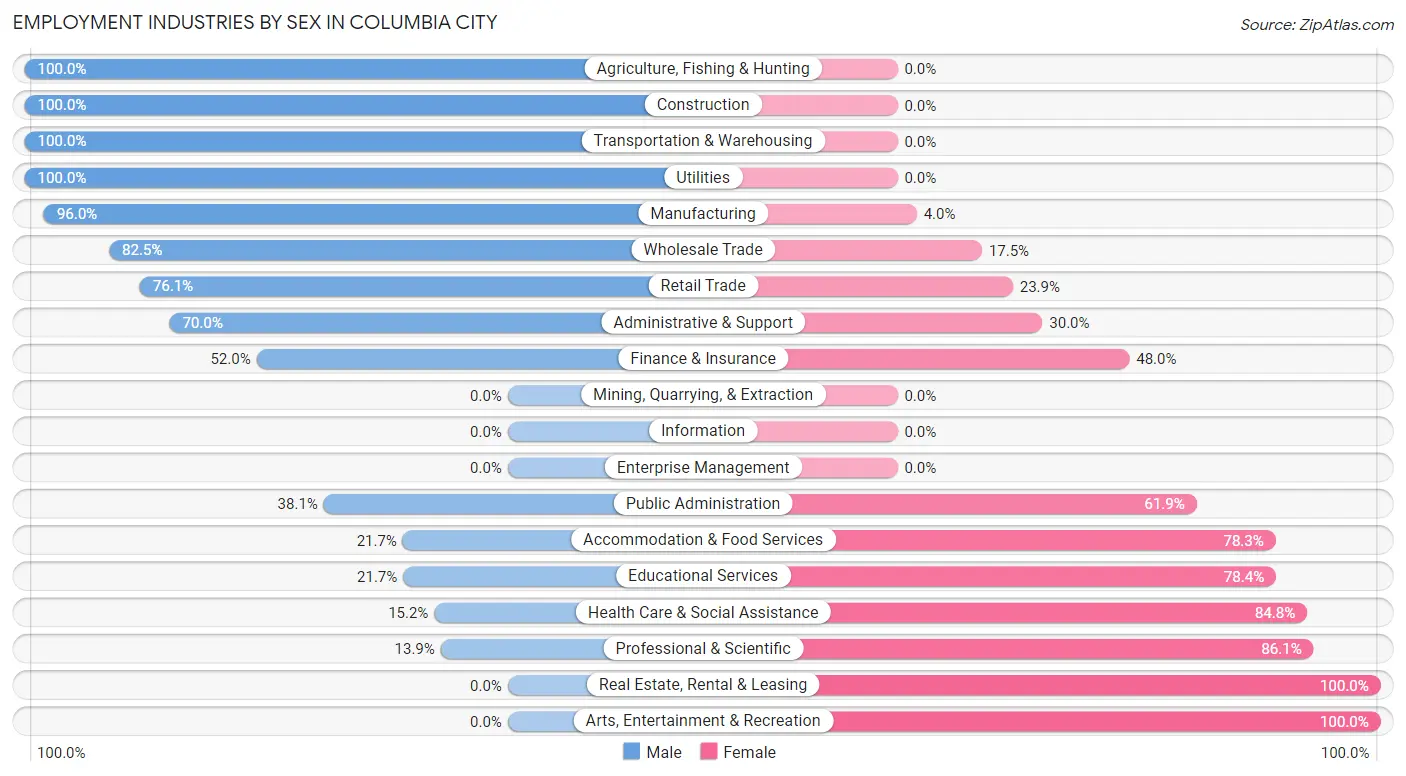
Employment Industries by Sex in Columbia City
The Columbia City industries that see more men than women are Agriculture, Fishing & Hunting (100.0%), Construction (100.0%), and Transportation & Warehousing (100.0%), whereas the industries that tend to have a higher number of women are Real Estate, Rental & Leasing (100.0%), Arts, Entertainment & Recreation (100.0%), and Professional & Scientific (86.1%).
| Industry | Male | Female |
| Agriculture, Fishing & Hunting | 7 (100.0%) | 0 (0.0%) |
| Mining, Quarrying, & Extraction | 0 (0.0%) | 0 (0.0%) |
| Construction | 75 (100.0%) | 0 (0.0%) |
| Manufacturing | 120 (96.0%) | 5 (4.0%) |
| Wholesale Trade | 33 (82.5%) | 7 (17.5%) |
| Retail Trade | 51 (76.1%) | 16 (23.9%) |
| Transportation & Warehousing | 63 (100.0%) | 0 (0.0%) |
| Utilities | 36 (100.0%) | 0 (0.0%) |
| Information | 0 (0.0%) | 0 (0.0%) |
| Finance & Insurance | 13 (52.0%) | 12 (48.0%) |
| Real Estate, Rental & Leasing | 0 (0.0%) | 15 (100.0%) |
| Professional & Scientific | 5 (13.9%) | 31 (86.1%) |
| Enterprise Management | 0 (0.0%) | 0 (0.0%) |
| Administrative & Support | 21 (70.0%) | 9 (30.0%) |
| Educational Services | 21 (21.6%) | 76 (78.3%) |
| Health Care & Social Assistance | 14 (15.2%) | 78 (84.8%) |
| Arts, Entertainment & Recreation | 0 (0.0%) | 5 (100.0%) |
| Accommodation & Food Services | 5 (21.7%) | 18 (78.3%) |
| Public Administration | 8 (38.1%) | 13 (61.9%) |
| Total | 483 (61.5%) | 303 (38.6%) |
Education in Columbia City
School Enrollment in Columbia City
The most common levels of schooling among the 400 students in Columbia City are high school (135 | 33.8%), middle school (76 | 19.0%), and elementary school (71 | 17.7%).
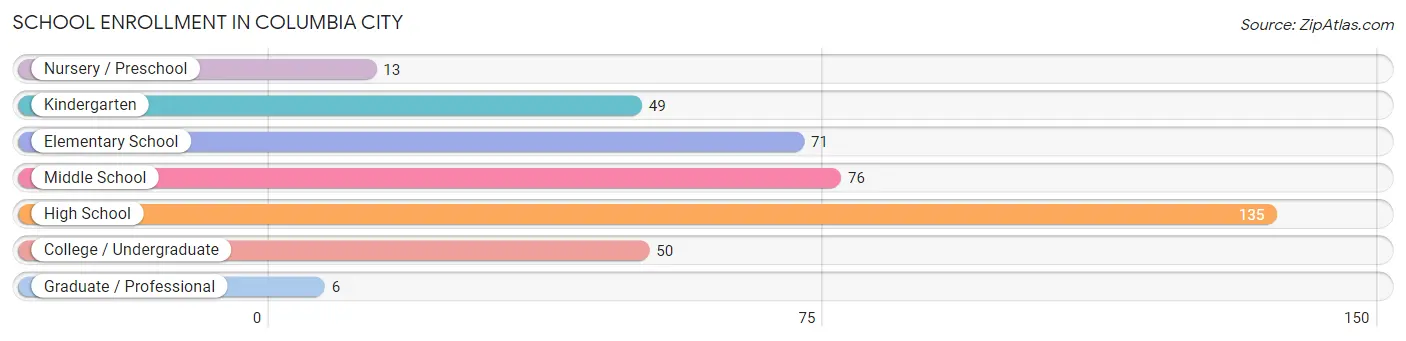
| School Level | # Students | % Students |
| Nursery / Preschool | 13 | 3.3% |
| Kindergarten | 49 | 12.2% |
| Elementary School | 71 | 17.7% |
| Middle School | 76 | 19.0% |
| High School | 135 | 33.8% |
| College / Undergraduate | 50 | 12.5% |
| Graduate / Professional | 6 | 1.5% |
| Total | 400 | 100.0% |
School Enrollment by Age by Funding Source in Columbia City
Out of a total of 400 students who are enrolled in schools in Columbia City, 53 (13.3%) attend a private institution, while the remaining 347 (86.7%) are enrolled in public schools. The age group of 3 to 4 year olds has the highest likelihood of being enrolled in private schools, with 6 (100.0% in the age bracket) enrolled. Conversely, the age group of 15 to 17 year olds has the lowest likelihood of being enrolled in a private school, with 120 (100.0% in the age bracket) attending a public institution.
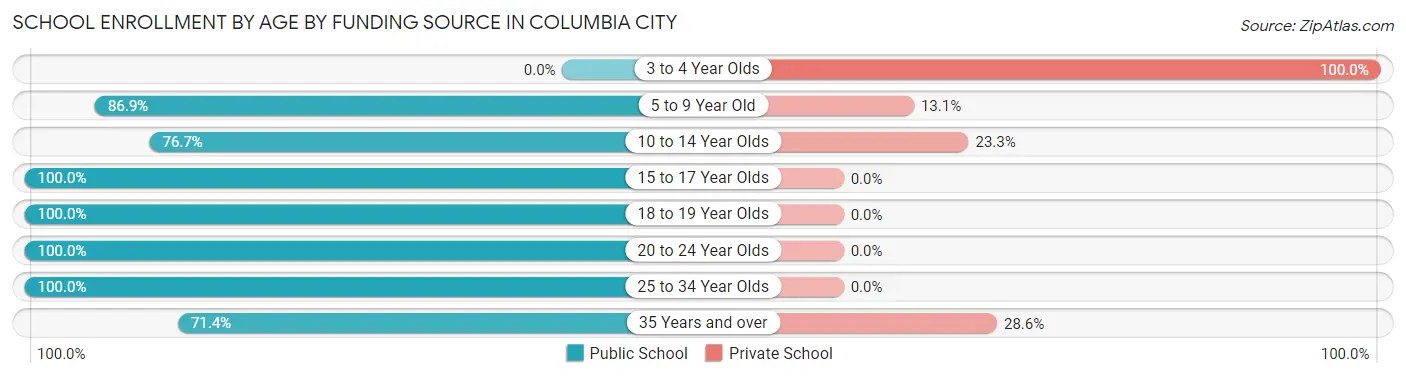
| Age Bracket | Public School | Private School |
| 3 to 4 Year Olds | 0 (0.0%) | 6 (100.0%) |
| 5 to 9 Year Old | 73 (86.9%) | 11 (13.1%) |
| 10 to 14 Year Olds | 99 (76.7%) | 30 (23.3%) |
| 15 to 17 Year Olds | 120 (100.0%) | 0 (0.0%) |
| 18 to 19 Year Olds | 17 (100.0%) | 0 (0.0%) |
| 20 to 24 Year Olds | 5 (100.0%) | 0 (0.0%) |
| 25 to 34 Year Olds | 18 (100.0%) | 0 (0.0%) |
| 35 Years and over | 15 (71.4%) | 6 (28.6%) |
| Total | 347 (86.8%) | 53 (13.3%) |
Educational Attainment by Field of Study in Columbia City
Education (91 | 28.1%), liberal arts & history (52 | 16.1%), social sciences (43 | 13.3%), bio, nature & agricultural (38 | 11.7%), and engineering (35 | 10.8%) are the most common fields of study among 324 individuals in Columbia City who have obtained a bachelor's degree or higher.
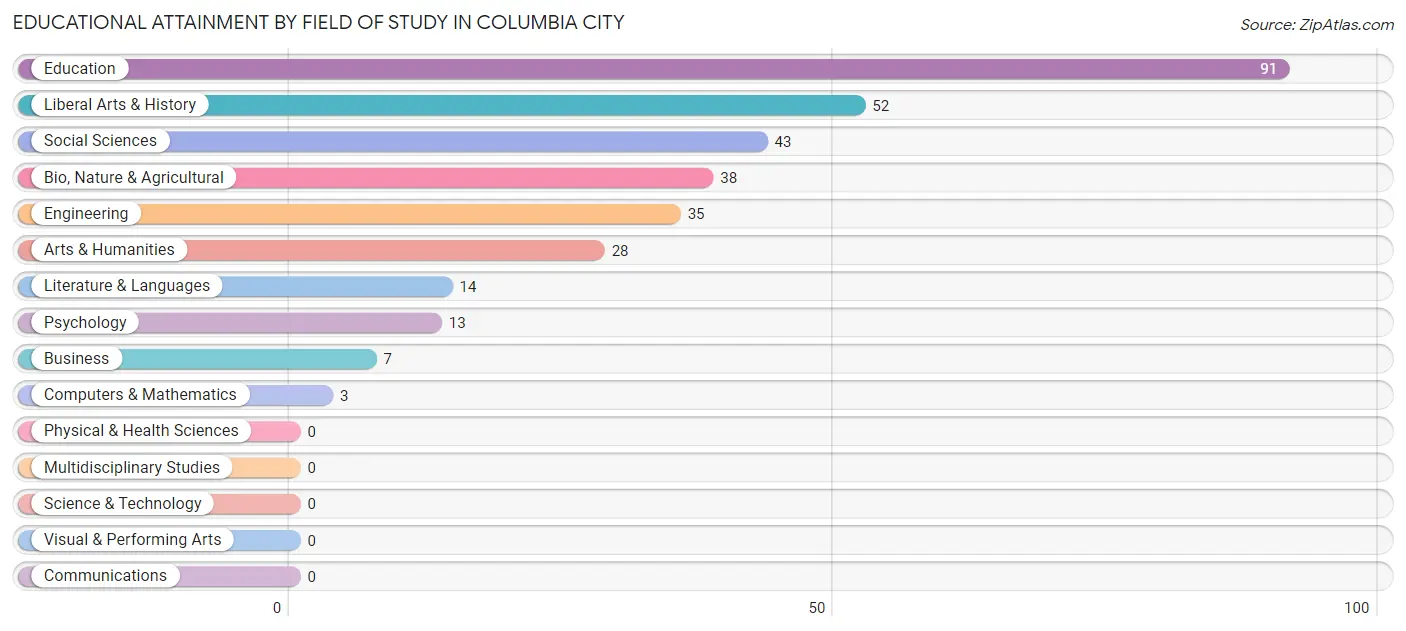
| Field of Study | # Graduates | % Graduates |
| Computers & Mathematics | 3 | 0.9% |
| Bio, Nature & Agricultural | 38 | 11.7% |
| Physical & Health Sciences | 0 | 0.0% |
| Psychology | 13 | 4.0% |
| Social Sciences | 43 | 13.3% |
| Engineering | 35 | 10.8% |
| Multidisciplinary Studies | 0 | 0.0% |
| Science & Technology | 0 | 0.0% |
| Business | 7 | 2.2% |
| Education | 91 | 28.1% |
| Literature & Languages | 14 | 4.3% |
| Liberal Arts & History | 52 | 16.1% |
| Visual & Performing Arts | 0 | 0.0% |
| Communications | 0 | 0.0% |
| Arts & Humanities | 28 | 8.6% |
| Total | 324 | 100.0% |
Transportation & Commute in Columbia City
Vehicle Availability by Sex in Columbia City
The most prevalent vehicle ownership categories in Columbia City are males with 2 vehicles (255, accounting for 53.5%) and females with 2 vehicles (150, making up 85.6%).
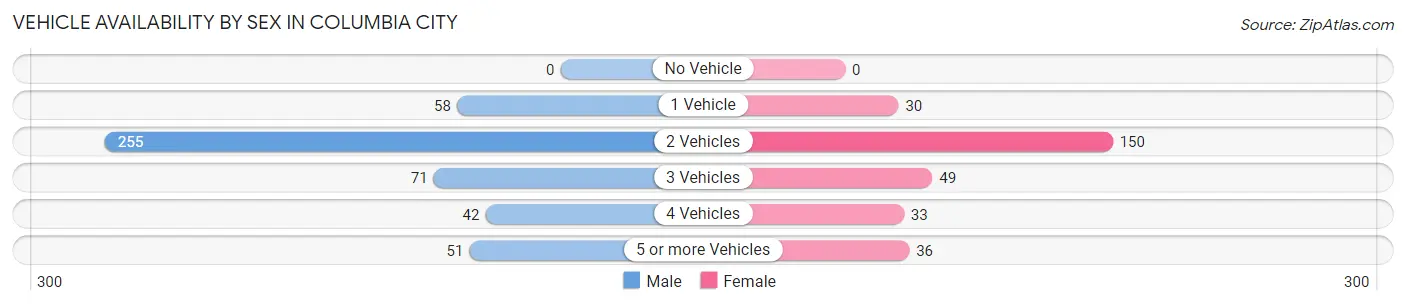
| Vehicles Available | Male | Female |
| No Vehicle | 0 (0.0%) | 0 (0.0%) |
| 1 Vehicle | 58 (12.2%) | 30 (10.1%) |
| 2 Vehicles | 255 (53.5%) | 150 (50.3%) |
| 3 Vehicles | 71 (14.9%) | 49 (16.4%) |
| 4 Vehicles | 42 (8.8%) | 33 (11.1%) |
| 5 or more Vehicles | 51 (10.7%) | 36 (12.1%) |
| Total | 477 (100.0%) | 298 (100.0%) |
Commute Time in Columbia City
The most frequently occuring commute durations in Columbia City are 45 to 59 minutes (203 commuters, 28.7%), 60 to 89 minutes (136 commuters, 19.2%), and 10 to 14 minutes (108 commuters, 15.3%).
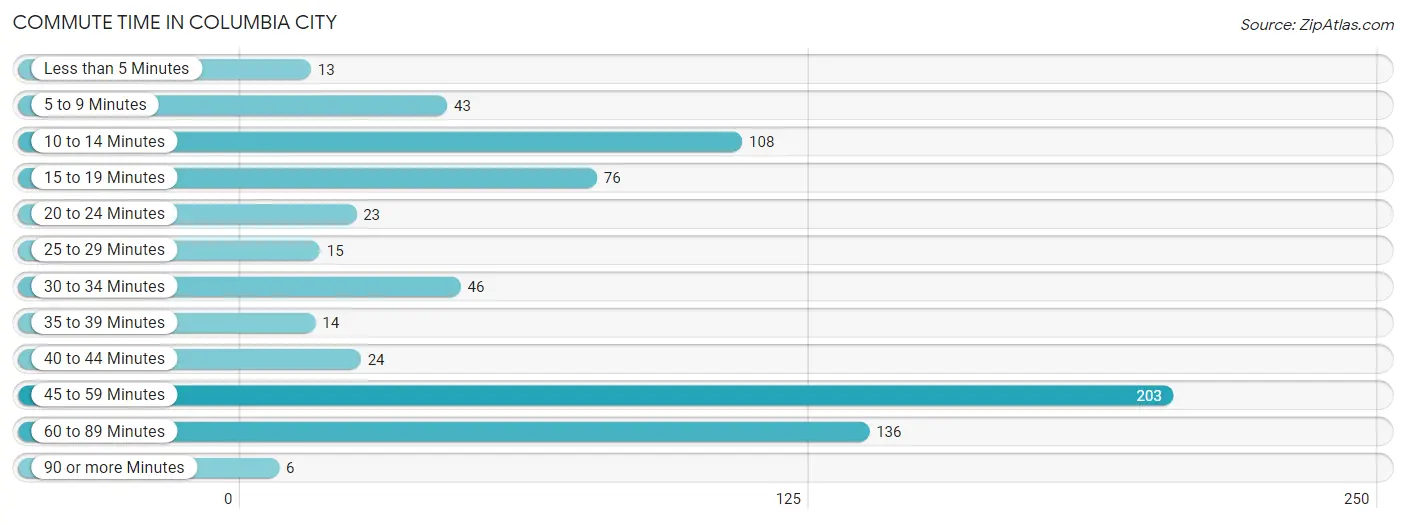
| Commute Time | # Commuters | % Commuters |
| Less than 5 Minutes | 13 | 1.8% |
| 5 to 9 Minutes | 43 | 6.1% |
| 10 to 14 Minutes | 108 | 15.3% |
| 15 to 19 Minutes | 76 | 10.7% |
| 20 to 24 Minutes | 23 | 3.3% |
| 25 to 29 Minutes | 15 | 2.1% |
| 30 to 34 Minutes | 46 | 6.5% |
| 35 to 39 Minutes | 14 | 2.0% |
| 40 to 44 Minutes | 24 | 3.4% |
| 45 to 59 Minutes | 203 | 28.7% |
| 60 to 89 Minutes | 136 | 19.2% |
| 90 or more Minutes | 6 | 0.9% |
Commute Time by Sex in Columbia City
The most common commute times in Columbia City are 45 to 59 minutes (149 commuters, 33.3%) for males and 45 to 59 minutes (54 commuters, 20.8%) for females.
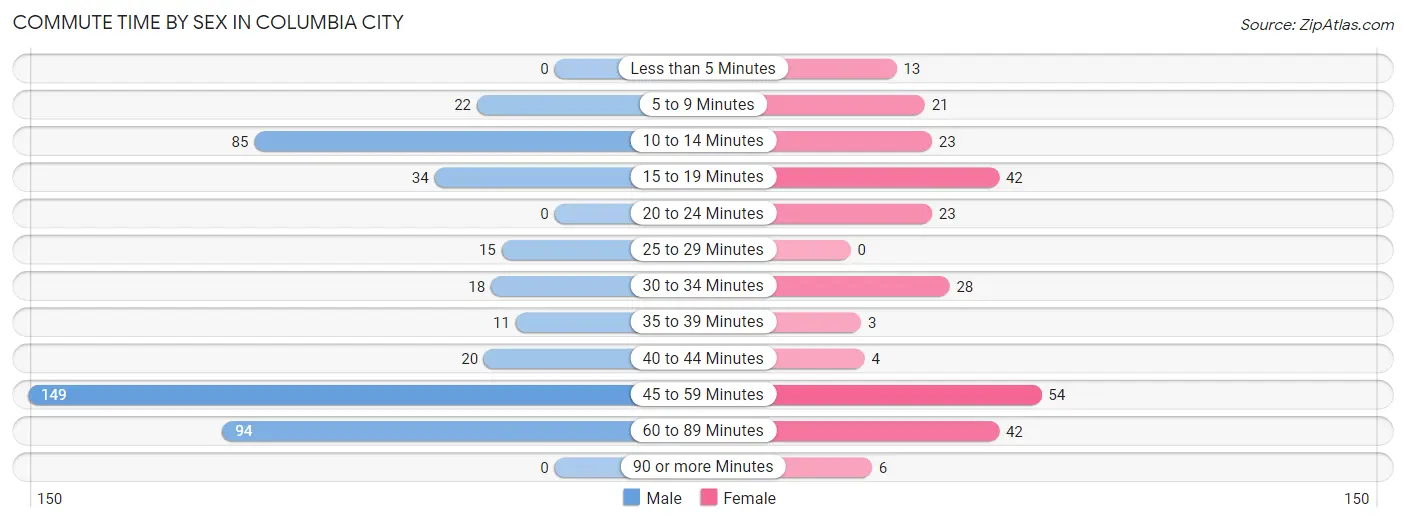
| Commute Time | Male | Female |
| Less than 5 Minutes | 0 (0.0%) | 13 (5.0%) |
| 5 to 9 Minutes | 22 (4.9%) | 21 (8.1%) |
| 10 to 14 Minutes | 85 (19.0%) | 23 (8.9%) |
| 15 to 19 Minutes | 34 (7.6%) | 42 (16.2%) |
| 20 to 24 Minutes | 0 (0.0%) | 23 (8.9%) |
| 25 to 29 Minutes | 15 (3.4%) | 0 (0.0%) |
| 30 to 34 Minutes | 18 (4.0%) | 28 (10.8%) |
| 35 to 39 Minutes | 11 (2.5%) | 3 (1.2%) |
| 40 to 44 Minutes | 20 (4.5%) | 4 (1.5%) |
| 45 to 59 Minutes | 149 (33.3%) | 54 (20.8%) |
| 60 to 89 Minutes | 94 (21.0%) | 42 (16.2%) |
| 90 or more Minutes | 0 (0.0%) | 6 (2.3%) |
Time of Departure to Work by Sex in Columbia City
The most frequent times of departure to work in Columbia City are 5:00 AM to 5:29 AM (113, 25.2%) for males and 7:00 AM to 7:29 AM (42, 16.2%) for females.
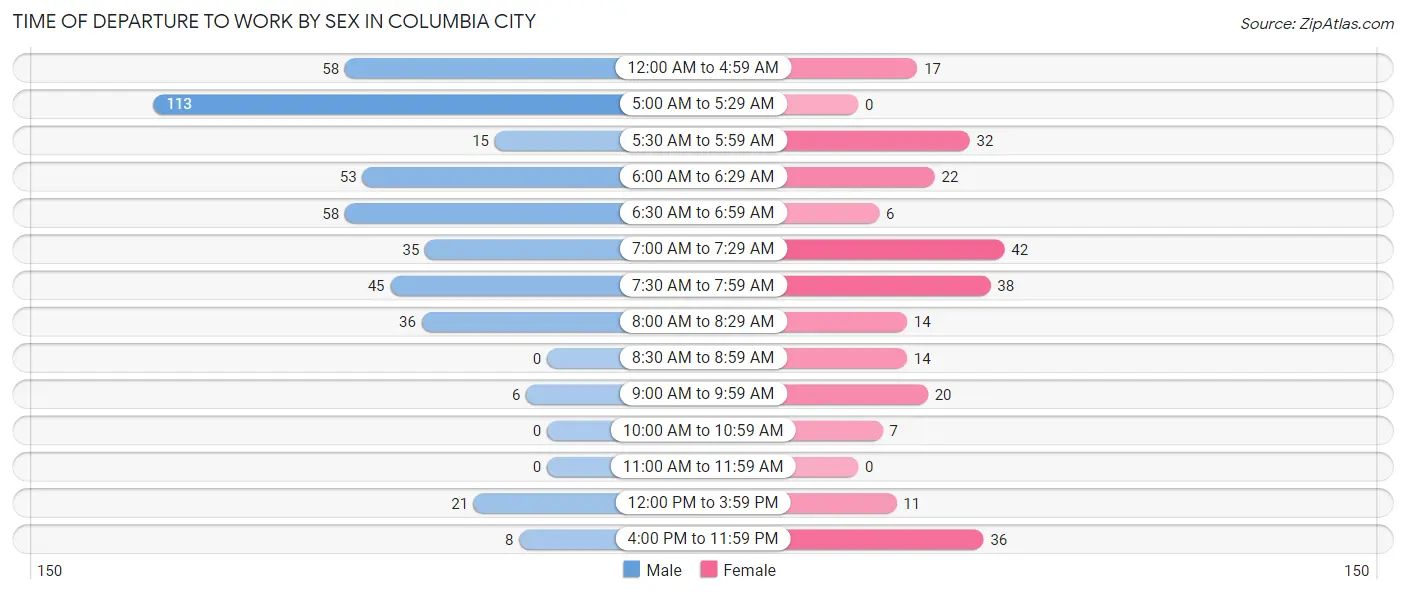
| Time of Departure | Male | Female |
| 12:00 AM to 4:59 AM | 58 (13.0%) | 17 (6.6%) |
| 5:00 AM to 5:29 AM | 113 (25.2%) | 0 (0.0%) |
| 5:30 AM to 5:59 AM | 15 (3.4%) | 32 (12.4%) |
| 6:00 AM to 6:29 AM | 53 (11.8%) | 22 (8.5%) |
| 6:30 AM to 6:59 AM | 58 (13.0%) | 6 (2.3%) |
| 7:00 AM to 7:29 AM | 35 (7.8%) | 42 (16.2%) |
| 7:30 AM to 7:59 AM | 45 (10.0%) | 38 (14.7%) |
| 8:00 AM to 8:29 AM | 36 (8.0%) | 14 (5.4%) |
| 8:30 AM to 8:59 AM | 0 (0.0%) | 14 (5.4%) |
| 9:00 AM to 9:59 AM | 6 (1.3%) | 20 (7.7%) |
| 10:00 AM to 10:59 AM | 0 (0.0%) | 7 (2.7%) |
| 11:00 AM to 11:59 AM | 0 (0.0%) | 0 (0.0%) |
| 12:00 PM to 3:59 PM | 21 (4.7%) | 11 (4.3%) |
| 4:00 PM to 11:59 PM | 8 (1.8%) | 36 (13.9%) |
| Total | 448 (100.0%) | 259 (100.0%) |
Housing Occupancy in Columbia City
Occupancy by Ownership in Columbia City
Of the total 690 dwellings in Columbia City, owner-occupied units account for 612 (88.7%), while renter-occupied units make up 78 (11.3%).
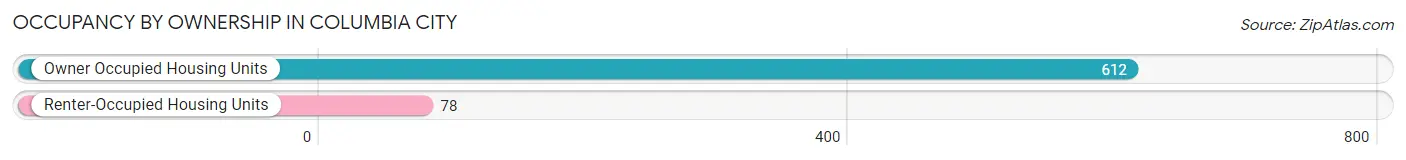
| Occupancy | # Housing Units | % Housing Units |
| Owner Occupied Housing Units | 612 | 88.7% |
| Renter-Occupied Housing Units | 78 | 11.3% |
| Total Occupied Housing Units | 690 | 100.0% |
Occupancy by Household Size in Columbia City
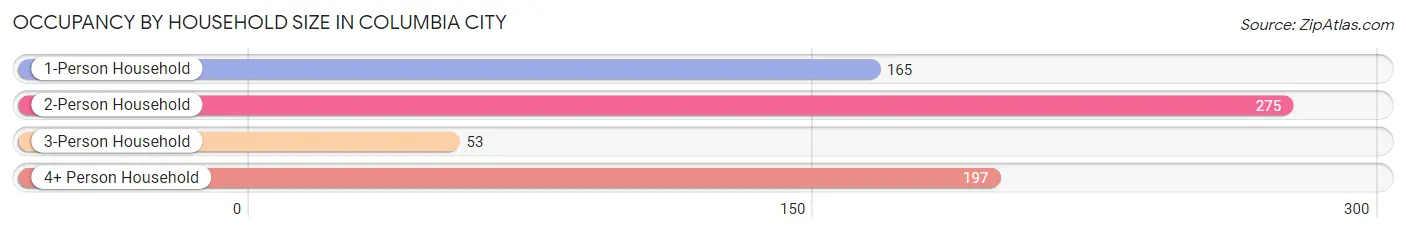
| Household Size | # Housing Units | % Housing Units |
| 1-Person Household | 165 | 23.9% |
| 2-Person Household | 275 | 39.9% |
| 3-Person Household | 53 | 7.7% |
| 4+ Person Household | 197 | 28.5% |
| Total Housing Units | 690 | 100.0% |
Occupancy by Ownership by Household Size in Columbia City
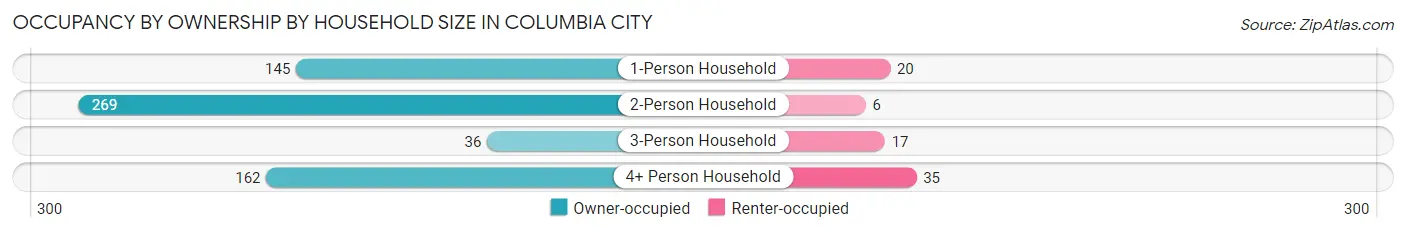
| Household Size | Owner-occupied | Renter-occupied |
| 1-Person Household | 145 (87.9%) | 20 (12.1%) |
| 2-Person Household | 269 (97.8%) | 6 (2.2%) |
| 3-Person Household | 36 (67.9%) | 17 (32.1%) |
| 4+ Person Household | 162 (82.2%) | 35 (17.8%) |
| Total Housing Units | 612 (88.7%) | 78 (11.3%) |
Occupancy by Educational Attainment in Columbia City
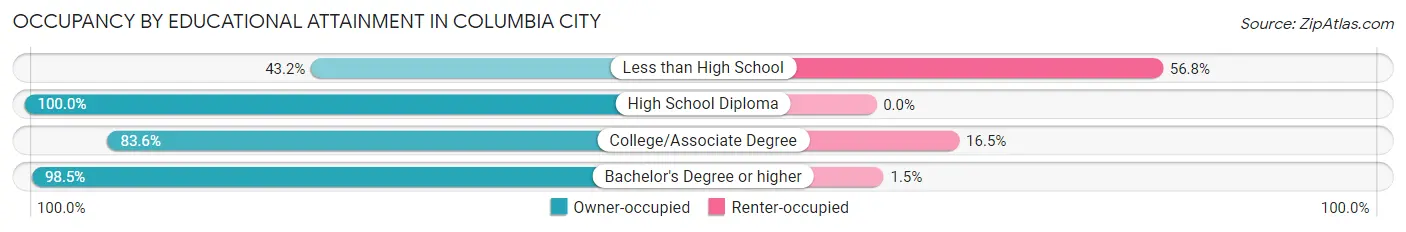
| Household Size | Owner-occupied | Renter-occupied |
| Less than High School | 19 (43.2%) | 25 (56.8%) |
| High School Diploma | 137 (100.0%) | 0 (0.0%) |
| College/Associate Degree | 254 (83.6%) | 50 (16.5%) |
| Bachelor's Degree or higher | 202 (98.5%) | 3 (1.5%) |
Occupancy by Age of Householder in Columbia City
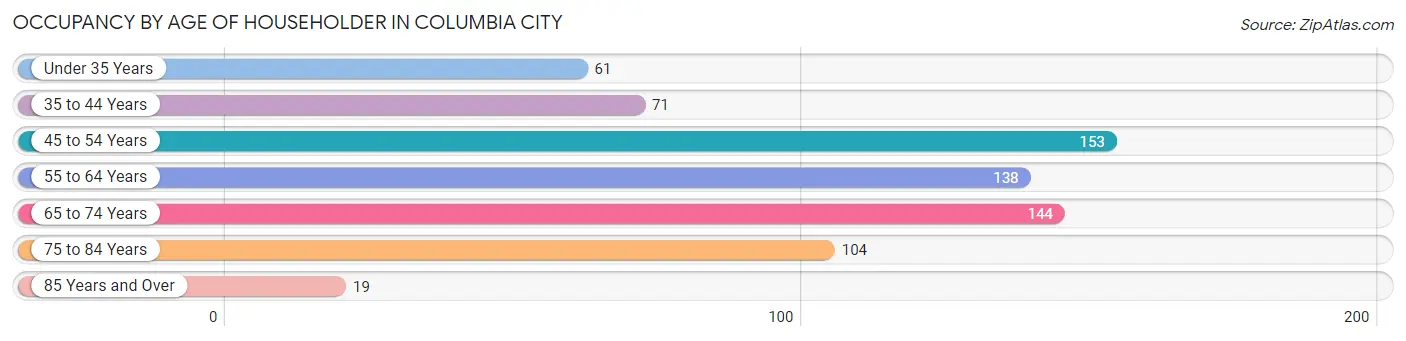
| Age Bracket | # Households | % Households |
| Under 35 Years | 61 | 8.8% |
| 35 to 44 Years | 71 | 10.3% |
| 45 to 54 Years | 153 | 22.2% |
| 55 to 64 Years | 138 | 20.0% |
| 65 to 74 Years | 144 | 20.9% |
| 75 to 84 Years | 104 | 15.1% |
| 85 Years and Over | 19 | 2.8% |
| Total | 690 | 100.0% |
Housing Finances in Columbia City
Median Income by Occupancy in Columbia City
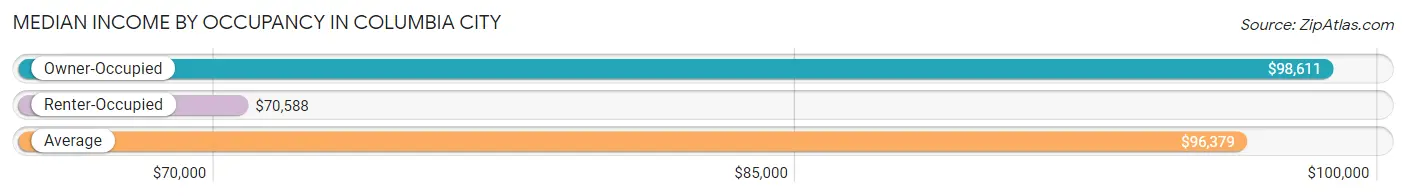
| Occupancy Type | # Households | Median Income |
| Owner-Occupied | 612 (88.7%) | $98,611 |
| Renter-Occupied | 78 (11.3%) | $70,588 |
| Average | 690 (100.0%) | $96,379 |
Occupancy by Householder Income Bracket in Columbia City
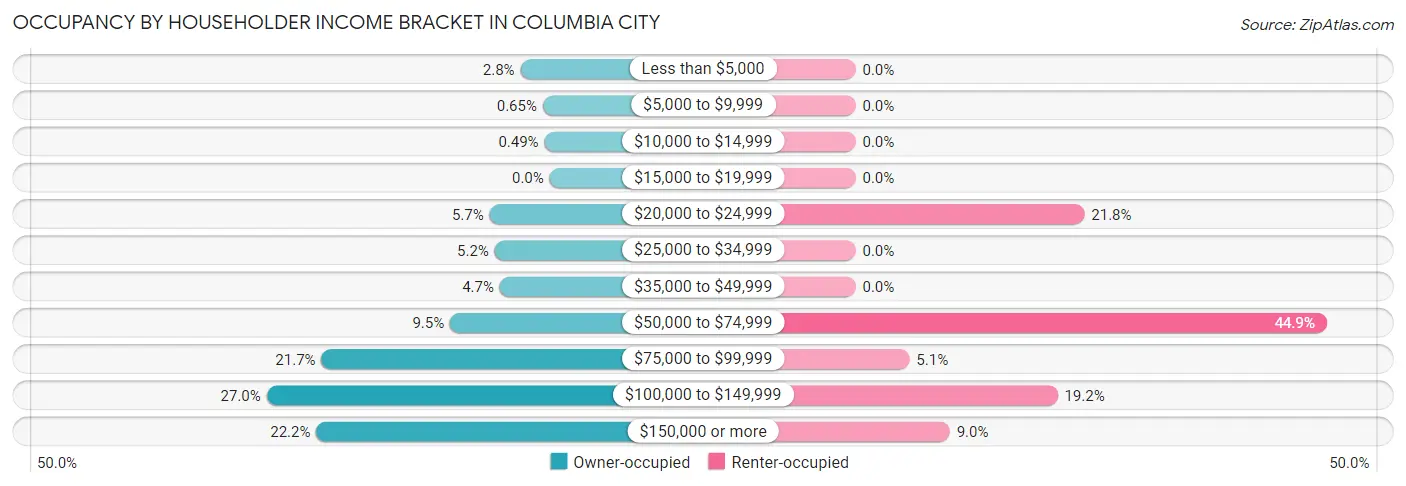
| Income Bracket | Owner-occupied | Renter-occupied |
| Less than $5,000 | 17 (2.8%) | 0 (0.0%) |
| $5,000 to $9,999 | 4 (0.6%) | 0 (0.0%) |
| $10,000 to $14,999 | 3 (0.5%) | 0 (0.0%) |
| $15,000 to $19,999 | 0 (0.0%) | 0 (0.0%) |
| $20,000 to $24,999 | 35 (5.7%) | 17 (21.8%) |
| $25,000 to $34,999 | 32 (5.2%) | 0 (0.0%) |
| $35,000 to $49,999 | 29 (4.7%) | 0 (0.0%) |
| $50,000 to $74,999 | 58 (9.5%) | 35 (44.9%) |
| $75,000 to $99,999 | 133 (21.7%) | 4 (5.1%) |
| $100,000 to $149,999 | 165 (27.0%) | 15 (19.2%) |
| $150,000 or more | 136 (22.2%) | 7 (9.0%) |
| Total | 612 (100.0%) | 78 (100.0%) |
Monthly Housing Cost Tiers in Columbia City
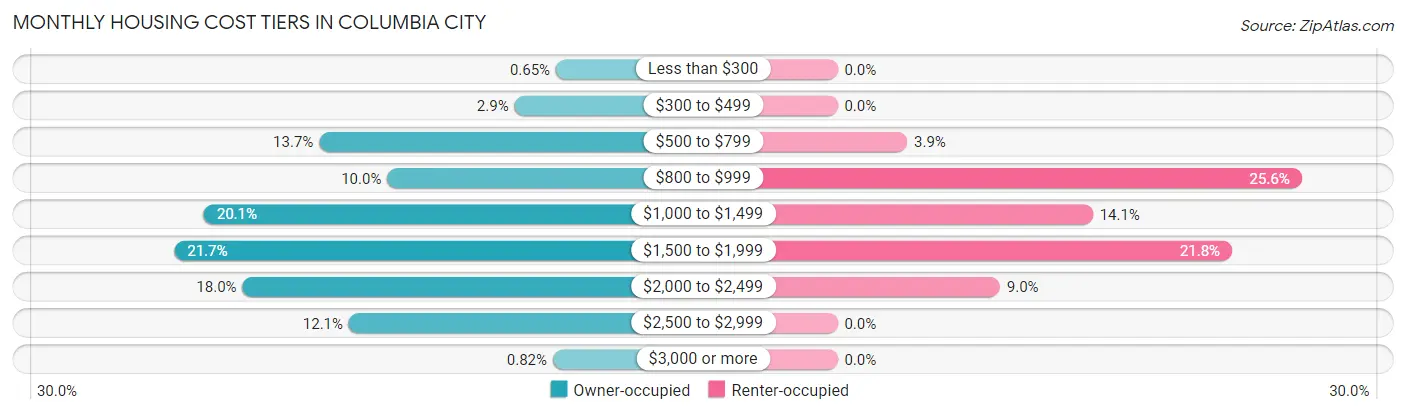
| Monthly Cost | Owner-occupied | Renter-occupied |
| Less than $300 | 4 (0.6%) | 0 (0.0%) |
| $300 to $499 | 18 (2.9%) | 0 (0.0%) |
| $500 to $799 | 84 (13.7%) | 3 (3.8%) |
| $800 to $999 | 61 (10.0%) | 20 (25.6%) |
| $1,000 to $1,499 | 123 (20.1%) | 11 (14.1%) |
| $1,500 to $1,999 | 133 (21.7%) | 17 (21.8%) |
| $2,000 to $2,499 | 110 (18.0%) | 7 (9.0%) |
| $2,500 to $2,999 | 74 (12.1%) | 0 (0.0%) |
| $3,000 or more | 5 (0.8%) | 0 (0.0%) |
| Total | 612 (100.0%) | 78 (100.0%) |
Physical Housing Characteristics in Columbia City
Housing Structures in Columbia City
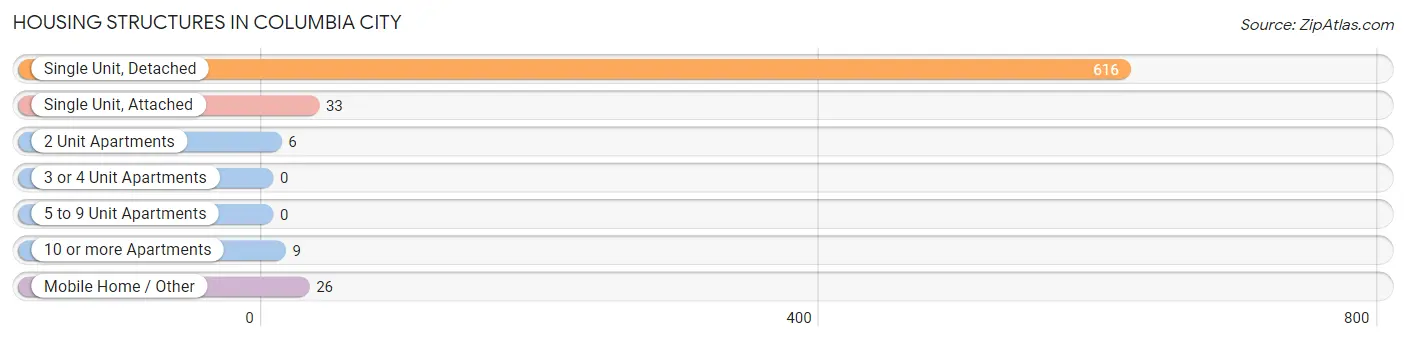
| Structure Type | # Housing Units | % Housing Units |
| Single Unit, Detached | 616 | 89.3% |
| Single Unit, Attached | 33 | 4.8% |
| 2 Unit Apartments | 6 | 0.9% |
| 3 or 4 Unit Apartments | 0 | 0.0% |
| 5 to 9 Unit Apartments | 0 | 0.0% |
| 10 or more Apartments | 9 | 1.3% |
| Mobile Home / Other | 26 | 3.8% |
| Total | 690 | 100.0% |
Housing Structures by Occupancy in Columbia City
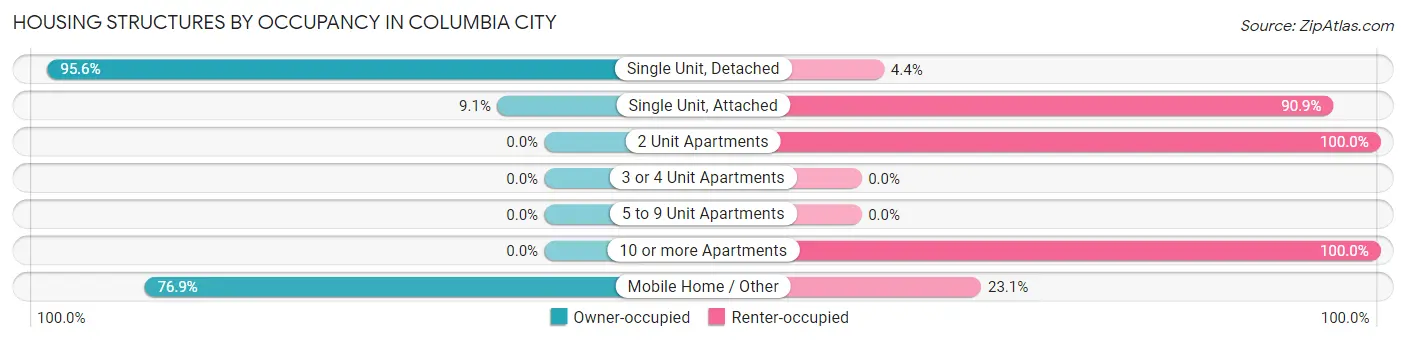
| Structure Type | Owner-occupied | Renter-occupied |
| Single Unit, Detached | 589 (95.6%) | 27 (4.4%) |
| Single Unit, Attached | 3 (9.1%) | 30 (90.9%) |
| 2 Unit Apartments | 0 (0.0%) | 6 (100.0%) |
| 3 or 4 Unit Apartments | 0 (0.0%) | 0 (0.0%) |
| 5 to 9 Unit Apartments | 0 (0.0%) | 0 (0.0%) |
| 10 or more Apartments | 0 (0.0%) | 9 (100.0%) |
| Mobile Home / Other | 20 (76.9%) | 6 (23.1%) |
| Total | 612 (88.7%) | 78 (11.3%) |
Housing Structures by Number of Rooms in Columbia City
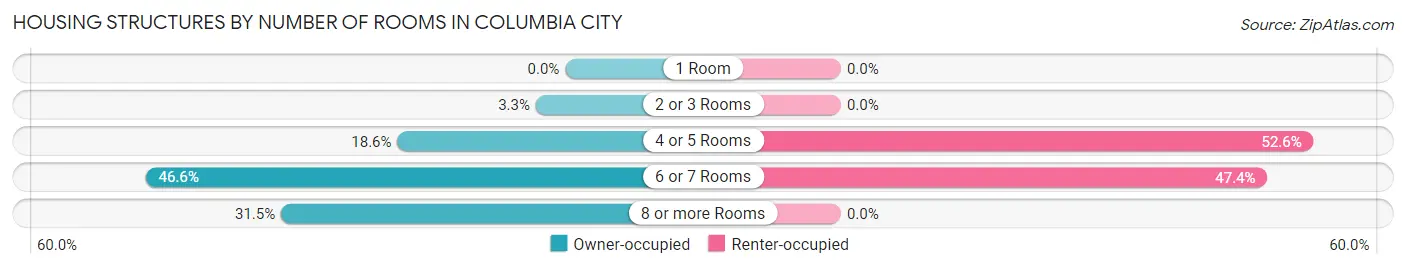
| Number of Rooms | Owner-occupied | Renter-occupied |
| 1 Room | 0 (0.0%) | 0 (0.0%) |
| 2 or 3 Rooms | 20 (3.3%) | 0 (0.0%) |
| 4 or 5 Rooms | 114 (18.6%) | 41 (52.6%) |
| 6 or 7 Rooms | 285 (46.6%) | 37 (47.4%) |
| 8 or more Rooms | 193 (31.5%) | 0 (0.0%) |
| Total | 612 (100.0%) | 78 (100.0%) |
Housing Structure by Heating Type in Columbia City
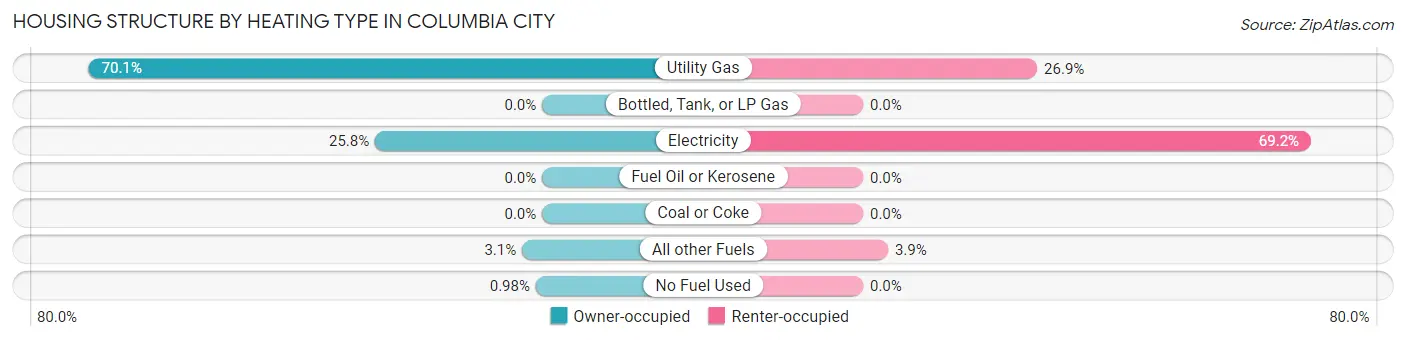
| Heating Type | Owner-occupied | Renter-occupied |
| Utility Gas | 429 (70.1%) | 21 (26.9%) |
| Bottled, Tank, or LP Gas | 0 (0.0%) | 0 (0.0%) |
| Electricity | 158 (25.8%) | 54 (69.2%) |
| Fuel Oil or Kerosene | 0 (0.0%) | 0 (0.0%) |
| Coal or Coke | 0 (0.0%) | 0 (0.0%) |
| All other Fuels | 19 (3.1%) | 3 (3.8%) |
| No Fuel Used | 6 (1.0%) | 0 (0.0%) |
| Total | 612 (100.0%) | 78 (100.0%) |
Household Vehicle Usage in Columbia City
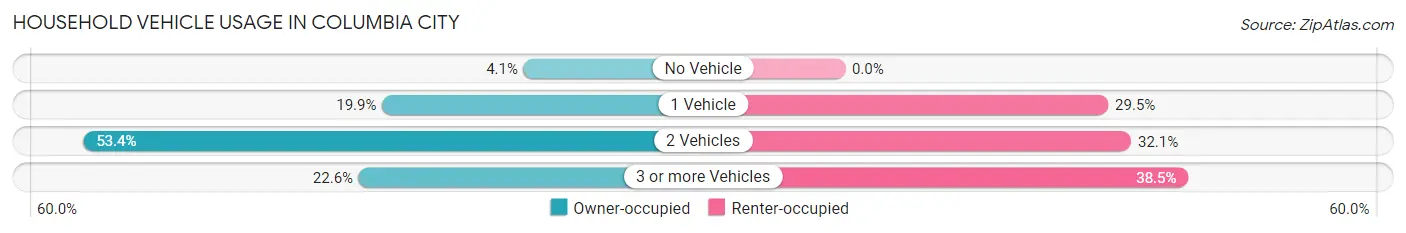
| Vehicles per Household | Owner-occupied | Renter-occupied |
| No Vehicle | 25 (4.1%) | 0 (0.0%) |
| 1 Vehicle | 122 (19.9%) | 23 (29.5%) |
| 2 Vehicles | 327 (53.4%) | 25 (32.1%) |
| 3 or more Vehicles | 138 (22.6%) | 30 (38.5%) |
| Total | 612 (100.0%) | 78 (100.0%) |
Real Estate & Mortgages in Columbia City
Real Estate and Mortgage Overview in Columbia City
| Characteristic | Without Mortgage | With Mortgage |
| Housing Units | 155 | 457 |
| Median Property Value | $408,000 | $394,900 |
| Median Household Income | $109,821 | $85 |
| Monthly Housing Costs | $764 | $5 |
| Real Estate Taxes | $4,211 | $0 |
Property Value by Mortgage Status in Columbia City
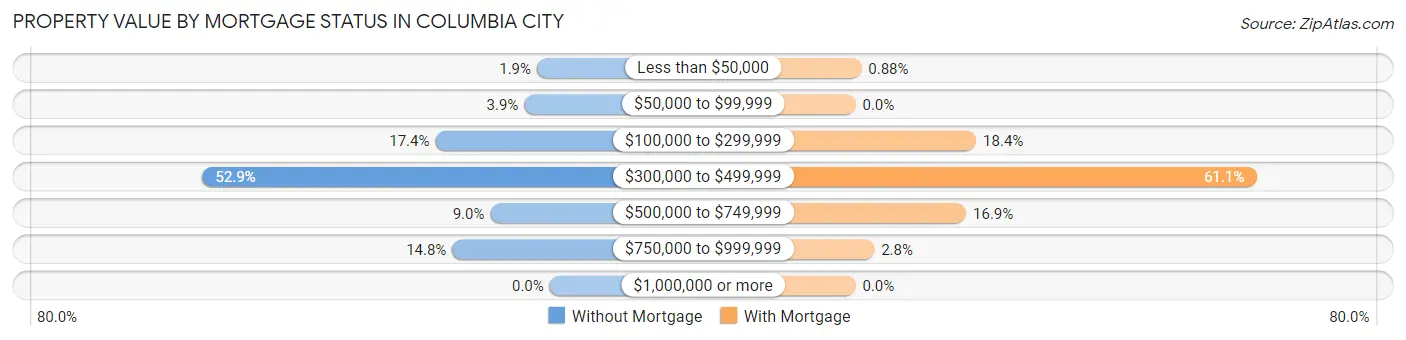
| Property Value | Without Mortgage | With Mortgage |
| Less than $50,000 | 3 (1.9%) | 4 (0.9%) |
| $50,000 to $99,999 | 6 (3.9%) | 0 (0.0%) |
| $100,000 to $299,999 | 27 (17.4%) | 84 (18.4%) |
| $300,000 to $499,999 | 82 (52.9%) | 279 (61.1%) |
| $500,000 to $749,999 | 14 (9.0%) | 77 (16.9%) |
| $750,000 to $999,999 | 23 (14.8%) | 13 (2.8%) |
| $1,000,000 or more | 0 (0.0%) | 0 (0.0%) |
| Total | 155 (100.0%) | 457 (100.0%) |
Household Income by Mortgage Status in Columbia City
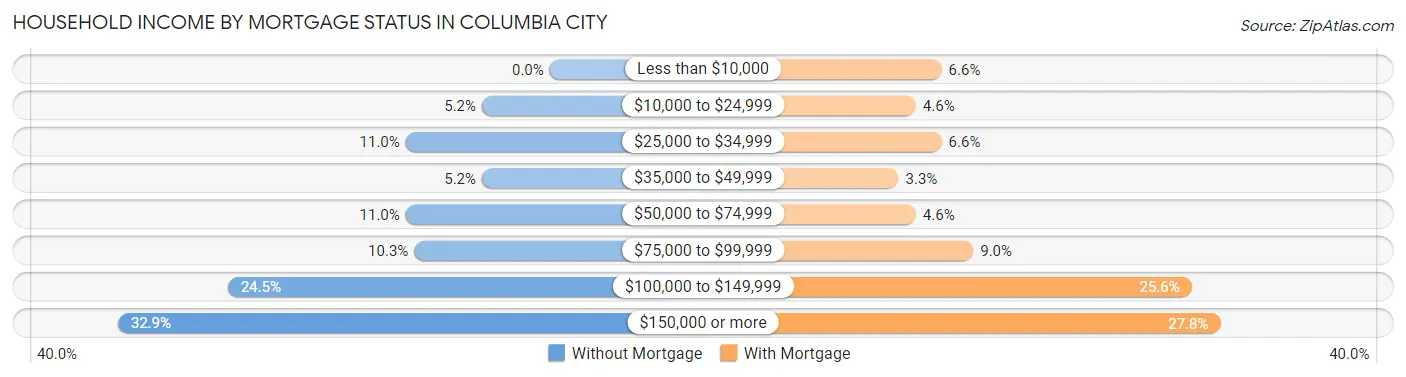
| Household Income | Without Mortgage | With Mortgage |
| Less than $10,000 | 0 (0.0%) | 30 (6.6%) |
| $10,000 to $24,999 | 8 (5.2%) | 21 (4.6%) |
| $25,000 to $34,999 | 17 (11.0%) | 30 (6.6%) |
| $35,000 to $49,999 | 8 (5.2%) | 15 (3.3%) |
| $50,000 to $74,999 | 17 (11.0%) | 21 (4.6%) |
| $75,000 to $99,999 | 16 (10.3%) | 41 (9.0%) |
| $100,000 to $149,999 | 38 (24.5%) | 117 (25.6%) |
| $150,000 or more | 51 (32.9%) | 127 (27.8%) |
| Total | 155 (100.0%) | 457 (100.0%) |
Property Value to Household Income Ratio in Columbia City
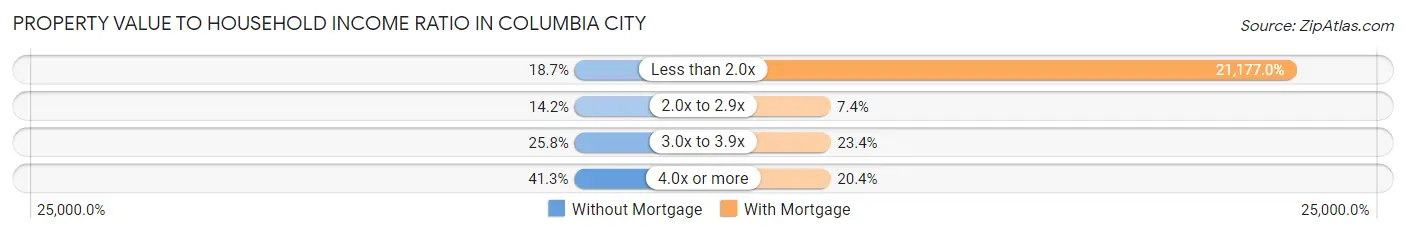
| Value-to-Income Ratio | Without Mortgage | With Mortgage |
| Less than 2.0x | 29 (18.7%) | 96,779 (21,177.0%) |
| 2.0x to 2.9x | 22 (14.2%) | 34 (7.4%) |
| 3.0x to 3.9x | 40 (25.8%) | 107 (23.4%) |
| 4.0x or more | 64 (41.3%) | 93 (20.3%) |
| Total | 155 (100.0%) | 457 (100.0%) |
Real Estate Taxes by Mortgage Status in Columbia City
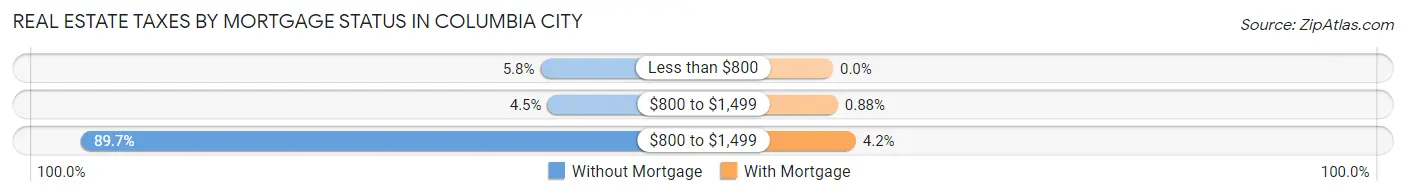
| Property Taxes | Without Mortgage | With Mortgage |
| Less than $800 | 9 (5.8%) | 0 (0.0%) |
| $800 to $1,499 | 7 (4.5%) | 4 (0.9%) |
| $800 to $1,499 | 139 (89.7%) | 19 (4.2%) |
| Total | 155 (100.0%) | 457 (100.0%) |
Health & Disability in Columbia City
Health Insurance Coverage by Age in Columbia City
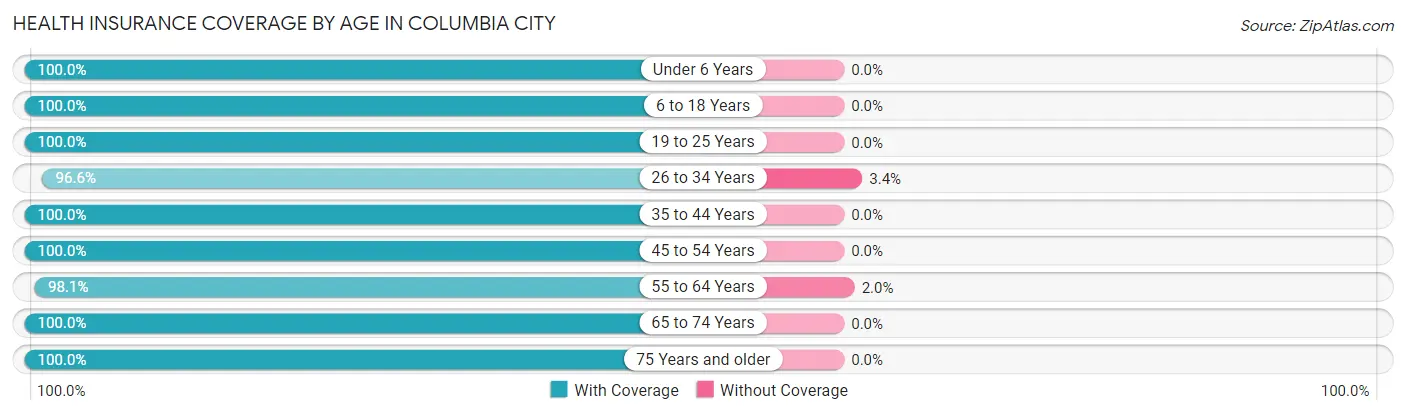
| Age Bracket | With Coverage | Without Coverage |
| Under 6 Years | 81 (100.0%) | 0 (0.0%) |
| 6 to 18 Years | 335 (100.0%) | 0 (0.0%) |
| 19 to 25 Years | 53 (100.0%) | 0 (0.0%) |
| 26 to 34 Years | 172 (96.6%) | 6 (3.4%) |
| 35 to 44 Years | 131 (100.0%) | 0 (0.0%) |
| 45 to 54 Years | 276 (100.0%) | 0 (0.0%) |
| 55 to 64 Years | 302 (98.1%) | 6 (1.9%) |
| 65 to 74 Years | 238 (100.0%) | 0 (0.0%) |
| 75 Years and older | 173 (100.0%) | 0 (0.0%) |
| Total | 1,761 (99.3%) | 12 (0.7%) |
Health Insurance Coverage by Citizenship Status in Columbia City
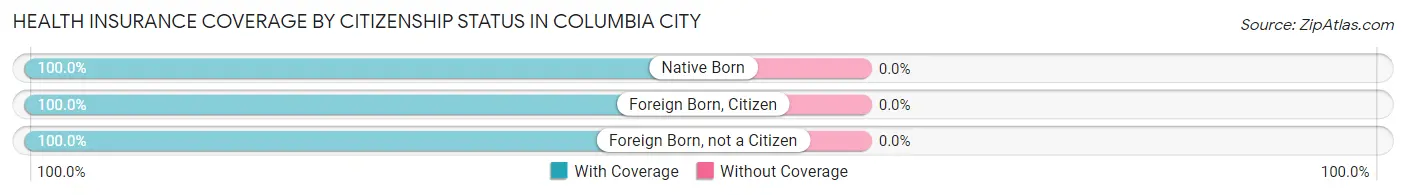
| Citizenship Status | With Coverage | Without Coverage |
| Native Born | 81 (100.0%) | 0 (0.0%) |
| Foreign Born, Citizen | 335 (100.0%) | 0 (0.0%) |
| Foreign Born, not a Citizen | 53 (100.0%) | 0 (0.0%) |
Health Insurance Coverage by Household Income in Columbia City
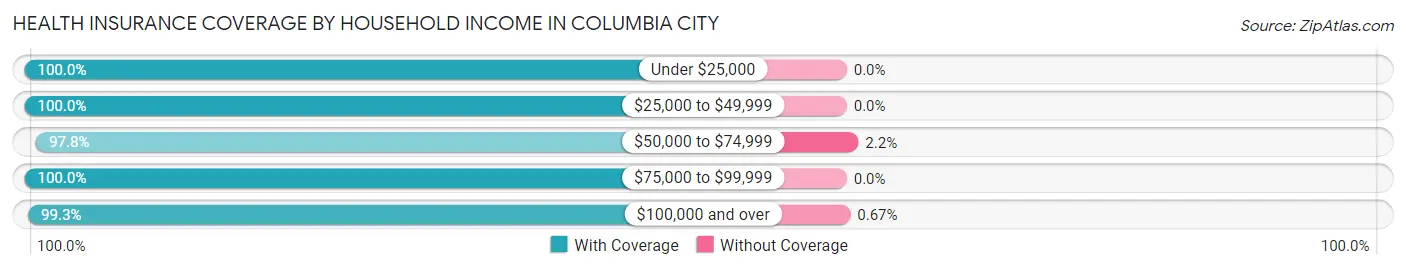
| Household Income | With Coverage | Without Coverage |
| Under $25,000 | 143 (100.0%) | 0 (0.0%) |
| $25,000 to $49,999 | 83 (100.0%) | 0 (0.0%) |
| $50,000 to $74,999 | 270 (97.8%) | 6 (2.2%) |
| $75,000 to $99,999 | 366 (100.0%) | 0 (0.0%) |
| $100,000 and over | 895 (99.3%) | 6 (0.7%) |
Public vs Private Health Insurance Coverage by Age in Columbia City
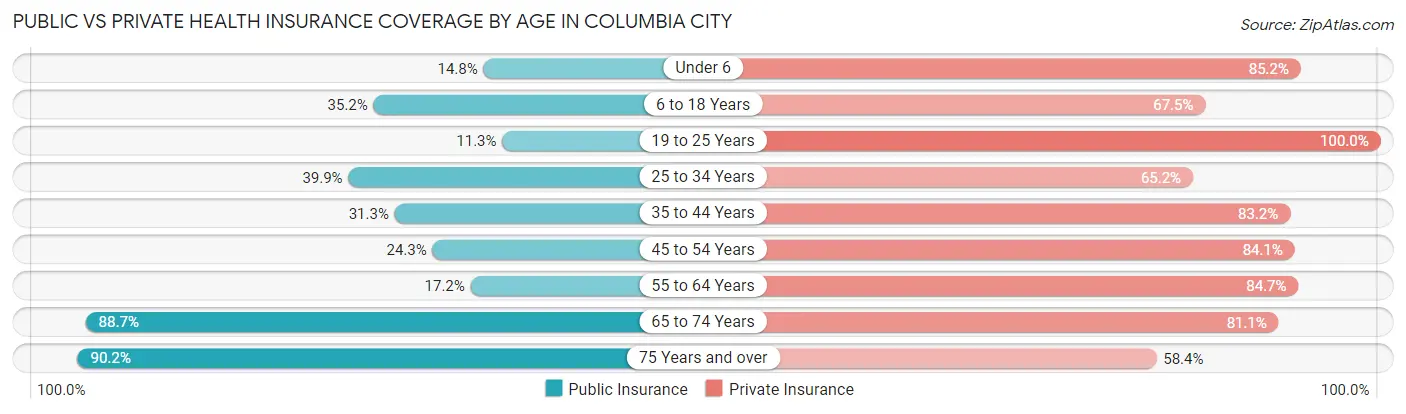
| Age Bracket | Public Insurance | Private Insurance |
| Under 6 | 12 (14.8%) | 69 (85.2%) |
| 6 to 18 Years | 118 (35.2%) | 226 (67.5%) |
| 19 to 25 Years | 6 (11.3%) | 53 (100.0%) |
| 25 to 34 Years | 71 (39.9%) | 116 (65.2%) |
| 35 to 44 Years | 41 (31.3%) | 109 (83.2%) |
| 45 to 54 Years | 67 (24.3%) | 232 (84.1%) |
| 55 to 64 Years | 53 (17.2%) | 261 (84.7%) |
| 65 to 74 Years | 211 (88.7%) | 193 (81.1%) |
| 75 Years and over | 156 (90.2%) | 101 (58.4%) |
| Total | 735 (41.5%) | 1,360 (76.7%) |
Disability Status by Sex by Age in Columbia City
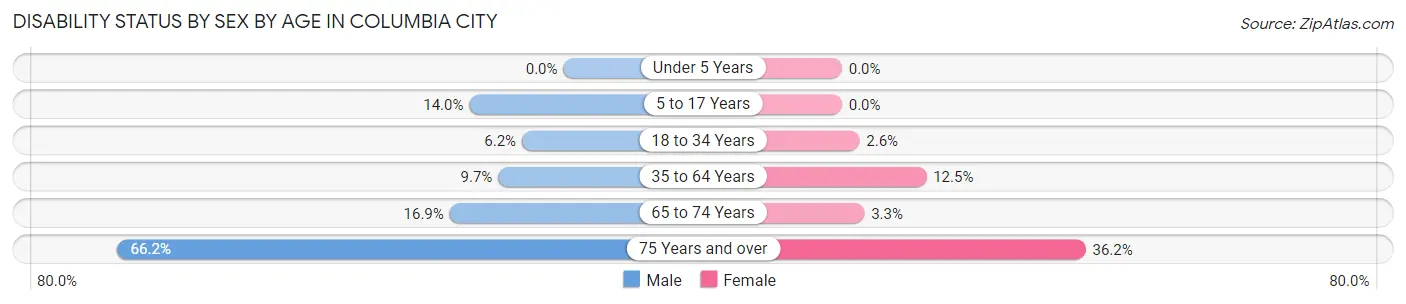
| Age Bracket | Male | Female |
| Under 5 Years | 0 (0.0%) | 0 (0.0%) |
| 5 to 17 Years | 25 (14.0%) | 0 (0.0%) |
| 18 to 34 Years | 8 (6.1%) | 3 (2.6%) |
| 35 to 64 Years | 36 (9.7%) | 43 (12.5%) |
| 65 to 74 Years | 25 (16.9%) | 3 (3.3%) |
| 75 Years and over | 45 (66.2%) | 38 (36.2%) |
Disability Class by Sex by Age in Columbia City
Disability Class: Hearing Difficulty
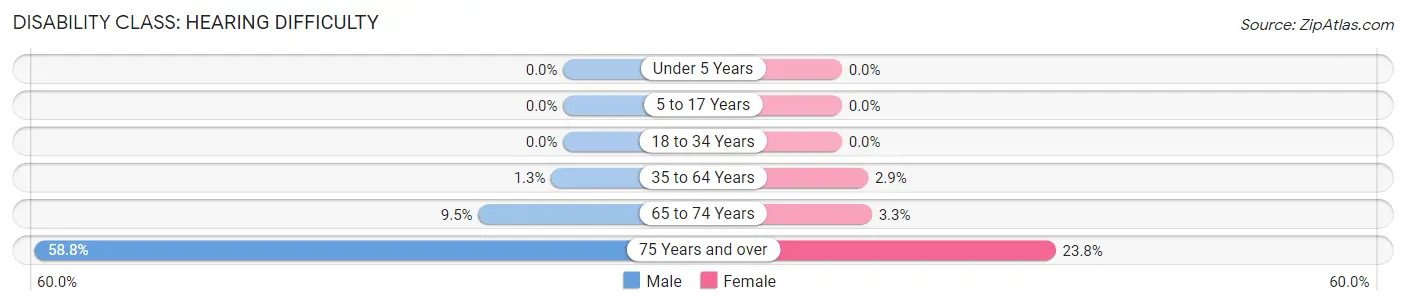
| Age Bracket | Male | Female |
| Under 5 Years | 0 (0.0%) | 0 (0.0%) |
| 5 to 17 Years | 0 (0.0%) | 0 (0.0%) |
| 18 to 34 Years | 0 (0.0%) | 0 (0.0%) |
| 35 to 64 Years | 5 (1.3%) | 10 (2.9%) |
| 65 to 74 Years | 14 (9.5%) | 3 (3.3%) |
| 75 Years and over | 40 (58.8%) | 25 (23.8%) |
Disability Class: Vision Difficulty
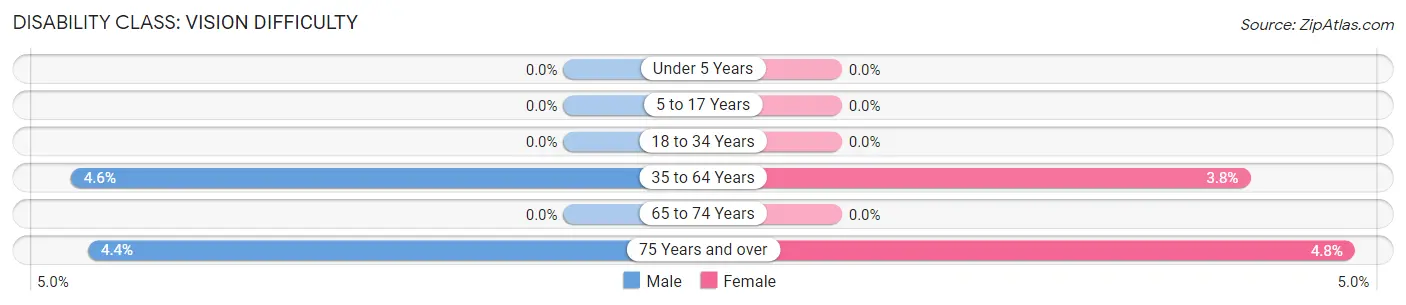
| Age Bracket | Male | Female |
| Under 5 Years | 0 (0.0%) | 0 (0.0%) |
| 5 to 17 Years | 0 (0.0%) | 0 (0.0%) |
| 18 to 34 Years | 0 (0.0%) | 0 (0.0%) |
| 35 to 64 Years | 17 (4.6%) | 13 (3.8%) |
| 65 to 74 Years | 0 (0.0%) | 0 (0.0%) |
| 75 Years and over | 3 (4.4%) | 5 (4.8%) |
Disability Class: Cognitive Difficulty
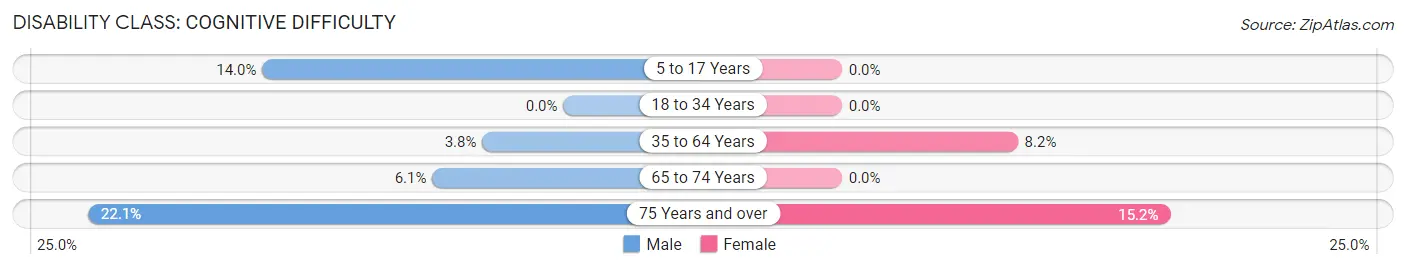
| Age Bracket | Male | Female |
| 5 to 17 Years | 25 (14.0%) | 0 (0.0%) |
| 18 to 34 Years | 0 (0.0%) | 0 (0.0%) |
| 35 to 64 Years | 14 (3.8%) | 28 (8.2%) |
| 65 to 74 Years | 9 (6.1%) | 0 (0.0%) |
| 75 Years and over | 15 (22.1%) | 16 (15.2%) |
Disability Class: Ambulatory Difficulty
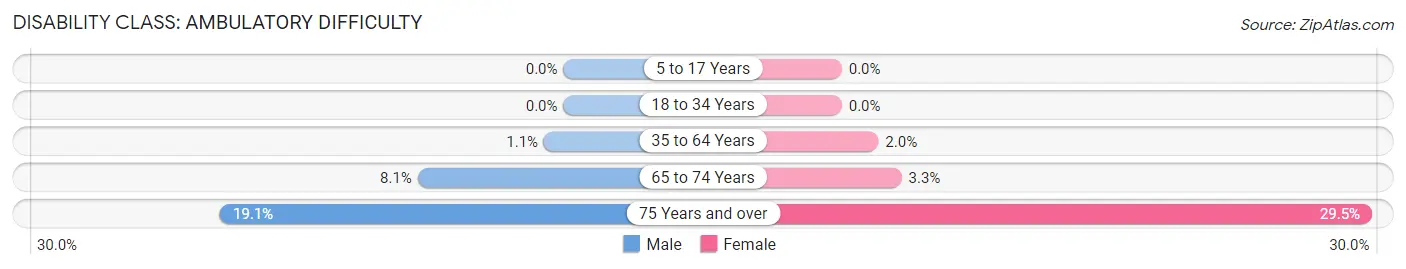
| Age Bracket | Male | Female |
| 5 to 17 Years | 0 (0.0%) | 0 (0.0%) |
| 18 to 34 Years | 0 (0.0%) | 0 (0.0%) |
| 35 to 64 Years | 4 (1.1%) | 7 (2.0%) |
| 65 to 74 Years | 12 (8.1%) | 3 (3.3%) |
| 75 Years and over | 13 (19.1%) | 31 (29.5%) |
Disability Class: Self-Care Difficulty
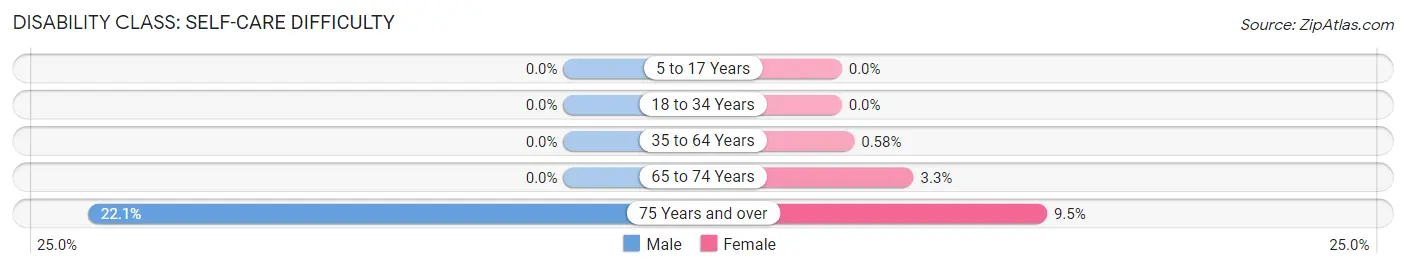
| Age Bracket | Male | Female |
| 5 to 17 Years | 0 (0.0%) | 0 (0.0%) |
| 18 to 34 Years | 0 (0.0%) | 0 (0.0%) |
| 35 to 64 Years | 0 (0.0%) | 2 (0.6%) |
| 65 to 74 Years | 0 (0.0%) | 3 (3.3%) |
| 75 Years and over | 15 (22.1%) | 10 (9.5%) |
Technology Access in Columbia City
Computing Device Access in Columbia City
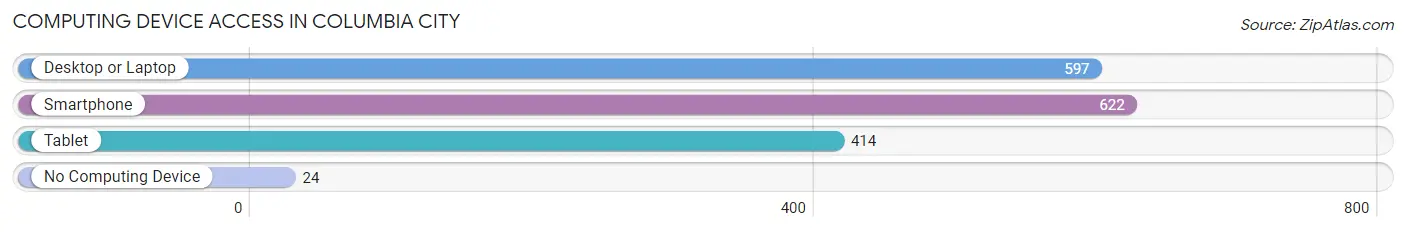
| Device Type | # Households | % Households |
| Desktop or Laptop | 597 | 86.5% |
| Smartphone | 622 | 90.1% |
| Tablet | 414 | 60.0% |
| No Computing Device | 24 | 3.5% |
| Total | 690 | 100.0% |
Internet Access in Columbia City
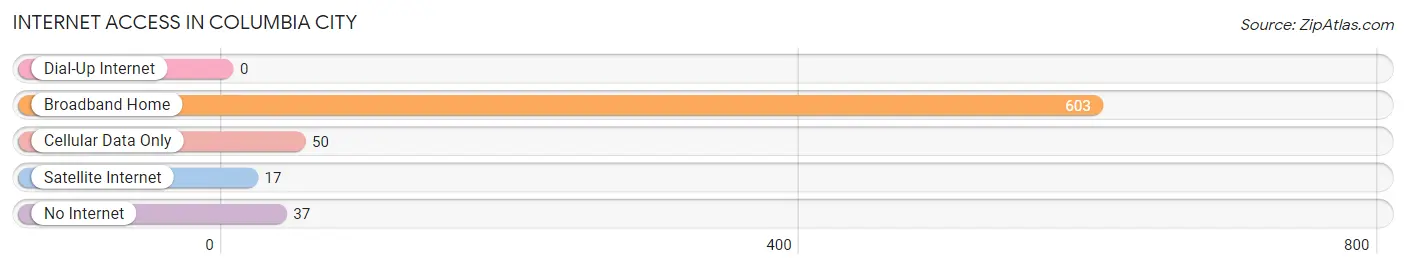
| Internet Type | # Households | % Households |
| Dial-Up Internet | 0 | 0.0% |
| Broadband Home | 603 | 87.4% |
| Cellular Data Only | 50 | 7.2% |
| Satellite Internet | 17 | 2.5% |
| No Internet | 37 | 5.4% |
| Total | 690 | 100.0% |
Columbia City Summary
Columbia City is a small city located in the state of Oregon, United States. It is situated in Columbia County, and is part of the Portland metropolitan area. The city has a population of approximately 4,000 people, and is located on the banks of the Columbia River.
Geography
Columbia City is located in the northwest corner of Oregon, on the banks of the Columbia River. The city is situated in the foothills of the Cascade Mountains, and is surrounded by lush forests and rolling hills. The city is located approximately 25 miles east of Portland, and is part of the Portland metropolitan area. The city is located at an elevation of approximately 200 feet above sea level.
History
Columbia City was founded in 1845 by settlers from the Oregon Trail. The city was originally known as Columbia City Station, and was a stop on the Oregon Trail. The city was incorporated in 1851, and was named after the Columbia River. The city was a major port for the lumber industry, and was also a major hub for the railroad industry.
In the late 19th century, the city was a major center for the fishing industry, and was also home to several canneries. The city was also home to several sawmills, and was a major center for the timber industry. The city was also home to several shipyards, and was a major center for the shipbuilding industry.
Economy
The economy of Columbia City is largely based on the timber industry. The city is home to several sawmills, and is a major center for the timber industry. The city is also home to several shipyards, and is a major center for the shipbuilding industry. The city is also home to several canneries, and is a major center for the fishing industry.
The city is also home to several manufacturing companies, and is a major center for the manufacturing industry. The city is also home to several retail stores, and is a major center for the retail industry. The city is also home to several restaurants, and is a major center for the restaurant industry.
Demographics
As of the 2010 census, the population of Columbia City was 4,000 people. The racial makeup of the city was 94.3% White, 0.7% African American, 0.3% Native American, 0.7% Asian, 0.1% Pacific Islander, 0.7% from other races, and 2.7% from two or more races. The median household income in the city was $45,000, and the median family income was $50,000.
Conclusion
Columbia City is a small city located in the state of Oregon, United States. It is situated in Columbia County, and is part of the Portland metropolitan area. The city has a population of approximately 4,000 people, and is located on the banks of the Columbia River. The economy of Columbia City is largely based on the timber industry, and the city is also home to several manufacturing companies, retail stores, and restaurants. The racial makeup of the city is 94.3% White, 0.7% African American, 0.3% Native American, 0.7% Asian, 0.1% Pacific Islander, 0.7% from other races, and 2.7% from two or more races. The median household income in the city was $45,000, and the median family income was $50,000.
Common Questions
What is Per Capita Income in Columbia City?
Per Capita income in Columbia City is $41,710.
What is the Median Family Income in Columbia City?
Median Family Income in Columbia City is $106,518.
What is the Median Household income in Columbia City?
Median Household Income in Columbia City is $96,379.
What is Income or Wage Gap in Columbia City?
Income or Wage Gap in Columbia City is 38.8%.
Women in Columbia City earn 61.2 cents for every dollar earned by a man.
What is Family Income Deficit in Columbia City?
Family Income Deficit in Columbia City is $10,139.
Families that are below poverty line in Columbia City earn $10,139 less on average than the poverty threshold level.
What is Inequality or Gini Index in Columbia City?
Inequality or Gini Index in Columbia City is 0.33.
What is the Total Population of Columbia City?
Total Population of Columbia City is 1,773.
What is the Total Male Population of Columbia City?
Total Male Population of Columbia City is 931.
What is the Total Female Population of Columbia City?
Total Female Population of Columbia City is 842.
What is the Ratio of Males per 100 Females in Columbia City?
There are 110.57 Males per 100 Females in Columbia City.
What is the Ratio of Females per 100 Males in Columbia City?
There are 90.44 Females per 100 Males in Columbia City.
What is the Median Population Age in Columbia City?
Median Population Age in Columbia City is 47.9 Years.
What is the Average Family Size in Columbia City
Average Family Size in Columbia City is 3.1 People.
What is the Average Household Size in Columbia City
Average Household Size in Columbia City is 2.6 People.
How Large is the Labor Force in Columbia City?
There are 809 People in the Labor Forcein in Columbia City.
What is the Percentage of People in the Labor Force in Columbia City?
56.7% of People are in the Labor Force in Columbia City.
What is the Unemployment Rate in Columbia City?
Unemployment Rate in Columbia City is 2.8%.