Carlton, OR Map & Demographics
Carlton Map
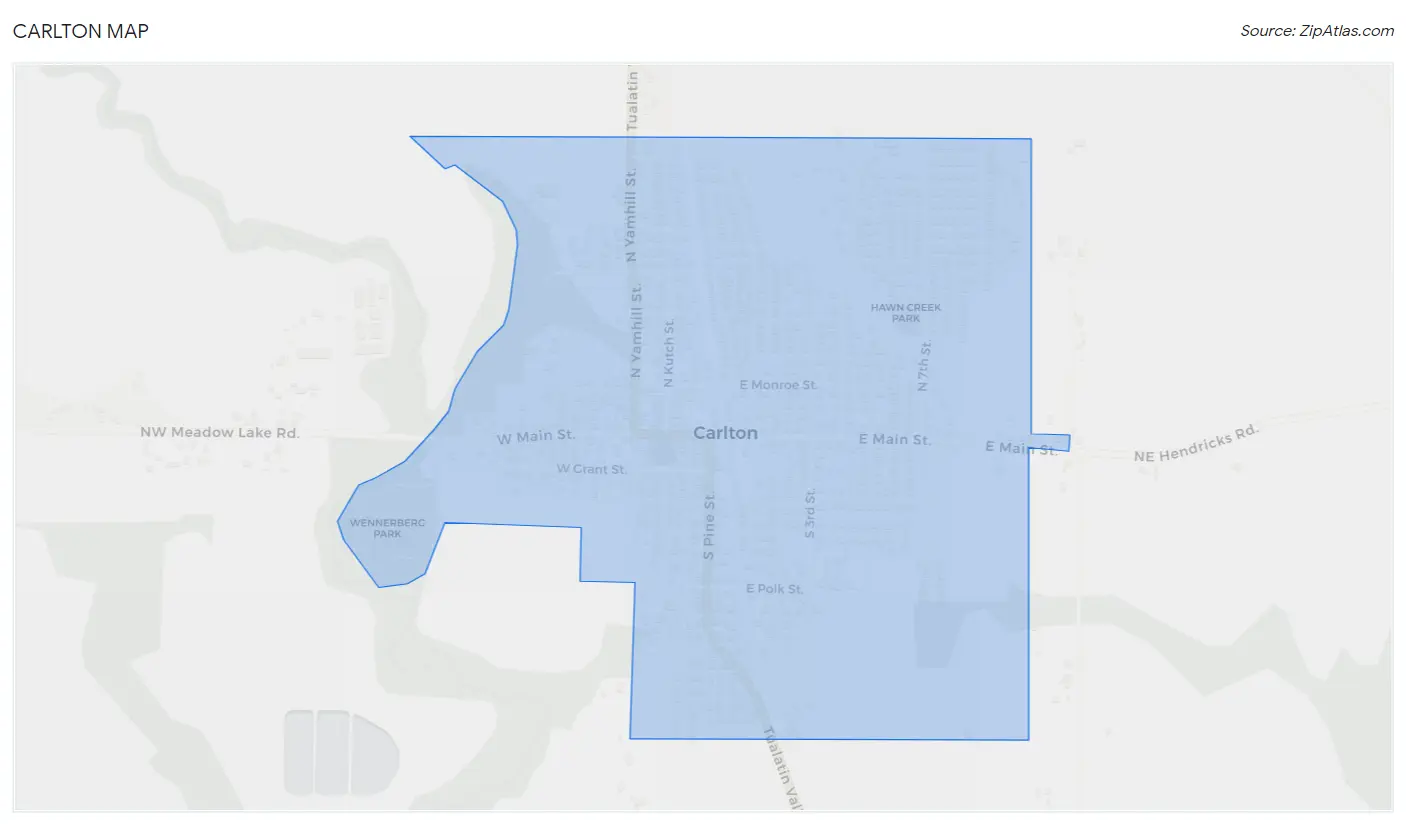
Carlton Overview
$34,957
PER CAPITA INCOME
$92,292
AVG FAMILY INCOME
$92,500
AVG HOUSEHOLD INCOME
26.4%
WAGE / INCOME GAP [ % ]
73.6¢/ $1
WAGE / INCOME GAP [ $ ]
0.35
INEQUALITY / GINI INDEX
2,339
TOTAL POPULATION
1,141
MALE POPULATION
1,198
FEMALE POPULATION
95.24
MALES / 100 FEMALES
105.00
FEMALES / 100 MALES
36.9
MEDIAN AGE
3.4
AVG FAMILY SIZE
3.0
AVG HOUSEHOLD SIZE
1,172
LABOR FORCE [ PEOPLE ]
65.2%
PERCENT IN LABOR FORCE
5.2%
UNEMPLOYMENT RATE
Carlton Zip Codes
Carlton Area Codes
Income in Carlton
Income Overview in Carlton
Per Capita Income in Carlton is $34,957, while median incomes of families and households are $92,292 and $92,500 respectively.
| Characteristic | Number | Measure |
| Per Capita Income | 2,339 | $34,957 |
| Median Family Income | 605 | $92,292 |
| Mean Family Income | 605 | $99,893 |
| Median Household Income | 780 | $92,500 |
| Mean Household Income | 780 | $100,837 |
| Income Deficit | 605 | $0 |
| Wage / Income Gap (%) | 2,339 | 26.40% |
| Wage / Income Gap ($) | 2,339 | 73.60¢ per $1 |
| Gini / Inequality Index | 2,339 | 0.35 |
Earnings by Sex in Carlton
Average Earnings in Carlton are $41,415, $48,889 for men and $35,982 for women, a difference of 26.4%.
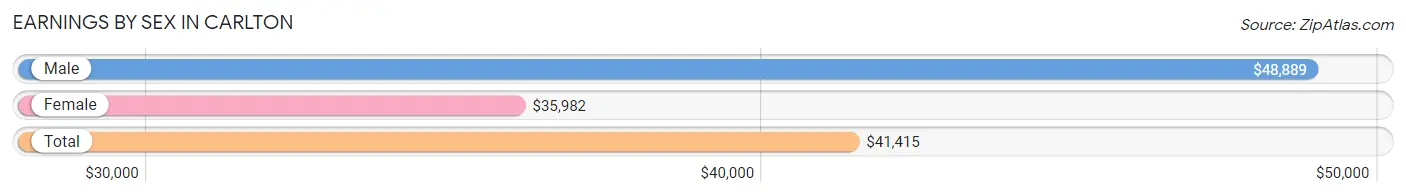
| Sex | Number | Average Earnings |
| Male | 672 (55.7%) | $48,889 |
| Female | 535 (44.3%) | $35,982 |
| Total | 1,207 (100.0%) | $41,415 |
Earnings by Sex by Income Bracket in Carlton
The most common earnings brackets in Carlton are $55,000 to $64,999 for men (104 | 15.5%) and $50,000 to $54,999 for women (52 | 9.7%).
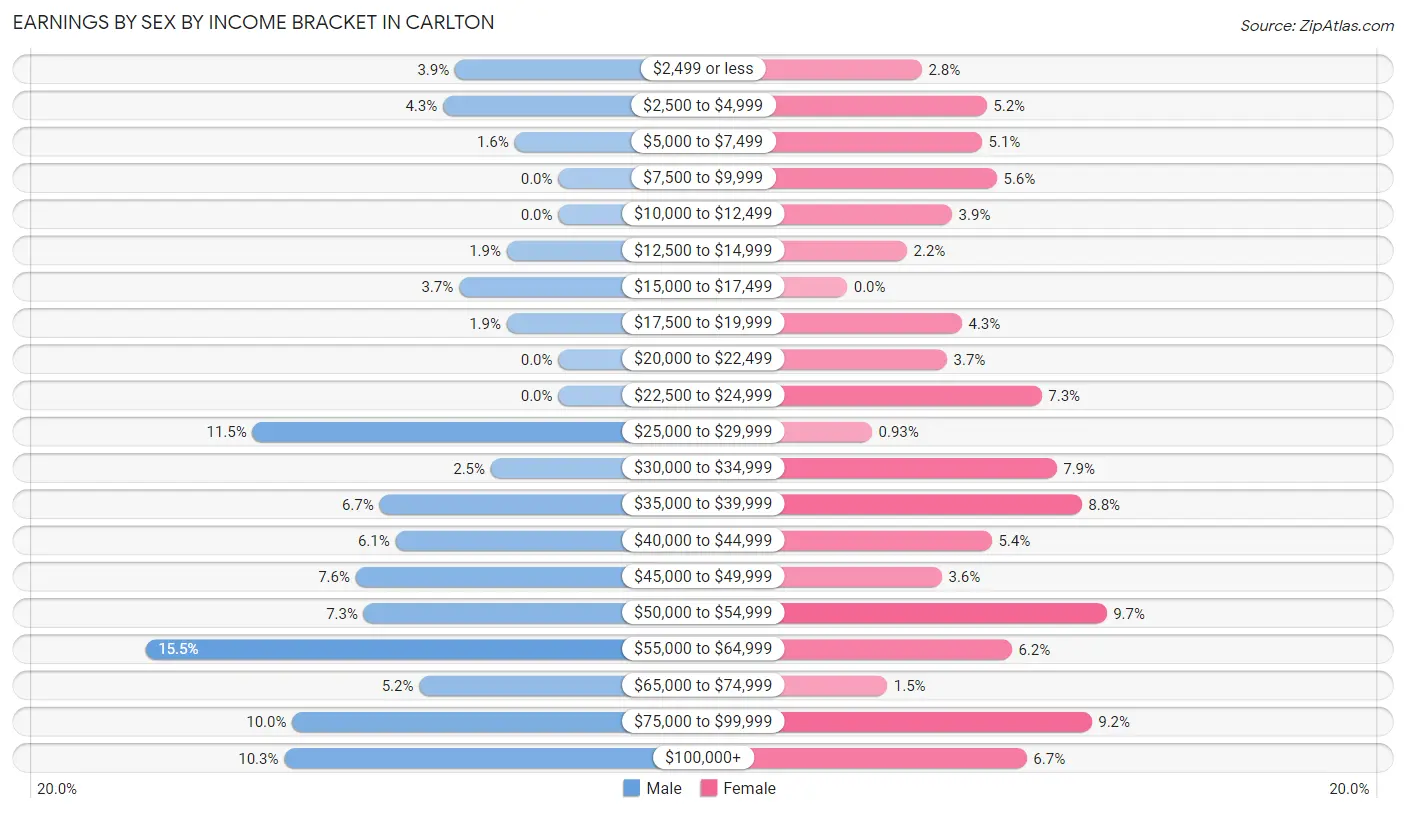
| Income | Male | Female |
| $2,499 or less | 26 (3.9%) | 15 (2.8%) |
| $2,500 to $4,999 | 29 (4.3%) | 28 (5.2%) |
| $5,000 to $7,499 | 11 (1.6%) | 27 (5.1%) |
| $7,500 to $9,999 | 0 (0.0%) | 30 (5.6%) |
| $10,000 to $12,499 | 0 (0.0%) | 21 (3.9%) |
| $12,500 to $14,999 | 13 (1.9%) | 12 (2.2%) |
| $15,000 to $17,499 | 25 (3.7%) | 0 (0.0%) |
| $17,500 to $19,999 | 13 (1.9%) | 23 (4.3%) |
| $20,000 to $22,499 | 0 (0.0%) | 20 (3.7%) |
| $22,500 to $24,999 | 0 (0.0%) | 39 (7.3%) |
| $25,000 to $29,999 | 77 (11.5%) | 5 (0.9%) |
| $30,000 to $34,999 | 17 (2.5%) | 42 (7.9%) |
| $35,000 to $39,999 | 45 (6.7%) | 47 (8.8%) |
| $40,000 to $44,999 | 41 (6.1%) | 29 (5.4%) |
| $45,000 to $49,999 | 51 (7.6%) | 19 (3.5%) |
| $50,000 to $54,999 | 49 (7.3%) | 52 (9.7%) |
| $55,000 to $64,999 | 104 (15.5%) | 33 (6.2%) |
| $65,000 to $74,999 | 35 (5.2%) | 8 (1.5%) |
| $75,000 to $99,999 | 67 (10.0%) | 49 (9.2%) |
| $100,000+ | 69 (10.3%) | 36 (6.7%) |
| Total | 672 (100.0%) | 535 (100.0%) |
Earnings by Sex by Educational Attainment in Carlton
Average earnings in Carlton are $54,209 for men and $40,972 for women, a difference of 24.4%. Men with an educational attainment of graduate degree enjoy the highest average annual earnings of $141,667, while those with high school diploma education earn the least with $40,875. Women with an educational attainment of graduate degree earn the most with the average annual earnings of $79,500, while those with high school diploma education have the smallest earnings of $29,167.
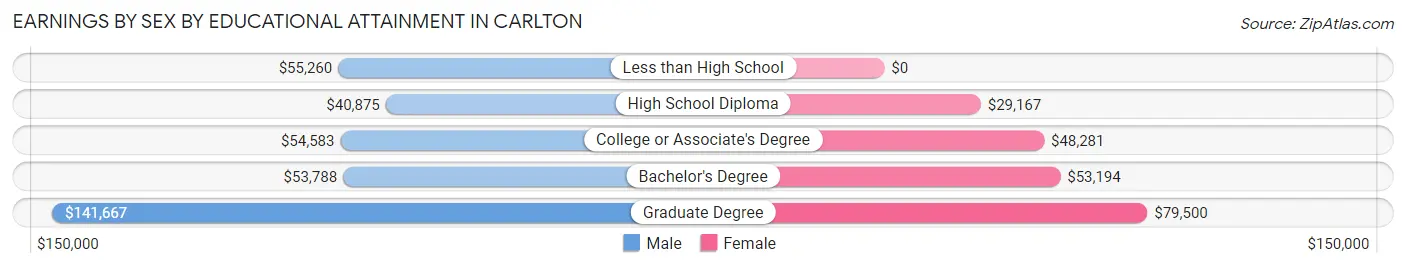
| Educational Attainment | Male Income | Female Income |
| Less than High School | $55,260 | $0 |
| High School Diploma | $40,875 | $29,167 |
| College or Associate's Degree | $54,583 | $48,281 |
| Bachelor's Degree | $53,788 | $53,194 |
| Graduate Degree | $141,667 | $79,500 |
| Total | $54,209 | $40,972 |
Family Income in Carlton
Family Income Brackets in Carlton
According to the Carlton family income data, there are 167 families falling into the $100,000 to $149,999 income range, which is the most common income bracket and makes up 27.6% of all families. Conversely, the less than $10,000 income bracket is the least frequent group with only 6 families (1.0%) belonging to this category.
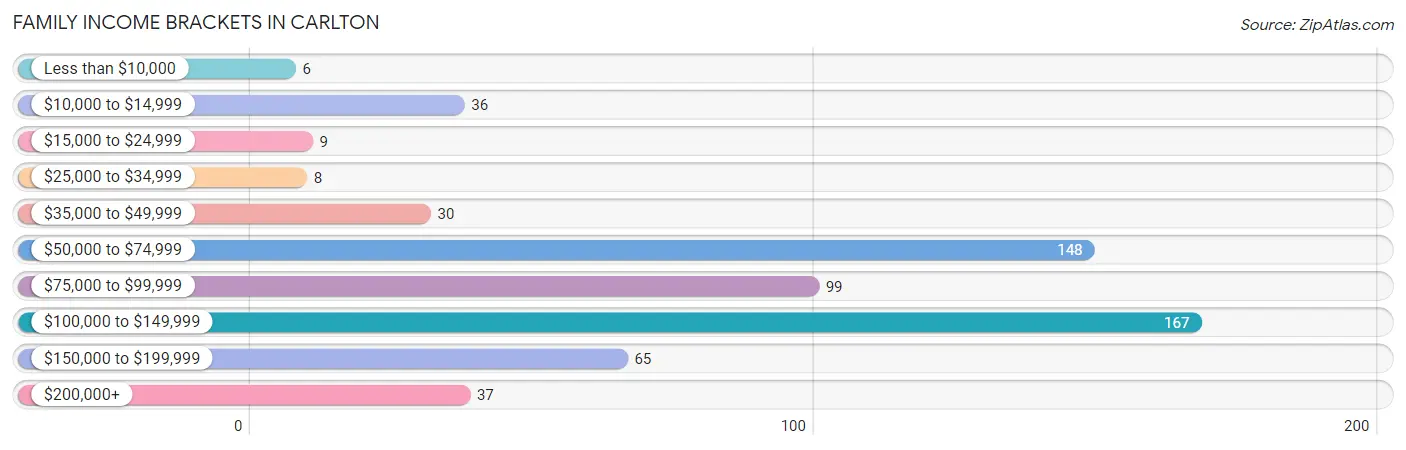
| Income Bracket | # Families | % Families |
| Less than $10,000 | 6 | 1.0% |
| $10,000 to $14,999 | 36 | 6.0% |
| $15,000 to $24,999 | 9 | 1.5% |
| $25,000 to $34,999 | 8 | 1.3% |
| $35,000 to $49,999 | 30 | 5.0% |
| $50,000 to $74,999 | 148 | 24.5% |
| $75,000 to $99,999 | 99 | 16.4% |
| $100,000 to $149,999 | 167 | 27.6% |
| $150,000 to $199,999 | 65 | 10.7% |
| $200,000+ | 37 | 6.1% |
Family Income by Famaliy Size in Carlton
5-person families (59 | 9.8%) account for the highest median family income in Carlton with $140,781 per family, while 2-person families (222 | 36.7%) have the highest median income of $49,318 per family member.
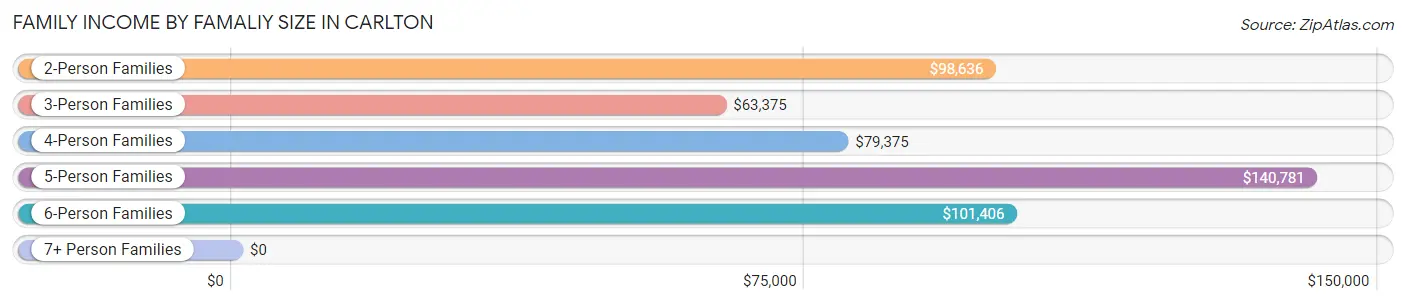
| Income Bracket | # Families | Median Income |
| 2-Person Families | 222 (36.7%) | $98,636 |
| 3-Person Families | 143 (23.6%) | $63,375 |
| 4-Person Families | 147 (24.3%) | $79,375 |
| 5-Person Families | 59 (9.8%) | $140,781 |
| 6-Person Families | 27 (4.5%) | $101,406 |
| 7+ Person Families | 7 (1.2%) | $0 |
| Total | 605 (100.0%) | $92,292 |
Family Income by Number of Earners in Carlton
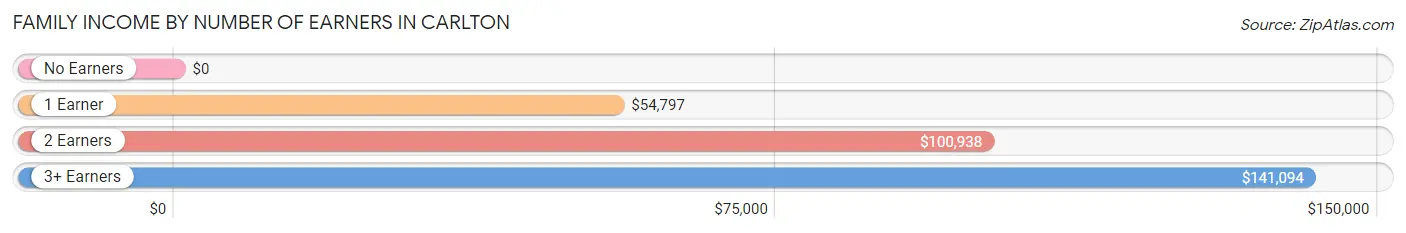
| Number of Earners | # Families | Median Income |
| No Earners | 103 (17.0%) | $0 |
| 1 Earner | 157 (26.0%) | $54,797 |
| 2 Earners | 256 (42.3%) | $100,938 |
| 3+ Earners | 89 (14.7%) | $141,094 |
| Total | 605 (100.0%) | $92,292 |
Household Income in Carlton
Household Income Brackets in Carlton
With 206 households falling in the category, the $100,000 to $149,999 income range is the most frequent in Carlton, accounting for 26.4% of all households. In contrast, only 21 households (2.7%) fall into the $25,000 to $34,999 income bracket, making it the least populous group.
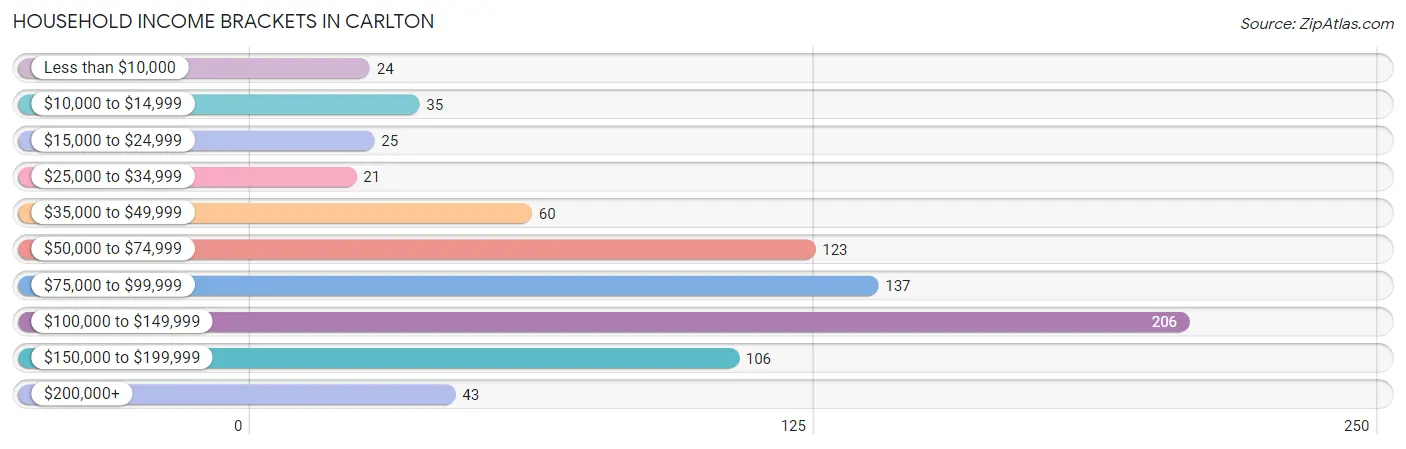
| Income Bracket | # Households | % Households |
| Less than $10,000 | 24 | 3.1% |
| $10,000 to $14,999 | 35 | 4.5% |
| $15,000 to $24,999 | 25 | 3.2% |
| $25,000 to $34,999 | 21 | 2.7% |
| $35,000 to $49,999 | 60 | 7.7% |
| $50,000 to $74,999 | 123 | 15.8% |
| $75,000 to $99,999 | 137 | 17.6% |
| $100,000 to $149,999 | 206 | 26.4% |
| $150,000 to $199,999 | 106 | 13.6% |
| $200,000+ | 43 | 5.5% |
Household Income by Householder Age in Carlton
The median household income in Carlton is $92,500, with the highest median household income of $101,979 found in the 45 to 64 years age bracket for the primary householder. A total of 345 households (44.2%) fall into this category. Meanwhile, the 15 to 24 years age bracket for the primary householder has the lowest median household income of $0, with 21 households (2.7%) in this group.
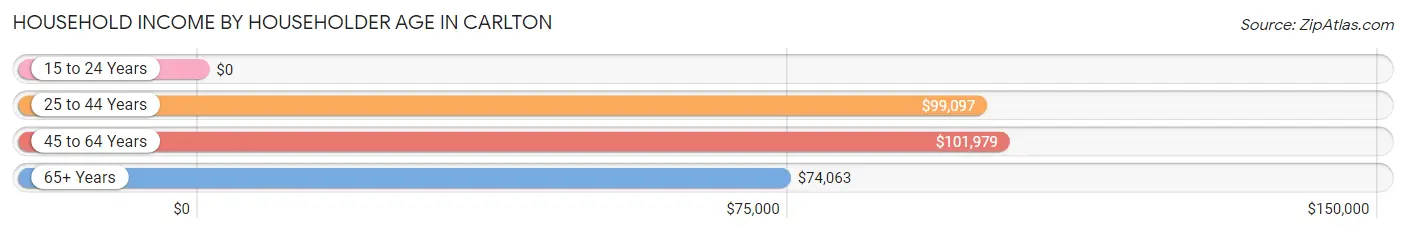
| Income Bracket | # Households | Median Income |
| 15 to 24 Years | 21 (2.7%) | $0 |
| 25 to 44 Years | 209 (26.8%) | $99,097 |
| 45 to 64 Years | 345 (44.2%) | $101,979 |
| 65+ Years | 205 (26.3%) | $74,063 |
| Total | 780 (100.0%) | $92,500 |
Poverty in Carlton
Income Below Poverty by Sex and Age in Carlton
With 7.7% poverty level for males and 7.1% for females among the residents of Carlton, under 5 year old males and 12 to 14 year old females are the most vulnerable to poverty, with 11 males (25.6%) and 25 females (32.9%) in their respective age groups living below the poverty level.
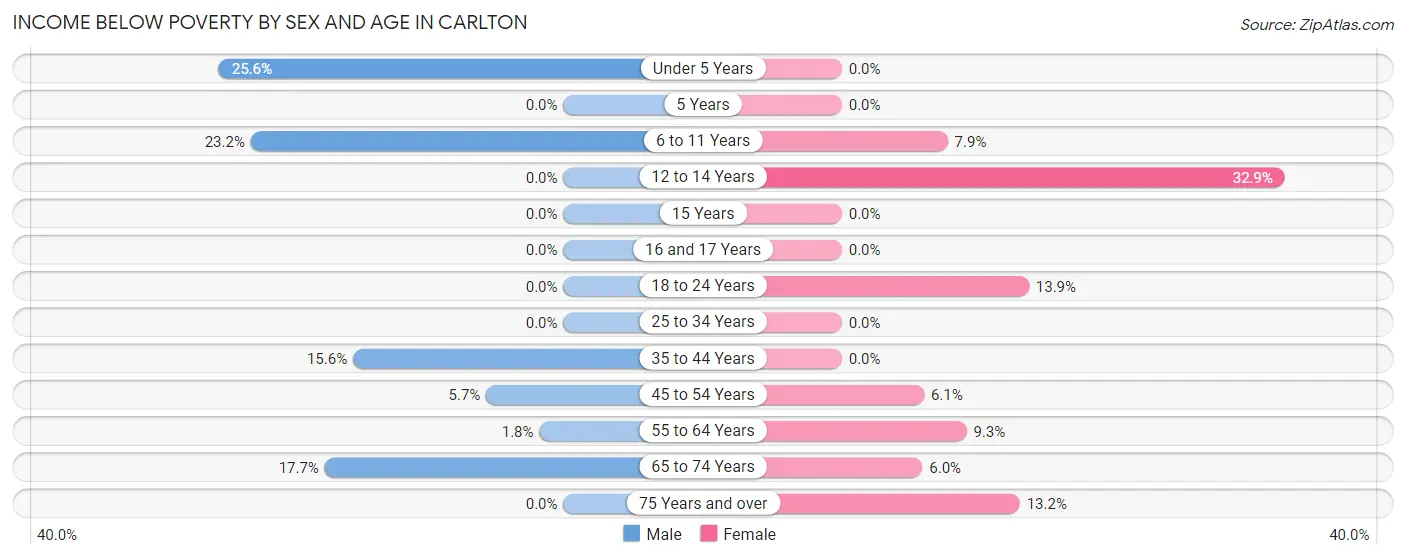
| Age Bracket | Male | Female |
| Under 5 Years | 11 (25.6%) | 0 (0.0%) |
| 5 Years | 0 (0.0%) | 0 (0.0%) |
| 6 to 11 Years | 26 (23.2%) | 11 (7.9%) |
| 12 to 14 Years | 0 (0.0%) | 25 (32.9%) |
| 15 Years | 0 (0.0%) | 0 (0.0%) |
| 16 and 17 Years | 0 (0.0%) | 0 (0.0%) |
| 18 to 24 Years | 0 (0.0%) | 15 (13.9%) |
| 25 to 34 Years | 0 (0.0%) | 0 (0.0%) |
| 35 to 44 Years | 25 (15.6%) | 0 (0.0%) |
| 45 to 54 Years | 9 (5.7%) | 10 (6.1%) |
| 55 to 64 Years | 3 (1.8%) | 10 (9.3%) |
| 65 to 74 Years | 14 (17.7%) | 7 (6.0%) |
| 75 Years and over | 0 (0.0%) | 7 (13.2%) |
| Total | 88 (7.7%) | 85 (7.1%) |
Income Above Poverty by Sex and Age in Carlton
According to the poverty statistics in Carlton, males aged 5 years and females aged under 5 years are the age groups that are most secure financially, with 100.0% of males and 100.0% of females in these age groups living above the poverty line.
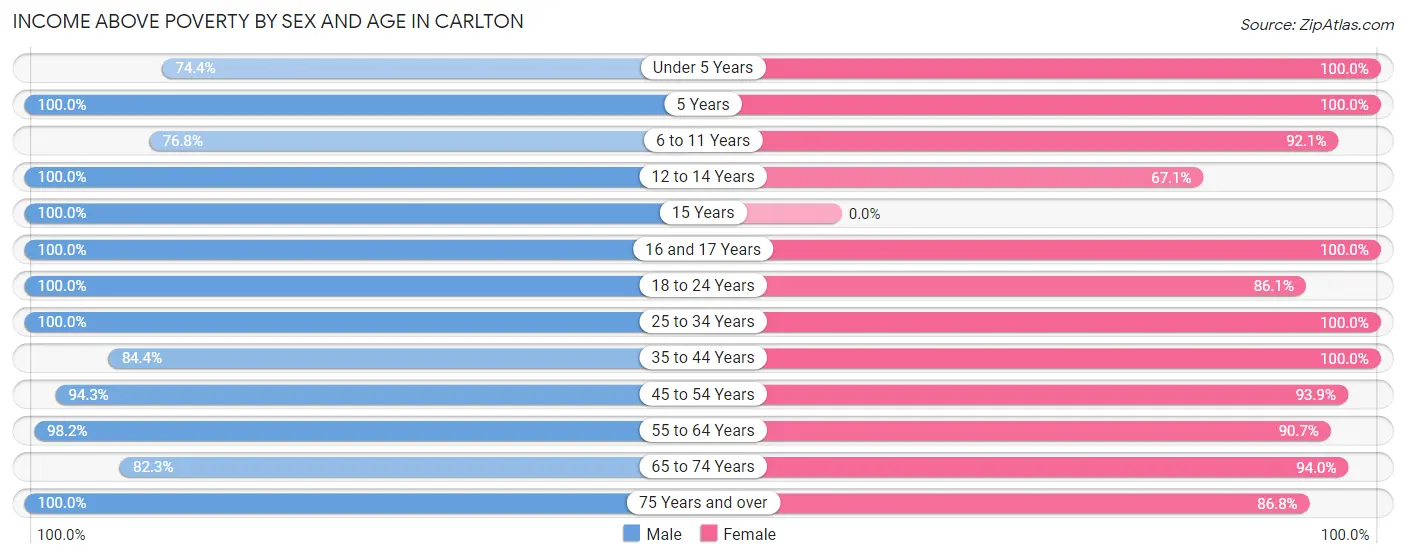
| Age Bracket | Male | Female |
| Under 5 Years | 32 (74.4%) | 95 (100.0%) |
| 5 Years | 10 (100.0%) | 6 (100.0%) |
| 6 to 11 Years | 86 (76.8%) | 129 (92.1%) |
| 12 to 14 Years | 49 (100.0%) | 51 (67.1%) |
| 15 Years | 10 (100.0%) | 0 (0.0%) |
| 16 and 17 Years | 16 (100.0%) | 44 (100.0%) |
| 18 to 24 Years | 125 (100.0%) | 93 (86.1%) |
| 25 to 34 Years | 145 (100.0%) | 118 (100.0%) |
| 35 to 44 Years | 135 (84.4%) | 169 (100.0%) |
| 45 to 54 Years | 148 (94.3%) | 154 (93.9%) |
| 55 to 64 Years | 166 (98.2%) | 98 (90.7%) |
| 65 to 74 Years | 65 (82.3%) | 110 (94.0%) |
| 75 Years and over | 66 (100.0%) | 46 (86.8%) |
| Total | 1,053 (92.3%) | 1,113 (92.9%) |
Income Below Poverty Among Married-Couple Families in Carlton
The poverty statistics for married-couple families in Carlton show that 3.4% or 15 of the total 440 families live below the poverty line. Families with no children have the highest poverty rate of 6.5%, comprising of 15 families. On the other hand, families with 1 or 2 children have the lowest poverty rate of 0.0%, which includes 0 families.
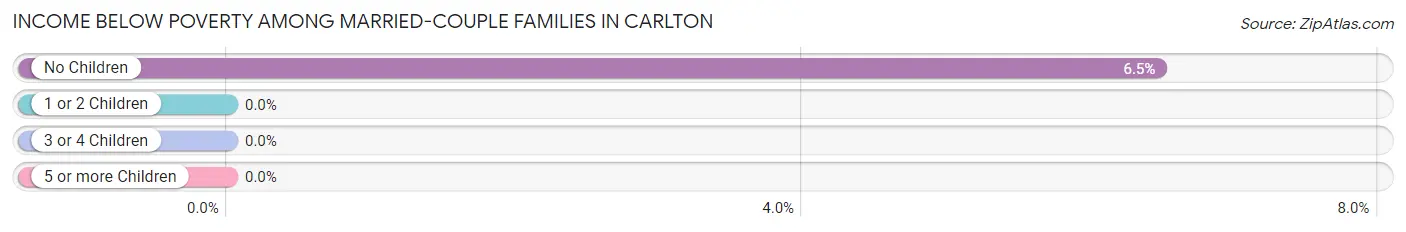
| Children | Above Poverty | Below Poverty |
| No Children | 217 (93.5%) | 15 (6.5%) |
| 1 or 2 Children | 169 (100.0%) | 0 (0.0%) |
| 3 or 4 Children | 39 (100.0%) | 0 (0.0%) |
| 5 or more Children | 0 (0.0%) | 0 (0.0%) |
| Total | 425 (96.6%) | 15 (3.4%) |
Income Below Poverty Among Single-Parent Households in Carlton
According to the poverty data in Carlton, 46.3% or 25 single-father households and 9.9% or 11 single-mother households are living below the poverty line. Among single-father households, those with 1 or 2 children have the highest poverty rate, with 25 households (65.8%) experiencing poverty. Likewise, among single-mother households, those with 1 or 2 children have the highest poverty rate, with 11 households (16.7%) falling below the poverty line.
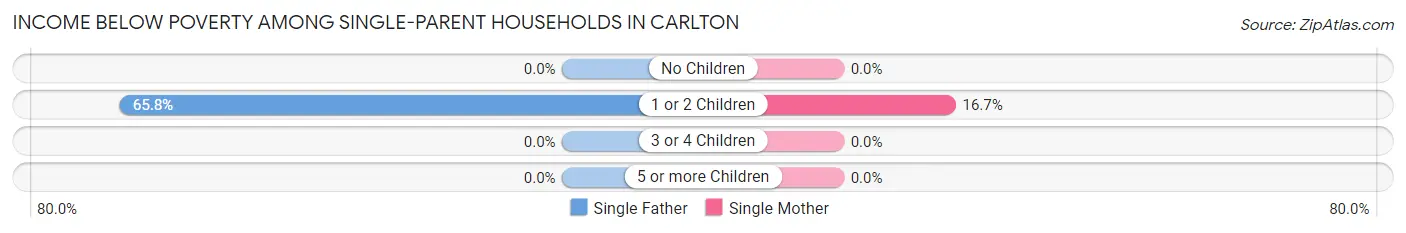
| Children | Single Father | Single Mother |
| No Children | 0 (0.0%) | 0 (0.0%) |
| 1 or 2 Children | 25 (65.8%) | 11 (16.7%) |
| 3 or 4 Children | 0 (0.0%) | 0 (0.0%) |
| 5 or more Children | 0 (0.0%) | 0 (0.0%) |
| Total | 25 (46.3%) | 11 (9.9%) |
Income Below Poverty Among Married-Couple vs Single-Parent Households in Carlton
The poverty data for Carlton shows that 15 of the married-couple family households (3.4%) and 36 of the single-parent households (21.8%) are living below the poverty level. Within the married-couple family households, those with no children have the highest poverty rate, with 15 households (6.5%) falling below the poverty line. Among the single-parent households, those with 1 or 2 children have the highest poverty rate, with 36 household (34.6%) living below poverty.
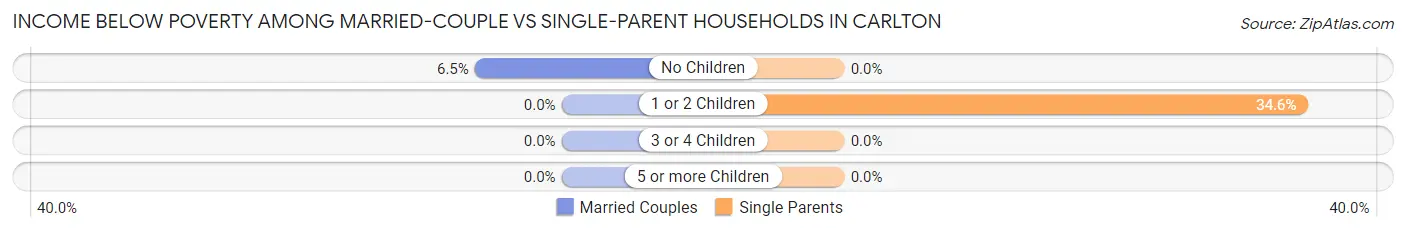
| Children | Married-Couple Families | Single-Parent Households |
| No Children | 15 (6.5%) | 0 (0.0%) |
| 1 or 2 Children | 0 (0.0%) | 36 (34.6%) |
| 3 or 4 Children | 0 (0.0%) | 0 (0.0%) |
| 5 or more Children | 0 (0.0%) | 0 (0.0%) |
| Total | 15 (3.4%) | 36 (21.8%) |
Race in Carlton
The most populous races in Carlton are White / Caucasian (1,803 | 77.1%), Hispanic or Latino (403 | 17.2%), and Two or more Races (260 | 11.1%).
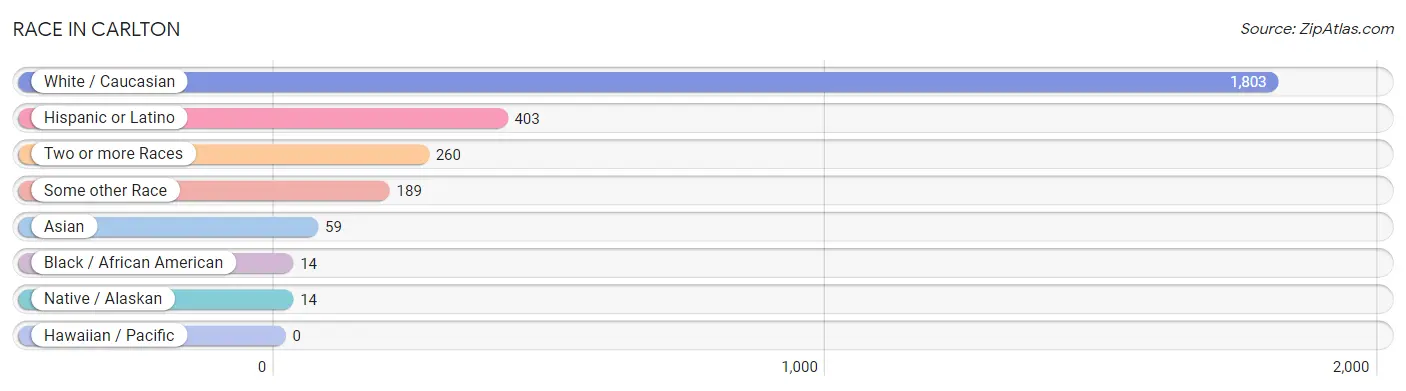
| Race | # Population | % Population |
| Asian | 59 | 2.5% |
| Black / African American | 14 | 0.6% |
| Hawaiian / Pacific | 0 | 0.0% |
| Hispanic or Latino | 403 | 17.2% |
| Native / Alaskan | 14 | 0.6% |
| White / Caucasian | 1,803 | 77.1% |
| Two or more Races | 260 | 11.1% |
| Some other Race | 189 | 8.1% |
| Total | 2,339 | 100.0% |
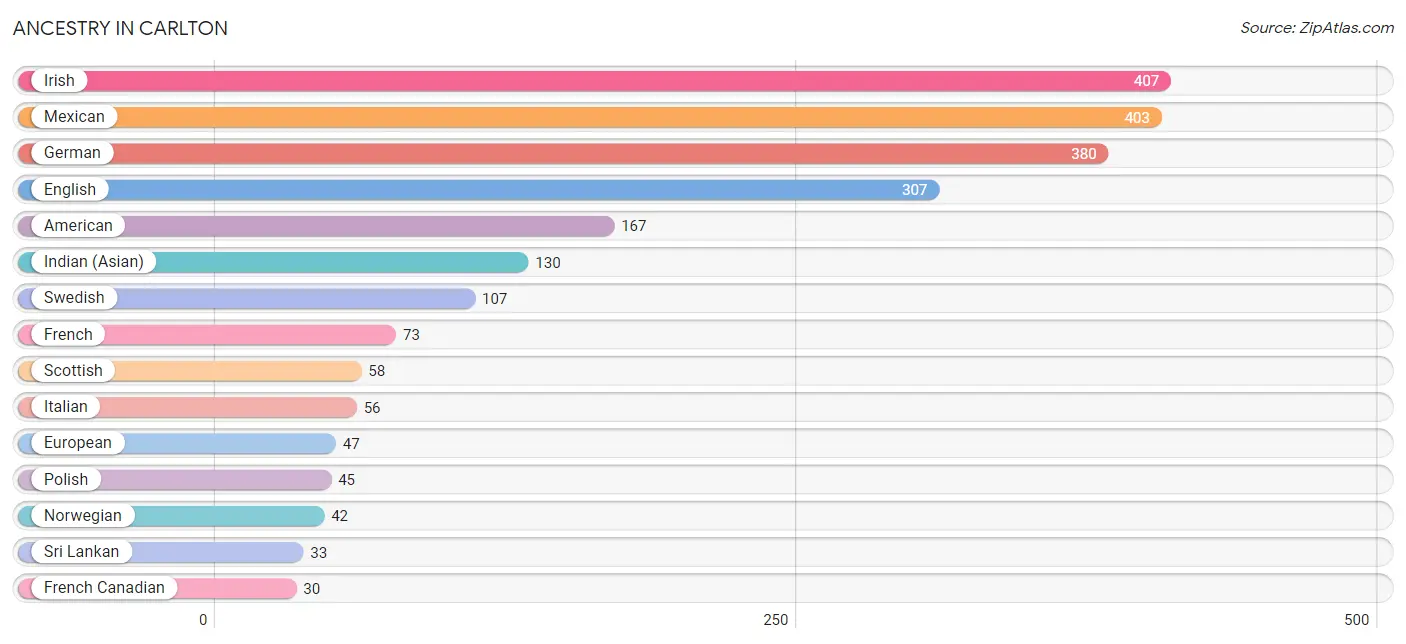
Ancestry in Carlton
The most populous ancestries reported in Carlton are Irish (407 | 17.4%), Mexican (403 | 17.2%), German (380 | 16.3%), English (307 | 13.1%), and American (167 | 7.1%), together accounting for 71.2% of all Carlton residents.
| Ancestry | # Population | % Population |
| American | 167 | 7.1% |
| Arab | 17 | 0.7% |
| Belgian | 7 | 0.3% |
| Bhutanese | 14 | 0.6% |
| British | 2 | 0.1% |
| Canadian | 3 | 0.1% |
| Cherokee | 4 | 0.2% |
| Cree | 3 | 0.1% |
| Dutch | 17 | 0.7% |
| Egyptian | 17 | 0.7% |
| English | 307 | 13.1% |
| Estonian | 6 | 0.3% |
| European | 47 | 2.0% |
| Finnish | 7 | 0.3% |
| French | 73 | 3.1% |
| French Canadian | 30 | 1.3% |
| German | 380 | 16.3% |
| Hungarian | 3 | 0.1% |
| Indian (Asian) | 130 | 5.6% |
| Irish | 407 | 17.4% |
| Iroquois | 1 | 0.0% |
| Italian | 56 | 2.4% |
| Mexican | 403 | 17.2% |
| Norwegian | 42 | 1.8% |
| Polish | 45 | 1.9% |
| Portuguese | 6 | 0.3% |
| Pueblo | 14 | 0.6% |
| Scandinavian | 26 | 1.1% |
| Scotch-Irish | 20 | 0.9% |
| Scottish | 58 | 2.5% |
| Slovak | 5 | 0.2% |
| Sri Lankan | 33 | 1.4% |
| Swedish | 107 | 4.6% |
| Swiss | 3 | 0.1% |
| Welsh | 6 | 0.3% | View All 35 Rows |
Immigrants in Carlton
The most numerous immigrant groups reported in Carlton came from Central America (175 | 7.5%), Latin America (175 | 7.5%), Mexico (175 | 7.5%), Asia (28 | 1.2%), and Europe (13 | 0.6%), together accounting for 24.2% of all Carlton residents.
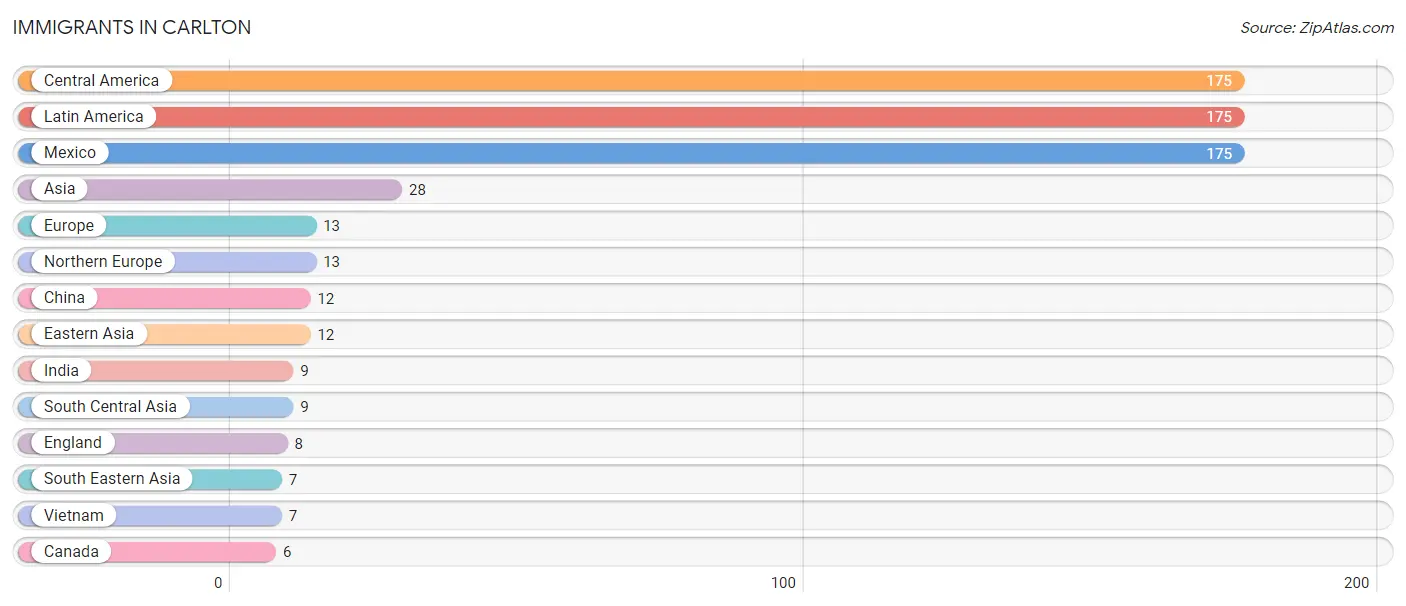
| Immigration Origin | # Population | % Population |
| Asia | 28 | 1.2% |
| Canada | 6 | 0.3% |
| Central America | 175 | 7.5% |
| China | 12 | 0.5% |
| Eastern Asia | 12 | 0.5% |
| England | 8 | 0.3% |
| Europe | 13 | 0.6% |
| India | 9 | 0.4% |
| Latin America | 175 | 7.5% |
| Mexico | 175 | 7.5% |
| Northern Europe | 13 | 0.6% |
| South Central Asia | 9 | 0.4% |
| South Eastern Asia | 7 | 0.3% |
| Vietnam | 7 | 0.3% | View All 14 Rows |
Sex and Age in Carlton
Sex and Age in Carlton
The most populous age groups in Carlton are 20 to 24 Years (111 | 9.7%) for men and 10 to 14 Years (135 | 11.3%) for women.
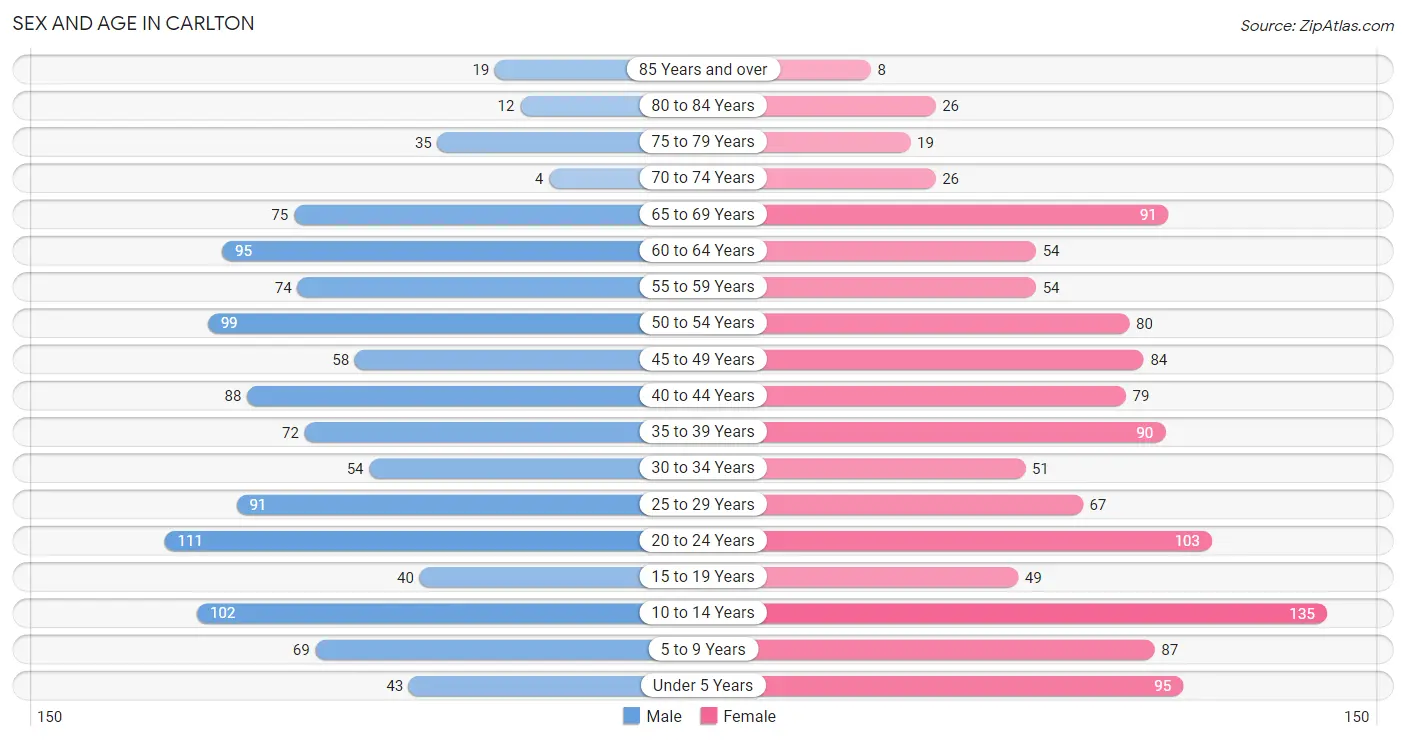
| Age Bracket | Male | Female |
| Under 5 Years | 43 (3.8%) | 95 (7.9%) |
| 5 to 9 Years | 69 (6.0%) | 87 (7.3%) |
| 10 to 14 Years | 102 (8.9%) | 135 (11.3%) |
| 15 to 19 Years | 40 (3.5%) | 49 (4.1%) |
| 20 to 24 Years | 111 (9.7%) | 103 (8.6%) |
| 25 to 29 Years | 91 (8.0%) | 67 (5.6%) |
| 30 to 34 Years | 54 (4.7%) | 51 (4.3%) |
| 35 to 39 Years | 72 (6.3%) | 90 (7.5%) |
| 40 to 44 Years | 88 (7.7%) | 79 (6.6%) |
| 45 to 49 Years | 58 (5.1%) | 84 (7.0%) |
| 50 to 54 Years | 99 (8.7%) | 80 (6.7%) |
| 55 to 59 Years | 74 (6.5%) | 54 (4.5%) |
| 60 to 64 Years | 95 (8.3%) | 54 (4.5%) |
| 65 to 69 Years | 75 (6.6%) | 91 (7.6%) |
| 70 to 74 Years | 4 (0.4%) | 26 (2.2%) |
| 75 to 79 Years | 35 (3.1%) | 19 (1.6%) |
| 80 to 84 Years | 12 (1.1%) | 26 (2.2%) |
| 85 Years and over | 19 (1.7%) | 8 (0.7%) |
| Total | 1,141 (100.0%) | 1,198 (100.0%) |
Families and Households in Carlton
Median Family Size in Carlton
The median family size in Carlton is 3.40 persons per family, with single female/mother families (111 | 18.3%) accounting for the largest median family size of 3.72 persons per family. On the other hand, single male/father families (54 | 8.9%) represent the smallest median family size with 3.28 persons per family.
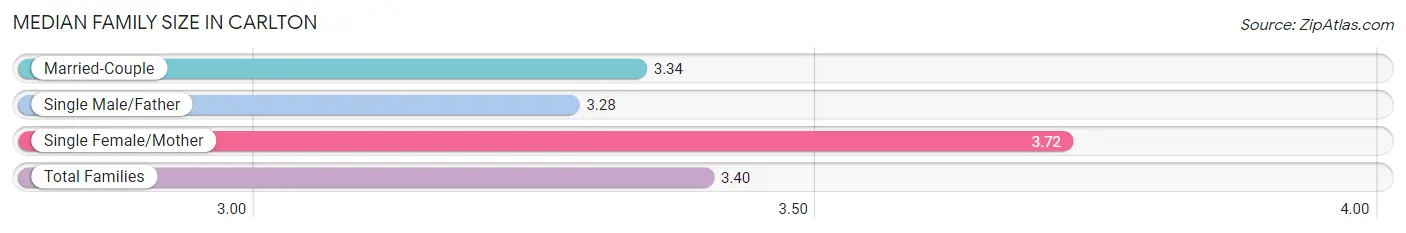
| Family Type | # Families | Family Size |
| Married-Couple | 440 (72.7%) | 3.34 |
| Single Male/Father | 54 (8.9%) | 3.28 |
| Single Female/Mother | 111 (18.3%) | 3.72 |
| Total Families | 605 (100.0%) | 3.40 |
Median Household Size in Carlton
The median household size in Carlton is 3.00 persons per household, with single female/mother households (111 | 14.2%) accounting for the largest median household size of 4.06 persons per household. non-family households (175 | 22.4%) represent the smallest median household size with 1.12 persons per household.
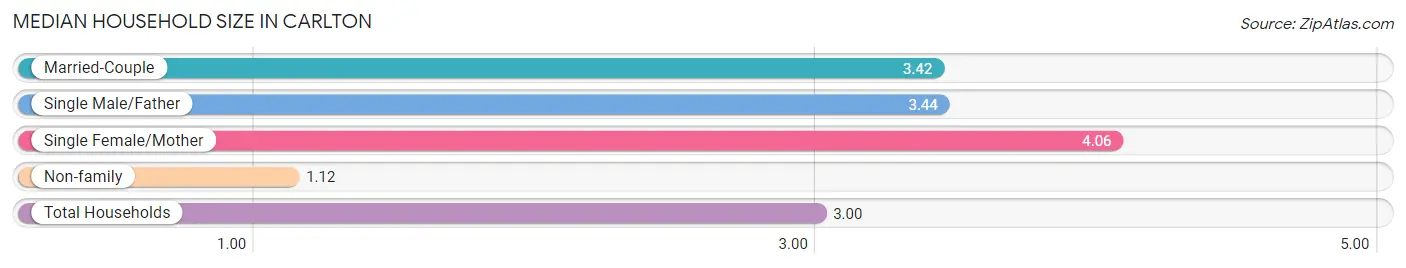
| Household Type | # Households | Household Size |
| Married-Couple | 440 (56.4%) | 3.42 |
| Single Male/Father | 54 (6.9%) | 3.44 |
| Single Female/Mother | 111 (14.2%) | 4.06 |
| Non-family | 175 (22.4%) | 1.12 |
| Total Households | 780 (100.0%) | 3.00 |
Household Size by Marriage Status in Carlton
Out of a total of 780 households in Carlton, 605 (77.6%) are family households, while 175 (22.4%) are nonfamily households. The most numerous type of family households are 2-person households, comprising 206, and the most common type of nonfamily households are 1-person households, comprising 152.
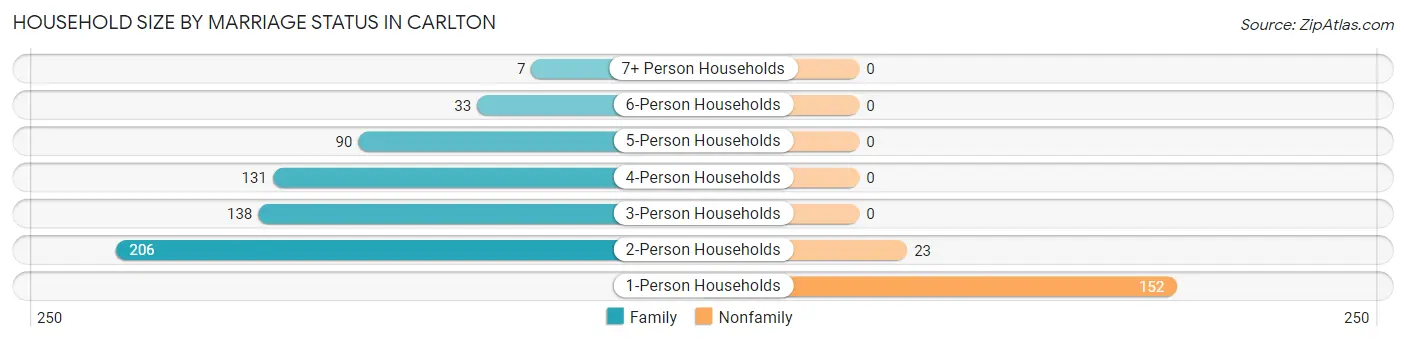
| Household Size | Family Households | Nonfamily Households |
| 1-Person Households | - | 152 (19.5%) |
| 2-Person Households | 206 (26.4%) | 23 (2.9%) |
| 3-Person Households | 138 (17.7%) | 0 (0.0%) |
| 4-Person Households | 131 (16.8%) | 0 (0.0%) |
| 5-Person Households | 90 (11.5%) | 0 (0.0%) |
| 6-Person Households | 33 (4.2%) | 0 (0.0%) |
| 7+ Person Households | 7 (0.9%) | 0 (0.0%) |
| Total | 605 (77.6%) | 175 (22.4%) |
Female Fertility in Carlton
Fertility by Age in Carlton
| Age Bracket | Women with Births | Births / 1,000 Women |
| 15 to 19 years | 0 (0.0%) | 0.0 |
| 20 to 34 years | 0 (0.0%) | 0.0 |
| 35 to 50 years | 0 (0.0%) | 0.0 |
| Total | 0 (0.0%) | 0.0 |
Fertility by Age by Marriage Status in Carlton
| Age Bracket | Married | Unmarried |
| 15 to 19 years | 0 (0.0%) | 0 (0.0%) |
| 20 to 34 years | 0 (0.0%) | 0 (0.0%) |
| 35 to 50 years | 0 (0.0%) | 0 (0.0%) |
| Total | 0 (0.0%) | 0 (0.0%) |
Fertility by Education in Carlton
| Educational Attainment | Women with Births | Births / 1,000 Women |
| Less than High School | 0 (0.0%) | 0.0 |
| High School Diploma | 0 (0.0%) | 0.0 |
| College or Associate's Degree | 0 (0.0%) | 0.0 |
| Bachelor's Degree | 0 (0.0%) | 0.0 |
| Graduate Degree | 0 (0.0%) | 0.0 |
| Total | 0 (0.0%) | 0.0 |
Fertility by Education by Marriage Status in Carlton
| Educational Attainment | Married | Unmarried |
| Less than High School | 0 (0.0%) | 0 (0.0%) |
| High School Diploma | 0 (0.0%) | 0 (0.0%) |
| College or Associate's Degree | 0 (0.0%) | 0 (0.0%) |
| Bachelor's Degree | 0 (0.0%) | 0 (0.0%) |
| Graduate Degree | 0 (0.0%) | 0 (0.0%) |
| Total | 0 (0.0%) | 0 (0.0%) |
Employment Characteristics in Carlton
Employment by Class of Employer in Carlton
Among the 1,090 employed individuals in Carlton, private company employees (786 | 72.1%), local government employees (100 | 9.2%), and self-employed (not incorporated) (75 | 6.9%) make up the most common classes of employment.
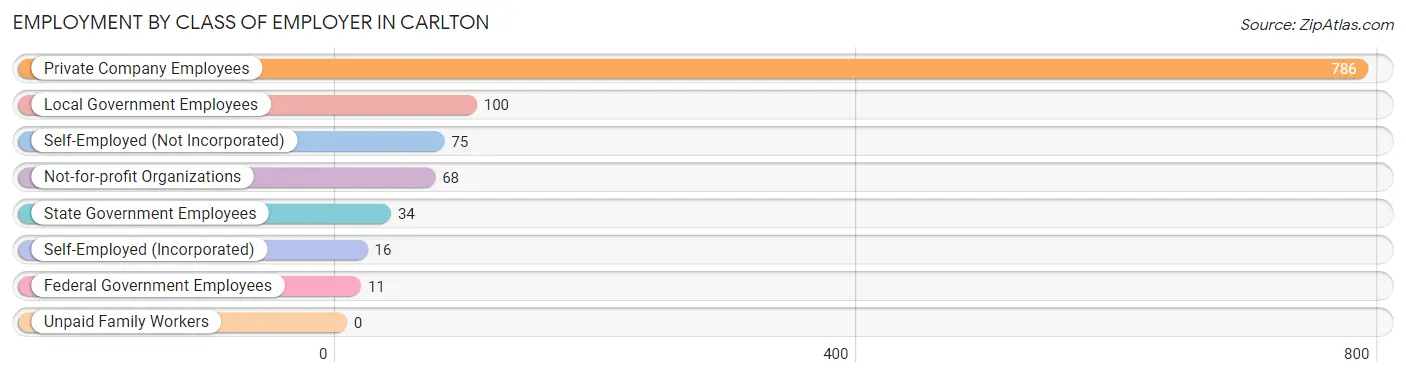
| Employer Class | # Employees | % Employees |
| Private Company Employees | 786 | 72.1% |
| Self-Employed (Incorporated) | 16 | 1.5% |
| Self-Employed (Not Incorporated) | 75 | 6.9% |
| Not-for-profit Organizations | 68 | 6.2% |
| Local Government Employees | 100 | 9.2% |
| State Government Employees | 34 | 3.1% |
| Federal Government Employees | 11 | 1.0% |
| Unpaid Family Workers | 0 | 0.0% |
| Total | 1,090 | 100.0% |
Employment Status by Age in Carlton
According to the labor force statistics for Carlton, out of the total population over 16 years of age (1,798), 65.2% or 1,172 individuals are in the labor force, with 5.2% or 61 of them unemployed. The age group with the highest labor force participation rate is 25 to 29 years, with 93.7% or 148 individuals in the labor force. Within the labor force, the 20 to 24 years age range has the highest percentage of unemployed individuals, with 23.3% or 44 of them being unemployed.
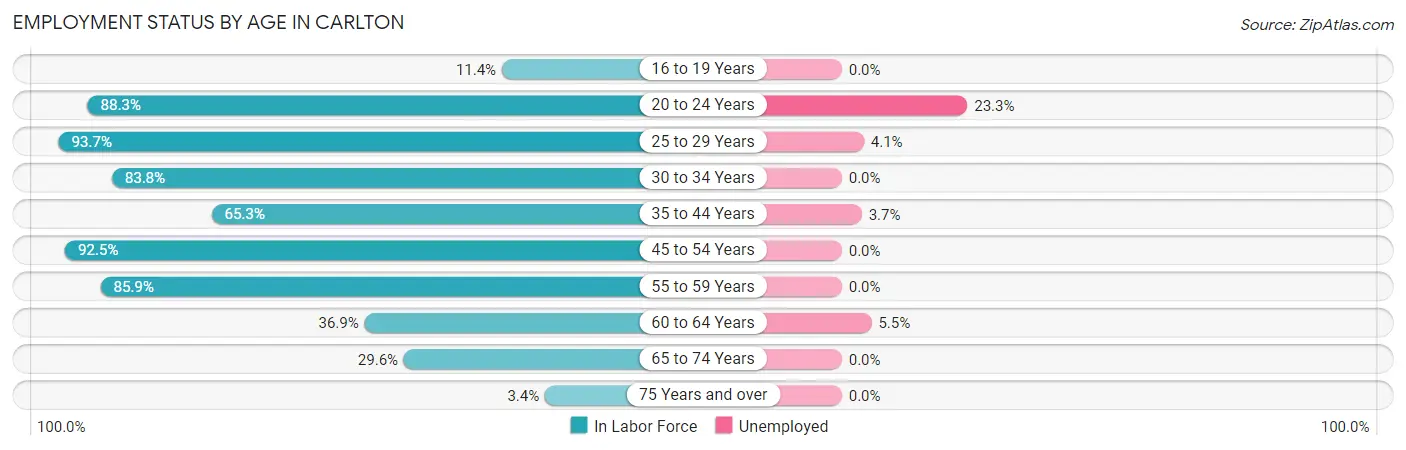
| Age Bracket | In Labor Force | Unemployed |
| 16 to 19 Years | 9 (11.4%) | 0 (0.0%) |
| 20 to 24 Years | 189 (88.3%) | 44 (23.3%) |
| 25 to 29 Years | 148 (93.7%) | 6 (4.1%) |
| 30 to 34 Years | 88 (83.8%) | 0 (0.0%) |
| 35 to 44 Years | 215 (65.3%) | 8 (3.7%) |
| 45 to 54 Years | 297 (92.5%) | 0 (0.0%) |
| 55 to 59 Years | 110 (85.9%) | 0 (0.0%) |
| 60 to 64 Years | 55 (36.9%) | 3 (5.5%) |
| 65 to 74 Years | 58 (29.6%) | 0 (0.0%) |
| 75 Years and over | 4 (3.4%) | 0 (0.0%) |
| Total | 1,172 (65.2%) | 61 (5.2%) |
Employment Status by Educational Attainment in Carlton
According to labor force statistics for Carlton, 76.7% of individuals (913) out of the total population between 25 and 64 years of age (1,190) are in the labor force, with 1.9% or 17 of them being unemployed. The group with the highest labor force participation rate are those with the educational attainment of bachelor's degree or higher, with 82.6% or 228 individuals in the labor force. Within the labor force, individuals with bachelor's degree or higher education have the highest percentage of unemployment, with 4.8% or 11 of them being unemployed.
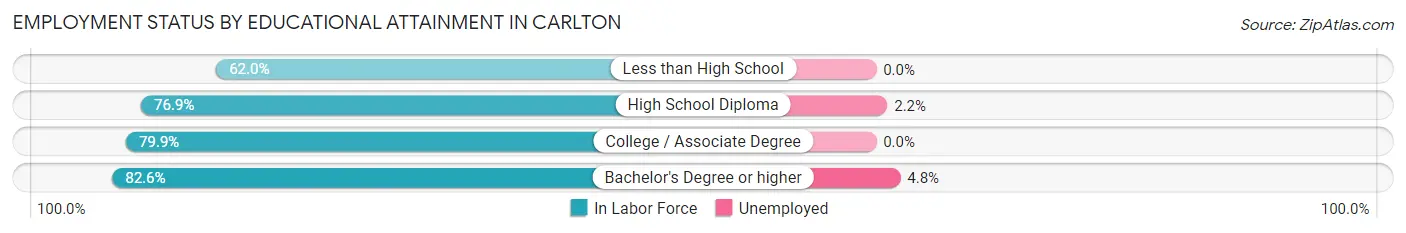
| Educational Attainment | In Labor Force | Unemployed |
| Less than High School | 119 (62.0%) | 0 (0.0%) |
| High School Diploma | 276 (76.9%) | 8 (2.2%) |
| College / Associate Degree | 290 (79.9%) | 0 (0.0%) |
| Bachelor's Degree or higher | 228 (82.6%) | 13 (4.8%) |
| Total | 913 (76.7%) | 23 (1.9%) |
Employment Occupations by Sex in Carlton
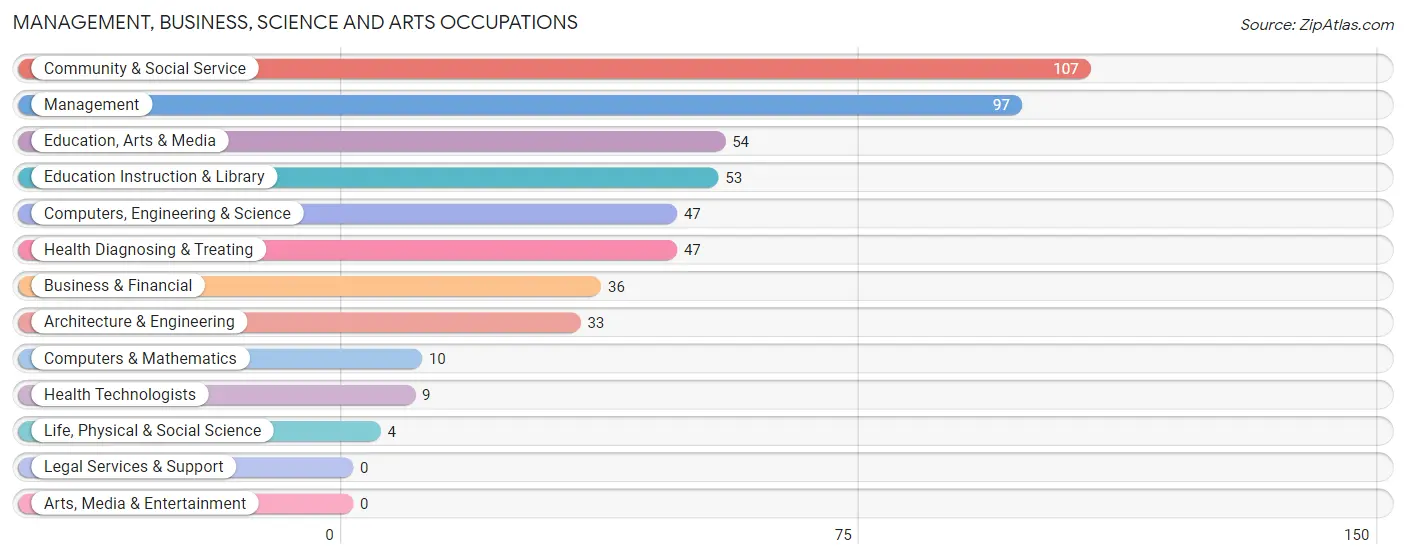
Management, Business, Science and Arts Occupations
The most common Management, Business, Science and Arts occupations in Carlton are Community & Social Service (107 | 9.6%), Management (97 | 8.7%), Education, Arts & Media (54 | 4.9%), Education Instruction & Library (53 | 4.8%), and Computers, Engineering & Science (47 | 4.2%).
Management, Business, Science and Arts Occupations by Sex
Within the Management, Business, Science and Arts occupations in Carlton, the most male-oriented occupations are Computers & Mathematics (100.0%), Architecture & Engineering (87.9%), and Computers, Engineering & Science (83.0%), while the most female-oriented occupations are Business & Financial (100.0%), Life, Physical & Social Science (100.0%), and Health Technologists (100.0%).
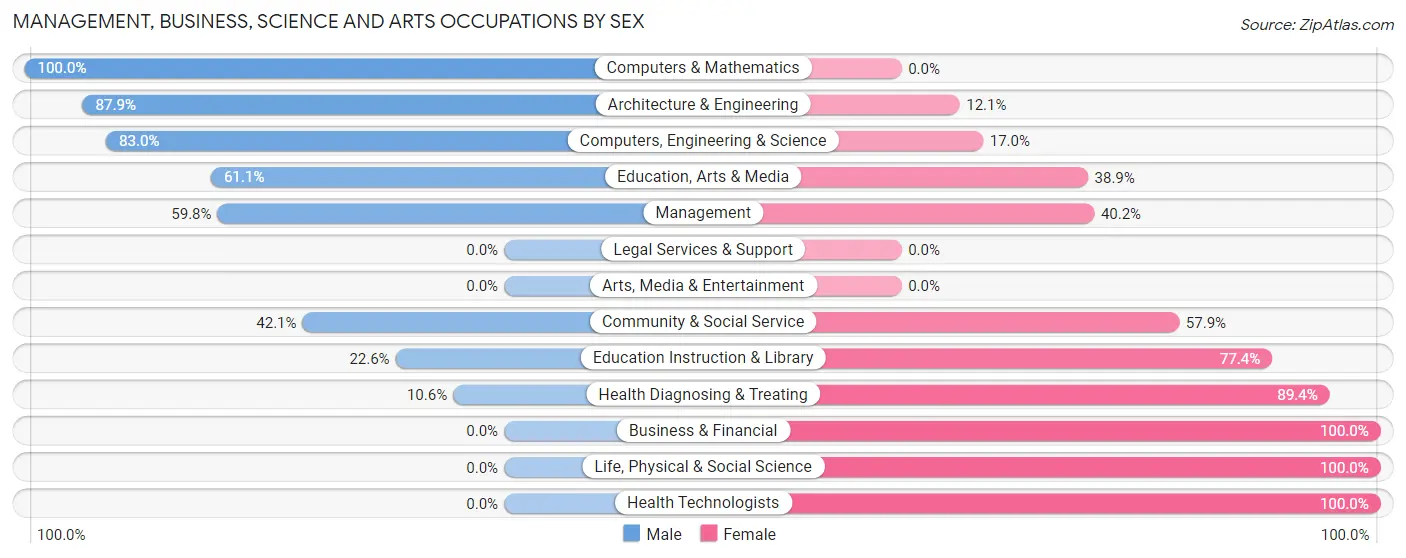
| Occupation | Male | Female |
| Management | 58 (59.8%) | 39 (40.2%) |
| Business & Financial | 0 (0.0%) | 36 (100.0%) |
| Computers, Engineering & Science | 39 (83.0%) | 8 (17.0%) |
| Computers & Mathematics | 10 (100.0%) | 0 (0.0%) |
| Architecture & Engineering | 29 (87.9%) | 4 (12.1%) |
| Life, Physical & Social Science | 0 (0.0%) | 4 (100.0%) |
| Community & Social Service | 45 (42.1%) | 62 (57.9%) |
| Education, Arts & Media | 33 (61.1%) | 21 (38.9%) |
| Legal Services & Support | 0 (0.0%) | 0 (0.0%) |
| Education Instruction & Library | 12 (22.6%) | 41 (77.4%) |
| Arts, Media & Entertainment | 0 (0.0%) | 0 (0.0%) |
| Health Diagnosing & Treating | 5 (10.6%) | 42 (89.4%) |
| Health Technologists | 0 (0.0%) | 9 (100.0%) |
| Total (Category) | 147 (44.0%) | 187 (56.0%) |
| Total (Overall) | 624 (56.1%) | 488 (43.9%) |
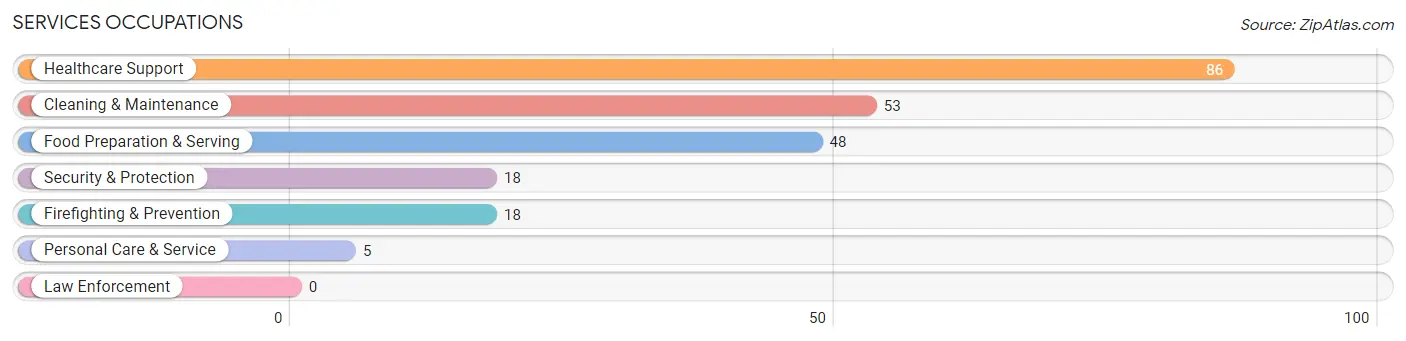
Services Occupations
The most common Services occupations in Carlton are Healthcare Support (86 | 7.7%), Cleaning & Maintenance (53 | 4.8%), Food Preparation & Serving (48 | 4.3%), Security & Protection (18 | 1.6%), and Firefighting & Prevention (18 | 1.6%).
Services Occupations by Sex
Within the Services occupations in Carlton, the most male-oriented occupations are Security & Protection (100.0%), Firefighting & Prevention (100.0%), and Food Preparation & Serving (77.1%), while the most female-oriented occupations are Personal Care & Service (100.0%), Healthcare Support (83.7%), and Cleaning & Maintenance (52.8%).
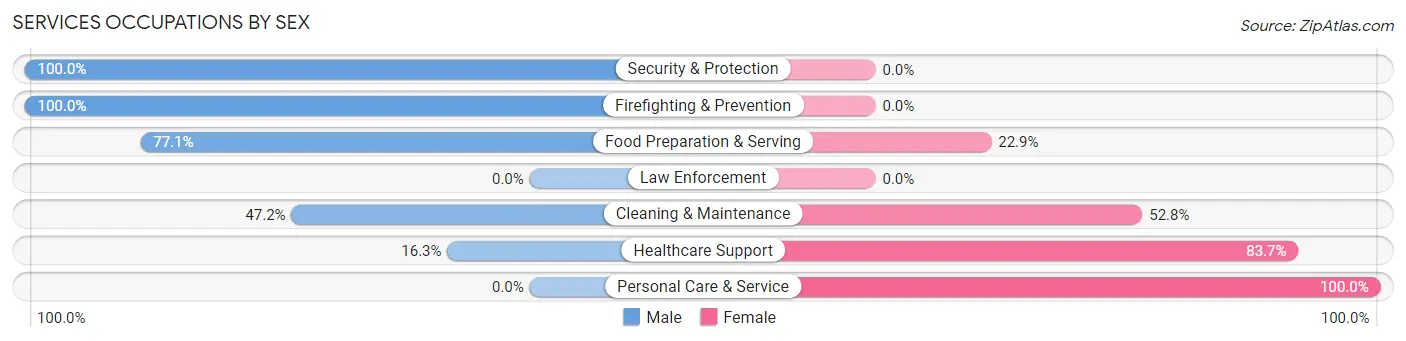
| Occupation | Male | Female |
| Healthcare Support | 14 (16.3%) | 72 (83.7%) |
| Security & Protection | 18 (100.0%) | 0 (0.0%) |
| Firefighting & Prevention | 18 (100.0%) | 0 (0.0%) |
| Law Enforcement | 0 (0.0%) | 0 (0.0%) |
| Food Preparation & Serving | 37 (77.1%) | 11 (22.9%) |
| Cleaning & Maintenance | 25 (47.2%) | 28 (52.8%) |
| Personal Care & Service | 0 (0.0%) | 5 (100.0%) |
| Total (Category) | 94 (44.8%) | 116 (55.2%) |
| Total (Overall) | 624 (56.1%) | 488 (43.9%) |
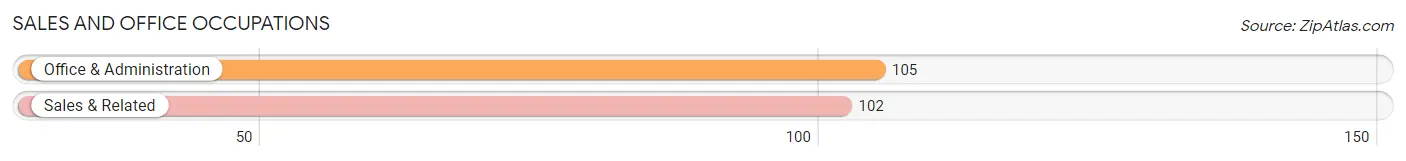
Sales and Office Occupations
The most common Sales and Office occupations in Carlton are Office & Administration (105 | 9.4%), and Sales & Related (102 | 9.2%).
Sales and Office Occupations by Sex
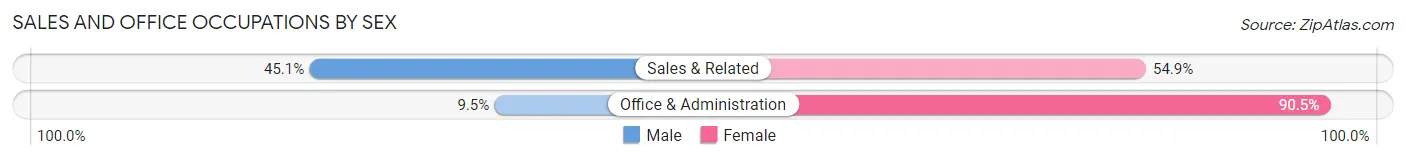
| Occupation | Male | Female |
| Sales & Related | 46 (45.1%) | 56 (54.9%) |
| Office & Administration | 10 (9.5%) | 95 (90.5%) |
| Total (Category) | 56 (27.1%) | 151 (73.0%) |
| Total (Overall) | 624 (56.1%) | 488 (43.9%) |
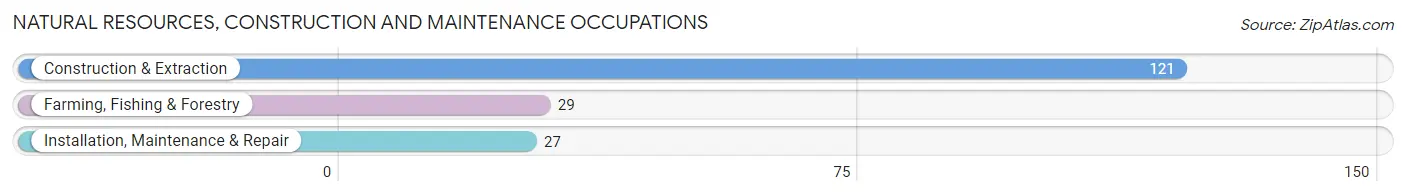
Natural Resources, Construction and Maintenance Occupations
The most common Natural Resources, Construction and Maintenance occupations in Carlton are Construction & Extraction (121 | 10.9%), Farming, Fishing & Forestry (29 | 2.6%), and Installation, Maintenance & Repair (27 | 2.4%).
Natural Resources, Construction and Maintenance Occupations by Sex
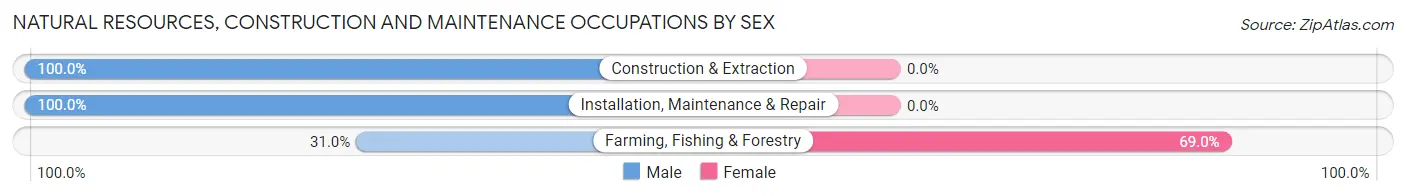
| Occupation | Male | Female |
| Farming, Fishing & Forestry | 9 (31.0%) | 20 (69.0%) |
| Construction & Extraction | 121 (100.0%) | 0 (0.0%) |
| Installation, Maintenance & Repair | 27 (100.0%) | 0 (0.0%) |
| Total (Category) | 157 (88.7%) | 20 (11.3%) |
| Total (Overall) | 624 (56.1%) | 488 (43.9%) |
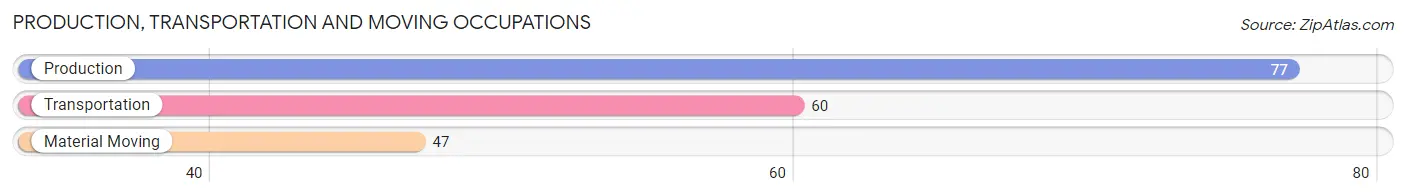
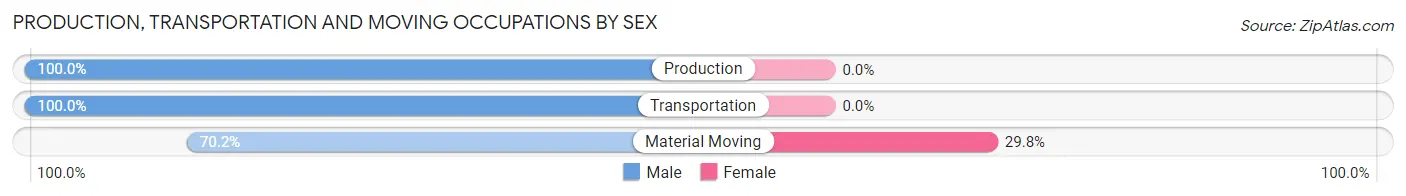
Production, Transportation and Moving Occupations
The most common Production, Transportation and Moving occupations in Carlton are Production (77 | 6.9%), Transportation (60 | 5.4%), and Material Moving (47 | 4.2%).
Production, Transportation and Moving Occupations by Sex
| Occupation | Male | Female |
| Production | 77 (100.0%) | 0 (0.0%) |
| Transportation | 60 (100.0%) | 0 (0.0%) |
| Material Moving | 33 (70.2%) | 14 (29.8%) |
| Total (Category) | 170 (92.4%) | 14 (7.6%) |
| Total (Overall) | 624 (56.1%) | 488 (43.9%) |
Employment Industries by Sex in Carlton
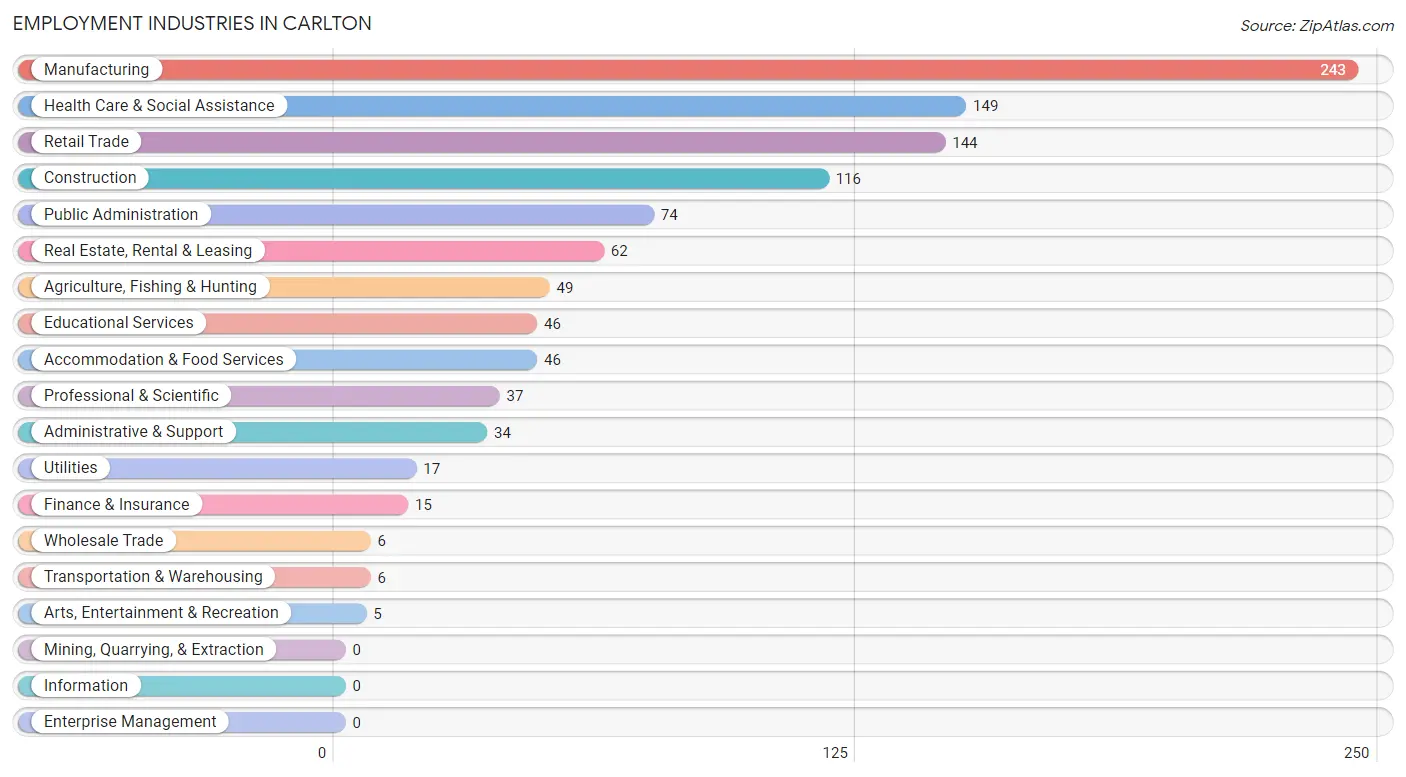
Employment Industries in Carlton
The major employment industries in Carlton include Manufacturing (243 | 21.8%), Health Care & Social Assistance (149 | 13.4%), Retail Trade (144 | 13.0%), Construction (116 | 10.4%), and Public Administration (74 | 6.7%).
Employment Industries by Sex in Carlton
The Carlton industries that see more men than women are Construction (100.0%), Utilities (100.0%), and Arts, Entertainment & Recreation (100.0%), whereas the industries that tend to have a higher number of women are Finance & Insurance (100.0%), Real Estate, Rental & Leasing (100.0%), and Health Care & Social Assistance (81.9%).
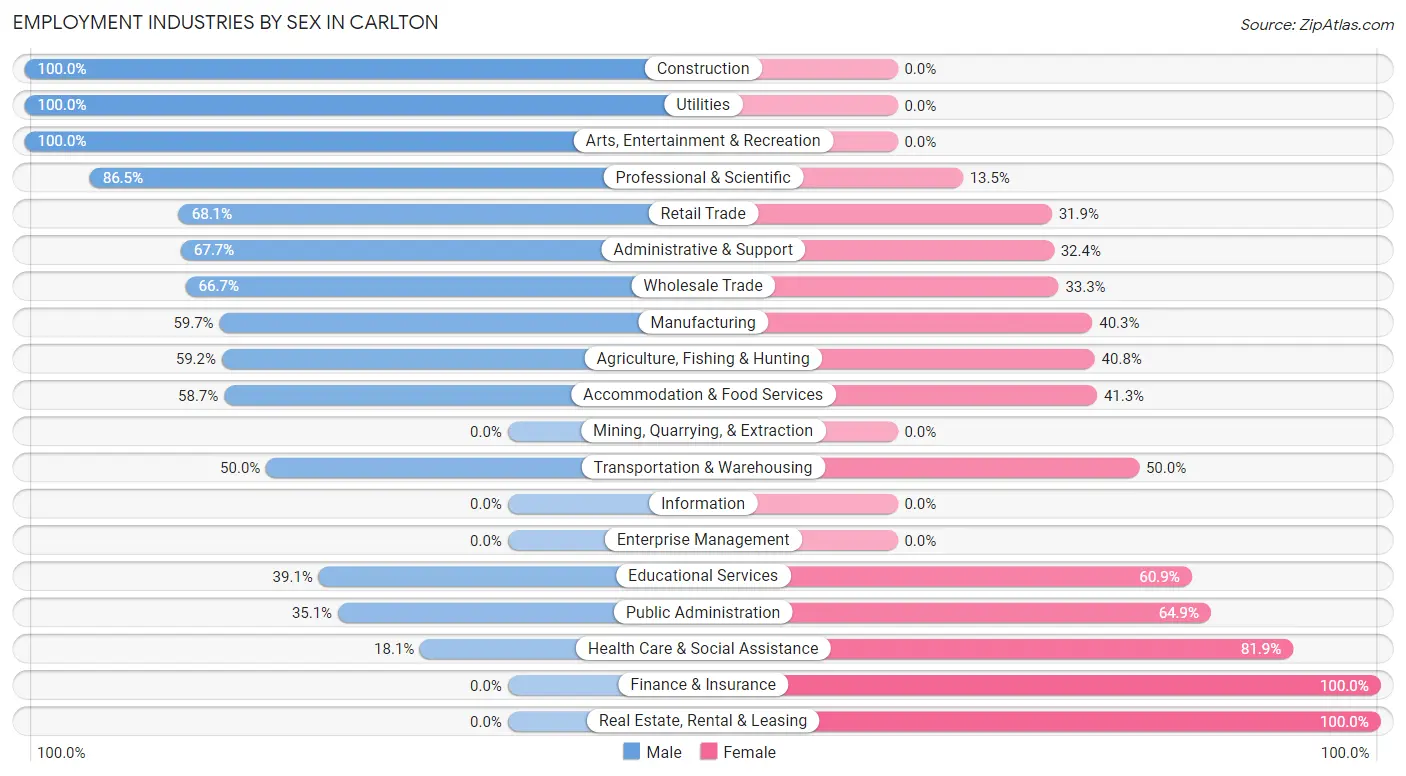
| Industry | Male | Female |
| Agriculture, Fishing & Hunting | 29 (59.2%) | 20 (40.8%) |
| Mining, Quarrying, & Extraction | 0 (0.0%) | 0 (0.0%) |
| Construction | 116 (100.0%) | 0 (0.0%) |
| Manufacturing | 145 (59.7%) | 98 (40.3%) |
| Wholesale Trade | 4 (66.7%) | 2 (33.3%) |
| Retail Trade | 98 (68.1%) | 46 (31.9%) |
| Transportation & Warehousing | 3 (50.0%) | 3 (50.0%) |
| Utilities | 17 (100.0%) | 0 (0.0%) |
| Information | 0 (0.0%) | 0 (0.0%) |
| Finance & Insurance | 0 (0.0%) | 15 (100.0%) |
| Real Estate, Rental & Leasing | 0 (0.0%) | 62 (100.0%) |
| Professional & Scientific | 32 (86.5%) | 5 (13.5%) |
| Enterprise Management | 0 (0.0%) | 0 (0.0%) |
| Administrative & Support | 23 (67.6%) | 11 (32.4%) |
| Educational Services | 18 (39.1%) | 28 (60.9%) |
| Health Care & Social Assistance | 27 (18.1%) | 122 (81.9%) |
| Arts, Entertainment & Recreation | 5 (100.0%) | 0 (0.0%) |
| Accommodation & Food Services | 27 (58.7%) | 19 (41.3%) |
| Public Administration | 26 (35.1%) | 48 (64.9%) |
| Total | 624 (56.1%) | 488 (43.9%) |
Education in Carlton
School Enrollment in Carlton
The most common levels of schooling among the 573 students in Carlton are middle school (193 | 33.7%), elementary school (168 | 29.3%), and high school (99 | 17.3%).
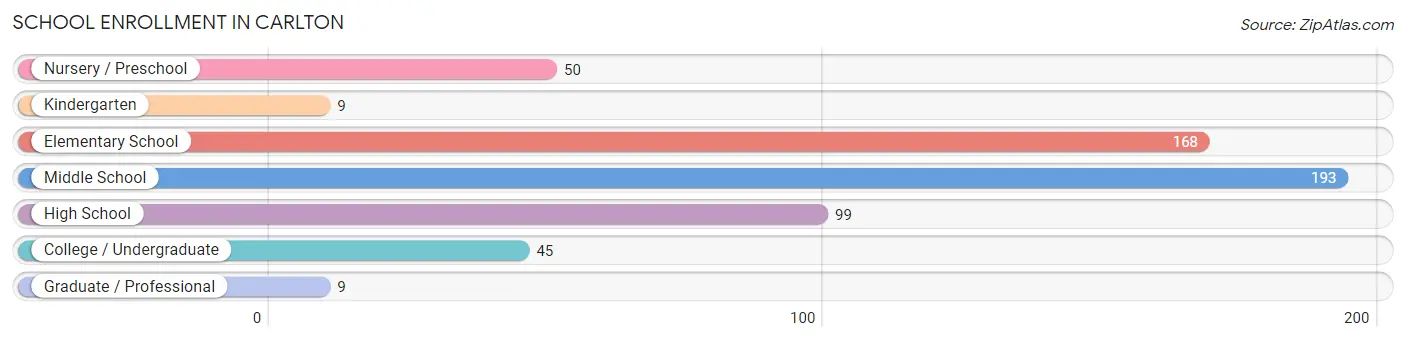
| School Level | # Students | % Students |
| Nursery / Preschool | 50 | 8.7% |
| Kindergarten | 9 | 1.6% |
| Elementary School | 168 | 29.3% |
| Middle School | 193 | 33.7% |
| High School | 99 | 17.3% |
| College / Undergraduate | 45 | 7.9% |
| Graduate / Professional | 9 | 1.6% |
| Total | 573 | 100.0% |
School Enrollment by Age by Funding Source in Carlton
Out of a total of 573 students who are enrolled in schools in Carlton, 71 (12.4%) attend a private institution, while the remaining 502 (87.6%) are enrolled in public schools. The age group of 3 to 4 year olds has the highest likelihood of being enrolled in private schools, with 50 (100.0% in the age bracket) enrolled. Conversely, the age group of 5 to 9 year old has the lowest likelihood of being enrolled in a private school, with 151 (100.0% in the age bracket) attending a public institution.
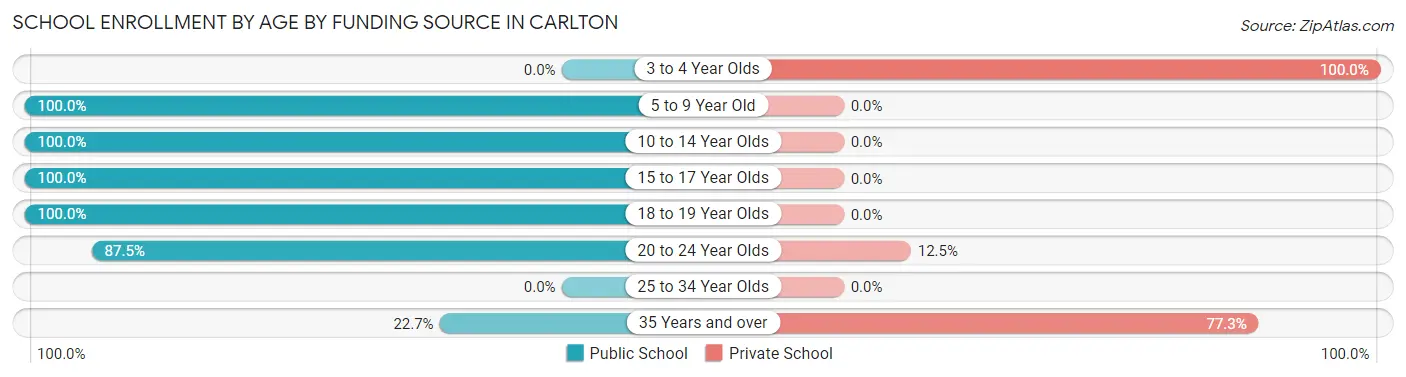
| Age Bracket | Public School | Private School |
| 3 to 4 Year Olds | 0 (0.0%) | 50 (100.0%) |
| 5 to 9 Year Old | 151 (100.0%) | 0 (0.0%) |
| 10 to 14 Year Olds | 237 (100.0%) | 0 (0.0%) |
| 15 to 17 Year Olds | 70 (100.0%) | 0 (0.0%) |
| 18 to 19 Year Olds | 11 (100.0%) | 0 (0.0%) |
| 20 to 24 Year Olds | 28 (87.5%) | 4 (12.5%) |
| 25 to 34 Year Olds | 0 (0.0%) | 0 (0.0%) |
| 35 Years and over | 5 (22.7%) | 17 (77.3%) |
| Total | 502 (87.6%) | 71 (12.4%) |
Educational Attainment by Field of Study in Carlton
Business (124 | 32.6%), science & technology (53 | 14.0%), psychology (40 | 10.5%), arts & humanities (35 | 9.2%), and bio, nature & agricultural (25 | 6.6%) are the most common fields of study among 380 individuals in Carlton who have obtained a bachelor's degree or higher.
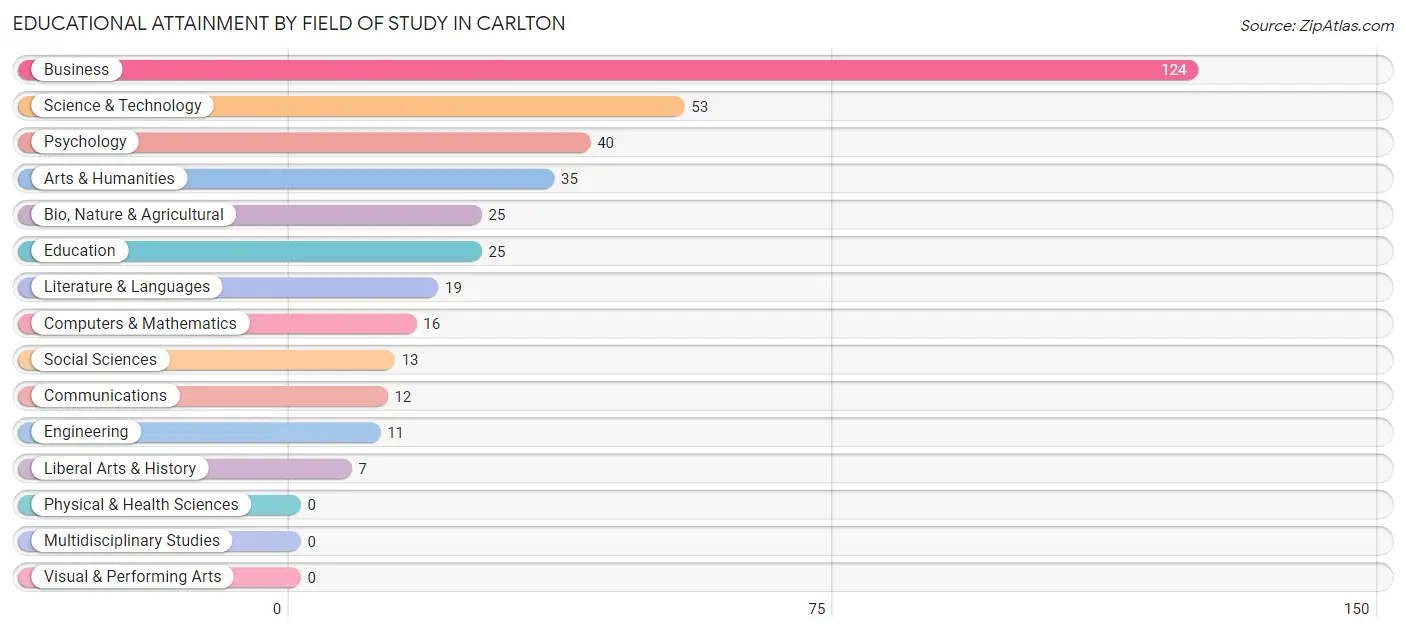
| Field of Study | # Graduates | % Graduates |
| Computers & Mathematics | 16 | 4.2% |
| Bio, Nature & Agricultural | 25 | 6.6% |
| Physical & Health Sciences | 0 | 0.0% |
| Psychology | 40 | 10.5% |
| Social Sciences | 13 | 3.4% |
| Engineering | 11 | 2.9% |
| Multidisciplinary Studies | 0 | 0.0% |
| Science & Technology | 53 | 14.0% |
| Business | 124 | 32.6% |
| Education | 25 | 6.6% |
| Literature & Languages | 19 | 5.0% |
| Liberal Arts & History | 7 | 1.8% |
| Visual & Performing Arts | 0 | 0.0% |
| Communications | 12 | 3.2% |
| Arts & Humanities | 35 | 9.2% |
| Total | 380 | 100.0% |
Transportation & Commute in Carlton
Vehicle Availability by Sex in Carlton
The most prevalent vehicle ownership categories in Carlton are males with 3 vehicles (171, accounting for 28.2%) and females with 3 vehicles (182, making up 35.3%).
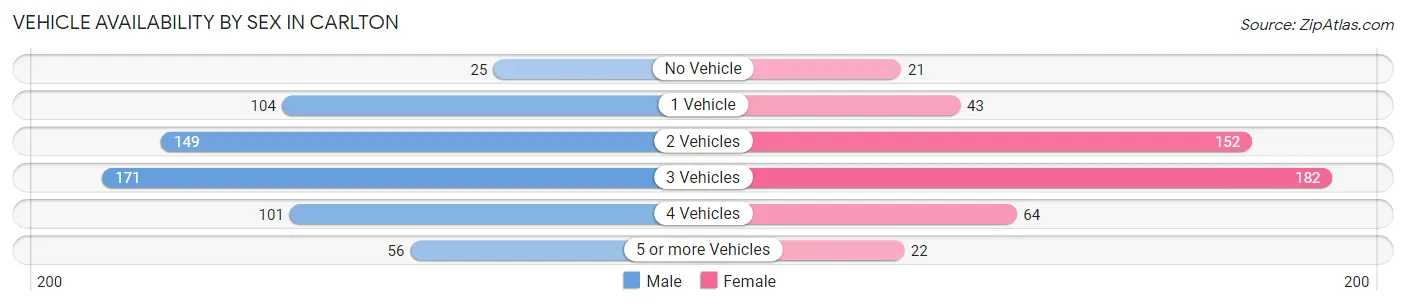
| Vehicles Available | Male | Female |
| No Vehicle | 25 (4.1%) | 21 (4.3%) |
| 1 Vehicle | 104 (17.2%) | 43 (8.9%) |
| 2 Vehicles | 149 (24.6%) | 152 (31.4%) |
| 3 Vehicles | 171 (28.2%) | 182 (37.6%) |
| 4 Vehicles | 101 (16.7%) | 64 (13.2%) |
| 5 or more Vehicles | 56 (9.2%) | 22 (4.5%) |
| Total | 606 (100.0%) | 484 (100.0%) |
Commute Time in Carlton
The most frequently occuring commute durations in Carlton are 15 to 19 minutes (183 commuters, 18.9%), 45 to 59 minutes (173 commuters, 17.8%), and 10 to 14 minutes (135 commuters, 13.9%).
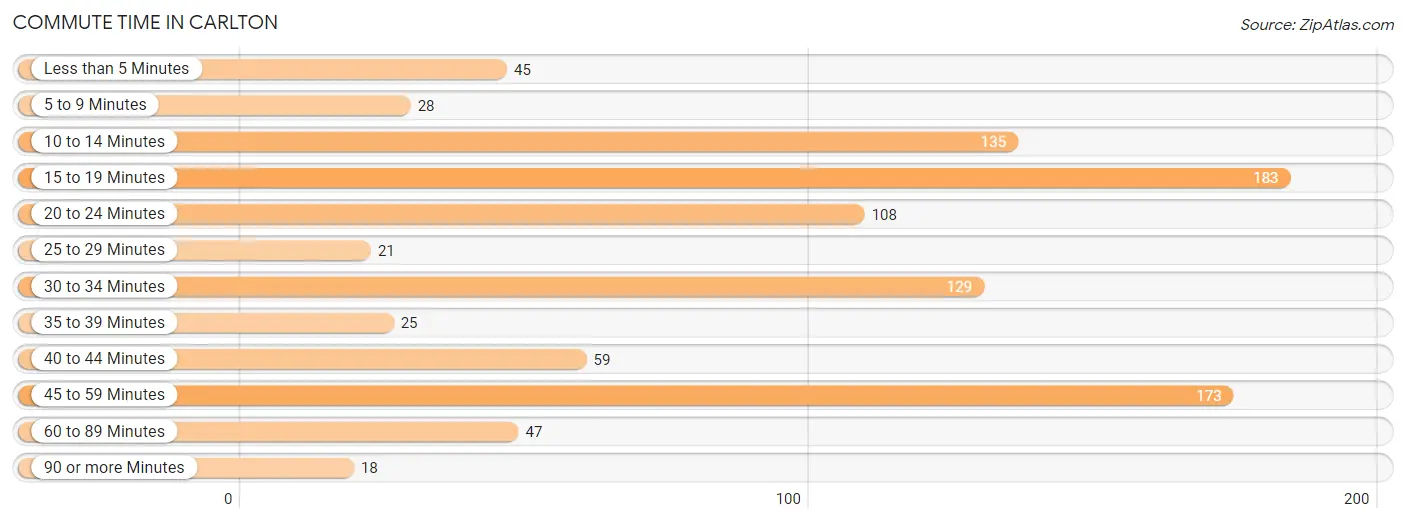
| Commute Time | # Commuters | % Commuters |
| Less than 5 Minutes | 45 | 4.6% |
| 5 to 9 Minutes | 28 | 2.9% |
| 10 to 14 Minutes | 135 | 13.9% |
| 15 to 19 Minutes | 183 | 18.9% |
| 20 to 24 Minutes | 108 | 11.1% |
| 25 to 29 Minutes | 21 | 2.2% |
| 30 to 34 Minutes | 129 | 13.3% |
| 35 to 39 Minutes | 25 | 2.6% |
| 40 to 44 Minutes | 59 | 6.1% |
| 45 to 59 Minutes | 173 | 17.8% |
| 60 to 89 Minutes | 47 | 4.8% |
| 90 or more Minutes | 18 | 1.8% |
Commute Time by Sex in Carlton
The most common commute times in Carlton are 45 to 59 minutes (130 commuters, 22.3%) for males and 15 to 19 minutes (108 commuters, 27.9%) for females.
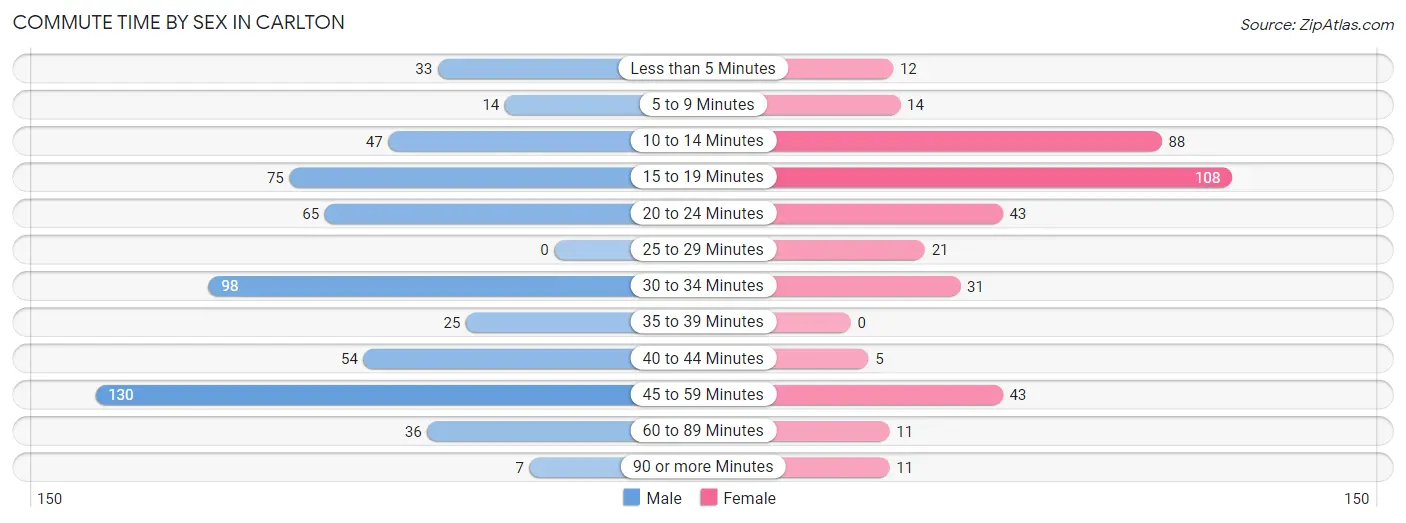
| Commute Time | Male | Female |
| Less than 5 Minutes | 33 (5.7%) | 12 (3.1%) |
| 5 to 9 Minutes | 14 (2.4%) | 14 (3.6%) |
| 10 to 14 Minutes | 47 (8.1%) | 88 (22.7%) |
| 15 to 19 Minutes | 75 (12.8%) | 108 (27.9%) |
| 20 to 24 Minutes | 65 (11.1%) | 43 (11.1%) |
| 25 to 29 Minutes | 0 (0.0%) | 21 (5.4%) |
| 30 to 34 Minutes | 98 (16.8%) | 31 (8.0%) |
| 35 to 39 Minutes | 25 (4.3%) | 0 (0.0%) |
| 40 to 44 Minutes | 54 (9.2%) | 5 (1.3%) |
| 45 to 59 Minutes | 130 (22.3%) | 43 (11.1%) |
| 60 to 89 Minutes | 36 (6.2%) | 11 (2.8%) |
| 90 or more Minutes | 7 (1.2%) | 11 (2.8%) |
Time of Departure to Work by Sex in Carlton
The most frequent times of departure to work in Carlton are 7:00 AM to 7:29 AM (103, 17.6%) for males and 6:00 AM to 6:29 AM (110, 28.4%) for females.
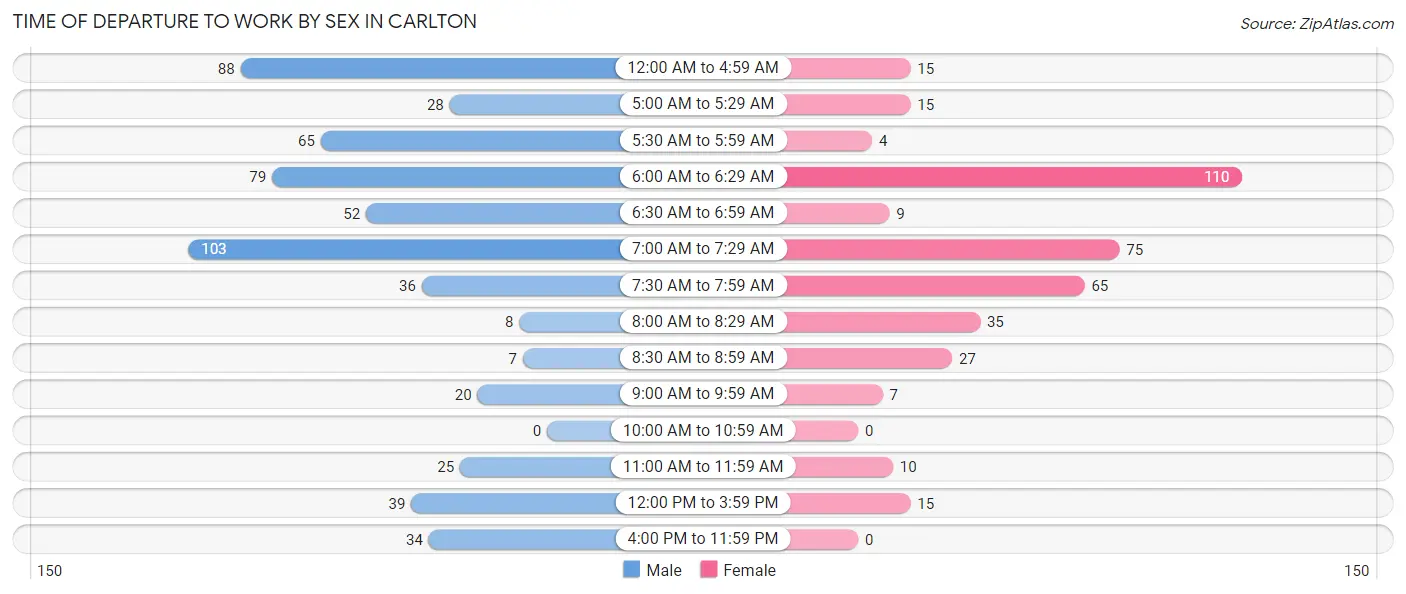
| Time of Departure | Male | Female |
| 12:00 AM to 4:59 AM | 88 (15.1%) | 15 (3.9%) |
| 5:00 AM to 5:29 AM | 28 (4.8%) | 15 (3.9%) |
| 5:30 AM to 5:59 AM | 65 (11.1%) | 4 (1.0%) |
| 6:00 AM to 6:29 AM | 79 (13.5%) | 110 (28.4%) |
| 6:30 AM to 6:59 AM | 52 (8.9%) | 9 (2.3%) |
| 7:00 AM to 7:29 AM | 103 (17.6%) | 75 (19.4%) |
| 7:30 AM to 7:59 AM | 36 (6.2%) | 65 (16.8%) |
| 8:00 AM to 8:29 AM | 8 (1.4%) | 35 (9.0%) |
| 8:30 AM to 8:59 AM | 7 (1.2%) | 27 (7.0%) |
| 9:00 AM to 9:59 AM | 20 (3.4%) | 7 (1.8%) |
| 10:00 AM to 10:59 AM | 0 (0.0%) | 0 (0.0%) |
| 11:00 AM to 11:59 AM | 25 (4.3%) | 10 (2.6%) |
| 12:00 PM to 3:59 PM | 39 (6.7%) | 15 (3.9%) |
| 4:00 PM to 11:59 PM | 34 (5.8%) | 0 (0.0%) |
| Total | 584 (100.0%) | 387 (100.0%) |
Housing Occupancy in Carlton
Occupancy by Ownership in Carlton
Of the total 780 dwellings in Carlton, owner-occupied units account for 605 (77.6%), while renter-occupied units make up 175 (22.4%).
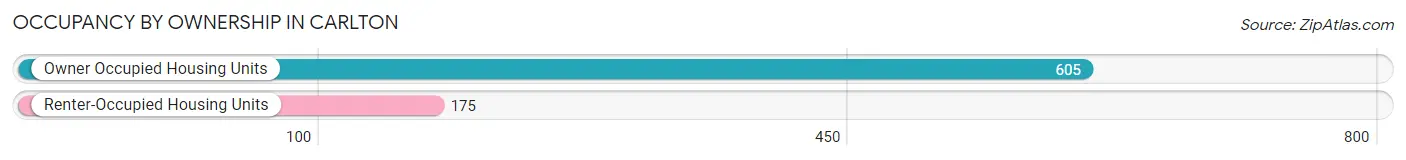
| Occupancy | # Housing Units | % Housing Units |
| Owner Occupied Housing Units | 605 | 77.6% |
| Renter-Occupied Housing Units | 175 | 22.4% |
| Total Occupied Housing Units | 780 | 100.0% |
Occupancy by Household Size in Carlton
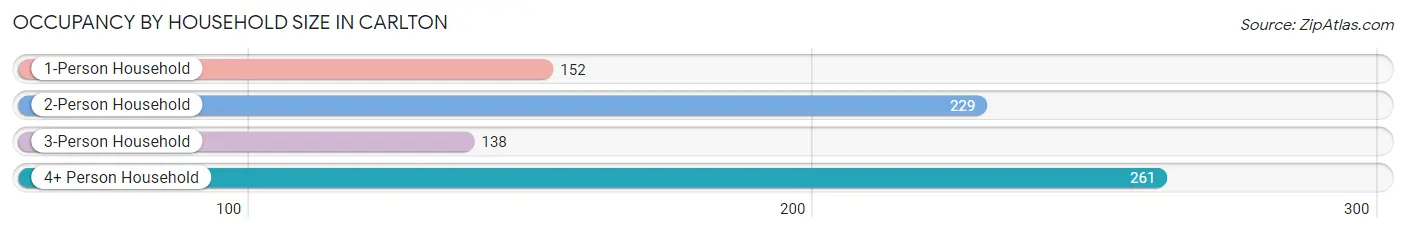
| Household Size | # Housing Units | % Housing Units |
| 1-Person Household | 152 | 19.5% |
| 2-Person Household | 229 | 29.4% |
| 3-Person Household | 138 | 17.7% |
| 4+ Person Household | 261 | 33.5% |
| Total Housing Units | 780 | 100.0% |
Occupancy by Ownership by Household Size in Carlton
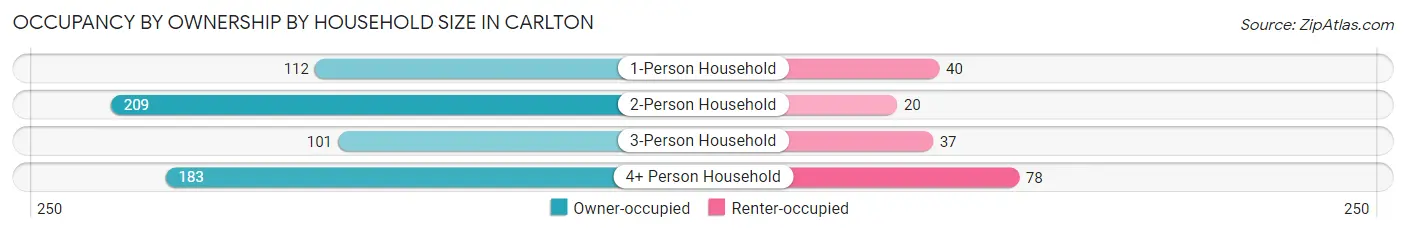
| Household Size | Owner-occupied | Renter-occupied |
| 1-Person Household | 112 (73.7%) | 40 (26.3%) |
| 2-Person Household | 209 (91.3%) | 20 (8.7%) |
| 3-Person Household | 101 (73.2%) | 37 (26.8%) |
| 4+ Person Household | 183 (70.1%) | 78 (29.9%) |
| Total Housing Units | 605 (77.6%) | 175 (22.4%) |
Occupancy by Educational Attainment in Carlton
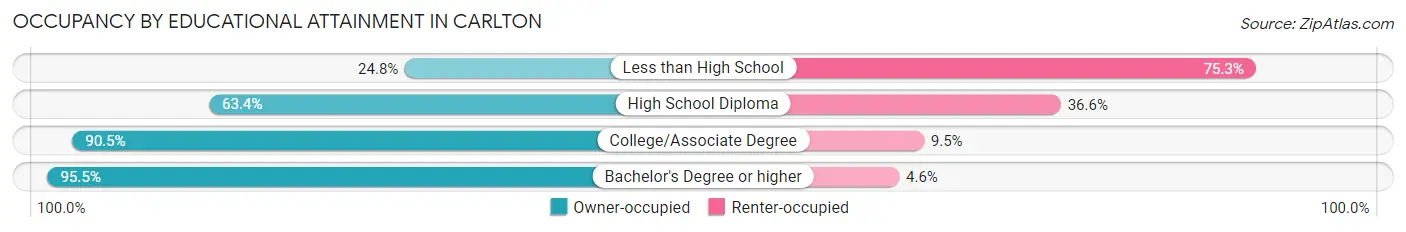
| Household Size | Owner-occupied | Renter-occupied |
| Less than High School | 25 (24.7%) | 76 (75.2%) |
| High School Diploma | 104 (63.4%) | 60 (36.6%) |
| College/Associate Degree | 287 (90.5%) | 30 (9.5%) |
| Bachelor's Degree or higher | 189 (95.5%) | 9 (4.5%) |
Occupancy by Age of Householder in Carlton
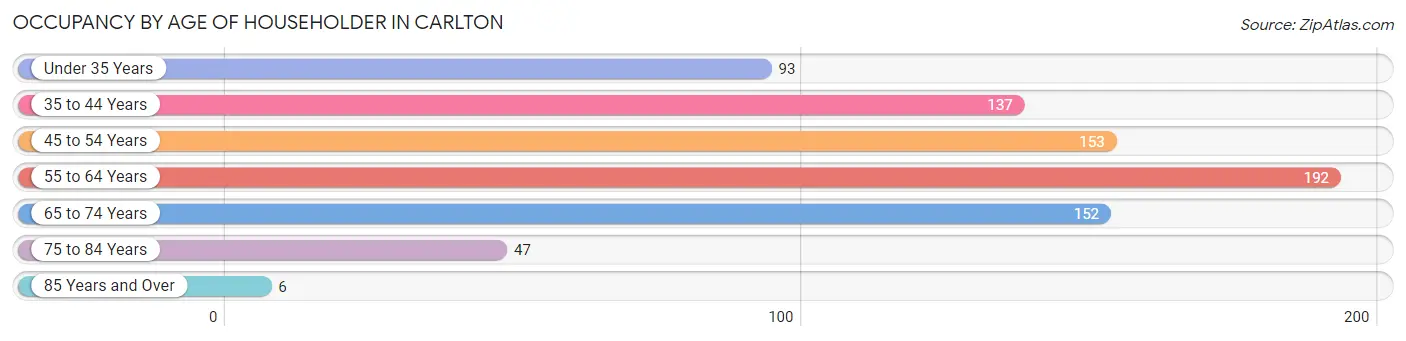
| Age Bracket | # Households | % Households |
| Under 35 Years | 93 | 11.9% |
| 35 to 44 Years | 137 | 17.6% |
| 45 to 54 Years | 153 | 19.6% |
| 55 to 64 Years | 192 | 24.6% |
| 65 to 74 Years | 152 | 19.5% |
| 75 to 84 Years | 47 | 6.0% |
| 85 Years and Over | 6 | 0.8% |
| Total | 780 | 100.0% |
Housing Finances in Carlton
Median Income by Occupancy in Carlton
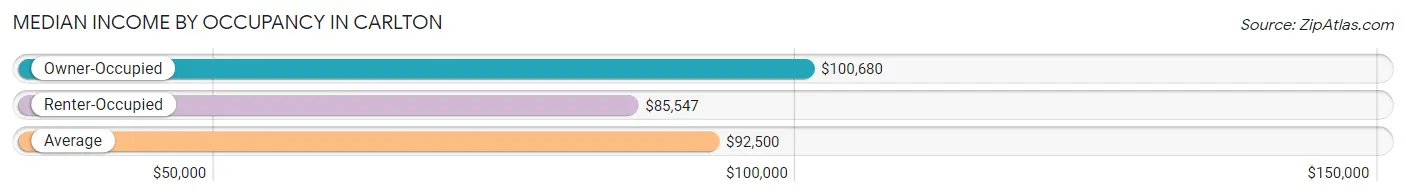
| Occupancy Type | # Households | Median Income |
| Owner-Occupied | 605 (77.6%) | $100,680 |
| Renter-Occupied | 175 (22.4%) | $85,547 |
| Average | 780 (100.0%) | $92,500 |
Occupancy by Householder Income Bracket in Carlton
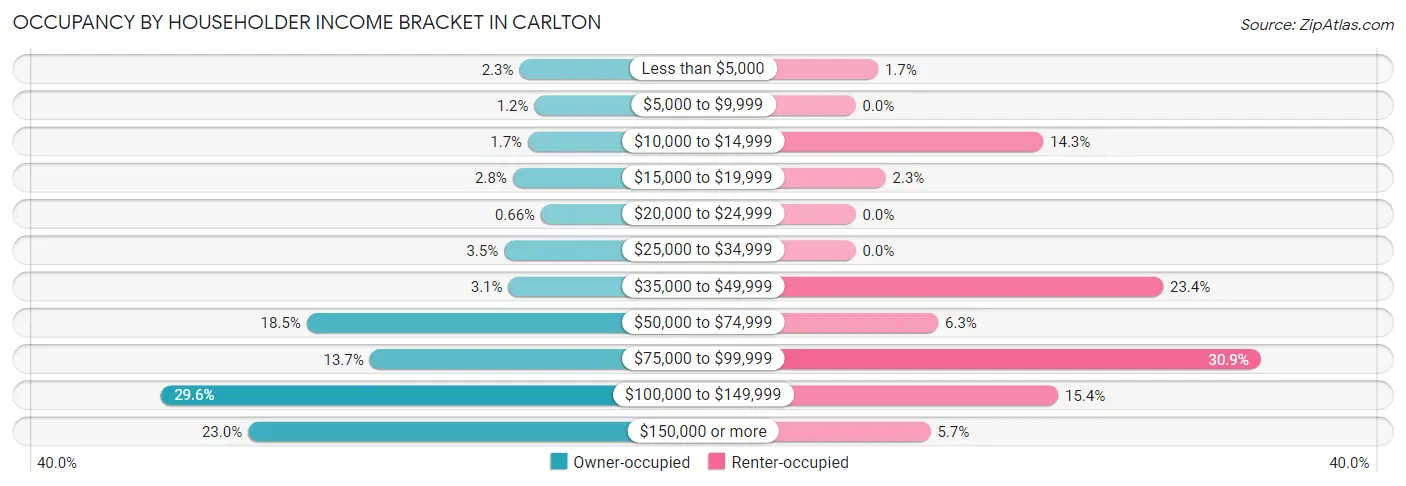
| Income Bracket | Owner-occupied | Renter-occupied |
| Less than $5,000 | 14 (2.3%) | 3 (1.7%) |
| $5,000 to $9,999 | 7 (1.2%) | 0 (0.0%) |
| $10,000 to $14,999 | 10 (1.7%) | 25 (14.3%) |
| $15,000 to $19,999 | 17 (2.8%) | 4 (2.3%) |
| $20,000 to $24,999 | 4 (0.7%) | 0 (0.0%) |
| $25,000 to $34,999 | 21 (3.5%) | 0 (0.0%) |
| $35,000 to $49,999 | 19 (3.1%) | 41 (23.4%) |
| $50,000 to $74,999 | 112 (18.5%) | 11 (6.3%) |
| $75,000 to $99,999 | 83 (13.7%) | 54 (30.9%) |
| $100,000 to $149,999 | 179 (29.6%) | 27 (15.4%) |
| $150,000 or more | 139 (23.0%) | 10 (5.7%) |
| Total | 605 (100.0%) | 175 (100.0%) |
Monthly Housing Cost Tiers in Carlton
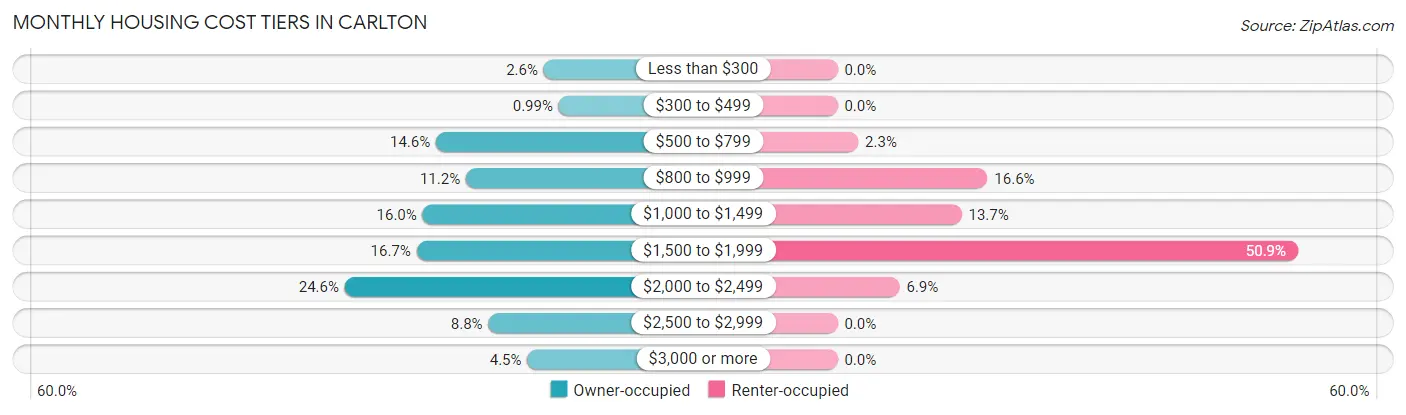
| Monthly Cost | Owner-occupied | Renter-occupied |
| Less than $300 | 16 (2.6%) | 0 (0.0%) |
| $300 to $499 | 6 (1.0%) | 0 (0.0%) |
| $500 to $799 | 88 (14.5%) | 4 (2.3%) |
| $800 to $999 | 68 (11.2%) | 29 (16.6%) |
| $1,000 to $1,499 | 97 (16.0%) | 24 (13.7%) |
| $1,500 to $1,999 | 101 (16.7%) | 89 (50.9%) |
| $2,000 to $2,499 | 149 (24.6%) | 12 (6.9%) |
| $2,500 to $2,999 | 53 (8.8%) | 0 (0.0%) |
| $3,000 or more | 27 (4.5%) | 0 (0.0%) |
| Total | 605 (100.0%) | 175 (100.0%) |
Physical Housing Characteristics in Carlton
Housing Structures in Carlton
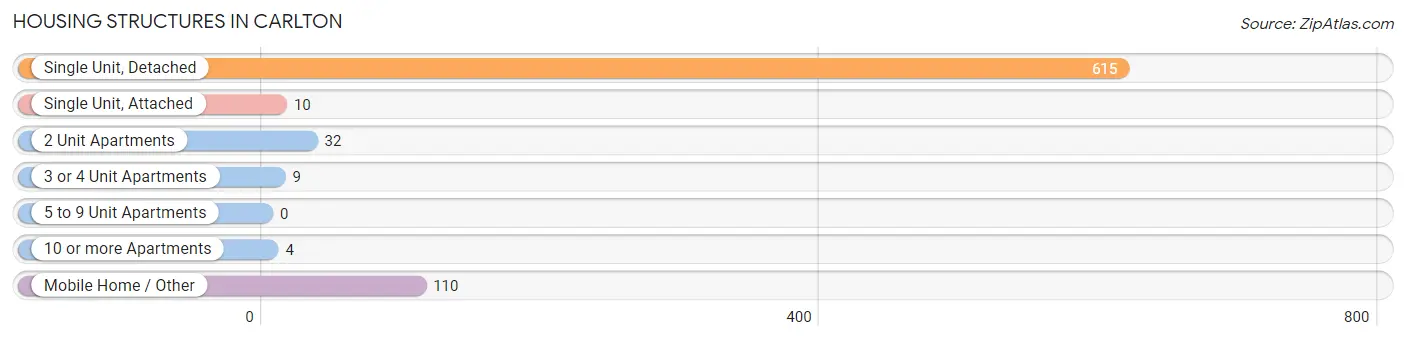
| Structure Type | # Housing Units | % Housing Units |
| Single Unit, Detached | 615 | 78.8% |
| Single Unit, Attached | 10 | 1.3% |
| 2 Unit Apartments | 32 | 4.1% |
| 3 or 4 Unit Apartments | 9 | 1.1% |
| 5 to 9 Unit Apartments | 0 | 0.0% |
| 10 or more Apartments | 4 | 0.5% |
| Mobile Home / Other | 110 | 14.1% |
| Total | 780 | 100.0% |
Housing Structures by Occupancy in Carlton
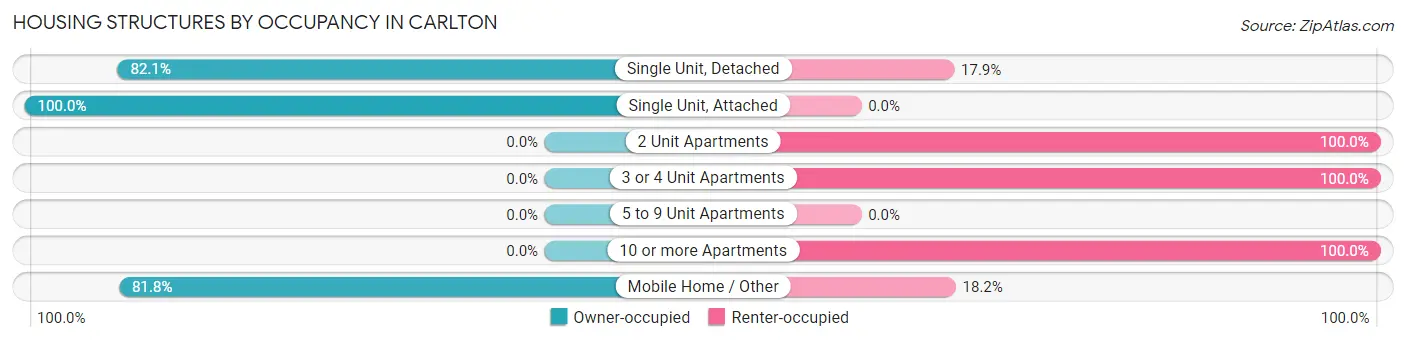
| Structure Type | Owner-occupied | Renter-occupied |
| Single Unit, Detached | 505 (82.1%) | 110 (17.9%) |
| Single Unit, Attached | 10 (100.0%) | 0 (0.0%) |
| 2 Unit Apartments | 0 (0.0%) | 32 (100.0%) |
| 3 or 4 Unit Apartments | 0 (0.0%) | 9 (100.0%) |
| 5 to 9 Unit Apartments | 0 (0.0%) | 0 (0.0%) |
| 10 or more Apartments | 0 (0.0%) | 4 (100.0%) |
| Mobile Home / Other | 90 (81.8%) | 20 (18.2%) |
| Total | 605 (77.6%) | 175 (22.4%) |
Housing Structures by Number of Rooms in Carlton
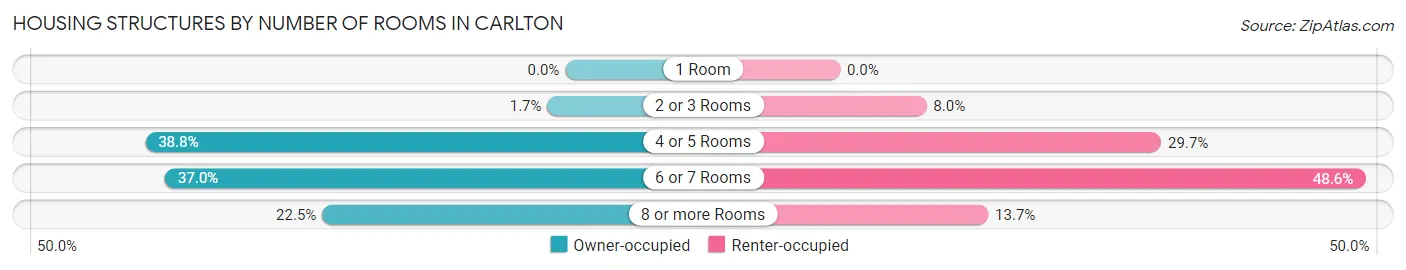
| Number of Rooms | Owner-occupied | Renter-occupied |
| 1 Room | 0 (0.0%) | 0 (0.0%) |
| 2 or 3 Rooms | 10 (1.7%) | 14 (8.0%) |
| 4 or 5 Rooms | 235 (38.8%) | 52 (29.7%) |
| 6 or 7 Rooms | 224 (37.0%) | 85 (48.6%) |
| 8 or more Rooms | 136 (22.5%) | 24 (13.7%) |
| Total | 605 (100.0%) | 175 (100.0%) |
Housing Structure by Heating Type in Carlton
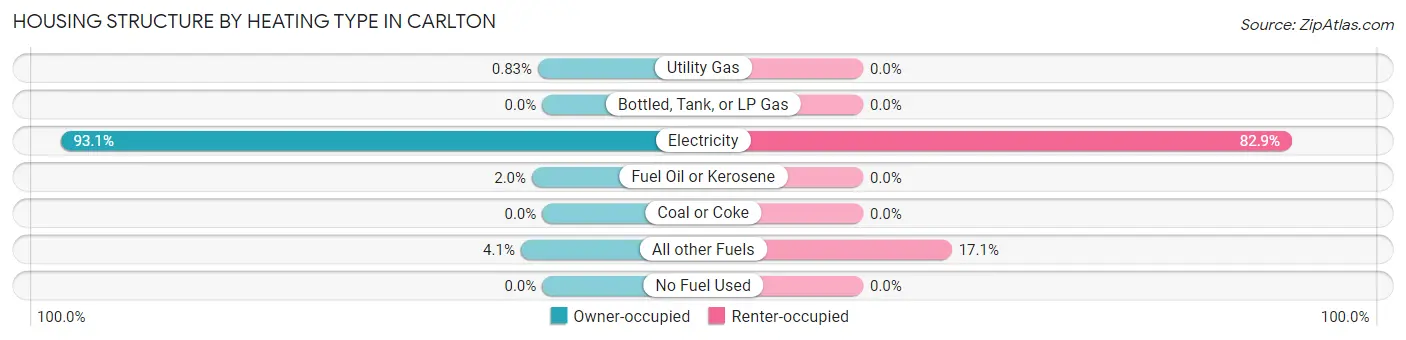
| Heating Type | Owner-occupied | Renter-occupied |
| Utility Gas | 5 (0.8%) | 0 (0.0%) |
| Bottled, Tank, or LP Gas | 0 (0.0%) | 0 (0.0%) |
| Electricity | 563 (93.1%) | 145 (82.9%) |
| Fuel Oil or Kerosene | 12 (2.0%) | 0 (0.0%) |
| Coal or Coke | 0 (0.0%) | 0 (0.0%) |
| All other Fuels | 25 (4.1%) | 30 (17.1%) |
| No Fuel Used | 0 (0.0%) | 0 (0.0%) |
| Total | 605 (100.0%) | 175 (100.0%) |
Household Vehicle Usage in Carlton
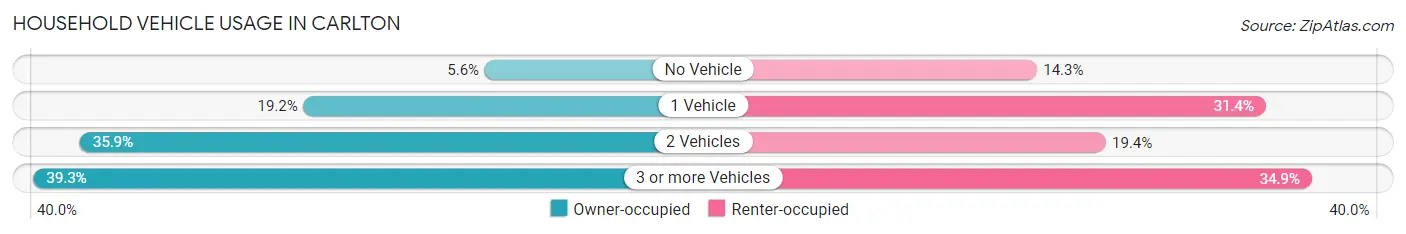
| Vehicles per Household | Owner-occupied | Renter-occupied |
| No Vehicle | 34 (5.6%) | 25 (14.3%) |
| 1 Vehicle | 116 (19.2%) | 55 (31.4%) |
| 2 Vehicles | 217 (35.9%) | 34 (19.4%) |
| 3 or more Vehicles | 238 (39.3%) | 61 (34.9%) |
| Total | 605 (100.0%) | 175 (100.0%) |
Real Estate & Mortgages in Carlton
Real Estate and Mortgage Overview in Carlton
| Characteristic | Without Mortgage | With Mortgage |
| Housing Units | 202 | 403 |
| Median Property Value | $268,300 | $419,100 |
| Median Household Income | $70,652 | $89 |
| Monthly Housing Costs | $812 | $27 |
| Real Estate Taxes | $2,545 | $11 |
Property Value by Mortgage Status in Carlton
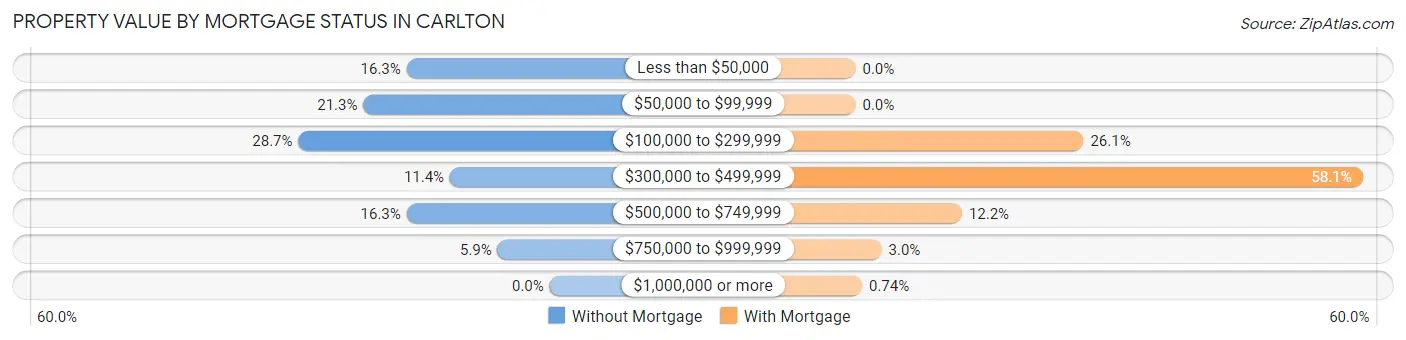
| Property Value | Without Mortgage | With Mortgage |
| Less than $50,000 | 33 (16.3%) | 0 (0.0%) |
| $50,000 to $99,999 | 43 (21.3%) | 0 (0.0%) |
| $100,000 to $299,999 | 58 (28.7%) | 105 (26.1%) |
| $300,000 to $499,999 | 23 (11.4%) | 234 (58.1%) |
| $500,000 to $749,999 | 33 (16.3%) | 49 (12.2%) |
| $750,000 to $999,999 | 12 (5.9%) | 12 (3.0%) |
| $1,000,000 or more | 0 (0.0%) | 3 (0.7%) |
| Total | 202 (100.0%) | 403 (100.0%) |
Household Income by Mortgage Status in Carlton
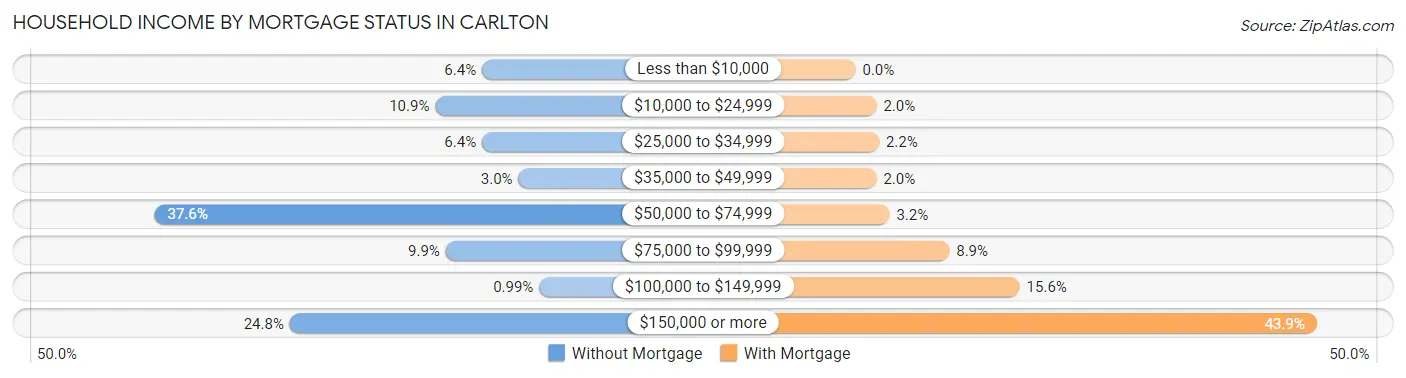
| Household Income | Without Mortgage | With Mortgage |
| Less than $10,000 | 13 (6.4%) | 0 (0.0%) |
| $10,000 to $24,999 | 22 (10.9%) | 8 (2.0%) |
| $25,000 to $34,999 | 13 (6.4%) | 9 (2.2%) |
| $35,000 to $49,999 | 6 (3.0%) | 8 (2.0%) |
| $50,000 to $74,999 | 76 (37.6%) | 13 (3.2%) |
| $75,000 to $99,999 | 20 (9.9%) | 36 (8.9%) |
| $100,000 to $149,999 | 2 (1.0%) | 63 (15.6%) |
| $150,000 or more | 50 (24.7%) | 177 (43.9%) |
| Total | 202 (100.0%) | 403 (100.0%) |
Property Value to Household Income Ratio in Carlton
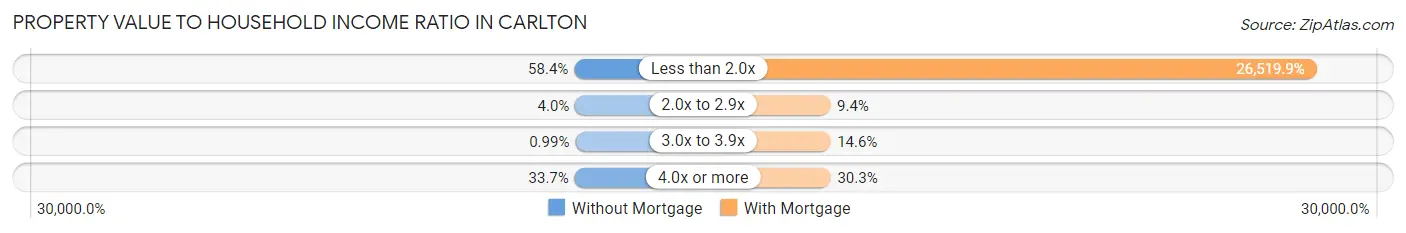
| Value-to-Income Ratio | Without Mortgage | With Mortgage |
| Less than 2.0x | 118 (58.4%) | 106,875 (26,519.9%) |
| 2.0x to 2.9x | 8 (4.0%) | 38 (9.4%) |
| 3.0x to 3.9x | 2 (1.0%) | 59 (14.6%) |
| 4.0x or more | 68 (33.7%) | 122 (30.3%) |
| Total | 202 (100.0%) | 403 (100.0%) |
Real Estate Taxes by Mortgage Status in Carlton
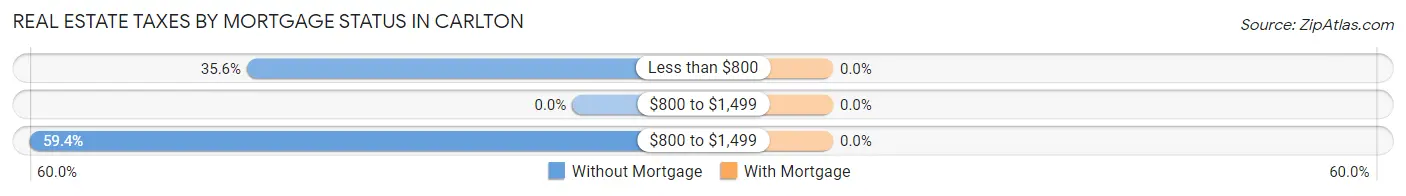
| Property Taxes | Without Mortgage | With Mortgage |
| Less than $800 | 72 (35.6%) | 0 (0.0%) |
| $800 to $1,499 | 0 (0.0%) | 0 (0.0%) |
| $800 to $1,499 | 120 (59.4%) | 0 (0.0%) |
| Total | 202 (100.0%) | 403 (100.0%) |
Health & Disability in Carlton
Health Insurance Coverage by Age in Carlton
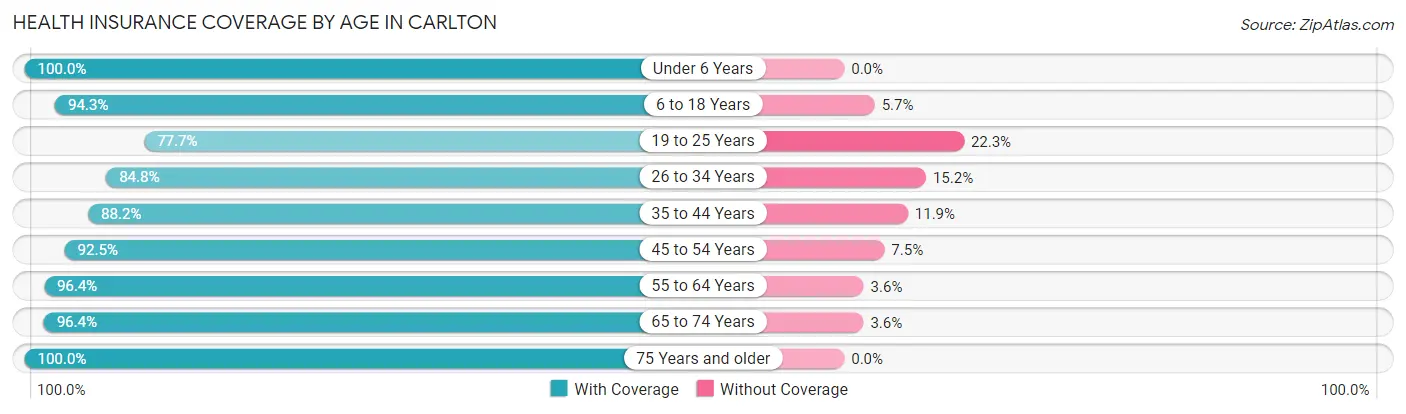
| Age Bracket | With Coverage | Without Coverage |
| Under 6 Years | 154 (100.0%) | 0 (0.0%) |
| 6 to 18 Years | 432 (94.3%) | 26 (5.7%) |
| 19 to 25 Years | 188 (77.7%) | 54 (22.3%) |
| 26 to 34 Years | 206 (84.8%) | 37 (15.2%) |
| 35 to 44 Years | 290 (88.1%) | 39 (11.8%) |
| 45 to 54 Years | 297 (92.5%) | 24 (7.5%) |
| 55 to 64 Years | 267 (96.4%) | 10 (3.6%) |
| 65 to 74 Years | 189 (96.4%) | 7 (3.6%) |
| 75 Years and older | 119 (100.0%) | 0 (0.0%) |
| Total | 2,142 (91.6%) | 197 (8.4%) |
Health Insurance Coverage by Citizenship Status in Carlton
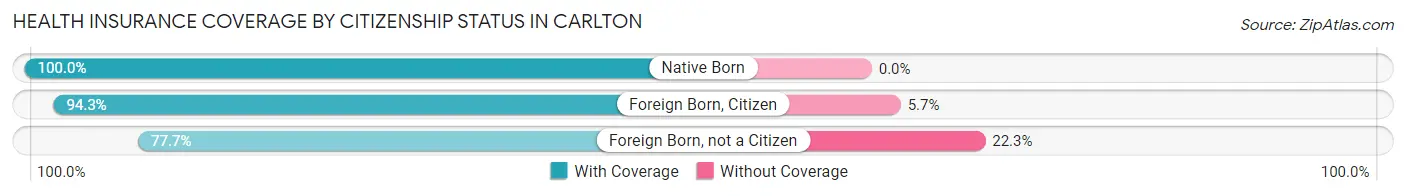
| Citizenship Status | With Coverage | Without Coverage |
| Native Born | 154 (100.0%) | 0 (0.0%) |
| Foreign Born, Citizen | 432 (94.3%) | 26 (5.7%) |
| Foreign Born, not a Citizen | 188 (77.7%) | 54 (22.3%) |
Health Insurance Coverage by Household Income in Carlton
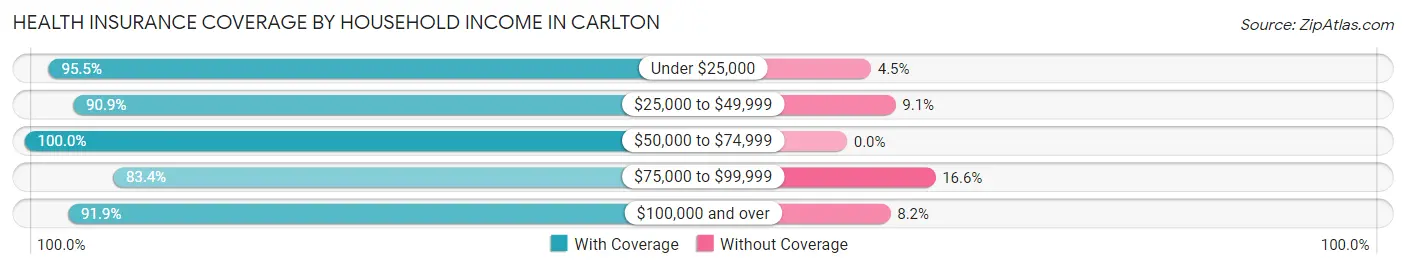
| Household Income | With Coverage | Without Coverage |
| Under $25,000 | 149 (95.5%) | 7 (4.5%) |
| $25,000 to $49,999 | 100 (90.9%) | 10 (9.1%) |
| $50,000 to $74,999 | 344 (100.0%) | 0 (0.0%) |
| $75,000 to $99,999 | 388 (83.4%) | 77 (16.6%) |
| $100,000 and over | 1,161 (91.8%) | 103 (8.2%) |
Public vs Private Health Insurance Coverage by Age in Carlton
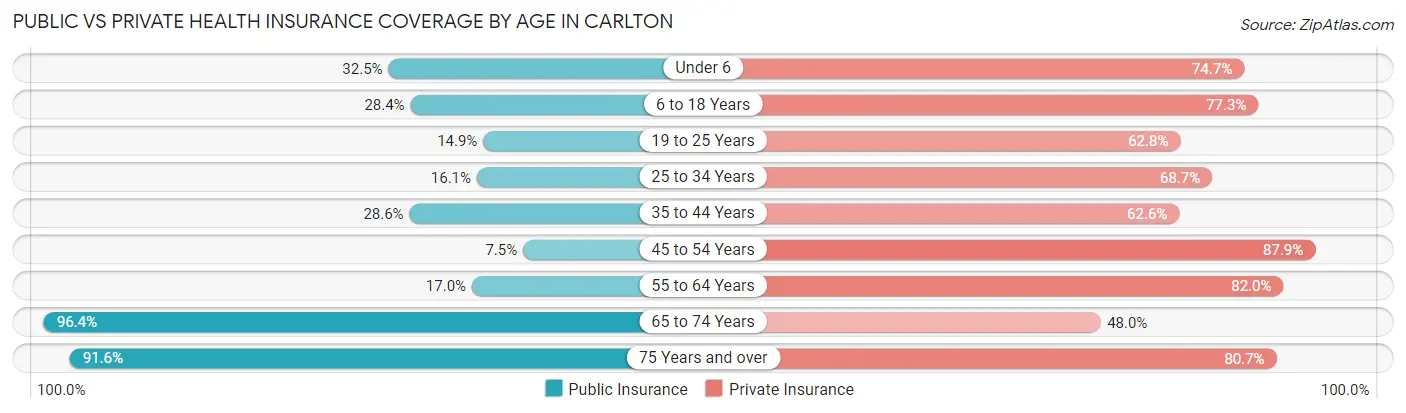
| Age Bracket | Public Insurance | Private Insurance |
| Under 6 | 50 (32.5%) | 115 (74.7%) |
| 6 to 18 Years | 130 (28.4%) | 354 (77.3%) |
| 19 to 25 Years | 36 (14.9%) | 152 (62.8%) |
| 25 to 34 Years | 39 (16.1%) | 167 (68.7%) |
| 35 to 44 Years | 94 (28.6%) | 206 (62.6%) |
| 45 to 54 Years | 24 (7.5%) | 282 (87.8%) |
| 55 to 64 Years | 47 (17.0%) | 227 (82.0%) |
| 65 to 74 Years | 189 (96.4%) | 94 (48.0%) |
| 75 Years and over | 109 (91.6%) | 96 (80.7%) |
| Total | 718 (30.7%) | 1,693 (72.4%) |
Disability Status by Sex by Age in Carlton
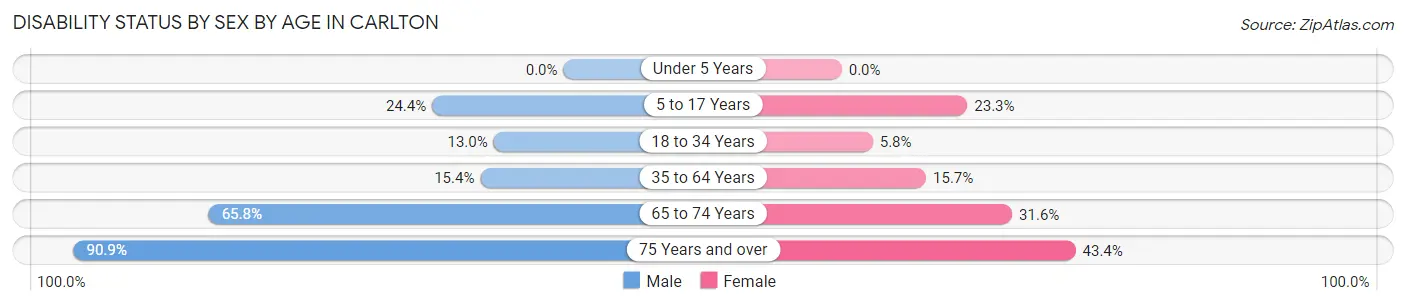
| Age Bracket | Male | Female |
| Under 5 Years | 0 (0.0%) | 0 (0.0%) |
| 5 to 17 Years | 48 (24.4%) | 62 (23.3%) |
| 18 to 34 Years | 35 (13.0%) | 13 (5.8%) |
| 35 to 64 Years | 75 (15.4%) | 69 (15.7%) |
| 65 to 74 Years | 52 (65.8%) | 37 (31.6%) |
| 75 Years and over | 60 (90.9%) | 23 (43.4%) |
Disability Class by Sex by Age in Carlton
Disability Class: Hearing Difficulty
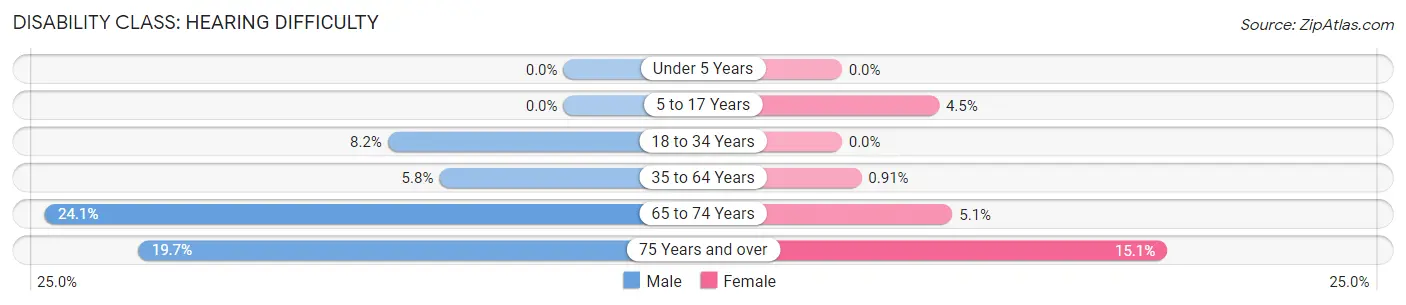
| Age Bracket | Male | Female |
| Under 5 Years | 0 (0.0%) | 0 (0.0%) |
| 5 to 17 Years | 0 (0.0%) | 12 (4.5%) |
| 18 to 34 Years | 22 (8.2%) | 0 (0.0%) |
| 35 to 64 Years | 28 (5.8%) | 4 (0.9%) |
| 65 to 74 Years | 19 (24.0%) | 6 (5.1%) |
| 75 Years and over | 13 (19.7%) | 8 (15.1%) |
Disability Class: Vision Difficulty
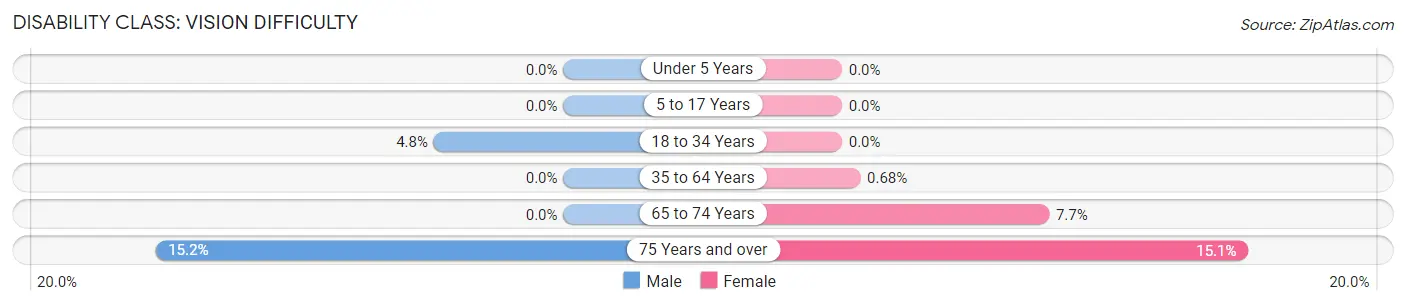
| Age Bracket | Male | Female |
| Under 5 Years | 0 (0.0%) | 0 (0.0%) |
| 5 to 17 Years | 0 (0.0%) | 0 (0.0%) |
| 18 to 34 Years | 13 (4.8%) | 0 (0.0%) |
| 35 to 64 Years | 0 (0.0%) | 3 (0.7%) |
| 65 to 74 Years | 0 (0.0%) | 9 (7.7%) |
| 75 Years and over | 10 (15.1%) | 8 (15.1%) |
Disability Class: Cognitive Difficulty
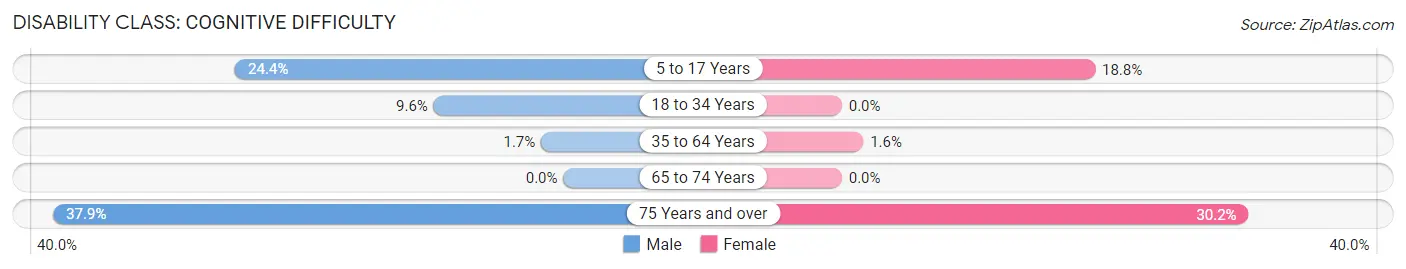
| Age Bracket | Male | Female |
| 5 to 17 Years | 48 (24.4%) | 50 (18.8%) |
| 18 to 34 Years | 26 (9.6%) | 0 (0.0%) |
| 35 to 64 Years | 8 (1.7%) | 7 (1.6%) |
| 65 to 74 Years | 0 (0.0%) | 0 (0.0%) |
| 75 Years and over | 25 (37.9%) | 16 (30.2%) |
Disability Class: Ambulatory Difficulty
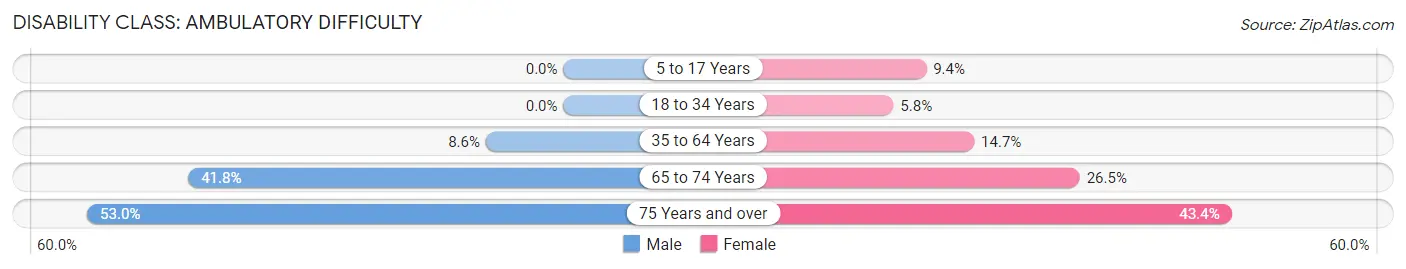
| Age Bracket | Male | Female |
| 5 to 17 Years | 0 (0.0%) | 25 (9.4%) |
| 18 to 34 Years | 0 (0.0%) | 13 (5.8%) |
| 35 to 64 Years | 42 (8.6%) | 65 (14.7%) |
| 65 to 74 Years | 33 (41.8%) | 31 (26.5%) |
| 75 Years and over | 35 (53.0%) | 23 (43.4%) |
Disability Class: Self-Care Difficulty
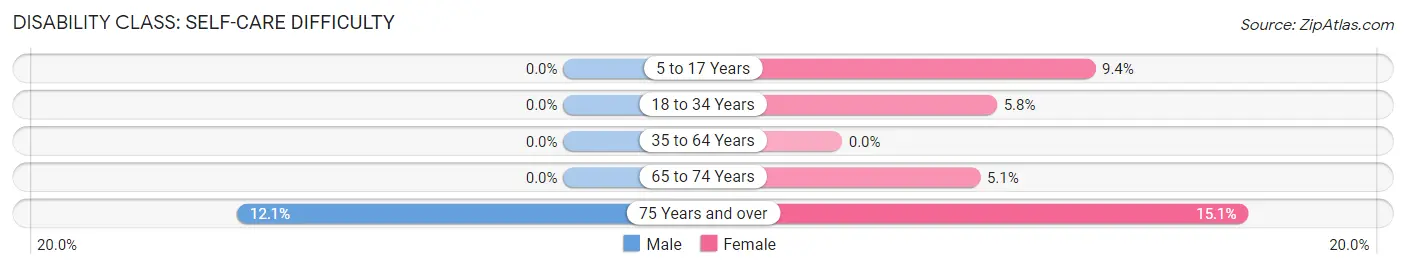
| Age Bracket | Male | Female |
| 5 to 17 Years | 0 (0.0%) | 25 (9.4%) |
| 18 to 34 Years | 0 (0.0%) | 13 (5.8%) |
| 35 to 64 Years | 0 (0.0%) | 0 (0.0%) |
| 65 to 74 Years | 0 (0.0%) | 6 (5.1%) |
| 75 Years and over | 8 (12.1%) | 8 (15.1%) |
Technology Access in Carlton
Computing Device Access in Carlton
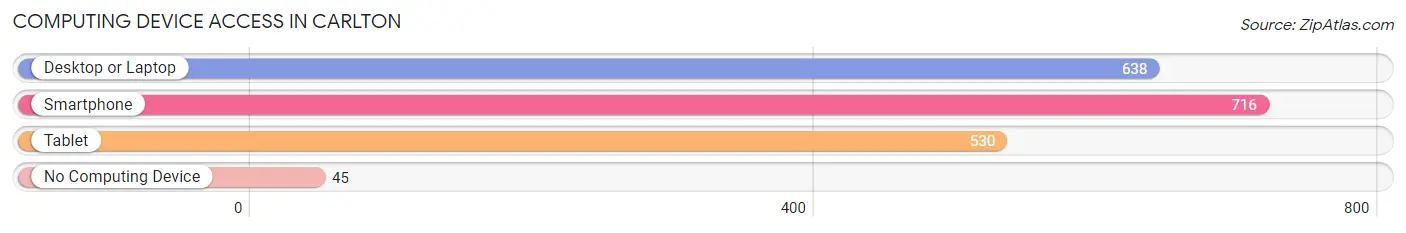
| Device Type | # Households | % Households |
| Desktop or Laptop | 638 | 81.8% |
| Smartphone | 716 | 91.8% |
| Tablet | 530 | 67.9% |
| No Computing Device | 45 | 5.8% |
| Total | 780 | 100.0% |
Internet Access in Carlton
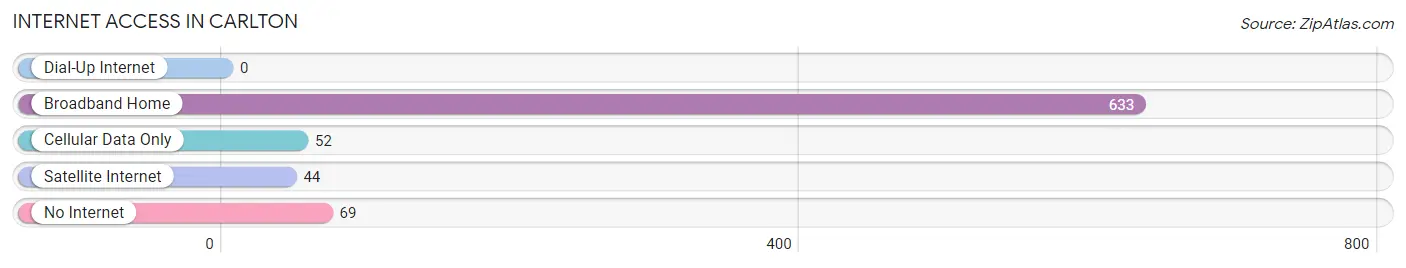
| Internet Type | # Households | % Households |
| Dial-Up Internet | 0 | 0.0% |
| Broadband Home | 633 | 81.1% |
| Cellular Data Only | 52 | 6.7% |
| Satellite Internet | 44 | 5.6% |
| No Internet | 69 | 8.8% |
| Total | 780 | 100.0% |
Carlton Summary
Carlton is a small city located in Yamhill County, Oregon, United States. It is situated in the northern part of the Willamette Valley, approximately 25 miles southwest of Portland. The city is part of the Portland metropolitan area and is home to a population of approximately 2,000 people.
History
The area that is now Carlton was first settled in the early 1850s by pioneers from the Oregon Trail. The first post office was established in 1858 and the town was officially incorporated in 1891. The city was named after Carlton, Massachusetts, the hometown of one of the early settlers.
In the early 1900s, the city was a major producer of hops, which were used to make beer. The hops industry declined in the 1920s, but the city continued to grow and develop. In the 1950s, the city was home to a large lumber mill, which provided employment for many of the city’s residents.
Geography
Carlton is located in the northern part of the Willamette Valley, approximately 25 miles southwest of Portland. The city is situated on the banks of the Yamhill River, which flows through the city. The city is surrounded by rolling hills and is home to several parks and recreational areas.
The climate in Carlton is mild and temperate, with warm summers and cool winters. The average annual temperature is around 50 degrees Fahrenheit. The city receives an average of 37 inches of precipitation per year.
Economy
The economy of Carlton is largely based on agriculture and tourism. The city is home to several wineries and vineyards, which attract visitors from all over the world. The city is also home to several small businesses, including restaurants, retail stores, and professional services.
The city is also home to a large lumber mill, which provides employment for many of the city’s residents. The city is also home to several manufacturing companies, which produce a variety of products, including furniture, clothing, and electronics.
Demographics
As of the 2010 census, the population of Carlton was 2,000 people. The racial makeup of the city was 94.2% White, 0.7% African American, 0.3% Native American, 0.7% Asian, 0.1% Pacific Islander, and 3.1% from other races. The median household income was $45,000 and the median family income was $50,000.
The city is home to a diverse population, with a variety of religious backgrounds. The largest religious group in the city is Christian, followed by Jewish, Buddhist, and Muslim.
Conclusion
Carlton is a small city located in Yamhill County, Oregon, United States. It is situated in the northern part of the Willamette Valley, approximately 25 miles southwest of Portland. The city is part of the Portland metropolitan area and is home to a population of approximately 2,000 people. The economy of Carlton is largely based on agriculture and tourism, and the city is home to several wineries and vineyards. The city is also home to a large lumber mill, which provides employment for many of the city’s residents. The city is home to a diverse population, with a variety of religious backgrounds.
Common Questions
What is Per Capita Income in Carlton?
Per Capita income in Carlton is $34,957.
What is the Median Family Income in Carlton?
Median Family Income in Carlton is $92,292.
What is the Median Household income in Carlton?
Median Household Income in Carlton is $92,500.
What is Income or Wage Gap in Carlton?
Income or Wage Gap in Carlton is 26.4%.
Women in Carlton earn 73.6 cents for every dollar earned by a man.
What is Inequality or Gini Index in Carlton?
Inequality or Gini Index in Carlton is 0.35.
What is the Total Population of Carlton?
Total Population of Carlton is 2,339.
What is the Total Male Population of Carlton?
Total Male Population of Carlton is 1,141.
What is the Total Female Population of Carlton?
Total Female Population of Carlton is 1,198.
What is the Ratio of Males per 100 Females in Carlton?
There are 95.24 Males per 100 Females in Carlton.
What is the Ratio of Females per 100 Males in Carlton?
There are 105.00 Females per 100 Males in Carlton.
What is the Median Population Age in Carlton?
Median Population Age in Carlton is 36.9 Years.
What is the Average Family Size in Carlton
Average Family Size in Carlton is 3.4 People.
What is the Average Household Size in Carlton
Average Household Size in Carlton is 3.0 People.
How Large is the Labor Force in Carlton?
There are 1,172 People in the Labor Forcein in Carlton.
What is the Percentage of People in the Labor Force in Carlton?
65.2% of People are in the Labor Force in Carlton.
What is the Unemployment Rate in Carlton?
Unemployment Rate in Carlton is 5.2%.