Burns, OR Map & Demographics
Burns Map
Burns Overview
$23,934
PER CAPITA INCOME
$46,394
AVG FAMILY INCOME
$41,374
AVG HOUSEHOLD INCOME
24.7%
WAGE / INCOME GAP [ % ]
75.3¢/ $1
WAGE / INCOME GAP [ $ ]
0.38
INEQUALITY / GINI INDEX
2,735
TOTAL POPULATION
1,349
MALE POPULATION
1,386
FEMALE POPULATION
97.33
MALES / 100 FEMALES
102.74
FEMALES / 100 MALES
43.5
MEDIAN AGE
2.7
AVG FAMILY SIZE
2.1
AVG HOUSEHOLD SIZE
1,276
LABOR FORCE [ PEOPLE ]
55.2%
PERCENT IN LABOR FORCE
6.6%
UNEMPLOYMENT RATE
Burns Zip Codes
Burns Area Codes
Income in Burns
Income Overview in Burns
Per Capita Income in Burns is $23,934, while median incomes of families and households are $46,394 and $41,374 respectively.
| Characteristic | Number | Measure |
| Per Capita Income | 2,735 | $23,934 |
| Median Family Income | 693 | $46,394 |
| Mean Family Income | 693 | $62,588 |
| Median Household Income | 1,241 | $41,374 |
| Mean Household Income | 1,241 | $53,300 |
| Income Deficit | 693 | $0 |
| Wage / Income Gap (%) | 2,735 | 24.73% |
| Wage / Income Gap ($) | 2,735 | 75.27¢ per $1 |
| Gini / Inequality Index | 2,735 | 0.38 |
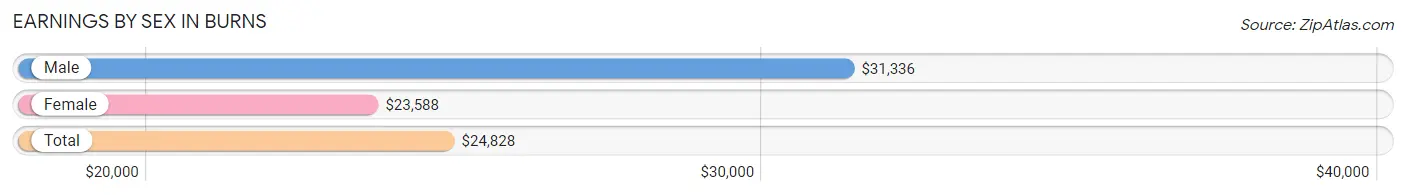
Earnings by Sex in Burns
Average Earnings in Burns are $24,828, $31,336 for men and $23,588 for women, a difference of 24.7%.
| Sex | Number | Average Earnings |
| Male | 687 (51.2%) | $31,336 |
| Female | 655 (48.8%) | $23,588 |
| Total | 1,342 (100.0%) | $24,828 |
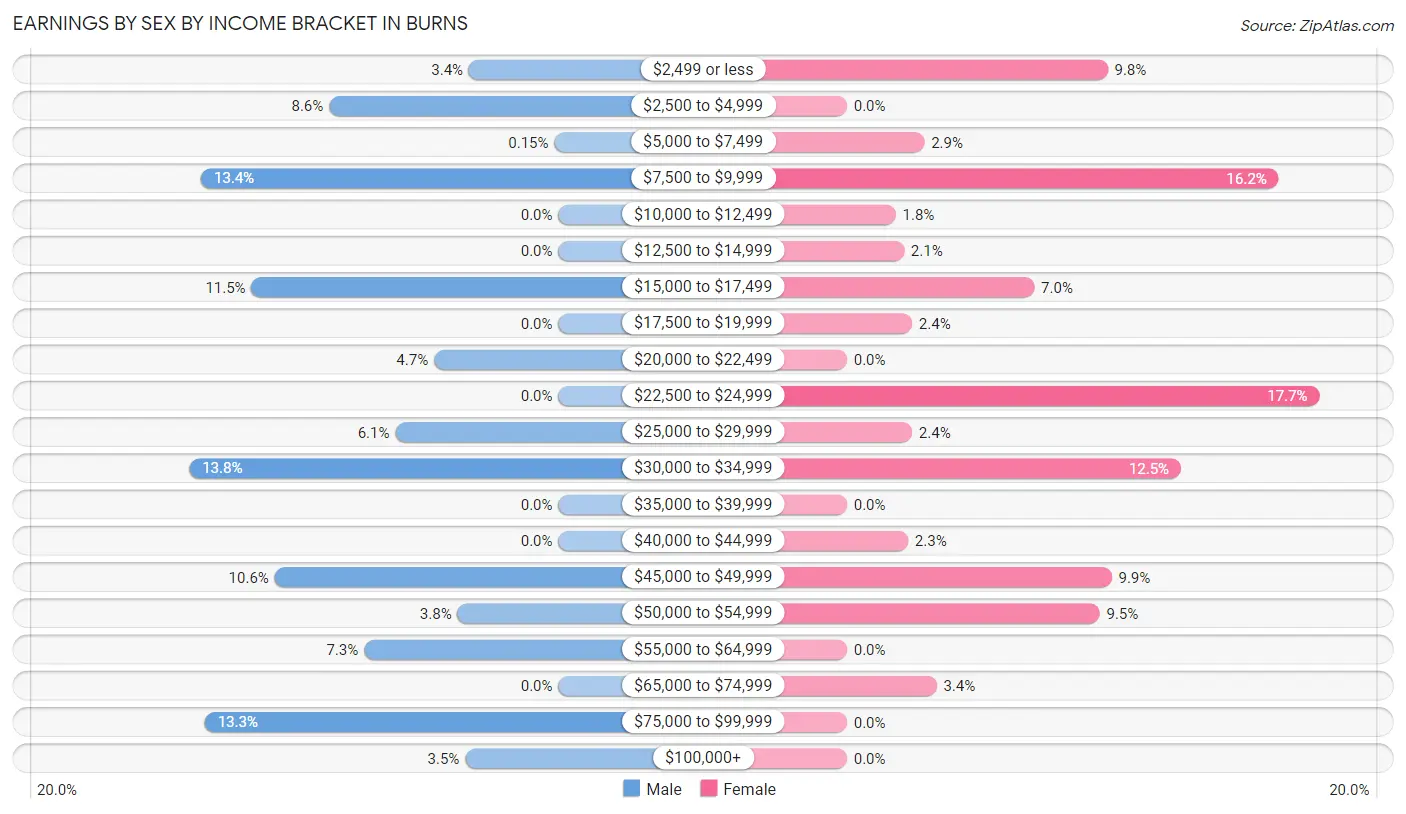
Earnings by Sex by Income Bracket in Burns
The most common earnings brackets in Burns are $30,000 to $34,999 for men (95 | 13.8%) and $22,500 to $24,999 for women (116 | 17.7%).
| Income | Male | Female |
| $2,499 or less | 23 (3.4%) | 64 (9.8%) |
| $2,500 to $4,999 | 59 (8.6%) | 0 (0.0%) |
| $5,000 to $7,499 | 1 (0.2%) | 19 (2.9%) |
| $7,500 to $9,999 | 92 (13.4%) | 106 (16.2%) |
| $10,000 to $12,499 | 0 (0.0%) | 12 (1.8%) |
| $12,500 to $14,999 | 0 (0.0%) | 14 (2.1%) |
| $15,000 to $17,499 | 79 (11.5%) | 46 (7.0%) |
| $17,500 to $19,999 | 0 (0.0%) | 16 (2.4%) |
| $20,000 to $22,499 | 32 (4.7%) | 0 (0.0%) |
| $22,500 to $24,999 | 0 (0.0%) | 116 (17.7%) |
| $25,000 to $29,999 | 42 (6.1%) | 16 (2.4%) |
| $30,000 to $34,999 | 95 (13.8%) | 82 (12.5%) |
| $35,000 to $39,999 | 0 (0.0%) | 0 (0.0%) |
| $40,000 to $44,999 | 0 (0.0%) | 15 (2.3%) |
| $45,000 to $49,999 | 73 (10.6%) | 65 (9.9%) |
| $50,000 to $54,999 | 26 (3.8%) | 62 (9.5%) |
| $55,000 to $64,999 | 50 (7.3%) | 0 (0.0%) |
| $65,000 to $74,999 | 0 (0.0%) | 22 (3.4%) |
| $75,000 to $99,999 | 91 (13.3%) | 0 (0.0%) |
| $100,000+ | 24 (3.5%) | 0 (0.0%) |
| Total | 687 (100.0%) | 655 (100.0%) |
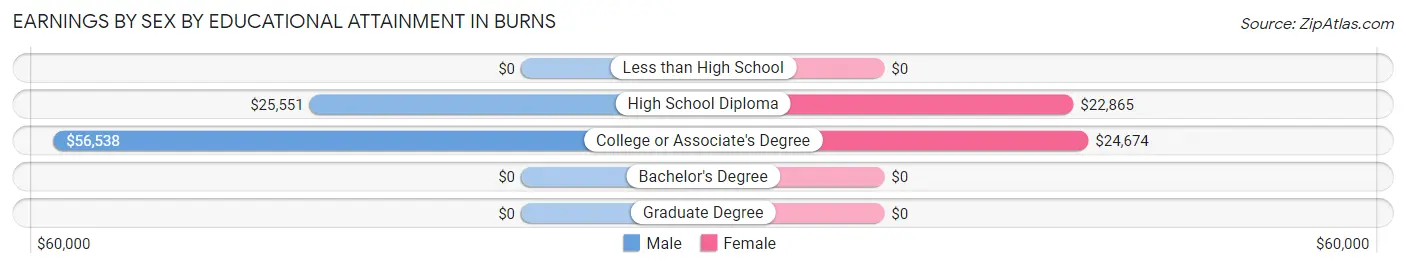
Earnings by Sex by Educational Attainment in Burns
Average earnings in Burns are $32,885 for men and $24,504 for women, a difference of 25.5%. Men with an educational attainment of college or associate's degree enjoy the highest average annual earnings of $56,538, while those with high school diploma education earn the least with $25,551. Women with an educational attainment of college or associate's degree earn the most with the average annual earnings of $24,674, while those with high school diploma education have the smallest earnings of $22,865.
| Educational Attainment | Male Income | Female Income |
| Less than High School | - | - |
| High School Diploma | $25,551 | $22,865 |
| College or Associate's Degree | $56,538 | $24,674 |
| Bachelor's Degree | - | - |
| Graduate Degree | - | - |
| Total | $32,885 | $24,504 |
Family Income in Burns
Family Income Brackets in Burns
According to the Burns family income data, there are 157 families falling into the $25,000 to $34,999 income range, which is the most common income bracket and makes up 22.7% of all families.
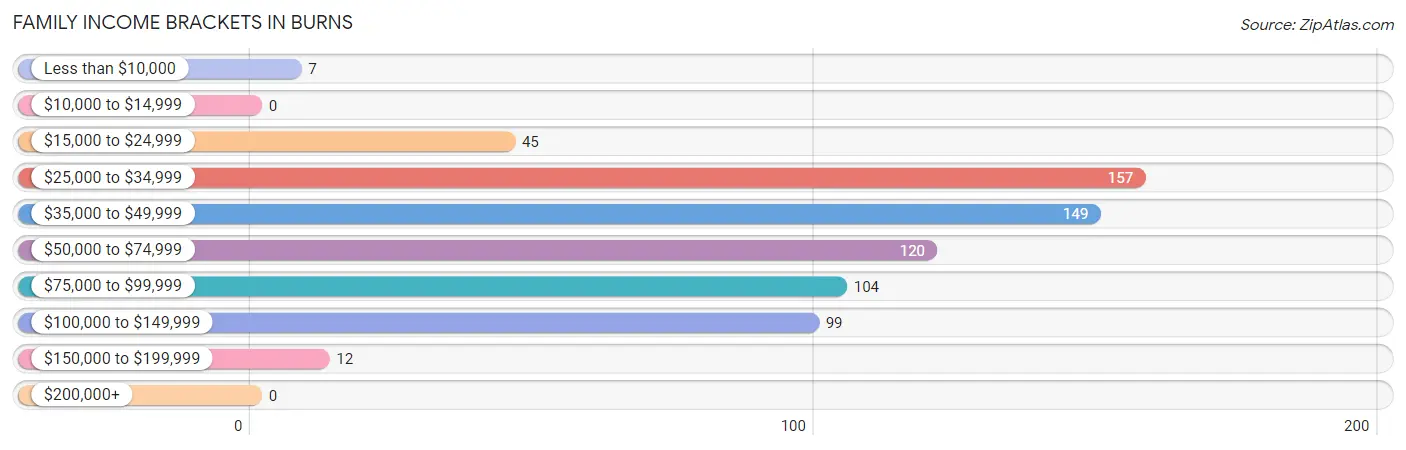
| Income Bracket | # Families | % Families |
| Less than $10,000 | 7 | 1.0% |
| $10,000 to $14,999 | 0 | 0.0% |
| $15,000 to $24,999 | 45 | 6.5% |
| $25,000 to $34,999 | 157 | 22.7% |
| $35,000 to $49,999 | 149 | 21.5% |
| $50,000 to $74,999 | 120 | 17.3% |
| $75,000 to $99,999 | 104 | 15.0% |
| $100,000 to $149,999 | 99 | 14.3% |
| $150,000 to $199,999 | 12 | 1.7% |
| $200,000+ | 0 | 0.0% |
Family Income by Famaliy Size in Burns
5-person families (58 | 8.4%) account for the highest median family income in Burns with $78,750 per family, while 2-person families (469 | 67.7%) have the highest median income of $21,119 per family member.
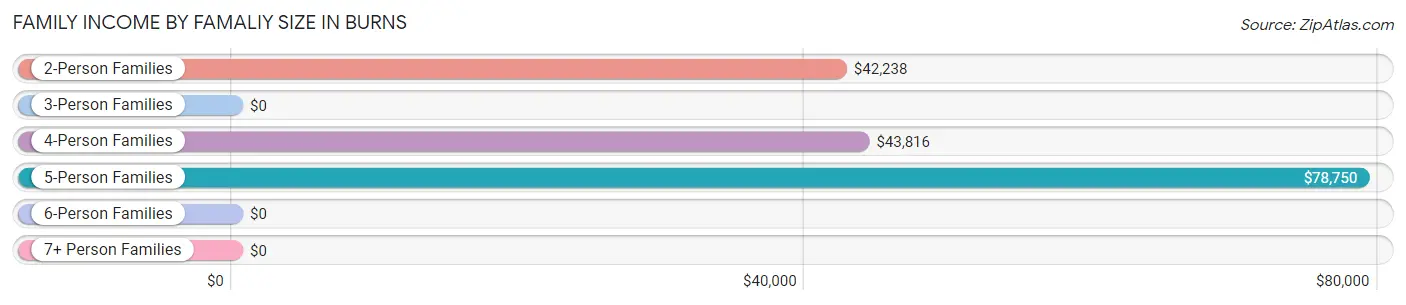
| Income Bracket | # Families | Median Income |
| 2-Person Families | 469 (67.7%) | $42,238 |
| 3-Person Families | 67 (9.7%) | $0 |
| 4-Person Families | 56 (8.1%) | $43,816 |
| 5-Person Families | 58 (8.4%) | $78,750 |
| 6-Person Families | 43 (6.2%) | $0 |
| 7+ Person Families | 0 (0.0%) | $0 |
| Total | 693 (100.0%) | $46,394 |
Family Income by Number of Earners in Burns
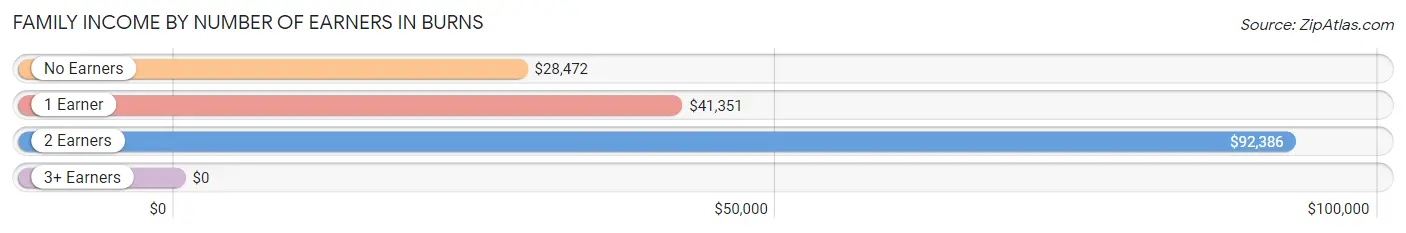
| Number of Earners | # Families | Median Income |
| No Earners | 104 (15.0%) | $28,472 |
| 1 Earner | 309 (44.6%) | $41,351 |
| 2 Earners | 275 (39.7%) | $92,386 |
| 3+ Earners | 5 (0.7%) | $0 |
| Total | 693 (100.0%) | $46,394 |
Household Income in Burns
Household Income Brackets in Burns
With 271 households falling in the category, the $25,000 to $34,999 income range is the most frequent in Burns, accounting for 21.8% of all households.
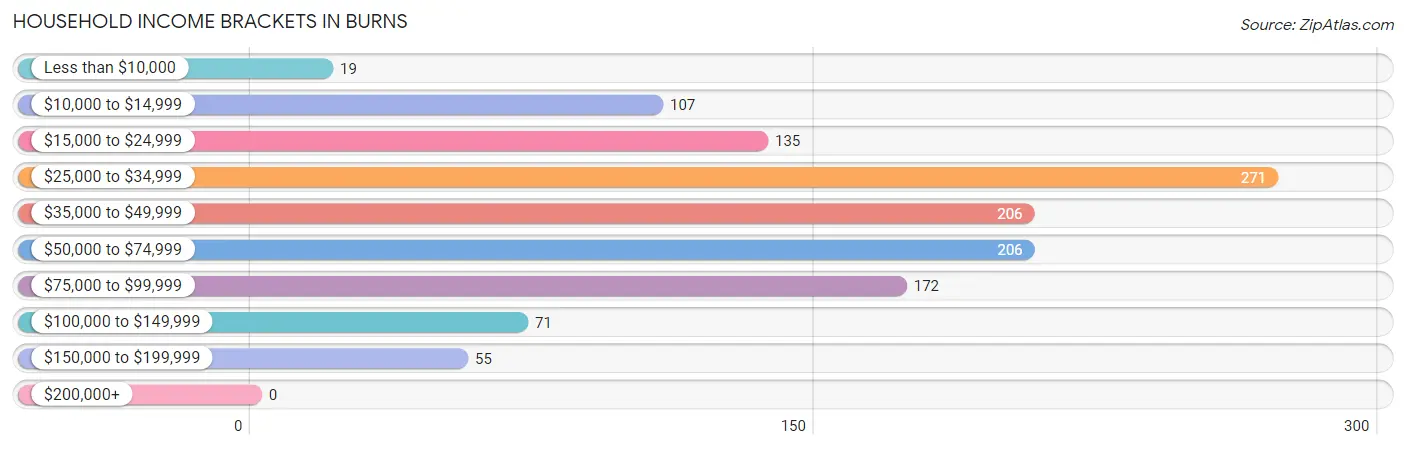
| Income Bracket | # Households | % Households |
| Less than $10,000 | 19 | 1.5% |
| $10,000 to $14,999 | 107 | 8.6% |
| $15,000 to $24,999 | 135 | 10.9% |
| $25,000 to $34,999 | 271 | 21.8% |
| $35,000 to $49,999 | 206 | 16.6% |
| $50,000 to $74,999 | 206 | 16.6% |
| $75,000 to $99,999 | 172 | 13.9% |
| $100,000 to $149,999 | 71 | 5.7% |
| $150,000 to $199,999 | 55 | 4.4% |
| $200,000+ | 0 | 0.0% |
Household Income by Householder Age in Burns
The median household income in Burns is $41,374, with the highest median household income of $50,241 found in the 25 to 44 years age bracket for the primary householder. A total of 393 households (31.7%) fall into this category.
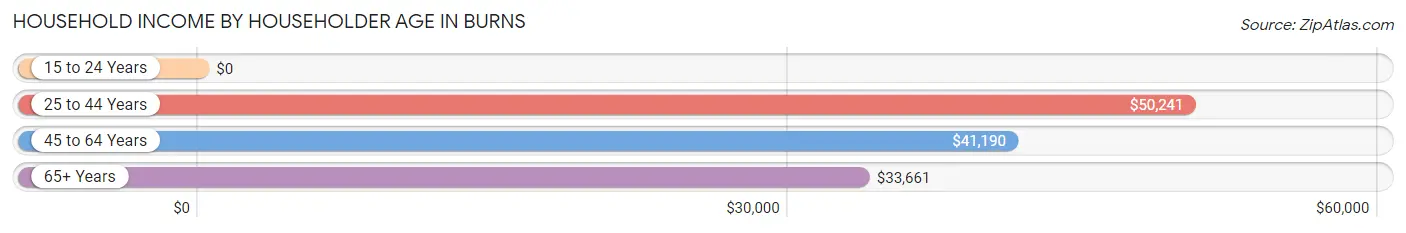
| Income Bracket | # Households | Median Income |
| 15 to 24 Years | 0 (0.0%) | $0 |
| 25 to 44 Years | 393 (31.7%) | $50,241 |
| 45 to 64 Years | 473 (38.1%) | $41,190 |
| 65+ Years | 375 (30.2%) | $33,661 |
| Total | 1,241 (100.0%) | $41,374 |
Poverty in Burns
Income Below Poverty by Sex and Age in Burns
With 18.6% poverty level for males and 7.3% for females among the residents of Burns, 16 and 17 year old males and 16 and 17 year old females are the most vulnerable to poverty, with 11 males (57.9%) and 7 females (53.8%) in their respective age groups living below the poverty level.
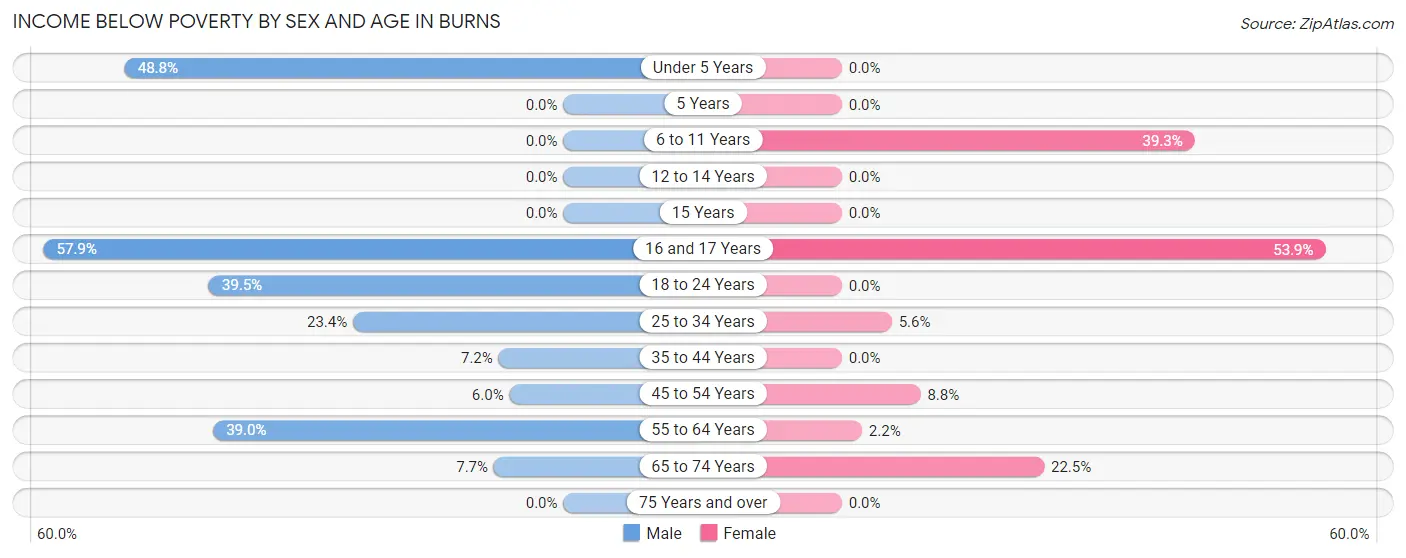
| Age Bracket | Male | Female |
| Under 5 Years | 21 (48.8%) | 0 (0.0%) |
| 5 Years | 0 (0.0%) | 0 (0.0%) |
| 6 to 11 Years | 0 (0.0%) | 11 (39.3%) |
| 12 to 14 Years | 0 (0.0%) | 0 (0.0%) |
| 15 Years | 0 (0.0%) | 0 (0.0%) |
| 16 and 17 Years | 11 (57.9%) | 7 (53.8%) |
| 18 to 24 Years | 45 (39.5%) | 0 (0.0%) |
| 25 to 34 Years | 37 (23.4%) | 13 (5.6%) |
| 35 to 44 Years | 15 (7.2%) | 0 (0.0%) |
| 45 to 54 Years | 6 (6.0%) | 12 (8.8%) |
| 55 to 64 Years | 85 (39.0%) | 7 (2.2%) |
| 65 to 74 Years | 12 (7.7%) | 50 (22.5%) |
| 75 Years and over | 0 (0.0%) | 0 (0.0%) |
| Total | 232 (18.6%) | 100 (7.3%) |
Income Above Poverty by Sex and Age in Burns
According to the poverty statistics in Burns, males aged 6 to 11 years and females aged under 5 years are the age groups that are most secure financially, with 100.0% of males and 100.0% of females in these age groups living above the poverty line.
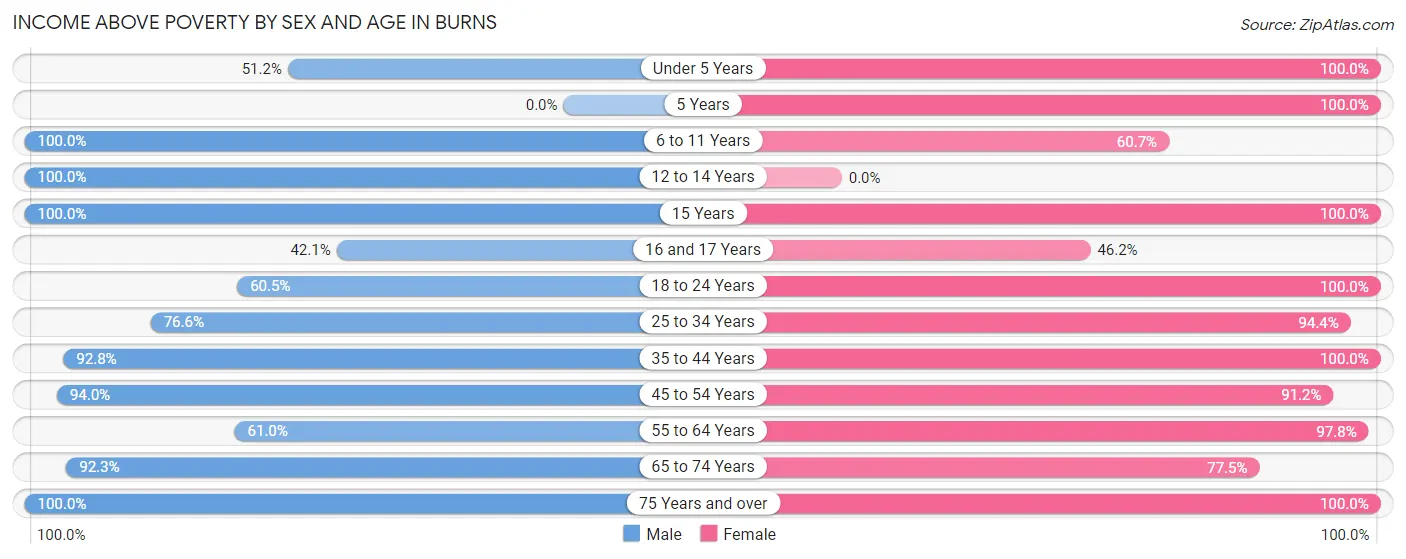
| Age Bracket | Male | Female |
| Under 5 Years | 22 (51.2%) | 69 (100.0%) |
| 5 Years | 0 (0.0%) | 41 (100.0%) |
| 6 to 11 Years | 131 (100.0%) | 17 (60.7%) |
| 12 to 14 Years | 15 (100.0%) | 0 (0.0%) |
| 15 Years | 13 (100.0%) | 22 (100.0%) |
| 16 and 17 Years | 8 (42.1%) | 6 (46.2%) |
| 18 to 24 Years | 69 (60.5%) | 85 (100.0%) |
| 25 to 34 Years | 121 (76.6%) | 221 (94.4%) |
| 35 to 44 Years | 193 (92.8%) | 81 (100.0%) |
| 45 to 54 Years | 94 (94.0%) | 125 (91.2%) |
| 55 to 64 Years | 133 (61.0%) | 306 (97.8%) |
| 65 to 74 Years | 143 (92.3%) | 172 (77.5%) |
| 75 Years and over | 74 (100.0%) | 117 (100.0%) |
| Total | 1,016 (81.4%) | 1,262 (92.7%) |
Income Below Poverty Among Married-Couple Families in Burns
The poverty statistics for married-couple families in Burns show that 3.4% or 15 of the total 440 families live below the poverty line. Families with 1 or 2 children have the highest poverty rate of 26.3%, comprising of 15 families. On the other hand, families with no children have the lowest poverty rate of 0.0%, which includes 0 families.
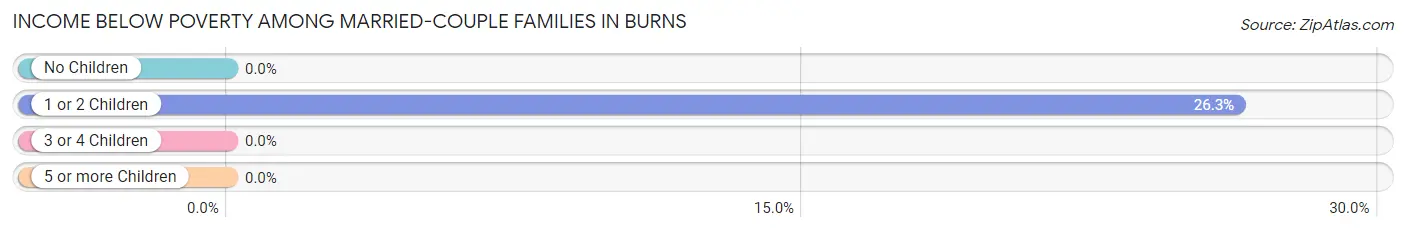
| Children | Above Poverty | Below Poverty |
| No Children | 287 (100.0%) | 0 (0.0%) |
| 1 or 2 Children | 42 (73.7%) | 15 (26.3%) |
| 3 or 4 Children | 96 (100.0%) | 0 (0.0%) |
| 5 or more Children | 0 (0.0%) | 0 (0.0%) |
| Total | 425 (96.6%) | 15 (3.4%) |
Income Below Poverty Among Single-Parent Households in Burns
| Children | Single Father | Single Mother |
| No Children | 0 (0.0%) | 0 (0.0%) |
| 1 or 2 Children | 0 (0.0%) | 0 (0.0%) |
| 3 or 4 Children | 0 (0.0%) | 0 (0.0%) |
| 5 or more Children | 0 (0.0%) | 0 (0.0%) |
| Total | 0 (0.0%) | 0 (0.0%) |
Income Below Poverty Among Married-Couple vs Single-Parent Households in Burns
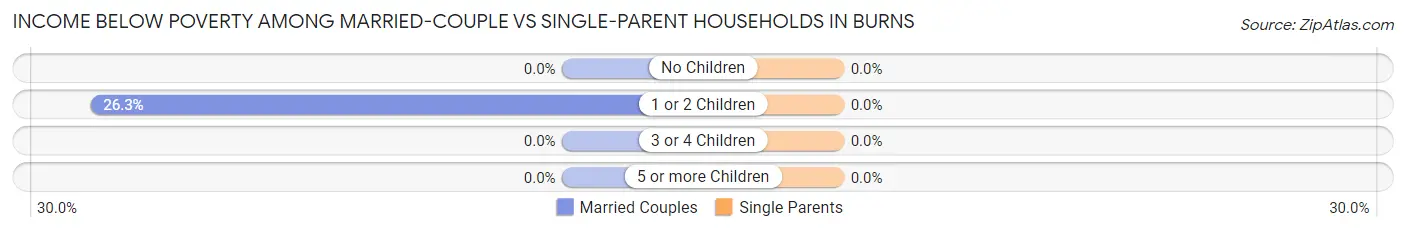
| Children | Married-Couple Families | Single-Parent Households |
| No Children | 0 (0.0%) | 0 (0.0%) |
| 1 or 2 Children | 15 (26.3%) | 0 (0.0%) |
| 3 or 4 Children | 0 (0.0%) | 0 (0.0%) |
| 5 or more Children | 0 (0.0%) | 0 (0.0%) |
| Total | 15 (3.4%) | 0 (0.0%) |
Race in Burns
The most populous races in Burns are White / Caucasian (2,646 | 96.8%), Hispanic or Latino (143 | 5.2%), and Two or more Races (63 | 2.3%).
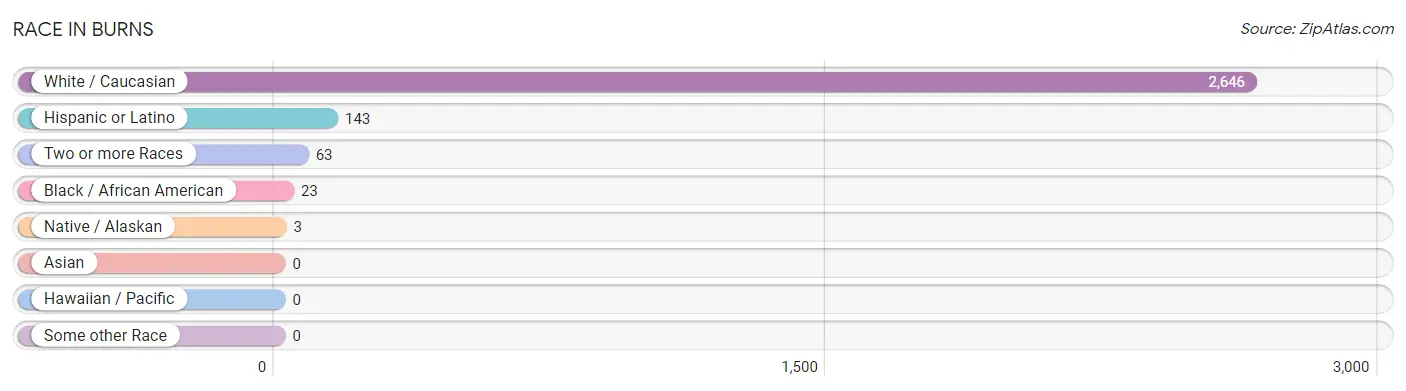
| Race | # Population | % Population |
| Asian | 0 | 0.0% |
| Black / African American | 23 | 0.8% |
| Hawaiian / Pacific | 0 | 0.0% |
| Hispanic or Latino | 143 | 5.2% |
| Native / Alaskan | 3 | 0.1% |
| White / Caucasian | 2,646 | 96.8% |
| Two or more Races | 63 | 2.3% |
| Some other Race | 0 | 0.0% |
| Total | 2,735 | 100.0% |
Ancestry in Burns
The most populous ancestries reported in Burns are German (640 | 23.4%), Irish (349 | 12.8%), American (224 | 8.2%), English (206 | 7.5%), and Spaniard (128 | 4.7%), together accounting for 56.6% of all Burns residents.
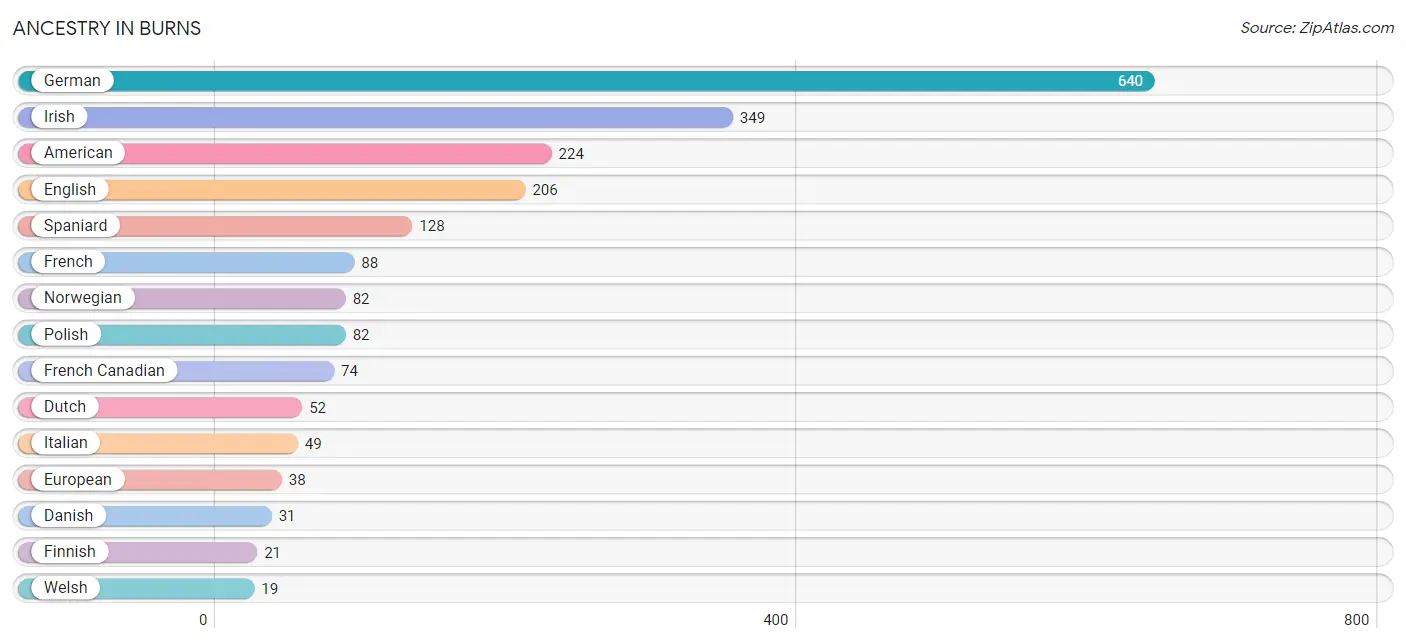
| Ancestry | # Population | % Population |
| African | 17 | 0.6% |
| American | 224 | 8.2% |
| Basque | 15 | 0.5% |
| Bhutanese | 11 | 0.4% |
| Blackfeet | 6 | 0.2% |
| Cherokee | 1 | 0.0% |
| Danish | 31 | 1.1% |
| Dutch | 52 | 1.9% |
| English | 206 | 7.5% |
| European | 38 | 1.4% |
| Finnish | 21 | 0.8% |
| French | 88 | 3.2% |
| French Canadian | 74 | 2.7% |
| German | 640 | 23.4% |
| Irish | 349 | 12.8% |
| Italian | 49 | 1.8% |
| Mexican | 8 | 0.3% |
| Norwegian | 82 | 3.0% |
| Paiute | 3 | 0.1% |
| Polish | 82 | 3.0% |
| Russian | 13 | 0.5% |
| Scandinavian | 12 | 0.4% |
| Scottish | 11 | 0.4% |
| Spaniard | 128 | 4.7% |
| Spanish | 7 | 0.3% |
| Subsaharan African | 17 | 0.6% |
| Swedish | 9 | 0.3% |
| Welsh | 19 | 0.7% | View All 28 Rows |
Immigrants in Burns
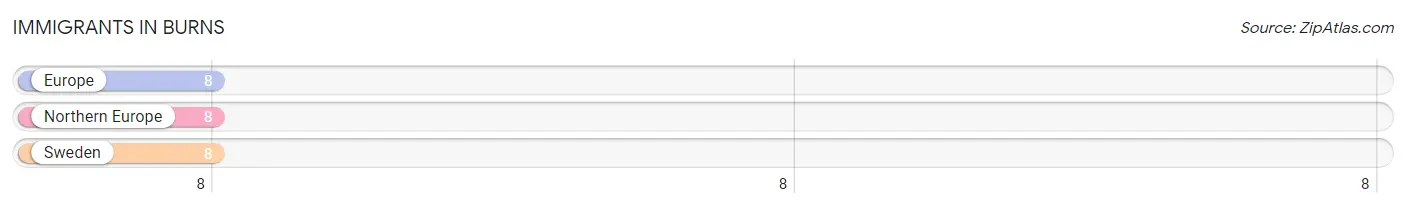
The most numerous immigrant groups reported in Burns came from Europe (8 | 0.3%), Northern Europe (8 | 0.3%), and Sweden (8 | 0.3%), together accounting for 0.9% of all Burns residents.
| Immigration Origin | # Population | % Population |
| Europe | 8 | 0.3% |
| Northern Europe | 8 | 0.3% |
| Sweden | 8 | 0.3% | View All 3 Rows |
Sex and Age in Burns
Sex and Age in Burns
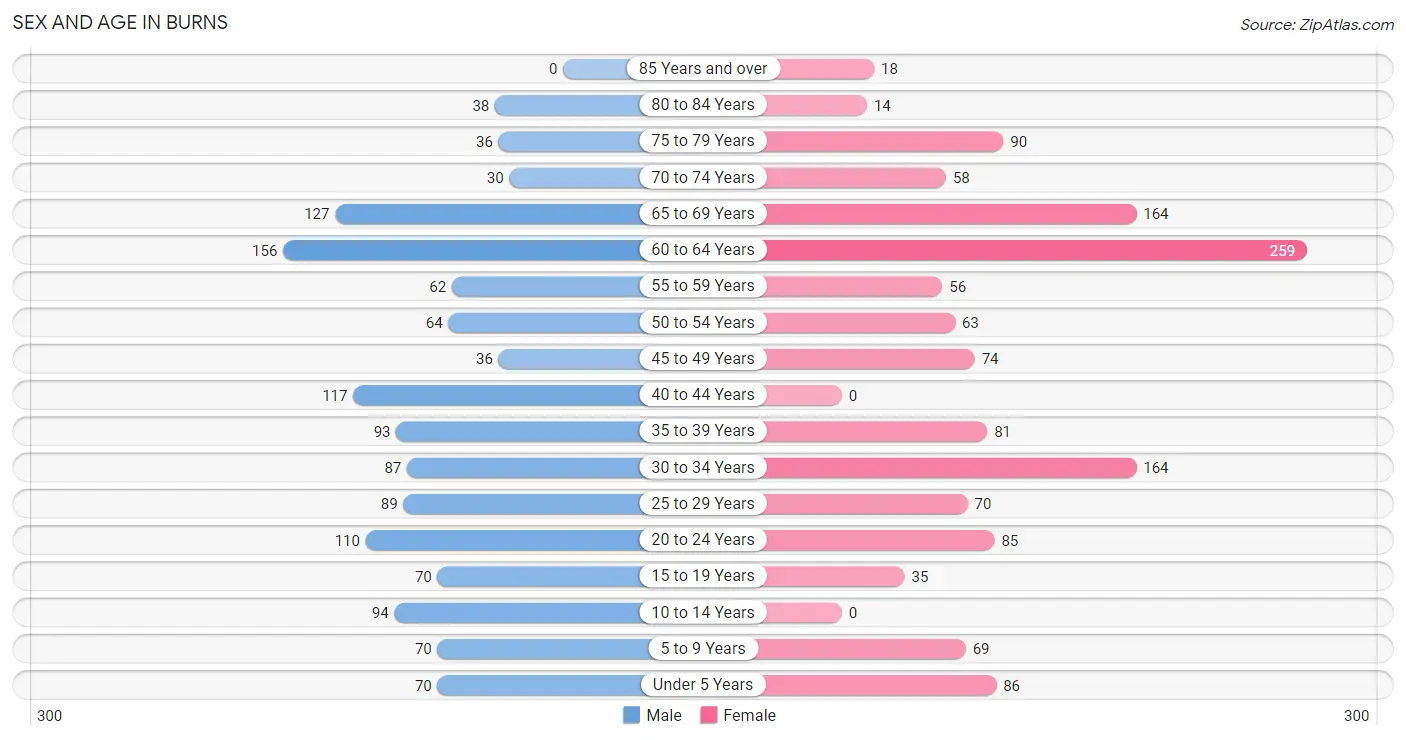
The most populous age groups in Burns are 60 to 64 Years (156 | 11.6%) for men and 60 to 64 Years (259 | 18.7%) for women.
| Age Bracket | Male | Female |
| Under 5 Years | 70 (5.2%) | 86 (6.2%) |
| 5 to 9 Years | 70 (5.2%) | 69 (5.0%) |
| 10 to 14 Years | 94 (7.0%) | 0 (0.0%) |
| 15 to 19 Years | 70 (5.2%) | 35 (2.5%) |
| 20 to 24 Years | 110 (8.2%) | 85 (6.1%) |
| 25 to 29 Years | 89 (6.6%) | 70 (5.1%) |
| 30 to 34 Years | 87 (6.5%) | 164 (11.8%) |
| 35 to 39 Years | 93 (6.9%) | 81 (5.8%) |
| 40 to 44 Years | 117 (8.7%) | 0 (0.0%) |
| 45 to 49 Years | 36 (2.7%) | 74 (5.3%) |
| 50 to 54 Years | 64 (4.7%) | 63 (4.5%) |
| 55 to 59 Years | 62 (4.6%) | 56 (4.0%) |
| 60 to 64 Years | 156 (11.6%) | 259 (18.7%) |
| 65 to 69 Years | 127 (9.4%) | 164 (11.8%) |
| 70 to 74 Years | 30 (2.2%) | 58 (4.2%) |
| 75 to 79 Years | 36 (2.7%) | 90 (6.5%) |
| 80 to 84 Years | 38 (2.8%) | 14 (1.0%) |
| 85 Years and over | 0 (0.0%) | 18 (1.3%) |
| Total | 1,349 (100.0%) | 1,386 (100.0%) |
Families and Households in Burns
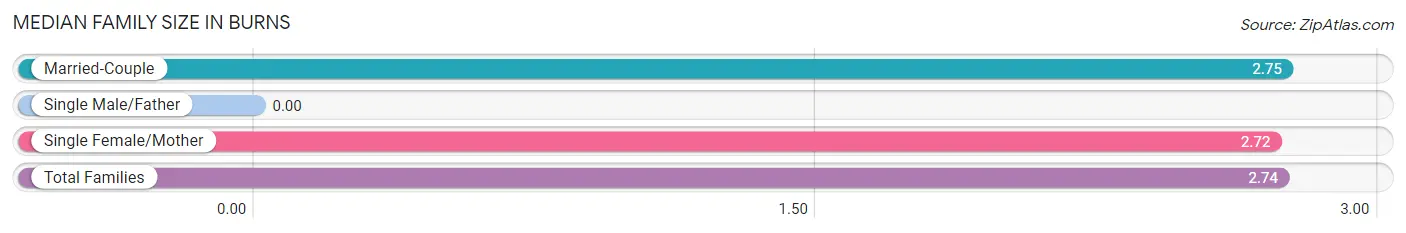
Median Family Size in Burns
| Family Type | # Families | Family Size |
| Married-Couple | 440 (63.5%) | 2.75 |
| Single Male/Father | 0 (0.0%) | - |
| Single Female/Mother | 253 (36.5%) | 2.72 |
| Total Families | 693 (100.0%) | 2.74 |
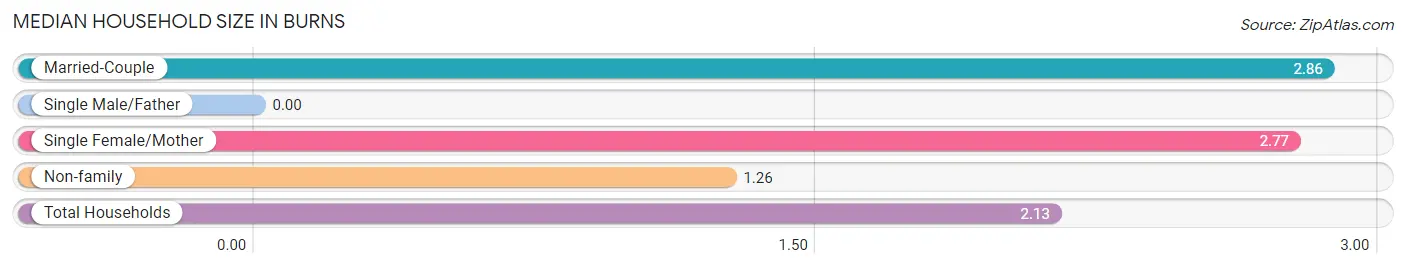
Median Household Size in Burns
| Household Type | # Households | Household Size |
| Married-Couple | 440 (35.5%) | 2.86 |
| Single Male/Father | 0 (0.0%) | - |
| Single Female/Mother | 253 (20.4%) | 2.77 |
| Non-family | 548 (44.2%) | 1.26 |
| Total Households | 1,241 (100.0%) | 2.13 |
Household Size by Marriage Status in Burns
Out of a total of 1,241 households in Burns, 693 (55.8%) are family households, while 548 (44.2%) are nonfamily households. The most numerous type of family households are 2-person households, comprising 469, and the most common type of nonfamily households are 1-person households, comprising 461.
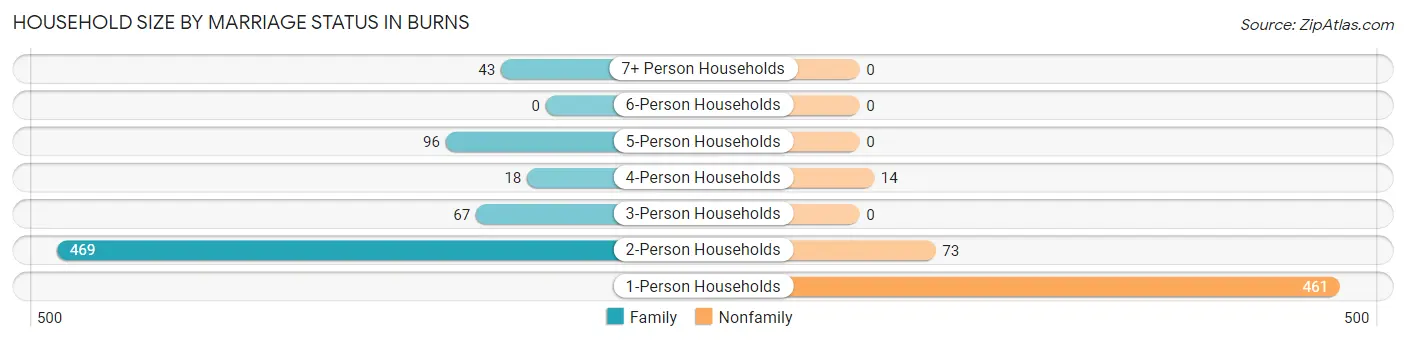
| Household Size | Family Households | Nonfamily Households |
| 1-Person Households | - | 461 (37.1%) |
| 2-Person Households | 469 (37.8%) | 73 (5.9%) |
| 3-Person Households | 67 (5.4%) | 0 (0.0%) |
| 4-Person Households | 18 (1.5%) | 14 (1.1%) |
| 5-Person Households | 96 (7.7%) | 0 (0.0%) |
| 6-Person Households | 0 (0.0%) | 0 (0.0%) |
| 7+ Person Households | 43 (3.5%) | 0 (0.0%) |
| Total | 693 (55.8%) | 548 (44.2%) |
Female Fertility in Burns
Fertility by Age in Burns
Average fertility rate in Burns is 15.0 births per 1,000 women. Women in the age bracket of 20 to 34 years have the highest fertility rate with 25.0 births per 1,000 women. Women in the age bracket of 20 to 34 years acount for 100.0% of all women with births.
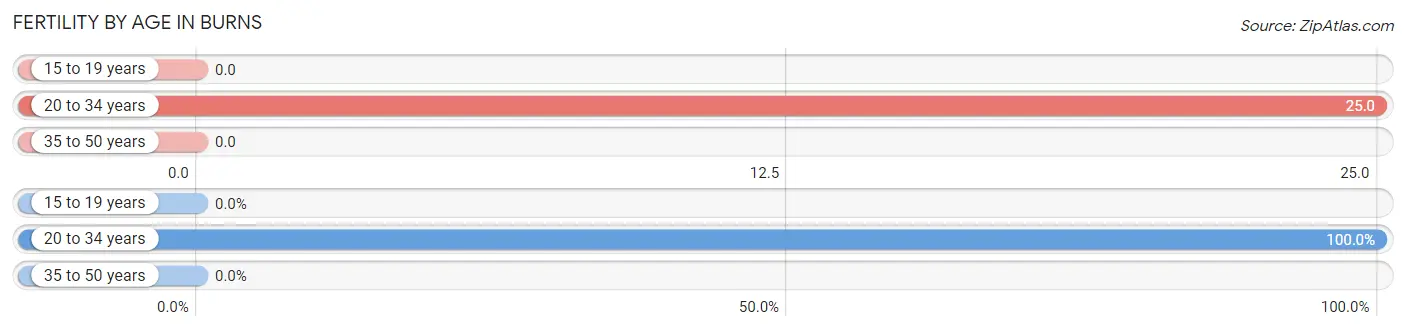
| Age Bracket | Women with Births | Births / 1,000 Women |
| 15 to 19 years | 0 (0.0%) | 0.0 |
| 20 to 34 years | 8 (100.0%) | 25.0 |
| 35 to 50 years | 0 (0.0%) | 0.0 |
| Total | 8 (100.0%) | 15.0 |
Fertility by Age by Marriage Status in Burns
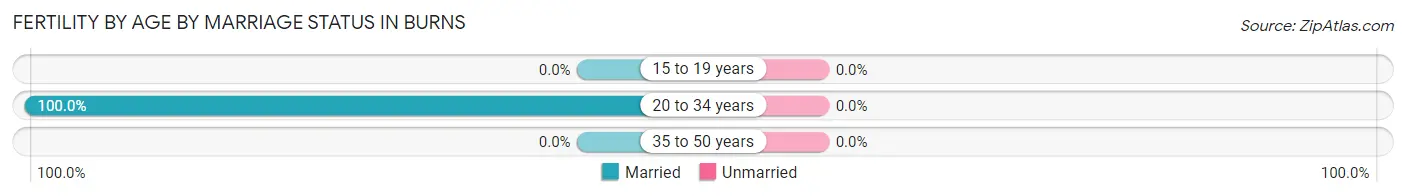
| Age Bracket | Married | Unmarried |
| 15 to 19 years | 0 (0.0%) | 0 (0.0%) |
| 20 to 34 years | 8 (100.0%) | 0 (0.0%) |
| 35 to 50 years | 0 (0.0%) | 0 (0.0%) |
| Total | 8 (100.0%) | 0 (0.0%) |
Fertility by Education in Burns
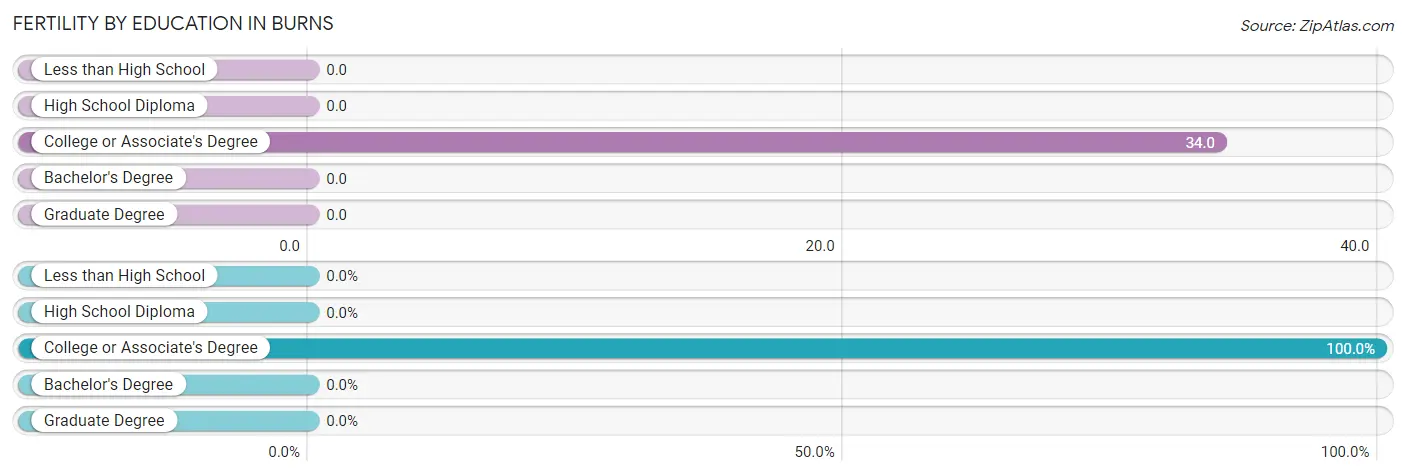
| Educational Attainment | Women with Births | Births / 1,000 Women |
| Less than High School | 0 (0.0%) | 0.0 |
| High School Diploma | 0 (0.0%) | 0.0 |
| College or Associate's Degree | 8 (100.0%) | 34.0 |
| Bachelor's Degree | 0 (0.0%) | 0.0 |
| Graduate Degree | 0 (0.0%) | 0.0 |
| Total | 8 (100.0%) | 15.0 |
Fertility by Education by Marriage Status in Burns
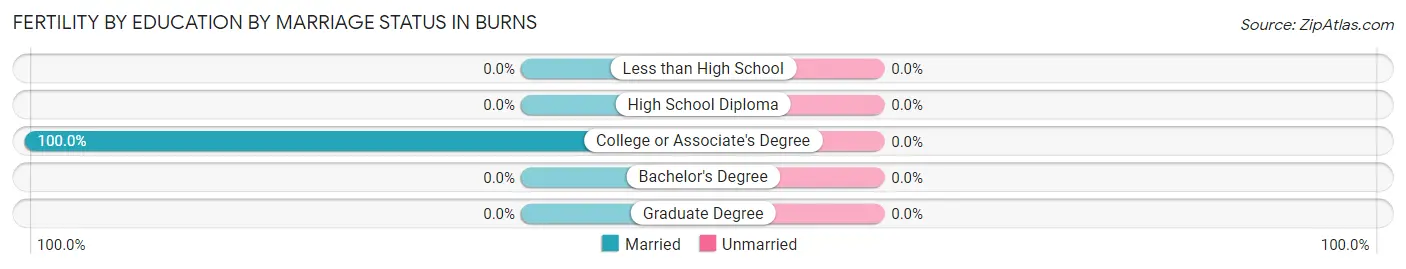
| Educational Attainment | Married | Unmarried |
| Less than High School | 0 (0.0%) | 0 (0.0%) |
| High School Diploma | 0 (0.0%) | 0 (0.0%) |
| College or Associate's Degree | 8 (100.0%) | 0 (0.0%) |
| Bachelor's Degree | 0 (0.0%) | 0 (0.0%) |
| Graduate Degree | 0 (0.0%) | 0 (0.0%) |
| Total | 8 (100.0%) | 0 (0.0%) |
Employment Characteristics in Burns
Employment by Class of Employer in Burns
Among the 1,192 employed individuals in Burns, private company employees (759 | 63.7%), state government employees (133 | 11.2%), and unpaid family workers (94 | 7.9%) make up the most common classes of employment.
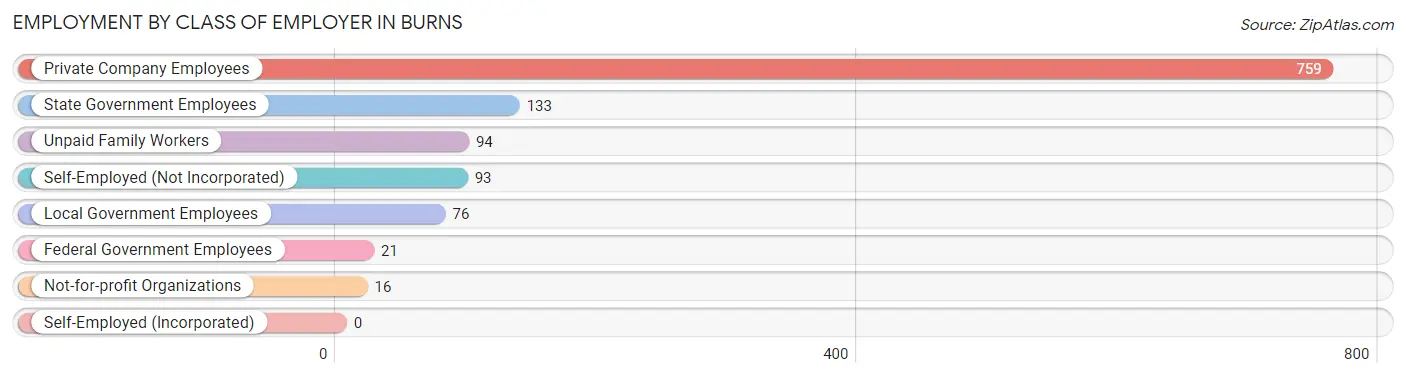
| Employer Class | # Employees | % Employees |
| Private Company Employees | 759 | 63.7% |
| Self-Employed (Incorporated) | 0 | 0.0% |
| Self-Employed (Not Incorporated) | 93 | 7.8% |
| Not-for-profit Organizations | 16 | 1.3% |
| Local Government Employees | 76 | 6.4% |
| State Government Employees | 133 | 11.2% |
| Federal Government Employees | 21 | 1.8% |
| Unpaid Family Workers | 94 | 7.9% |
| Total | 1,192 | 100.0% |
Employment Status by Age in Burns
According to the labor force statistics for Burns, out of the total population over 16 years of age (2,311), 55.2% or 1,276 individuals are in the labor force, with 6.6% or 84 of them unemployed. The age group with the highest labor force participation rate is 30 to 34 years, with 92.8% or 233 individuals in the labor force. Within the labor force, the 16 to 19 years age range has the highest percentage of unemployed individuals, with 100.0% or 13 of them being unemployed.
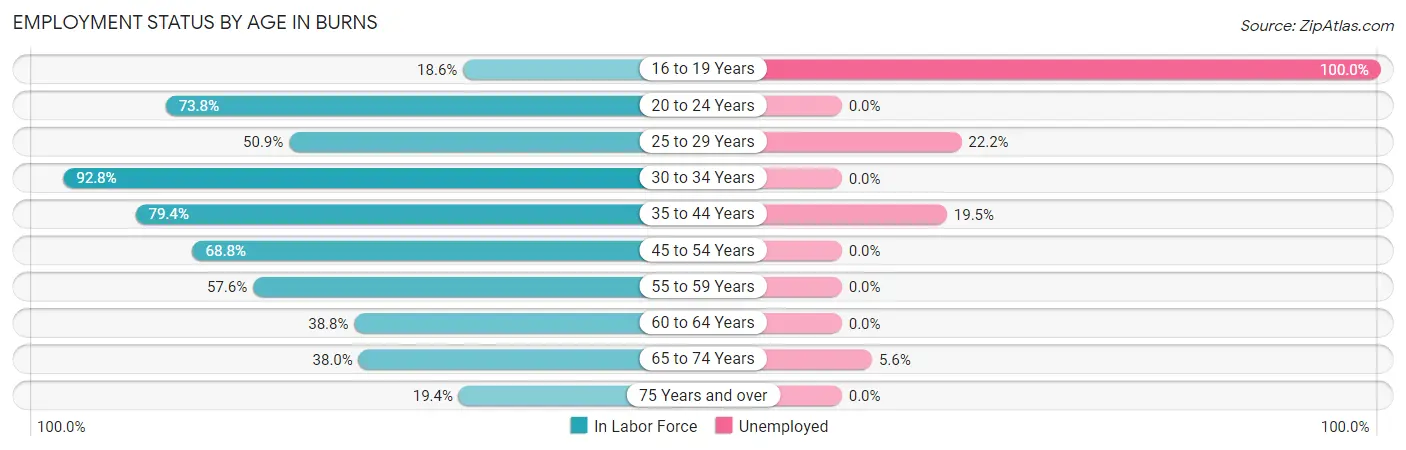
| Age Bracket | In Labor Force | Unemployed |
| 16 to 19 Years | 13 (18.6%) | 13 (100.0%) |
| 20 to 24 Years | 144 (73.8%) | 0 (0.0%) |
| 25 to 29 Years | 81 (50.9%) | 18 (22.2%) |
| 30 to 34 Years | 233 (92.8%) | 0 (0.0%) |
| 35 to 44 Years | 231 (79.4%) | 45 (19.5%) |
| 45 to 54 Years | 163 (68.8%) | 0 (0.0%) |
| 55 to 59 Years | 68 (57.6%) | 0 (0.0%) |
| 60 to 64 Years | 161 (38.8%) | 0 (0.0%) |
| 65 to 74 Years | 144 (38.0%) | 8 (5.6%) |
| 75 Years and over | 38 (19.4%) | 0 (0.0%) |
| Total | 1,276 (55.2%) | 84 (6.6%) |
Employment Status by Educational Attainment in Burns
According to labor force statistics for Burns, 63.7% of individuals (937) out of the total population between 25 and 64 years of age (1,471) are in the labor force, with 6.7% or 63 of them being unemployed. The group with the highest labor force participation rate are those with the educational attainment of college / associate degree, with 72.7% or 451 individuals in the labor force. Within the labor force, individuals with less than high school education have the highest percentage of unemployment, with 38.8% or 19 of them being unemployed.
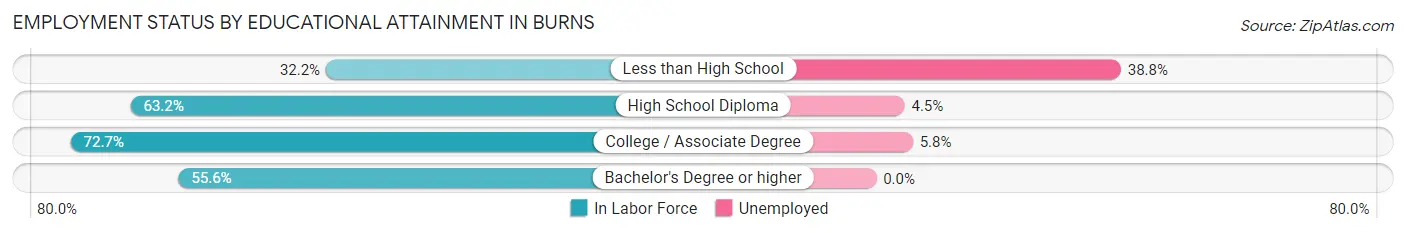
| Educational Attainment | In Labor Force | Unemployed |
| Less than High School | 49 (32.2%) | 59 (38.8%) |
| High School Diploma | 402 (63.2%) | 29 (4.5%) |
| College / Associate Degree | 451 (72.7%) | 36 (5.8%) |
| Bachelor's Degree or higher | 35 (55.6%) | 0 (0.0%) |
| Total | 937 (63.7%) | 99 (6.7%) |
Employment Occupations by Sex in Burns
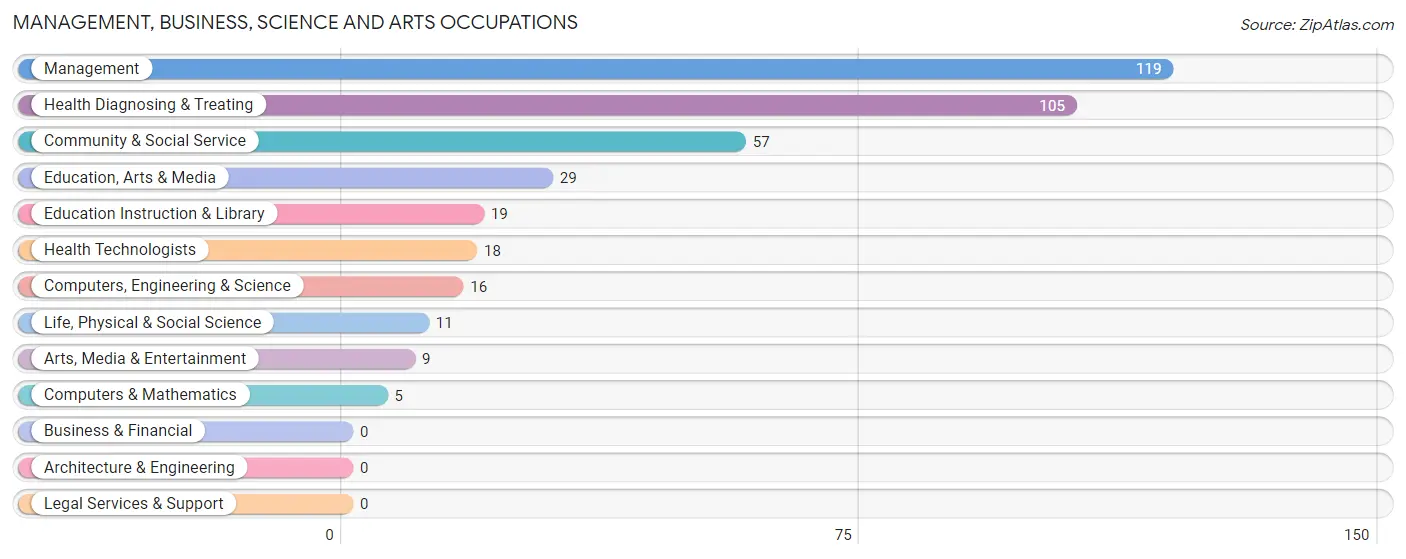
Management, Business, Science and Arts Occupations
The most common Management, Business, Science and Arts occupations in Burns are Management (119 | 10.0%), Health Diagnosing & Treating (105 | 8.8%), Community & Social Service (57 | 4.8%), Education, Arts & Media (29 | 2.4%), and Education Instruction & Library (19 | 1.6%).
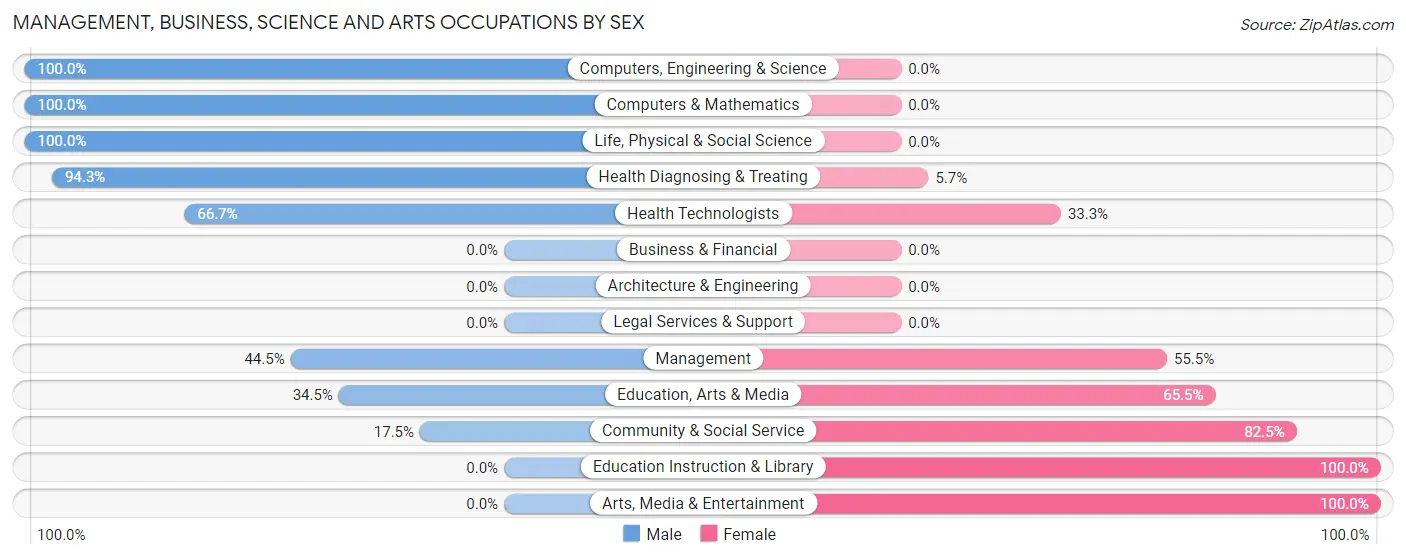
Management, Business, Science and Arts Occupations by Sex
Within the Management, Business, Science and Arts occupations in Burns, the most male-oriented occupations are Computers, Engineering & Science (100.0%), Computers & Mathematics (100.0%), and Life, Physical & Social Science (100.0%), while the most female-oriented occupations are Education Instruction & Library (100.0%), Arts, Media & Entertainment (100.0%), and Community & Social Service (82.5%).
| Occupation | Male | Female |
| Management | 53 (44.5%) | 66 (55.5%) |
| Business & Financial | 0 (0.0%) | 0 (0.0%) |
| Computers, Engineering & Science | 16 (100.0%) | 0 (0.0%) |
| Computers & Mathematics | 5 (100.0%) | 0 (0.0%) |
| Architecture & Engineering | 0 (0.0%) | 0 (0.0%) |
| Life, Physical & Social Science | 11 (100.0%) | 0 (0.0%) |
| Community & Social Service | 10 (17.5%) | 47 (82.5%) |
| Education, Arts & Media | 10 (34.5%) | 19 (65.5%) |
| Legal Services & Support | 0 (0.0%) | 0 (0.0%) |
| Education Instruction & Library | 0 (0.0%) | 19 (100.0%) |
| Arts, Media & Entertainment | 0 (0.0%) | 9 (100.0%) |
| Health Diagnosing & Treating | 99 (94.3%) | 6 (5.7%) |
| Health Technologists | 12 (66.7%) | 6 (33.3%) |
| Total (Category) | 178 (59.9%) | 119 (40.1%) |
| Total (Overall) | 589 (49.4%) | 603 (50.6%) |
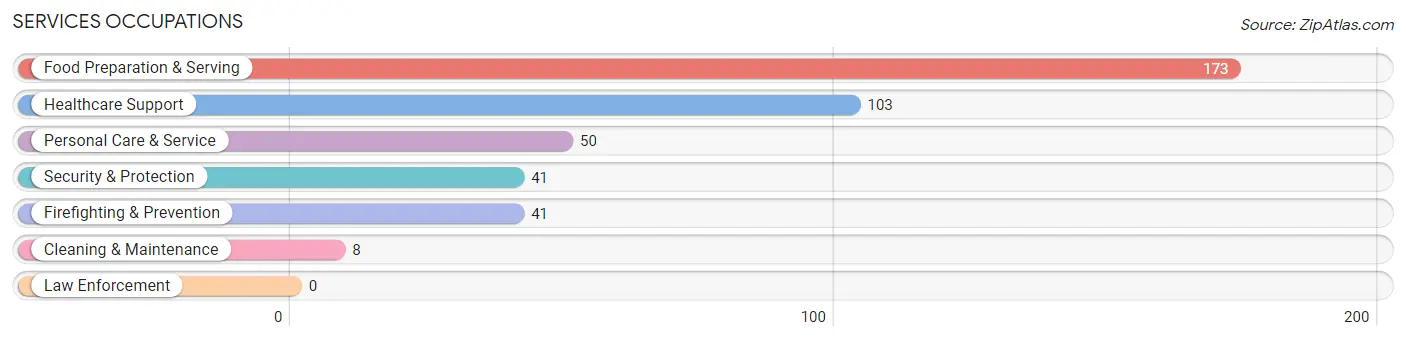
Services Occupations
The most common Services occupations in Burns are Food Preparation & Serving (173 | 14.5%), Healthcare Support (103 | 8.6%), Personal Care & Service (50 | 4.2%), Security & Protection (41 | 3.4%), and Firefighting & Prevention (41 | 3.4%).
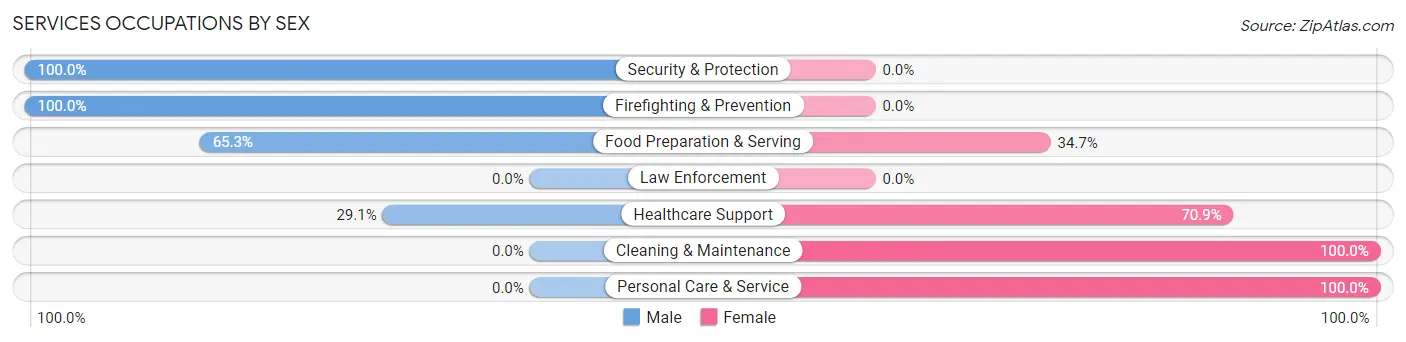
Services Occupations by Sex
Within the Services occupations in Burns, the most male-oriented occupations are Security & Protection (100.0%), Firefighting & Prevention (100.0%), and Food Preparation & Serving (65.3%), while the most female-oriented occupations are Cleaning & Maintenance (100.0%), Personal Care & Service (100.0%), and Healthcare Support (70.9%).
| Occupation | Male | Female |
| Healthcare Support | 30 (29.1%) | 73 (70.9%) |
| Security & Protection | 41 (100.0%) | 0 (0.0%) |
| Firefighting & Prevention | 41 (100.0%) | 0 (0.0%) |
| Law Enforcement | 0 (0.0%) | 0 (0.0%) |
| Food Preparation & Serving | 113 (65.3%) | 60 (34.7%) |
| Cleaning & Maintenance | 0 (0.0%) | 8 (100.0%) |
| Personal Care & Service | 0 (0.0%) | 50 (100.0%) |
| Total (Category) | 184 (49.1%) | 191 (50.9%) |
| Total (Overall) | 589 (49.4%) | 603 (50.6%) |
Sales and Office Occupations
The most common Sales and Office occupations in Burns are Office & Administration (207 | 17.4%), and Sales & Related (28 | 2.4%).
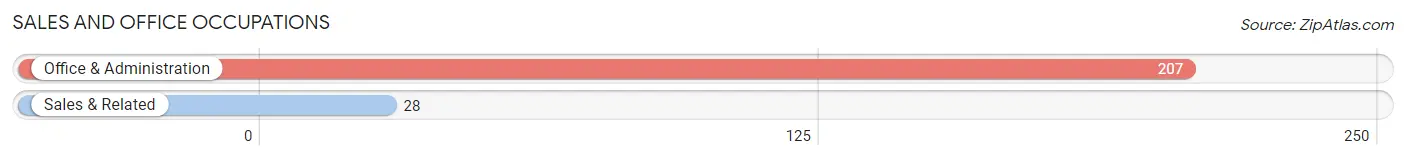
Sales and Office Occupations by Sex
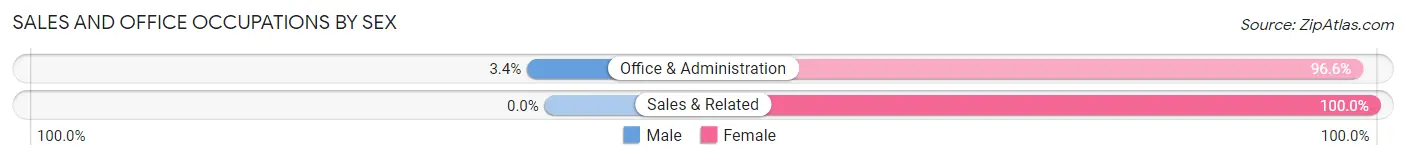
| Occupation | Male | Female |
| Sales & Related | 0 (0.0%) | 28 (100.0%) |
| Office & Administration | 7 (3.4%) | 200 (96.6%) |
| Total (Category) | 7 (3.0%) | 228 (97.0%) |
| Total (Overall) | 589 (49.4%) | 603 (50.6%) |
Natural Resources, Construction and Maintenance Occupations
The most common Natural Resources, Construction and Maintenance occupations in Burns are Construction & Extraction (26 | 2.2%), and Installation, Maintenance & Repair (11 | 0.9%).
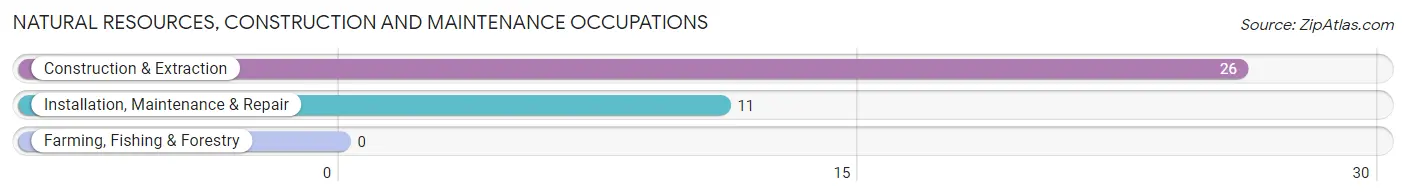
Natural Resources, Construction and Maintenance Occupations by Sex
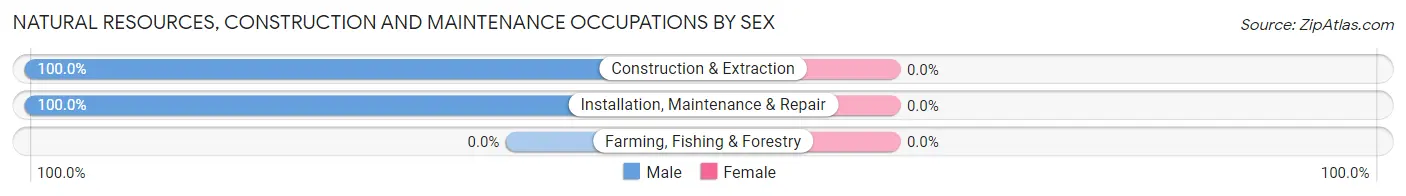
| Occupation | Male | Female |
| Farming, Fishing & Forestry | 0 (0.0%) | 0 (0.0%) |
| Construction & Extraction | 26 (100.0%) | 0 (0.0%) |
| Installation, Maintenance & Repair | 11 (100.0%) | 0 (0.0%) |
| Total (Category) | 37 (100.0%) | 0 (0.0%) |
| Total (Overall) | 589 (49.4%) | 603 (50.6%) |
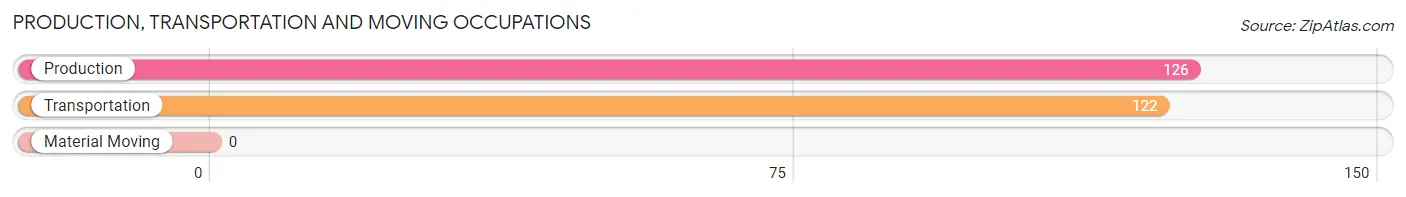
Production, Transportation and Moving Occupations
The most common Production, Transportation and Moving occupations in Burns are Production (126 | 10.6%), and Transportation (122 | 10.2%).
Production, Transportation and Moving Occupations by Sex
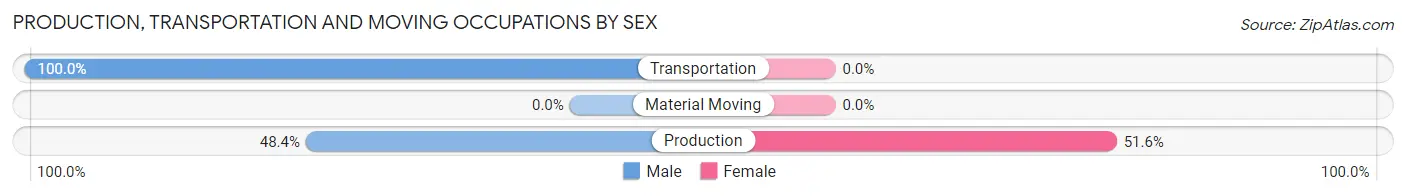
| Occupation | Male | Female |
| Production | 61 (48.4%) | 65 (51.6%) |
| Transportation | 122 (100.0%) | 0 (0.0%) |
| Material Moving | 0 (0.0%) | 0 (0.0%) |
| Total (Category) | 183 (73.8%) | 65 (26.2%) |
| Total (Overall) | 589 (49.4%) | 603 (50.6%) |
Employment Industries by Sex in Burns
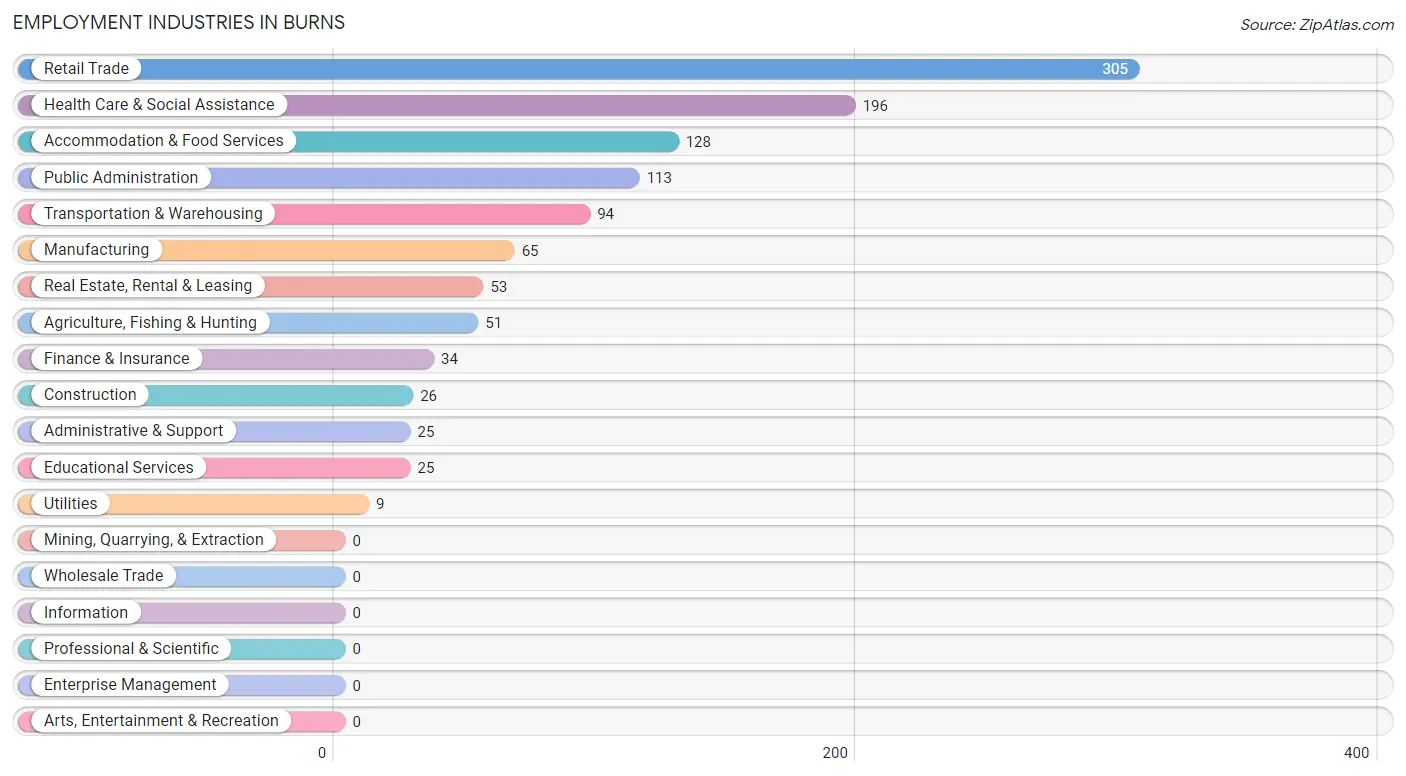
Employment Industries in Burns
The major employment industries in Burns include Retail Trade (305 | 25.6%), Health Care & Social Assistance (196 | 16.4%), Accommodation & Food Services (128 | 10.7%), Public Administration (113 | 9.5%), and Transportation & Warehousing (94 | 7.9%).
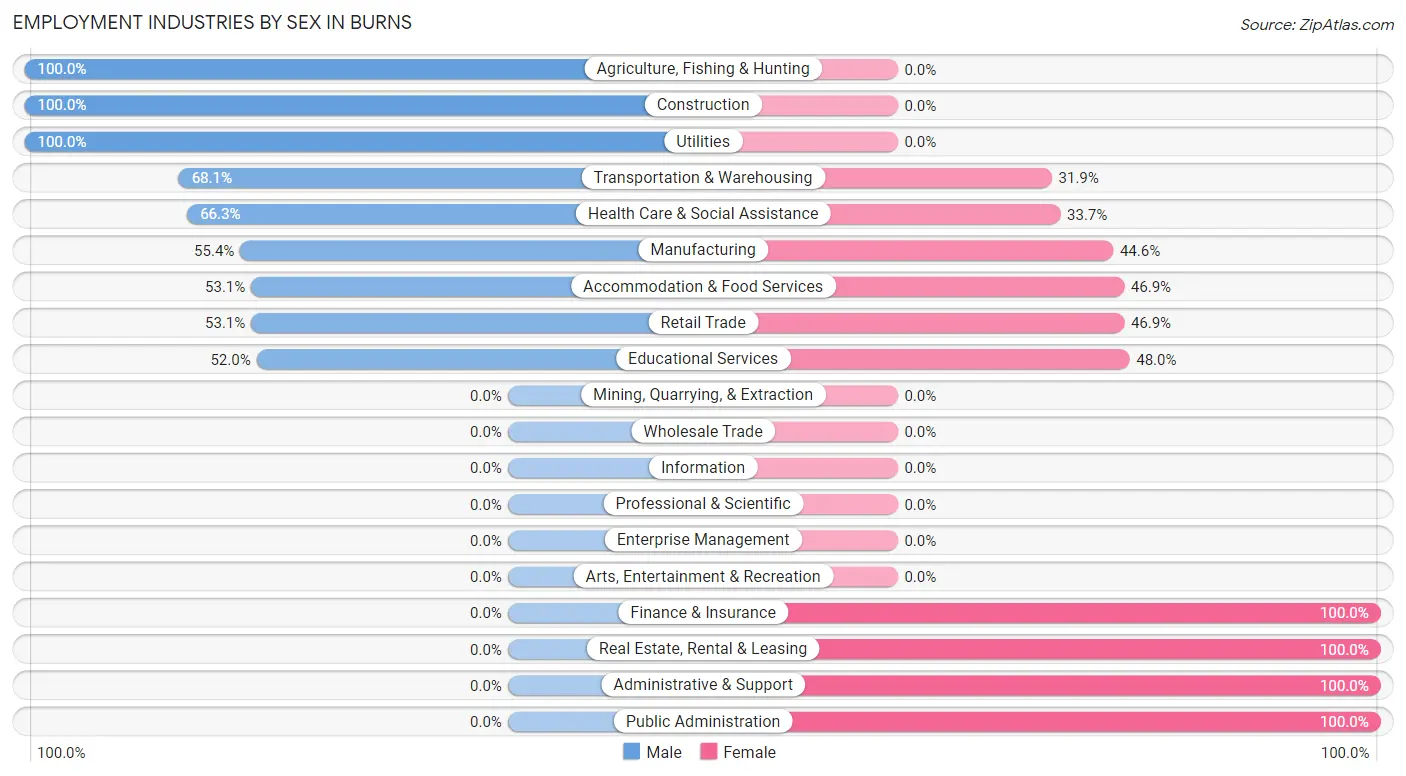
Employment Industries by Sex in Burns
The Burns industries that see more men than women are Agriculture, Fishing & Hunting (100.0%), Construction (100.0%), and Utilities (100.0%), whereas the industries that tend to have a higher number of women are Finance & Insurance (100.0%), Real Estate, Rental & Leasing (100.0%), and Administrative & Support (100.0%).
| Industry | Male | Female |
| Agriculture, Fishing & Hunting | 51 (100.0%) | 0 (0.0%) |
| Mining, Quarrying, & Extraction | 0 (0.0%) | 0 (0.0%) |
| Construction | 26 (100.0%) | 0 (0.0%) |
| Manufacturing | 36 (55.4%) | 29 (44.6%) |
| Wholesale Trade | 0 (0.0%) | 0 (0.0%) |
| Retail Trade | 162 (53.1%) | 143 (46.9%) |
| Transportation & Warehousing | 64 (68.1%) | 30 (31.9%) |
| Utilities | 9 (100.0%) | 0 (0.0%) |
| Information | 0 (0.0%) | 0 (0.0%) |
| Finance & Insurance | 0 (0.0%) | 34 (100.0%) |
| Real Estate, Rental & Leasing | 0 (0.0%) | 53 (100.0%) |
| Professional & Scientific | 0 (0.0%) | 0 (0.0%) |
| Enterprise Management | 0 (0.0%) | 0 (0.0%) |
| Administrative & Support | 0 (0.0%) | 25 (100.0%) |
| Educational Services | 13 (52.0%) | 12 (48.0%) |
| Health Care & Social Assistance | 130 (66.3%) | 66 (33.7%) |
| Arts, Entertainment & Recreation | 0 (0.0%) | 0 (0.0%) |
| Accommodation & Food Services | 68 (53.1%) | 60 (46.9%) |
| Public Administration | 0 (0.0%) | 113 (100.0%) |
| Total | 589 (49.4%) | 603 (50.6%) |
Education in Burns
School Enrollment in Burns
The most common levels of schooling among the 377 students in Burns are high school (93 | 24.7%), elementary school (90 | 23.9%), and nursery / preschool (59 | 15.7%).
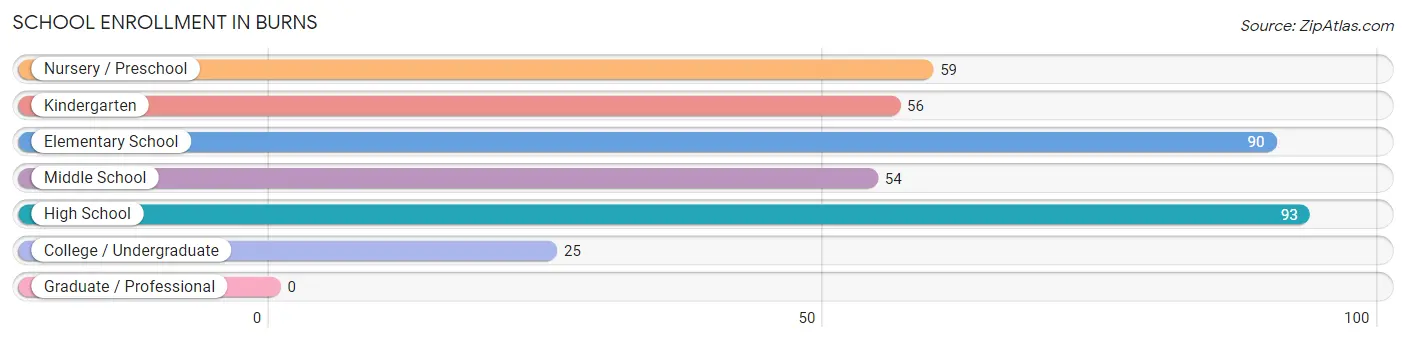
| School Level | # Students | % Students |
| Nursery / Preschool | 59 | 15.7% |
| Kindergarten | 56 | 14.8% |
| Elementary School | 90 | 23.9% |
| Middle School | 54 | 14.3% |
| High School | 93 | 24.7% |
| College / Undergraduate | 25 | 6.6% |
| Graduate / Professional | 0 | 0.0% |
| Total | 377 | 100.0% |
School Enrollment by Age by Funding Source in Burns
Out of a total of 377 students who are enrolled in schools in Burns, 42 (11.1%) attend a private institution, while the remaining 335 (88.9%) are enrolled in public schools. The age group of 15 to 17 year olds has the highest likelihood of being enrolled in private schools, with 19 (22.1% in the age bracket) enrolled. Conversely, the age group of 3 to 4 year olds has the lowest likelihood of being enrolled in a private school, with 29 (100.0% in the age bracket) attending a public institution.
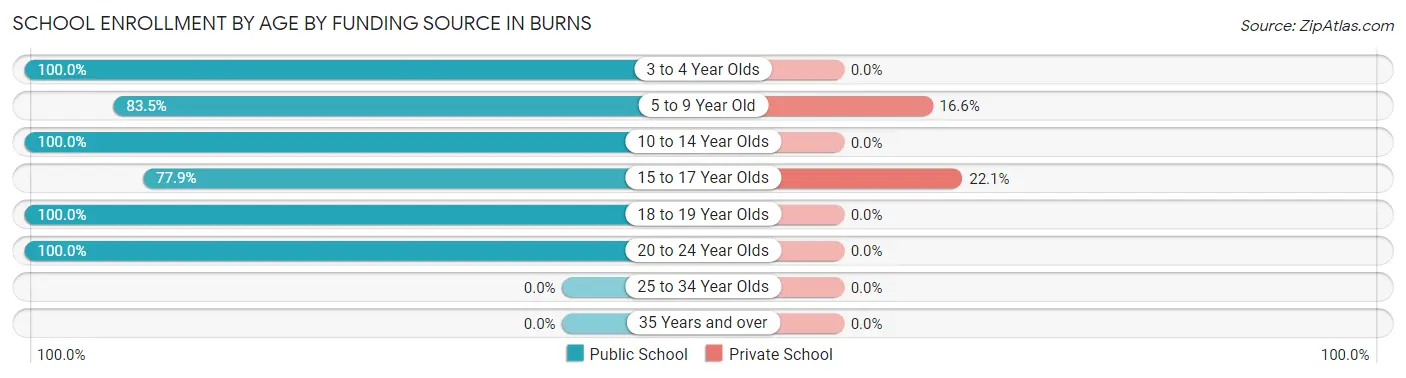
| Age Bracket | Public School | Private School |
| 3 to 4 Year Olds | 29 (100.0%) | 0 (0.0%) |
| 5 to 9 Year Old | 116 (83.5%) | 23 (16.6%) |
| 10 to 14 Year Olds | 94 (100.0%) | 0 (0.0%) |
| 15 to 17 Year Olds | 67 (77.9%) | 19 (22.1%) |
| 18 to 19 Year Olds | 3 (100.0%) | 0 (0.0%) |
| 20 to 24 Year Olds | 26 (100.0%) | 0 (0.0%) |
| 25 to 34 Year Olds | 0 (0.0%) | 0 (0.0%) |
| 35 Years and over | 0 (0.0%) | 0 (0.0%) |
| Total | 335 (88.9%) | 42 (11.1%) |
Educational Attainment by Field of Study in Burns
Bio, nature & agricultural (40 | 25.2%), business (34 | 21.4%), psychology (22 | 13.8%), education (16 | 10.1%), and science & technology (12 | 7.5%) are the most common fields of study among 159 individuals in Burns who have obtained a bachelor's degree or higher.
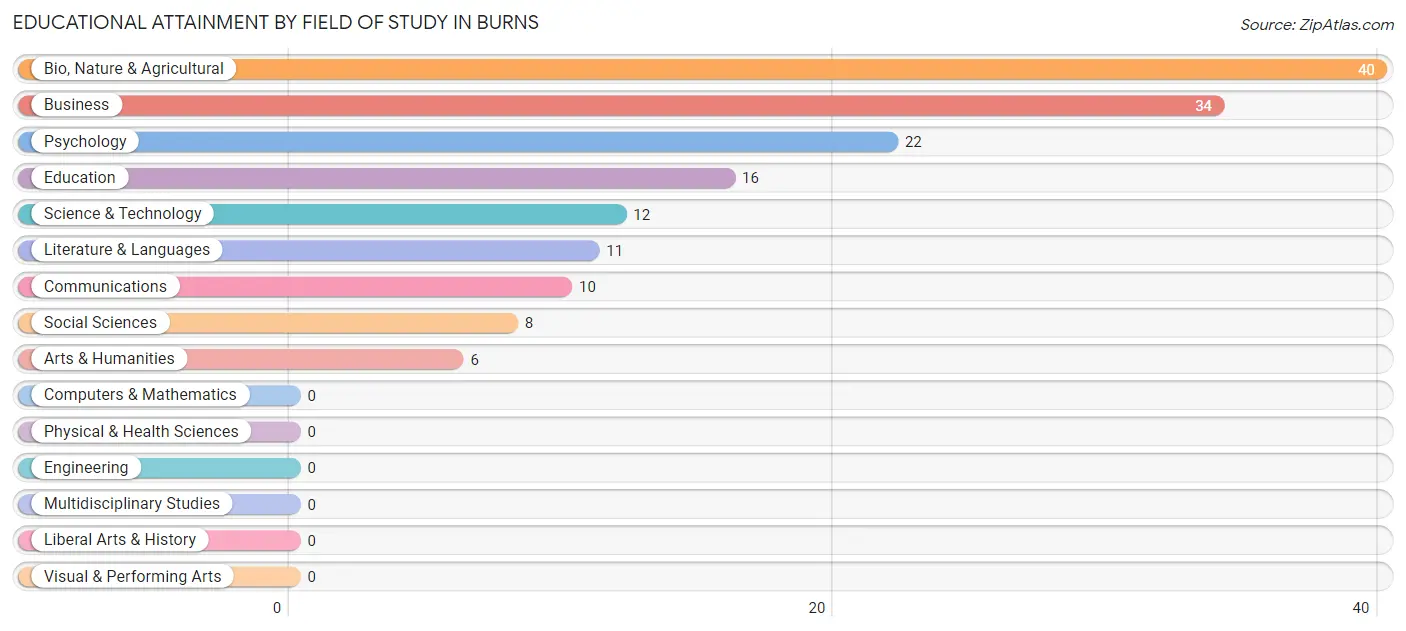
| Field of Study | # Graduates | % Graduates |
| Computers & Mathematics | 0 | 0.0% |
| Bio, Nature & Agricultural | 40 | 25.2% |
| Physical & Health Sciences | 0 | 0.0% |
| Psychology | 22 | 13.8% |
| Social Sciences | 8 | 5.0% |
| Engineering | 0 | 0.0% |
| Multidisciplinary Studies | 0 | 0.0% |
| Science & Technology | 12 | 7.5% |
| Business | 34 | 21.4% |
| Education | 16 | 10.1% |
| Literature & Languages | 11 | 6.9% |
| Liberal Arts & History | 0 | 0.0% |
| Visual & Performing Arts | 0 | 0.0% |
| Communications | 10 | 6.3% |
| Arts & Humanities | 6 | 3.8% |
| Total | 159 | 100.0% |
Transportation & Commute in Burns
Vehicle Availability by Sex in Burns
The most prevalent vehicle ownership categories in Burns are males with 1 vehicle (246, accounting for 41.8%) and females with 1 vehicle (137, making up 40.8%).
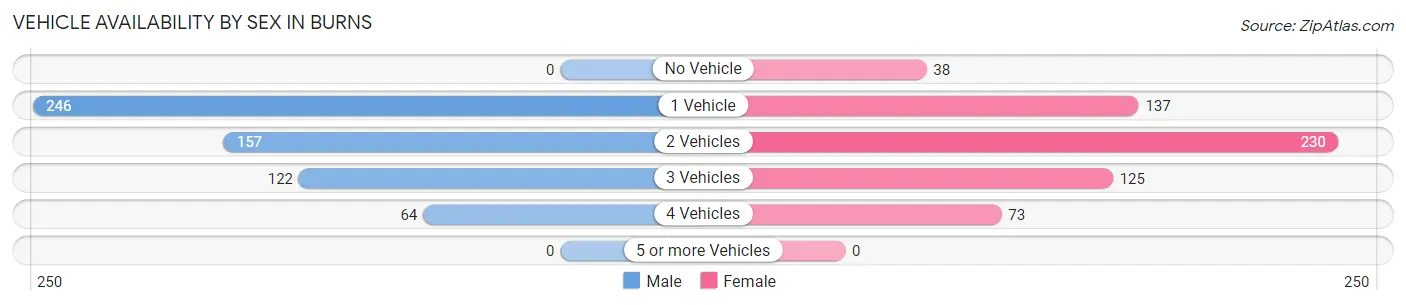
| Vehicles Available | Male | Female |
| No Vehicle | 0 (0.0%) | 38 (6.3%) |
| 1 Vehicle | 246 (41.8%) | 137 (22.7%) |
| 2 Vehicles | 157 (26.7%) | 230 (38.1%) |
| 3 Vehicles | 122 (20.7%) | 125 (20.7%) |
| 4 Vehicles | 64 (10.9%) | 73 (12.1%) |
| 5 or more Vehicles | 0 (0.0%) | 0 (0.0%) |
| Total | 589 (100.0%) | 603 (100.0%) |
Commute Time in Burns
The most frequently occuring commute durations in Burns are 5 to 9 minutes (490 commuters, 49.0%), 10 to 14 minutes (195 commuters, 19.5%), and less than 5 minutes (155 commuters, 15.5%).
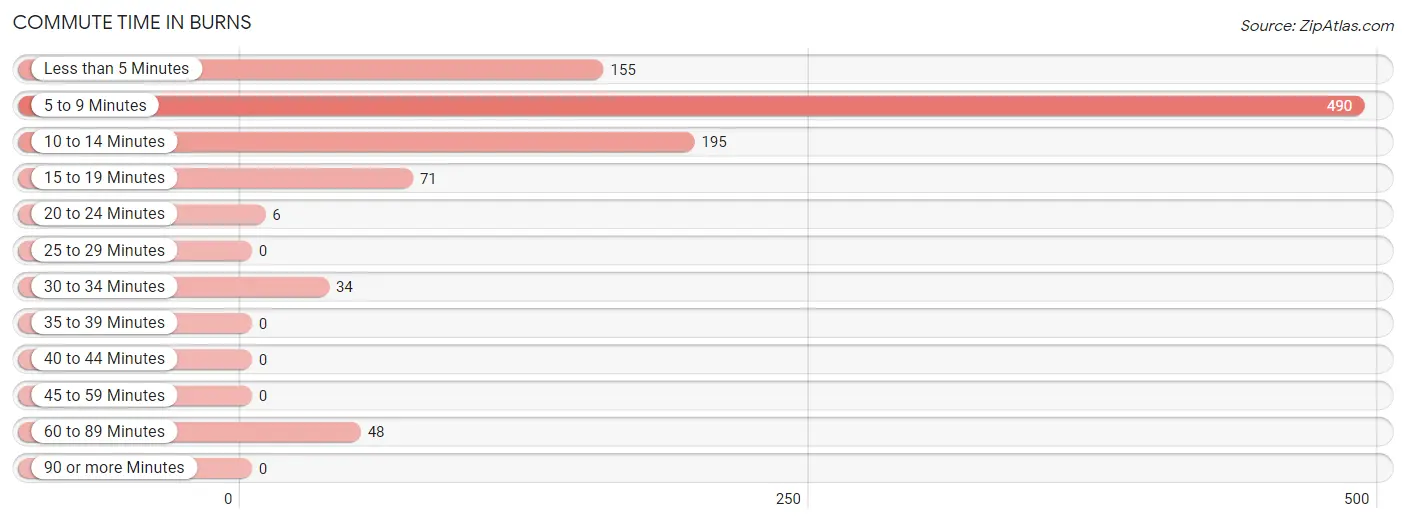
| Commute Time | # Commuters | % Commuters |
| Less than 5 Minutes | 155 | 15.5% |
| 5 to 9 Minutes | 490 | 49.0% |
| 10 to 14 Minutes | 195 | 19.5% |
| 15 to 19 Minutes | 71 | 7.1% |
| 20 to 24 Minutes | 6 | 0.6% |
| 25 to 29 Minutes | 0 | 0.0% |
| 30 to 34 Minutes | 34 | 3.4% |
| 35 to 39 Minutes | 0 | 0.0% |
| 40 to 44 Minutes | 0 | 0.0% |
| 45 to 59 Minutes | 0 | 0.0% |
| 60 to 89 Minutes | 48 | 4.8% |
| 90 or more Minutes | 0 | 0.0% |
Commute Time by Sex in Burns
The most common commute times in Burns are 5 to 9 minutes (207 commuters, 41.8%) for males and 5 to 9 minutes (283 commuters, 56.1%) for females.
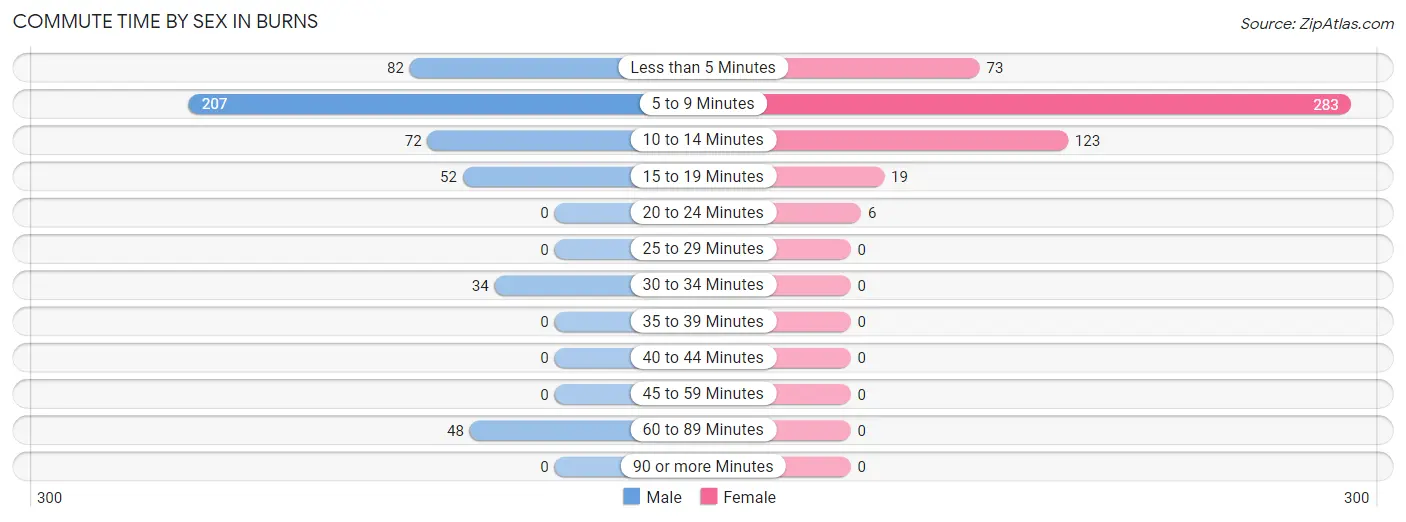
| Commute Time | Male | Female |
| Less than 5 Minutes | 82 (16.6%) | 73 (14.5%) |
| 5 to 9 Minutes | 207 (41.8%) | 283 (56.1%) |
| 10 to 14 Minutes | 72 (14.5%) | 123 (24.4%) |
| 15 to 19 Minutes | 52 (10.5%) | 19 (3.8%) |
| 20 to 24 Minutes | 0 (0.0%) | 6 (1.2%) |
| 25 to 29 Minutes | 0 (0.0%) | 0 (0.0%) |
| 30 to 34 Minutes | 34 (6.9%) | 0 (0.0%) |
| 35 to 39 Minutes | 0 (0.0%) | 0 (0.0%) |
| 40 to 44 Minutes | 0 (0.0%) | 0 (0.0%) |
| 45 to 59 Minutes | 0 (0.0%) | 0 (0.0%) |
| 60 to 89 Minutes | 48 (9.7%) | 0 (0.0%) |
| 90 or more Minutes | 0 (0.0%) | 0 (0.0%) |
Time of Departure to Work by Sex in Burns
The most frequent times of departure to work in Burns are 12:00 PM to 3:59 PM (114, 23.0%) for males and 10:00 AM to 10:59 AM (178, 35.3%) for females.
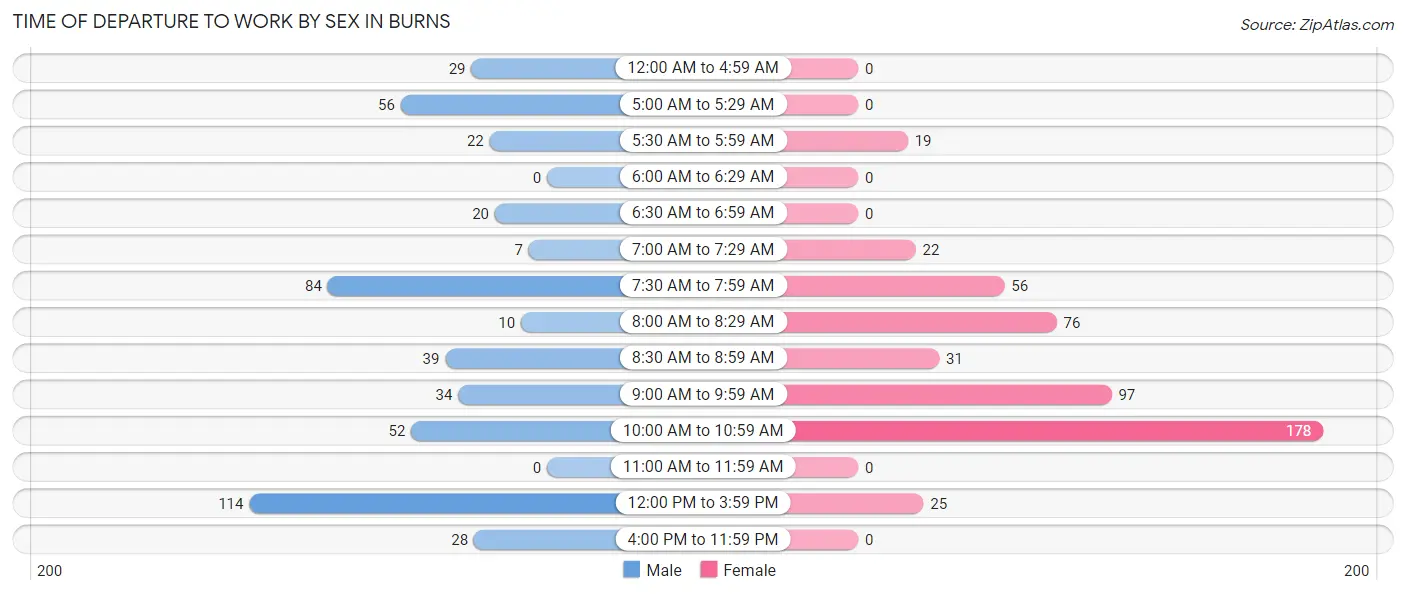
| Time of Departure | Male | Female |
| 12:00 AM to 4:59 AM | 29 (5.9%) | 0 (0.0%) |
| 5:00 AM to 5:29 AM | 56 (11.3%) | 0 (0.0%) |
| 5:30 AM to 5:59 AM | 22 (4.4%) | 19 (3.8%) |
| 6:00 AM to 6:29 AM | 0 (0.0%) | 0 (0.0%) |
| 6:30 AM to 6:59 AM | 20 (4.0%) | 0 (0.0%) |
| 7:00 AM to 7:29 AM | 7 (1.4%) | 22 (4.4%) |
| 7:30 AM to 7:59 AM | 84 (17.0%) | 56 (11.1%) |
| 8:00 AM to 8:29 AM | 10 (2.0%) | 76 (15.1%) |
| 8:30 AM to 8:59 AM | 39 (7.9%) | 31 (6.1%) |
| 9:00 AM to 9:59 AM | 34 (6.9%) | 97 (19.3%) |
| 10:00 AM to 10:59 AM | 52 (10.5%) | 178 (35.3%) |
| 11:00 AM to 11:59 AM | 0 (0.0%) | 0 (0.0%) |
| 12:00 PM to 3:59 PM | 114 (23.0%) | 25 (5.0%) |
| 4:00 PM to 11:59 PM | 28 (5.7%) | 0 (0.0%) |
| Total | 495 (100.0%) | 504 (100.0%) |
Housing Occupancy in Burns
Occupancy by Ownership in Burns
Of the total 1,241 dwellings in Burns, owner-occupied units account for 714 (57.5%), while renter-occupied units make up 527 (42.5%).
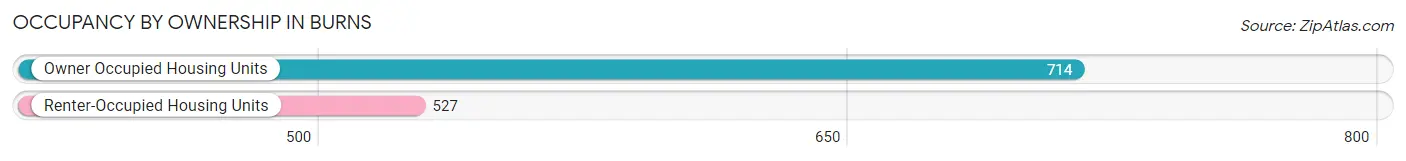
| Occupancy | # Housing Units | % Housing Units |
| Owner Occupied Housing Units | 714 | 57.5% |
| Renter-Occupied Housing Units | 527 | 42.5% |
| Total Occupied Housing Units | 1,241 | 100.0% |
Occupancy by Household Size in Burns
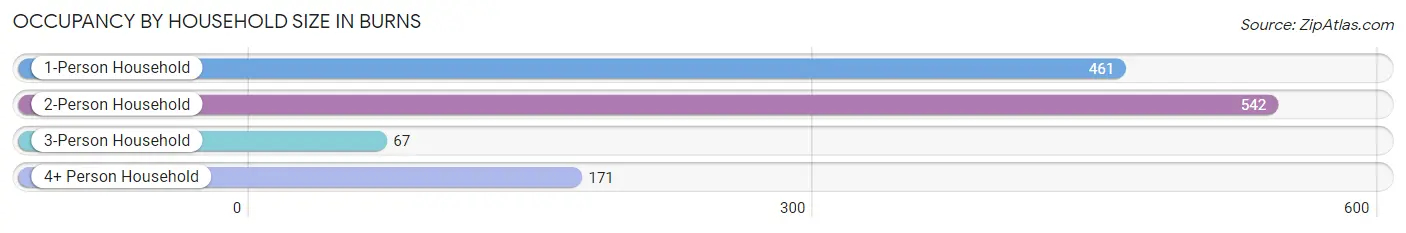
| Household Size | # Housing Units | % Housing Units |
| 1-Person Household | 461 | 37.1% |
| 2-Person Household | 542 | 43.7% |
| 3-Person Household | 67 | 5.4% |
| 4+ Person Household | 171 | 13.8% |
| Total Housing Units | 1,241 | 100.0% |
Occupancy by Ownership by Household Size in Burns

| Household Size | Owner-occupied | Renter-occupied |
| 1-Person Household | 150 (32.5%) | 311 (67.5%) |
| 2-Person Household | 412 (76.0%) | 130 (24.0%) |
| 3-Person Household | 56 (83.6%) | 11 (16.4%) |
| 4+ Person Household | 96 (56.1%) | 75 (43.9%) |
| Total Housing Units | 714 (57.5%) | 527 (42.5%) |
Occupancy by Educational Attainment in Burns
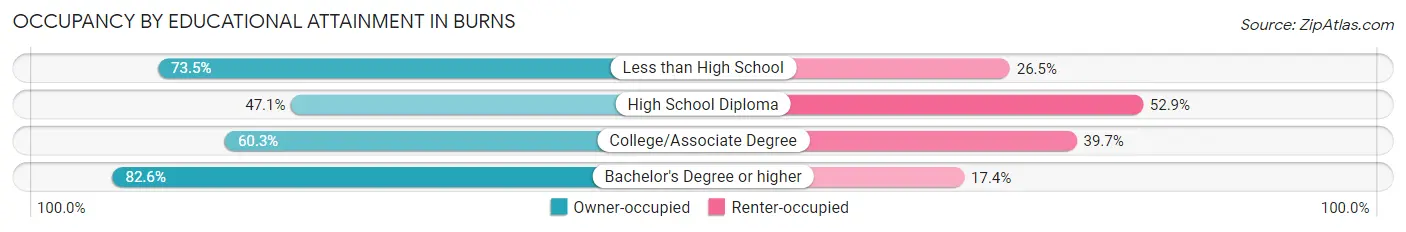
| Household Size | Owner-occupied | Renter-occupied |
| Less than High School | 111 (73.5%) | 40 (26.5%) |
| High School Diploma | 262 (47.1%) | 294 (52.9%) |
| College/Associate Degree | 270 (60.3%) | 178 (39.7%) |
| Bachelor's Degree or higher | 71 (82.6%) | 15 (17.4%) |
Occupancy by Age of Householder in Burns
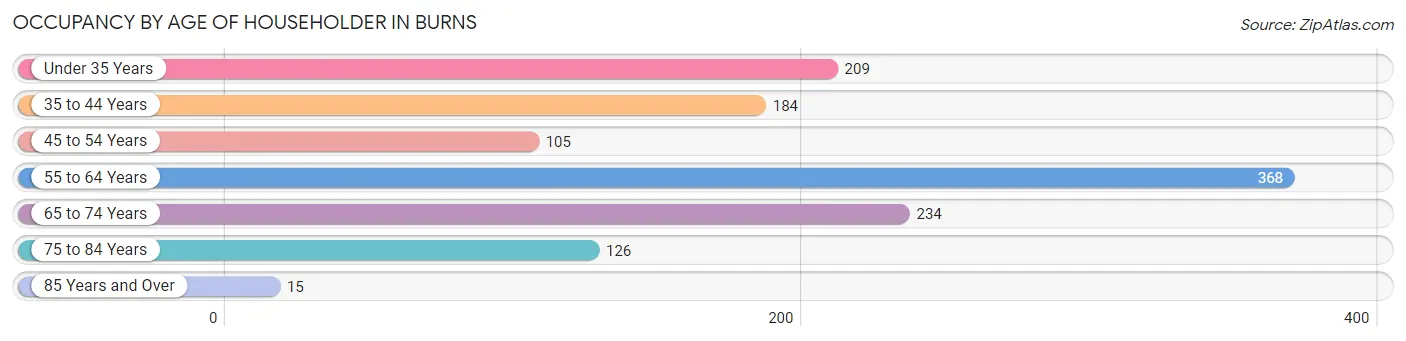
| Age Bracket | # Households | % Households |
| Under 35 Years | 209 | 16.8% |
| 35 to 44 Years | 184 | 14.8% |
| 45 to 54 Years | 105 | 8.5% |
| 55 to 64 Years | 368 | 29.6% |
| 65 to 74 Years | 234 | 18.9% |
| 75 to 84 Years | 126 | 10.2% |
| 85 Years and Over | 15 | 1.2% |
| Total | 1,241 | 100.0% |
Housing Finances in Burns
Median Income by Occupancy in Burns
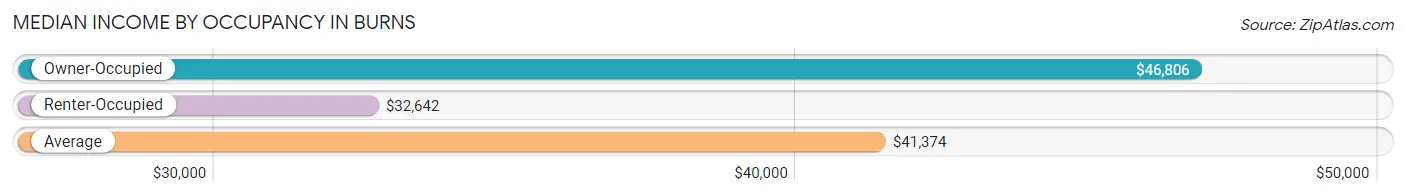
| Occupancy Type | # Households | Median Income |
| Owner-Occupied | 714 (57.5%) | $46,806 |
| Renter-Occupied | 527 (42.5%) | $32,642 |
| Average | 1,241 (100.0%) | $41,374 |
Occupancy by Householder Income Bracket in Burns
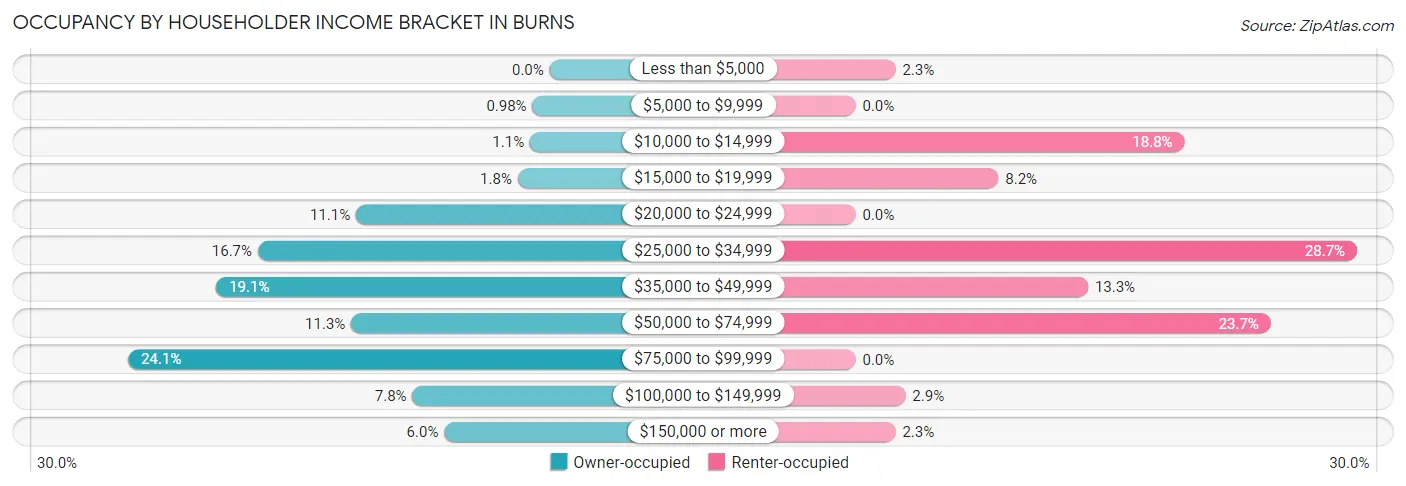
| Income Bracket | Owner-occupied | Renter-occupied |
| Less than $5,000 | 0 (0.0%) | 12 (2.3%) |
| $5,000 to $9,999 | 7 (1.0%) | 0 (0.0%) |
| $10,000 to $14,999 | 8 (1.1%) | 99 (18.8%) |
| $15,000 to $19,999 | 13 (1.8%) | 43 (8.2%) |
| $20,000 to $24,999 | 79 (11.1%) | 0 (0.0%) |
| $25,000 to $34,999 | 119 (16.7%) | 151 (28.6%) |
| $35,000 to $49,999 | 136 (19.1%) | 70 (13.3%) |
| $50,000 to $74,999 | 81 (11.3%) | 125 (23.7%) |
| $75,000 to $99,999 | 172 (24.1%) | 0 (0.0%) |
| $100,000 to $149,999 | 56 (7.8%) | 15 (2.9%) |
| $150,000 or more | 43 (6.0%) | 12 (2.3%) |
| Total | 714 (100.0%) | 527 (100.0%) |
Monthly Housing Cost Tiers in Burns
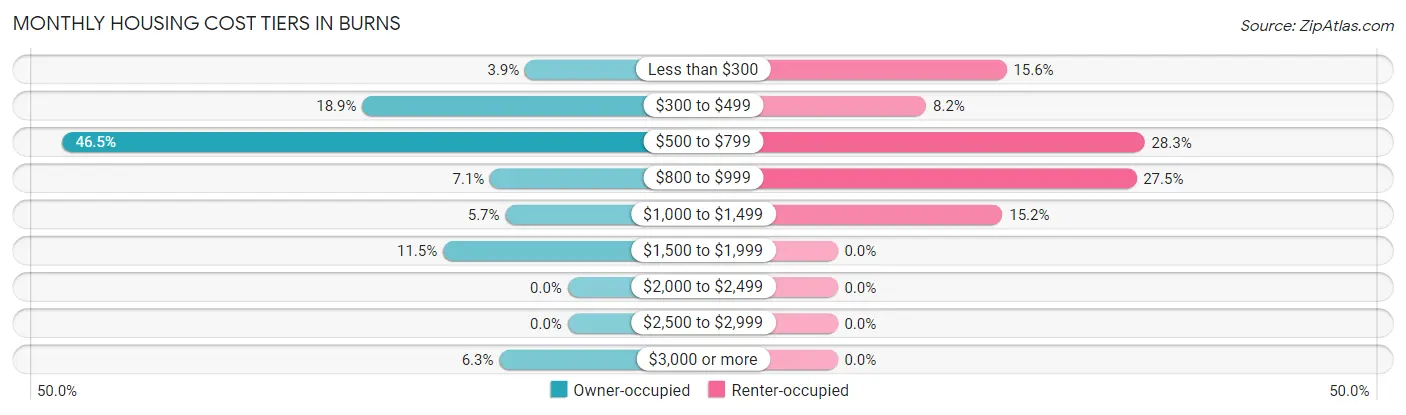
| Monthly Cost | Owner-occupied | Renter-occupied |
| Less than $300 | 28 (3.9%) | 82 (15.6%) |
| $300 to $499 | 135 (18.9%) | 43 (8.2%) |
| $500 to $799 | 332 (46.5%) | 149 (28.3%) |
| $800 to $999 | 51 (7.1%) | 145 (27.5%) |
| $1,000 to $1,499 | 41 (5.7%) | 80 (15.2%) |
| $1,500 to $1,999 | 82 (11.5%) | 0 (0.0%) |
| $2,000 to $2,499 | 0 (0.0%) | 0 (0.0%) |
| $2,500 to $2,999 | 0 (0.0%) | 0 (0.0%) |
| $3,000 or more | 45 (6.3%) | 0 (0.0%) |
| Total | 714 (100.0%) | 527 (100.0%) |
Physical Housing Characteristics in Burns
Housing Structures in Burns
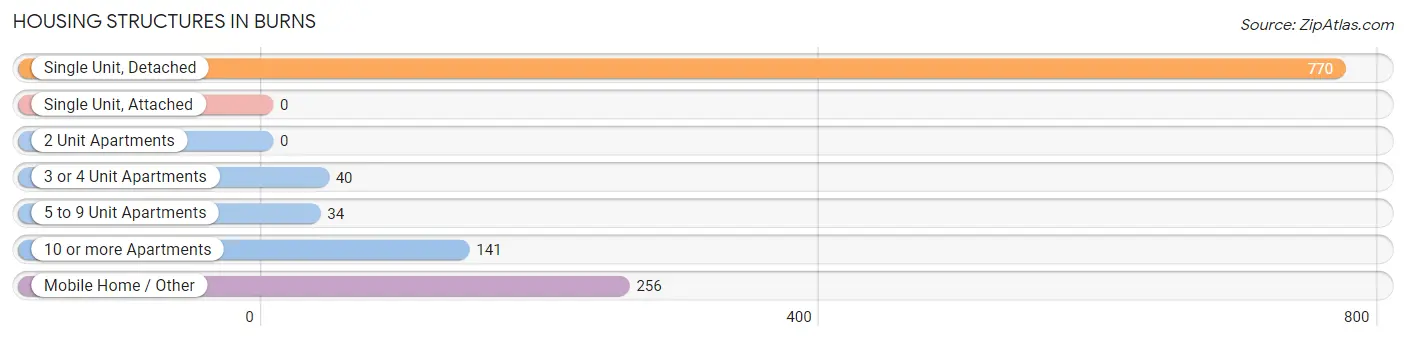
| Structure Type | # Housing Units | % Housing Units |
| Single Unit, Detached | 770 | 62.1% |
| Single Unit, Attached | 0 | 0.0% |
| 2 Unit Apartments | 0 | 0.0% |
| 3 or 4 Unit Apartments | 40 | 3.2% |
| 5 to 9 Unit Apartments | 34 | 2.7% |
| 10 or more Apartments | 141 | 11.4% |
| Mobile Home / Other | 256 | 20.6% |
| Total | 1,241 | 100.0% |
Housing Structures by Occupancy in Burns
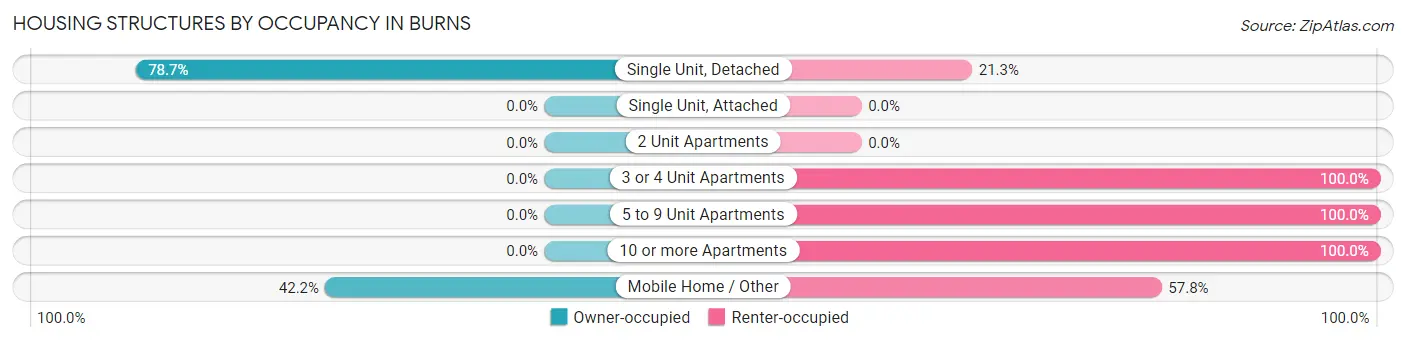
| Structure Type | Owner-occupied | Renter-occupied |
| Single Unit, Detached | 606 (78.7%) | 164 (21.3%) |
| Single Unit, Attached | 0 (0.0%) | 0 (0.0%) |
| 2 Unit Apartments | 0 (0.0%) | 0 (0.0%) |
| 3 or 4 Unit Apartments | 0 (0.0%) | 40 (100.0%) |
| 5 to 9 Unit Apartments | 0 (0.0%) | 34 (100.0%) |
| 10 or more Apartments | 0 (0.0%) | 141 (100.0%) |
| Mobile Home / Other | 108 (42.2%) | 148 (57.8%) |
| Total | 714 (57.5%) | 527 (42.5%) |
Housing Structures by Number of Rooms in Burns
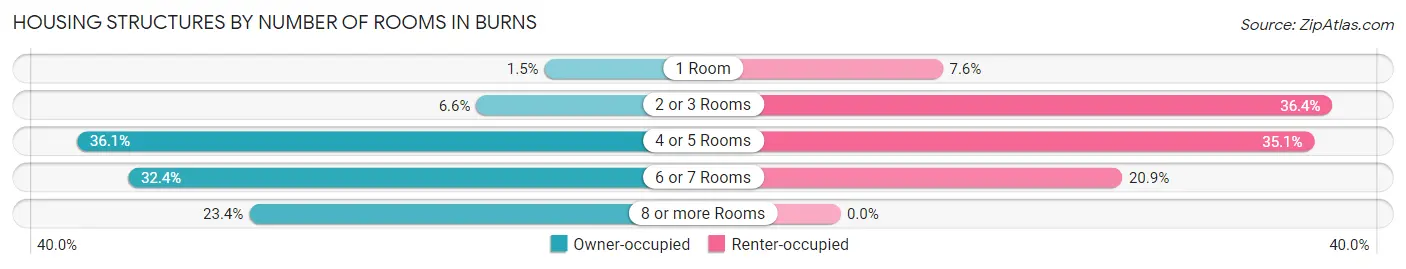
| Number of Rooms | Owner-occupied | Renter-occupied |
| 1 Room | 11 (1.5%) | 40 (7.6%) |
| 2 or 3 Rooms | 47 (6.6%) | 192 (36.4%) |
| 4 or 5 Rooms | 258 (36.1%) | 185 (35.1%) |
| 6 or 7 Rooms | 231 (32.4%) | 110 (20.9%) |
| 8 or more Rooms | 167 (23.4%) | 0 (0.0%) |
| Total | 714 (100.0%) | 527 (100.0%) |
Housing Structure by Heating Type in Burns
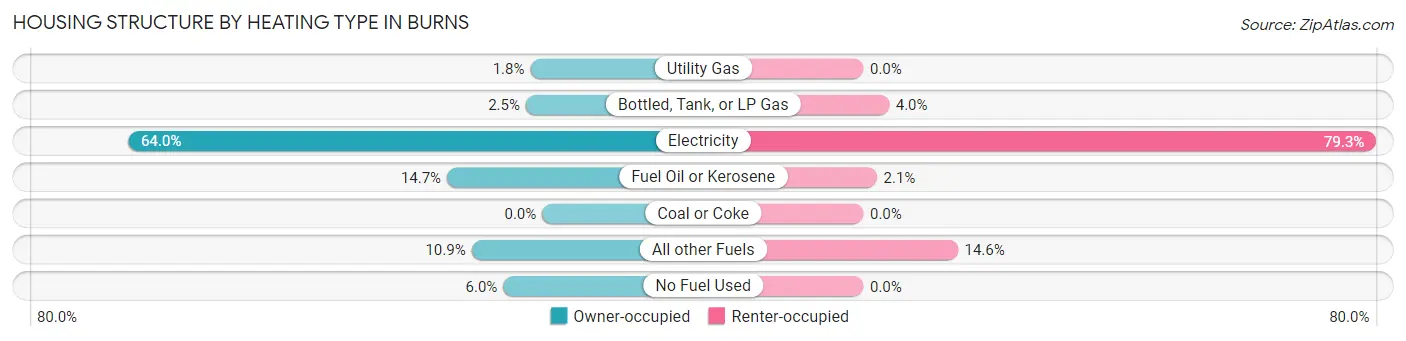
| Heating Type | Owner-occupied | Renter-occupied |
| Utility Gas | 13 (1.8%) | 0 (0.0%) |
| Bottled, Tank, or LP Gas | 18 (2.5%) | 21 (4.0%) |
| Electricity | 457 (64.0%) | 418 (79.3%) |
| Fuel Oil or Kerosene | 105 (14.7%) | 11 (2.1%) |
| Coal or Coke | 0 (0.0%) | 0 (0.0%) |
| All other Fuels | 78 (10.9%) | 77 (14.6%) |
| No Fuel Used | 43 (6.0%) | 0 (0.0%) |
| Total | 714 (100.0%) | 527 (100.0%) |
Household Vehicle Usage in Burns
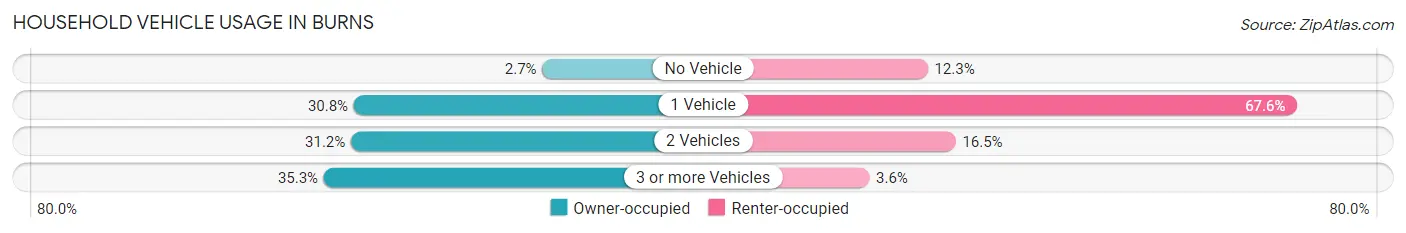
| Vehicles per Household | Owner-occupied | Renter-occupied |
| No Vehicle | 19 (2.7%) | 65 (12.3%) |
| 1 Vehicle | 220 (30.8%) | 356 (67.5%) |
| 2 Vehicles | 223 (31.2%) | 87 (16.5%) |
| 3 or more Vehicles | 252 (35.3%) | 19 (3.6%) |
| Total | 714 (100.0%) | 527 (100.0%) |
Real Estate & Mortgages in Burns
Real Estate and Mortgage Overview in Burns
| Characteristic | Without Mortgage | With Mortgage |
| Housing Units | 289 | 425 |
| Median Property Value | - | - |
| Median Household Income | $50,625 | $43 |
| Monthly Housing Costs | $518 | $45 |
| Real Estate Taxes | $1,302 | $0 |
Property Value by Mortgage Status in Burns
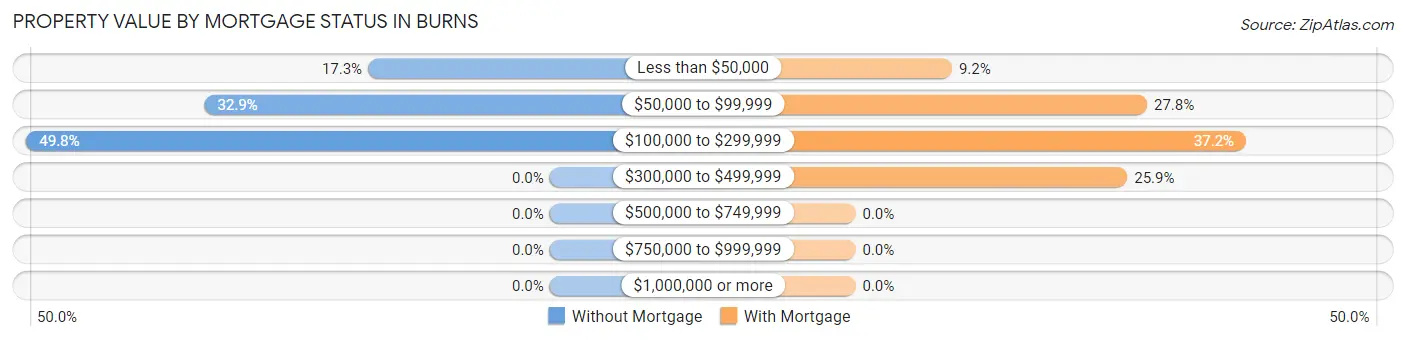
| Property Value | Without Mortgage | With Mortgage |
| Less than $50,000 | 50 (17.3%) | 39 (9.2%) |
| $50,000 to $99,999 | 95 (32.9%) | 118 (27.8%) |
| $100,000 to $299,999 | 144 (49.8%) | 158 (37.2%) |
| $300,000 to $499,999 | 0 (0.0%) | 110 (25.9%) |
| $500,000 to $749,999 | 0 (0.0%) | 0 (0.0%) |
| $750,000 to $999,999 | 0 (0.0%) | 0 (0.0%) |
| $1,000,000 or more | 0 (0.0%) | 0 (0.0%) |
| Total | 289 (100.0%) | 425 (100.0%) |
Household Income by Mortgage Status in Burns
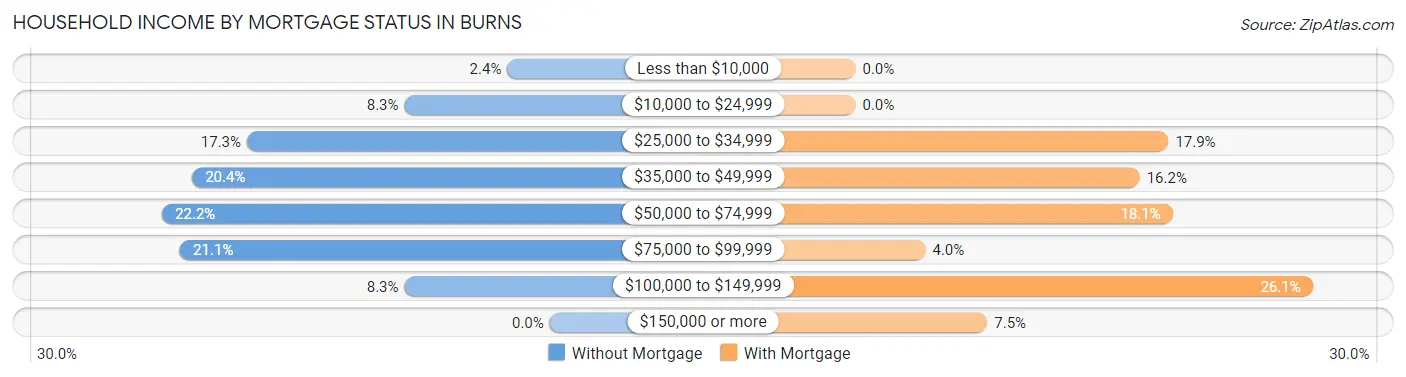
| Household Income | Without Mortgage | With Mortgage |
| Less than $10,000 | 7 (2.4%) | 0 (0.0%) |
| $10,000 to $24,999 | 24 (8.3%) | 0 (0.0%) |
| $25,000 to $34,999 | 50 (17.3%) | 76 (17.9%) |
| $35,000 to $49,999 | 59 (20.4%) | 69 (16.2%) |
| $50,000 to $74,999 | 64 (22.2%) | 77 (18.1%) |
| $75,000 to $99,999 | 61 (21.1%) | 17 (4.0%) |
| $100,000 to $149,999 | 24 (8.3%) | 111 (26.1%) |
| $150,000 or more | 0 (0.0%) | 32 (7.5%) |
| Total | 289 (100.0%) | 425 (100.0%) |
Property Value to Household Income Ratio in Burns
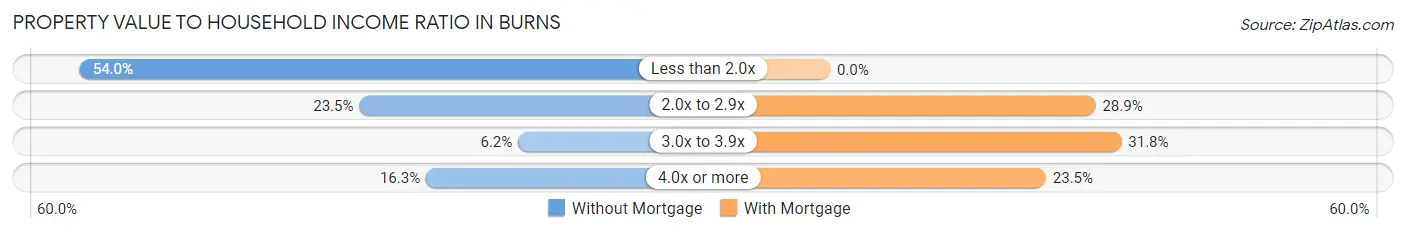
| Value-to-Income Ratio | Without Mortgage | With Mortgage |
| Less than 2.0x | 156 (54.0%) | 0 (0.0%) |
| 2.0x to 2.9x | 68 (23.5%) | 123 (28.9%) |
| 3.0x to 3.9x | 18 (6.2%) | 135 (31.8%) |
| 4.0x or more | 47 (16.3%) | 100 (23.5%) |
| Total | 289 (100.0%) | 425 (100.0%) |
Real Estate Taxes by Mortgage Status in Burns
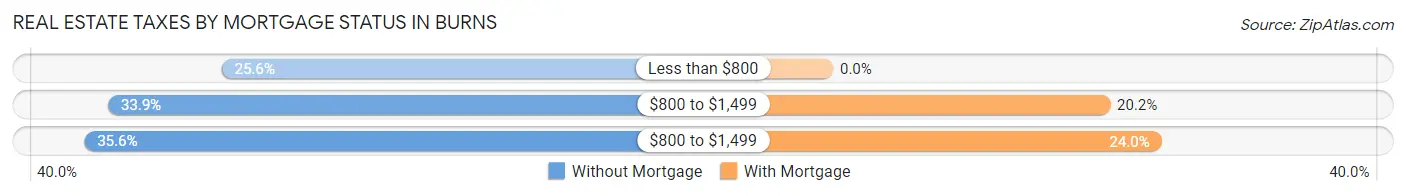
| Property Taxes | Without Mortgage | With Mortgage |
| Less than $800 | 74 (25.6%) | 0 (0.0%) |
| $800 to $1,499 | 98 (33.9%) | 86 (20.2%) |
| $800 to $1,499 | 103 (35.6%) | 102 (24.0%) |
| Total | 289 (100.0%) | 425 (100.0%) |
Health & Disability in Burns
Health Insurance Coverage by Age in Burns
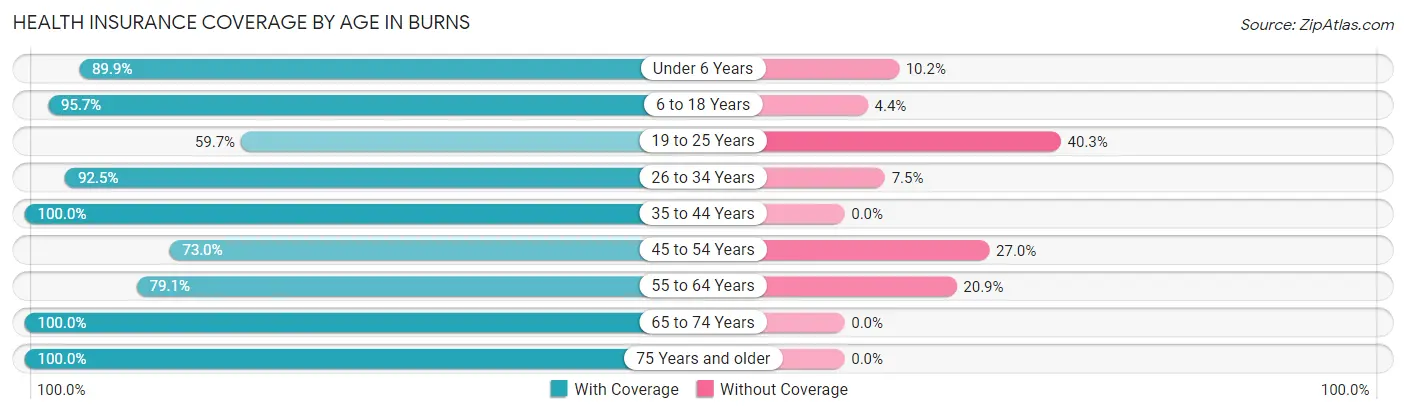
| Age Bracket | With Coverage | Without Coverage |
| Under 6 Years | 177 (89.8%) | 20 (10.2%) |
| 6 to 18 Years | 242 (95.7%) | 11 (4.3%) |
| 19 to 25 Years | 139 (59.7%) | 94 (40.3%) |
| 26 to 34 Years | 331 (92.5%) | 27 (7.5%) |
| 35 to 44 Years | 289 (100.0%) | 0 (0.0%) |
| 45 to 54 Years | 173 (73.0%) | 64 (27.0%) |
| 55 to 64 Years | 420 (79.1%) | 111 (20.9%) |
| 65 to 74 Years | 377 (100.0%) | 0 (0.0%) |
| 75 Years and older | 191 (100.0%) | 0 (0.0%) |
| Total | 2,339 (87.7%) | 327 (12.3%) |
Health Insurance Coverage by Citizenship Status in Burns
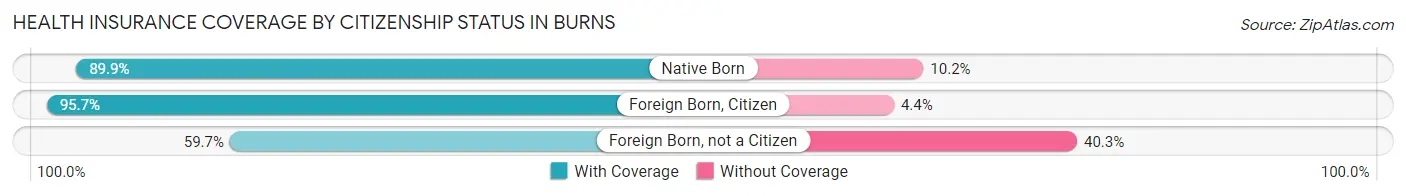
| Citizenship Status | With Coverage | Without Coverage |
| Native Born | 177 (89.8%) | 20 (10.2%) |
| Foreign Born, Citizen | 242 (95.7%) | 11 (4.3%) |
| Foreign Born, not a Citizen | 139 (59.7%) | 94 (40.3%) |
Health Insurance Coverage by Household Income in Burns
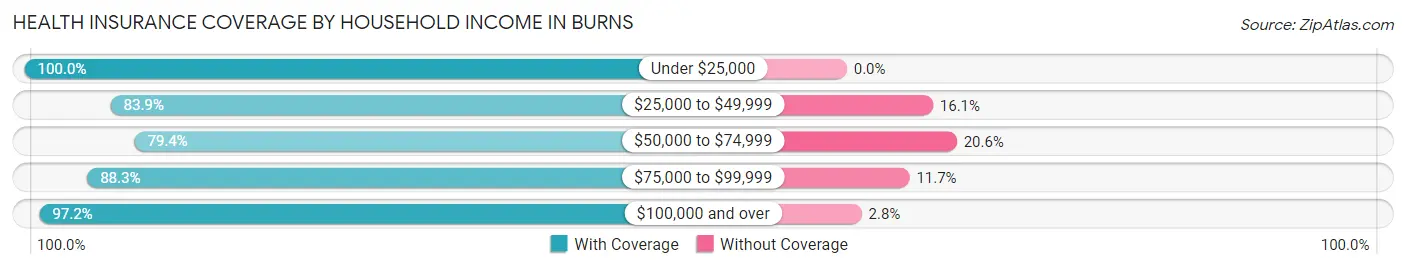
| Household Income | With Coverage | Without Coverage |
| Under $25,000 | 319 (100.0%) | 0 (0.0%) |
| $25,000 to $49,999 | 838 (83.9%) | 161 (16.1%) |
| $50,000 to $74,999 | 405 (79.4%) | 105 (20.6%) |
| $75,000 to $99,999 | 376 (88.3%) | 50 (11.7%) |
| $100,000 and over | 384 (97.2%) | 11 (2.8%) |
Public vs Private Health Insurance Coverage by Age in Burns
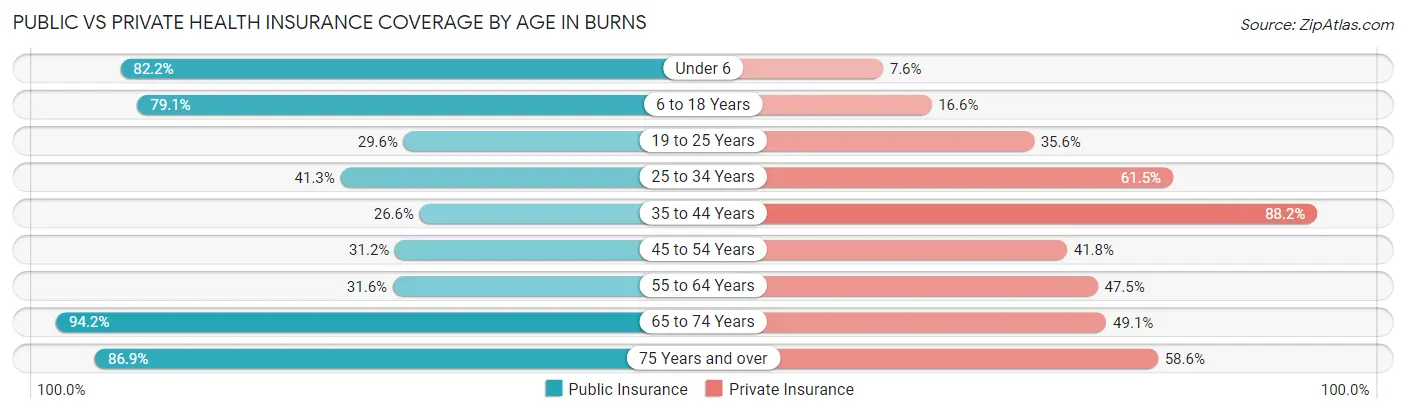
| Age Bracket | Public Insurance | Private Insurance |
| Under 6 | 162 (82.2%) | 15 (7.6%) |
| 6 to 18 Years | 200 (79.0%) | 42 (16.6%) |
| 19 to 25 Years | 69 (29.6%) | 83 (35.6%) |
| 25 to 34 Years | 148 (41.3%) | 220 (61.5%) |
| 35 to 44 Years | 77 (26.6%) | 255 (88.2%) |
| 45 to 54 Years | 74 (31.2%) | 99 (41.8%) |
| 55 to 64 Years | 168 (31.6%) | 252 (47.5%) |
| 65 to 74 Years | 355 (94.2%) | 185 (49.1%) |
| 75 Years and over | 166 (86.9%) | 112 (58.6%) |
| Total | 1,419 (53.2%) | 1,263 (47.4%) |
Disability Status by Sex by Age in Burns
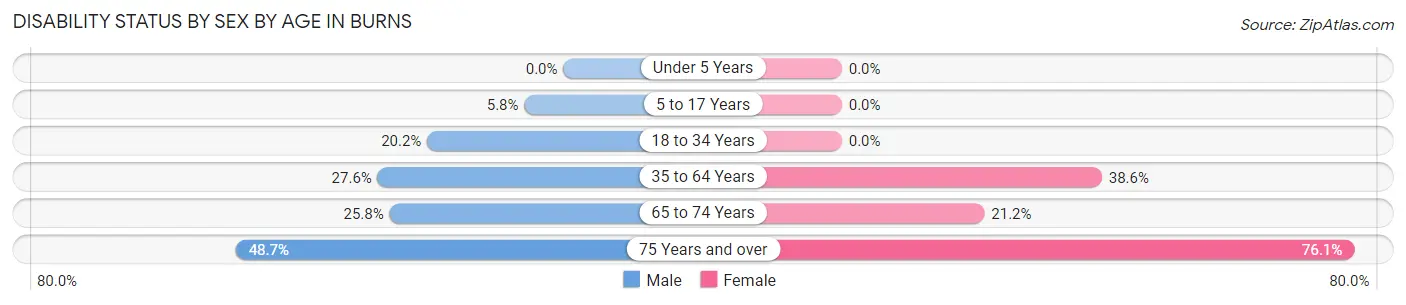
| Age Bracket | Male | Female |
| Under 5 Years | 0 (0.0%) | 0 (0.0%) |
| 5 to 17 Years | 11 (5.8%) | 0 (0.0%) |
| 18 to 34 Years | 55 (20.2%) | 0 (0.0%) |
| 35 to 64 Years | 145 (27.6%) | 205 (38.6%) |
| 65 to 74 Years | 40 (25.8%) | 47 (21.2%) |
| 75 Years and over | 36 (48.6%) | 89 (76.1%) |
Disability Class by Sex by Age in Burns
Disability Class: Hearing Difficulty
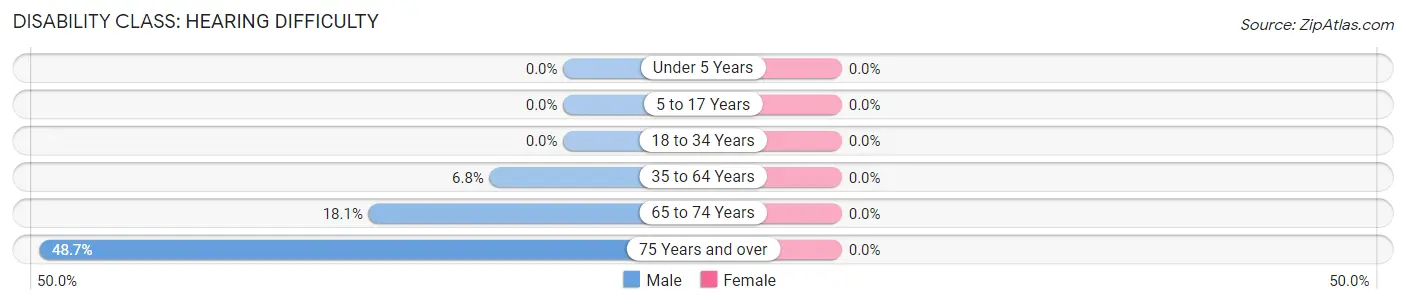
| Age Bracket | Male | Female |
| Under 5 Years | 0 (0.0%) | 0 (0.0%) |
| 5 to 17 Years | 0 (0.0%) | 0 (0.0%) |
| 18 to 34 Years | 0 (0.0%) | 0 (0.0%) |
| 35 to 64 Years | 36 (6.8%) | 0 (0.0%) |
| 65 to 74 Years | 28 (18.1%) | 0 (0.0%) |
| 75 Years and over | 36 (48.6%) | 0 (0.0%) |
Disability Class: Vision Difficulty
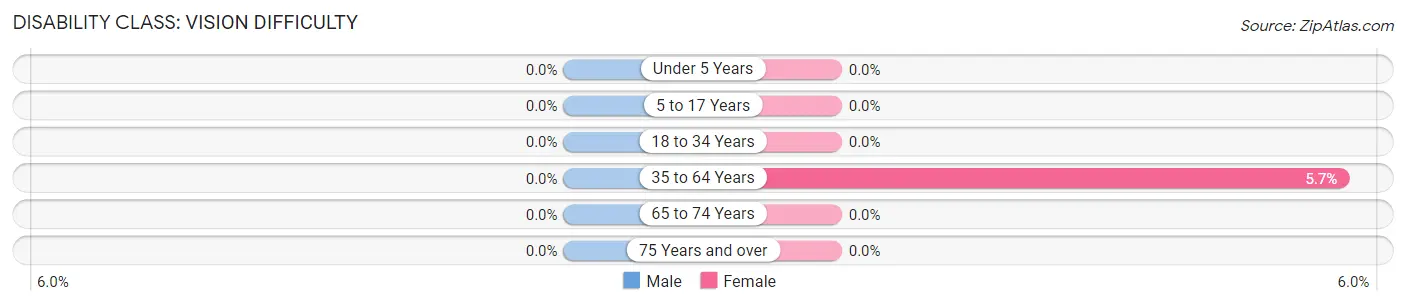
| Age Bracket | Male | Female |
| Under 5 Years | 0 (0.0%) | 0 (0.0%) |
| 5 to 17 Years | 0 (0.0%) | 0 (0.0%) |
| 18 to 34 Years | 0 (0.0%) | 0 (0.0%) |
| 35 to 64 Years | 0 (0.0%) | 30 (5.7%) |
| 65 to 74 Years | 0 (0.0%) | 0 (0.0%) |
| 75 Years and over | 0 (0.0%) | 0 (0.0%) |
Disability Class: Cognitive Difficulty
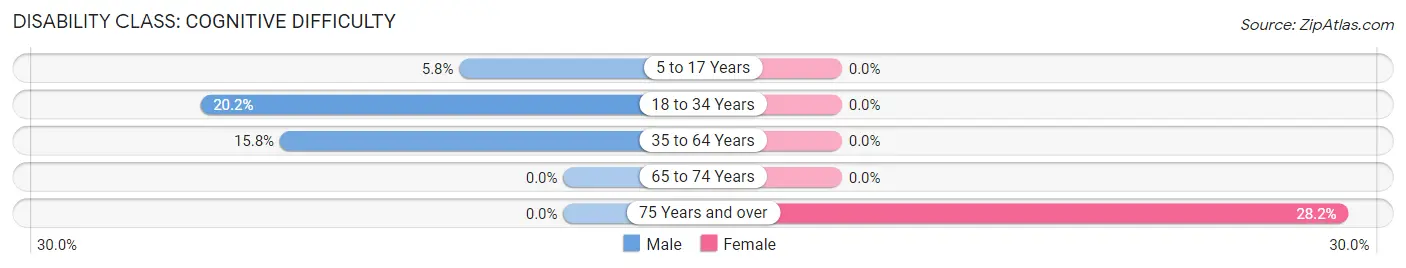
| Age Bracket | Male | Female |
| 5 to 17 Years | 11 (5.8%) | 0 (0.0%) |
| 18 to 34 Years | 55 (20.2%) | 0 (0.0%) |
| 35 to 64 Years | 83 (15.8%) | 0 (0.0%) |
| 65 to 74 Years | 0 (0.0%) | 0 (0.0%) |
| 75 Years and over | 0 (0.0%) | 33 (28.2%) |
Disability Class: Ambulatory Difficulty
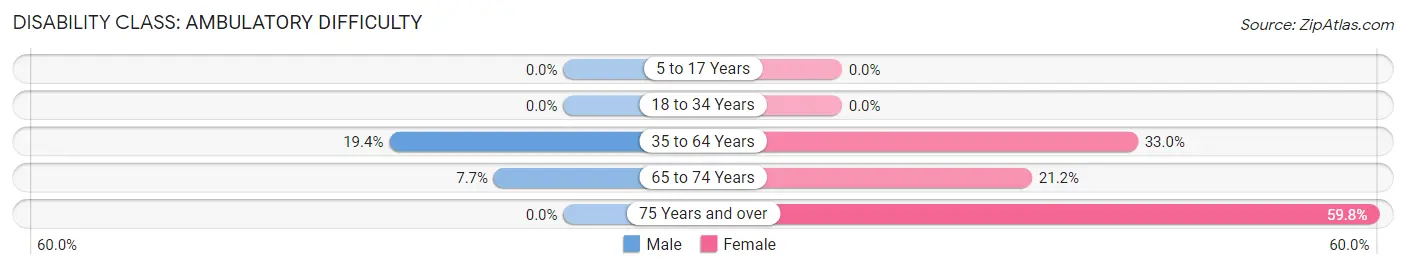
| Age Bracket | Male | Female |
| 5 to 17 Years | 0 (0.0%) | 0 (0.0%) |
| 18 to 34 Years | 0 (0.0%) | 0 (0.0%) |
| 35 to 64 Years | 102 (19.4%) | 175 (33.0%) |
| 65 to 74 Years | 12 (7.7%) | 47 (21.2%) |
| 75 Years and over | 0 (0.0%) | 70 (59.8%) |
Disability Class: Self-Care Difficulty
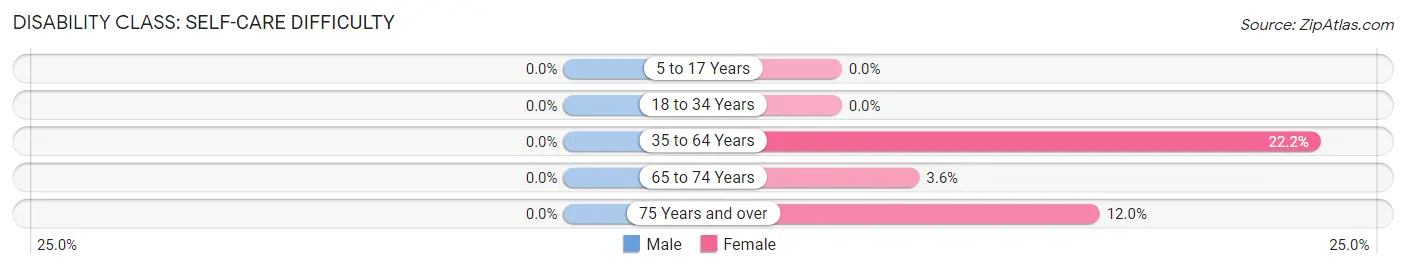
| Age Bracket | Male | Female |
| 5 to 17 Years | 0 (0.0%) | 0 (0.0%) |
| 18 to 34 Years | 0 (0.0%) | 0 (0.0%) |
| 35 to 64 Years | 0 (0.0%) | 118 (22.2%) |
| 65 to 74 Years | 0 (0.0%) | 8 (3.6%) |
| 75 Years and over | 0 (0.0%) | 14 (12.0%) |
Technology Access in Burns
Computing Device Access in Burns
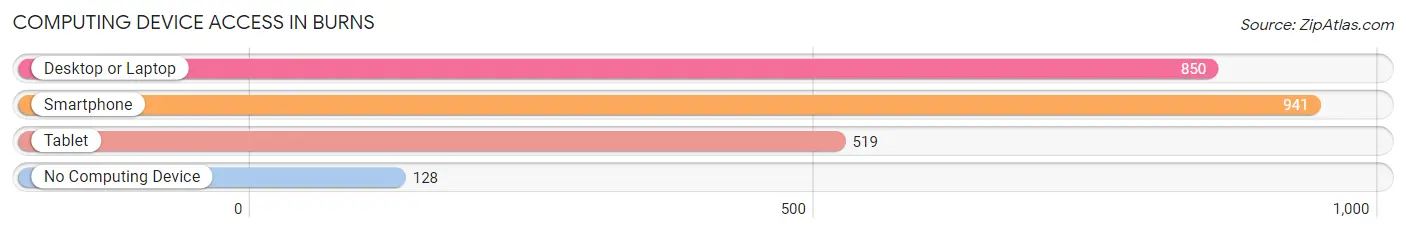
| Device Type | # Households | % Households |
| Desktop or Laptop | 850 | 68.5% |
| Smartphone | 941 | 75.8% |
| Tablet | 519 | 41.8% |
| No Computing Device | 128 | 10.3% |
| Total | 1,241 | 100.0% |
Internet Access in Burns
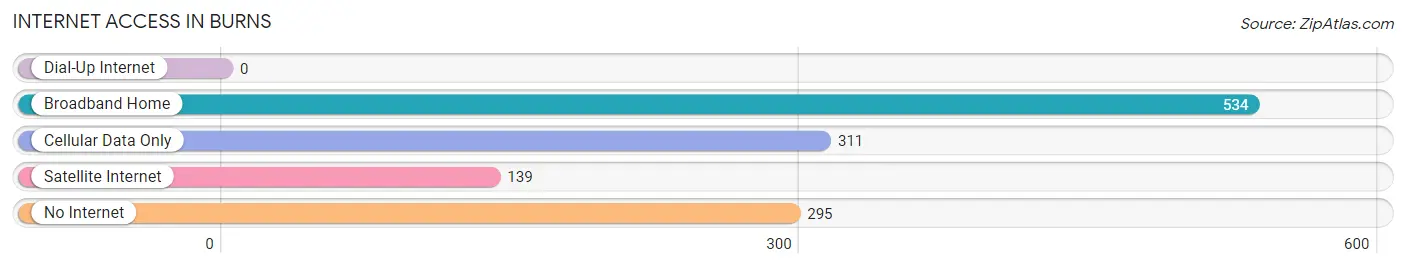
| Internet Type | # Households | % Households |
| Dial-Up Internet | 0 | 0.0% |
| Broadband Home | 534 | 43.0% |
| Cellular Data Only | 311 | 25.1% |
| Satellite Internet | 139 | 11.2% |
| No Internet | 295 | 23.8% |
| Total | 1,241 | 100.0% |
Burns Summary
Burns is a city located in Harney County, Oregon, United States. It is the county seat of Harney County and the largest city in the county. The population was 2,806 at the 2010 census. The city is located in the high desert of southeastern Oregon, approximately 78 miles (126 km) south of Bend and 180 miles (290 km) southeast of Portland.
History
The area around Burns was first inhabited by the Northern Paiute people. The first white settlers arrived in the area in the late 1860s, and the city was founded in 1883. The city was named after the Scottish poet Robert Burns.
The city was incorporated in 1887 and was the largest city in Harney County until the early 1900s. In the early 1900s, the city was a major center for sheep and cattle ranching. The city also served as a major trading center for the surrounding area.
In the 1920s, the city experienced a period of growth and development. The city was home to several businesses, including a bank, a hotel, a movie theater, and a newspaper.
In the 1950s, the city experienced a period of decline as the local economy shifted away from ranching and towards tourism. The city was also affected by the construction of the John Day Dam, which flooded much of the surrounding area.
Geography
Burns is located in the high desert of southeastern Oregon, approximately 78 miles (126 km) south of Bend and 180 miles (290 km) southeast of Portland. The city is situated at the confluence of the Silvies River and the Malheur River. The city is surrounded by the Malheur National Forest and is located near the Steens Mountain Wilderness Area.
The city has a total area of 4 2 square miles 10 8 km2 all of which is land
Economy
The economy of Burns is largely based on agriculture, tourism, and government services. The city is home to several agricultural businesses, including a large cattle ranch and a sheep ranch. The city is also home to several tourist attractions, including the Malheur National Wildlife Refuge and the Steens Mountain Wilderness Area.
The city is also home to several government services, including the Harney County Courthouse and the Harney County Sheriff's Office.
Demographics
As of the 2010 census, there were 2,806 people, 1,093 households, and 690 families residing in the city. The population density was 668.2 people per square mile (258.2/km2). There were 1,223 housing units at an average density of 293.2 per square mile (113.3/km2). The racial makeup of the city was 87.2% White, 0.3% African American, 1.7% Native American, 0.7% Asian, 0.1% Pacific Islander, 7.2% from other races, and 3.0% from two or more races. Hispanic or Latino of any race were 13.2% of the population.
There were 1,093 households, out of which 28.2% had children under the age of 18 living with them, 48.2% were married couples living together, 11.2% had a female householder with no husband present, and 35.2% were non-families. 29.7% of all households were made up of individuals, and 13.2% had someone living alone who was 65 years of age or older. The average household size was 2.50 and the average family size was 3.09.
In the city, the population was spread out, with 25.7% under the age of 18, 8.2% from 18 to 24, 24.2% from 25 to 44, 25.2% from 45 to 64, and 16.7% who were 65 years of age or older. The median age was 39 years. For every 100 females, there were 97.2 males. For every 100 females age 18 and over, there were 94.2 males.
The median income for a household in the city was $30,938, and the median income for a family was $36,250. Males had a median income of $30,000 versus $20,000 for females. The per capita income for the city was $15,945. About 13.2% of families and 17.2% of the population were below the poverty line, including 22.2% of those under age 18 and 10.2% of those age 65 or over.
Common Questions
What is Per Capita Income in Burns?
Per Capita income in Burns is $23,934.
What is the Median Family Income in Burns?
Median Family Income in Burns is $46,394.
What is the Median Household income in Burns?
Median Household Income in Burns is $41,374.
What is Income or Wage Gap in Burns?
Income or Wage Gap in Burns is 24.7%.
Women in Burns earn 75.3 cents for every dollar earned by a man.
What is Inequality or Gini Index in Burns?
Inequality or Gini Index in Burns is 0.38.
What is the Total Population of Burns?
Total Population of Burns is 2,735.
What is the Total Male Population of Burns?
Total Male Population of Burns is 1,349.
What is the Total Female Population of Burns?
Total Female Population of Burns is 1,386.
What is the Ratio of Males per 100 Females in Burns?
There are 97.33 Males per 100 Females in Burns.
What is the Ratio of Females per 100 Males in Burns?
There are 102.74 Females per 100 Males in Burns.
What is the Median Population Age in Burns?
Median Population Age in Burns is 43.5 Years.
What is the Average Family Size in Burns
Average Family Size in Burns is 2.7 People.
What is the Average Household Size in Burns
Average Household Size in Burns is 2.1 People.
How Large is the Labor Force in Burns?
There are 1,276 People in the Labor Forcein in Burns.
What is the Percentage of People in the Labor Force in Burns?
55.2% of People are in the Labor Force in Burns.
What is the Unemployment Rate in Burns?
Unemployment Rate in Burns is 6.6%.