Beavercreek, OR Map & Demographics
Beavercreek Map
Beavercreek Overview
$54,068
PER CAPITA INCOME
$121,597
AVG FAMILY INCOME
$119,119
AVG HOUSEHOLD INCOME
22.6%
WAGE / INCOME GAP [ % ]
77.4¢/ $1
WAGE / INCOME GAP [ $ ]
0.37
INEQUALITY / GINI INDEX
4,532
TOTAL POPULATION
2,518
MALE POPULATION
2,014
FEMALE POPULATION
125.02
MALES / 100 FEMALES
79.98
FEMALES / 100 MALES
47.2
MEDIAN AGE
3.0
AVG FAMILY SIZE
2.8
AVG HOUSEHOLD SIZE
2,308
LABOR FORCE [ PEOPLE ]
61.7%
PERCENT IN LABOR FORCE
3.0%
UNEMPLOYMENT RATE
Beavercreek Zip Codes
Beavercreek Area Codes
Income in Beavercreek
Income Overview in Beavercreek
Per Capita Income in Beavercreek is $54,068, while median incomes of families and households are $121,597 and $119,119 respectively.
| Characteristic | Number | Measure |
| Per Capita Income | 4,532 | $54,068 |
| Median Family Income | 1,337 | $121,597 |
| Mean Family Income | 1,337 | $152,975 |
| Median Household Income | 1,641 | $119,119 |
| Mean Household Income | 1,641 | $147,154 |
| Income Deficit | 1,337 | $0 |
| Wage / Income Gap (%) | 4,532 | 22.61% |
| Wage / Income Gap ($) | 4,532 | 77.39¢ per $1 |
| Gini / Inequality Index | 4,532 | 0.37 |
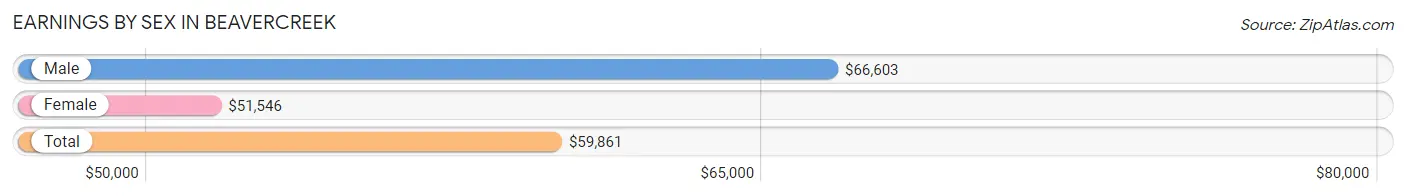
Earnings by Sex in Beavercreek
Average Earnings in Beavercreek are $59,861, $66,603 for men and $51,546 for women, a difference of 22.6%.
| Sex | Number | Average Earnings |
| Male | 1,410 (59.4%) | $66,603 |
| Female | 965 (40.6%) | $51,546 |
| Total | 2,375 (100.0%) | $59,861 |
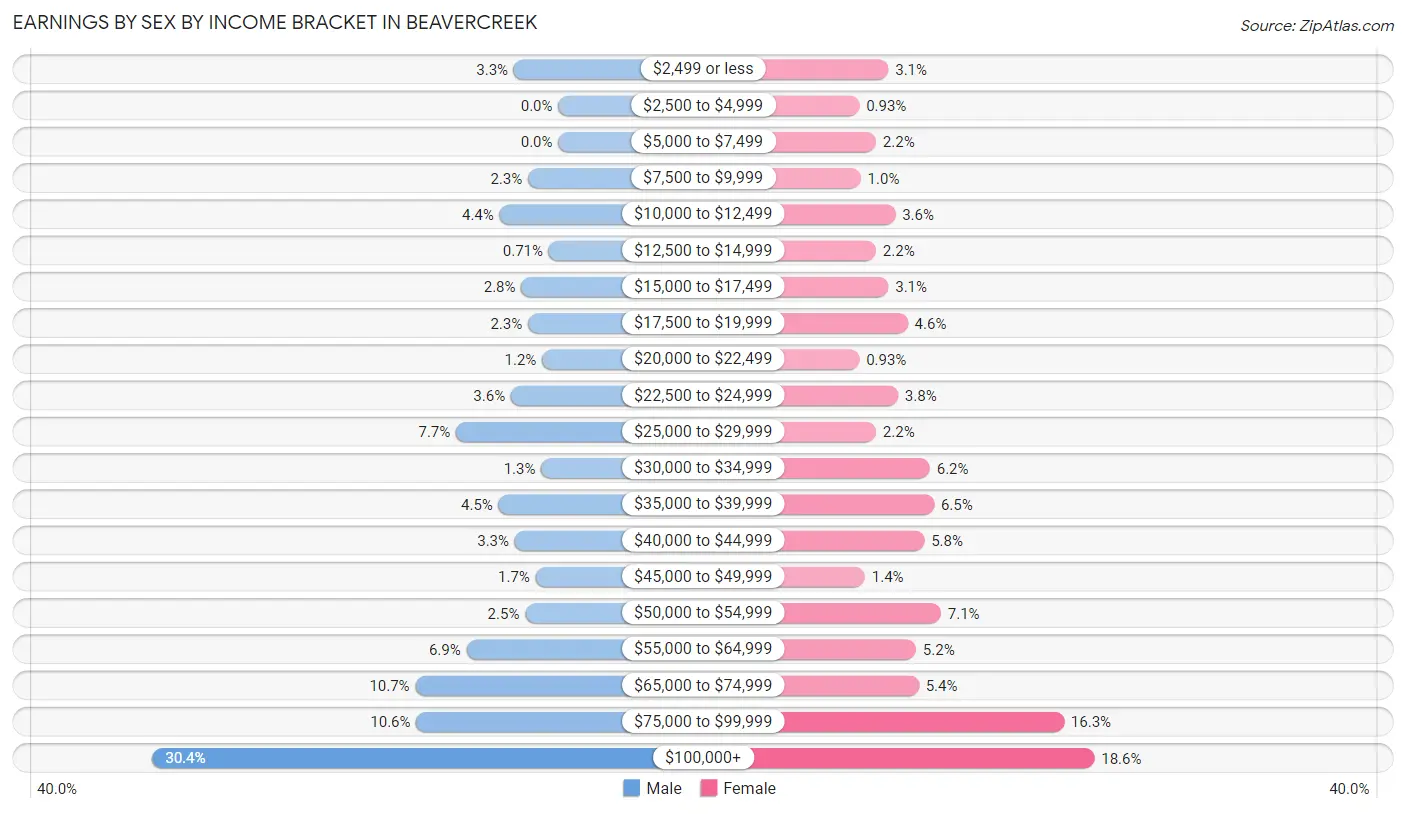
Earnings by Sex by Income Bracket in Beavercreek
The most common earnings brackets in Beavercreek are $100,000+ for men (429 | 30.4%) and $100,000+ for women (179 | 18.5%).
| Income | Male | Female |
| $2,499 or less | 47 (3.3%) | 30 (3.1%) |
| $2,500 to $4,999 | 0 (0.0%) | 9 (0.9%) |
| $5,000 to $7,499 | 0 (0.0%) | 21 (2.2%) |
| $7,500 to $9,999 | 32 (2.3%) | 10 (1.0%) |
| $10,000 to $12,499 | 62 (4.4%) | 35 (3.6%) |
| $12,500 to $14,999 | 10 (0.7%) | 21 (2.2%) |
| $15,000 to $17,499 | 39 (2.8%) | 30 (3.1%) |
| $17,500 to $19,999 | 32 (2.3%) | 44 (4.6%) |
| $20,000 to $22,499 | 17 (1.2%) | 9 (0.9%) |
| $22,500 to $24,999 | 50 (3.5%) | 37 (3.8%) |
| $25,000 to $29,999 | 108 (7.7%) | 21 (2.2%) |
| $30,000 to $34,999 | 18 (1.3%) | 60 (6.2%) |
| $35,000 to $39,999 | 63 (4.5%) | 63 (6.5%) |
| $40,000 to $44,999 | 46 (3.3%) | 56 (5.8%) |
| $45,000 to $49,999 | 24 (1.7%) | 13 (1.3%) |
| $50,000 to $54,999 | 35 (2.5%) | 68 (7.0%) |
| $55,000 to $64,999 | 97 (6.9%) | 50 (5.2%) |
| $65,000 to $74,999 | 151 (10.7%) | 52 (5.4%) |
| $75,000 to $99,999 | 150 (10.6%) | 157 (16.3%) |
| $100,000+ | 429 (30.4%) | 179 (18.5%) |
| Total | 1,410 (100.0%) | 965 (100.0%) |
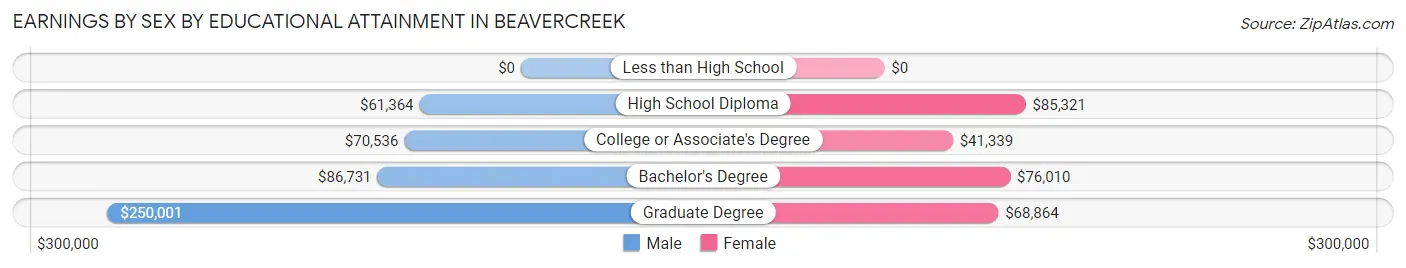
Earnings by Sex by Educational Attainment in Beavercreek
Average earnings in Beavercreek are $70,911 for men and $53,542 for women, a difference of 24.5%. Men with an educational attainment of graduate degree enjoy the highest average annual earnings of $250,001, while those with high school diploma education earn the least with $61,364. Women with an educational attainment of high school diploma earn the most with the average annual earnings of $85,321, while those with college or associate's degree education have the smallest earnings of $41,339.
| Educational Attainment | Male Income | Female Income |
| Less than High School | - | - |
| High School Diploma | $61,364 | $85,321 |
| College or Associate's Degree | $70,536 | $41,339 |
| Bachelor's Degree | $86,731 | $76,010 |
| Graduate Degree | $250,001 | $68,864 |
| Total | $70,911 | $53,542 |
Family Income in Beavercreek
Family Income Brackets in Beavercreek
According to the Beavercreek family income data, there are 459 families falling into the $100,000 to $149,999 income range, which is the most common income bracket and makes up 34.3% of all families.
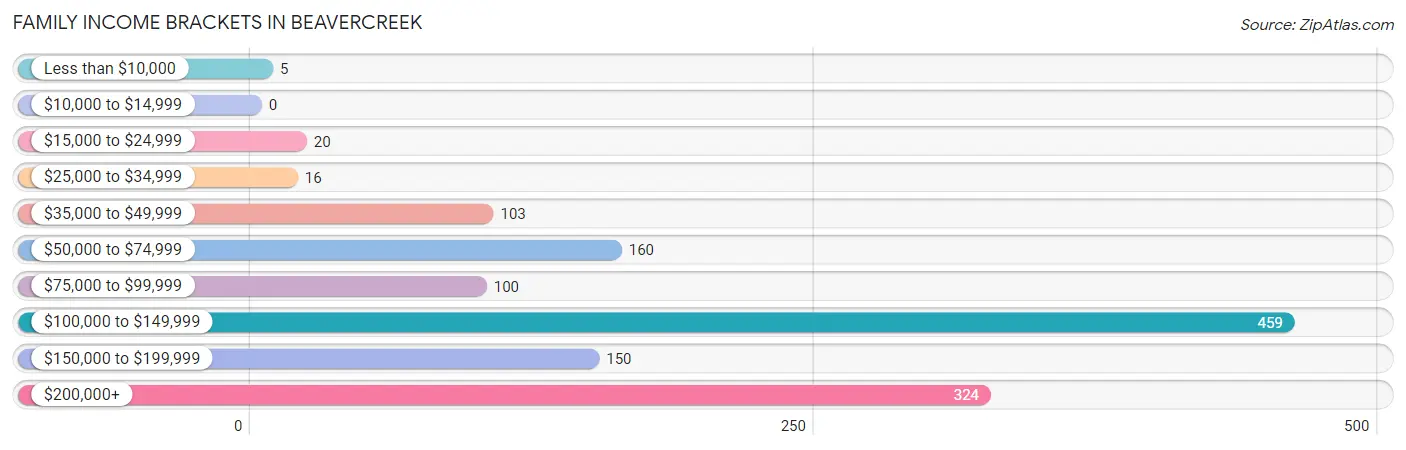
| Income Bracket | # Families | % Families |
| Less than $10,000 | 5 | 0.4% |
| $10,000 to $14,999 | 0 | 0.0% |
| $15,000 to $24,999 | 20 | 1.5% |
| $25,000 to $34,999 | 16 | 1.2% |
| $35,000 to $49,999 | 103 | 7.7% |
| $50,000 to $74,999 | 160 | 12.0% |
| $75,000 to $99,999 | 100 | 7.5% |
| $100,000 to $149,999 | 459 | 34.3% |
| $150,000 to $199,999 | 150 | 11.2% |
| $200,000+ | 324 | 24.2% |
Family Income by Famaliy Size in Beavercreek
5-person families (74 | 5.5%) account for the highest median family income in Beavercreek with $250,001 per family, while 2-person families (688 | 51.5%) have the highest median income of $52,724 per family member.
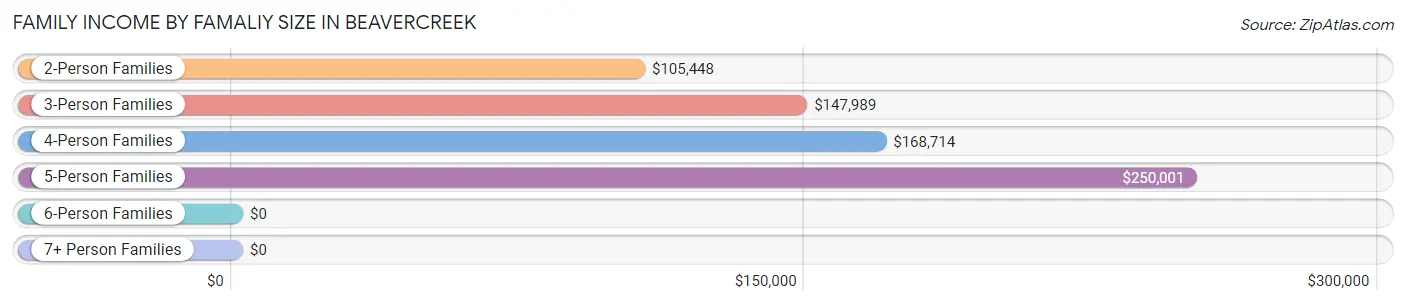
| Income Bracket | # Families | Median Income |
| 2-Person Families | 688 (51.5%) | $105,448 |
| 3-Person Families | 253 (18.9%) | $147,989 |
| 4-Person Families | 292 (21.8%) | $168,714 |
| 5-Person Families | 74 (5.5%) | $250,001 |
| 6-Person Families | 15 (1.1%) | $0 |
| 7+ Person Families | 15 (1.1%) | $0 |
| Total | 1,337 (100.0%) | $121,597 |
Family Income by Number of Earners in Beavercreek
The median family income in Beavercreek is $121,597, with families comprising 3+ earners (194) having the highest median family income of $250,001, while families with no earners (307) have the lowest median family income of $84,028, accounting for 14.5% and 23.0% of families, respectively.
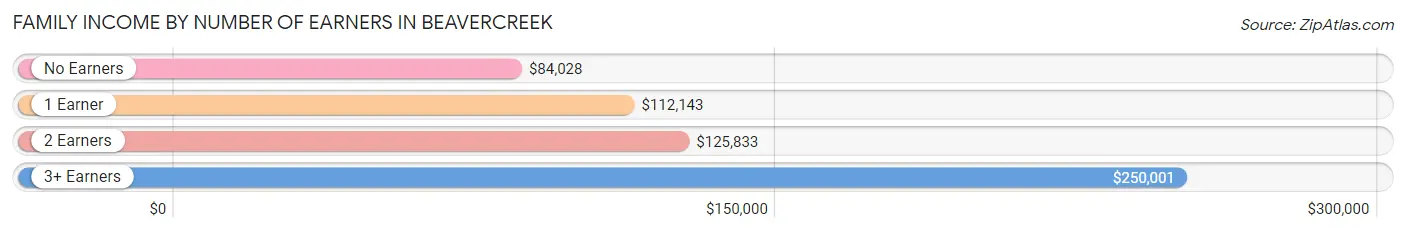
| Number of Earners | # Families | Median Income |
| No Earners | 307 (23.0%) | $84,028 |
| 1 Earner | 330 (24.7%) | $112,143 |
| 2 Earners | 506 (37.9%) | $125,833 |
| 3+ Earners | 194 (14.5%) | $250,001 |
| Total | 1,337 (100.0%) | $121,597 |
Household Income in Beavercreek
Household Income Brackets in Beavercreek
With 505 households falling in the category, the $100,000 to $149,999 income range is the most frequent in Beavercreek, accounting for 30.8% of all households. In contrast, only 8 households (0.5%) fall into the $10,000 to $14,999 income bracket, making it the least populous group.
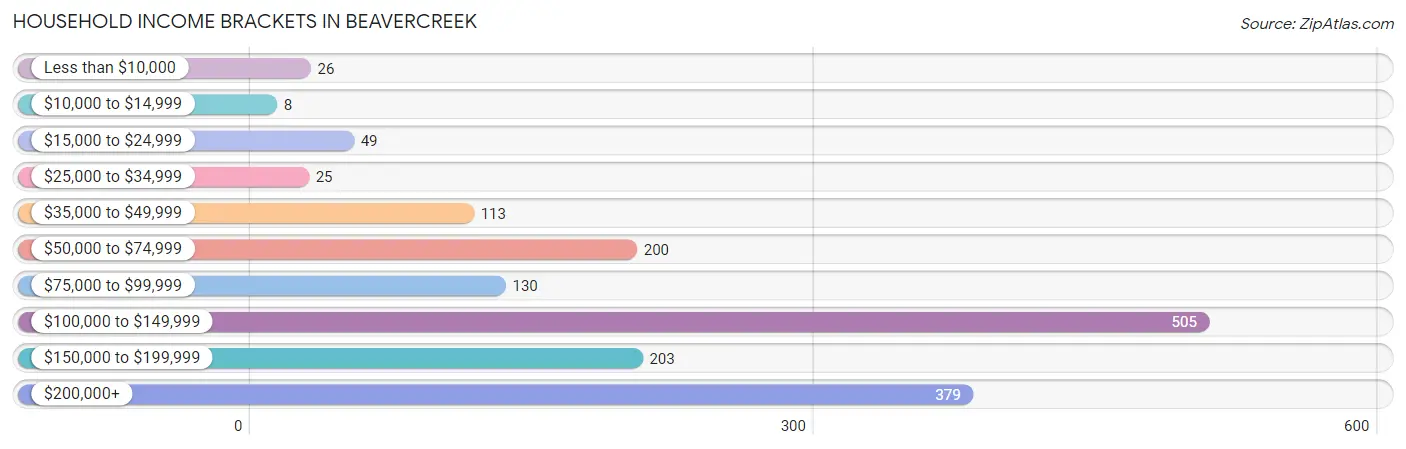
| Income Bracket | # Households | % Households |
| Less than $10,000 | 26 | 1.6% |
| $10,000 to $14,999 | 8 | 0.5% |
| $15,000 to $24,999 | 49 | 3.0% |
| $25,000 to $34,999 | 25 | 1.5% |
| $35,000 to $49,999 | 113 | 6.9% |
| $50,000 to $74,999 | 200 | 12.2% |
| $75,000 to $99,999 | 130 | 7.9% |
| $100,000 to $149,999 | 505 | 30.8% |
| $150,000 to $199,999 | 203 | 12.4% |
| $200,000+ | 379 | 23.1% |
Household Income by Householder Age in Beavercreek
The median household income in Beavercreek is $119,119, with the highest median household income of $167,557 found in the 45 to 64 years age bracket for the primary householder. A total of 704 households (42.9%) fall into this category. Meanwhile, the 15 to 24 years age bracket for the primary householder has the lowest median household income of $0, with 19 households (1.2%) in this group.
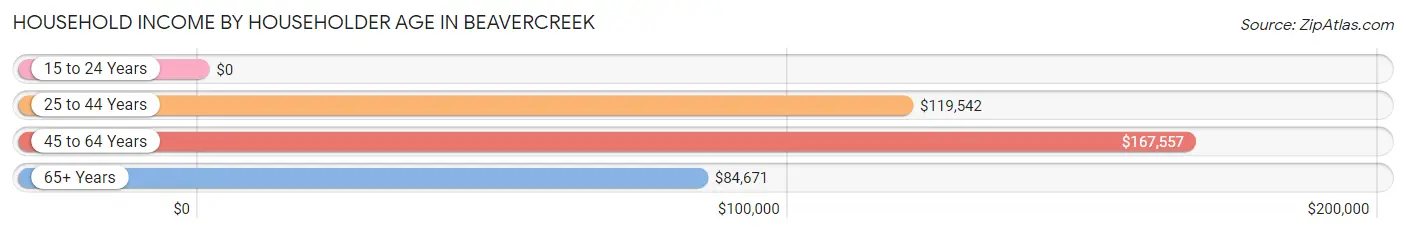
| Income Bracket | # Households | Median Income |
| 15 to 24 Years | 19 (1.2%) | $0 |
| 25 to 44 Years | 379 (23.1%) | $119,542 |
| 45 to 64 Years | 704 (42.9%) | $167,557 |
| 65+ Years | 539 (32.9%) | $84,671 |
| Total | 1,641 (100.0%) | $119,119 |
Poverty in Beavercreek
Income Below Poverty by Sex and Age in Beavercreek
With 1.8% poverty level for males and 4.7% for females among the residents of Beavercreek, 55 to 64 year old males and 18 to 24 year old females are the most vulnerable to poverty, with 34 males (7.4%) and 43 females (55.1%) in their respective age groups living below the poverty level.
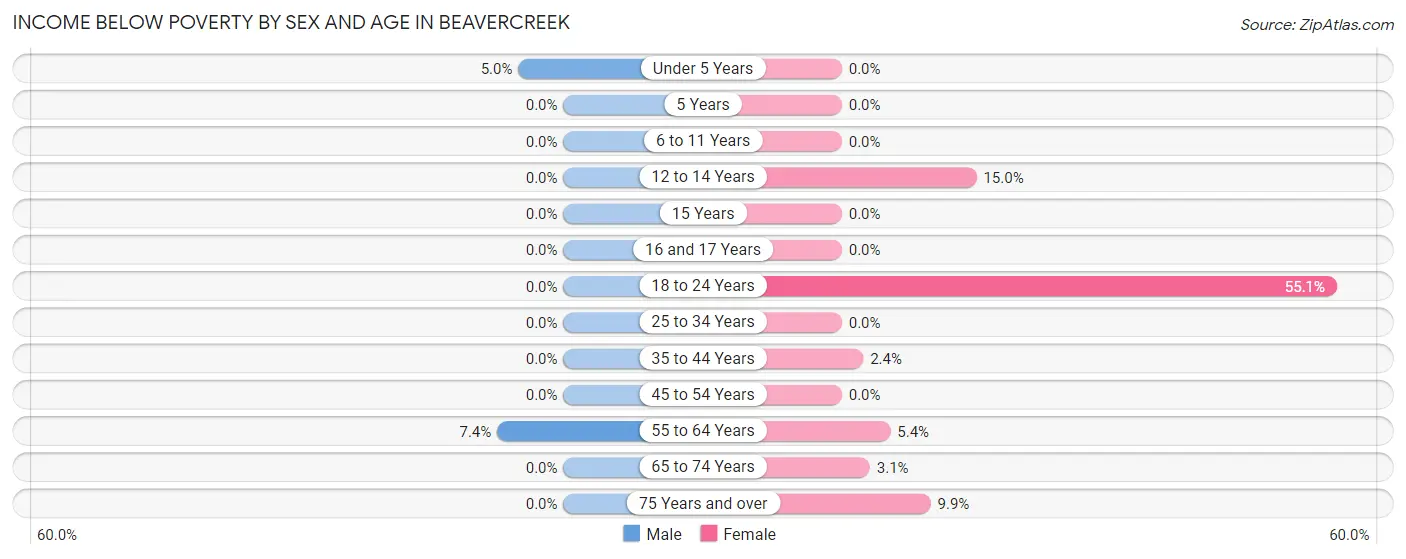
| Age Bracket | Male | Female |
| Under 5 Years | 11 (5.0%) | 0 (0.0%) |
| 5 Years | 0 (0.0%) | 0 (0.0%) |
| 6 to 11 Years | 0 (0.0%) | 0 (0.0%) |
| 12 to 14 Years | 0 (0.0%) | 9 (15.0%) |
| 15 Years | 0 (0.0%) | 0 (0.0%) |
| 16 and 17 Years | 0 (0.0%) | 0 (0.0%) |
| 18 to 24 Years | 0 (0.0%) | 43 (55.1%) |
| 25 to 34 Years | 0 (0.0%) | 0 (0.0%) |
| 35 to 44 Years | 0 (0.0%) | 9 (2.4%) |
| 45 to 54 Years | 0 (0.0%) | 0 (0.0%) |
| 55 to 64 Years | 34 (7.4%) | 16 (5.4%) |
| 65 to 74 Years | 0 (0.0%) | 9 (3.1%) |
| 75 Years and over | 0 (0.0%) | 9 (9.9%) |
| Total | 45 (1.8%) | 95 (4.7%) |
Income Above Poverty by Sex and Age in Beavercreek
According to the poverty statistics in Beavercreek, males aged 5 years and females aged under 5 years are the age groups that are most secure financially, with 100.0% of males and 100.0% of females in these age groups living above the poverty line.
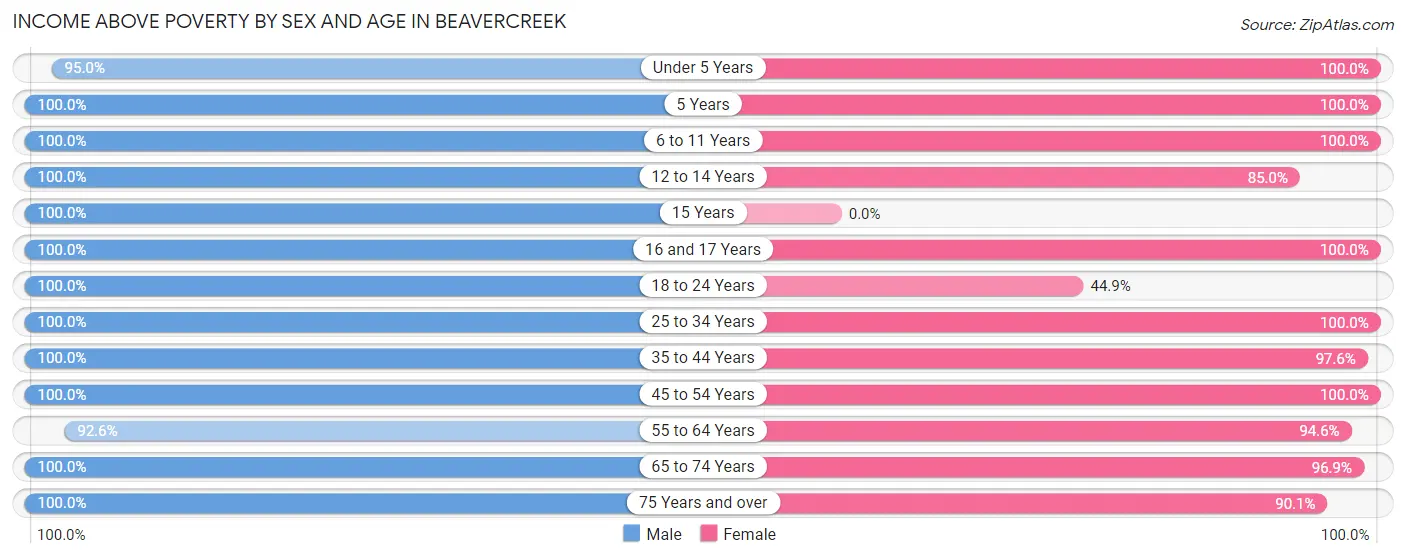
| Age Bracket | Male | Female |
| Under 5 Years | 208 (95.0%) | 122 (100.0%) |
| 5 Years | 26 (100.0%) | 3 (100.0%) |
| 6 to 11 Years | 92 (100.0%) | 120 (100.0%) |
| 12 to 14 Years | 103 (100.0%) | 51 (85.0%) |
| 15 Years | 38 (100.0%) | 0 (0.0%) |
| 16 and 17 Years | 94 (100.0%) | 26 (100.0%) |
| 18 to 24 Years | 120 (100.0%) | 35 (44.9%) |
| 25 to 34 Years | 236 (100.0%) | 230 (100.0%) |
| 35 to 44 Years | 249 (100.0%) | 367 (97.6%) |
| 45 to 54 Years | 395 (100.0%) | 315 (100.0%) |
| 55 to 64 Years | 427 (92.6%) | 280 (94.6%) |
| 65 to 74 Years | 349 (100.0%) | 279 (96.9%) |
| 75 Years and over | 136 (100.0%) | 82 (90.1%) |
| Total | 2,473 (98.2%) | 1,910 (95.3%) |
Income Below Poverty Among Married-Couple Families in Beavercreek
The poverty statistics for married-couple families in Beavercreek show that 1.3% or 16 of the total 1,190 families live below the poverty line. Families with no children have the highest poverty rate of 2.1%, comprising of 16 families. On the other hand, families with 1 or 2 children have the lowest poverty rate of 0.0%, which includes 0 families.
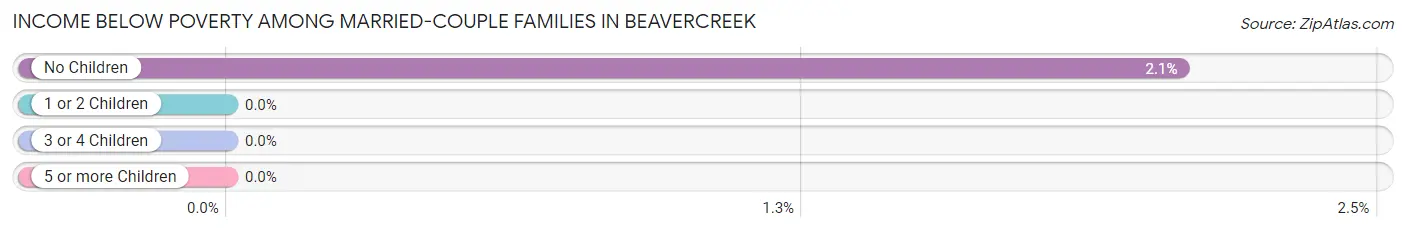
| Children | Above Poverty | Below Poverty |
| No Children | 756 (97.9%) | 16 (2.1%) |
| 1 or 2 Children | 335 (100.0%) | 0 (0.0%) |
| 3 or 4 Children | 74 (100.0%) | 0 (0.0%) |
| 5 or more Children | 9 (100.0%) | 0 (0.0%) |
| Total | 1,174 (98.7%) | 16 (1.3%) |
Income Below Poverty Among Single-Parent Households in Beavercreek
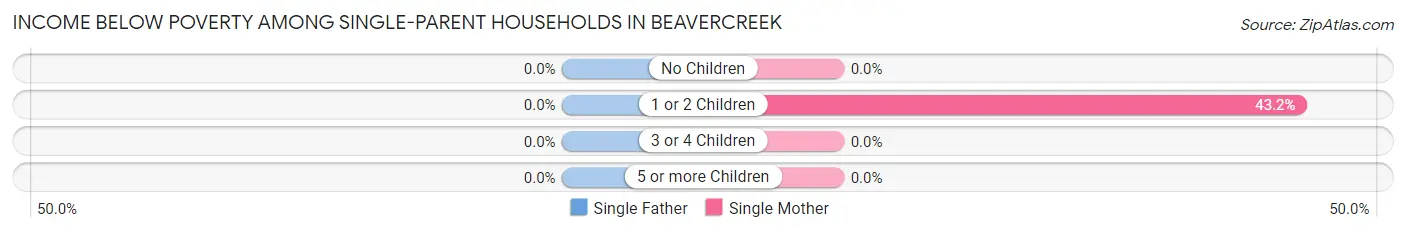
| Children | Single Father | Single Mother |
| No Children | 0 (0.0%) | 0 (0.0%) |
| 1 or 2 Children | 0 (0.0%) | 19 (43.2%) |
| 3 or 4 Children | 0 (0.0%) | 0 (0.0%) |
| 5 or more Children | 0 (0.0%) | 0 (0.0%) |
| Total | 0 (0.0%) | 19 (19.0%) |
Income Below Poverty Among Married-Couple vs Single-Parent Households in Beavercreek
The poverty data for Beavercreek shows that 16 of the married-couple family households (1.3%) and 19 of the single-parent households (12.9%) are living below the poverty level. Within the married-couple family households, those with no children have the highest poverty rate, with 16 households (2.1%) falling below the poverty line. Among the single-parent households, those with 1 or 2 children have the highest poverty rate, with 19 household (35.2%) living below poverty.
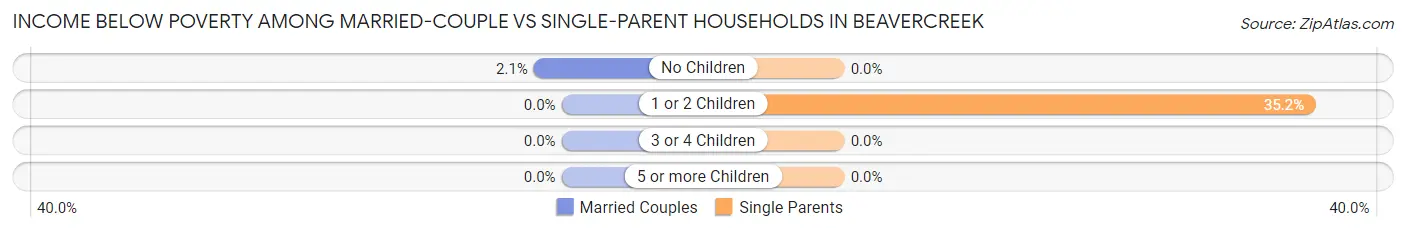
| Children | Married-Couple Families | Single-Parent Households |
| No Children | 16 (2.1%) | 0 (0.0%) |
| 1 or 2 Children | 0 (0.0%) | 19 (35.2%) |
| 3 or 4 Children | 0 (0.0%) | 0 (0.0%) |
| 5 or more Children | 0 (0.0%) | 0 (0.0%) |
| Total | 16 (1.3%) | 19 (12.9%) |
Race in Beavercreek
The most populous races in Beavercreek are White / Caucasian (4,038 | 89.1%), Two or more Races (249 | 5.5%), and Hispanic or Latino (142 | 3.1%).
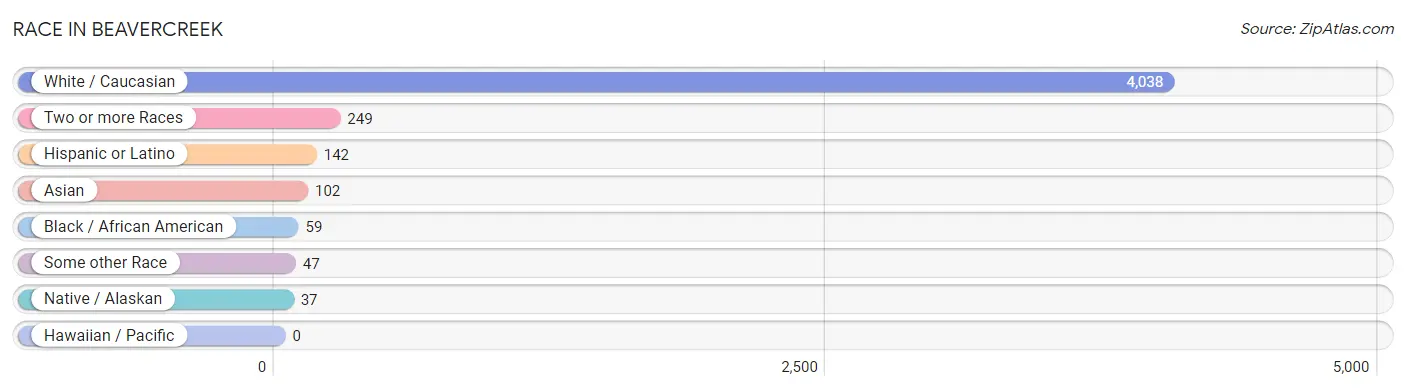
| Race | # Population | % Population |
| Asian | 102 | 2.2% |
| Black / African American | 59 | 1.3% |
| Hawaiian / Pacific | 0 | 0.0% |
| Hispanic or Latino | 142 | 3.1% |
| Native / Alaskan | 37 | 0.8% |
| White / Caucasian | 4,038 | 89.1% |
| Two or more Races | 249 | 5.5% |
| Some other Race | 47 | 1.0% |
| Total | 4,532 | 100.0% |
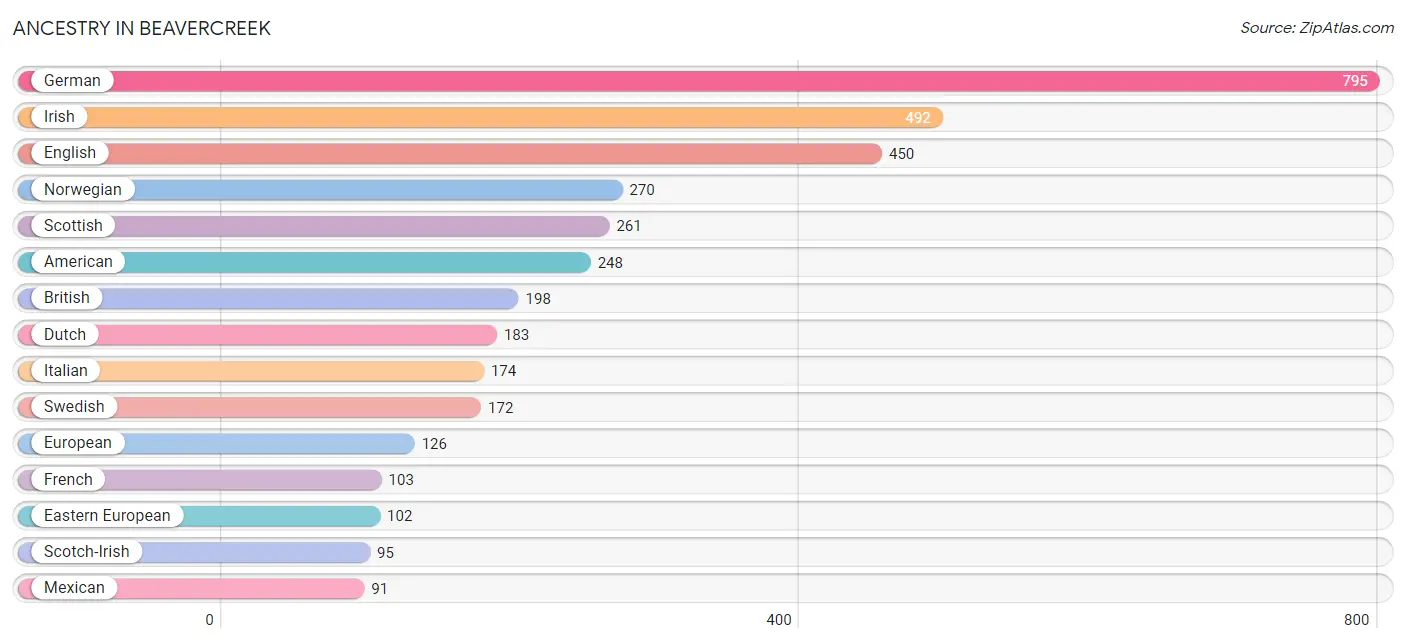
Ancestry in Beavercreek
The most populous ancestries reported in Beavercreek are German (795 | 17.5%), Irish (492 | 10.9%), English (450 | 9.9%), Norwegian (270 | 6.0%), and Scottish (261 | 5.8%), together accounting for 50.1% of all Beavercreek residents.
| Ancestry | # Population | % Population |
| American | 248 | 5.5% |
| Arab | 59 | 1.3% |
| Austrian | 10 | 0.2% |
| Belgian | 16 | 0.4% |
| Bhutanese | 23 | 0.5% |
| Blackfeet | 20 | 0.4% |
| British | 198 | 4.4% |
| Cajun | 23 | 0.5% |
| Canadian | 37 | 0.8% |
| Cherokee | 19 | 0.4% |
| Cuban | 9 | 0.2% |
| Danish | 34 | 0.7% |
| Dutch | 183 | 4.0% |
| Eastern European | 102 | 2.2% |
| Egyptian | 59 | 1.3% |
| English | 450 | 9.9% |
| European | 126 | 2.8% |
| Finnish | 20 | 0.4% |
| French | 103 | 2.3% |
| French Canadian | 48 | 1.1% |
| German | 795 | 17.5% |
| Indian (Asian) | 11 | 0.2% |
| Iranian | 31 | 0.7% |
| Irish | 492 | 10.9% |
| Iroquois | 14 | 0.3% |
| Italian | 174 | 3.8% |
| Korean | 74 | 1.6% |
| Laotian | 13 | 0.3% |
| Mexican | 91 | 2.0% |
| Navajo | 5 | 0.1% |
| Northern European | 25 | 0.5% |
| Norwegian | 270 | 6.0% |
| Polish | 86 | 1.9% |
| Portuguese | 6 | 0.1% |
| Russian | 36 | 0.8% |
| Scandinavian | 19 | 0.4% |
| Scotch-Irish | 95 | 2.1% |
| Scottish | 261 | 5.8% |
| Spanish | 27 | 0.6% |
| Swedish | 172 | 3.8% |
| Swiss | 15 | 0.3% |
| Thai | 20 | 0.4% |
| Ukrainian | 10 | 0.2% |
| Welsh | 43 | 0.9% |
| Yugoslavian | 9 | 0.2% | View All 45 Rows |
Immigrants in Beavercreek
The most numerous immigrant groups reported in Beavercreek came from Asia (89 | 2.0%), Philippines (59 | 1.3%), South Eastern Asia (59 | 1.3%), Latin America (37 | 0.8%), and South Central Asia (30 | 0.7%), together accounting for 6.0% of all Beavercreek residents.
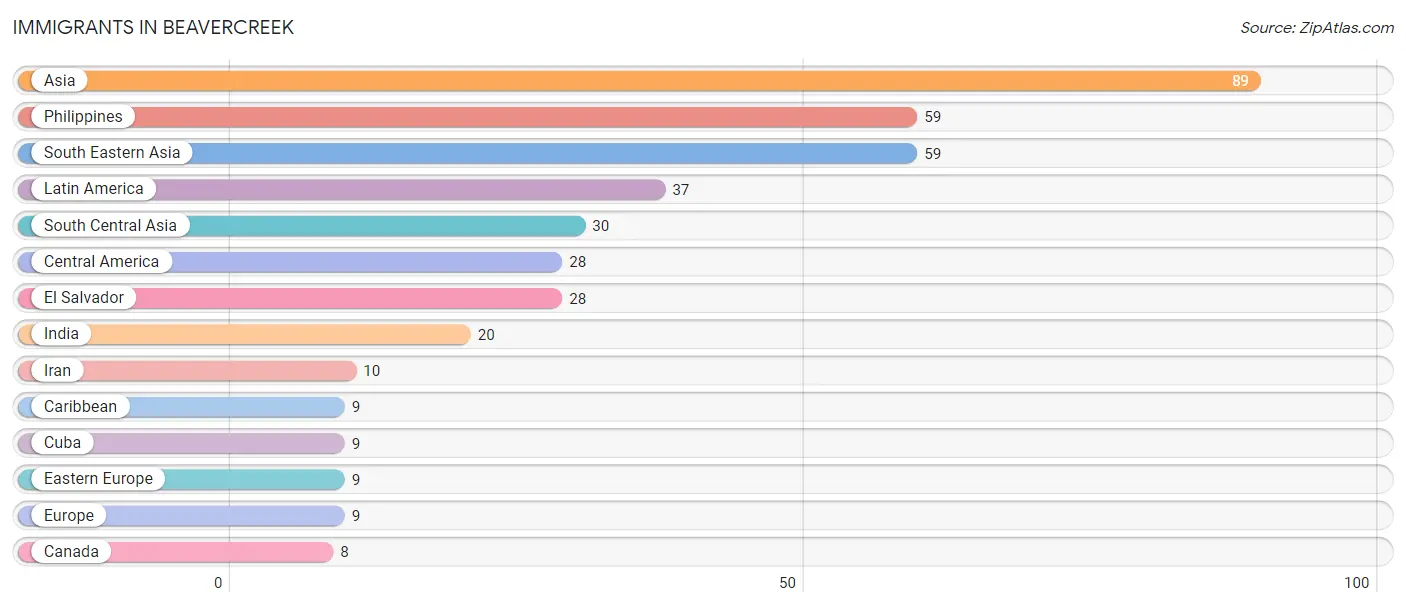
| Immigration Origin | # Population | % Population |
| Asia | 89 | 2.0% |
| Canada | 8 | 0.2% |
| Caribbean | 9 | 0.2% |
| Central America | 28 | 0.6% |
| Cuba | 9 | 0.2% |
| Eastern Europe | 9 | 0.2% |
| El Salvador | 28 | 0.6% |
| Europe | 9 | 0.2% |
| India | 20 | 0.4% |
| Iran | 10 | 0.2% |
| Latin America | 37 | 0.8% |
| Philippines | 59 | 1.3% |
| South Central Asia | 30 | 0.7% |
| South Eastern Asia | 59 | 1.3% | View All 14 Rows |
Sex and Age in Beavercreek
Sex and Age in Beavercreek
The most populous age groups in Beavercreek are 60 to 64 Years (303 | 12.0%) for men and 50 to 54 Years (247 | 12.3%) for women.
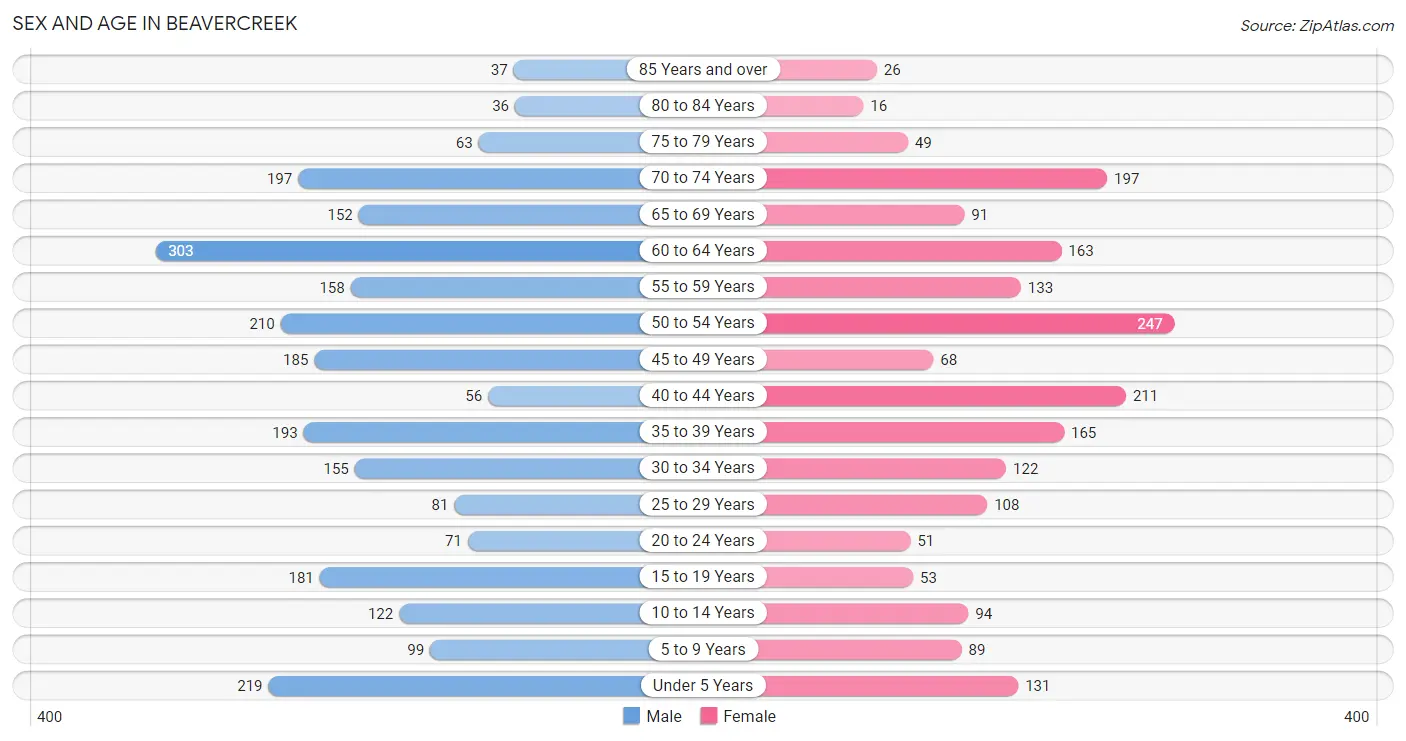
| Age Bracket | Male | Female |
| Under 5 Years | 219 (8.7%) | 131 (6.5%) |
| 5 to 9 Years | 99 (3.9%) | 89 (4.4%) |
| 10 to 14 Years | 122 (4.9%) | 94 (4.7%) |
| 15 to 19 Years | 181 (7.2%) | 53 (2.6%) |
| 20 to 24 Years | 71 (2.8%) | 51 (2.5%) |
| 25 to 29 Years | 81 (3.2%) | 108 (5.4%) |
| 30 to 34 Years | 155 (6.2%) | 122 (6.1%) |
| 35 to 39 Years | 193 (7.7%) | 165 (8.2%) |
| 40 to 44 Years | 56 (2.2%) | 211 (10.5%) |
| 45 to 49 Years | 185 (7.3%) | 68 (3.4%) |
| 50 to 54 Years | 210 (8.3%) | 247 (12.3%) |
| 55 to 59 Years | 158 (6.3%) | 133 (6.6%) |
| 60 to 64 Years | 303 (12.0%) | 163 (8.1%) |
| 65 to 69 Years | 152 (6.0%) | 91 (4.5%) |
| 70 to 74 Years | 197 (7.8%) | 197 (9.8%) |
| 75 to 79 Years | 63 (2.5%) | 49 (2.4%) |
| 80 to 84 Years | 36 (1.4%) | 16 (0.8%) |
| 85 Years and over | 37 (1.5%) | 26 (1.3%) |
| Total | 2,518 (100.0%) | 2,014 (100.0%) |
Families and Households in Beavercreek
Median Family Size in Beavercreek
The median family size in Beavercreek is 2.98 persons per family, with single female/mother families (100 | 7.5%) accounting for the largest median family size of 3.53 persons per family. On the other hand, single male/father families (47 | 3.5%) represent the smallest median family size with 2.57 persons per family.
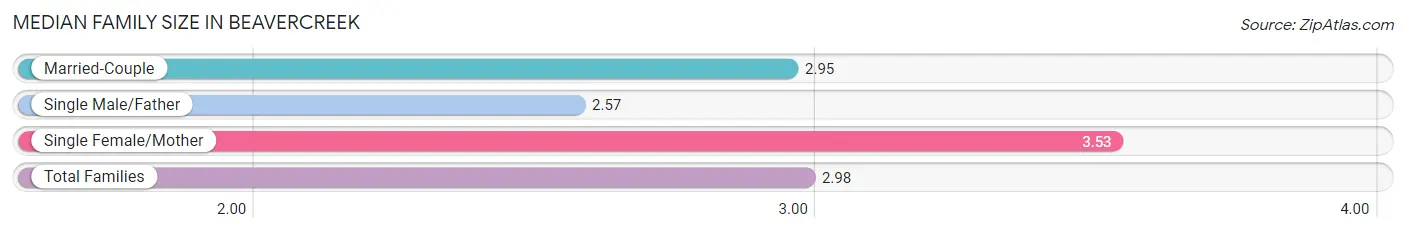
| Family Type | # Families | Family Size |
| Married-Couple | 1,190 (89.0%) | 2.95 |
| Single Male/Father | 47 (3.5%) | 2.57 |
| Single Female/Mother | 100 (7.5%) | 3.53 |
| Total Families | 1,337 (100.0%) | 2.98 |
Median Household Size in Beavercreek
The median household size in Beavercreek is 2.76 persons per household, with single female/mother households (100 | 6.1%) accounting for the largest median household size of 4.05 persons per household. non-family households (304 | 18.5%) represent the smallest median household size with 1.52 persons per household.
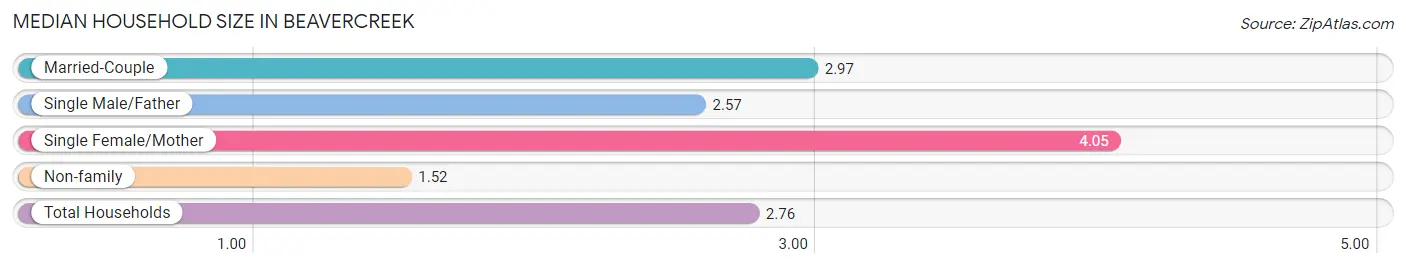
| Household Type | # Households | Household Size |
| Married-Couple | 1,190 (72.5%) | 2.97 |
| Single Male/Father | 47 (2.9%) | 2.57 |
| Single Female/Mother | 100 (6.1%) | 4.05 |
| Non-family | 304 (18.5%) | 1.52 |
| Total Households | 1,641 (100.0%) | 2.76 |
Household Size by Marriage Status in Beavercreek
Out of a total of 1,641 households in Beavercreek, 1,337 (81.5%) are family households, while 304 (18.5%) are nonfamily households. The most numerous type of family households are 2-person households, comprising 678, and the most common type of nonfamily households are 1-person households, comprising 177.
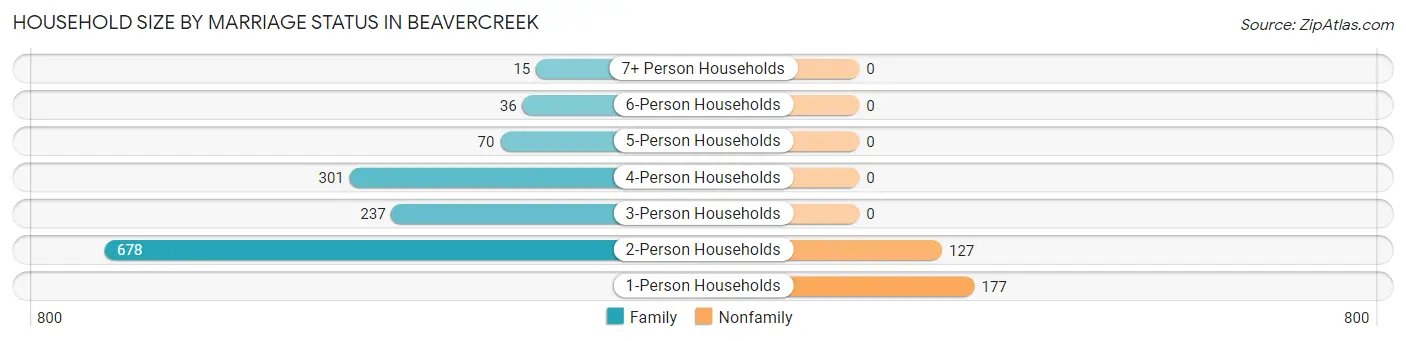
| Household Size | Family Households | Nonfamily Households |
| 1-Person Households | - | 177 (10.8%) |
| 2-Person Households | 678 (41.3%) | 127 (7.7%) |
| 3-Person Households | 237 (14.4%) | 0 (0.0%) |
| 4-Person Households | 301 (18.3%) | 0 (0.0%) |
| 5-Person Households | 70 (4.3%) | 0 (0.0%) |
| 6-Person Households | 36 (2.2%) | 0 (0.0%) |
| 7+ Person Households | 15 (0.9%) | 0 (0.0%) |
| Total | 1,337 (81.5%) | 304 (18.5%) |
Female Fertility in Beavercreek
Fertility by Age in Beavercreek
Average fertility rate in Beavercreek is 91.0 births per 1,000 women. Women in the age bracket of 20 to 34 years have the highest fertility rate with 103.0 births per 1,000 women. Women in the age bracket of 35 to 50 years acount for 61.3% of all women with births.
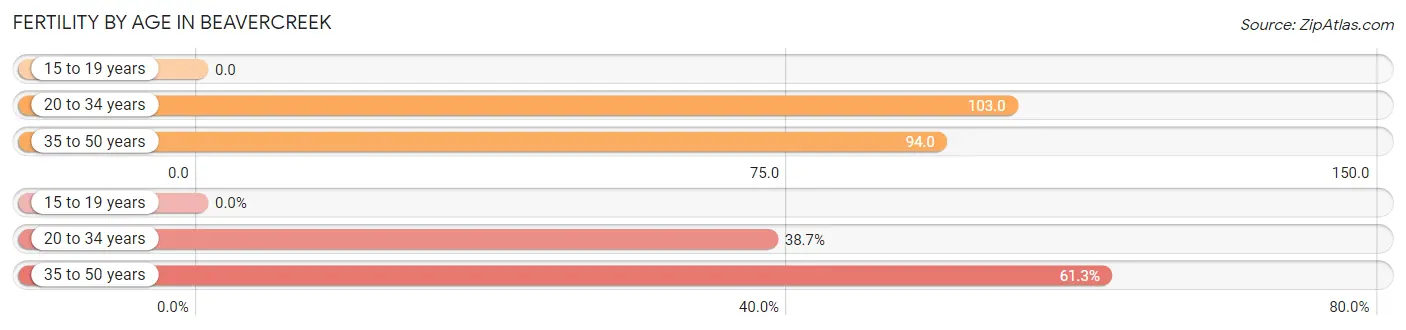
| Age Bracket | Women with Births | Births / 1,000 Women |
| 15 to 19 years | 0 (0.0%) | 0.0 |
| 20 to 34 years | 29 (38.7%) | 103.0 |
| 35 to 50 years | 46 (61.3%) | 94.0 |
| Total | 75 (100.0%) | 91.0 |
Fertility by Age by Marriage Status in Beavercreek
94.7% of women with births (75) in Beavercreek are married. The highest percentage of unmarried women with births falls into 20 to 34 years age bracket with 13.8% of them unmarried at the time of birth, while the lowest percentage of unmarried women with births belong to 35 to 50 years age bracket with 0.0% of them unmarried.
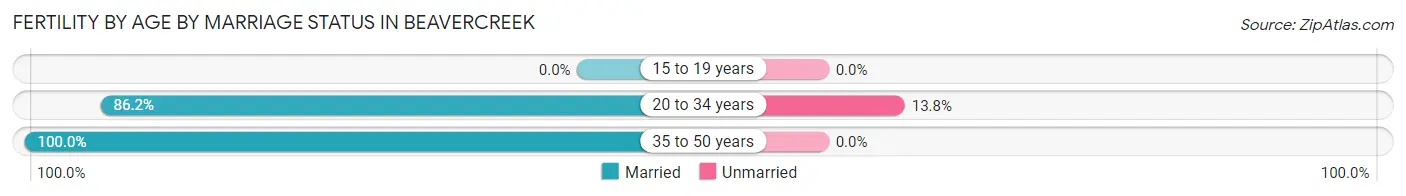
| Age Bracket | Married | Unmarried |
| 15 to 19 years | 0 (0.0%) | 0 (0.0%) |
| 20 to 34 years | 25 (86.2%) | 4 (13.8%) |
| 35 to 50 years | 46 (100.0%) | 0 (0.0%) |
| Total | 71 (94.7%) | 4 (5.3%) |
Fertility by Education in Beavercreek
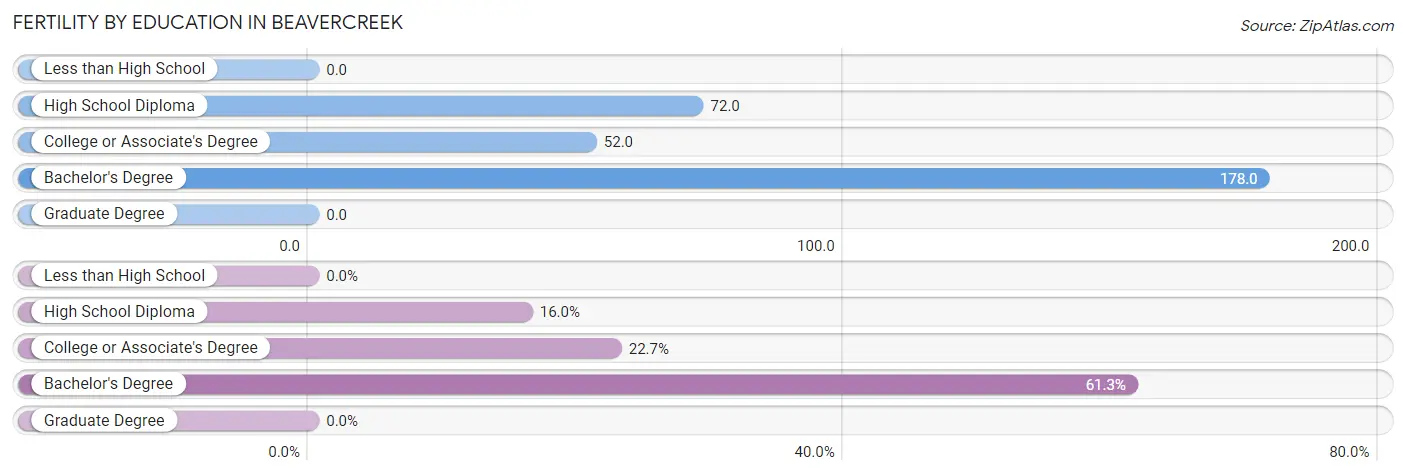
| Educational Attainment | Women with Births | Births / 1,000 Women |
| Less than High School | 0 (0.0%) | 0.0 |
| High School Diploma | 12 (16.0%) | 72.0 |
| College or Associate's Degree | 17 (22.7%) | 52.0 |
| Bachelor's Degree | 46 (61.3%) | 178.0 |
| Graduate Degree | 0 (0.0%) | 0.0 |
| Total | 75 (100.0%) | 91.0 |
Fertility by Education by Marriage Status in Beavercreek
5.3% of women with births in Beavercreek are unmarried. Women with the educational attainment of college or associate's degree are most likely to be married with 100.0% of them married at childbirth, while women with the educational attainment of high school diploma are least likely to be married with 33.3% of them unmarried at childbirth.
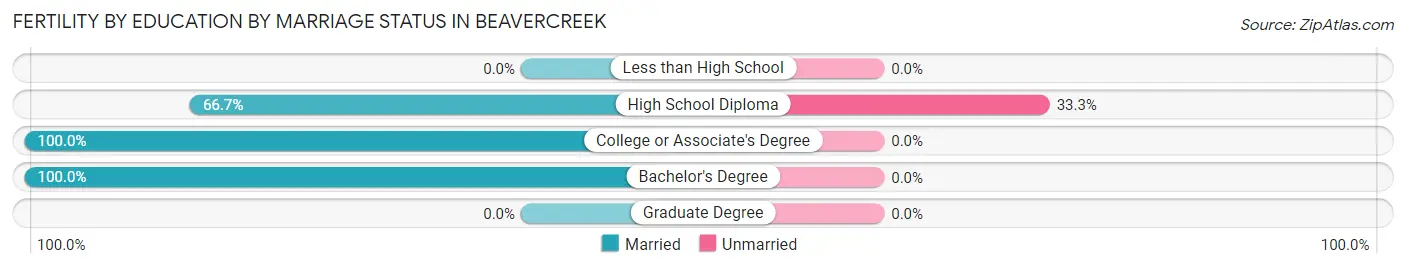
| Educational Attainment | Married | Unmarried |
| Less than High School | 0 (0.0%) | 0 (0.0%) |
| High School Diploma | 8 (66.7%) | 4 (33.3%) |
| College or Associate's Degree | 17 (100.0%) | 0 (0.0%) |
| Bachelor's Degree | 46 (100.0%) | 0 (0.0%) |
| Graduate Degree | 0 (0.0%) | 0 (0.0%) |
| Total | 71 (94.7%) | 4 (5.3%) |
Employment Characteristics in Beavercreek
Employment by Class of Employer in Beavercreek
Among the 2,182 employed individuals in Beavercreek, private company employees (1,502 | 68.8%), local government employees (231 | 10.6%), and self-employed (incorporated) (229 | 10.5%) make up the most common classes of employment.
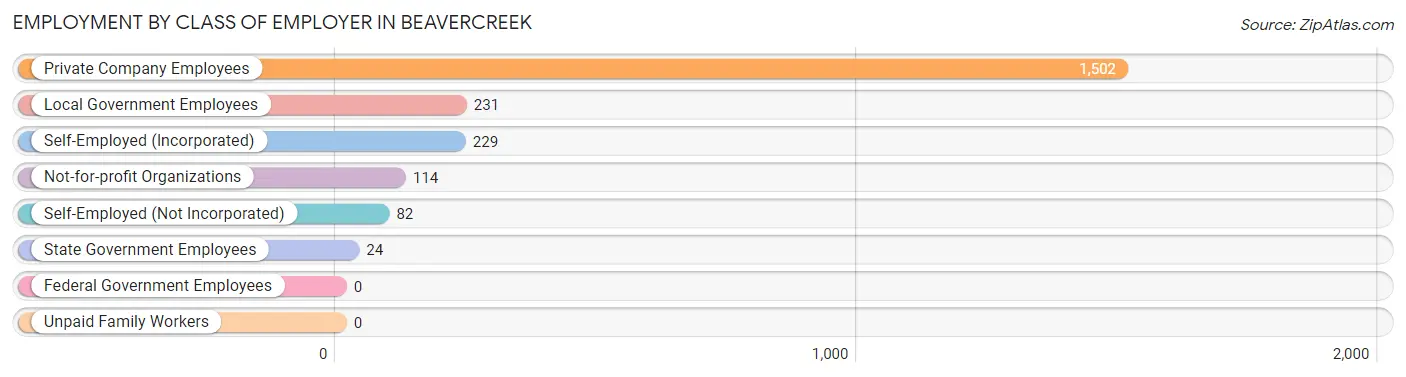
| Employer Class | # Employees | % Employees |
| Private Company Employees | 1,502 | 68.8% |
| Self-Employed (Incorporated) | 229 | 10.5% |
| Self-Employed (Not Incorporated) | 82 | 3.8% |
| Not-for-profit Organizations | 114 | 5.2% |
| Local Government Employees | 231 | 10.6% |
| State Government Employees | 24 | 1.1% |
| Federal Government Employees | 0 | 0.0% |
| Unpaid Family Workers | 0 | 0.0% |
| Total | 2,182 | 100.0% |
Employment Status by Age in Beavercreek
According to the labor force statistics for Beavercreek, out of the total population over 16 years of age (3,740), 61.7% or 2,308 individuals are in the labor force, with 3.0% or 69 of them unemployed. The age group with the highest labor force participation rate is 55 to 59 years, with 86.6% or 252 individuals in the labor force. Within the labor force, the 65 to 74 years age range has the highest percentage of unemployed individuals, with 17.1% or 20 of them being unemployed.
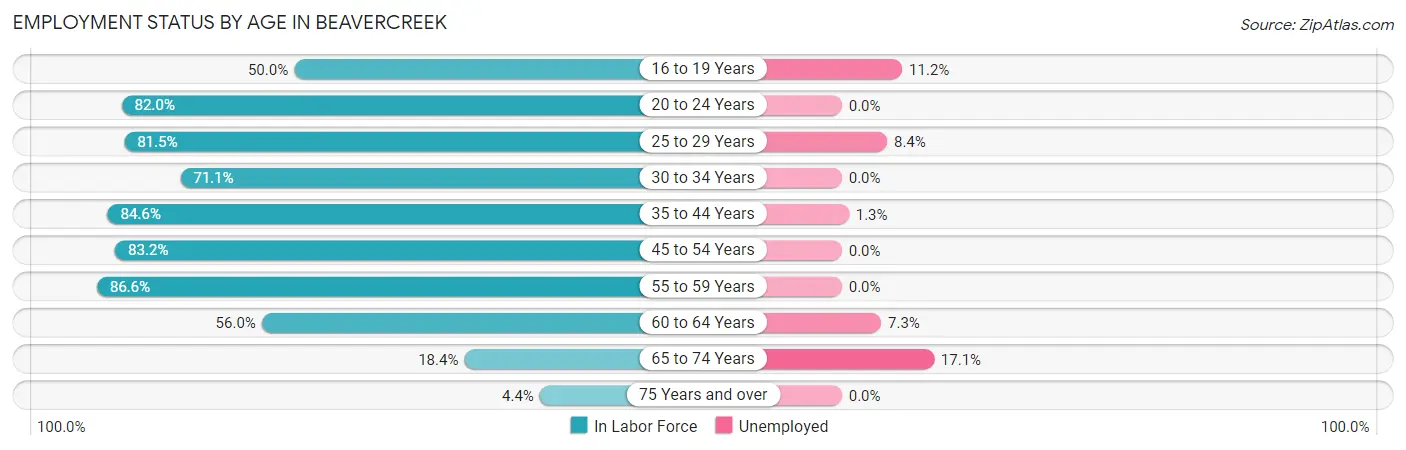
| Age Bracket | In Labor Force | Unemployed |
| 16 to 19 Years | 98 (50.0%) | 11 (11.2%) |
| 20 to 24 Years | 100 (82.0%) | 0 (0.0%) |
| 25 to 29 Years | 154 (81.5%) | 13 (8.4%) |
| 30 to 34 Years | 197 (71.1%) | 0 (0.0%) |
| 35 to 44 Years | 529 (84.6%) | 7 (1.3%) |
| 45 to 54 Years | 591 (83.2%) | 0 (0.0%) |
| 55 to 59 Years | 252 (86.6%) | 0 (0.0%) |
| 60 to 64 Years | 261 (56.0%) | 19 (7.3%) |
| 65 to 74 Years | 117 (18.4%) | 20 (17.1%) |
| 75 Years and over | 10 (4.4%) | 0 (0.0%) |
| Total | 2,308 (61.7%) | 69 (3.0%) |
Employment Status by Educational Attainment in Beavercreek
According to labor force statistics for Beavercreek, 77.6% of individuals (1,985) out of the total population between 25 and 64 years of age (2,558) are in the labor force, with 2.0% or 40 of them being unemployed. The group with the highest labor force participation rate are those with the educational attainment of college / associate degree, with 81.0% or 927 individuals in the labor force. Within the labor force, individuals with high school diploma education have the highest percentage of unemployment, with 3.1% or 13 of them being unemployed.
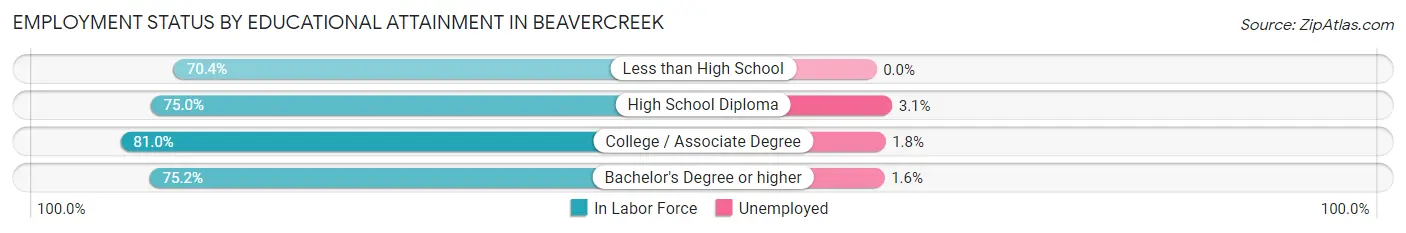
| Educational Attainment | In Labor Force | Unemployed |
| Less than High School | 81 (70.4%) | 0 (0.0%) |
| High School Diploma | 424 (75.0%) | 18 (3.1%) |
| College / Associate Degree | 927 (81.0%) | 21 (1.8%) |
| Bachelor's Degree or higher | 551 (75.2%) | 12 (1.6%) |
| Total | 1,985 (77.6%) | 51 (2.0%) |
Employment Occupations by Sex in Beavercreek
Management, Business, Science and Arts Occupations
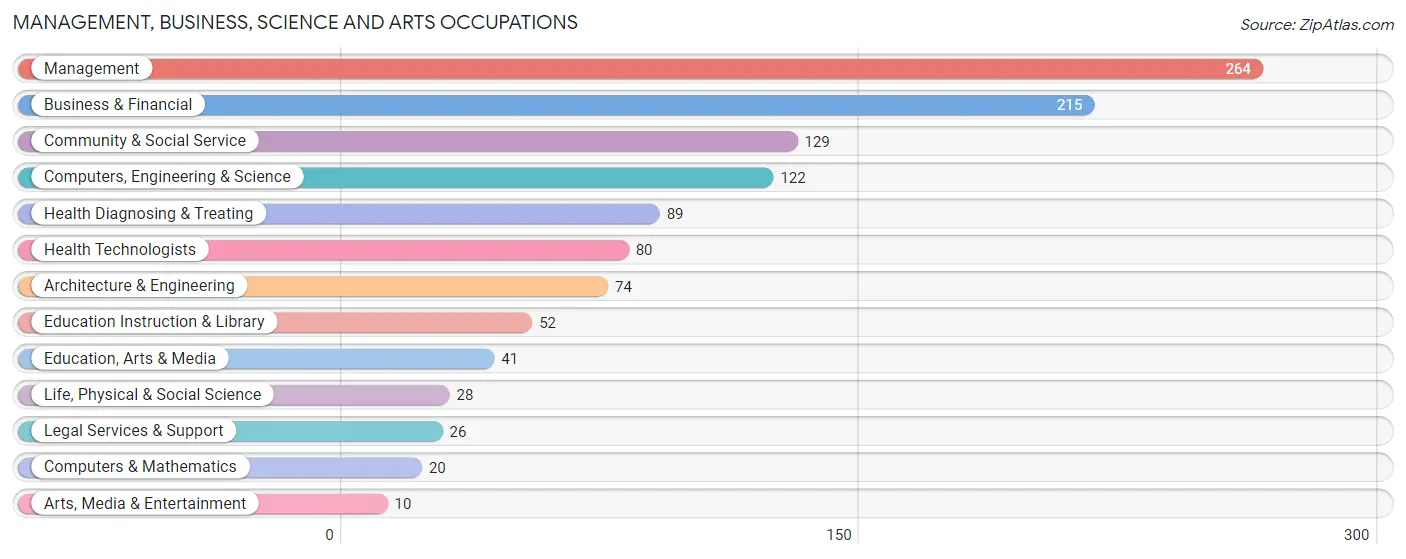
The most common Management, Business, Science and Arts occupations in Beavercreek are Management (264 | 11.8%), Business & Financial (215 | 9.6%), Community & Social Service (129 | 5.8%), Computers, Engineering & Science (122 | 5.4%), and Health Diagnosing & Treating (89 | 4.0%).
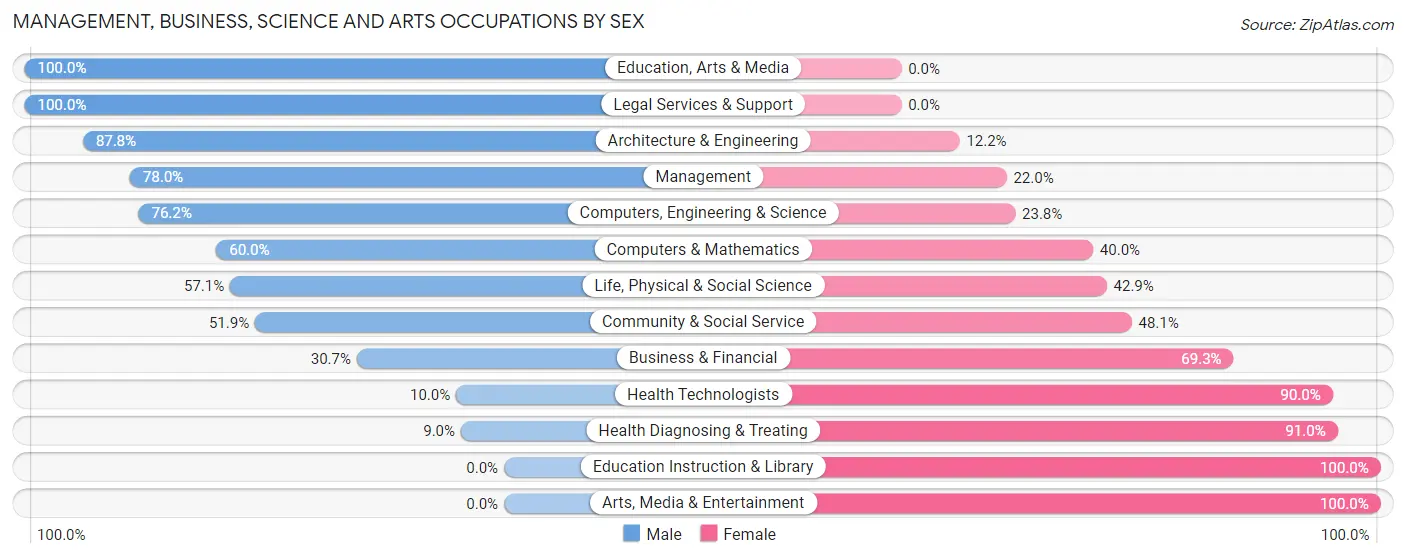
Management, Business, Science and Arts Occupations by Sex
Within the Management, Business, Science and Arts occupations in Beavercreek, the most male-oriented occupations are Education, Arts & Media (100.0%), Legal Services & Support (100.0%), and Architecture & Engineering (87.8%), while the most female-oriented occupations are Education Instruction & Library (100.0%), Arts, Media & Entertainment (100.0%), and Health Diagnosing & Treating (91.0%).
| Occupation | Male | Female |
| Management | 206 (78.0%) | 58 (22.0%) |
| Business & Financial | 66 (30.7%) | 149 (69.3%) |
| Computers, Engineering & Science | 93 (76.2%) | 29 (23.8%) |
| Computers & Mathematics | 12 (60.0%) | 8 (40.0%) |
| Architecture & Engineering | 65 (87.8%) | 9 (12.2%) |
| Life, Physical & Social Science | 16 (57.1%) | 12 (42.9%) |
| Community & Social Service | 67 (51.9%) | 62 (48.1%) |
| Education, Arts & Media | 41 (100.0%) | 0 (0.0%) |
| Legal Services & Support | 26 (100.0%) | 0 (0.0%) |
| Education Instruction & Library | 0 (0.0%) | 52 (100.0%) |
| Arts, Media & Entertainment | 0 (0.0%) | 10 (100.0%) |
| Health Diagnosing & Treating | 8 (9.0%) | 81 (91.0%) |
| Health Technologists | 8 (10.0%) | 72 (90.0%) |
| Total (Category) | 440 (53.7%) | 379 (46.3%) |
| Total (Overall) | 1,305 (58.3%) | 934 (41.7%) |
Services Occupations
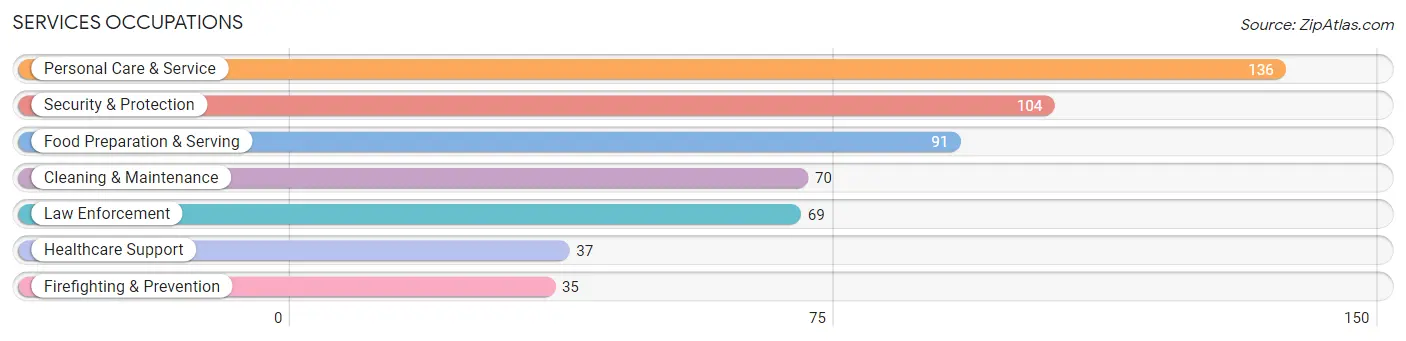
The most common Services occupations in Beavercreek are Personal Care & Service (136 | 6.1%), Security & Protection (104 | 4.6%), Food Preparation & Serving (91 | 4.1%), Cleaning & Maintenance (70 | 3.1%), and Law Enforcement (69 | 3.1%).
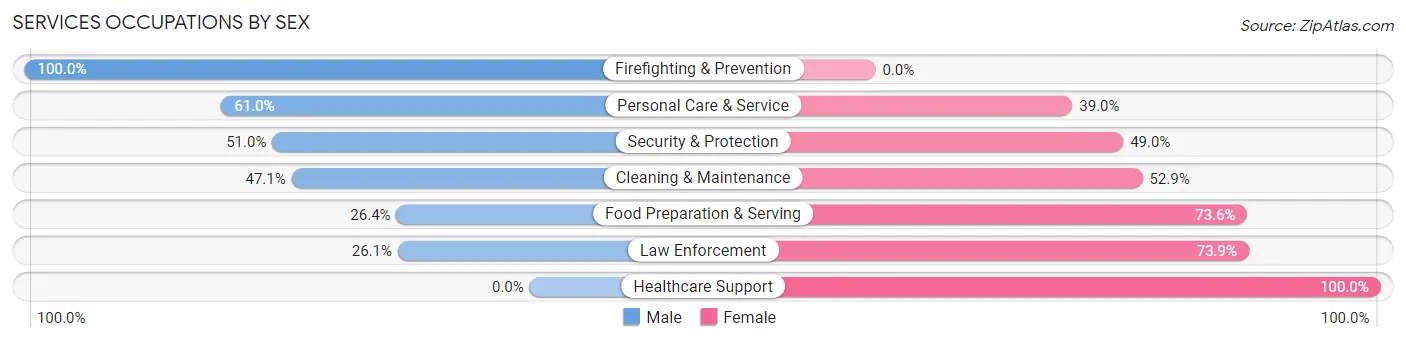
Services Occupations by Sex
Within the Services occupations in Beavercreek, the most male-oriented occupations are Firefighting & Prevention (100.0%), Personal Care & Service (61.0%), and Security & Protection (51.0%), while the most female-oriented occupations are Healthcare Support (100.0%), Law Enforcement (73.9%), and Food Preparation & Serving (73.6%).
| Occupation | Male | Female |
| Healthcare Support | 0 (0.0%) | 37 (100.0%) |
| Security & Protection | 53 (51.0%) | 51 (49.0%) |
| Firefighting & Prevention | 35 (100.0%) | 0 (0.0%) |
| Law Enforcement | 18 (26.1%) | 51 (73.9%) |
| Food Preparation & Serving | 24 (26.4%) | 67 (73.6%) |
| Cleaning & Maintenance | 33 (47.1%) | 37 (52.9%) |
| Personal Care & Service | 83 (61.0%) | 53 (39.0%) |
| Total (Category) | 193 (44.1%) | 245 (55.9%) |
| Total (Overall) | 1,305 (58.3%) | 934 (41.7%) |
Sales and Office Occupations
The most common Sales and Office occupations in Beavercreek are Office & Administration (304 | 13.6%), and Sales & Related (144 | 6.4%).
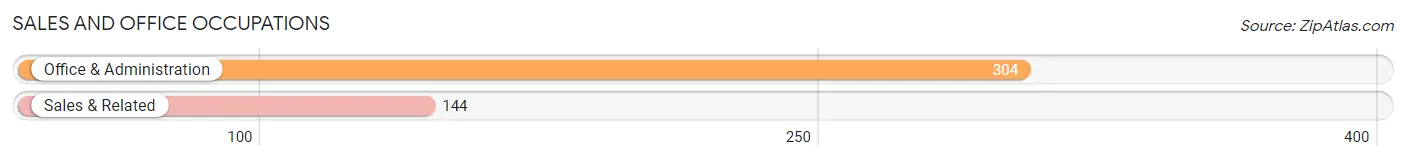
Sales and Office Occupations by Sex

| Occupation | Male | Female |
| Sales & Related | 130 (90.3%) | 14 (9.7%) |
| Office & Administration | 44 (14.5%) | 260 (85.5%) |
| Total (Category) | 174 (38.8%) | 274 (61.2%) |
| Total (Overall) | 1,305 (58.3%) | 934 (41.7%) |
Natural Resources, Construction and Maintenance Occupations
The most common Natural Resources, Construction and Maintenance occupations in Beavercreek are Construction & Extraction (142 | 6.3%), Installation, Maintenance & Repair (117 | 5.2%), and Farming, Fishing & Forestry (40 | 1.8%).
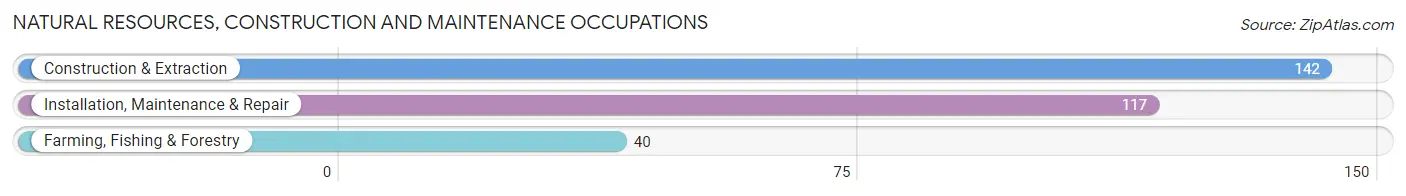
Natural Resources, Construction and Maintenance Occupations by Sex
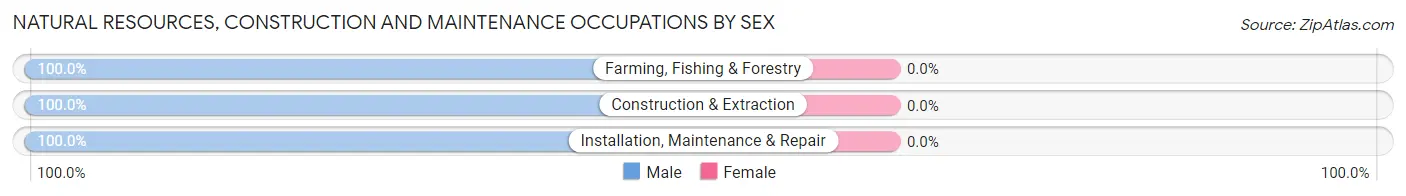
| Occupation | Male | Female |
| Farming, Fishing & Forestry | 40 (100.0%) | 0 (0.0%) |
| Construction & Extraction | 142 (100.0%) | 0 (0.0%) |
| Installation, Maintenance & Repair | 117 (100.0%) | 0 (0.0%) |
| Total (Category) | 299 (100.0%) | 0 (0.0%) |
| Total (Overall) | 1,305 (58.3%) | 934 (41.7%) |
Production, Transportation and Moving Occupations
The most common Production, Transportation and Moving occupations in Beavercreek are Production (118 | 5.3%), Transportation (62 | 2.8%), and Material Moving (55 | 2.5%).
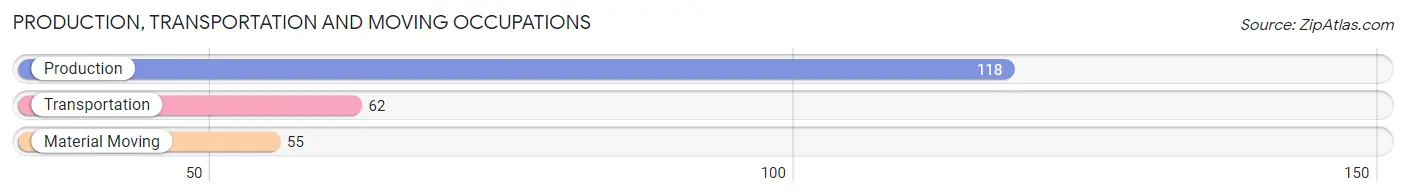
Production, Transportation and Moving Occupations by Sex
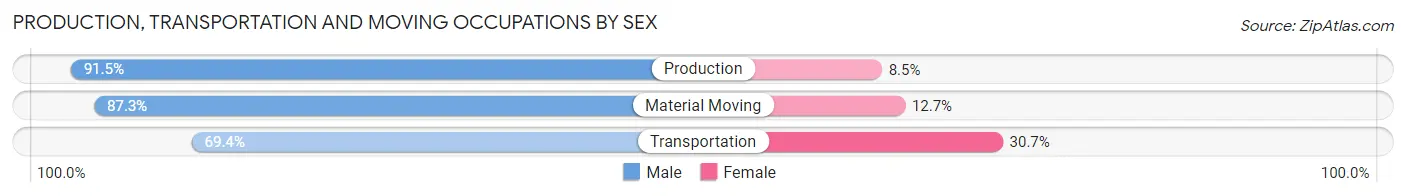
| Occupation | Male | Female |
| Production | 108 (91.5%) | 10 (8.5%) |
| Transportation | 43 (69.4%) | 19 (30.6%) |
| Material Moving | 48 (87.3%) | 7 (12.7%) |
| Total (Category) | 199 (84.7%) | 36 (15.3%) |
| Total (Overall) | 1,305 (58.3%) | 934 (41.7%) |
Employment Industries by Sex in Beavercreek
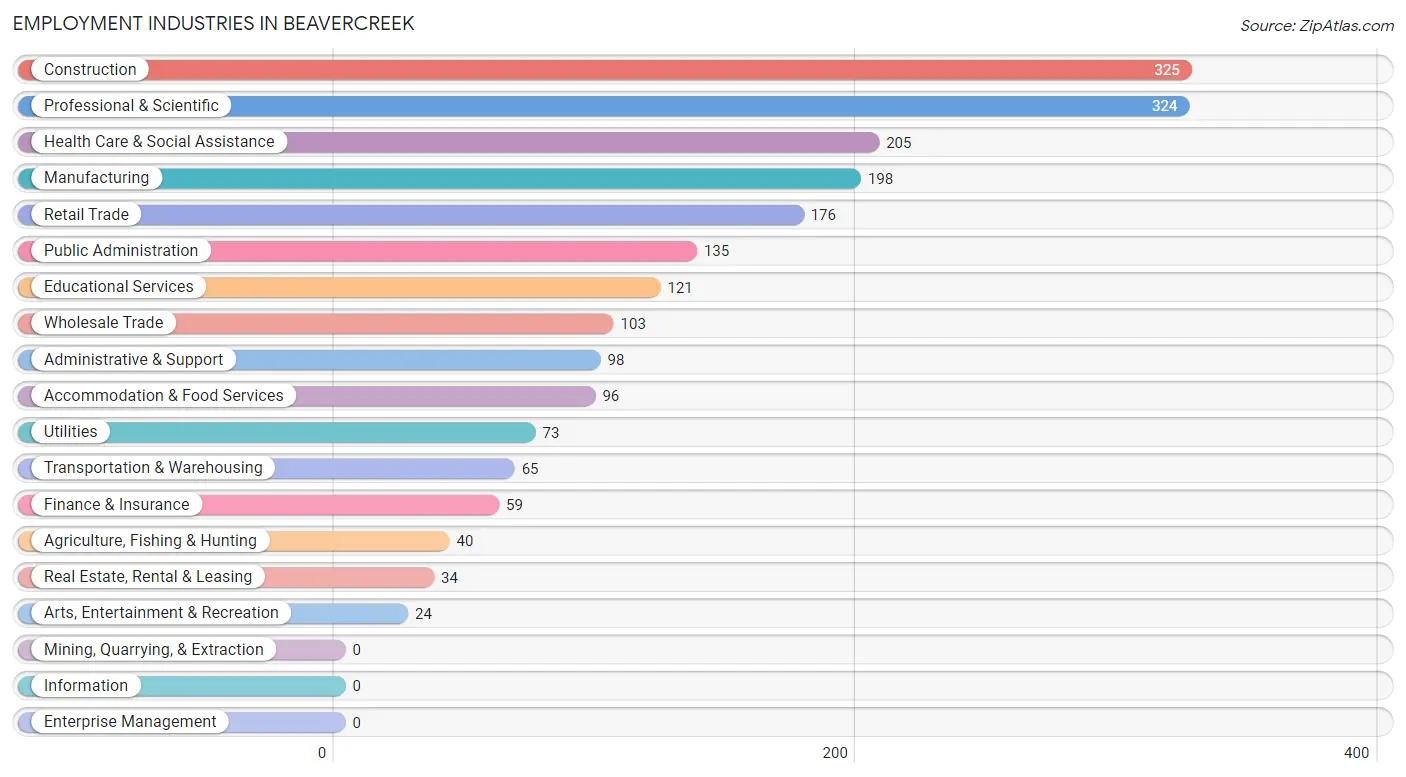
Employment Industries in Beavercreek
The major employment industries in Beavercreek include Construction (325 | 14.5%), Professional & Scientific (324 | 14.5%), Health Care & Social Assistance (205 | 9.2%), Manufacturing (198 | 8.8%), and Retail Trade (176 | 7.9%).
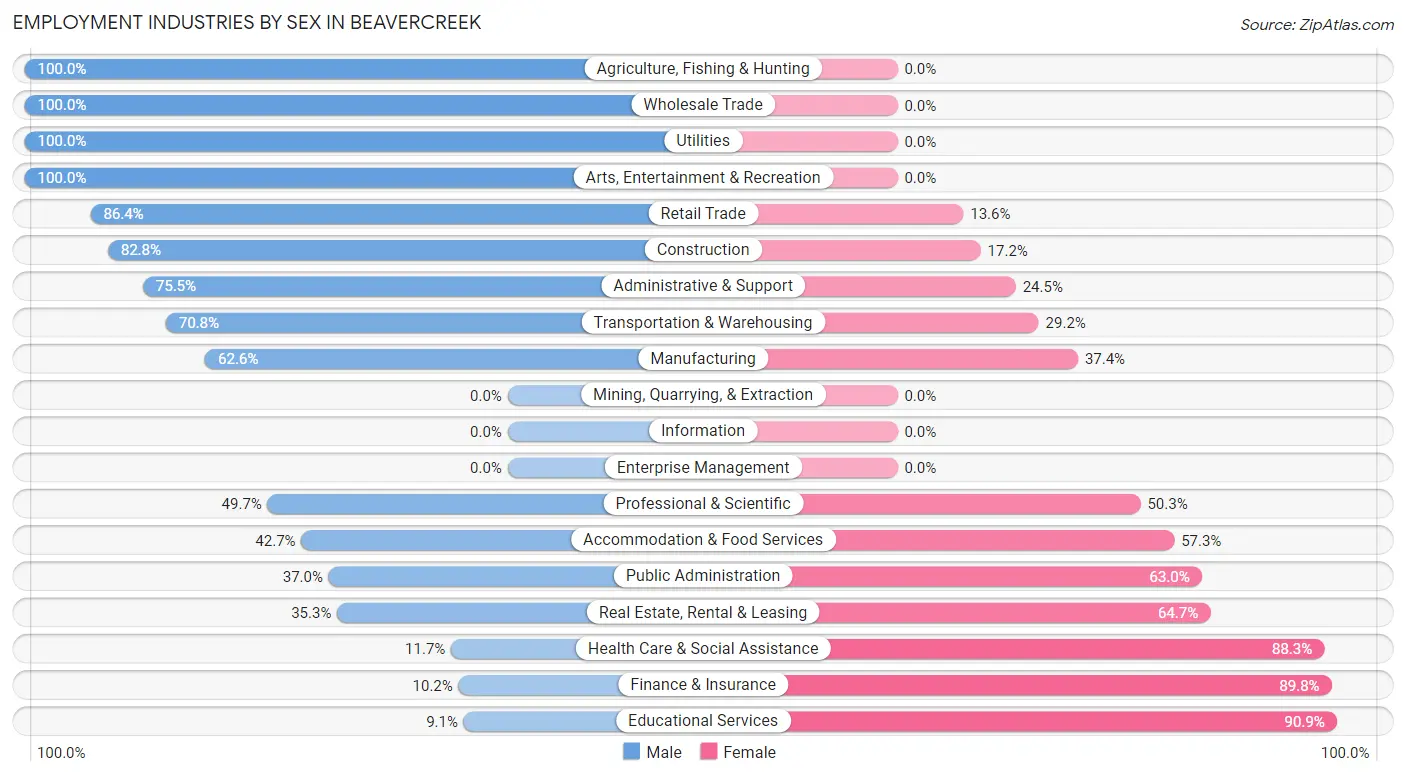
Employment Industries by Sex in Beavercreek
The Beavercreek industries that see more men than women are Agriculture, Fishing & Hunting (100.0%), Wholesale Trade (100.0%), and Utilities (100.0%), whereas the industries that tend to have a higher number of women are Educational Services (90.9%), Finance & Insurance (89.8%), and Health Care & Social Assistance (88.3%).
| Industry | Male | Female |
| Agriculture, Fishing & Hunting | 40 (100.0%) | 0 (0.0%) |
| Mining, Quarrying, & Extraction | 0 (0.0%) | 0 (0.0%) |
| Construction | 269 (82.8%) | 56 (17.2%) |
| Manufacturing | 124 (62.6%) | 74 (37.4%) |
| Wholesale Trade | 103 (100.0%) | 0 (0.0%) |
| Retail Trade | 152 (86.4%) | 24 (13.6%) |
| Transportation & Warehousing | 46 (70.8%) | 19 (29.2%) |
| Utilities | 73 (100.0%) | 0 (0.0%) |
| Information | 0 (0.0%) | 0 (0.0%) |
| Finance & Insurance | 6 (10.2%) | 53 (89.8%) |
| Real Estate, Rental & Leasing | 12 (35.3%) | 22 (64.7%) |
| Professional & Scientific | 161 (49.7%) | 163 (50.3%) |
| Enterprise Management | 0 (0.0%) | 0 (0.0%) |
| Administrative & Support | 74 (75.5%) | 24 (24.5%) |
| Educational Services | 11 (9.1%) | 110 (90.9%) |
| Health Care & Social Assistance | 24 (11.7%) | 181 (88.3%) |
| Arts, Entertainment & Recreation | 24 (100.0%) | 0 (0.0%) |
| Accommodation & Food Services | 41 (42.7%) | 55 (57.3%) |
| Public Administration | 50 (37.0%) | 85 (63.0%) |
| Total | 1,305 (58.3%) | 934 (41.7%) |
Education in Beavercreek
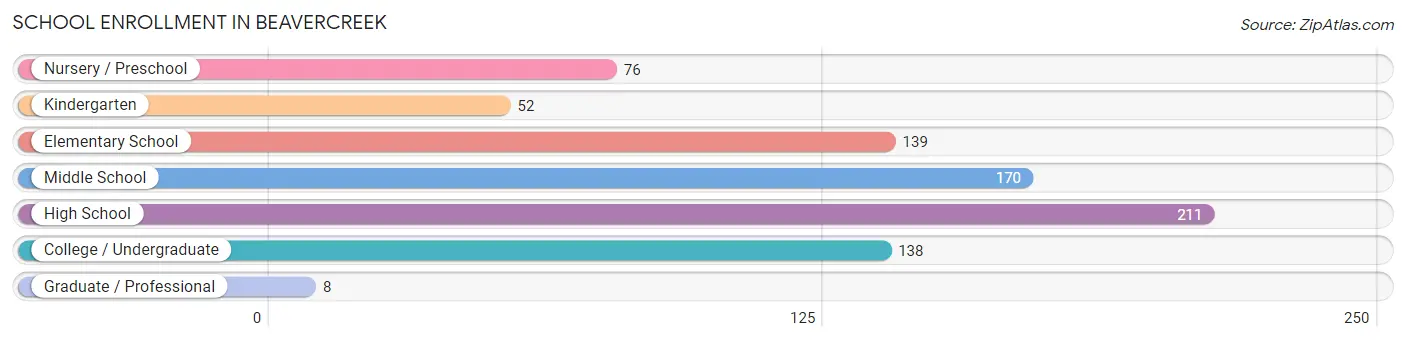
School Enrollment in Beavercreek
The most common levels of schooling among the 794 students in Beavercreek are high school (211 | 26.6%), middle school (170 | 21.4%), and elementary school (139 | 17.5%).
| School Level | # Students | % Students |
| Nursery / Preschool | 76 | 9.6% |
| Kindergarten | 52 | 6.6% |
| Elementary School | 139 | 17.5% |
| Middle School | 170 | 21.4% |
| High School | 211 | 26.6% |
| College / Undergraduate | 138 | 17.4% |
| Graduate / Professional | 8 | 1.0% |
| Total | 794 | 100.0% |
School Enrollment by Age by Funding Source in Beavercreek
Out of a total of 794 students who are enrolled in schools in Beavercreek, 92 (11.6%) attend a private institution, while the remaining 702 (88.4%) are enrolled in public schools. The age group of 3 to 4 year olds has the highest likelihood of being enrolled in private schools, with 32 (51.6% in the age bracket) enrolled. Conversely, the age group of 15 to 17 year olds has the lowest likelihood of being enrolled in a private school, with 158 (100.0% in the age bracket) attending a public institution.
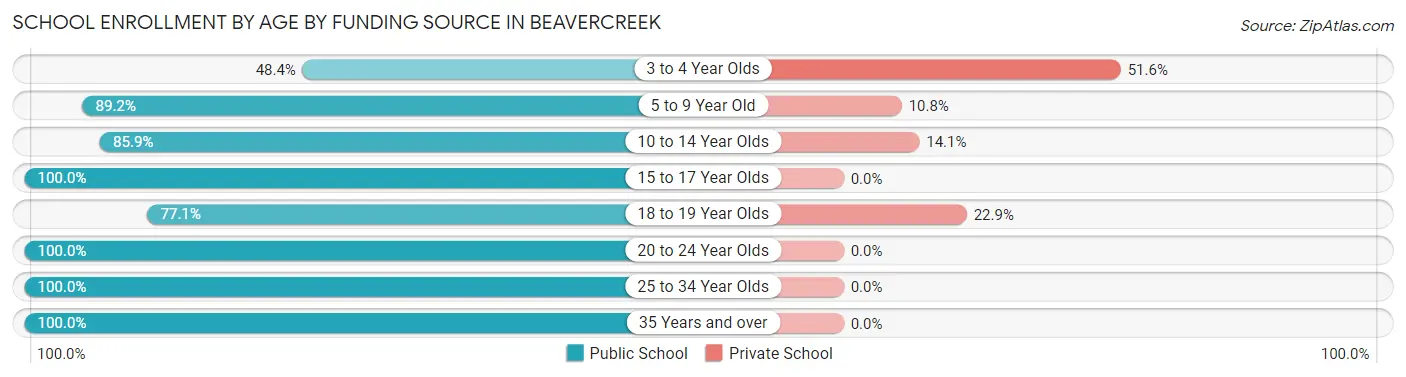
| Age Bracket | Public School | Private School |
| 3 to 4 Year Olds | 30 (48.4%) | 32 (51.6%) |
| 5 to 9 Year Old | 165 (89.2%) | 20 (10.8%) |
| 10 to 14 Year Olds | 177 (85.9%) | 29 (14.1%) |
| 15 to 17 Year Olds | 158 (100.0%) | 0 (0.0%) |
| 18 to 19 Year Olds | 37 (77.1%) | 11 (22.9%) |
| 20 to 24 Year Olds | 34 (100.0%) | 0 (0.0%) |
| 25 to 34 Year Olds | 58 (100.0%) | 0 (0.0%) |
| 35 Years and over | 43 (100.0%) | 0 (0.0%) |
| Total | 702 (88.4%) | 92 (11.6%) |
Educational Attainment by Field of Study in Beavercreek
Business (246 | 22.4%), social sciences (146 | 13.3%), science & technology (145 | 13.2%), education (114 | 10.4%), and arts & humanities (103 | 9.4%) are the most common fields of study among 1,100 individuals in Beavercreek who have obtained a bachelor's degree or higher.
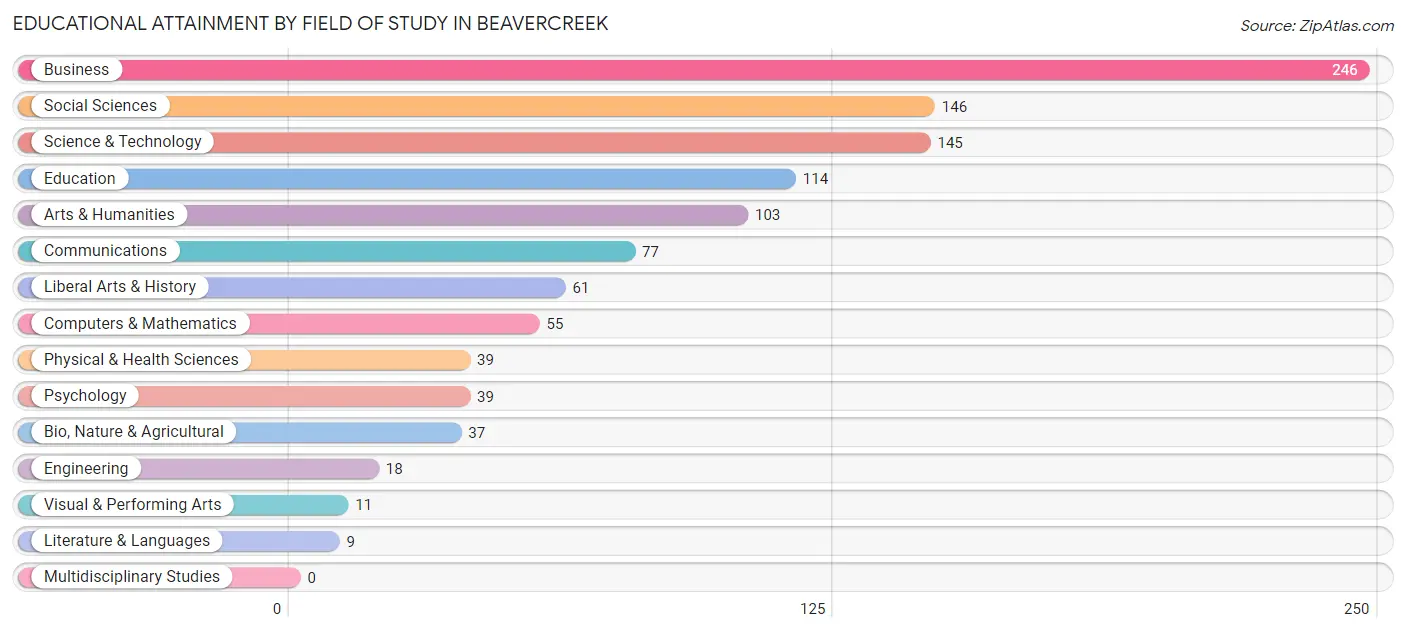
| Field of Study | # Graduates | % Graduates |
| Computers & Mathematics | 55 | 5.0% |
| Bio, Nature & Agricultural | 37 | 3.4% |
| Physical & Health Sciences | 39 | 3.5% |
| Psychology | 39 | 3.5% |
| Social Sciences | 146 | 13.3% |
| Engineering | 18 | 1.6% |
| Multidisciplinary Studies | 0 | 0.0% |
| Science & Technology | 145 | 13.2% |
| Business | 246 | 22.4% |
| Education | 114 | 10.4% |
| Literature & Languages | 9 | 0.8% |
| Liberal Arts & History | 61 | 5.6% |
| Visual & Performing Arts | 11 | 1.0% |
| Communications | 77 | 7.0% |
| Arts & Humanities | 103 | 9.4% |
| Total | 1,100 | 100.0% |
Transportation & Commute in Beavercreek
Vehicle Availability by Sex in Beavercreek
The most prevalent vehicle ownership categories in Beavercreek are males with 2 vehicles (452, accounting for 34.8%) and females with 2 vehicles (276, making up 51.5%).
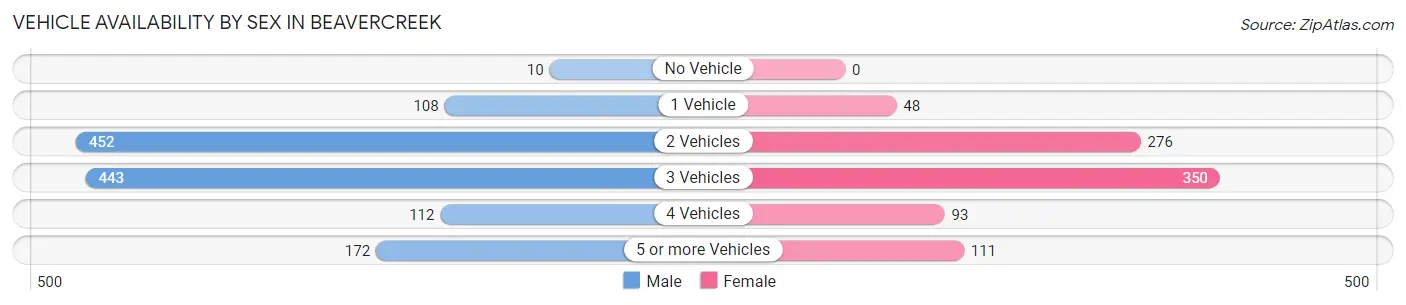
| Vehicles Available | Male | Female |
| No Vehicle | 10 (0.8%) | 0 (0.0%) |
| 1 Vehicle | 108 (8.3%) | 48 (5.5%) |
| 2 Vehicles | 452 (34.8%) | 276 (31.4%) |
| 3 Vehicles | 443 (34.2%) | 350 (39.9%) |
| 4 Vehicles | 112 (8.6%) | 93 (10.6%) |
| 5 or more Vehicles | 172 (13.3%) | 111 (12.6%) |
| Total | 1,297 (100.0%) | 878 (100.0%) |
Commute Time in Beavercreek
The most frequently occuring commute durations in Beavercreek are 45 to 59 minutes (355 commuters, 18.3%), 30 to 34 minutes (322 commuters, 16.6%), and 20 to 24 minutes (248 commuters, 12.8%).
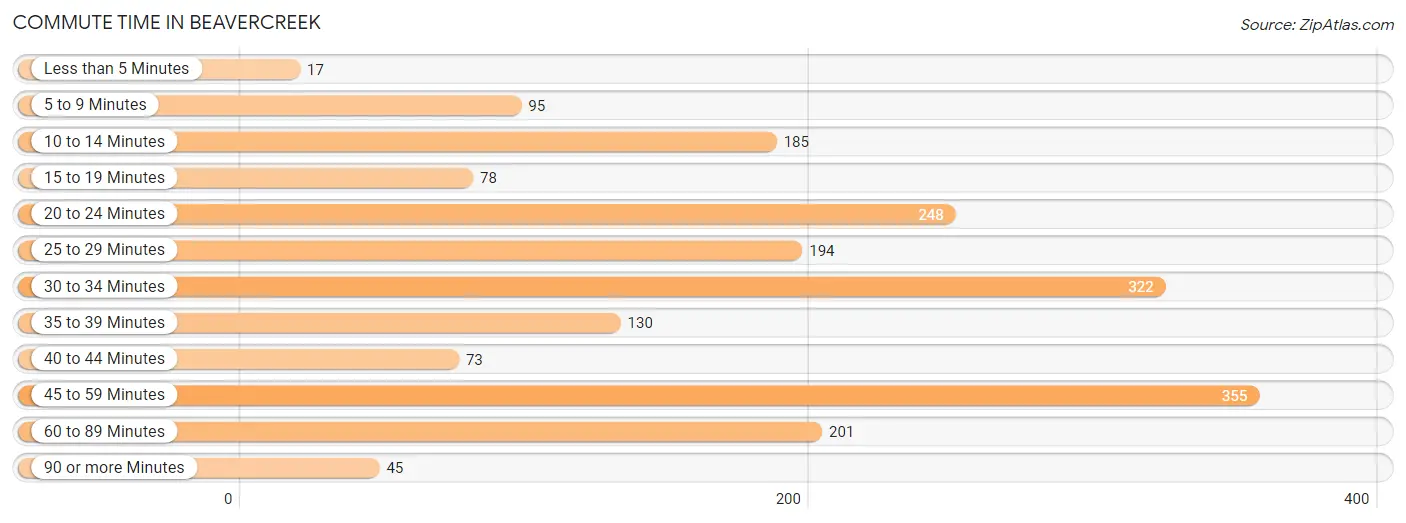
| Commute Time | # Commuters | % Commuters |
| Less than 5 Minutes | 17 | 0.9% |
| 5 to 9 Minutes | 95 | 4.9% |
| 10 to 14 Minutes | 185 | 9.5% |
| 15 to 19 Minutes | 78 | 4.0% |
| 20 to 24 Minutes | 248 | 12.8% |
| 25 to 29 Minutes | 194 | 10.0% |
| 30 to 34 Minutes | 322 | 16.6% |
| 35 to 39 Minutes | 130 | 6.7% |
| 40 to 44 Minutes | 73 | 3.8% |
| 45 to 59 Minutes | 355 | 18.3% |
| 60 to 89 Minutes | 201 | 10.3% |
| 90 or more Minutes | 45 | 2.3% |
Commute Time by Sex in Beavercreek
The most common commute times in Beavercreek are 45 to 59 minutes (203 commuters, 17.2%) for males and 20 to 24 minutes (161 commuters, 21.2%) for females.
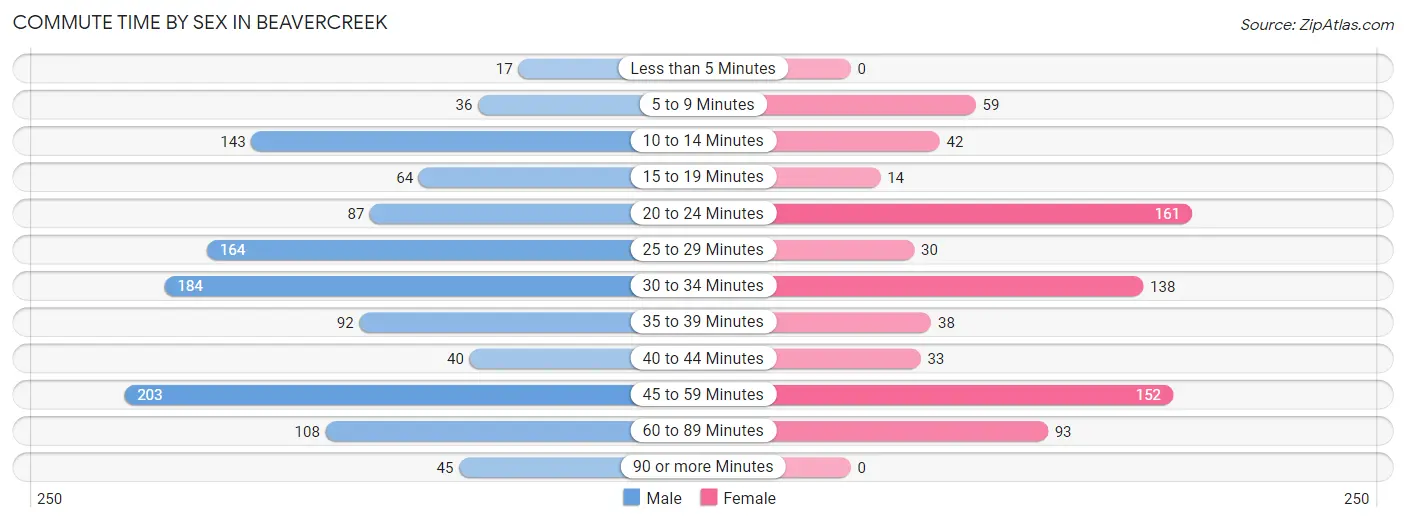
| Commute Time | Male | Female |
| Less than 5 Minutes | 17 (1.4%) | 0 (0.0%) |
| 5 to 9 Minutes | 36 (3.0%) | 59 (7.8%) |
| 10 to 14 Minutes | 143 (12.1%) | 42 (5.5%) |
| 15 to 19 Minutes | 64 (5.4%) | 14 (1.8%) |
| 20 to 24 Minutes | 87 (7.3%) | 161 (21.2%) |
| 25 to 29 Minutes | 164 (13.9%) | 30 (4.0%) |
| 30 to 34 Minutes | 184 (15.5%) | 138 (18.2%) |
| 35 to 39 Minutes | 92 (7.8%) | 38 (5.0%) |
| 40 to 44 Minutes | 40 (3.4%) | 33 (4.3%) |
| 45 to 59 Minutes | 203 (17.2%) | 152 (20.0%) |
| 60 to 89 Minutes | 108 (9.1%) | 93 (12.2%) |
| 90 or more Minutes | 45 (3.8%) | 0 (0.0%) |
Time of Departure to Work by Sex in Beavercreek
The most frequent times of departure to work in Beavercreek are 6:00 AM to 6:29 AM (199, 16.8%) for males and 6:00 AM to 6:29 AM (171, 22.5%) for females.
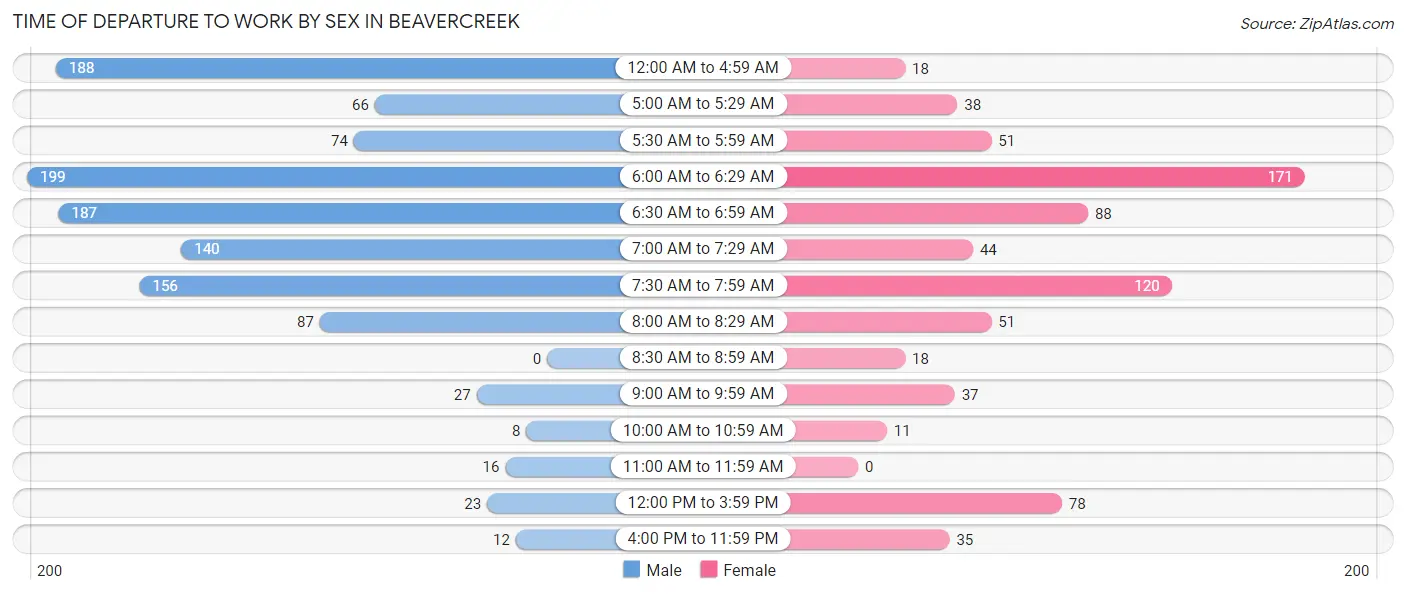
| Time of Departure | Male | Female |
| 12:00 AM to 4:59 AM | 188 (15.9%) | 18 (2.4%) |
| 5:00 AM to 5:29 AM | 66 (5.6%) | 38 (5.0%) |
| 5:30 AM to 5:59 AM | 74 (6.3%) | 51 (6.7%) |
| 6:00 AM to 6:29 AM | 199 (16.8%) | 171 (22.5%) |
| 6:30 AM to 6:59 AM | 187 (15.8%) | 88 (11.6%) |
| 7:00 AM to 7:29 AM | 140 (11.8%) | 44 (5.8%) |
| 7:30 AM to 7:59 AM | 156 (13.2%) | 120 (15.8%) |
| 8:00 AM to 8:29 AM | 87 (7.3%) | 51 (6.7%) |
| 8:30 AM to 8:59 AM | 0 (0.0%) | 18 (2.4%) |
| 9:00 AM to 9:59 AM | 27 (2.3%) | 37 (4.9%) |
| 10:00 AM to 10:59 AM | 8 (0.7%) | 11 (1.5%) |
| 11:00 AM to 11:59 AM | 16 (1.3%) | 0 (0.0%) |
| 12:00 PM to 3:59 PM | 23 (1.9%) | 78 (10.3%) |
| 4:00 PM to 11:59 PM | 12 (1.0%) | 35 (4.6%) |
| Total | 1,183 (100.0%) | 760 (100.0%) |
Housing Occupancy in Beavercreek
Occupancy by Ownership in Beavercreek
Of the total 1,641 dwellings in Beavercreek, owner-occupied units account for 1,506 (91.8%), while renter-occupied units make up 135 (8.2%).
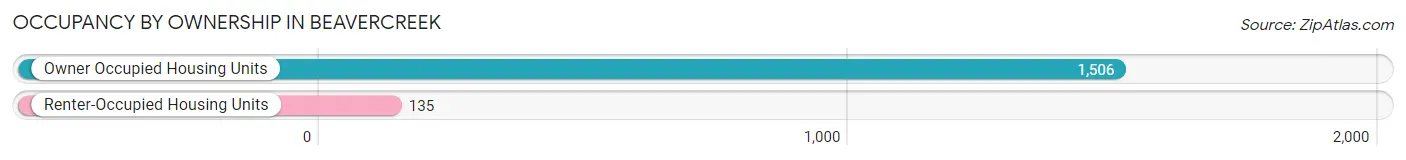
| Occupancy | # Housing Units | % Housing Units |
| Owner Occupied Housing Units | 1,506 | 91.8% |
| Renter-Occupied Housing Units | 135 | 8.2% |
| Total Occupied Housing Units | 1,641 | 100.0% |
Occupancy by Household Size in Beavercreek
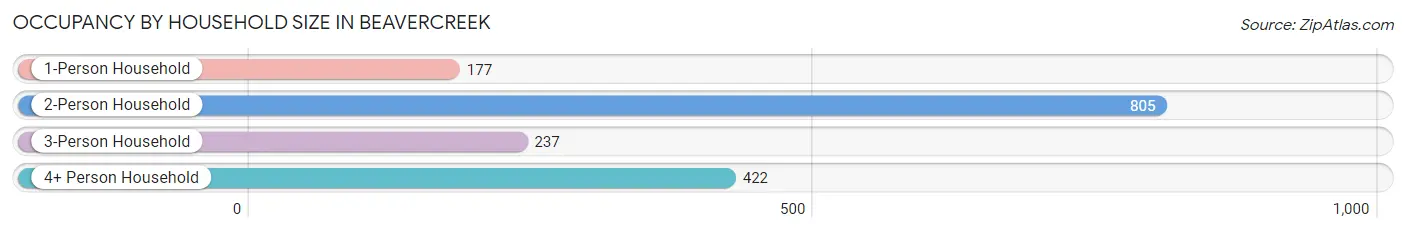
| Household Size | # Housing Units | % Housing Units |
| 1-Person Household | 177 | 10.8% |
| 2-Person Household | 805 | 49.1% |
| 3-Person Household | 237 | 14.4% |
| 4+ Person Household | 422 | 25.7% |
| Total Housing Units | 1,641 | 100.0% |
Occupancy by Ownership by Household Size in Beavercreek
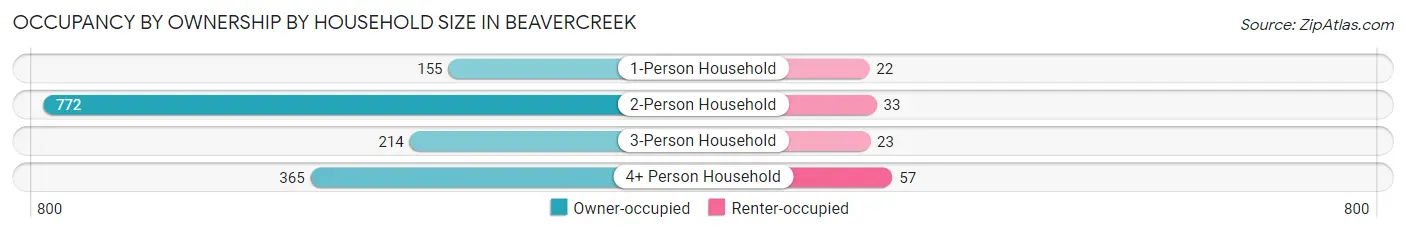
| Household Size | Owner-occupied | Renter-occupied |
| 1-Person Household | 155 (87.6%) | 22 (12.4%) |
| 2-Person Household | 772 (95.9%) | 33 (4.1%) |
| 3-Person Household | 214 (90.3%) | 23 (9.7%) |
| 4+ Person Household | 365 (86.5%) | 57 (13.5%) |
| Total Housing Units | 1,506 (91.8%) | 135 (8.2%) |
Occupancy by Educational Attainment in Beavercreek
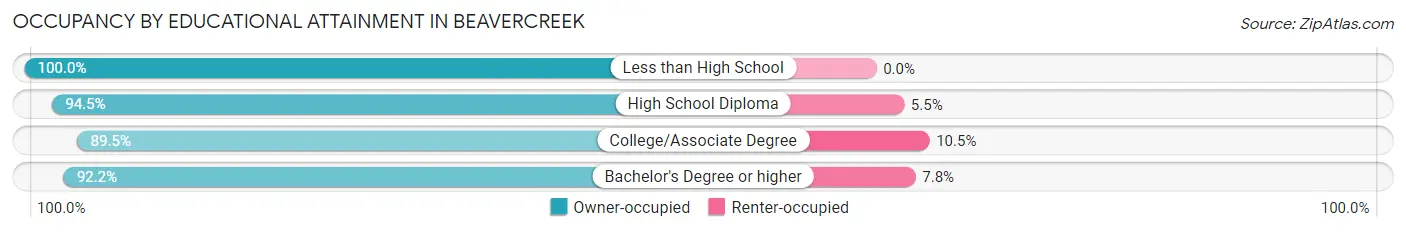
| Household Size | Owner-occupied | Renter-occupied |
| Less than High School | 54 (100.0%) | 0 (0.0%) |
| High School Diploma | 309 (94.5%) | 18 (5.5%) |
| College/Associate Degree | 621 (89.5%) | 73 (10.5%) |
| Bachelor's Degree or higher | 522 (92.2%) | 44 (7.8%) |
Occupancy by Age of Householder in Beavercreek
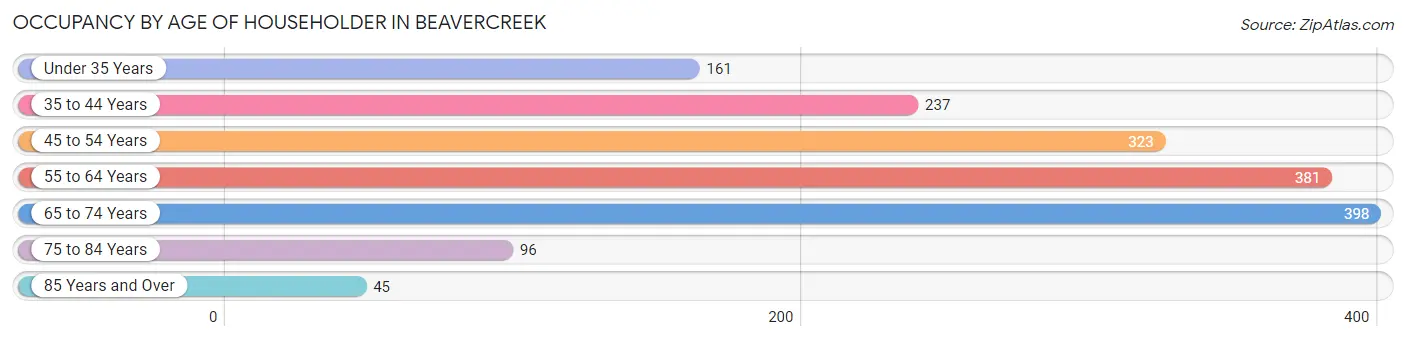
| Age Bracket | # Households | % Households |
| Under 35 Years | 161 | 9.8% |
| 35 to 44 Years | 237 | 14.4% |
| 45 to 54 Years | 323 | 19.7% |
| 55 to 64 Years | 381 | 23.2% |
| 65 to 74 Years | 398 | 24.2% |
| 75 to 84 Years | 96 | 5.9% |
| 85 Years and Over | 45 | 2.7% |
| Total | 1,641 | 100.0% |
Housing Finances in Beavercreek
Median Income by Occupancy in Beavercreek
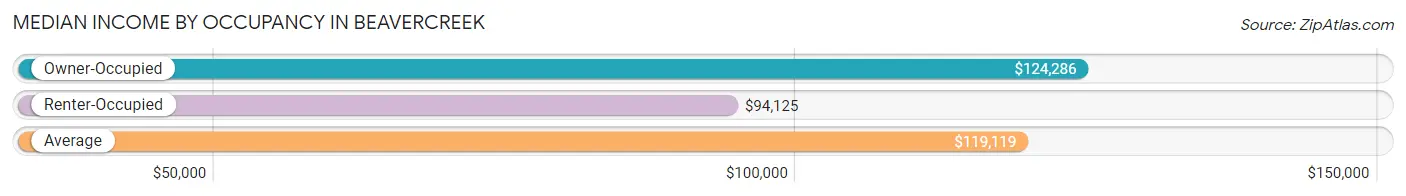
| Occupancy Type | # Households | Median Income |
| Owner-Occupied | 1,506 (91.8%) | $124,286 |
| Renter-Occupied | 135 (8.2%) | $94,125 |
| Average | 1,641 (100.0%) | $119,119 |
Occupancy by Householder Income Bracket in Beavercreek
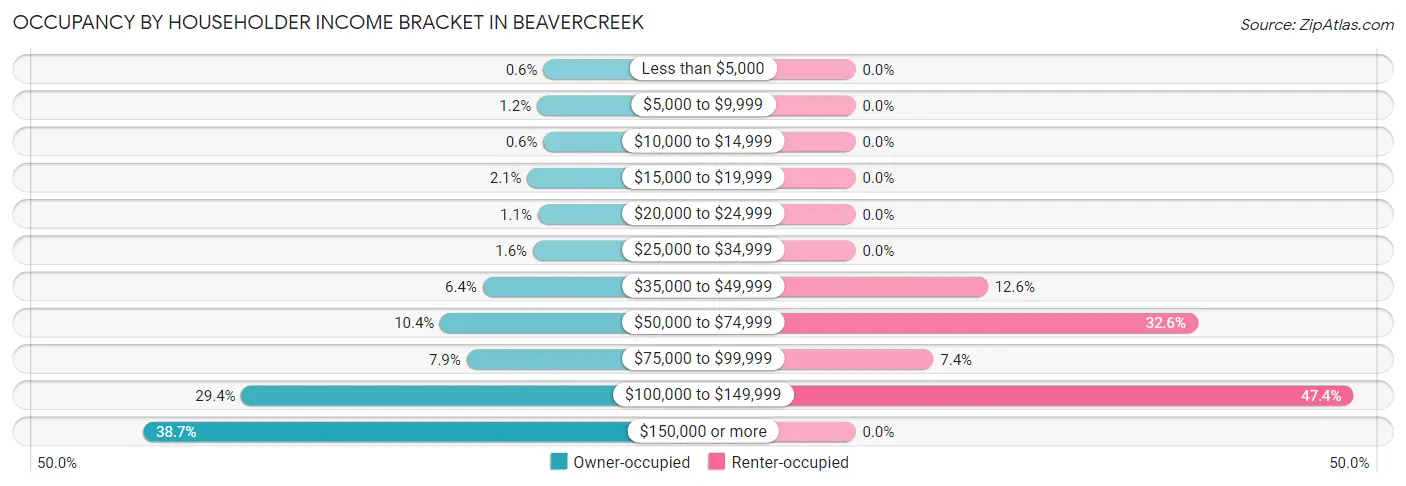
| Income Bracket | Owner-occupied | Renter-occupied |
| Less than $5,000 | 9 (0.6%) | 0 (0.0%) |
| $5,000 to $9,999 | 18 (1.2%) | 0 (0.0%) |
| $10,000 to $14,999 | 9 (0.6%) | 0 (0.0%) |
| $15,000 to $19,999 | 32 (2.1%) | 0 (0.0%) |
| $20,000 to $24,999 | 17 (1.1%) | 0 (0.0%) |
| $25,000 to $34,999 | 24 (1.6%) | 0 (0.0%) |
| $35,000 to $49,999 | 96 (6.4%) | 17 (12.6%) |
| $50,000 to $74,999 | 157 (10.4%) | 44 (32.6%) |
| $75,000 to $99,999 | 119 (7.9%) | 10 (7.4%) |
| $100,000 to $149,999 | 442 (29.3%) | 64 (47.4%) |
| $150,000 or more | 583 (38.7%) | 0 (0.0%) |
| Total | 1,506 (100.0%) | 135 (100.0%) |
Monthly Housing Cost Tiers in Beavercreek
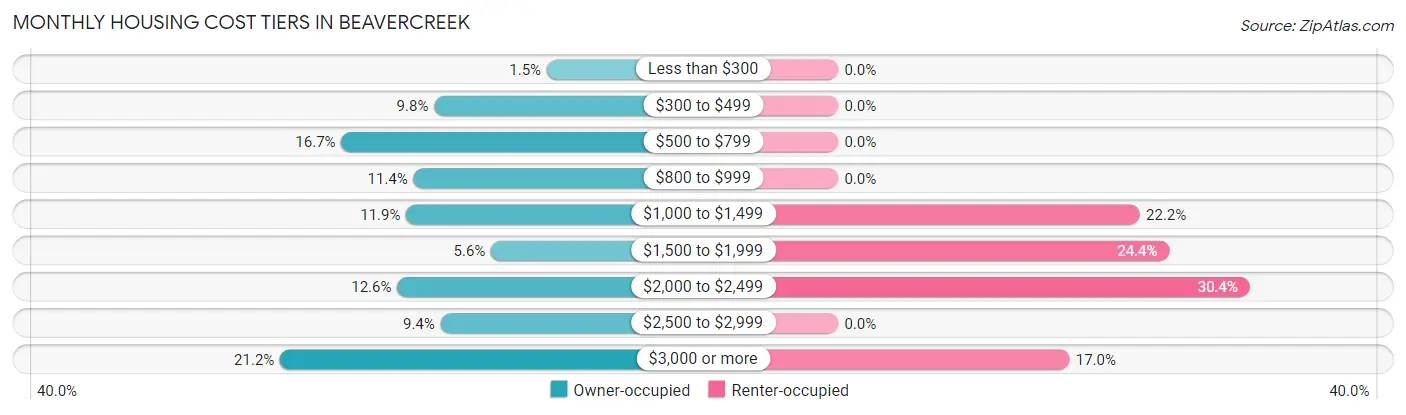
| Monthly Cost | Owner-occupied | Renter-occupied |
| Less than $300 | 23 (1.5%) | 0 (0.0%) |
| $300 to $499 | 148 (9.8%) | 0 (0.0%) |
| $500 to $799 | 251 (16.7%) | 0 (0.0%) |
| $800 to $999 | 171 (11.4%) | 0 (0.0%) |
| $1,000 to $1,499 | 179 (11.9%) | 30 (22.2%) |
| $1,500 to $1,999 | 85 (5.6%) | 33 (24.4%) |
| $2,000 to $2,499 | 189 (12.6%) | 41 (30.4%) |
| $2,500 to $2,999 | 141 (9.4%) | 0 (0.0%) |
| $3,000 or more | 319 (21.2%) | 23 (17.0%) |
| Total | 1,506 (100.0%) | 135 (100.0%) |
Physical Housing Characteristics in Beavercreek
Housing Structures in Beavercreek
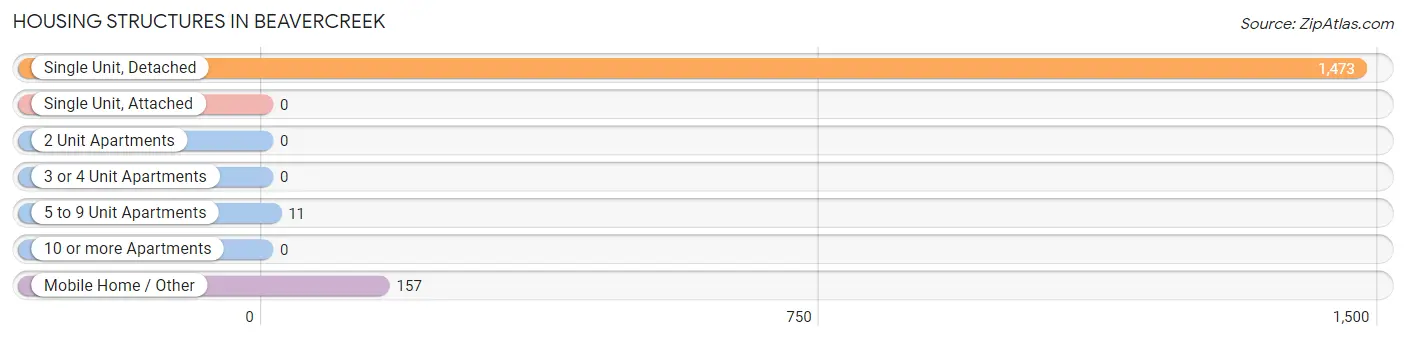
| Structure Type | # Housing Units | % Housing Units |
| Single Unit, Detached | 1,473 | 89.8% |
| Single Unit, Attached | 0 | 0.0% |
| 2 Unit Apartments | 0 | 0.0% |
| 3 or 4 Unit Apartments | 0 | 0.0% |
| 5 to 9 Unit Apartments | 11 | 0.7% |
| 10 or more Apartments | 0 | 0.0% |
| Mobile Home / Other | 157 | 9.6% |
| Total | 1,641 | 100.0% |
Housing Structures by Occupancy in Beavercreek
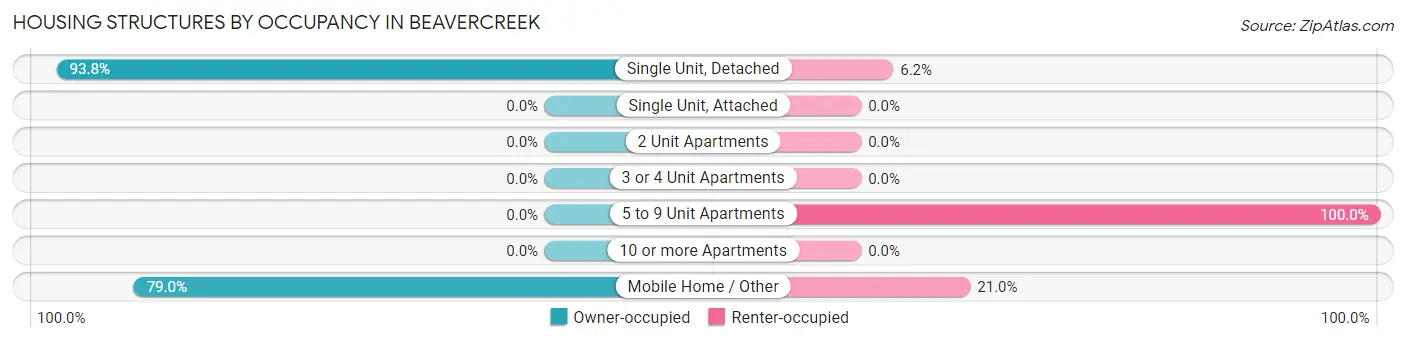
| Structure Type | Owner-occupied | Renter-occupied |
| Single Unit, Detached | 1,382 (93.8%) | 91 (6.2%) |
| Single Unit, Attached | 0 (0.0%) | 0 (0.0%) |
| 2 Unit Apartments | 0 (0.0%) | 0 (0.0%) |
| 3 or 4 Unit Apartments | 0 (0.0%) | 0 (0.0%) |
| 5 to 9 Unit Apartments | 0 (0.0%) | 11 (100.0%) |
| 10 or more Apartments | 0 (0.0%) | 0 (0.0%) |
| Mobile Home / Other | 124 (79.0%) | 33 (21.0%) |
| Total | 1,506 (91.8%) | 135 (8.2%) |
Housing Structures by Number of Rooms in Beavercreek
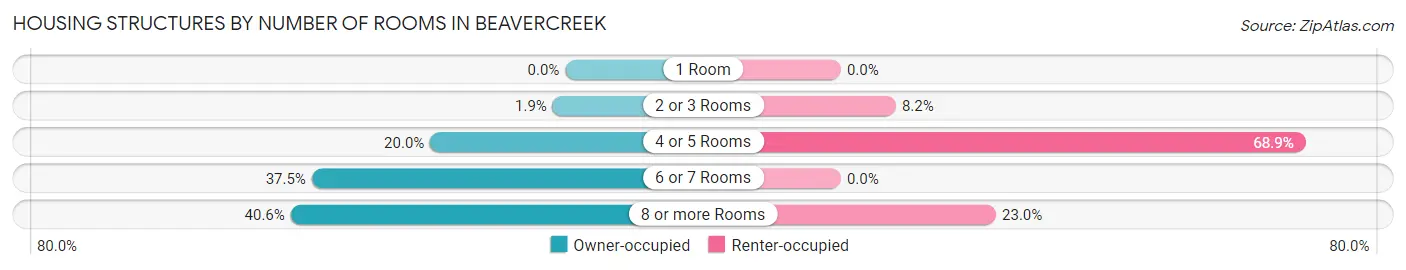
| Number of Rooms | Owner-occupied | Renter-occupied |
| 1 Room | 0 (0.0%) | 0 (0.0%) |
| 2 or 3 Rooms | 28 (1.9%) | 11 (8.2%) |
| 4 or 5 Rooms | 301 (20.0%) | 93 (68.9%) |
| 6 or 7 Rooms | 565 (37.5%) | 0 (0.0%) |
| 8 or more Rooms | 612 (40.6%) | 31 (23.0%) |
| Total | 1,506 (100.0%) | 135 (100.0%) |
Housing Structure by Heating Type in Beavercreek
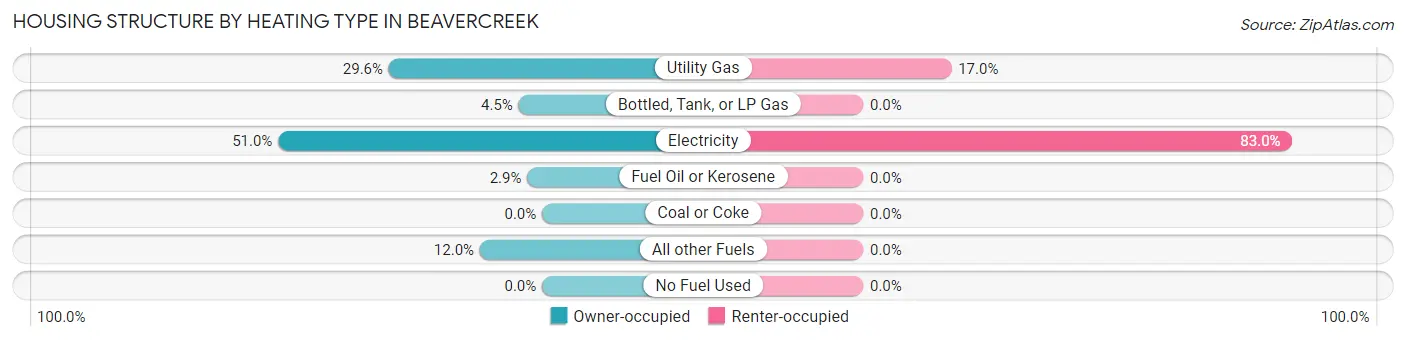
| Heating Type | Owner-occupied | Renter-occupied |
| Utility Gas | 446 (29.6%) | 23 (17.0%) |
| Bottled, Tank, or LP Gas | 68 (4.5%) | 0 (0.0%) |
| Electricity | 768 (51.0%) | 112 (83.0%) |
| Fuel Oil or Kerosene | 43 (2.9%) | 0 (0.0%) |
| Coal or Coke | 0 (0.0%) | 0 (0.0%) |
| All other Fuels | 181 (12.0%) | 0 (0.0%) |
| No Fuel Used | 0 (0.0%) | 0 (0.0%) |
| Total | 1,506 (100.0%) | 135 (100.0%) |
Household Vehicle Usage in Beavercreek
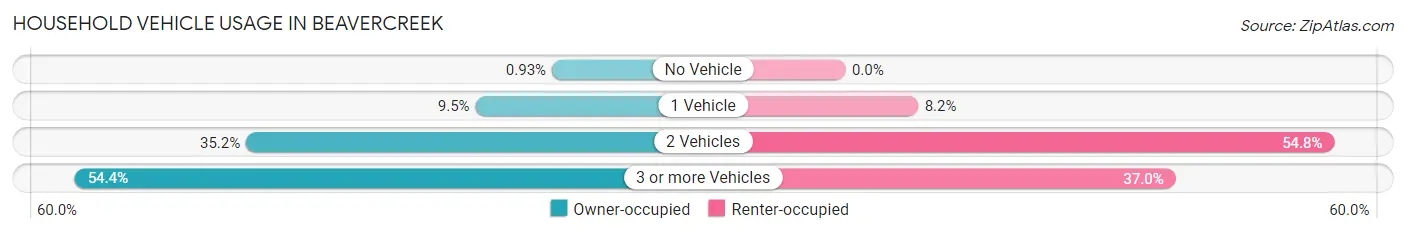
| Vehicles per Household | Owner-occupied | Renter-occupied |
| No Vehicle | 14 (0.9%) | 0 (0.0%) |
| 1 Vehicle | 143 (9.5%) | 11 (8.2%) |
| 2 Vehicles | 530 (35.2%) | 74 (54.8%) |
| 3 or more Vehicles | 819 (54.4%) | 50 (37.0%) |
| Total | 1,506 (100.0%) | 135 (100.0%) |
Real Estate & Mortgages in Beavercreek
Real Estate and Mortgage Overview in Beavercreek
| Characteristic | Without Mortgage | With Mortgage |
| Housing Units | 662 | 844 |
| Median Property Value | $516,000 | $699,000 |
| Median Household Income | $105,078 | $447 |
| Monthly Housing Costs | $654 | $319 |
| Real Estate Taxes | $3,663 | $0 |
Property Value by Mortgage Status in Beavercreek
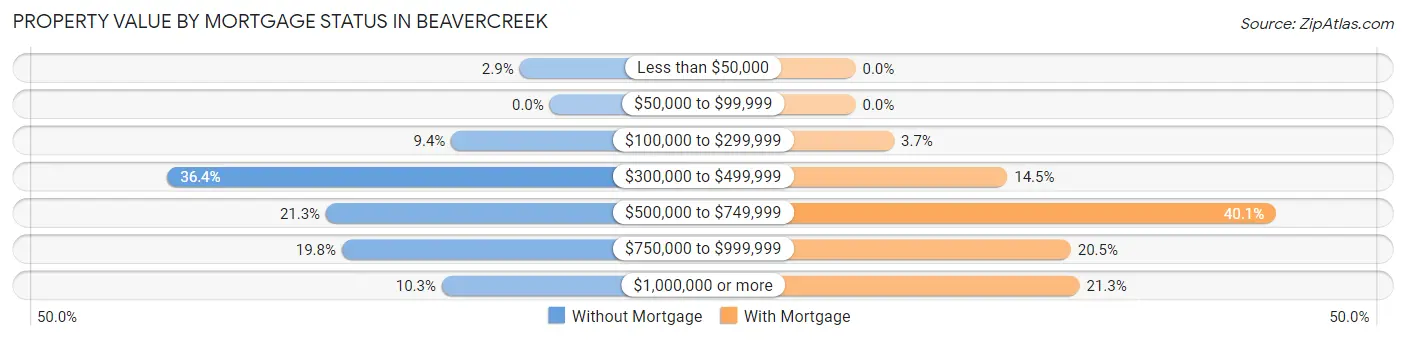
| Property Value | Without Mortgage | With Mortgage |
| Less than $50,000 | 19 (2.9%) | 0 (0.0%) |
| $50,000 to $99,999 | 0 (0.0%) | 0 (0.0%) |
| $100,000 to $299,999 | 62 (9.4%) | 31 (3.7%) |
| $300,000 to $499,999 | 241 (36.4%) | 122 (14.4%) |
| $500,000 to $749,999 | 141 (21.3%) | 338 (40.1%) |
| $750,000 to $999,999 | 131 (19.8%) | 173 (20.5%) |
| $1,000,000 or more | 68 (10.3%) | 180 (21.3%) |
| Total | 662 (100.0%) | 844 (100.0%) |
Household Income by Mortgage Status in Beavercreek
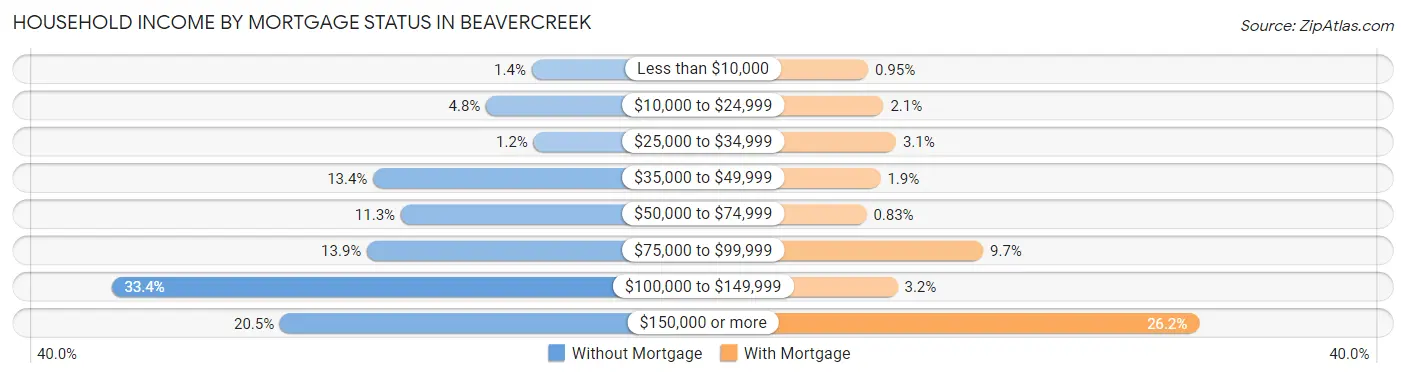
| Household Income | Without Mortgage | With Mortgage |
| Less than $10,000 | 9 (1.4%) | 8 (0.9%) |
| $10,000 to $24,999 | 32 (4.8%) | 18 (2.1%) |
| $25,000 to $34,999 | 8 (1.2%) | 26 (3.1%) |
| $35,000 to $49,999 | 89 (13.4%) | 16 (1.9%) |
| $50,000 to $74,999 | 75 (11.3%) | 7 (0.8%) |
| $75,000 to $99,999 | 92 (13.9%) | 82 (9.7%) |
| $100,000 to $149,999 | 221 (33.4%) | 27 (3.2%) |
| $150,000 or more | 136 (20.5%) | 221 (26.2%) |
| Total | 662 (100.0%) | 844 (100.0%) |
Property Value to Household Income Ratio in Beavercreek
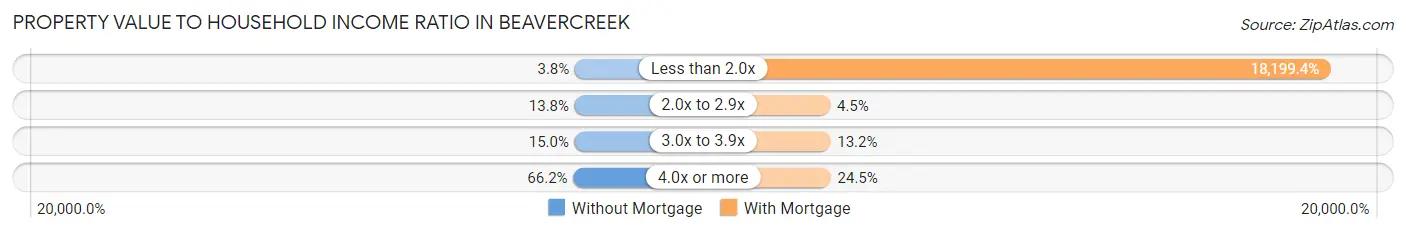
| Value-to-Income Ratio | Without Mortgage | With Mortgage |
| Less than 2.0x | 25 (3.8%) | 153,603 (18,199.4%) |
| 2.0x to 2.9x | 91 (13.8%) | 38 (4.5%) |
| 3.0x to 3.9x | 99 (14.9%) | 111 (13.2%) |
| 4.0x or more | 438 (66.2%) | 207 (24.5%) |
| Total | 662 (100.0%) | 844 (100.0%) |
Real Estate Taxes by Mortgage Status in Beavercreek
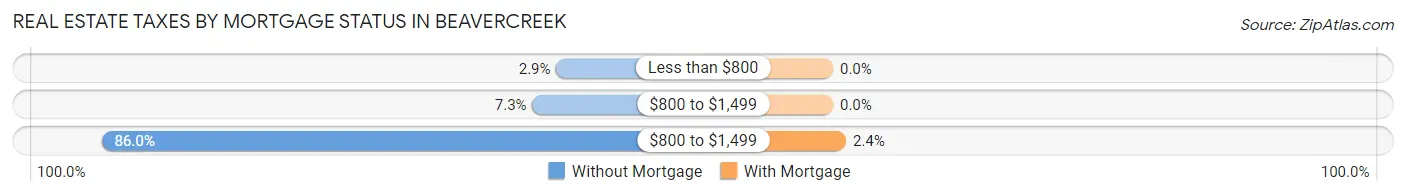
| Property Taxes | Without Mortgage | With Mortgage |
| Less than $800 | 19 (2.9%) | 0 (0.0%) |
| $800 to $1,499 | 48 (7.2%) | 0 (0.0%) |
| $800 to $1,499 | 569 (86.0%) | 20 (2.4%) |
| Total | 662 (100.0%) | 844 (100.0%) |
Health & Disability in Beavercreek
Health Insurance Coverage by Age in Beavercreek
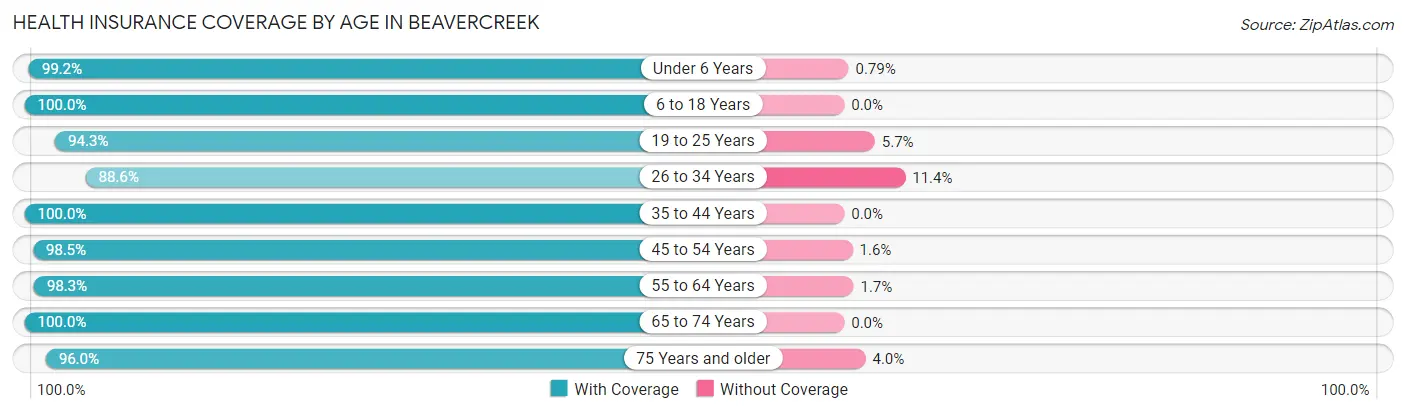
| Age Bracket | With Coverage | Without Coverage |
| Under 6 Years | 376 (99.2%) | 3 (0.8%) |
| 6 to 18 Years | 582 (100.0%) | 0 (0.0%) |
| 19 to 25 Years | 182 (94.3%) | 11 (5.7%) |
| 26 to 34 Years | 374 (88.6%) | 48 (11.4%) |
| 35 to 44 Years | 625 (100.0%) | 0 (0.0%) |
| 45 to 54 Years | 699 (98.5%) | 11 (1.5%) |
| 55 to 64 Years | 744 (98.3%) | 13 (1.7%) |
| 65 to 74 Years | 637 (100.0%) | 0 (0.0%) |
| 75 Years and older | 218 (96.0%) | 9 (4.0%) |
| Total | 4,437 (97.9%) | 95 (2.1%) |
Health Insurance Coverage by Citizenship Status in Beavercreek
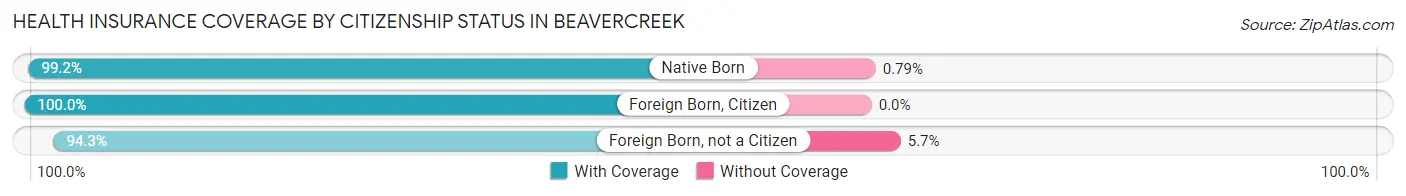
| Citizenship Status | With Coverage | Without Coverage |
| Native Born | 376 (99.2%) | 3 (0.8%) |
| Foreign Born, Citizen | 582 (100.0%) | 0 (0.0%) |
| Foreign Born, not a Citizen | 182 (94.3%) | 11 (5.7%) |
Health Insurance Coverage by Household Income in Beavercreek
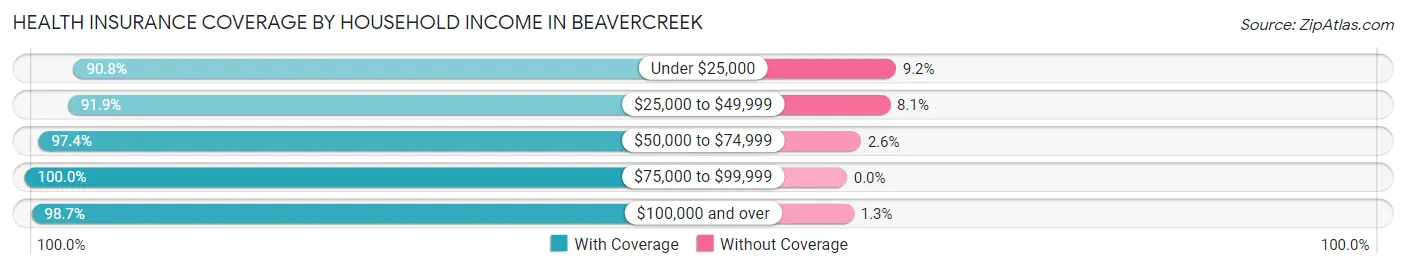
| Household Income | With Coverage | Without Coverage |
| Under $25,000 | 89 (90.8%) | 9 (9.2%) |
| $25,000 to $49,999 | 362 (91.9%) | 32 (8.1%) |
| $50,000 to $74,999 | 411 (97.4%) | 11 (2.6%) |
| $75,000 to $99,999 | 331 (100.0%) | 0 (0.0%) |
| $100,000 and over | 3,237 (98.7%) | 43 (1.3%) |
Public vs Private Health Insurance Coverage by Age in Beavercreek
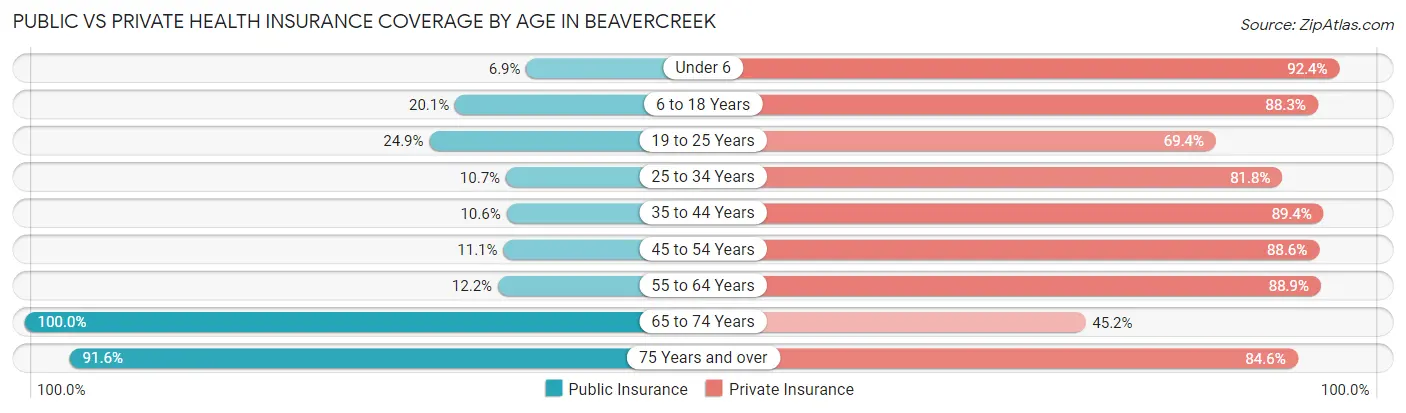
| Age Bracket | Public Insurance | Private Insurance |
| Under 6 | 26 (6.9%) | 350 (92.3%) |
| 6 to 18 Years | 117 (20.1%) | 514 (88.3%) |
| 19 to 25 Years | 48 (24.9%) | 134 (69.4%) |
| 25 to 34 Years | 45 (10.7%) | 345 (81.8%) |
| 35 to 44 Years | 66 (10.6%) | 559 (89.4%) |
| 45 to 54 Years | 79 (11.1%) | 629 (88.6%) |
| 55 to 64 Years | 92 (12.1%) | 673 (88.9%) |
| 65 to 74 Years | 637 (100.0%) | 288 (45.2%) |
| 75 Years and over | 208 (91.6%) | 192 (84.6%) |
| Total | 1,318 (29.1%) | 3,684 (81.3%) |
Disability Status by Sex by Age in Beavercreek
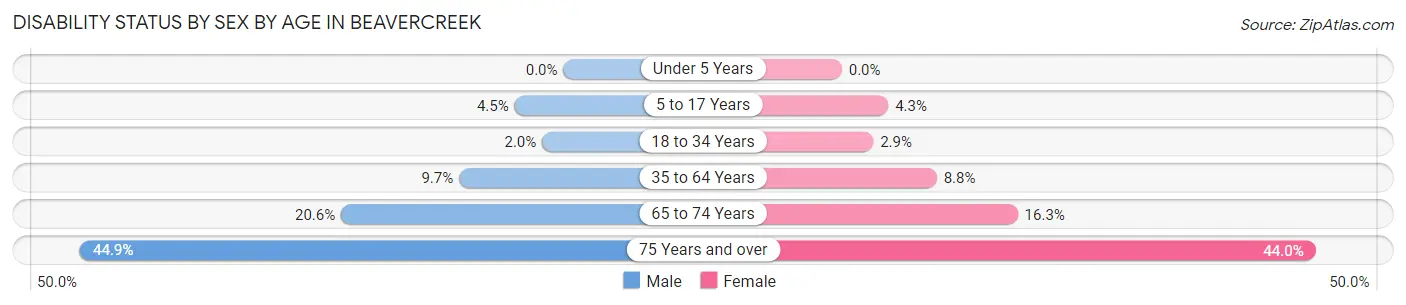
| Age Bracket | Male | Female |
| Under 5 Years | 0 (0.0%) | 0 (0.0%) |
| 5 to 17 Years | 16 (4.5%) | 9 (4.3%) |
| 18 to 34 Years | 7 (2.0%) | 9 (2.9%) |
| 35 to 64 Years | 107 (9.7%) | 87 (8.8%) |
| 65 to 74 Years | 72 (20.6%) | 47 (16.3%) |
| 75 Years and over | 61 (44.9%) | 40 (44.0%) |
Disability Class by Sex by Age in Beavercreek
Disability Class: Hearing Difficulty
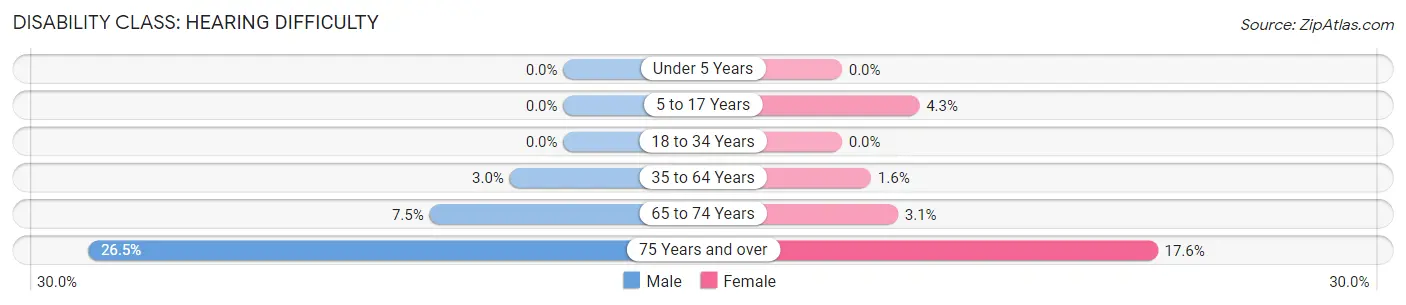
| Age Bracket | Male | Female |
| Under 5 Years | 0 (0.0%) | 0 (0.0%) |
| 5 to 17 Years | 0 (0.0%) | 9 (4.3%) |
| 18 to 34 Years | 0 (0.0%) | 0 (0.0%) |
| 35 to 64 Years | 33 (3.0%) | 16 (1.6%) |
| 65 to 74 Years | 26 (7.4%) | 9 (3.1%) |
| 75 Years and over | 36 (26.5%) | 16 (17.6%) |
Disability Class: Vision Difficulty
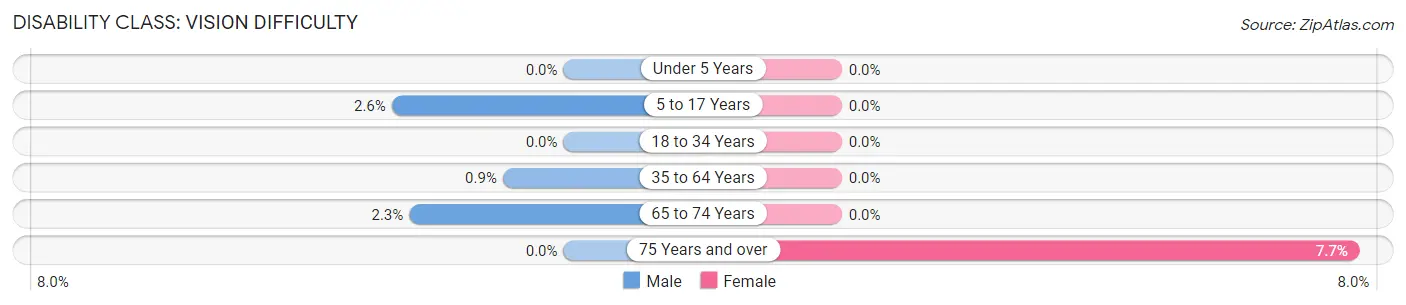
| Age Bracket | Male | Female |
| Under 5 Years | 0 (0.0%) | 0 (0.0%) |
| 5 to 17 Years | 9 (2.5%) | 0 (0.0%) |
| 18 to 34 Years | 0 (0.0%) | 0 (0.0%) |
| 35 to 64 Years | 10 (0.9%) | 0 (0.0%) |
| 65 to 74 Years | 8 (2.3%) | 0 (0.0%) |
| 75 Years and over | 0 (0.0%) | 7 (7.7%) |
Disability Class: Cognitive Difficulty
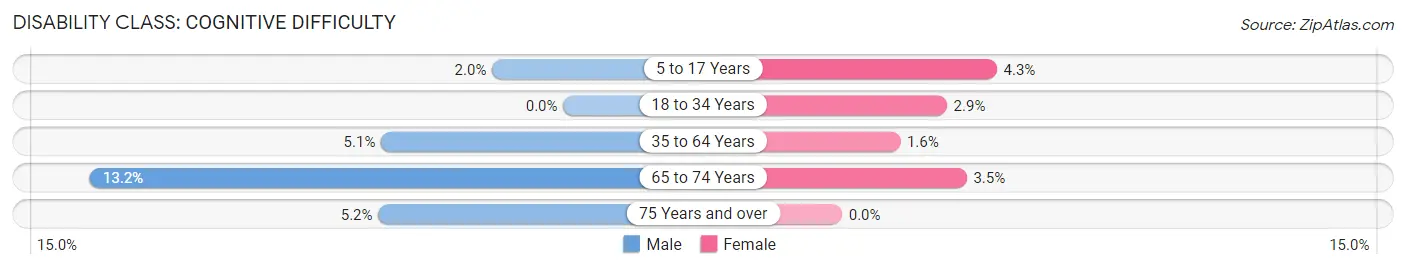
| Age Bracket | Male | Female |
| 5 to 17 Years | 7 (2.0%) | 9 (4.3%) |
| 18 to 34 Years | 0 (0.0%) | 9 (2.9%) |
| 35 to 64 Years | 56 (5.1%) | 16 (1.6%) |
| 65 to 74 Years | 46 (13.2%) | 10 (3.5%) |
| 75 Years and over | 7 (5.1%) | 0 (0.0%) |
Disability Class: Ambulatory Difficulty
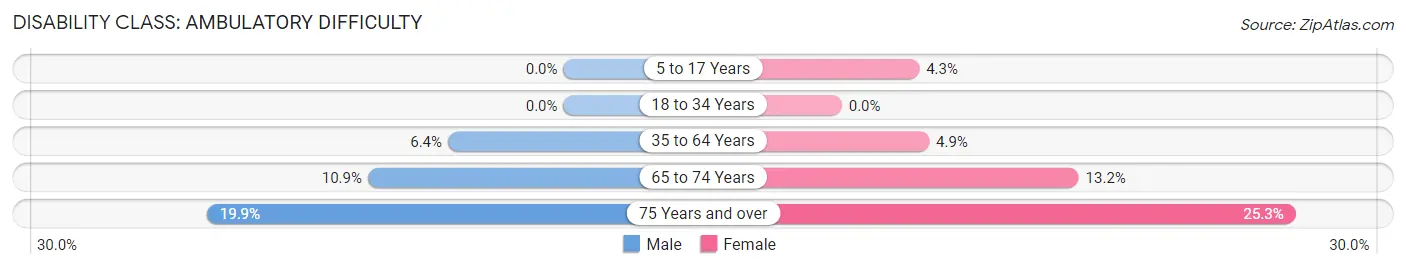
| Age Bracket | Male | Female |
| 5 to 17 Years | 0 (0.0%) | 9 (4.3%) |
| 18 to 34 Years | 0 (0.0%) | 0 (0.0%) |
| 35 to 64 Years | 71 (6.4%) | 48 (4.9%) |
| 65 to 74 Years | 38 (10.9%) | 38 (13.2%) |
| 75 Years and over | 27 (19.9%) | 23 (25.3%) |
Disability Class: Self-Care Difficulty
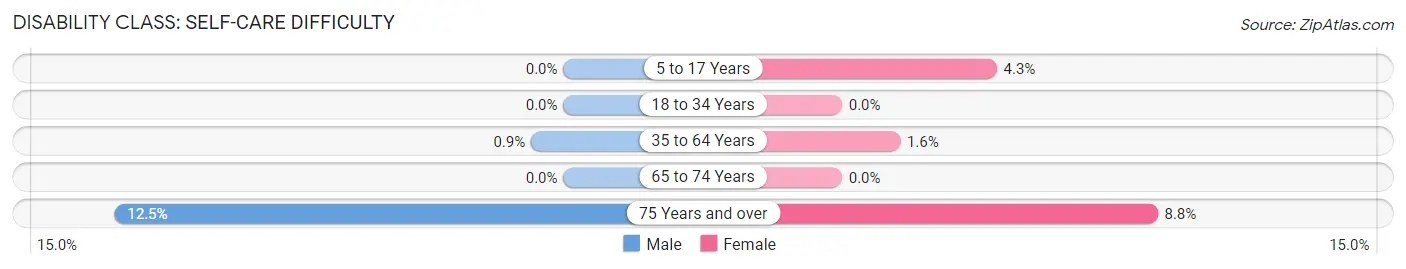
| Age Bracket | Male | Female |
| 5 to 17 Years | 0 (0.0%) | 9 (4.3%) |
| 18 to 34 Years | 0 (0.0%) | 0 (0.0%) |
| 35 to 64 Years | 10 (0.9%) | 16 (1.6%) |
| 65 to 74 Years | 0 (0.0%) | 0 (0.0%) |
| 75 Years and over | 17 (12.5%) | 8 (8.8%) |
Technology Access in Beavercreek
Computing Device Access in Beavercreek
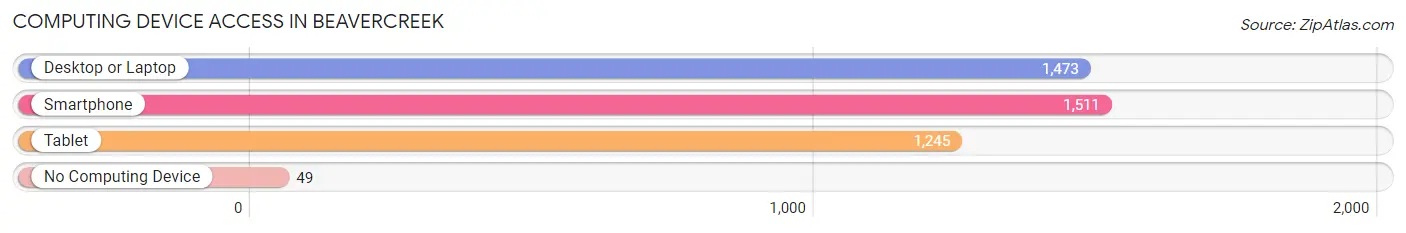
| Device Type | # Households | % Households |
| Desktop or Laptop | 1,473 | 89.8% |
| Smartphone | 1,511 | 92.1% |
| Tablet | 1,245 | 75.9% |
| No Computing Device | 49 | 3.0% |
| Total | 1,641 | 100.0% |
Internet Access in Beavercreek
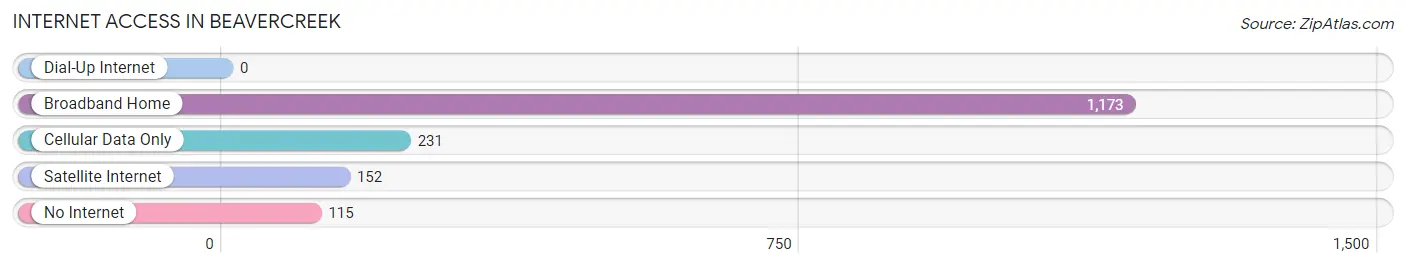
| Internet Type | # Households | % Households |
| Dial-Up Internet | 0 | 0.0% |
| Broadband Home | 1,173 | 71.5% |
| Cellular Data Only | 231 | 14.1% |
| Satellite Internet | 152 | 9.3% |
| No Internet | 115 | 7.0% |
| Total | 1,641 | 100.0% |
Beavercreek Summary
Beavercreek, Oregon is a small unincorporated community located in Clackamas County, Oregon. It is situated in the foothills of the Cascade Mountains, approximately 20 miles south of Portland. The community is home to approximately 1,000 people and is known for its rural charm and close-knit community.
History
Beavercreek was first settled in the late 1800s by a group of German immigrants. The town was originally called “Beaver Creek” after the nearby creek, but the name was changed to Beavercreek in the early 1900s. The town was primarily an agricultural community, with many of the early settlers growing wheat, oats, and hay.
In the early 1900s, the town began to grow and develop. A post office was established in 1906, and a school was built in 1908. The town also had a general store, a blacksmith shop, and a few other businesses.
In the 1920s, the town began to experience a population boom. Many of the new residents were farmers who had moved to the area to take advantage of the fertile soil and mild climate. The town also began to attract more businesses, including a bank, a movie theater, and a hotel.
Geography
Beavercreek is located in the foothills of the Cascade Mountains, approximately 20 miles south of Portland. The town is situated in a valley surrounded by rolling hills and lush forests. The nearby Beaver Creek runs through the town and is a popular spot for fishing and swimming.
The climate in Beavercreek is mild and temperate. Summers are warm and dry, while winters are cool and wet. The average annual temperature is around 50 degrees Fahrenheit.
Economy
Beavercreek’s economy is primarily based on agriculture. The town is home to several farms that grow a variety of crops, including wheat, oats, hay, and vegetables. The town also has a few small businesses, including a general store, a bank, and a movie theater.
Demographics
As of the 2010 census, Beavercreek had a population of 1,000 people. The racial makeup of the town was 94.2% White, 0.7% African American, 0.7% Native American, 0.7% Asian, 0.7% from other races, and 2.7% from two or more races. Hispanic or Latino of any race were 2.7% of the population.
The median household income in Beavercreek was $50,000, and the median family income was $54,000. The per capita income was $21,000. About 8.7% of families and 11.7% of the population were below the poverty line, including 16.7% of those under age 18 and none of those age 65 or over.
Beavercreek is a small, rural community with a close-knit population. The town is known for its rural charm and friendly atmosphere. It is a great place to live for those who enjoy the outdoors and a slower pace of life.
Common Questions
What is Per Capita Income in Beavercreek?
Per Capita income in Beavercreek is $54,068.
What is the Median Family Income in Beavercreek?
Median Family Income in Beavercreek is $121,597.
What is the Median Household income in Beavercreek?
Median Household Income in Beavercreek is $119,119.
What is Income or Wage Gap in Beavercreek?
Income or Wage Gap in Beavercreek is 22.6%.
Women in Beavercreek earn 77.4 cents for every dollar earned by a man.
What is Inequality or Gini Index in Beavercreek?
Inequality or Gini Index in Beavercreek is 0.37.
What is the Total Population of Beavercreek?
Total Population of Beavercreek is 4,532.
What is the Total Male Population of Beavercreek?
Total Male Population of Beavercreek is 2,518.
What is the Total Female Population of Beavercreek?
Total Female Population of Beavercreek is 2,014.
What is the Ratio of Males per 100 Females in Beavercreek?
There are 125.02 Males per 100 Females in Beavercreek.
What is the Ratio of Females per 100 Males in Beavercreek?
There are 79.98 Females per 100 Males in Beavercreek.
What is the Median Population Age in Beavercreek?
Median Population Age in Beavercreek is 47.2 Years.
What is the Average Family Size in Beavercreek
Average Family Size in Beavercreek is 3.0 People.
What is the Average Household Size in Beavercreek
Average Household Size in Beavercreek is 2.8 People.
How Large is the Labor Force in Beavercreek?
There are 2,308 People in the Labor Forcein in Beavercreek.
What is the Percentage of People in the Labor Force in Beavercreek?
61.7% of People are in the Labor Force in Beavercreek.
What is the Unemployment Rate in Beavercreek?
Unemployment Rate in Beavercreek is 3.0%.