Zip Codes with the Highest Percentage of Population Employed in Security & Protection in Muskogee, OK
RELATED REPORTS & OPTIONS
Security & Protection
Muskogee
Compare Zip Codes
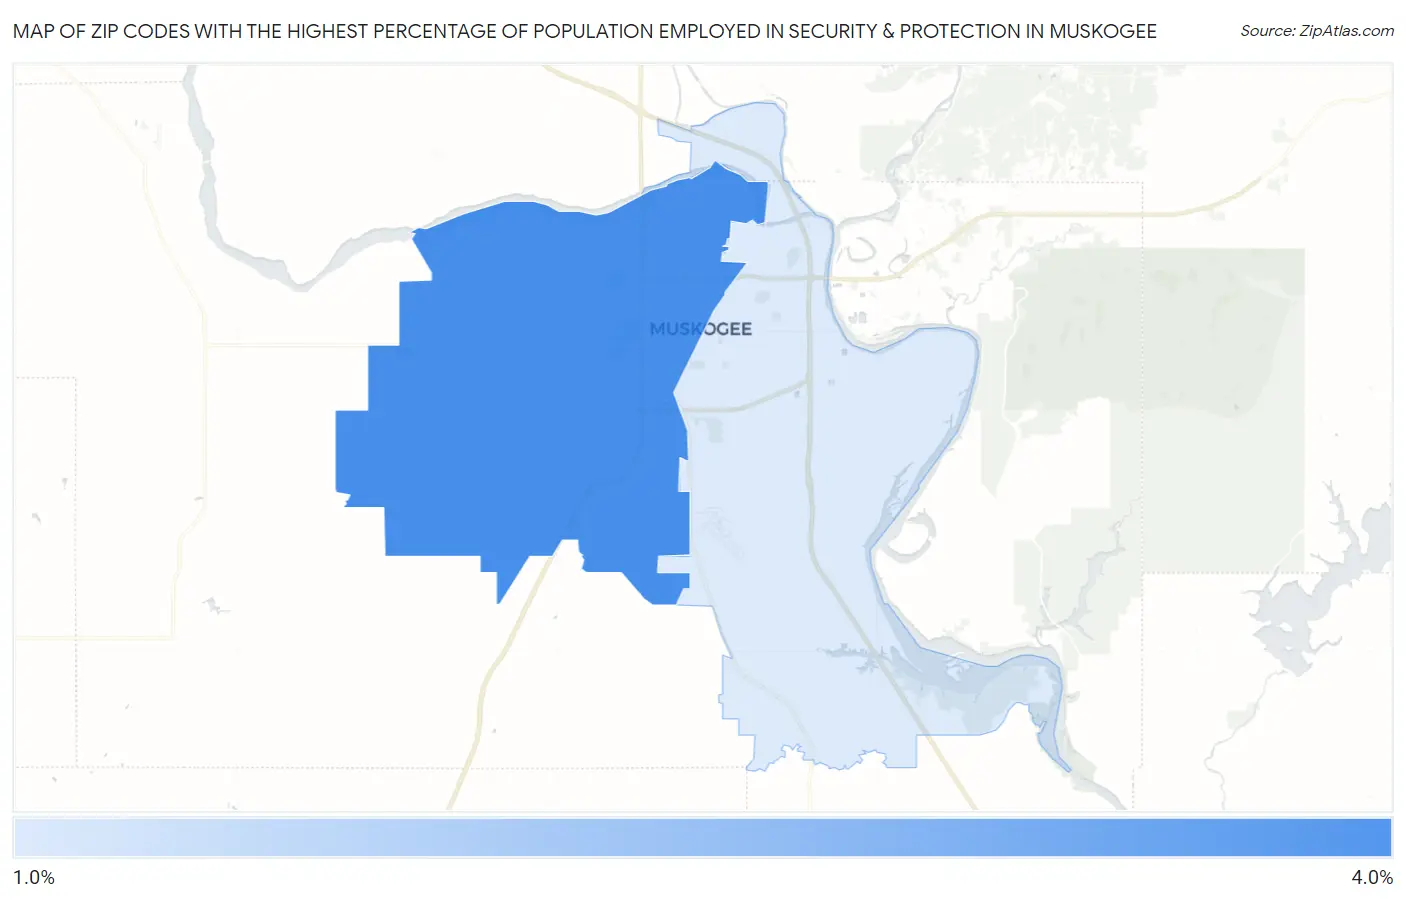
Map of Zip Codes with the Highest Percentage of Population Employed in Security & Protection in Muskogee
1.9%
4.0%
Zip Codes with the Highest Percentage of Population Employed in Security & Protection in Muskogee, OK
| Zip Code | % Employed | vs State | vs National | |
| 1. | 74401 | 4.0% | 2.0%(+1.97)#96 | 2.1%(+1.83)#4,538 |
| 2. | 74403 | 1.9% | 2.0%(-0.127)#295 | 2.1%(-0.267)#13,369 |
1
Common Questions
What are the Top Zip Codes with the Highest Percentage of Population Employed in Security & Protection in Muskogee, OK?
Top Zip Codes with the Highest Percentage of Population Employed in Security & Protection in Muskogee, OK are:
What zip code has the Highest Percentage of Population Employed in Security & Protection in Muskogee, OK?
74401 has the Highest Percentage of Population Employed in Security & Protection in Muskogee, OK with 4.0%.
What is the Percentage of Population Employed in Security & Protection in Muskogee, OK?
Percentage of Population Employed in Security & Protection in Muskogee is 2.4%.
What is the Percentage of Population Employed in Security & Protection in Oklahoma?
Percentage of Population Employed in Security & Protection in Oklahoma is 2.0%.
What is the Percentage of Population Employed in Security & Protection in the United States?
Percentage of Population Employed in Security & Protection in the United States is 2.1%.