Zip Codes with the Most Immigrants from South Eastern Asia in Muskogee, OK
RELATED REPORTS & OPTIONS
South Eastern Asia
Muskogee
Compare Zip Codes
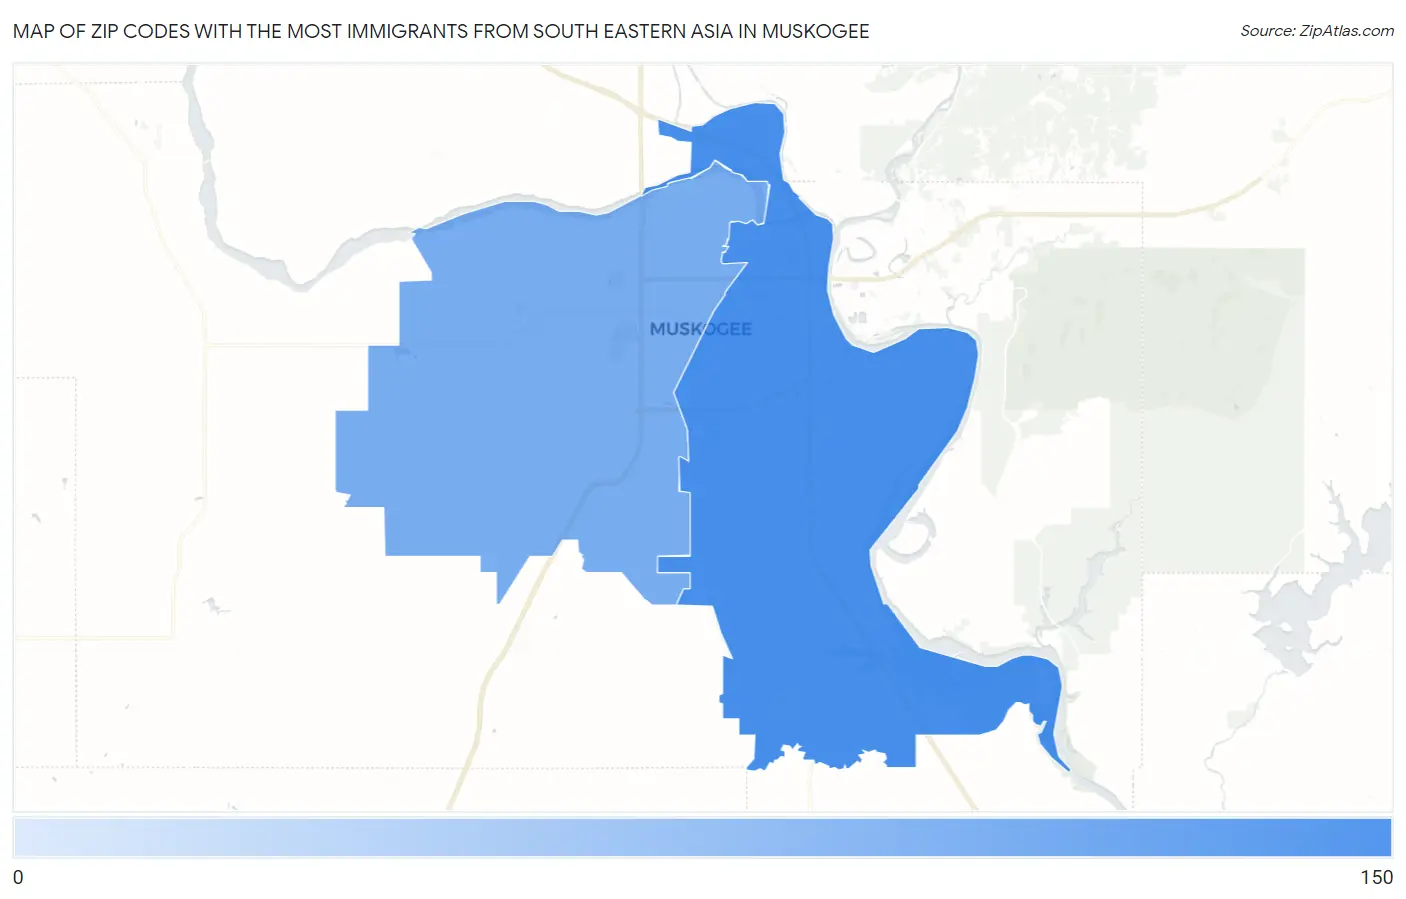
Map of Zip Codes with the Most Immigrants from South Eastern Asia in Muskogee
26
133
Zip Codes with the Most Immigrants from South Eastern Asia in Muskogee, OK
| Zip Code | South Eastern Asia | vs State | vs National | |
| 1. | 74403 | 133 | 31,076(0.43%)#59 | 4,292,058(0.00%)#5,142 |
| 2. | 74401 | 26 | 31,076(0.08%)#132 | 4,292,058(0.00%)#9,575 |
1
Common Questions
What are the Top Zip Codes with the Most Immigrants from South Eastern Asia in Muskogee, OK?
Top Zip Codes with the Most Immigrants from South Eastern Asia in Muskogee, OK are:
What zip code has the Most Immigrants from South Eastern Asia in Muskogee, OK?
74403 has the Most Immigrants from South Eastern Asia in Muskogee, OK with 133.
What is the Total Immigrants from South Eastern Asia in Muskogee, OK?
Total Immigrants from South Eastern Asia in Muskogee is 151.
What is the Total Immigrants from South Eastern Asia in Oklahoma?
Total Immigrants from South Eastern Asia in Oklahoma is 31,076.
What is the Total Immigrants from South Eastern Asia in the United States?
Total Immigrants from South Eastern Asia in the United States is 4,292,058.