Zip Codes with the Highest Percentage of Immigrants from Latin America in Lima, OH
RELATED REPORTS & OPTIONS
Latin America
Lima
Compare Zip Codes
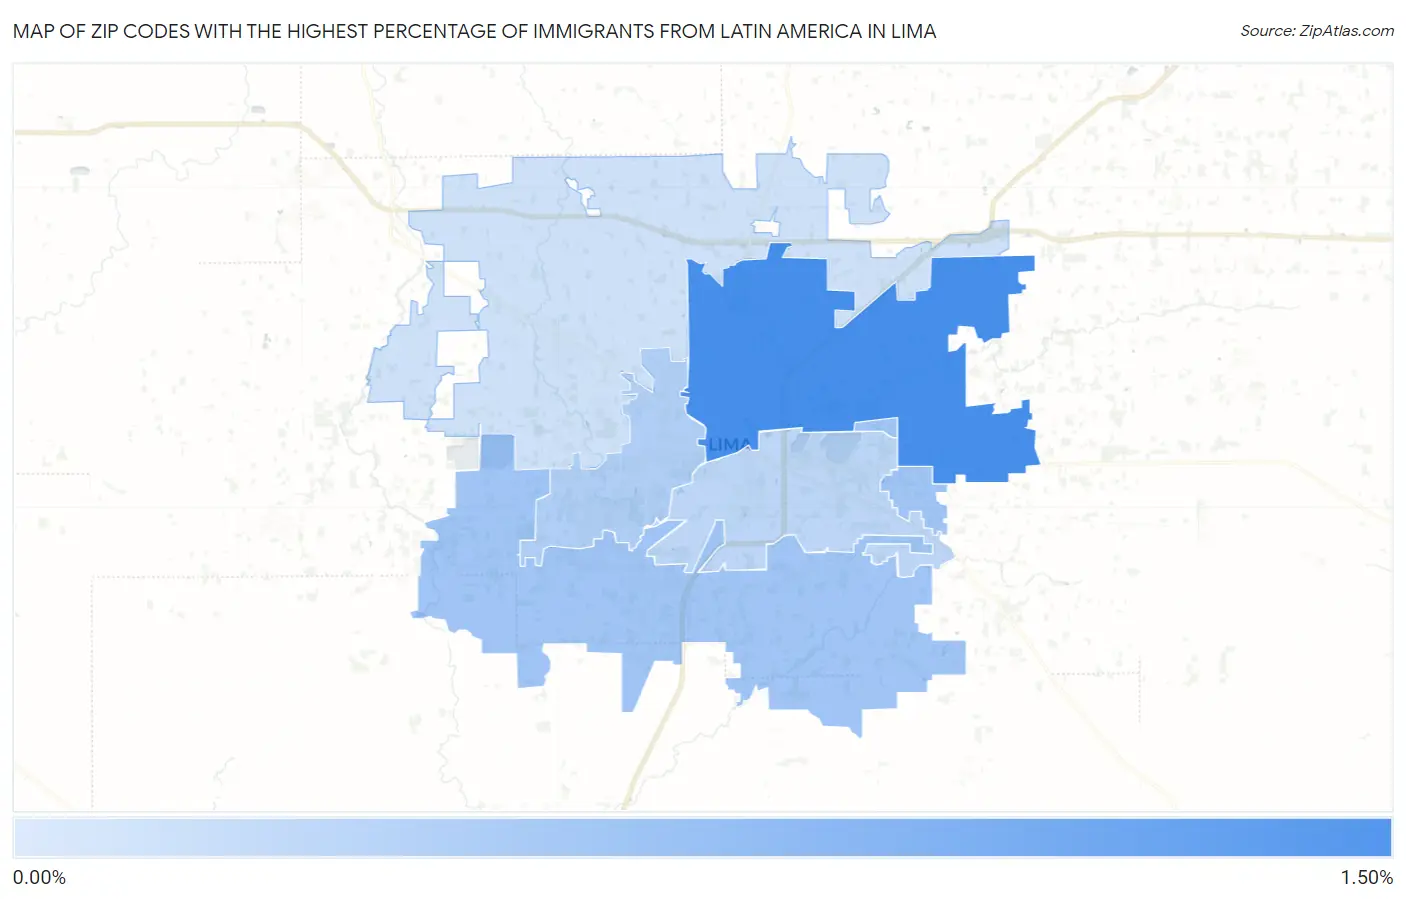
Map of Zip Codes with the Highest Percentage of Immigrants from Latin America in Lima
0.12%
1.29%
Zip Codes with the Highest Percentage of Immigrants from Latin America in Lima, OH
| Zip Code | Latin America | vs State | vs National | |
| 1. | 45801 | 1.29% | 0.97%(+0.322)#-1 | 6.84%(-5.55)#0 |
| 2. | 45806 | 0.52% | 0.97%(-0.444)#0 | 6.84%(-6.32)#1 |
| 3. | 45805 | 0.38% | 0.97%(-0.590)#1 | 6.84%(-6.46)#2 |
| 4. | 45804 | 0.27% | 0.97%(-0.692)#2 | 6.84%(-6.57)#3 |
| 5. | 45807 | 0.12% | 0.97%(-0.849)#3 | 6.84%(-6.72)#4 |
1
Common Questions
What are the Top 3 Zip Codes with the Highest Percentage of Immigrants from Latin America in Lima, OH?
Top 3 Zip Codes with the Highest Percentage of Immigrants from Latin America in Lima, OH are:
What zip code has the Highest Percentage of Immigrants from Latin America in Lima, OH?
45801 has the Highest Percentage of Immigrants from Latin America in Lima, OH with 1.29%.
What is the Percentage of Immigrants from Latin America in Lima, OH?
Percentage of Immigrants from Latin America in Lima is 0.78%.
What is the Percentage of Immigrants from Latin America in Ohio?
Percentage of Immigrants from Latin America in Ohio is 0.97%.
What is the Percentage of Immigrants from Latin America in the United States?
Percentage of Immigrants from Latin America in the United States is 6.84%.