Zip Codes with the Highest Percentage of Population Employed in Arts, Entertainment & Recreation in Las Vegas, NV

RELATED REPORTS & OPTIONS

Arts, Entertainment & Recreation
Population
Families and Households
Female Fertility
Female Fertility (Unmarried)
Race (Community Size)
Race (Percentage)
Ancestry (Community Size)
AfghanAfricanAlaska NativeAlbanianAleutAmericanApacheArabArapahoArgentineanArmenianAssyrian / Chaldean / SyriacAustralianAustrianBangladeshiBarbadianBasqueBelgianBelizeanBhutaneseBlackfeetBolivianBrazilianBritishBritish West IndianBulgarianBurmeseCajunCambodianCanadianCape VerdeanCelticCentral AmericanCentral American IndianCherokeeCheyenneChickasawChileanChineseChippewaChoctawColombianComancheCosta RicanCreeCreekCroatianCubanCzechCzechoslovakianDanishDelawareDominicanDutchDutch West IndianEastern EuropeanEcuadorianEgyptianEnglishEstonianEthiopianEuropeanFijianFilipinoFinnishFrenchFrench American IndianFrench CanadianGermanGerman RussianGhanaianGreekGuamanian / ChamorroGuatemalanGuyaneseHaitianHonduranHopiHungarianIcelanderIndian (Asian)IndonesianInupiatIranianIraqiIrishIroquoisIsraeliItalianJamaicanJapaneseJordanianKenyanKoreanLaotianLatvianLebaneseLiberianLithuanianLuxembourgerMacedonianMalaysianMalteseMenomineeMexicanMexican American IndianMongolianMoroccanNative HawaiianNavajoNew ZealanderNicaraguanNigerianNorthern EuropeanNorwegianOkinawanOsagePaiutePakistaniPalestinianPanamanianParaguayanPennsylvania GermanPeruvianPimaPolishPortuguesePotawatomiPuebloPuerto RicanPuget Sound SalishRomanianRussianSalvadoranSamoanScandinavianScotch-IrishScottishSeminoleSenegaleseSerbianShoshoneSierra LeoneanSiouxSlavicSlovakSloveneSomaliSouth AfricanSouth AmericanSouth American IndianSoviet UnionSpaniardSpanishSpanish AmericanSpanish American IndianSri LankanSubsaharan AfricanSudaneseSwedishSwissSyrianThaiTlingit-HaidaTohono O'OdhamTonganTrinidadian and TobagonianTurkishU.S. Virgin IslanderUgandanUkrainianUruguayanUteVenezuelanVietnameseWelshWest IndianYaquiYugoslavianYumanYup'ikZimbabwean
Ancestry (Percentage)
AfghanAfricanAlaska NativeAlbanianAleutAmericanApacheArabArapahoArgentineanArmenianAssyrian / Chaldean / SyriacAustralianAustrianBangladeshiBarbadianBasqueBelgianBelizeanBhutaneseBlackfeetBolivianBrazilianBritishBritish West IndianBulgarianBurmeseCajunCambodianCanadianCape VerdeanCelticCentral AmericanCentral American IndianCherokeeCheyenneChickasawChileanChineseChippewaChoctawColombianComancheCosta RicanCreeCreekCroatianCubanCzechCzechoslovakianDanishDelawareDominicanDutchDutch West IndianEastern EuropeanEcuadorianEgyptianEnglishEstonianEthiopianEuropeanFijianFilipinoFinnishFrenchFrench American IndianFrench CanadianGermanGerman RussianGhanaianGreekGuamanian / ChamorroGuatemalanGuyaneseHaitianHonduranHopiHungarianIcelanderIndian (Asian)IndonesianInupiatIranianIraqiIrishIroquoisIsraeliItalianJamaicanJapaneseJordanianKenyanKoreanLaotianLatvianLebaneseLiberianLithuanianLuxembourgerMacedonianMalaysianMalteseMenomineeMexicanMexican American IndianMongolianMoroccanNative HawaiianNavajoNew ZealanderNicaraguanNigerianNorthern EuropeanNorwegianOkinawanOsagePaiutePakistaniPalestinianPanamanianParaguayanPennsylvania GermanPeruvianPimaPolishPortuguesePotawatomiPuebloPuerto RicanPuget Sound SalishRomanianRussianSalvadoranSamoanScandinavianScotch-IrishScottishSeminoleSenegaleseSerbianShoshoneSierra LeoneanSiouxSlavicSlovakSloveneSomaliSouth AfricanSouth AmericanSouth American IndianSoviet UnionSpaniardSpanishSpanish AmericanSpanish American IndianSri LankanSubsaharan AfricanSudaneseSwedishSwissSyrianThaiTlingit-HaidaTohono O'OdhamTonganTrinidadian and TobagonianTurkishU.S. Virgin IslanderUgandanUkrainianUruguayanUteVenezuelanVietnameseWelshWest IndianYaquiYugoslavianYumanYup'ikZimbabwean
Immigrant Origin (Total)
AfghanistanAfricaAlbaniaArgentinaArmeniaAsiaAustraliaAustriaBahamasBangladeshBarbadosBelarusBelgiumBelizeBoliviaBosnia and HerzegovinaBrazilBulgariaBurma / MyanmarCambodiaCameroonCanadaCaribbeanCentral AmericaChileChinaColombiaCosta RicaCroatiaCubaCzechoslovakiaDenmarkDominican RepublicEastern AfricaEastern AsiaEastern EuropeEcuadorEgyptEl SalvadorEnglandEritreaEthiopiaEuropeFijiFranceGermanyGhanaGreeceGuatemalaGuyanaHaitiHondurasHong KongHungaryIndiaIndonesiaIranIraqIrelandIsraelItalyJamaicaJapanJordanKazakhstanKenyaKoreaLaosLatin AmericaLatviaLebanonLiberiaLithuaniaMalaysiaMexicoMicronesiaMiddle AfricaMoldovaMoroccoNepalNetherlandsNicaraguaNigeriaNorth MacedoniaNorthern AfricaNorthern EuropeNorwayOceaniaPakistanPanamaPeruPhilippinesPolandPortugalRomaniaRussiaSaudi ArabiaScotlandSenegalSerbiaSierra LeoneSingaporeSomaliaSouth AfricaSouth AmericaSouth Central AsiaSouth Eastern AsiaSouthern EuropeSpainSri LankaSudanSwedenSwitzerlandSyriaTaiwanThailandTrinidad and TobagoTurkeyUgandaUkraineUruguayUzbekistanVenezuelaVietnamWest IndiesWestern AfricaWestern AsiaWestern EuropeYemenZaireZimbabwe
Immigrant Origin (Percentage)
AfghanistanAfricaAlbaniaArgentinaArmeniaAsiaAustraliaAustriaBahamasBangladeshBarbadosBelarusBelgiumBelizeBoliviaBosnia and HerzegovinaBrazilBulgariaBurma / MyanmarCambodiaCameroonCanadaCaribbeanCentral AmericaChileChinaColombiaCosta RicaCroatiaCubaCzechoslovakiaDenmarkDominican RepublicEastern AfricaEastern AsiaEastern EuropeEcuadorEgyptEl SalvadorEnglandEritreaEthiopiaEuropeFijiFranceGermanyGhanaGreeceGuatemalaGuyanaHaitiHondurasHong KongHungaryIndiaIndonesiaIranIraqIrelandIsraelItalyJamaicaJapanJordanKazakhstanKenyaKoreaLaosLatin AmericaLatviaLebanonLiberiaLithuaniaMalaysiaMexicoMicronesiaMiddle AfricaMoldovaMoroccoNepalNetherlandsNicaraguaNigeriaNorth MacedoniaNorthern AfricaNorthern EuropeNorwayOceaniaPakistanPanamaPeruPhilippinesPolandPortugalRomaniaRussiaSaudi ArabiaScotlandSenegalSerbiaSierra LeoneSingaporeSomaliaSouth AfricaSouth AmericaSouth Central AsiaSouth Eastern AsiaSouthern EuropeSpainSri LankaSudanSwedenSwitzerlandSyriaTaiwanThailandTrinidad and TobagoTurkeyUgandaUkraineUruguayUzbekistanVenezuelaVietnamWest IndiesWestern AfricaWestern AsiaWestern EuropeYemenZaireZimbabwe
Income
Income (Families)
Income (Households)
Poverty
Poverty (Families)
Unemployment
Employment Occupations
Employment Industries
Employer Class
Commute Time
Commute Means
School Enrollment
Education by Degree Field
Occupancy
Finances
Physical Characteristics
Las Vegas
Compare Zip Codes
Comparison Subject

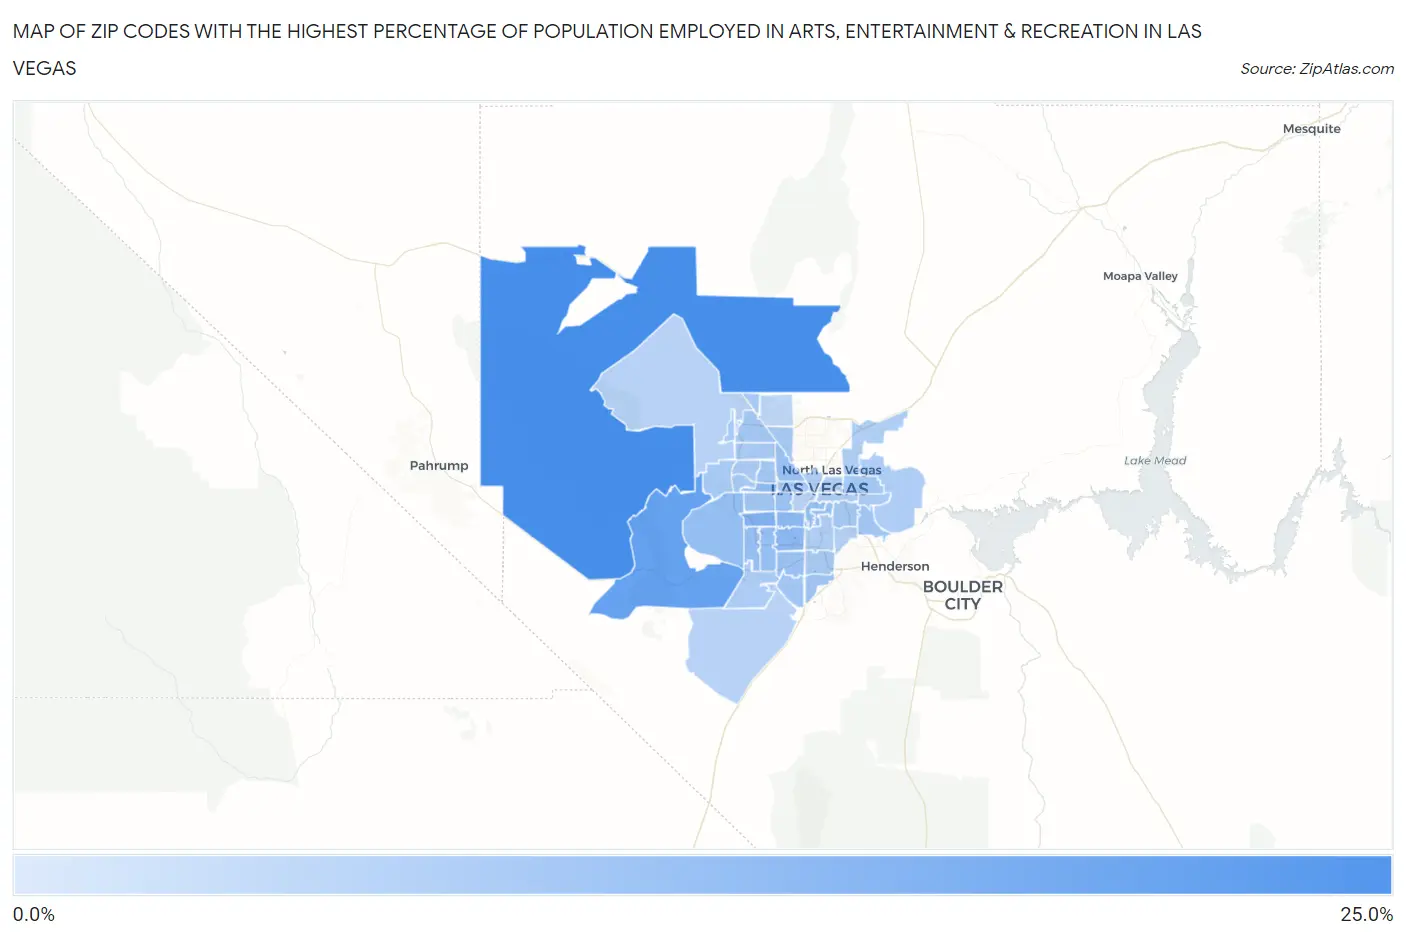
Map of Zip Codes with the Highest Percentage of Population Employed in Arts, Entertainment & Recreation in Las Vegas

0.0%
25.0%
Zip Codes with the Highest Percentage of Population Employed in Arts, Entertainment & Recreation in Las Vegas Map

Zip Codes with the Highest Percentage of Population Employed in Arts, Entertainment & Recreation in Las Vegas, NV

Zip Code % Employed vs State vs National
1.8912422.4%7.6%(+14.7)#82.1%(+20.3)#145
2.8916117.9%7.6%(+10.3)#102.1%(+15.8)#231
3.8914713.2%7.6%(+5.60)#172.1%(+11.1)#437
4.8910312.1%7.6%(+4.49)#192.1%(+10.0)#498
5.8911812.1%7.6%(+4.48)#202.1%(+10.0)#501
6.8914511.4%7.6%(+3.79)#242.1%(+9.33)#558
7.8910910.7%7.6%(+3.10)#282.1%(+8.64)#623
8.8913510.6%7.6%(+2.97)#302.1%(+8.51)#639
9.8914810.4%7.6%(+2.77)#312.1%(+8.31)#658
10.8911310.3%7.6%(+2.65)#322.1%(+8.19)#669
11.8914610.0%7.6%(+2.39)#342.1%(+7.93)#698
12.8913910.0%7.6%(+2.35)#352.1%(+7.89)#705
13.891089.8%7.6%(+2.14)#362.1%(+7.68)#739
14.891699.3%7.6%(+1.70)#392.1%(+7.24)#801
15.891839.1%7.6%(+1.48)#422.1%(+7.01)#835
16.891228.9%7.6%(+1.28)#442.1%(+6.82)#867
17.891418.8%7.6%(+1.23)#462.1%(+6.76)#877
18.891178.8%7.6%(+1.19)#472.1%(+6.73)#885
19.891288.8%7.6%(+1.15)#482.1%(+6.69)#898
20.891498.4%7.6%(+0.815)#502.1%(+6.35)#958
21.891218.3%7.6%(+0.701)#522.1%(+6.24)#983
22.891238.2%7.6%(+0.581)#532.1%(+6.12)#1,002
23.891108.2%7.6%(+0.575)#542.1%(+6.11)#1,007
24.891448.1%7.6%(+0.478)#562.1%(+6.02)#1,036
25.891308.0%7.6%(+0.427)#582.1%(+5.97)#1,048
26.891388.0%7.6%(+0.358)#592.1%(+5.90)#1,065
27.891437.9%7.6%(+0.237)#612.1%(+5.78)#1,096
28.891347.8%7.6%(+0.193)#622.1%(+5.73)#1,102
29.891297.7%7.6%(+0.095)#642.1%(+5.63)#1,126
30.891427.6%7.6%(-0.064)#662.1%(+5.47)#1,170
31.891787.5%7.6%(-0.154)#682.1%(+5.38)#1,186
32.891077.4%7.6%(-0.194)#692.1%(+5.34)#1,194
33.891197.2%7.6%(-0.398)#712.1%(+5.14)#1,257
34.891567.1%7.6%(-0.490)#742.1%(+5.05)#1,294
35.891157.0%7.6%(-0.658)#772.1%(+4.88)#1,346
36.891066.8%7.6%(-0.844)#792.1%(+4.69)#1,401
37.891046.7%7.6%(-0.872)#802.1%(+4.67)#1,403
38.891206.7%7.6%(-0.962)#832.1%(+4.58)#1,440
39.891016.2%7.6%(-1.41)#882.1%(+4.13)#1,624
40.891666.1%7.6%(-1.56)#912.1%(+3.98)#1,672
41.891796.0%7.6%(-1.63)#922.1%(+3.91)#1,707
42.891025.6%7.6%(-2.06)#952.1%(+3.48)#1,930
43.891314.8%7.6%(-2.78)#1022.1%(+2.76)#2,408
44.891581.0%7.6%(-6.60)#1362.1%(-1.06)#16,780

Common Questions

What are the Top 10 Zip Codes with the Highest Percentage of Population Employed in Arts, Entertainment & Recreation in Las Vegas, NV?
Top 10 Zip Codes with the Highest Percentage of Population Employed in Arts, Entertainment & Recreation in Las Vegas, NV are:
#1
22.4%
#2
17.9%
#3
13.2%
#4
12.1%
#5
12.1%
#6
11.4%
#7
10.7%
#8
10.6%
#9
10.4%
#10
10.3%
What zip code has the Highest Percentage of Population Employed in Arts, Entertainment & Recreation in Las Vegas, NV?
89124 has the Highest Percentage of Population Employed in Arts, Entertainment & Recreation in Las Vegas, NV with 22.4%.
What is the Percentage of Population Employed in Arts, Entertainment & Recreation in Las Vegas, NV?
Percentage of Population Employed in Arts, Entertainment & Recreation in Las Vegas is 7.7%.
What is the Percentage of Population Employed in Arts, Entertainment & Recreation in Nevada?
Percentage of Population Employed in Arts, Entertainment & Recreation in Nevada is 7.6%.
What is the Percentage of Population Employed in Arts, Entertainment & Recreation in the United States?
Percentage of Population Employed in Arts, Entertainment & Recreation in the United States is 2.1%.