Zip Codes with the Highest Percentage of Population Employed in Arts, Entertainment & Recreation in Carson City, NV
RELATED REPORTS & OPTIONS
Arts, Entertainment & Recreation
Carson City
Compare Zip Codes
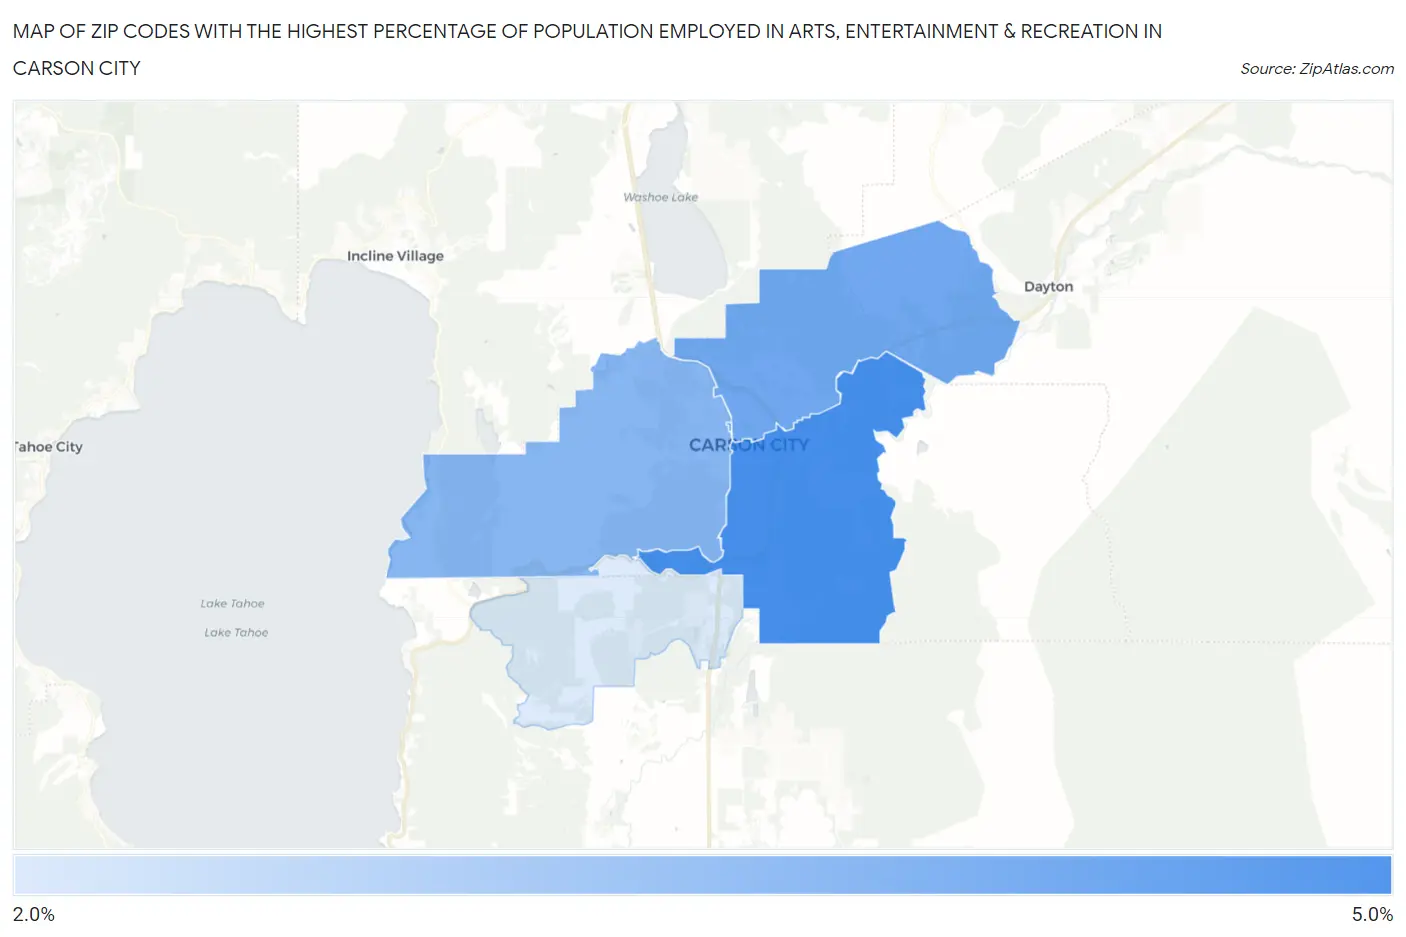
Map of Zip Codes with the Highest Percentage of Population Employed in Arts, Entertainment & Recreation in Carson City
0.0%
5.0%
Zip Codes with the Highest Percentage of Population Employed in Arts, Entertainment & Recreation in Carson City, NV
| Zip Code | % Employed | vs State | vs National | |
| 1. | 89701 | 4.3% | 7.6%(-3.33)#112 | 2.1%(+2.21)#2,978 |
| 2. | 89706 | 3.9% | 7.6%(-3.74)#114 | 2.1%(+1.80)#3,511 |
| 3. | 89703 | 3.7% | 7.6%(-3.95)#117 | 2.1%(+1.58)#3,829 |
| 4. | 89705 | 2.8% | 7.6%(-4.80)#122 | 2.1%(+0.741)#5,903 |
1
Common Questions
What are the Top 3 Zip Codes with the Highest Percentage of Population Employed in Arts, Entertainment & Recreation in Carson City, NV?
Top 3 Zip Codes with the Highest Percentage of Population Employed in Arts, Entertainment & Recreation in Carson City, NV are:
What zip code has the Highest Percentage of Population Employed in Arts, Entertainment & Recreation in Carson City, NV?
89701 has the Highest Percentage of Population Employed in Arts, Entertainment & Recreation in Carson City, NV with 4.3%.
What is the Percentage of Population Employed in Arts, Entertainment & Recreation in Nevada?
Percentage of Population Employed in Arts, Entertainment & Recreation in Nevada is 7.6%.
What is the Percentage of Population Employed in Arts, Entertainment & Recreation in the United States?
Percentage of Population Employed in Arts, Entertainment & Recreation in the United States is 2.1%.