Zip Codes with the Highest Percentage of Population Employed in Arts, Entertainment & Recreation in New Mexico
RELATED REPORTS & OPTIONS
Arts, Entertainment & Recreation
New Mexico
Compare Zip Codes
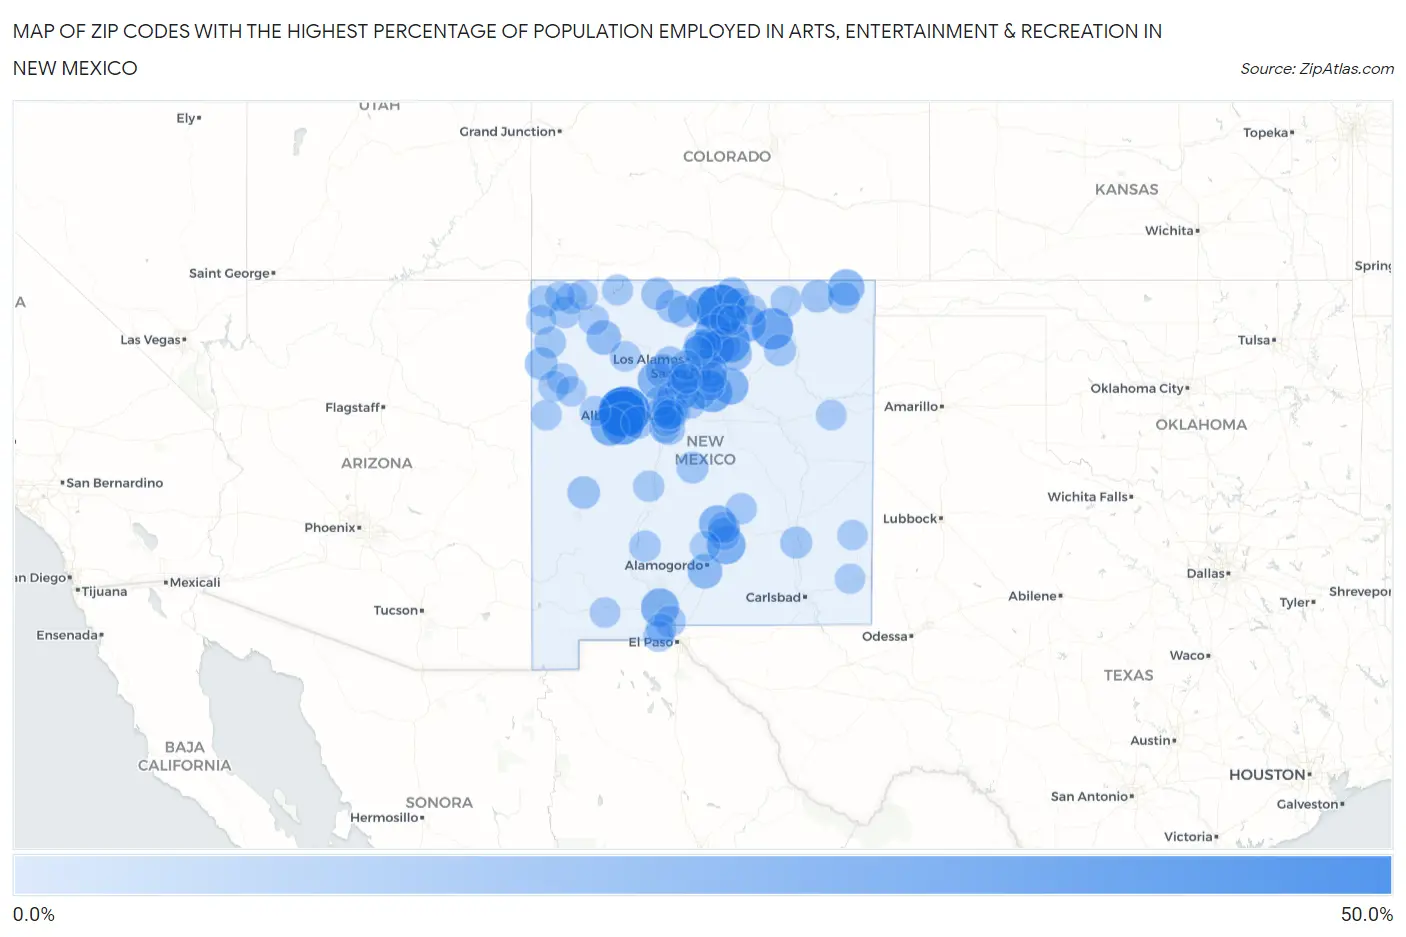
Map of Zip Codes with the Highest Percentage of Population Employed in Arts, Entertainment & Recreation in New Mexico
0.0%
50.0%
Zip Codes with the Highest Percentage of Population Employed in Arts, Entertainment & Recreation in New Mexico
| Zip Code | % Employed | vs State | vs National | |
| 1. | 87040 | 46.4% | 2.3%(+44.1)#1 | 2.1%(+44.3)#40 |
| 2. | 87513 | 43.3% | 2.3%(+40.9)#2 | 2.1%(+41.2)#47 |
| 3. | 87014 | 42.2% | 2.3%(+39.8)#3 | 2.1%(+40.1)#50 |
| 4. | 87038 | 41.0% | 2.3%(+38.6)#4 | 2.1%(+38.9)#52 |
| 5. | 87007 | 29.2% | 2.3%(+26.8)#5 | 2.1%(+27.1)#80 |
| 6. | 87729 | 27.0% | 2.3%(+24.7)#6 | 2.1%(+24.9)#102 |
| 7. | 87579 | 24.9% | 2.3%(+22.6)#7 | 2.1%(+22.8)#115 |
| 8. | 87540 | 22.9% | 2.3%(+20.6)#8 | 2.1%(+20.9)#133 |
| 9. | 87034 | 21.3% | 2.3%(+19.0)#9 | 2.1%(+19.3)#158 |
| 10. | 87577 | 21.3% | 2.3%(+18.9)#10 | 2.1%(+19.2)#160 |
| 11. | 88340 | 21.0% | 2.3%(+18.7)#11 | 2.1%(+19.0)#167 |
| 12. | 88046 | 20.2% | 2.3%(+17.8)#12 | 2.1%(+18.1)#180 |
| 13. | 87567 | 20.1% | 2.3%(+17.7)#13 | 2.1%(+18.0)#181 |
| 14. | 87053 | 17.6% | 2.3%(+15.3)#14 | 2.1%(+15.5)#236 |
| 15. | 88341 | 17.5% | 2.3%(+15.1)#15 | 2.1%(+15.4)#239 |
| 16. | 87531 | 17.3% | 2.3%(+15.0)#16 | 2.1%(+15.2)#243 |
| 17. | 87538 | 17.2% | 2.3%(+14.8)#17 | 2.1%(+15.1)#252 |
| 18. | 88419 | 16.0% | 2.3%(+13.7)#18 | 2.1%(+13.9)#293 |
| 19. | 87010 | 14.9% | 2.3%(+12.6)#19 | 2.1%(+12.8)#336 |
| 20. | 87521 | 14.5% | 2.3%(+12.1)#20 | 2.1%(+12.4)#365 |
| 21. | 87710 | 14.2% | 2.3%(+11.9)#21 | 2.1%(+12.2)#374 |
| 22. | 87578 | 13.5% | 2.3%(+11.2)#22 | 2.1%(+11.4)#416 |
| 23. | 87001 | 13.1% | 2.3%(+10.7)#23 | 2.1%(+11.0)#443 |
| 24. | 88311 | 12.5% | 2.3%(+10.2)#24 | 2.1%(+10.4)#479 |
| 25. | 87037 | 11.6% | 2.3%(+9.28)#25 | 2.1%(+9.54)#545 |
| 26. | 87072 | 11.3% | 2.3%(+8.96)#26 | 2.1%(+9.22)#572 |
| 27. | 87024 | 10.2% | 2.3%(+7.81)#27 | 2.1%(+8.08)#684 |
| 28. | 87732 | 9.9% | 2.3%(+7.55)#28 | 2.1%(+7.82)#722 |
| 29. | 87556 | 8.3% | 2.3%(+5.95)#29 | 2.1%(+6.21)#987 |
| 30. | 87575 | 8.2% | 2.3%(+5.81)#30 | 2.1%(+6.07)#1,016 |
| 31. | 87320 | 8.1% | 2.3%(+5.76)#31 | 2.1%(+6.03)#1,032 |
| 32. | 88345 | 8.1% | 2.3%(+5.76)#32 | 2.1%(+6.02)#1,034 |
| 33. | 87528 | 7.7% | 2.3%(+5.39)#33 | 2.1%(+5.65)#1,123 |
| 34. | 88414 | 7.7% | 2.3%(+5.34)#34 | 2.1%(+5.61)#1,137 |
| 35. | 87026 | 7.6% | 2.3%(+5.28)#35 | 2.1%(+5.55)#1,147 |
| 36. | 87821 | 7.5% | 2.3%(+5.17)#36 | 2.1%(+5.43)#1,176 |
| 37. | 87501 | 7.4% | 2.3%(+5.06)#37 | 2.1%(+5.32)#1,205 |
| 38. | 87068 | 7.4% | 2.3%(+5.01)#38 | 2.1%(+5.27)#1,215 |
| 39. | 88312 | 6.7% | 2.3%(+4.32)#39 | 2.1%(+4.58)#1,429 |
| 40. | 87025 | 6.5% | 2.3%(+4.15)#40 | 2.1%(+4.42)#1,497 |
| 41. | 87752 | 6.4% | 2.3%(+4.07)#41 | 2.1%(+4.34)#1,531 |
| 42. | 87506 | 6.4% | 2.3%(+4.06)#42 | 2.1%(+4.33)#1,537 |
| 43. | 88230 | 6.4% | 2.3%(+4.05)#43 | 2.1%(+4.31)#1,543 |
| 44. | 87515 | 6.3% | 2.3%(+3.94)#44 | 2.1%(+4.21)#1,592 |
| 45. | 87566 | 6.1% | 2.3%(+3.76)#45 | 2.1%(+4.03)#1,652 |
| 46. | 87036 | 5.9% | 2.3%(+3.55)#46 | 2.1%(+3.81)#1,753 |
| 47. | 87558 | 5.8% | 2.3%(+3.42)#47 | 2.1%(+3.68)#1,824 |
| 48. | 87508 | 5.7% | 2.3%(+3.36)#48 | 2.1%(+3.62)#1,852 |
| 49. | 87364 | 5.6% | 2.3%(+3.29)#49 | 2.1%(+3.55)#1,890 |
| 50. | 87022 | 5.5% | 2.3%(+3.12)#50 | 2.1%(+3.39)#1,985 |
| 51. | 88418 | 5.4% | 2.3%(+3.09)#51 | 2.1%(+3.35)#2,002 |
| 52. | 88024 | 5.1% | 2.3%(+2.77)#52 | 2.1%(+3.03)#2,201 |
| 53. | 87901 | 5.0% | 2.3%(+2.69)#53 | 2.1%(+2.95)#2,260 |
| 54. | 87420 | 4.8% | 2.3%(+2.49)#54 | 2.1%(+2.76)#2,405 |
| 55. | 87048 | 4.7% | 2.3%(+2.36)#55 | 2.1%(+2.62)#2,525 |
| 56. | 87416 | 4.6% | 2.3%(+2.25)#56 | 2.1%(+2.51)#2,631 |
| 57. | 87417 | 4.6% | 2.3%(+2.25)#57 | 2.1%(+2.51)#2,632 |
| 58. | 88316 | 4.6% | 2.3%(+2.21)#58 | 2.1%(+2.48)#2,672 |
| 59. | 87505 | 4.5% | 2.3%(+2.15)#59 | 2.1%(+2.41)#2,754 |
| 60. | 87801 | 4.3% | 2.3%(+1.99)#60 | 2.1%(+2.26)#2,918 |
| 61. | 88008 | 4.2% | 2.3%(+1.84)#61 | 2.1%(+2.11)#3,091 |
| 62. | 87740 | 4.0% | 2.3%(+1.68)#62 | 2.1%(+1.94)#3,306 |
| 63. | 87311 | 4.0% | 2.3%(+1.63)#63 | 2.1%(+1.89)#3,370 |
| 64. | 87322 | 3.9% | 2.3%(+1.55)#64 | 2.1%(+1.81)#3,490 |
| 65. | 87419 | 3.8% | 2.3%(+1.48)#65 | 2.1%(+1.75)#3,586 |
| 66. | 87529 | 3.5% | 2.3%(+1.14)#66 | 2.1%(+1.41)#4,152 |
| 67. | 88021 | 3.5% | 2.3%(+1.13)#67 | 2.1%(+1.39)#4,191 |
| 68. | 87327 | 3.4% | 2.3%(+1.05)#68 | 2.1%(+1.31)#4,373 |
| 69. | 87109 | 3.1% | 2.3%(+0.796)#69 | 2.1%(+1.06)#4,944 |
| 70. | 87004 | 3.1% | 2.3%(+0.775)#70 | 2.1%(+1.04)#5,004 |
| 71. | 87013 | 3.1% | 2.3%(+0.764)#71 | 2.1%(+1.03)#5,030 |
| 72. | 88401 | 3.1% | 2.3%(+0.763)#72 | 2.1%(+1.03)#5,034 |
| 73. | 87111 | 3.1% | 2.3%(+0.724)#73 | 2.1%(+0.989)#5,153 |
| 74. | 87083 | 3.0% | 2.3%(+0.701)#74 | 2.1%(+0.966)#5,218 |
| 75. | 87052 | 3.0% | 2.3%(+0.670)#75 | 2.1%(+0.935)#5,313 |
| 76. | 87413 | 3.0% | 2.3%(+0.650)#76 | 2.1%(+0.915)#5,364 |
| 77. | 87104 | 3.0% | 2.3%(+0.642)#77 | 2.1%(+0.907)#5,380 |
| 78. | 87312 | 2.9% | 2.3%(+0.523)#78 | 2.1%(+0.788)#5,744 |
| 79. | 88030 | 2.9% | 2.3%(+0.518)#79 | 2.1%(+0.784)#5,758 |
| 80. | 87020 | 2.9% | 2.3%(+0.504)#80 | 2.1%(+0.769)#5,814 |
| 81. | 87107 | 2.8% | 2.3%(+0.489)#81 | 2.1%(+0.754)#5,866 |
| 82. | 87402 | 2.8% | 2.3%(+0.476)#82 | 2.1%(+0.741)#5,904 |
| 83. | 87718 | 2.8% | 2.3%(+0.469)#83 | 2.1%(+0.734)#5,928 |
| 84. | 87511 | 2.8% | 2.3%(+0.411)#84 | 2.1%(+0.676)#6,143 |
| 85. | 87106 | 2.7% | 2.3%(+0.370)#85 | 2.1%(+0.636)#6,290 |
| 86. | 87110 | 2.7% | 2.3%(+0.335)#86 | 2.1%(+0.601)#6,422 |
| 87. | 87120 | 2.7% | 2.3%(+0.326)#87 | 2.1%(+0.591)#6,470 |
| 88. | 87421 | 2.6% | 2.3%(+0.245)#88 | 2.1%(+0.511)#6,784 |
| 89. | 87571 | 2.6% | 2.3%(+0.240)#89 | 2.1%(+0.505)#6,808 |
| 90. | 88352 | 2.6% | 2.3%(+0.206)#90 | 2.1%(+0.471)#6,940 |
| 91. | 88267 | 2.6% | 2.3%(+0.205)#91 | 2.1%(+0.470)#6,944 |
| 92. | 87532 | 2.5% | 2.3%(+0.164)#92 | 2.1%(+0.429)#7,131 |
| 93. | 87047 | 2.5% | 2.3%(+0.132)#93 | 2.1%(+0.398)#7,264 |
| 94. | 87544 | 2.4% | 2.3%(+0.062)#94 | 2.1%(+0.328)#7,594 |
| 95. | 87124 | 2.4% | 2.3%(+0.039)#95 | 2.1%(+0.304)#7,706 |
| 96. | 87105 | 2.4% | 2.3%(+0.022)#96 | 2.1%(+0.287)#7,788 |
| 97. | 87102 | 2.3% | 2.3%(-0.009)#97 | 2.1%(+0.256)#7,938 |
| 98. | 88240 | 2.3% | 2.3%(-0.011)#98 | 2.1%(+0.254)#7,948 |
| 99. | 87041 | 2.3% | 2.3%(-0.065)#99 | 2.1%(+0.201)#8,210 |
| 100. | 87461 | 2.2% | 2.3%(-0.113)#100 | 2.1%(+0.152)#8,440 |
Common Questions
What are the Top 10 Zip Codes with the Highest Percentage of Population Employed in Arts, Entertainment & Recreation in New Mexico?
Top 10 Zip Codes with the Highest Percentage of Population Employed in Arts, Entertainment & Recreation in New Mexico are:
What zip code has the Highest Percentage of Population Employed in Arts, Entertainment & Recreation in New Mexico?
87040 has the Highest Percentage of Population Employed in Arts, Entertainment & Recreation in New Mexico with 46.4%.
What is the Percentage of Population Employed in Arts, Entertainment & Recreation in the State of New Mexico?
Percentage of Population Employed in Arts, Entertainment & Recreation in New Mexico is 2.3%.
What is the Percentage of Population Employed in Arts, Entertainment & Recreation in the United States?
Percentage of Population Employed in Arts, Entertainment & Recreation in the United States is 2.1%.