Zip Codes with the Highest Percentage of Population Employed in Accommodation & Food Services in Gallup, NM
RELATED REPORTS & OPTIONS
Accommodation & Food Services
Gallup
Compare Zip Codes
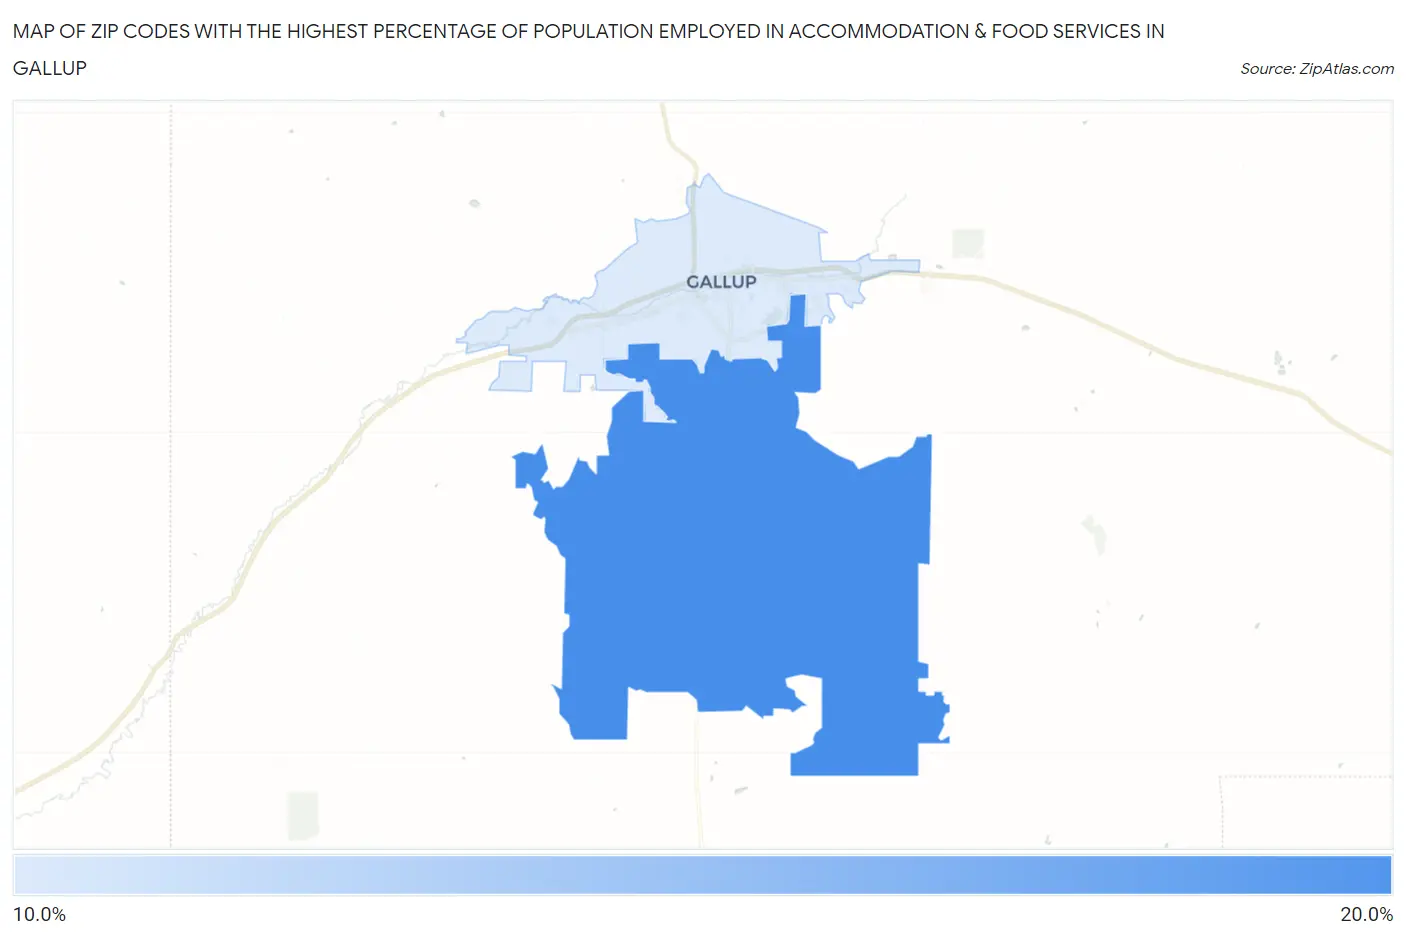
Map of Zip Codes with the Highest Percentage of Population Employed in Accommodation & Food Services in Gallup
11.3%
18.9%
Zip Codes with the Highest Percentage of Population Employed in Accommodation & Food Services in Gallup, NM
| Zip Code | % Employed | vs State | vs National | |
| 1. | 87305 | 18.9% | 7.9%(+11.0)#21 | 6.9%(+12.0)#960 |
| 2. | 87301 | 11.3% | 7.9%(+3.35)#52 | 6.9%(+4.41)#3,330 |
1
Common Questions
What are the Top Zip Codes with the Highest Percentage of Population Employed in Accommodation & Food Services in Gallup, NM?
Top Zip Codes with the Highest Percentage of Population Employed in Accommodation & Food Services in Gallup, NM are:
What zip code has the Highest Percentage of Population Employed in Accommodation & Food Services in Gallup, NM?
87305 has the Highest Percentage of Population Employed in Accommodation & Food Services in Gallup, NM with 18.9%.
What is the Percentage of Population Employed in Accommodation & Food Services in Gallup, NM?
Percentage of Population Employed in Accommodation & Food Services in Gallup is 11.4%.
What is the Percentage of Population Employed in Accommodation & Food Services in New Mexico?
Percentage of Population Employed in Accommodation & Food Services in New Mexico is 7.9%.
What is the Percentage of Population Employed in Accommodation & Food Services in the United States?
Percentage of Population Employed in Accommodation & Food Services in the United States is 6.9%.