Zip Codes with the Highest Percentage of Population Employed in Agriculture, Fishing & Hunting in Nashua, NH
RELATED REPORTS & OPTIONS
Agriculture, Fishing & Hunting
Nashua
Compare Zip Codes
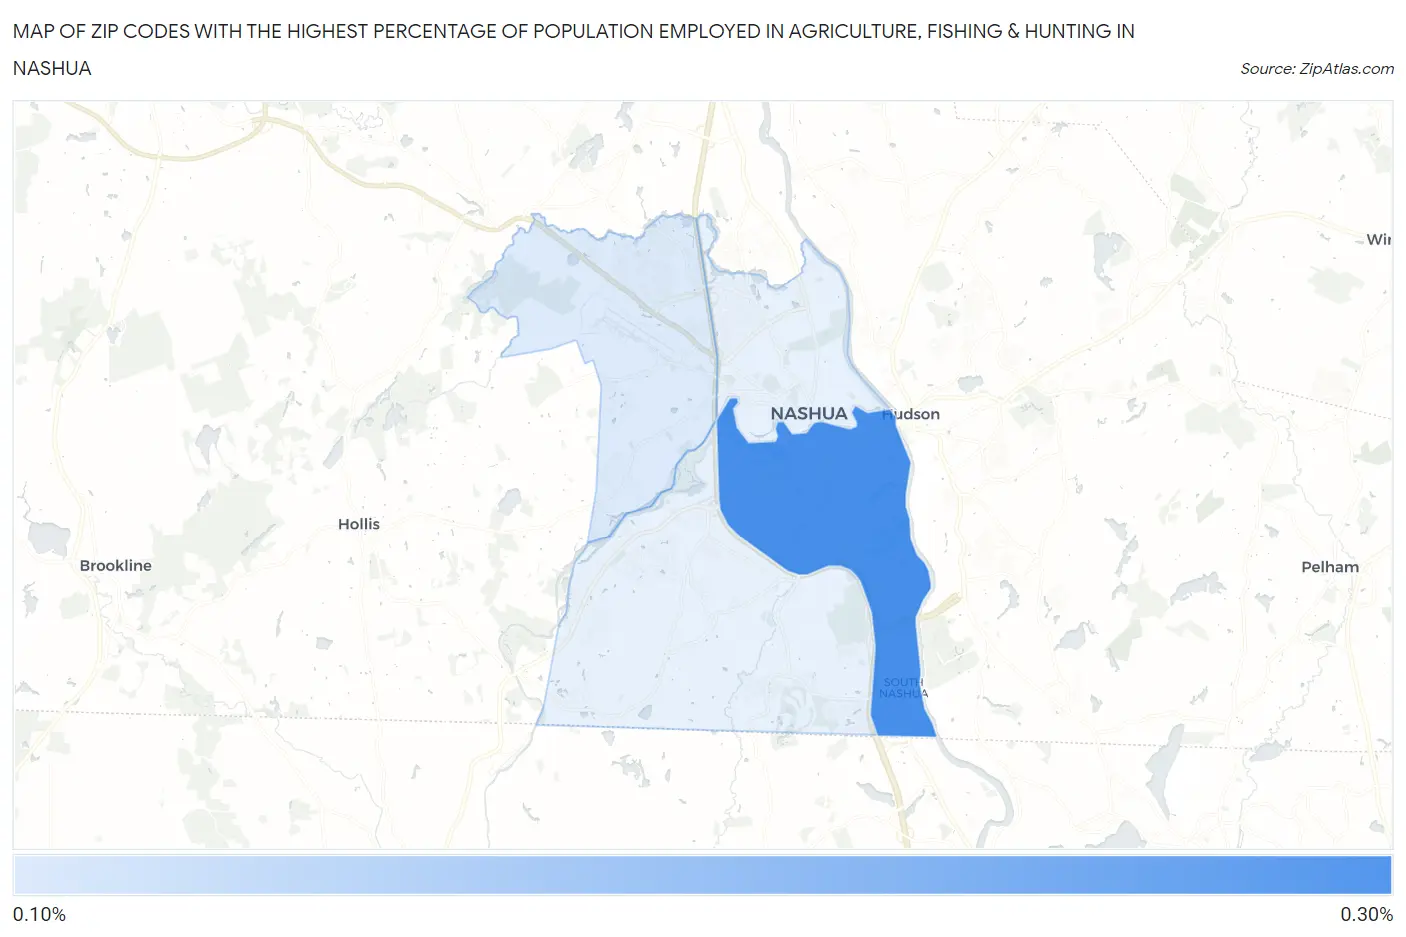
Map of Zip Codes with the Highest Percentage of Population Employed in Agriculture, Fishing & Hunting in Nashua
0.0%
0.30%
Zip Codes with the Highest Percentage of Population Employed in Agriculture, Fishing & Hunting in Nashua, NH
| Zip Code | % Employed | vs State | vs National | |
| 1. | 03060 | 0.29% | 0.68%(-0.395)#150 | 1.2%(-0.912)#21,322 |
| 2. | 03063 | 0.15% | 0.68%(-0.535)#167 | 1.2%(-1.05)#23,065 |
1
Common Questions
What are the Top 3 Zip Codes with the Highest Percentage of Population Employed in Agriculture, Fishing & Hunting in Nashua, NH?
Top 3 Zip Codes with the Highest Percentage of Population Employed in Agriculture, Fishing & Hunting in Nashua, NH are:
What zip code has the Highest Percentage of Population Employed in Agriculture, Fishing & Hunting in Nashua, NH?
03060 has the Highest Percentage of Population Employed in Agriculture, Fishing & Hunting in Nashua, NH with 0.29%.
What is the Percentage of Population Employed in Agriculture, Fishing & Hunting in Nashua, NH?
Percentage of Population Employed in Agriculture, Fishing & Hunting in Nashua is 0.13%.
What is the Percentage of Population Employed in Agriculture, Fishing & Hunting in New Hampshire?
Percentage of Population Employed in Agriculture, Fishing & Hunting in New Hampshire is 0.68%.
What is the Percentage of Population Employed in Agriculture, Fishing & Hunting in the United States?
Percentage of Population Employed in Agriculture, Fishing & Hunting in the United States is 1.2%.