Zip Codes with the Highest Percentage of Population Employed in Accommodation & Food Services in Henderson, NC
RELATED REPORTS & OPTIONS
Accommodation & Food Services
Henderson
Compare Zip Codes
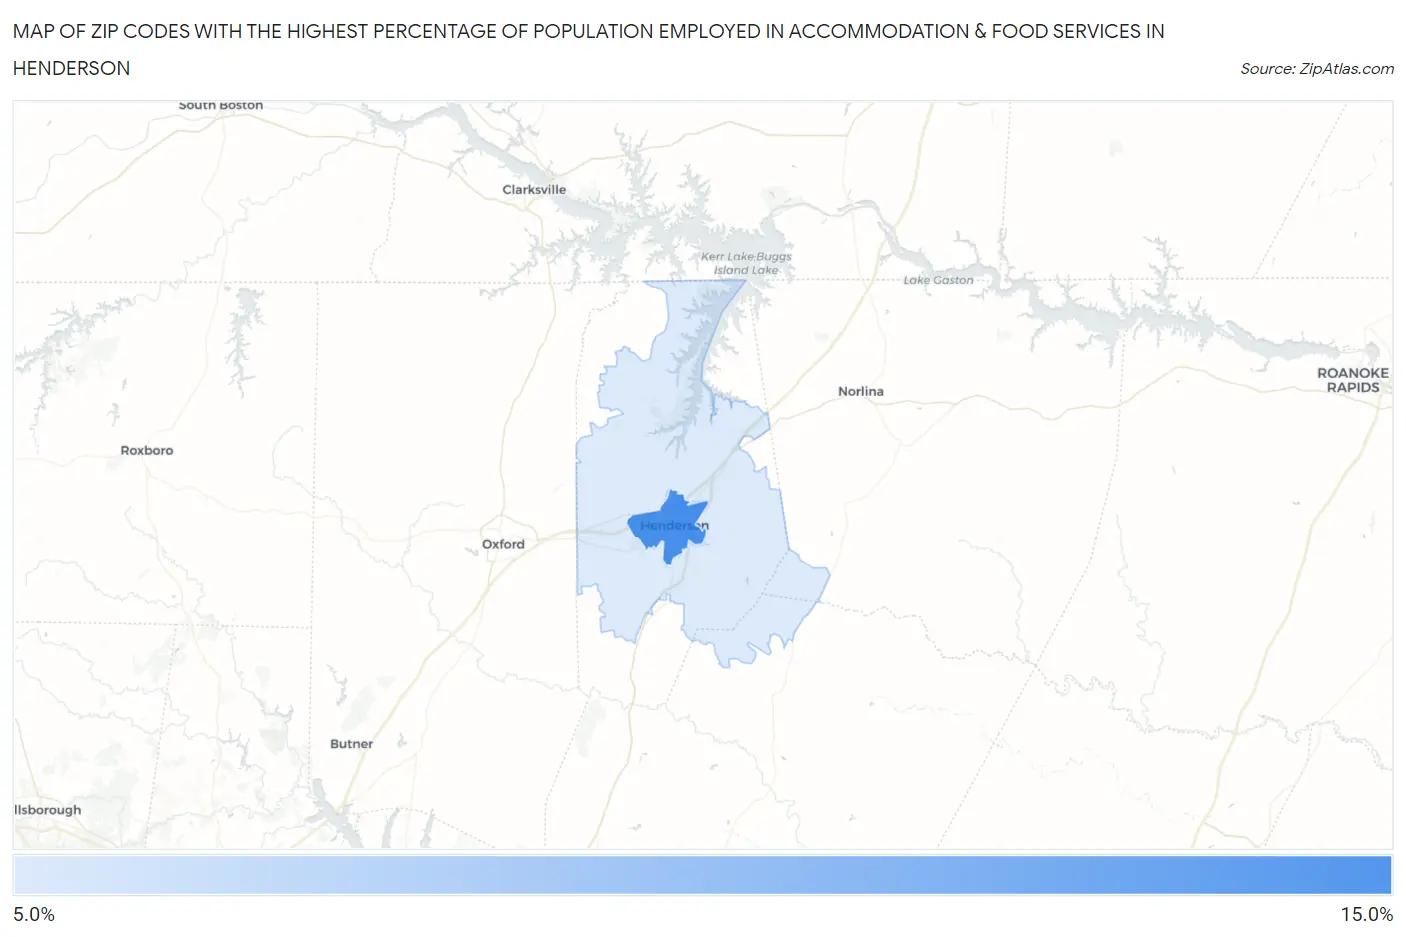
Map of Zip Codes with the Highest Percentage of Population Employed in Accommodation & Food Services in Henderson
8.0%
12.2%
Zip Codes with the Highest Percentage of Population Employed in Accommodation & Food Services in Henderson, NC
| Zip Code | % Employed | vs State | vs National | |
| 1. | 27536 | 12.2% | 7.0%(+5.17)#90 | 6.9%(+5.34)#2,697 |
| 2. | 27537 | 8.0% | 7.0%(+0.993)#240 | 6.9%(+1.16)#7,742 |
1
Common Questions
What are the Top Zip Codes with the Highest Percentage of Population Employed in Accommodation & Food Services in Henderson, NC?
Top Zip Codes with the Highest Percentage of Population Employed in Accommodation & Food Services in Henderson, NC are:
What zip code has the Highest Percentage of Population Employed in Accommodation & Food Services in Henderson, NC?
27536 has the Highest Percentage of Population Employed in Accommodation & Food Services in Henderson, NC with 12.2%.
What is the Percentage of Population Employed in Accommodation & Food Services in Henderson, NC?
Percentage of Population Employed in Accommodation & Food Services in Henderson is 11.5%.
What is the Percentage of Population Employed in Accommodation & Food Services in North Carolina?
Percentage of Population Employed in Accommodation & Food Services in North Carolina is 7.0%.
What is the Percentage of Population Employed in Accommodation & Food Services in the United States?
Percentage of Population Employed in Accommodation & Food Services in the United States is 6.9%.