Zip Codes with the Highest Percentage of Population Employed in Accommodation & Food Services in Charlotte, NC

RELATED REPORTS & OPTIONS

Accommodation & Food Services
Population
Families and Households
Female Fertility
Female Fertility (Unmarried)
Race (Community Size)
Race (Percentage)
Ancestry (Community Size)
AfghanAfricanAlbanianAlsatianAmericanApacheArabArgentineanArmenianAustralianAustrianBahamianBangladeshiBarbadianBelgianBelizeanBhutaneseBlackfeetBolivianBrazilianBritishBritish West IndianBulgarianBurmeseCajunCambodianCanadianCape VerdeanCelticCentral AmericanCentral American IndianCherokeeChickasawChileanChippewaChoctawColombianCosta RicanCreekCroatianCubanCzechCzechoslovakianDanishDominicanDutchEastern EuropeanEcuadorianEgyptianEnglishEthiopianEuropeanFilipinoFinnishFrenchFrench American IndianFrench CanadianGermanGhanaianGreekGuamanian / ChamorroGuatemalanGuyaneseHaitianHonduranHoumaHungarianIcelanderIndian (Asian)IndonesianIranianIraqiIrishIroquoisIsraeliItalianJamaicanJapaneseJordanianKenyanKiowaKoreanLaotianLatvianLebaneseLiberianLithuanianLumbeeMacedonianMalaysianMalteseMexicanMexican American IndianMoroccanNative HawaiianNavajoNew ZealanderNicaraguanNigerianNorthern EuropeanNorwegianOsagePakistaniPalestinianPanamanianParaguayanPennsylvania GermanPeruvianPolishPortuguesePuerto RicanRomanianRussianSalvadoranSamoanScandinavianScotch-IrishScottishSeminoleSenegaleseSerbianSierra LeoneanSiouxSlavicSlovakSloveneSomaliSouth AfricanSouth AmericanSouth American IndianSpaniardSpanishSri LankanSubsaharan AfricanSudaneseSwedishSwissSyrianTaiwaneseThaiTonganTrinidadian and TobagonianTurkishU.S. Virgin IslanderUkrainianUruguayanVenezuelanVietnameseWelshWest IndianYugoslavianZimbabwean
Ancestry (Percentage)
AfghanAfricanAlbanianAlsatianAmericanApacheArabArgentineanArmenianAustralianAustrianBahamianBangladeshiBarbadianBelgianBelizeanBhutaneseBlackfeetBolivianBrazilianBritishBritish West IndianBulgarianBurmeseCajunCambodianCanadianCape VerdeanCelticCentral AmericanCentral American IndianCherokeeChickasawChileanChippewaChoctawColombianCosta RicanCreekCroatianCubanCzechCzechoslovakianDanishDominicanDutchEastern EuropeanEcuadorianEgyptianEnglishEthiopianEuropeanFilipinoFinnishFrenchFrench American IndianFrench CanadianGermanGhanaianGreekGuamanian / ChamorroGuatemalanGuyaneseHaitianHonduranHoumaHungarianIcelanderIndian (Asian)IndonesianIranianIraqiIrishIroquoisIsraeliItalianJamaicanJapaneseJordanianKenyanKiowaKoreanLaotianLatvianLebaneseLiberianLithuanianLumbeeMacedonianMalaysianMalteseMexicanMexican American IndianMoroccanNative HawaiianNavajoNew ZealanderNicaraguanNigerianNorthern EuropeanNorwegianOsagePakistaniPalestinianPanamanianParaguayanPennsylvania GermanPeruvianPolishPortuguesePuerto RicanRomanianRussianSalvadoranSamoanScandinavianScotch-IrishScottishSeminoleSenegaleseSerbianSierra LeoneanSiouxSlavicSlovakSloveneSomaliSouth AfricanSouth AmericanSouth American IndianSpaniardSpanishSri LankanSubsaharan AfricanSudaneseSwedishSwissSyrianTaiwaneseThaiTonganTrinidadian and TobagonianTurkishU.S. Virgin IslanderUkrainianUruguayanVenezuelanVietnameseWelshWest IndianYugoslavianZimbabwean
Immigrant Origin (Total)
AfghanistanAfricaAlbaniaArgentinaAsiaAustraliaAustriaBahamasBangladeshBarbadosBelarusBelgiumBelizeBoliviaBosnia and HerzegovinaBrazilBulgariaBurma / MyanmarCabo VerdeCambodiaCameroonCanadaCaribbeanCentral AmericaChileChinaColombiaCongoCosta RicaCroatiaCubaCzechoslovakiaDenmarkDominican RepublicEastern AfricaEastern AsiaEastern EuropeEcuadorEgyptEl SalvadorEnglandEritreaEthiopiaEuropeFranceGermanyGhanaGreeceGrenadaGuatemalaGuyanaHaitiHondurasHong KongHungaryIndiaIndonesiaIranIraqIrelandIsraelItalyJamaicaJapanJordanKazakhstanKenyaKoreaKuwaitLaosLatin AmericaLatviaLebanonLiberiaLithuaniaMalaysiaMexicoMiddle AfricaMoldovaMoroccoNepalNetherlandsNicaraguaNigeriaNorthern AfricaNorthern EuropeNorwayOceaniaPakistanPanamaPeruPhilippinesPolandPortugalRomaniaRussiaSaudi ArabiaScotlandSenegalSerbiaSierra LeoneSingaporeSomaliaSouth AfricaSouth AmericaSouth Central AsiaSouth Eastern AsiaSouthern EuropeSpainSri LankaSudanSwedenSwitzerlandSyriaTaiwanThailandTrinidad and TobagoTurkeyUkraineUruguayUzbekistanVenezuelaVietnamWest IndiesWestern AfricaWestern AsiaWestern EuropeZaireZimbabwe
Immigrant Origin (Percentage)
AfghanistanAfricaAlbaniaArgentinaAsiaAustraliaAustriaBahamasBangladeshBarbadosBelarusBelgiumBelizeBoliviaBosnia and HerzegovinaBrazilBulgariaBurma / MyanmarCabo VerdeCambodiaCameroonCanadaCaribbeanCentral AmericaChileChinaColombiaCongoCosta RicaCroatiaCubaCzechoslovakiaDenmarkDominican RepublicEastern AfricaEastern AsiaEastern EuropeEcuadorEgyptEl SalvadorEnglandEritreaEthiopiaEuropeFranceGermanyGhanaGreeceGrenadaGuatemalaGuyanaHaitiHondurasHong KongHungaryIndiaIndonesiaIranIraqIrelandIsraelItalyJamaicaJapanJordanKazakhstanKenyaKoreaKuwaitLaosLatin AmericaLatviaLebanonLiberiaLithuaniaMalaysiaMexicoMiddle AfricaMoldovaMoroccoNepalNetherlandsNicaraguaNigeriaNorthern AfricaNorthern EuropeNorwayOceaniaPakistanPanamaPeruPhilippinesPolandPortugalRomaniaRussiaSaudi ArabiaScotlandSenegalSerbiaSierra LeoneSingaporeSomaliaSouth AfricaSouth AmericaSouth Central AsiaSouth Eastern AsiaSouthern EuropeSpainSri LankaSudanSwedenSwitzerlandSyriaTaiwanThailandTrinidad and TobagoTurkeyUkraineUruguayUzbekistanVenezuelaVietnamWest IndiesWestern AfricaWestern AsiaWestern EuropeZaireZimbabwe
Income
Income (Families)
Income (Households)
Poverty
Poverty (Families)
Unemployment
Employment Occupations
Employment Industries
Employer Class
Commute Time
Commute Means
School Enrollment
Education by Degree Field
Occupancy
Finances
Physical Characteristics
Charlotte
Compare Zip Codes
Comparison Subject

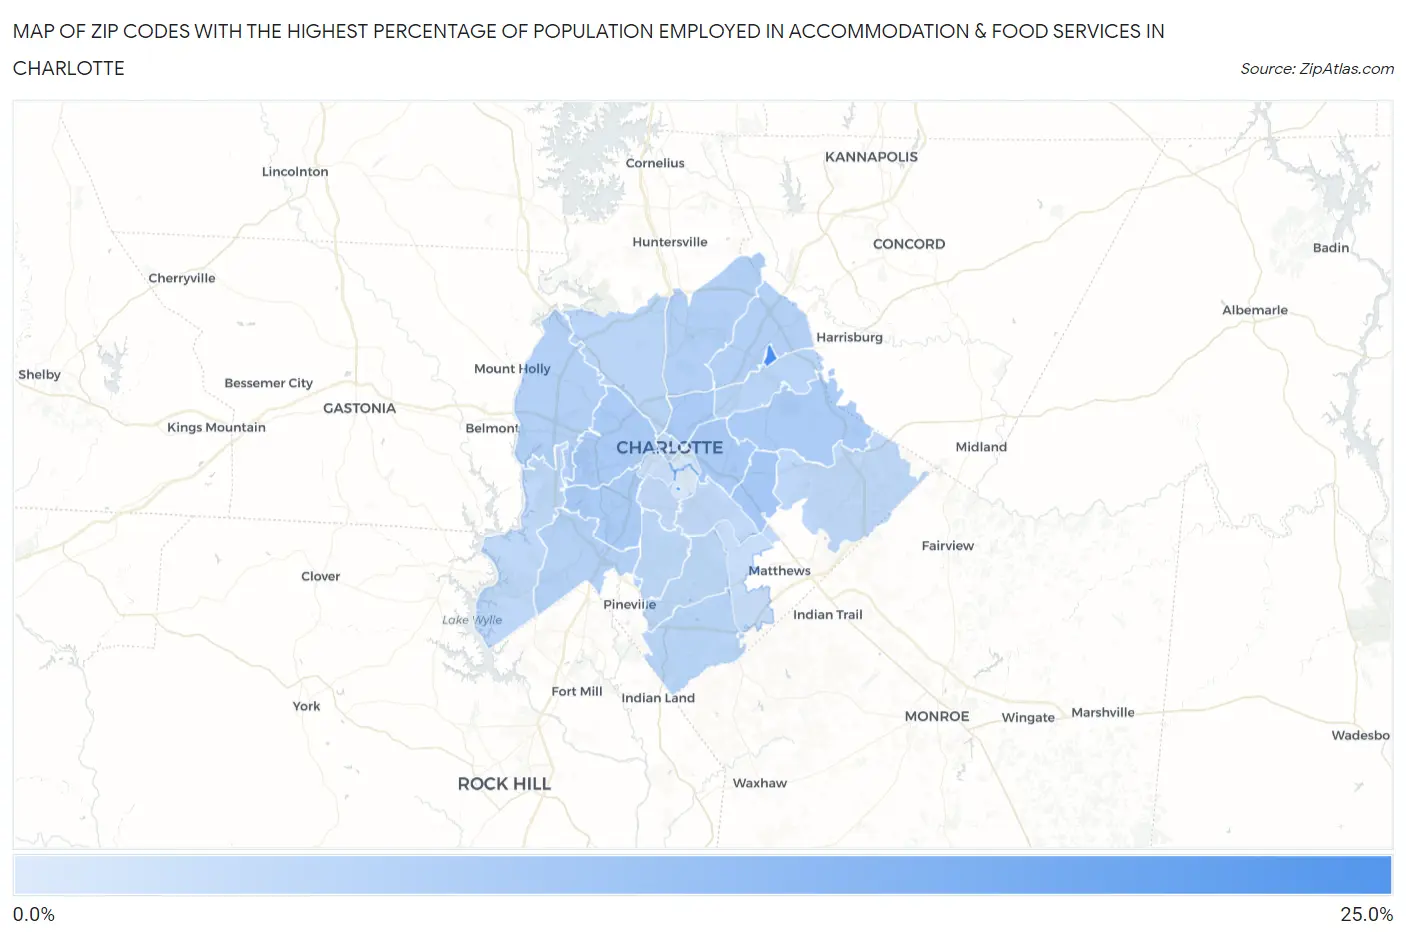
Map of Zip Codes with the Highest Percentage of Population Employed in Accommodation & Food Services in Charlotte

0.0%
25.0%
Zip Codes with the Highest Percentage of Population Employed in Accommodation & Food Services in Charlotte Map

Zip Codes with the Highest Percentage of Population Employed in Accommodation & Food Services in Charlotte, NC

Zip Code % Employed vs State vs National
1.2822324.5%7.0%(+17.5)#126.9%(+17.6)#530
2.2827421.6%7.0%(+14.5)#166.9%(+14.7)#707
3.282129.3%7.0%(+2.30)#1706.9%(+2.46)#5,433
4.282088.8%7.0%(+1.78)#1956.9%(+1.95)#6,222
5.282068.7%7.0%(+1.65)#2006.9%(+1.82)#6,464
6.282058.7%7.0%(+1.63)#2026.9%(+1.80)#6,502
7.282158.2%7.0%(+1.19)#2256.9%(+1.35)#7,348
8.282178.2%7.0%(+1.15)#2286.9%(+1.32)#7,408
9.282147.4%7.0%(+0.357)#2926.9%(+0.525)#9,242
10.282697.2%7.0%(+0.189)#3056.9%(+0.357)#9,701
11.282627.2%7.0%(+0.156)#3096.9%(+0.324)#9,800
12.282736.8%7.0%(-0.225)#3376.9%(-0.057)#10,817
13.282776.4%7.0%(-0.661)#3806.9%(-0.492)#12,198
14.282136.4%7.0%(-0.672)#3836.9%(-0.504)#12,235
15.282166.1%7.0%(-0.920)#4036.9%(-0.752)#13,034
16.282106.1%7.0%(-0.968)#4086.9%(-0.800)#13,202
17.282265.9%7.0%(-1.11)#4246.9%(-0.944)#13,651
18.282275.7%7.0%(-1.37)#4436.9%(-1.20)#14,464
19.282785.6%7.0%(-1.43)#4476.9%(-1.26)#14,616
20.282025.5%7.0%(-1.51)#4636.9%(-1.34)#14,933
21.282115.3%7.0%(-1.76)#4856.9%(-1.59)#15,824
22.282095.2%7.0%(-1.86)#4936.9%(-1.69)#16,155
23.282704.3%7.0%(-2.71)#5626.9%(-2.54)#19,032
24.282034.0%7.0%(-3.05)#5836.9%(-2.88)#20,148
25.282042.2%7.0%(-4.84)#6856.9%(-4.67)#25,134
26.282071.4%7.0%(-5.69)#7086.9%(-5.52)#26,720

Common Questions

What are the Top 10 Zip Codes with the Highest Percentage of Population Employed in Accommodation & Food Services in Charlotte, NC?
Top 10 Zip Codes with the Highest Percentage of Population Employed in Accommodation & Food Services in Charlotte, NC are:
#1
24.5%
#2
21.6%
#3
9.3%
#4
8.8%
#5
8.7%
#6
8.7%
#7
8.2%
#8
8.2%
#9
7.4%
#10
7.2%
What zip code has the Highest Percentage of Population Employed in Accommodation & Food Services in Charlotte, NC?
28223 has the Highest Percentage of Population Employed in Accommodation & Food Services in Charlotte, NC with 24.5%.
What is the Percentage of Population Employed in Accommodation & Food Services in Charlotte, NC?
Percentage of Population Employed in Accommodation & Food Services in Charlotte is 6.8%.
What is the Percentage of Population Employed in Accommodation & Food Services in North Carolina?
Percentage of Population Employed in Accommodation & Food Services in North Carolina is 7.0%.
What is the Percentage of Population Employed in Accommodation & Food Services in the United States?
Percentage of Population Employed in Accommodation & Food Services in the United States is 6.9%.