Zip Codes with the Highest Percentage of Population Employed in Arts, Entertainment & Recreation in Henderson, NC
RELATED REPORTS & OPTIONS
Arts, Entertainment & Recreation
Henderson
Compare Zip Codes
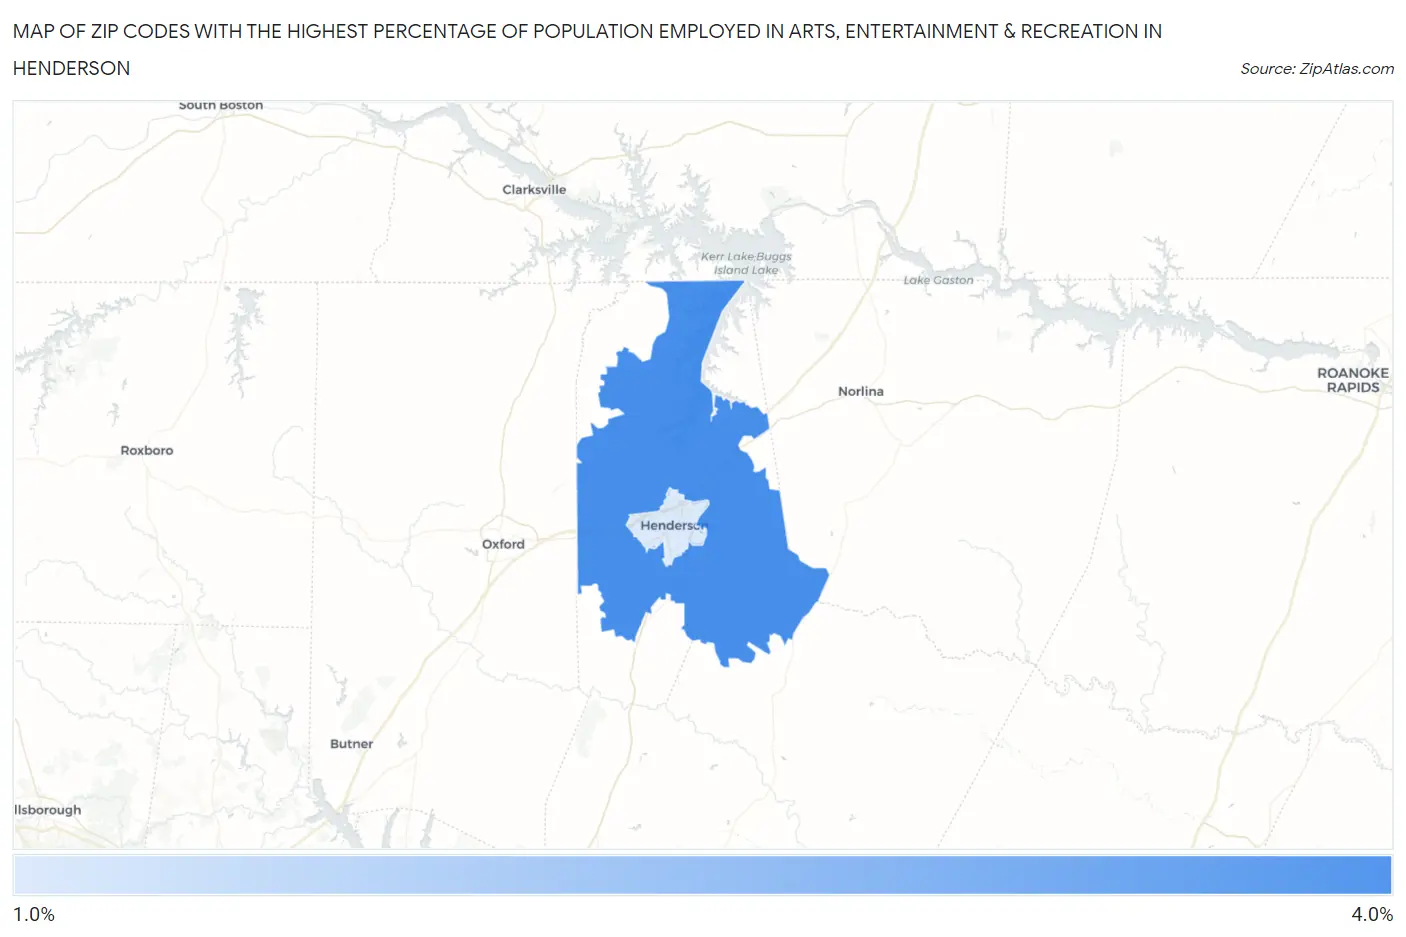
Map of Zip Codes with the Highest Percentage of Population Employed in Arts, Entertainment & Recreation in Henderson
1.1%
3.6%
Zip Codes with the Highest Percentage of Population Employed in Arts, Entertainment & Recreation in Henderson, NC
| Zip Code | % Employed | vs State | vs National | |
| 1. | 27537 | 3.6% | 1.8%(+1.81)#101 | 2.1%(+1.48)#4,016 |
| 2. | 27536 | 1.1% | 1.8%(-0.632)#393 | 2.1%(-0.960)#16,060 |
1
Common Questions
What are the Top Zip Codes with the Highest Percentage of Population Employed in Arts, Entertainment & Recreation in Henderson, NC?
Top Zip Codes with the Highest Percentage of Population Employed in Arts, Entertainment & Recreation in Henderson, NC are:
What zip code has the Highest Percentage of Population Employed in Arts, Entertainment & Recreation in Henderson, NC?
27537 has the Highest Percentage of Population Employed in Arts, Entertainment & Recreation in Henderson, NC with 3.6%.
What is the Percentage of Population Employed in Arts, Entertainment & Recreation in Henderson, NC?
Percentage of Population Employed in Arts, Entertainment & Recreation in Henderson is 0.80%.
What is the Percentage of Population Employed in Arts, Entertainment & Recreation in North Carolina?
Percentage of Population Employed in Arts, Entertainment & Recreation in North Carolina is 1.8%.
What is the Percentage of Population Employed in Arts, Entertainment & Recreation in the United States?
Percentage of Population Employed in Arts, Entertainment & Recreation in the United States is 2.1%.