Zip Codes with the Highest Percentage of Population Employed in Agriculture, Fishing & Hunting in Henderson, NC
RELATED REPORTS & OPTIONS
Agriculture, Fishing & Hunting
Henderson
Compare Zip Codes
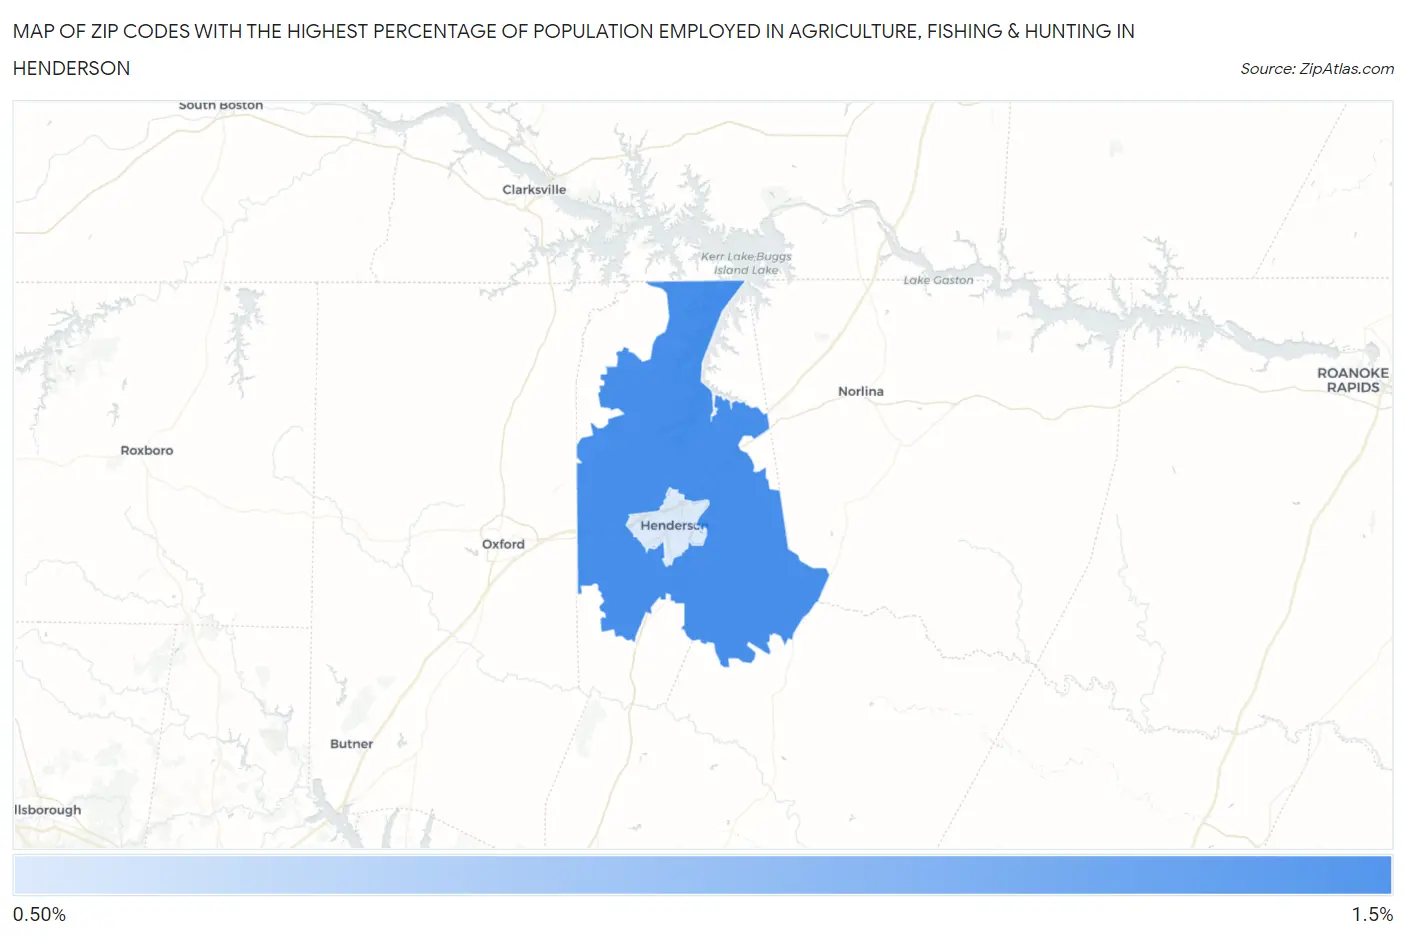
Map of Zip Codes with the Highest Percentage of Population Employed in Agriculture, Fishing & Hunting in Henderson
0.70%
1.0%
Zip Codes with the Highest Percentage of Population Employed in Agriculture, Fishing & Hunting in Henderson, NC
| Zip Code | % Employed | vs State | vs National | |
| 1. | 27537 | 1.0% | 1.0%(-0.005)#384 | 1.2%(-0.197)#16,205 |
| 2. | 27536 | 0.70% | 1.0%(-0.307)#437 | 1.2%(-0.498)#17,835 |
1
Common Questions
What are the Top Zip Codes with the Highest Percentage of Population Employed in Agriculture, Fishing & Hunting in Henderson, NC?
Top Zip Codes with the Highest Percentage of Population Employed in Agriculture, Fishing & Hunting in Henderson, NC are:
What zip code has the Highest Percentage of Population Employed in Agriculture, Fishing & Hunting in Henderson, NC?
27537 has the Highest Percentage of Population Employed in Agriculture, Fishing & Hunting in Henderson, NC with 1.0%.
What is the Percentage of Population Employed in Agriculture, Fishing & Hunting in Henderson, NC?
Percentage of Population Employed in Agriculture, Fishing & Hunting in Henderson is 0.59%.
What is the Percentage of Population Employed in Agriculture, Fishing & Hunting in North Carolina?
Percentage of Population Employed in Agriculture, Fishing & Hunting in North Carolina is 1.0%.
What is the Percentage of Population Employed in Agriculture, Fishing & Hunting in the United States?
Percentage of Population Employed in Agriculture, Fishing & Hunting in the United States is 1.2%.