Yaak, MT Map & Demographics
Yaak Map
Yaak Overview
$29,776
PER CAPITA INCOME
$58,333
AVG FAMILY INCOME
$57,917
AVG HOUSEHOLD INCOME
16.4%
WAGE / INCOME GAP [ % ]
83.6¢/ $1
WAGE / INCOME GAP [ $ ]
0.39
INEQUALITY / GINI INDEX
330
TOTAL POPULATION
155
MALE POPULATION
175
FEMALE POPULATION
88.57
MALES / 100 FEMALES
112.90
FEMALES / 100 MALES
63.1
MEDIAN AGE
2.5
AVG FAMILY SIZE
2.2
AVG HOUSEHOLD SIZE
85
LABOR FORCE [ PEOPLE ]
29.9%
PERCENT IN LABOR FORCE
7.1%
UNEMPLOYMENT RATE
Income in Yaak
Income Overview in Yaak
Per Capita Income in Yaak is $29,776, while median incomes of families and households are $58,333 and $57,917 respectively.
| Characteristic | Number | Measure |
| Per Capita Income | 330 | $29,776 |
| Median Family Income | 106 | $58,333 |
| Mean Family Income | 106 | $70,742 |
| Median Household Income | 147 | $57,917 |
| Mean Household Income | 147 | $64,803 |
| Income Deficit | 106 | $0 |
| Wage / Income Gap (%) | 330 | 16.43% |
| Wage / Income Gap ($) | 330 | 83.57¢ per $1 |
| Gini / Inequality Index | 330 | 0.39 |
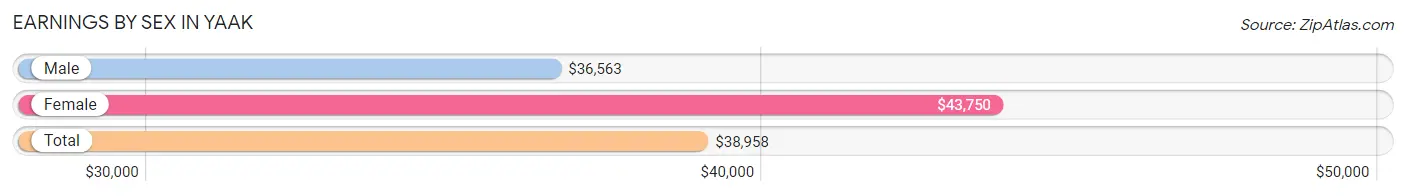
Earnings by Sex in Yaak
Average Earnings in Yaak are $38,958, $36,563 for men and $43,750 for women, a difference of 16.4%.
| Sex | Number | Average Earnings |
| Male | 49 (48.5%) | $36,563 |
| Female | 52 (51.5%) | $43,750 |
| Total | 101 (100.0%) | $38,958 |
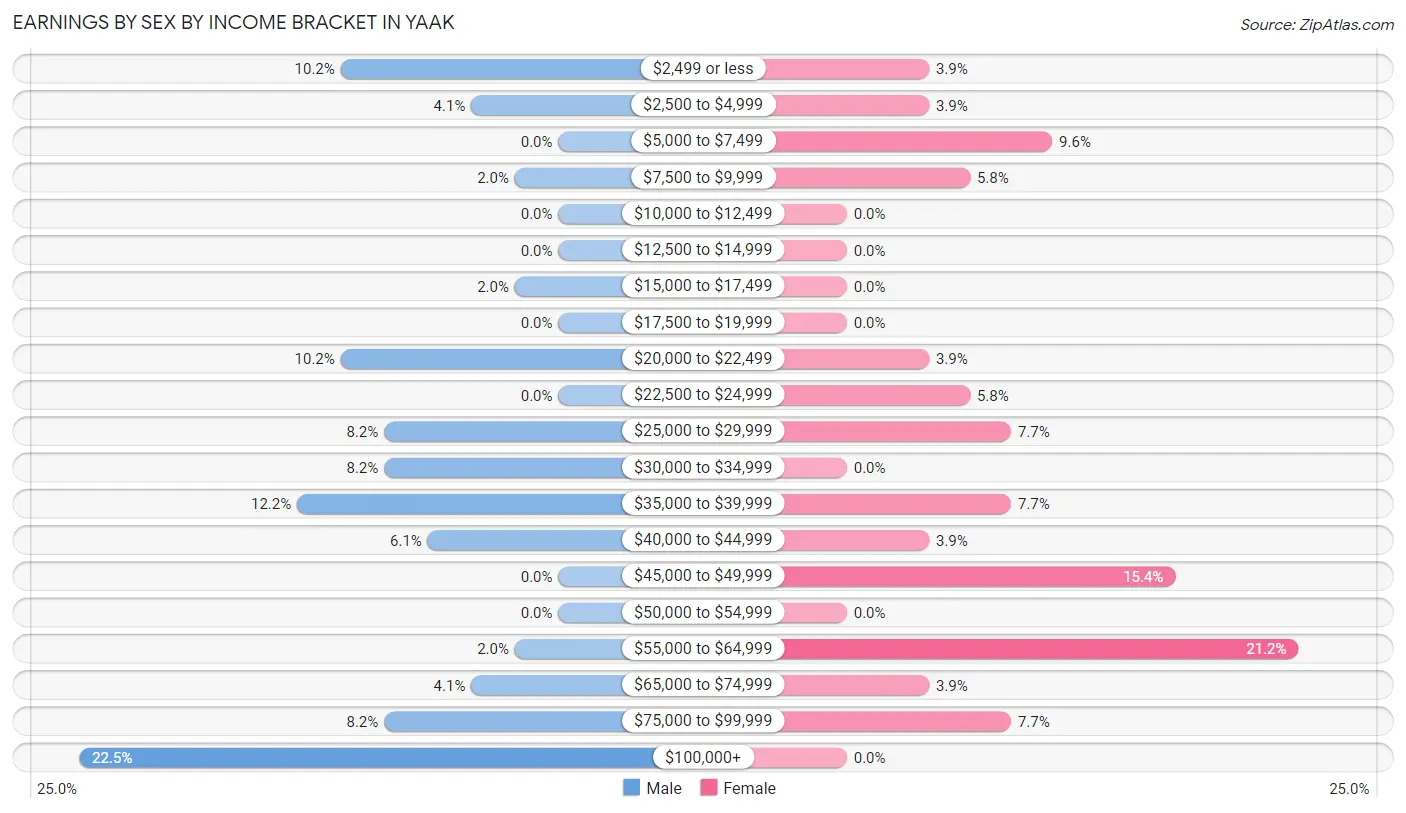
Earnings by Sex by Income Bracket in Yaak
The most common earnings brackets in Yaak are $100,000+ for men (11 | 22.5%) and $55,000 to $64,999 for women (11 | 21.1%).
| Income | Male | Female |
| $2,499 or less | 5 (10.2%) | 2 (3.8%) |
| $2,500 to $4,999 | 2 (4.1%) | 2 (3.8%) |
| $5,000 to $7,499 | 0 (0.0%) | 5 (9.6%) |
| $7,500 to $9,999 | 1 (2.0%) | 3 (5.8%) |
| $10,000 to $12,499 | 0 (0.0%) | 0 (0.0%) |
| $12,500 to $14,999 | 0 (0.0%) | 0 (0.0%) |
| $15,000 to $17,499 | 1 (2.0%) | 0 (0.0%) |
| $17,500 to $19,999 | 0 (0.0%) | 0 (0.0%) |
| $20,000 to $22,499 | 5 (10.2%) | 2 (3.8%) |
| $22,500 to $24,999 | 0 (0.0%) | 3 (5.8%) |
| $25,000 to $29,999 | 4 (8.2%) | 4 (7.7%) |
| $30,000 to $34,999 | 4 (8.2%) | 0 (0.0%) |
| $35,000 to $39,999 | 6 (12.2%) | 4 (7.7%) |
| $40,000 to $44,999 | 3 (6.1%) | 2 (3.8%) |
| $45,000 to $49,999 | 0 (0.0%) | 8 (15.4%) |
| $50,000 to $54,999 | 0 (0.0%) | 0 (0.0%) |
| $55,000 to $64,999 | 1 (2.0%) | 11 (21.1%) |
| $65,000 to $74,999 | 2 (4.1%) | 2 (3.8%) |
| $75,000 to $99,999 | 4 (8.2%) | 4 (7.7%) |
| $100,000+ | 11 (22.5%) | 0 (0.0%) |
| Total | 49 (100.0%) | 52 (100.0%) |
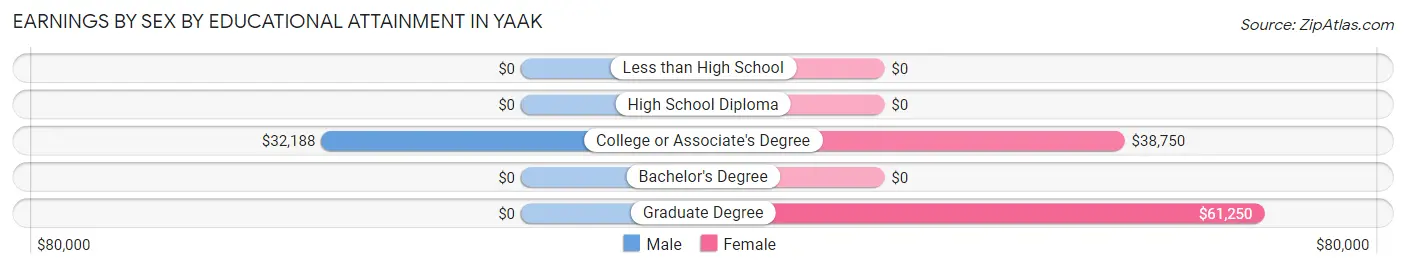
Earnings by Sex by Educational Attainment in Yaak
Average earnings in Yaak are $36,875 for men and $43,750 for women, a difference of 15.7%. Men with an educational attainment of college or associate's degree enjoy the highest average annual earnings of $32,188, while those with college or associate's degree education earn the least with $32,188. Women with an educational attainment of graduate degree earn the most with the average annual earnings of $61,250, while those with college or associate's degree education have the smallest earnings of $38,750.
| Educational Attainment | Male Income | Female Income |
| Less than High School | - | - |
| High School Diploma | - | - |
| College or Associate's Degree | $32,188 | $38,750 |
| Bachelor's Degree | - | - |
| Graduate Degree | - | - |
| Total | $36,875 | $43,750 |
Family Income in Yaak
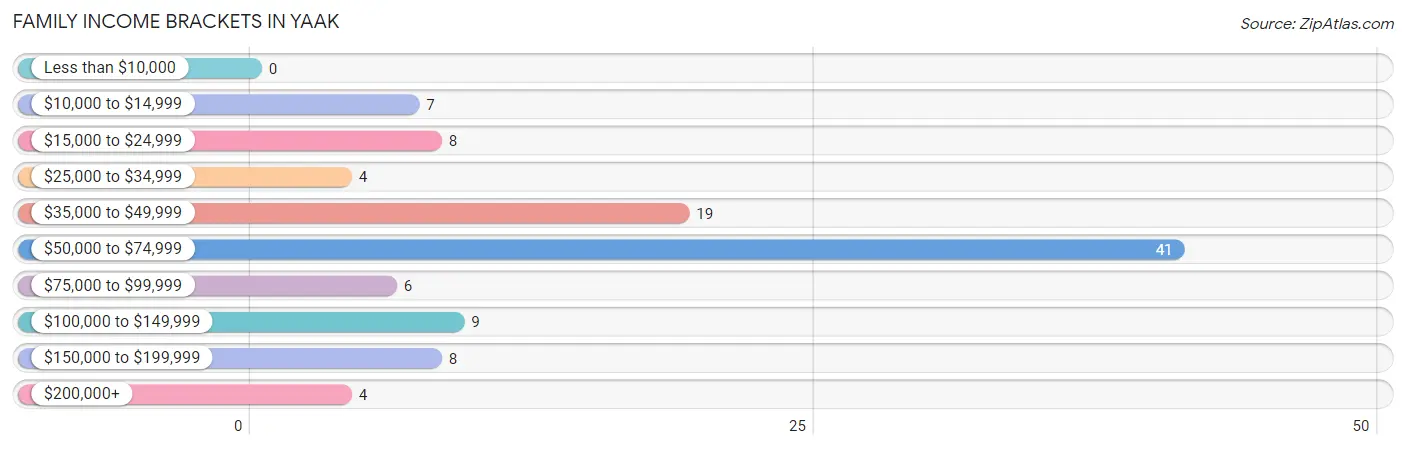
Family Income Brackets in Yaak
According to the Yaak family income data, there are 41 families falling into the $50,000 to $74,999 income range, which is the most common income bracket and makes up 38.7% of all families.
| Income Bracket | # Families | % Families |
| Less than $10,000 | 0 | 0.0% |
| $10,000 to $14,999 | 7 | 6.6% |
| $15,000 to $24,999 | 8 | 7.5% |
| $25,000 to $34,999 | 4 | 3.8% |
| $35,000 to $49,999 | 19 | 17.9% |
| $50,000 to $74,999 | 41 | 38.7% |
| $75,000 to $99,999 | 6 | 5.7% |
| $100,000 to $149,999 | 9 | 8.5% |
| $150,000 to $199,999 | 8 | 7.5% |
| $200,000+ | 4 | 3.8% |
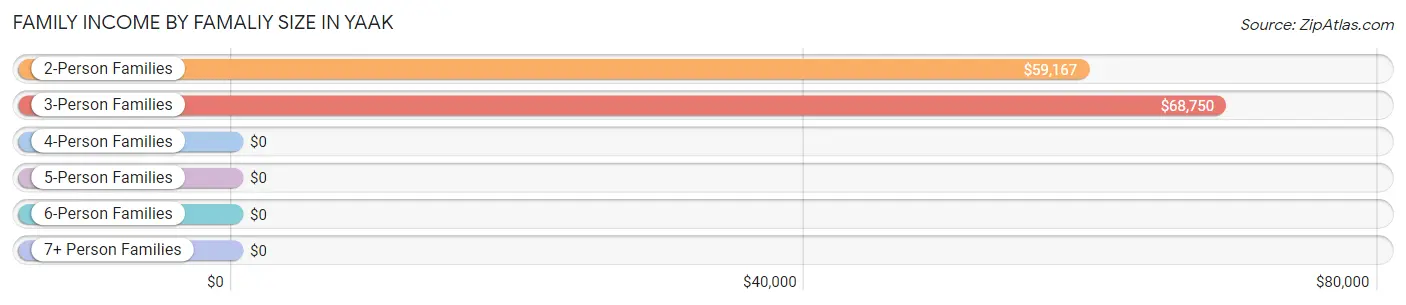
Family Income by Famaliy Size in Yaak
3-person families (8 | 7.5%) account for the highest median family income in Yaak with $68,750 per family, while 2-person families (86 | 81.1%) have the highest median income of $29,584 per family member.
| Income Bracket | # Families | Median Income |
| 2-Person Families | 86 (81.1%) | $59,167 |
| 3-Person Families | 8 (7.5%) | $68,750 |
| 4-Person Families | 5 (4.7%) | $0 |
| 5-Person Families | 7 (6.6%) | $0 |
| 6-Person Families | 0 (0.0%) | $0 |
| 7+ Person Families | 0 (0.0%) | $0 |
| Total | 106 (100.0%) | $58,333 |
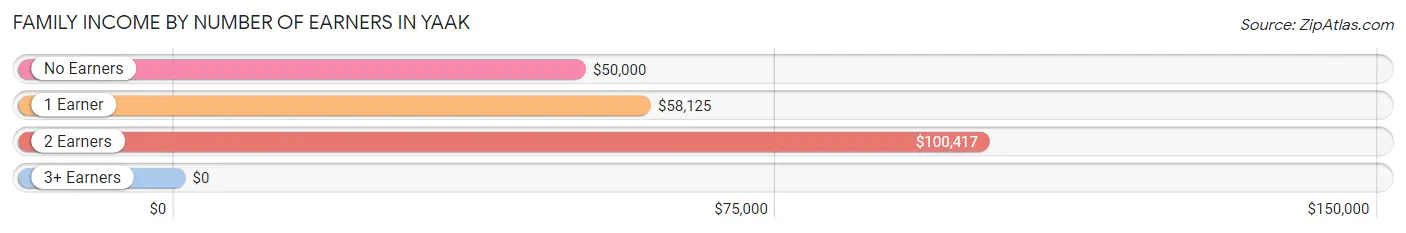
Family Income by Number of Earners in Yaak
| Number of Earners | # Families | Median Income |
| No Earners | 46 (43.4%) | $50,000 |
| 1 Earner | 37 (34.9%) | $58,125 |
| 2 Earners | 23 (21.7%) | $100,417 |
| 3+ Earners | 0 (0.0%) | $0 |
| Total | 106 (100.0%) | $58,333 |
Household Income in Yaak
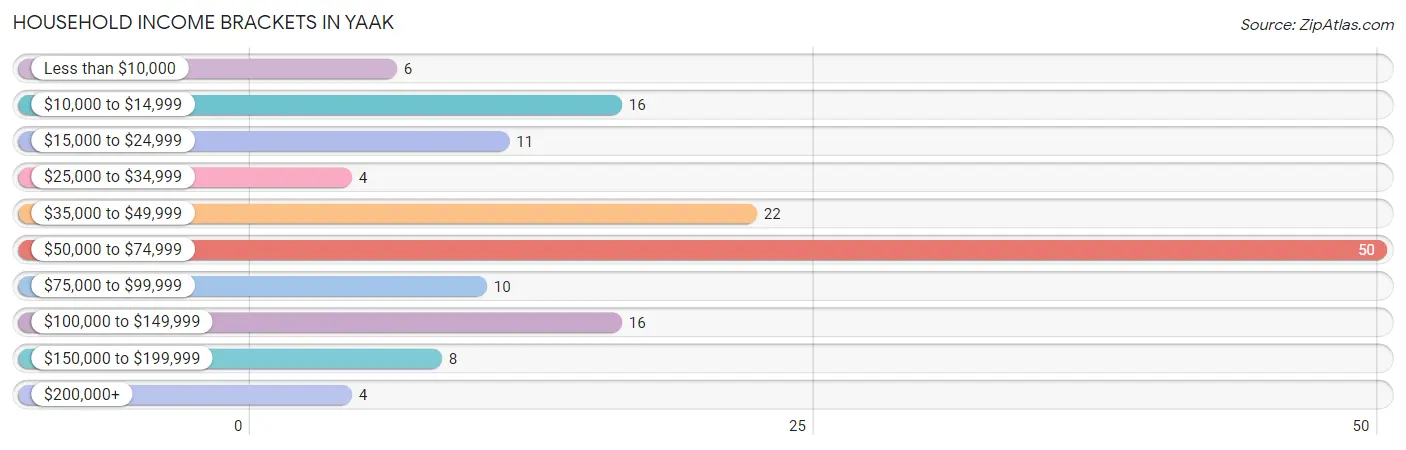
Household Income Brackets in Yaak
With 50 households falling in the category, the $50,000 to $74,999 income range is the most frequent in Yaak, accounting for 34.0% of all households. In contrast, only 4 households (2.7%) fall into the $25,000 to $34,999 income bracket, making it the least populous group.
| Income Bracket | # Households | % Households |
| Less than $10,000 | 6 | 4.1% |
| $10,000 to $14,999 | 16 | 10.9% |
| $15,000 to $24,999 | 11 | 7.5% |
| $25,000 to $34,999 | 4 | 2.7% |
| $35,000 to $49,999 | 22 | 15.0% |
| $50,000 to $74,999 | 50 | 34.0% |
| $75,000 to $99,999 | 10 | 6.8% |
| $100,000 to $149,999 | 16 | 10.9% |
| $150,000 to $199,999 | 8 | 5.4% |
| $200,000+ | 4 | 2.7% |
Household Income by Householder Age in Yaak
The median household income in Yaak is $57,917, with the highest median household income of $63,750 found in the 45 to 64 years age bracket for the primary householder. A total of 50 households (34.0%) fall into this category.
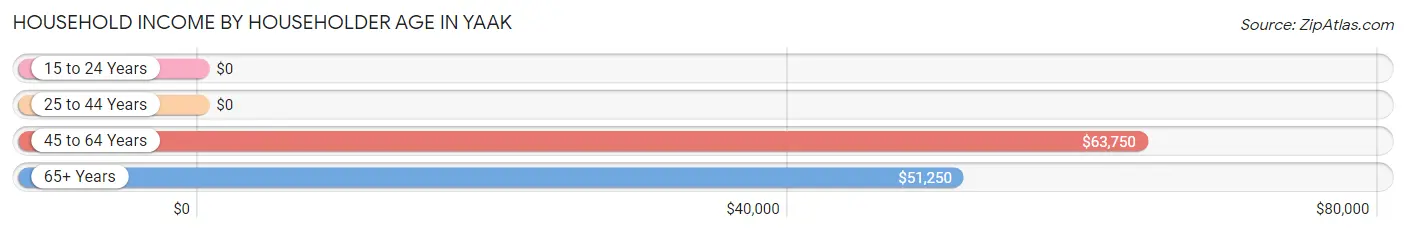
| Income Bracket | # Households | Median Income |
| 15 to 24 Years | 0 (0.0%) | $0 |
| 25 to 44 Years | 21 (14.3%) | $0 |
| 45 to 64 Years | 50 (34.0%) | $63,750 |
| 65+ Years | 76 (51.7%) | $51,250 |
| Total | 147 (100.0%) | $57,917 |
Poverty in Yaak
Income Below Poverty by Sex and Age in Yaak
With 16.1% poverty level for males and 19.5% for females among the residents of Yaak, 12 to 14 year old males and 35 to 44 year old females are the most vulnerable to poverty, with 3 males (100.0%) and 9 females (60.0%) in their respective age groups living below the poverty level.
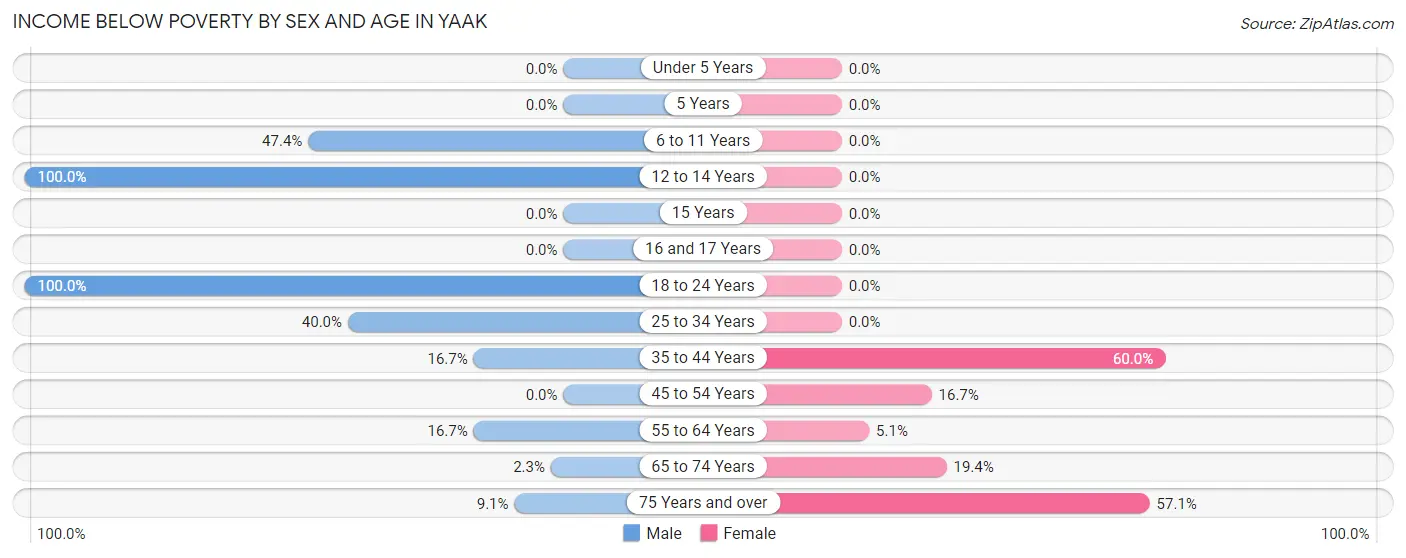
| Age Bracket | Male | Female |
| Under 5 Years | 0 (0.0%) | 0 (0.0%) |
| 5 Years | 0 (0.0%) | 0 (0.0%) |
| 6 to 11 Years | 9 (47.4%) | 0 (0.0%) |
| 12 to 14 Years | 3 (100.0%) | 0 (0.0%) |
| 15 Years | 0 (0.0%) | 0 (0.0%) |
| 16 and 17 Years | 0 (0.0%) | 0 (0.0%) |
| 18 to 24 Years | 1 (100.0%) | 0 (0.0%) |
| 25 to 34 Years | 2 (40.0%) | 0 (0.0%) |
| 35 to 44 Years | 2 (16.7%) | 9 (60.0%) |
| 45 to 54 Years | 0 (0.0%) | 2 (16.7%) |
| 55 to 64 Years | 4 (16.7%) | 3 (5.1%) |
| 65 to 74 Years | 1 (2.3%) | 7 (19.4%) |
| 75 Years and over | 3 (9.1%) | 12 (57.1%) |
| Total | 25 (16.1%) | 33 (19.5%) |
Income Above Poverty by Sex and Age in Yaak
According to the poverty statistics in Yaak, males aged under 5 years and females aged under 5 years are the age groups that are most secure financially, with 100.0% of males and 100.0% of females in these age groups living above the poverty line.
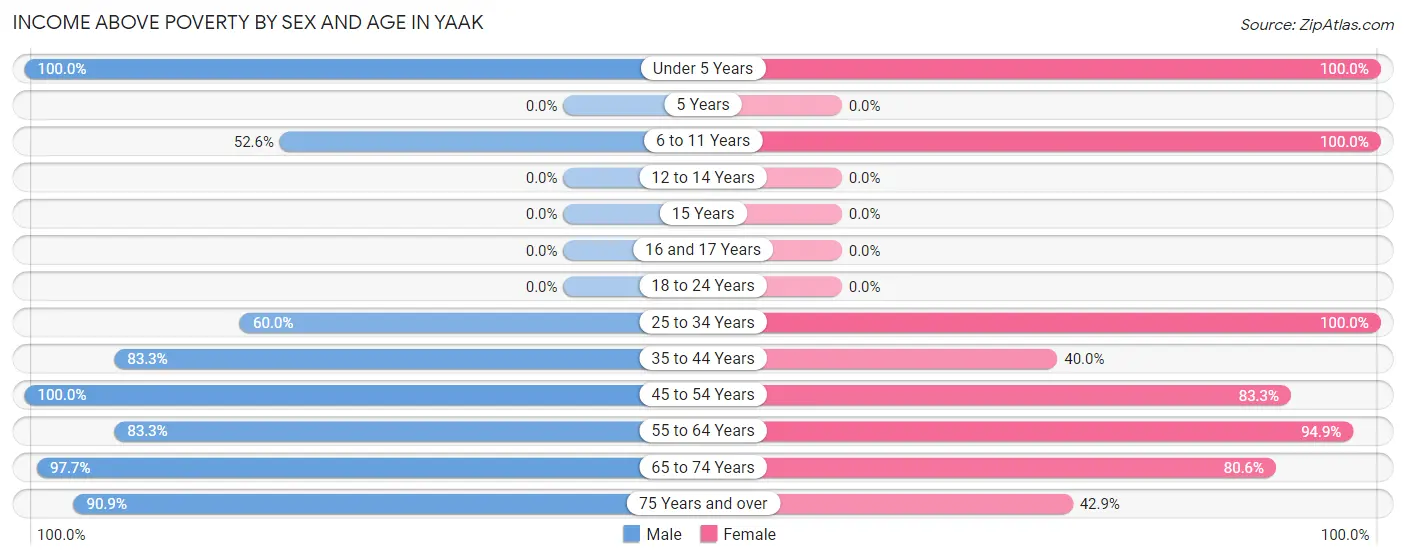
| Age Bracket | Male | Female |
| Under 5 Years | 6 (100.0%) | 3 (100.0%) |
| 5 Years | 0 (0.0%) | 0 (0.0%) |
| 6 to 11 Years | 10 (52.6%) | 9 (100.0%) |
| 12 to 14 Years | 0 (0.0%) | 0 (0.0%) |
| 15 Years | 0 (0.0%) | 0 (0.0%) |
| 16 and 17 Years | 0 (0.0%) | 0 (0.0%) |
| 18 to 24 Years | 0 (0.0%) | 0 (0.0%) |
| 25 to 34 Years | 3 (60.0%) | 14 (100.0%) |
| 35 to 44 Years | 10 (83.3%) | 6 (40.0%) |
| 45 to 54 Years | 9 (100.0%) | 10 (83.3%) |
| 55 to 64 Years | 20 (83.3%) | 56 (94.9%) |
| 65 to 74 Years | 42 (97.7%) | 29 (80.6%) |
| 75 Years and over | 30 (90.9%) | 9 (42.9%) |
| Total | 130 (83.9%) | 136 (80.5%) |
Income Below Poverty Among Married-Couple Families in Yaak
The poverty statistics for married-couple families in Yaak show that 4.1% or 4 of the total 97 families live below the poverty line. Families with 3 or 4 children have the highest poverty rate of 28.6%, comprising of 2 families. On the other hand, families with 1 or 2 children have the lowest poverty rate of 0.0%, which includes 0 families.
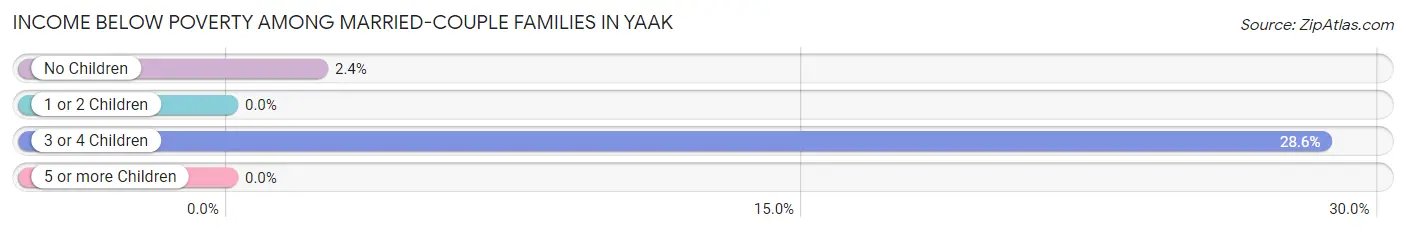
| Children | Above Poverty | Below Poverty |
| No Children | 83 (97.7%) | 2 (2.4%) |
| 1 or 2 Children | 5 (100.0%) | 0 (0.0%) |
| 3 or 4 Children | 5 (71.4%) | 2 (28.6%) |
| 5 or more Children | 0 (0.0%) | 0 (0.0%) |
| Total | 93 (95.9%) | 4 (4.1%) |
Income Below Poverty Among Single-Parent Households in Yaak
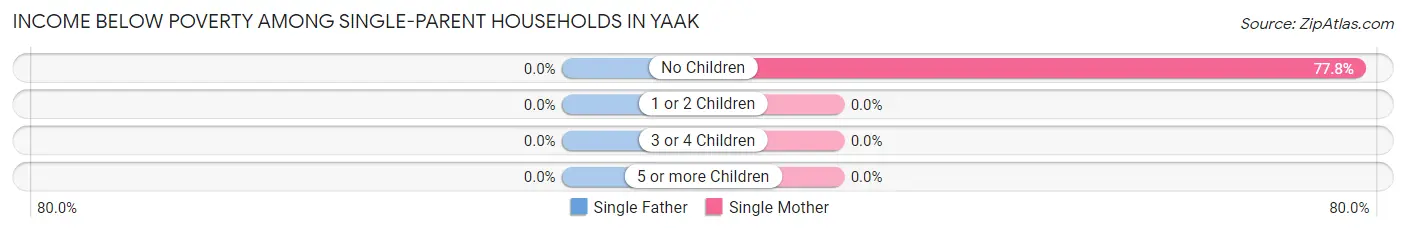
| Children | Single Father | Single Mother |
| No Children | 0 (0.0%) | 7 (77.8%) |
| 1 or 2 Children | 0 (0.0%) | 0 (0.0%) |
| 3 or 4 Children | 0 (0.0%) | 0 (0.0%) |
| 5 or more Children | 0 (0.0%) | 0 (0.0%) |
| Total | 0 (0.0%) | 7 (77.8%) |
Income Below Poverty Among Married-Couple vs Single-Parent Households in Yaak
The poverty data for Yaak shows that 4 of the married-couple family households (4.1%) and 7 of the single-parent households (77.8%) are living below the poverty level. Within the married-couple family households, those with 3 or 4 children have the highest poverty rate, with 2 households (28.6%) falling below the poverty line. Among the single-parent households, those with no children have the highest poverty rate, with 7 household (77.8%) living below poverty.
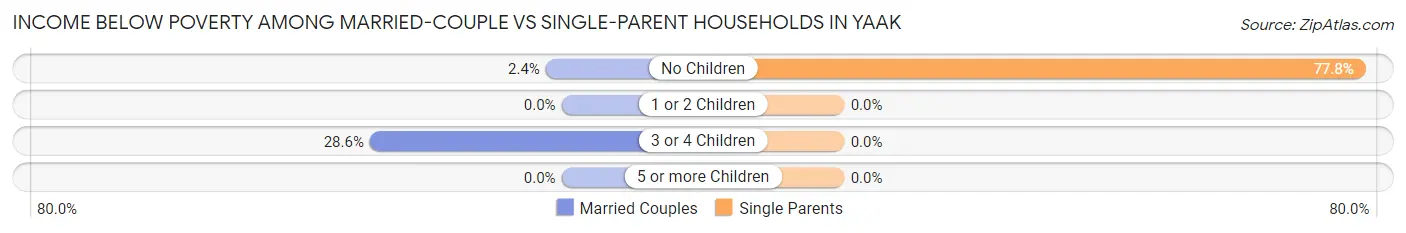
| Children | Married-Couple Families | Single-Parent Households |
| No Children | 2 (2.4%) | 7 (77.8%) |
| 1 or 2 Children | 0 (0.0%) | 0 (0.0%) |
| 3 or 4 Children | 2 (28.6%) | 0 (0.0%) |
| 5 or more Children | 0 (0.0%) | 0 (0.0%) |
| Total | 4 (4.1%) | 7 (77.8%) |
Race in Yaak
The most populous races in Yaak are White / Caucasian (281 | 85.2%), Two or more Races (35 | 10.6%), and Hispanic or Latino (14 | 4.2%).
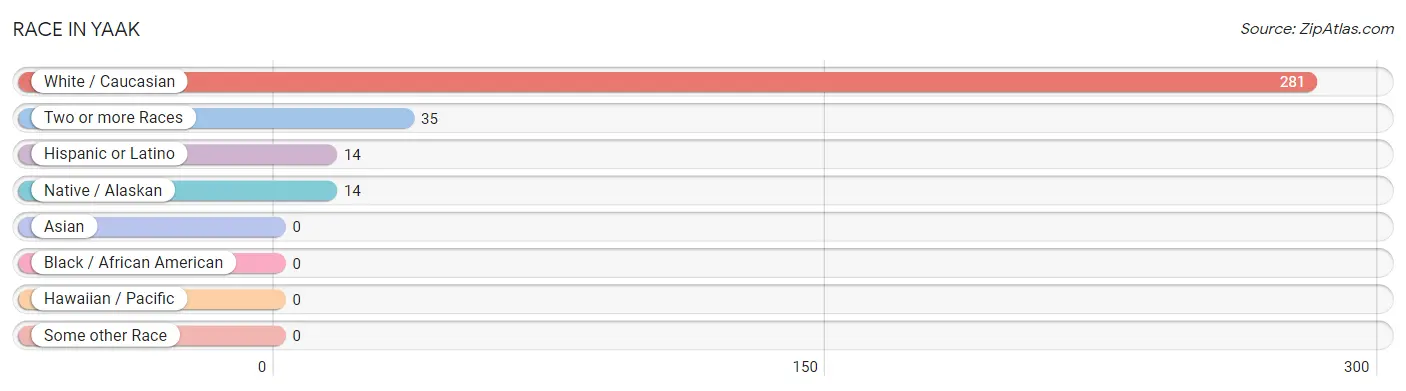
| Race | # Population | % Population |
| Asian | 0 | 0.0% |
| Black / African American | 0 | 0.0% |
| Hawaiian / Pacific | 0 | 0.0% |
| Hispanic or Latino | 14 | 4.2% |
| Native / Alaskan | 14 | 4.2% |
| White / Caucasian | 281 | 85.2% |
| Two or more Races | 35 | 10.6% |
| Some other Race | 0 | 0.0% |
| Total | 330 | 100.0% |
Ancestry in Yaak
The most populous ancestries reported in Yaak are German (84 | 25.5%), English (46 | 13.9%), Irish (46 | 13.9%), Scandinavian (16 | 4.9%), and French (15 | 4.5%), together accounting for 62.7% of all Yaak residents.
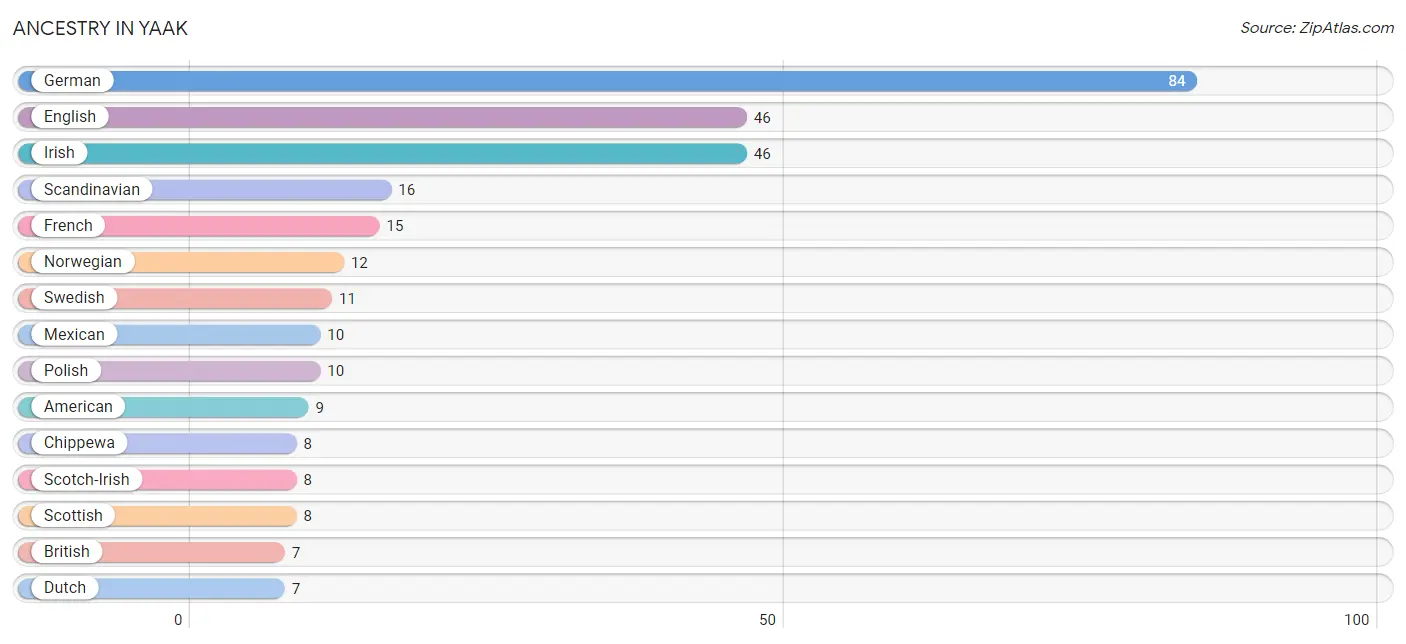
| Ancestry | # Population | % Population |
| American | 9 | 2.7% |
| Blackfeet | 6 | 1.8% |
| British | 7 | 2.1% |
| Chippewa | 8 | 2.4% |
| Danish | 2 | 0.6% |
| Dutch | 7 | 2.1% |
| Eastern European | 2 | 0.6% |
| English | 46 | 13.9% |
| European | 4 | 1.2% |
| French | 15 | 4.5% |
| French Canadian | 3 | 0.9% |
| German | 84 | 25.5% |
| Irish | 46 | 13.9% |
| Italian | 5 | 1.5% |
| Mexican | 10 | 3.0% |
| Northern European | 7 | 2.1% |
| Norwegian | 12 | 3.6% |
| Polish | 10 | 3.0% |
| Scandinavian | 16 | 4.9% |
| Scotch-Irish | 8 | 2.4% |
| Scottish | 8 | 2.4% |
| Spanish | 4 | 1.2% |
| Swedish | 11 | 3.3% |
| Swiss | 7 | 2.1% |
| Welsh | 3 | 0.9% | View All 25 Rows |
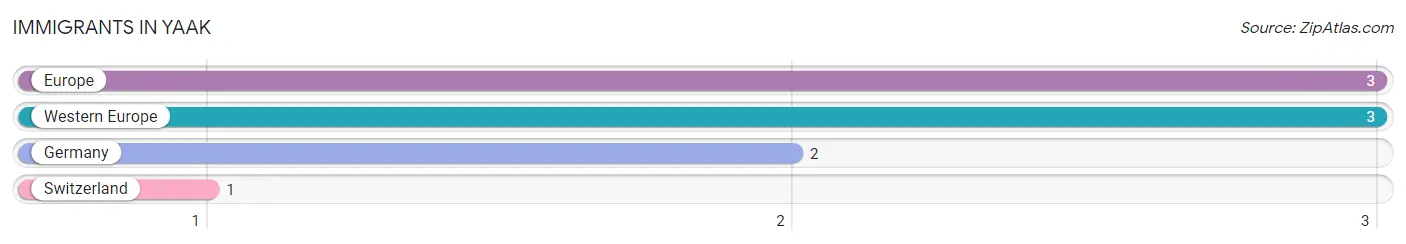
Immigrants in Yaak
The most numerous immigrant groups reported in Yaak came from Europe (3 | 0.9%), Western Europe (3 | 0.9%), Germany (2 | 0.6%), and Switzerland (1 | 0.3%), together accounting for 2.7% of all Yaak residents.
| Immigration Origin | # Population | % Population |
| Europe | 3 | 0.9% |
| Germany | 2 | 0.6% |
| Switzerland | 1 | 0.3% |
| Western Europe | 3 | 0.9% | View All 4 Rows |
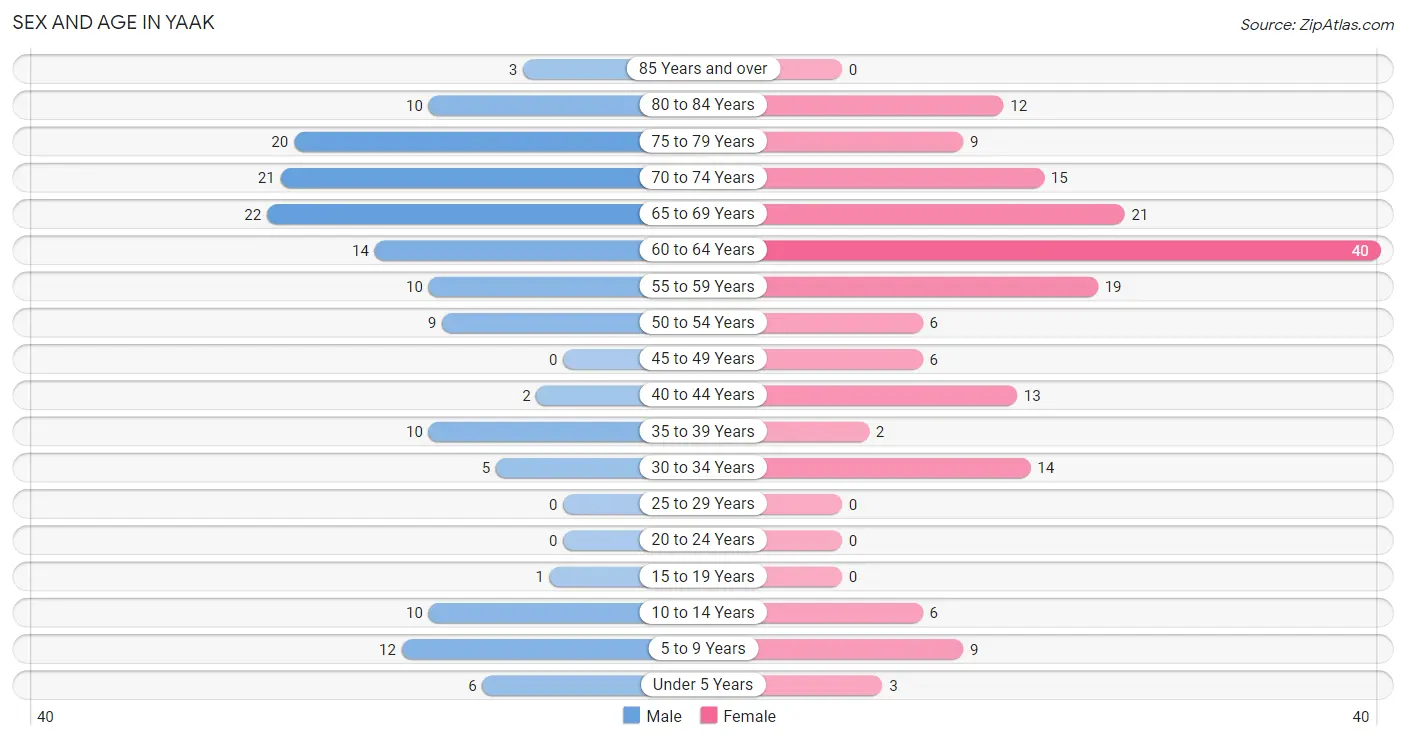
Sex and Age in Yaak
Sex and Age in Yaak
The most populous age groups in Yaak are 65 to 69 Years (22 | 14.2%) for men and 60 to 64 Years (40 | 22.9%) for women.
| Age Bracket | Male | Female |
| Under 5 Years | 6 (3.9%) | 3 (1.7%) |
| 5 to 9 Years | 12 (7.7%) | 9 (5.1%) |
| 10 to 14 Years | 10 (6.5%) | 6 (3.4%) |
| 15 to 19 Years | 1 (0.6%) | 0 (0.0%) |
| 20 to 24 Years | 0 (0.0%) | 0 (0.0%) |
| 25 to 29 Years | 0 (0.0%) | 0 (0.0%) |
| 30 to 34 Years | 5 (3.2%) | 14 (8.0%) |
| 35 to 39 Years | 10 (6.5%) | 2 (1.1%) |
| 40 to 44 Years | 2 (1.3%) | 13 (7.4%) |
| 45 to 49 Years | 0 (0.0%) | 6 (3.4%) |
| 50 to 54 Years | 9 (5.8%) | 6 (3.4%) |
| 55 to 59 Years | 10 (6.5%) | 19 (10.9%) |
| 60 to 64 Years | 14 (9.0%) | 40 (22.9%) |
| 65 to 69 Years | 22 (14.2%) | 21 (12.0%) |
| 70 to 74 Years | 21 (13.6%) | 15 (8.6%) |
| 75 to 79 Years | 20 (12.9%) | 9 (5.1%) |
| 80 to 84 Years | 10 (6.5%) | 12 (6.9%) |
| 85 Years and over | 3 (1.9%) | 0 (0.0%) |
| Total | 155 (100.0%) | 175 (100.0%) |
Families and Households in Yaak
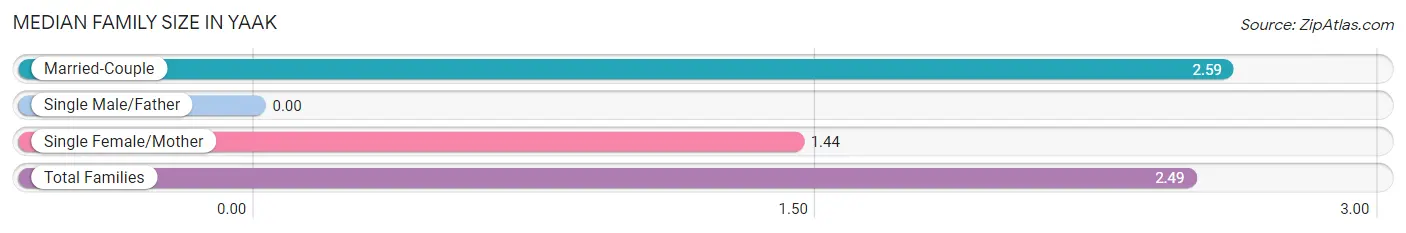
Median Family Size in Yaak
| Family Type | # Families | Family Size |
| Married-Couple | 97 (91.5%) | 2.59 |
| Single Male/Father | 0 (0.0%) | - |
| Single Female/Mother | 9 (8.5%) | 1.44 |
| Total Families | 106 (100.0%) | 2.49 |
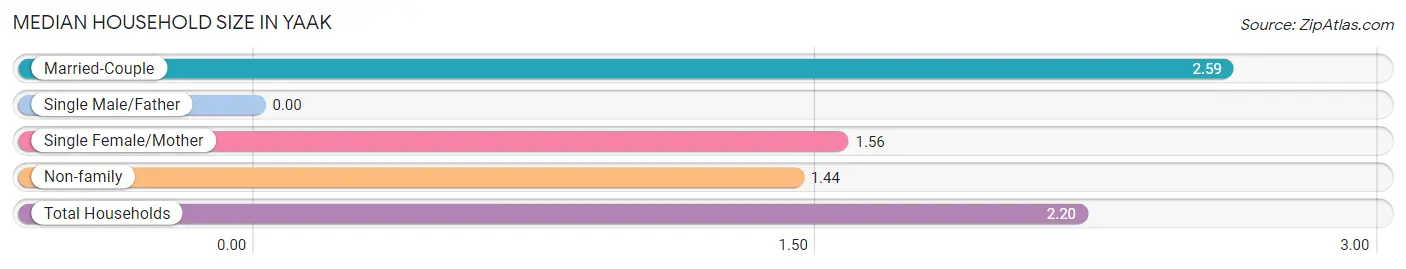
Median Household Size in Yaak
| Household Type | # Households | Household Size |
| Married-Couple | 97 (66.0%) | 2.59 |
| Single Male/Father | 0 (0.0%) | - |
| Single Female/Mother | 9 (6.1%) | 1.56 |
| Non-family | 41 (27.9%) | 1.44 |
| Total Households | 147 (100.0%) | 2.20 |
Household Size by Marriage Status in Yaak
Out of a total of 147 households in Yaak, 106 (72.1%) are family households, while 41 (27.9%) are nonfamily households. The most numerous type of family households are 2-person households, comprising 84, and the most common type of nonfamily households are 1-person households, comprising 35.
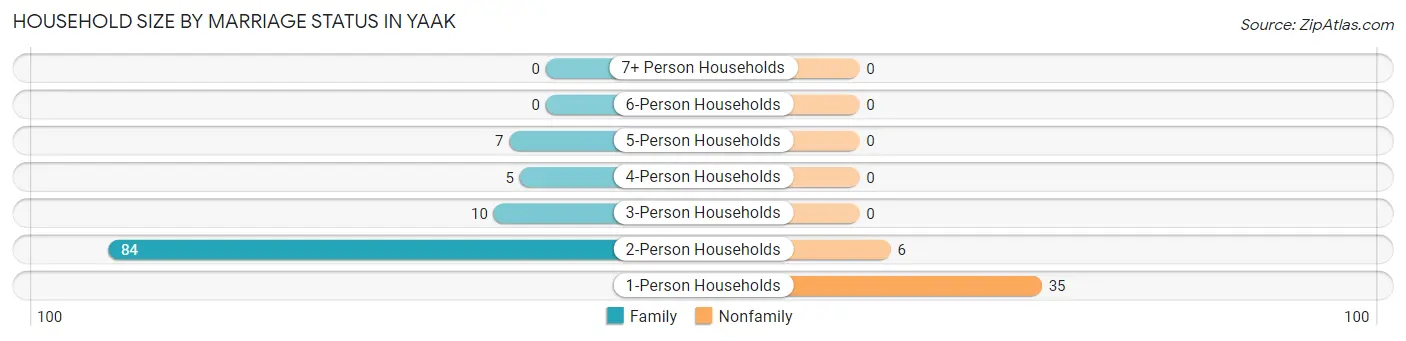
| Household Size | Family Households | Nonfamily Households |
| 1-Person Households | - | 35 (23.8%) |
| 2-Person Households | 84 (57.1%) | 6 (4.1%) |
| 3-Person Households | 10 (6.8%) | 0 (0.0%) |
| 4-Person Households | 5 (3.4%) | 0 (0.0%) |
| 5-Person Households | 7 (4.8%) | 0 (0.0%) |
| 6-Person Households | 0 (0.0%) | 0 (0.0%) |
| 7+ Person Households | 0 (0.0%) | 0 (0.0%) |
| Total | 106 (72.1%) | 41 (27.9%) |
Female Fertility in Yaak
Fertility by Age in Yaak
| Age Bracket | Women with Births | Births / 1,000 Women |
| 15 to 19 years | 0 (0.0%) | 0.0 |
| 20 to 34 years | 0 (0.0%) | 0.0 |
| 35 to 50 years | 0 (0.0%) | 0.0 |
| Total | 0 (0.0%) | 0.0 |
Fertility by Age by Marriage Status in Yaak
| Age Bracket | Married | Unmarried |
| 15 to 19 years | 0 (0.0%) | 0 (0.0%) |
| 20 to 34 years | 0 (0.0%) | 0 (0.0%) |
| 35 to 50 years | 0 (0.0%) | 0 (0.0%) |
| Total | 0 (0.0%) | 0 (0.0%) |
Fertility by Education in Yaak
| Educational Attainment | Women with Births | Births / 1,000 Women |
| Less than High School | 0 (0.0%) | 0.0 |
| High School Diploma | 0 (0.0%) | 0.0 |
| College or Associate's Degree | 0 (0.0%) | 0.0 |
| Bachelor's Degree | 0 (0.0%) | 0.0 |
| Graduate Degree | 0 (0.0%) | 0.0 |
| Total | 0 (0.0%) | 0.0 |
Fertility by Education by Marriage Status in Yaak
| Educational Attainment | Married | Unmarried |
| Less than High School | 0 (0.0%) | 0 (0.0%) |
| High School Diploma | 0 (0.0%) | 0 (0.0%) |
| College or Associate's Degree | 0 (0.0%) | 0 (0.0%) |
| Bachelor's Degree | 0 (0.0%) | 0 (0.0%) |
| Graduate Degree | 0 (0.0%) | 0 (0.0%) |
| Total | 0 (0.0%) | 0 (0.0%) |
Employment Characteristics in Yaak
Employment by Class of Employer in Yaak
Among the 77 employed individuals in Yaak, private company employees (38 | 49.3%), self-employed (incorporated) (14 | 18.2%), and federal government employees (9 | 11.7%) make up the most common classes of employment.
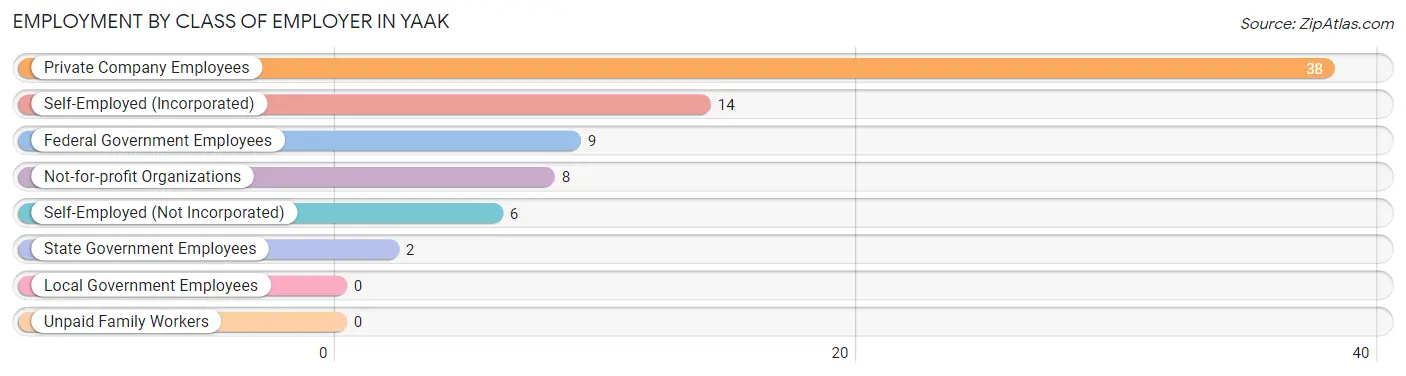
| Employer Class | # Employees | % Employees |
| Private Company Employees | 38 | 49.3% |
| Self-Employed (Incorporated) | 14 | 18.2% |
| Self-Employed (Not Incorporated) | 6 | 7.8% |
| Not-for-profit Organizations | 8 | 10.4% |
| Local Government Employees | 0 | 0.0% |
| State Government Employees | 2 | 2.6% |
| Federal Government Employees | 9 | 11.7% |
| Unpaid Family Workers | 0 | 0.0% |
| Total | 77 | 100.0% |
Employment Status by Age in Yaak
According to the labor force statistics for Yaak, out of the total population over 16 years of age (284), 29.9% or 85 individuals are in the labor force, with 7.1% or 6 of them unemployed. The age group with the highest labor force participation rate is 16 to 19 years, with 100.0% or 1 individuals in the labor force. Within the labor force, the 30 to 34 years age range has the highest percentage of unemployed individuals, with 23.5% or 4 of them being unemployed.
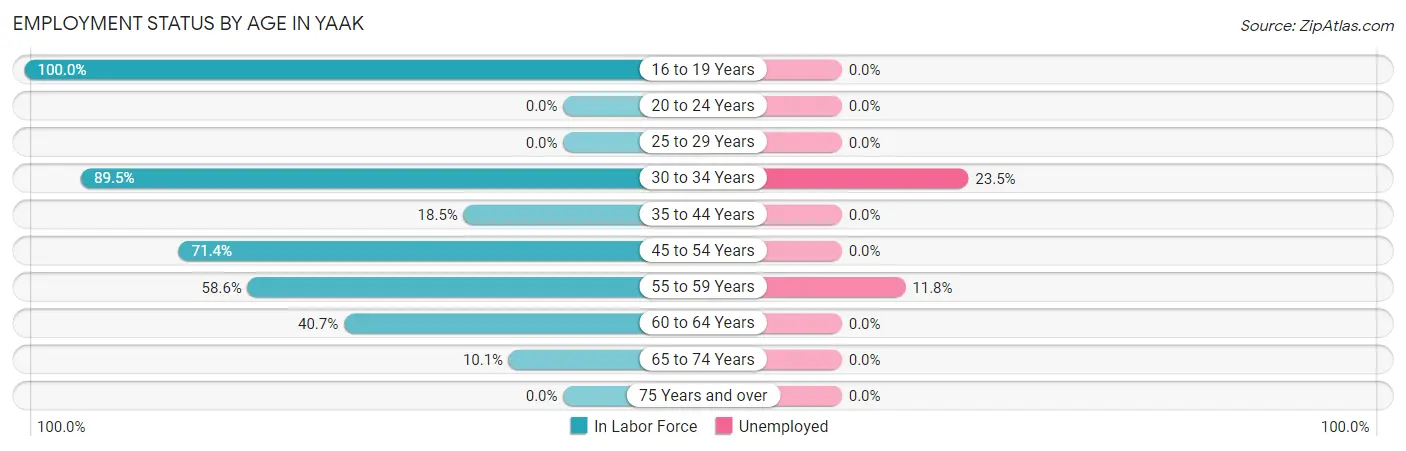
| Age Bracket | In Labor Force | Unemployed |
| 16 to 19 Years | 1 (100.0%) | 0 (0.0%) |
| 20 to 24 Years | 0 (0.0%) | 0 (0.0%) |
| 25 to 29 Years | 0 (0.0%) | 0 (0.0%) |
| 30 to 34 Years | 17 (89.5%) | 4 (23.5%) |
| 35 to 44 Years | 5 (18.5%) | 0 (0.0%) |
| 45 to 54 Years | 15 (71.4%) | 0 (0.0%) |
| 55 to 59 Years | 17 (58.6%) | 2 (11.8%) |
| 60 to 64 Years | 22 (40.7%) | 0 (0.0%) |
| 65 to 74 Years | 8 (10.1%) | 0 (0.0%) |
| 75 Years and over | 0 (0.0%) | 0 (0.0%) |
| Total | 85 (29.9%) | 6 (7.1%) |
Employment Status by Educational Attainment in Yaak
According to labor force statistics for Yaak, 50.7% of individuals (76) out of the total population between 25 and 64 years of age (150) are in the labor force, with 7.9% or 6 of them being unemployed. The group with the highest labor force participation rate are those with the educational attainment of bachelor's degree or higher, with 86.2% or 25 individuals in the labor force. Within the labor force, individuals with high school diploma education have the highest percentage of unemployment, with 13.3% or 4 of them being unemployed.
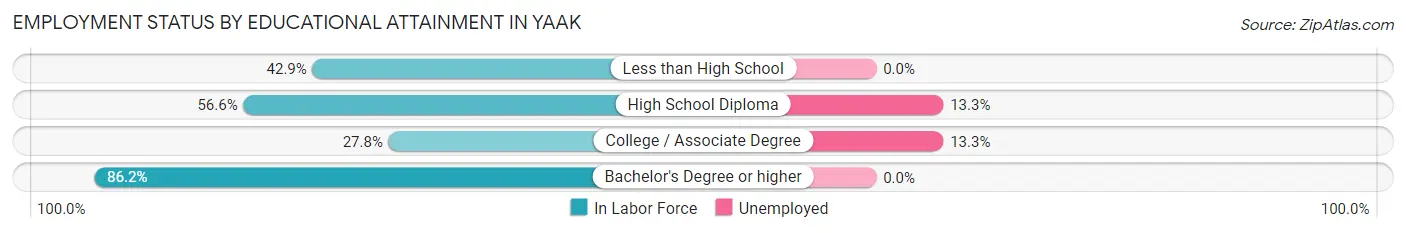
| Educational Attainment | In Labor Force | Unemployed |
| Less than High School | 6 (42.9%) | 0 (0.0%) |
| High School Diploma | 30 (56.6%) | 7 (13.3%) |
| College / Associate Degree | 15 (27.8%) | 7 (13.3%) |
| Bachelor's Degree or higher | 25 (86.2%) | 0 (0.0%) |
| Total | 76 (50.7%) | 12 (7.9%) |
Employment Occupations by Sex in Yaak
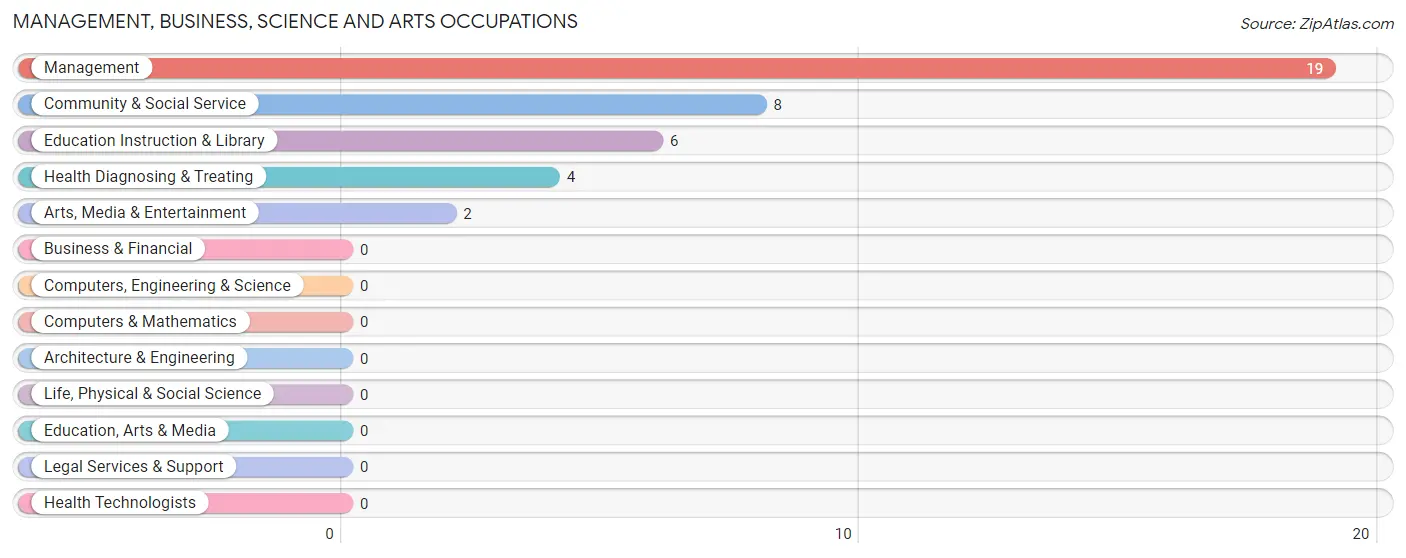
Management, Business, Science and Arts Occupations
The most common Management, Business, Science and Arts occupations in Yaak are Management (19 | 24.0%), Community & Social Service (8 | 10.1%), Education Instruction & Library (6 | 7.6%), Health Diagnosing & Treating (4 | 5.1%), and Arts, Media & Entertainment (2 | 2.5%).
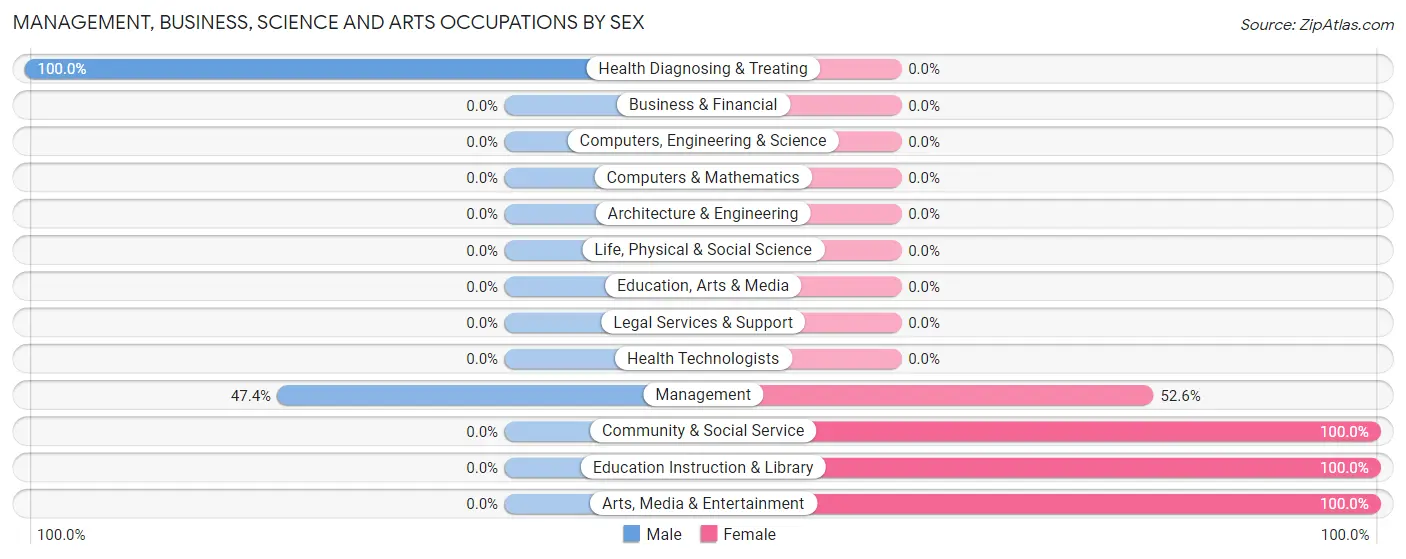
Management, Business, Science and Arts Occupations by Sex
Within the Management, Business, Science and Arts occupations in Yaak, the most male-oriented occupations are Health Diagnosing & Treating (100.0%), and Management (47.4%), while the most female-oriented occupations are Community & Social Service (100.0%), Education Instruction & Library (100.0%), and Arts, Media & Entertainment (100.0%).
| Occupation | Male | Female |
| Management | 9 (47.4%) | 10 (52.6%) |
| Business & Financial | 0 (0.0%) | 0 (0.0%) |
| Computers, Engineering & Science | 0 (0.0%) | 0 (0.0%) |
| Computers & Mathematics | 0 (0.0%) | 0 (0.0%) |
| Architecture & Engineering | 0 (0.0%) | 0 (0.0%) |
| Life, Physical & Social Science | 0 (0.0%) | 0 (0.0%) |
| Community & Social Service | 0 (0.0%) | 8 (100.0%) |
| Education, Arts & Media | 0 (0.0%) | 0 (0.0%) |
| Legal Services & Support | 0 (0.0%) | 0 (0.0%) |
| Education Instruction & Library | 0 (0.0%) | 6 (100.0%) |
| Arts, Media & Entertainment | 0 (0.0%) | 2 (100.0%) |
| Health Diagnosing & Treating | 4 (100.0%) | 0 (0.0%) |
| Health Technologists | 0 (0.0%) | 0 (0.0%) |
| Total (Category) | 13 (41.9%) | 18 (58.1%) |
| Total (Overall) | 34 (43.0%) | 45 (57.0%) |
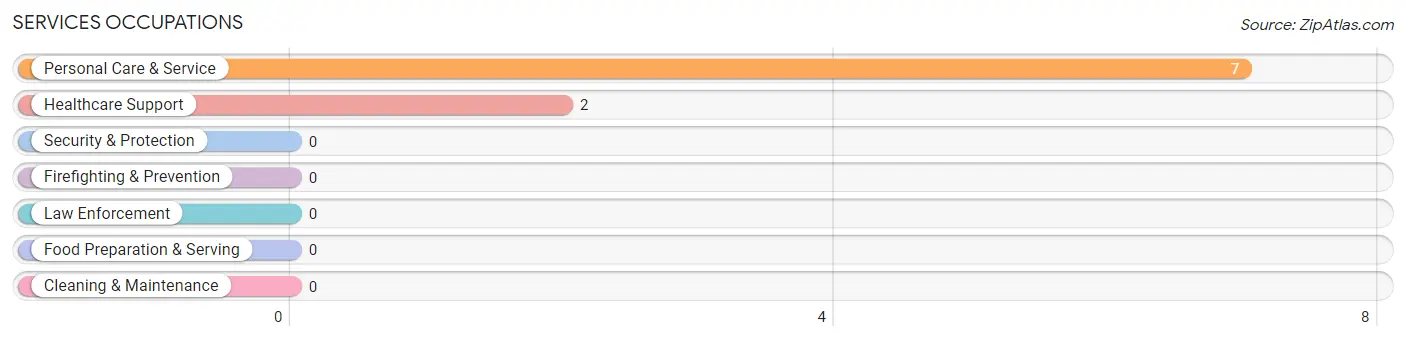
Services Occupations
The most common Services occupations in Yaak are Personal Care & Service (7 | 8.9%), and Healthcare Support (2 | 2.5%).
Services Occupations by Sex
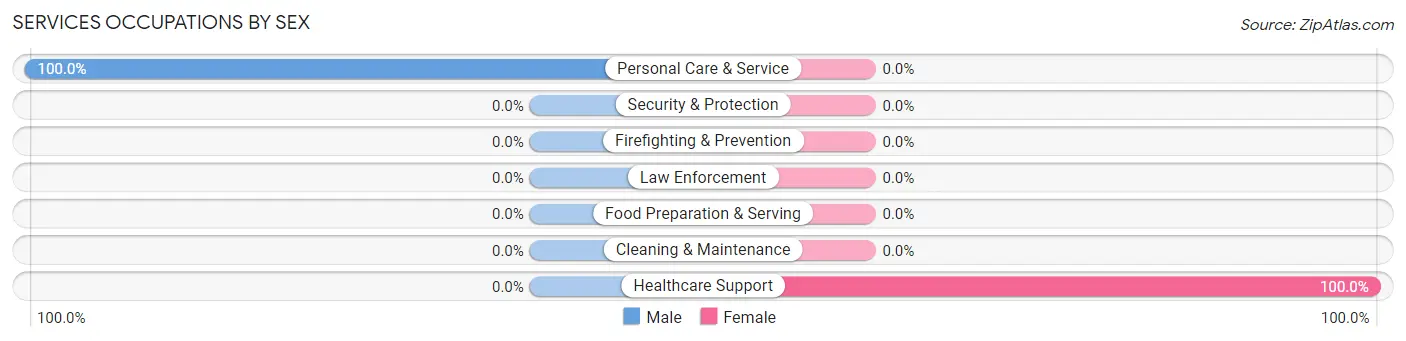
| Occupation | Male | Female |
| Healthcare Support | 0 (0.0%) | 2 (100.0%) |
| Security & Protection | 0 (0.0%) | 0 (0.0%) |
| Firefighting & Prevention | 0 (0.0%) | 0 (0.0%) |
| Law Enforcement | 0 (0.0%) | 0 (0.0%) |
| Food Preparation & Serving | 0 (0.0%) | 0 (0.0%) |
| Cleaning & Maintenance | 0 (0.0%) | 0 (0.0%) |
| Personal Care & Service | 7 (100.0%) | 0 (0.0%) |
| Total (Category) | 7 (77.8%) | 2 (22.2%) |
| Total (Overall) | 34 (43.0%) | 45 (57.0%) |
Sales and Office Occupations
The most common Sales and Office occupations in Yaak are Office & Administration (25 | 31.7%), and Sales & Related (7 | 8.9%).
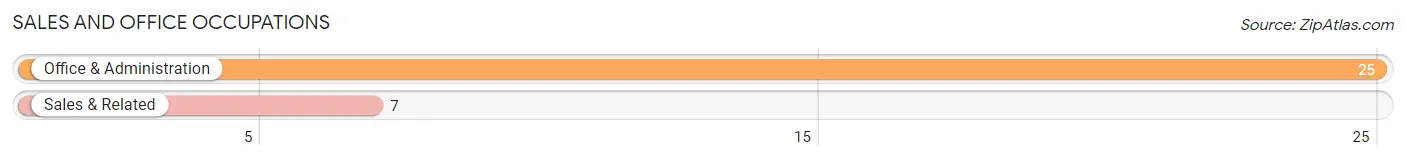
Sales and Office Occupations by Sex
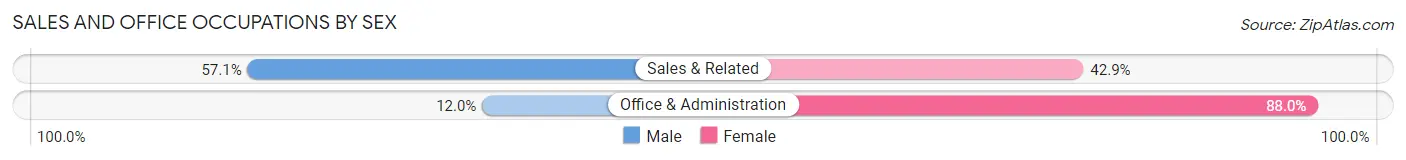
| Occupation | Male | Female |
| Sales & Related | 4 (57.1%) | 3 (42.9%) |
| Office & Administration | 3 (12.0%) | 22 (88.0%) |
| Total (Category) | 7 (21.9%) | 25 (78.1%) |
| Total (Overall) | 34 (43.0%) | 45 (57.0%) |
Natural Resources, Construction and Maintenance Occupations
The most common Natural Resources, Construction and Maintenance occupations in Yaak are , and Construction & Extraction (4 | 5.1%).
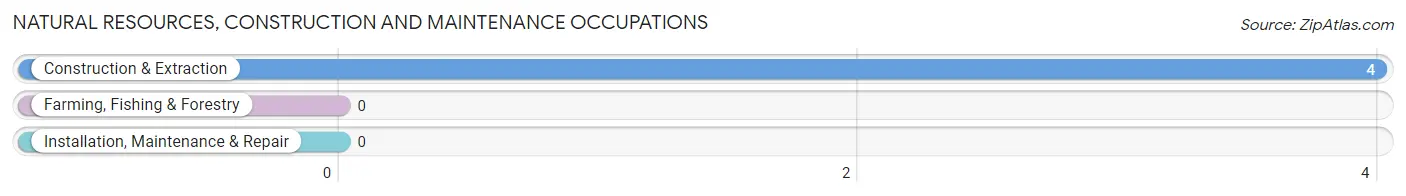
Natural Resources, Construction and Maintenance Occupations by Sex
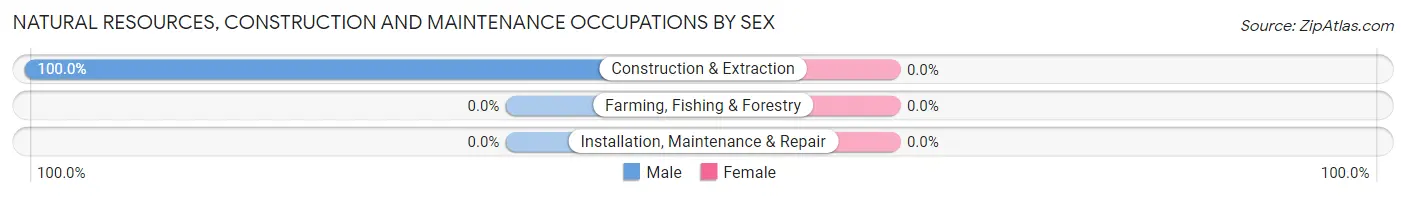
| Occupation | Male | Female |
| Farming, Fishing & Forestry | 0 (0.0%) | 0 (0.0%) |
| Construction & Extraction | 4 (100.0%) | 0 (0.0%) |
| Installation, Maintenance & Repair | 0 (0.0%) | 0 (0.0%) |
| Total (Category) | 4 (100.0%) | 0 (0.0%) |
| Total (Overall) | 34 (43.0%) | 45 (57.0%) |
Production, Transportation and Moving Occupations
The most common Production, Transportation and Moving occupations in Yaak are , and Transportation (3 | 3.8%).
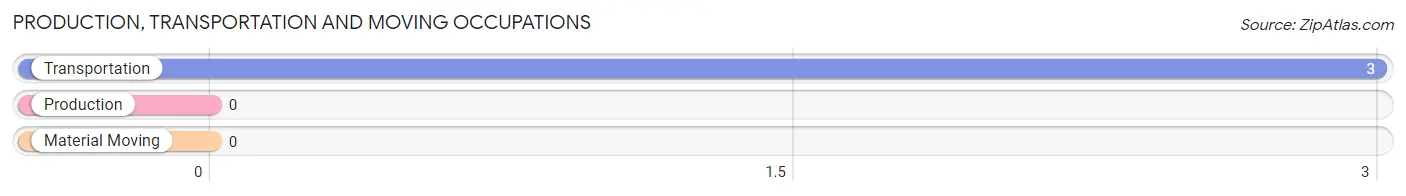
Production, Transportation and Moving Occupations by Sex
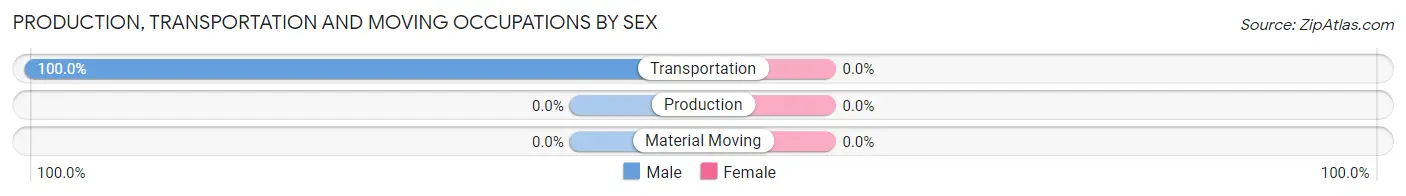
| Occupation | Male | Female |
| Production | 0 (0.0%) | 0 (0.0%) |
| Transportation | 3 (100.0%) | 0 (0.0%) |
| Material Moving | 0 (0.0%) | 0 (0.0%) |
| Total (Category) | 3 (100.0%) | 0 (0.0%) |
| Total (Overall) | 34 (43.0%) | 45 (57.0%) |
Employment Industries by Sex in Yaak
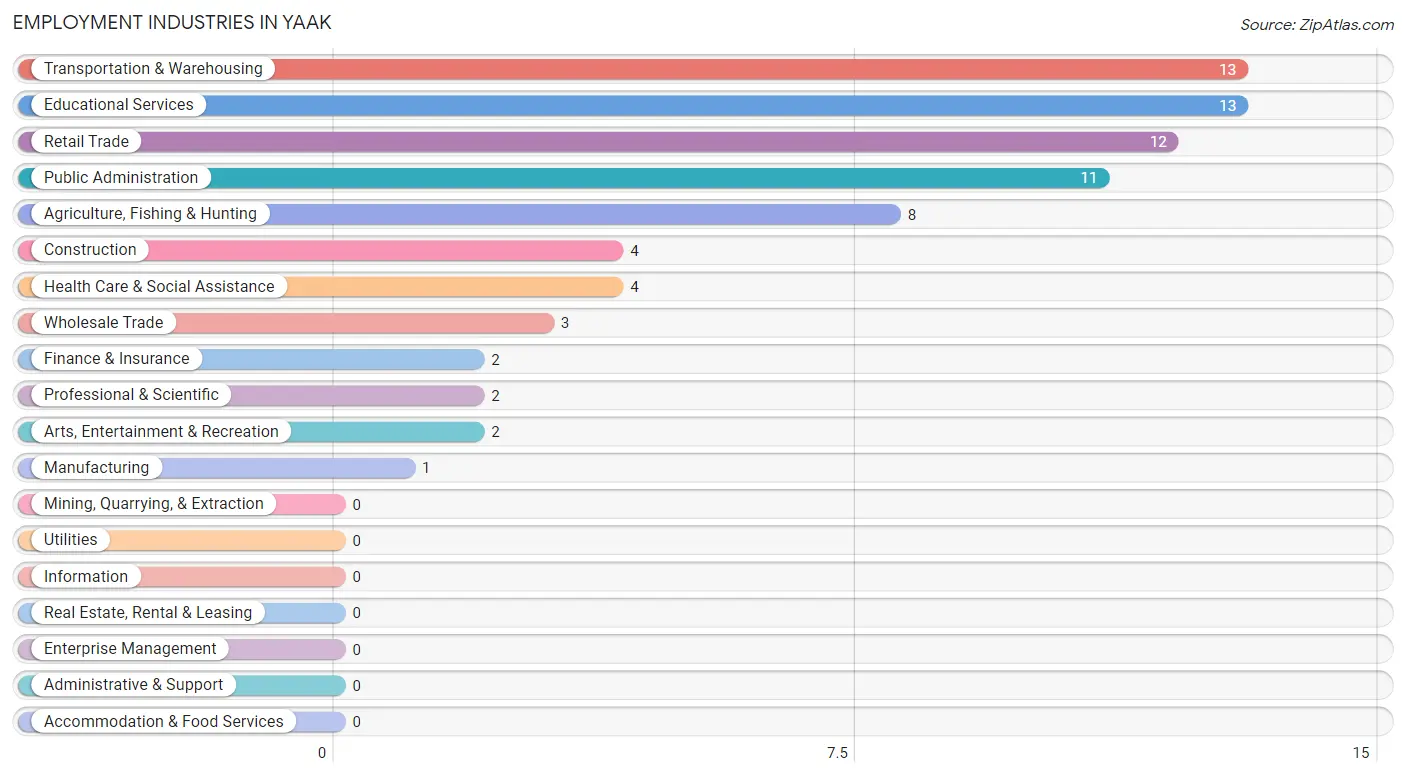
Employment Industries in Yaak
The major employment industries in Yaak include Transportation & Warehousing (13 | 16.5%), Educational Services (13 | 16.5%), Retail Trade (12 | 15.2%), Public Administration (11 | 13.9%), and Agriculture, Fishing & Hunting (8 | 10.1%).
Employment Industries by Sex in Yaak
The Yaak industries that see more men than women are Construction (100.0%), Manufacturing (100.0%), and Wholesale Trade (100.0%), whereas the industries that tend to have a higher number of women are Finance & Insurance (100.0%), Professional & Scientific (100.0%), and Public Administration (100.0%).
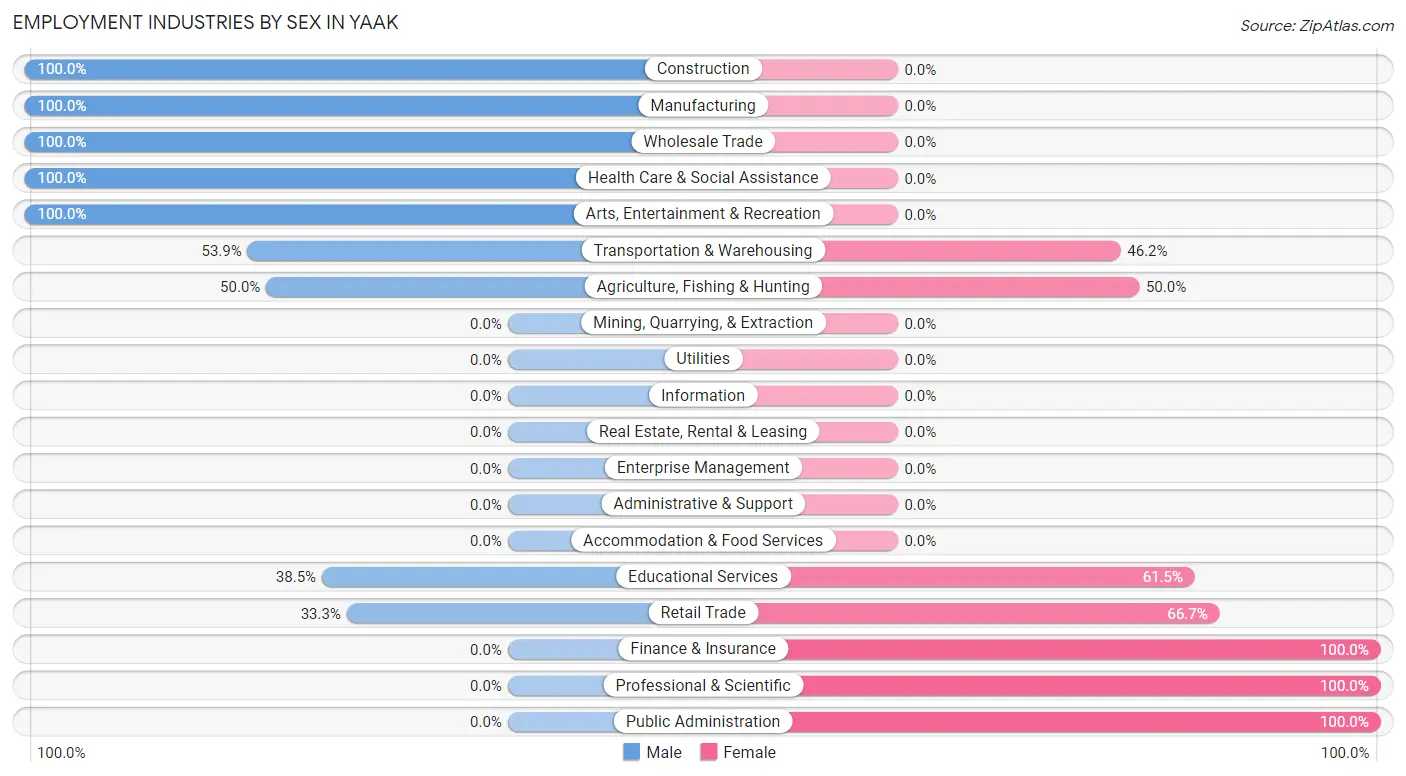
| Industry | Male | Female |
| Agriculture, Fishing & Hunting | 4 (50.0%) | 4 (50.0%) |
| Mining, Quarrying, & Extraction | 0 (0.0%) | 0 (0.0%) |
| Construction | 4 (100.0%) | 0 (0.0%) |
| Manufacturing | 1 (100.0%) | 0 (0.0%) |
| Wholesale Trade | 3 (100.0%) | 0 (0.0%) |
| Retail Trade | 4 (33.3%) | 8 (66.7%) |
| Transportation & Warehousing | 7 (53.8%) | 6 (46.2%) |
| Utilities | 0 (0.0%) | 0 (0.0%) |
| Information | 0 (0.0%) | 0 (0.0%) |
| Finance & Insurance | 0 (0.0%) | 2 (100.0%) |
| Real Estate, Rental & Leasing | 0 (0.0%) | 0 (0.0%) |
| Professional & Scientific | 0 (0.0%) | 2 (100.0%) |
| Enterprise Management | 0 (0.0%) | 0 (0.0%) |
| Administrative & Support | 0 (0.0%) | 0 (0.0%) |
| Educational Services | 5 (38.5%) | 8 (61.5%) |
| Health Care & Social Assistance | 4 (100.0%) | 0 (0.0%) |
| Arts, Entertainment & Recreation | 2 (100.0%) | 0 (0.0%) |
| Accommodation & Food Services | 0 (0.0%) | 0 (0.0%) |
| Public Administration | 0 (0.0%) | 11 (100.0%) |
| Total | 34 (43.0%) | 45 (57.0%) |
Education in Yaak
School Enrollment in Yaak
The most common levels of schooling among the 36 students in Yaak are middle school (18 | 50.0%), elementary school (16 | 44.4%), and high school (2 | 5.6%).
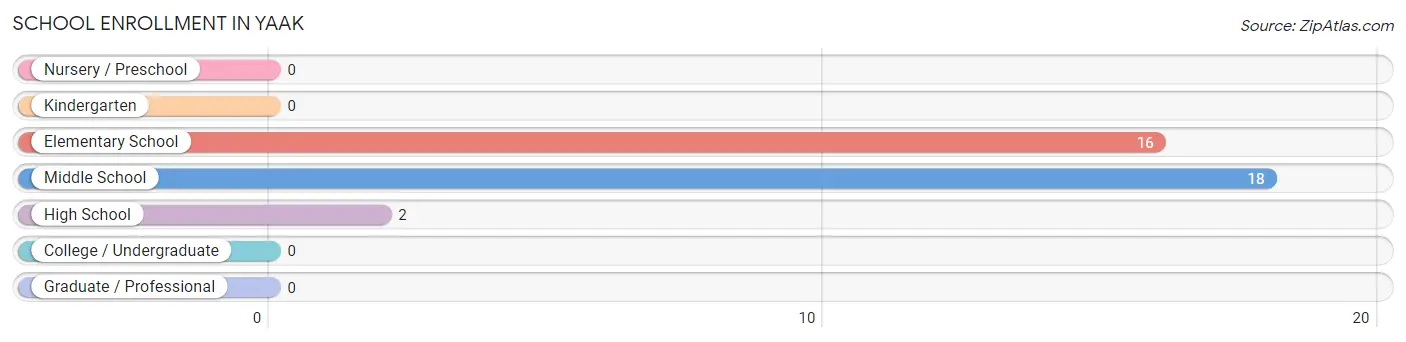
| School Level | # Students | % Students |
| Nursery / Preschool | 0 | 0.0% |
| Kindergarten | 0 | 0.0% |
| Elementary School | 16 | 44.4% |
| Middle School | 18 | 50.0% |
| High School | 2 | 5.6% |
| College / Undergraduate | 0 | 0.0% |
| Graduate / Professional | 0 | 0.0% |
| Total | 36 | 100.0% |
School Enrollment by Age by Funding Source in Yaak
Out of a total of 36 students who are enrolled in schools in Yaak, 23 (63.9%) attend a private institution, while the remaining 13 (36.1%) are enrolled in public schools. The age group of 5 to 9 year old has the highest likelihood of being enrolled in private schools, with 15 (83.3% in the age bracket) enrolled. Conversely, the age group of 18 to 19 year olds has the lowest likelihood of being enrolled in a private school, with 1 (100.0% in the age bracket) attending a public institution.
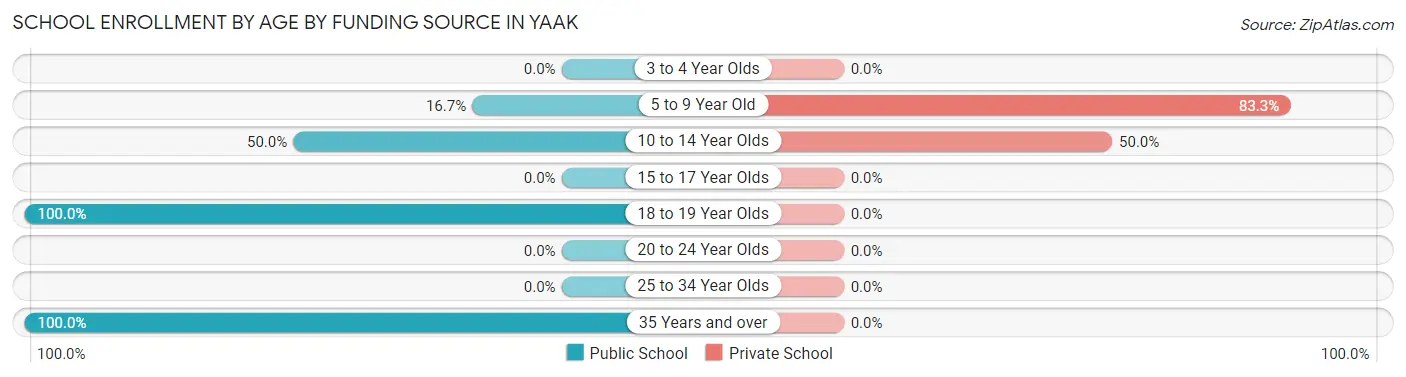
| Age Bracket | Public School | Private School |
| 3 to 4 Year Olds | 0 (0.0%) | 0 (0.0%) |
| 5 to 9 Year Old | 3 (16.7%) | 15 (83.3%) |
| 10 to 14 Year Olds | 8 (50.0%) | 8 (50.0%) |
| 15 to 17 Year Olds | 0 (0.0%) | 0 (0.0%) |
| 18 to 19 Year Olds | 1 (100.0%) | 0 (0.0%) |
| 20 to 24 Year Olds | 0 (0.0%) | 0 (0.0%) |
| 25 to 34 Year Olds | 0 (0.0%) | 0 (0.0%) |
| 35 Years and over | 1 (100.0%) | 0 (0.0%) |
| Total | 13 (36.1%) | 23 (63.9%) |
Educational Attainment by Field of Study in Yaak
Bio, nature & agricultural (16 | 28.6%), education (11 | 19.6%), liberal arts & history (10 | 17.9%), physical & health sciences (6 | 10.7%), and business (4 | 7.1%) are the most common fields of study among 56 individuals in Yaak who have obtained a bachelor's degree or higher.
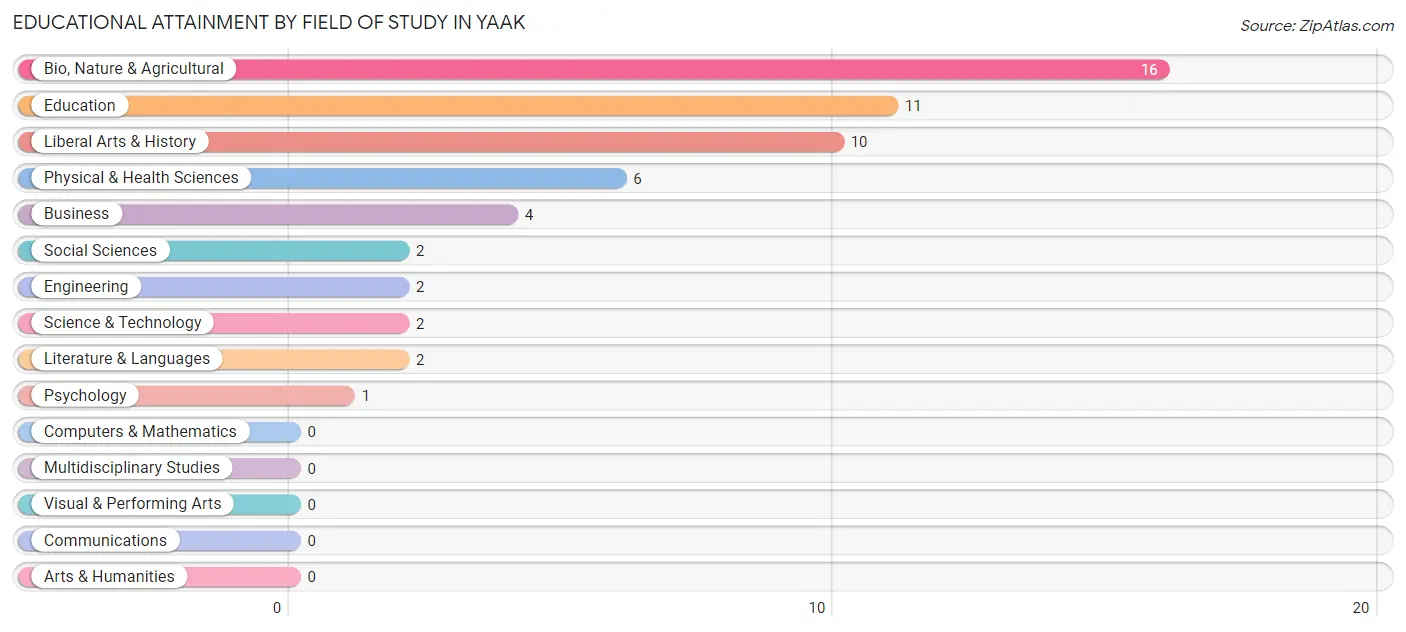
| Field of Study | # Graduates | % Graduates |
| Computers & Mathematics | 0 | 0.0% |
| Bio, Nature & Agricultural | 16 | 28.6% |
| Physical & Health Sciences | 6 | 10.7% |
| Psychology | 1 | 1.8% |
| Social Sciences | 2 | 3.6% |
| Engineering | 2 | 3.6% |
| Multidisciplinary Studies | 0 | 0.0% |
| Science & Technology | 2 | 3.6% |
| Business | 4 | 7.1% |
| Education | 11 | 19.6% |
| Literature & Languages | 2 | 3.6% |
| Liberal Arts & History | 10 | 17.9% |
| Visual & Performing Arts | 0 | 0.0% |
| Communications | 0 | 0.0% |
| Arts & Humanities | 0 | 0.0% |
| Total | 56 | 100.0% |
Transportation & Commute in Yaak
Vehicle Availability by Sex in Yaak
The most prevalent vehicle ownership categories in Yaak are males with 2 vehicles (18, accounting for 52.9%) and females with 2 vehicles (29, making up 41.9%).
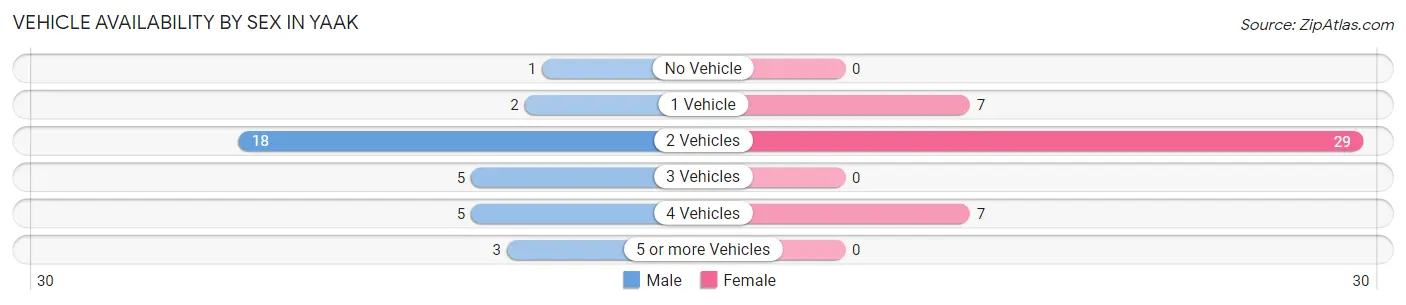
| Vehicles Available | Male | Female |
| No Vehicle | 1 (2.9%) | 0 (0.0%) |
| 1 Vehicle | 2 (5.9%) | 7 (16.3%) |
| 2 Vehicles | 18 (52.9%) | 29 (67.4%) |
| 3 Vehicles | 5 (14.7%) | 0 (0.0%) |
| 4 Vehicles | 5 (14.7%) | 7 (16.3%) |
| 5 or more Vehicles | 3 (8.8%) | 0 (0.0%) |
| Total | 34 (100.0%) | 43 (100.0%) |
Commute Time in Yaak
The most frequently occuring commute durations in Yaak are less than 5 minutes (14 commuters, 30.4%), 10 to 14 minutes (13 commuters, 28.3%), and 5 to 9 minutes (6 commuters, 13.0%).
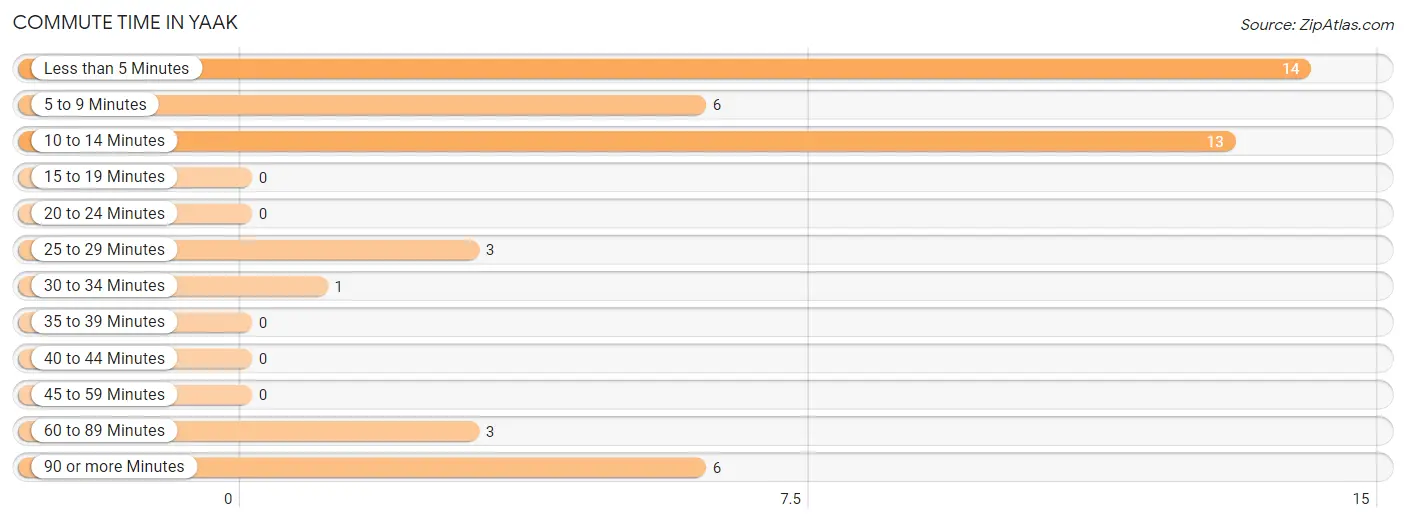
| Commute Time | # Commuters | % Commuters |
| Less than 5 Minutes | 14 | 30.4% |
| 5 to 9 Minutes | 6 | 13.0% |
| 10 to 14 Minutes | 13 | 28.3% |
| 15 to 19 Minutes | 0 | 0.0% |
| 20 to 24 Minutes | 0 | 0.0% |
| 25 to 29 Minutes | 3 | 6.5% |
| 30 to 34 Minutes | 1 | 2.2% |
| 35 to 39 Minutes | 0 | 0.0% |
| 40 to 44 Minutes | 0 | 0.0% |
| 45 to 59 Minutes | 0 | 0.0% |
| 60 to 89 Minutes | 3 | 6.5% |
| 90 or more Minutes | 6 | 13.0% |
Commute Time by Sex in Yaak
The most common commute times in Yaak are 5 to 9 minutes (6 commuters, 25.0%) for males and 10 to 14 minutes (13 commuters, 59.1%) for females.
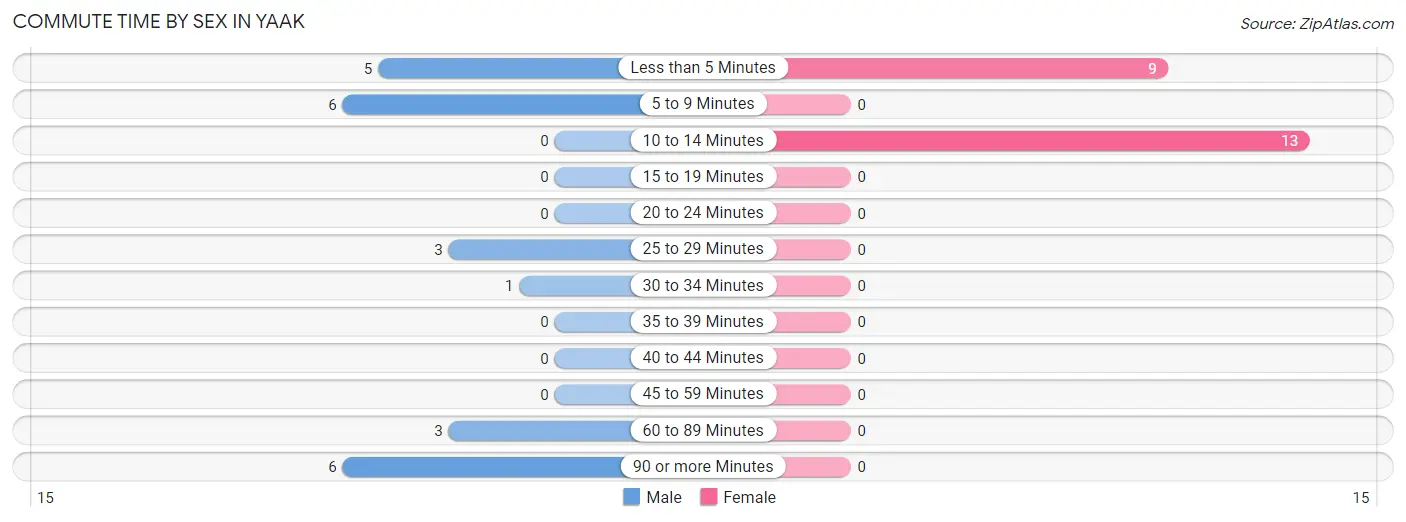
| Commute Time | Male | Female |
| Less than 5 Minutes | 5 (20.8%) | 9 (40.9%) |
| 5 to 9 Minutes | 6 (25.0%) | 0 (0.0%) |
| 10 to 14 Minutes | 0 (0.0%) | 13 (59.1%) |
| 15 to 19 Minutes | 0 (0.0%) | 0 (0.0%) |
| 20 to 24 Minutes | 0 (0.0%) | 0 (0.0%) |
| 25 to 29 Minutes | 3 (12.5%) | 0 (0.0%) |
| 30 to 34 Minutes | 1 (4.2%) | 0 (0.0%) |
| 35 to 39 Minutes | 0 (0.0%) | 0 (0.0%) |
| 40 to 44 Minutes | 0 (0.0%) | 0 (0.0%) |
| 45 to 59 Minutes | 0 (0.0%) | 0 (0.0%) |
| 60 to 89 Minutes | 3 (12.5%) | 0 (0.0%) |
| 90 or more Minutes | 6 (25.0%) | 0 (0.0%) |
Time of Departure to Work by Sex in Yaak
The most frequent times of departure to work in Yaak are 8:00 AM to 8:29 AM (9, 37.5%) for males and 7:00 AM to 7:29 AM (9, 40.9%) for females.
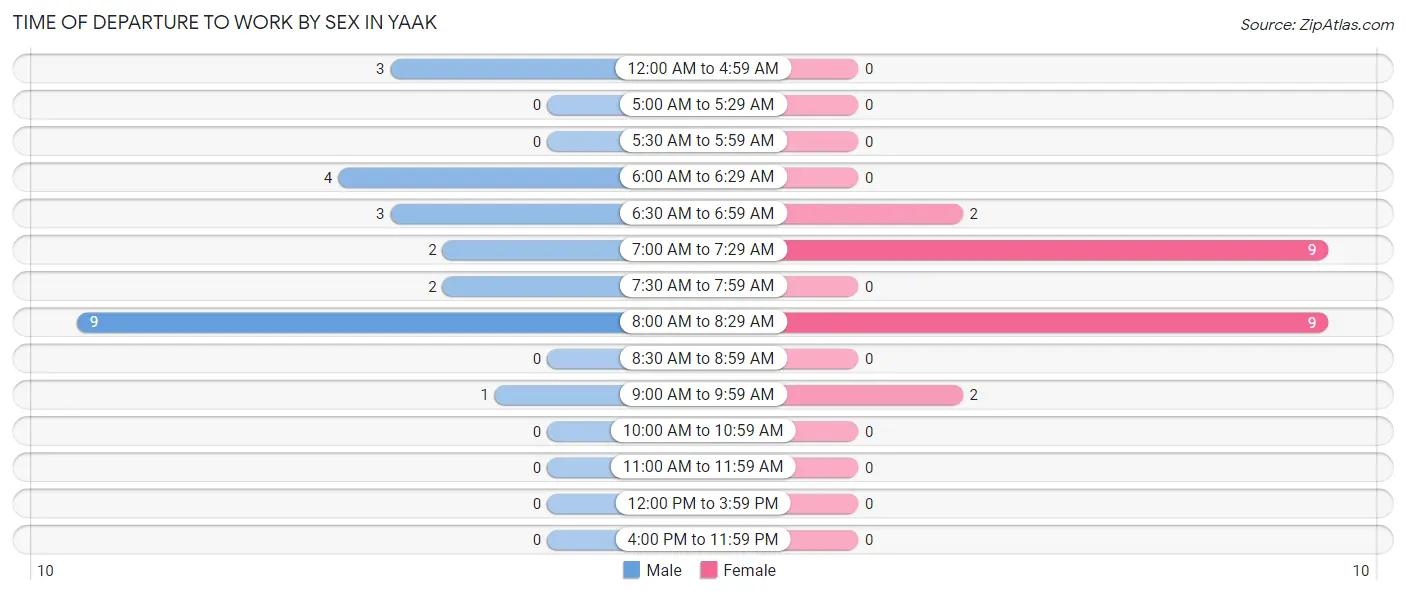
| Time of Departure | Male | Female |
| 12:00 AM to 4:59 AM | 3 (12.5%) | 0 (0.0%) |
| 5:00 AM to 5:29 AM | 0 (0.0%) | 0 (0.0%) |
| 5:30 AM to 5:59 AM | 0 (0.0%) | 0 (0.0%) |
| 6:00 AM to 6:29 AM | 4 (16.7%) | 0 (0.0%) |
| 6:30 AM to 6:59 AM | 3 (12.5%) | 2 (9.1%) |
| 7:00 AM to 7:29 AM | 2 (8.3%) | 9 (40.9%) |
| 7:30 AM to 7:59 AM | 2 (8.3%) | 0 (0.0%) |
| 8:00 AM to 8:29 AM | 9 (37.5%) | 9 (40.9%) |
| 8:30 AM to 8:59 AM | 0 (0.0%) | 0 (0.0%) |
| 9:00 AM to 9:59 AM | 1 (4.2%) | 2 (9.1%) |
| 10:00 AM to 10:59 AM | 0 (0.0%) | 0 (0.0%) |
| 11:00 AM to 11:59 AM | 0 (0.0%) | 0 (0.0%) |
| 12:00 PM to 3:59 PM | 0 (0.0%) | 0 (0.0%) |
| 4:00 PM to 11:59 PM | 0 (0.0%) | 0 (0.0%) |
| Total | 24 (100.0%) | 22 (100.0%) |
Housing Occupancy in Yaak
Occupancy by Ownership in Yaak
Of the total 147 dwellings in Yaak, owner-occupied units account for 139 (94.6%), while renter-occupied units make up 8 (5.4%).
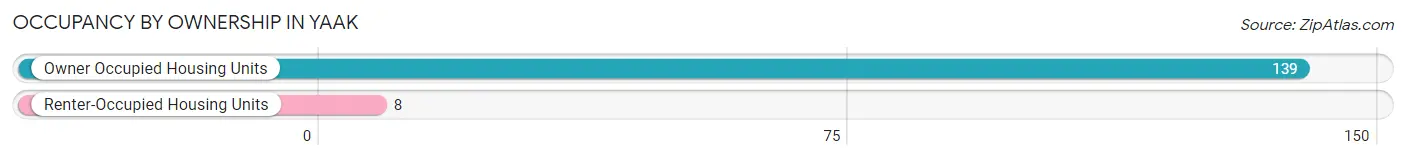
| Occupancy | # Housing Units | % Housing Units |
| Owner Occupied Housing Units | 139 | 94.6% |
| Renter-Occupied Housing Units | 8 | 5.4% |
| Total Occupied Housing Units | 147 | 100.0% |
Occupancy by Household Size in Yaak
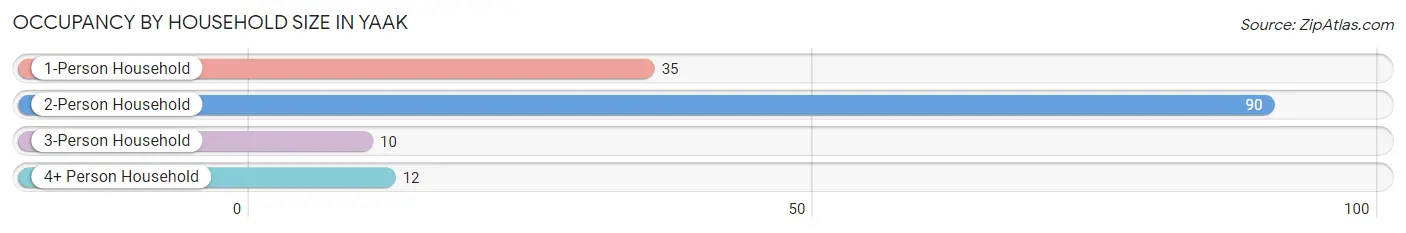
| Household Size | # Housing Units | % Housing Units |
| 1-Person Household | 35 | 23.8% |
| 2-Person Household | 90 | 61.2% |
| 3-Person Household | 10 | 6.8% |
| 4+ Person Household | 12 | 8.2% |
| Total Housing Units | 147 | 100.0% |
Occupancy by Ownership by Household Size in Yaak
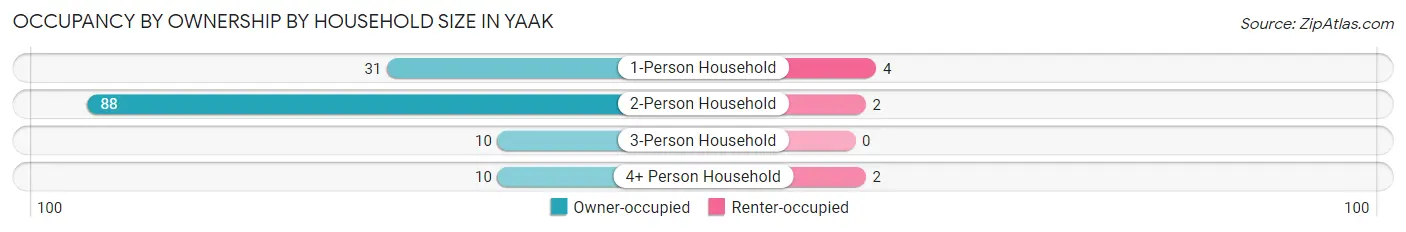
| Household Size | Owner-occupied | Renter-occupied |
| 1-Person Household | 31 (88.6%) | 4 (11.4%) |
| 2-Person Household | 88 (97.8%) | 2 (2.2%) |
| 3-Person Household | 10 (100.0%) | 0 (0.0%) |
| 4+ Person Household | 10 (83.3%) | 2 (16.7%) |
| Total Housing Units | 139 (94.6%) | 8 (5.4%) |
Occupancy by Educational Attainment in Yaak
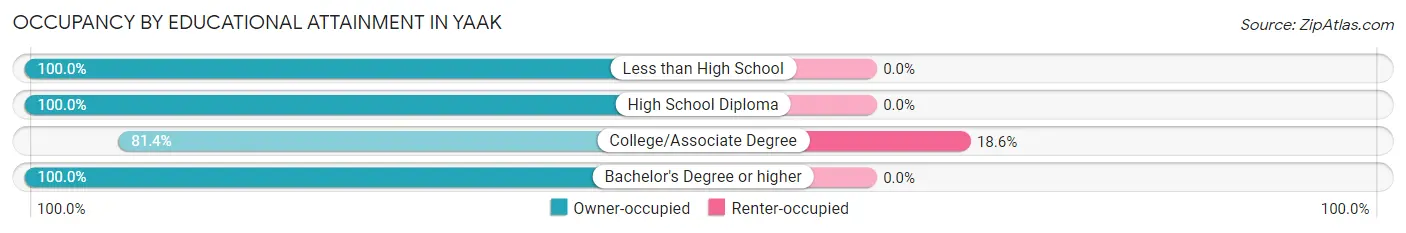
| Household Size | Owner-occupied | Renter-occupied |
| Less than High School | 6 (100.0%) | 0 (0.0%) |
| High School Diploma | 64 (100.0%) | 0 (0.0%) |
| College/Associate Degree | 35 (81.4%) | 8 (18.6%) |
| Bachelor's Degree or higher | 34 (100.0%) | 0 (0.0%) |
Occupancy by Age of Householder in Yaak
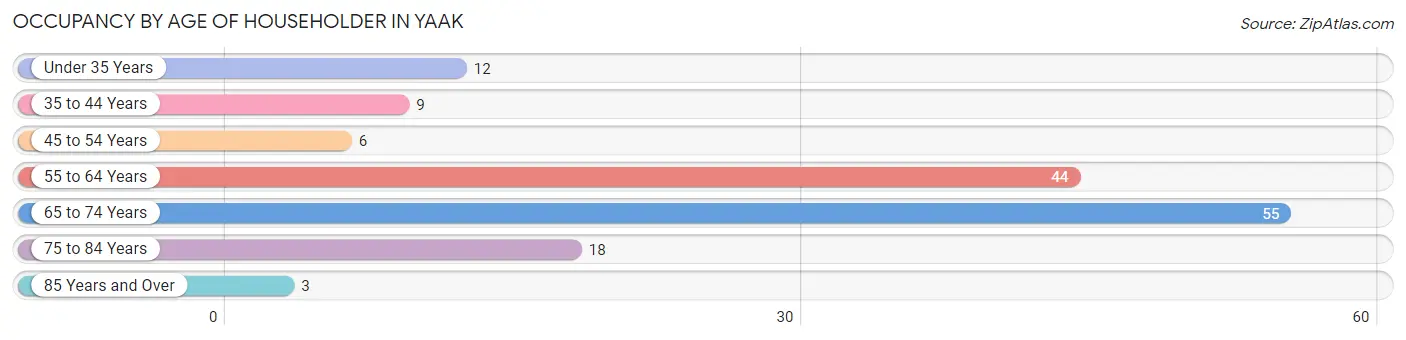
| Age Bracket | # Households | % Households |
| Under 35 Years | 12 | 8.2% |
| 35 to 44 Years | 9 | 6.1% |
| 45 to 54 Years | 6 | 4.1% |
| 55 to 64 Years | 44 | 29.9% |
| 65 to 74 Years | 55 | 37.4% |
| 75 to 84 Years | 18 | 12.2% |
| 85 Years and Over | 3 | 2.0% |
| Total | 147 | 100.0% |
Housing Finances in Yaak
Median Income by Occupancy in Yaak
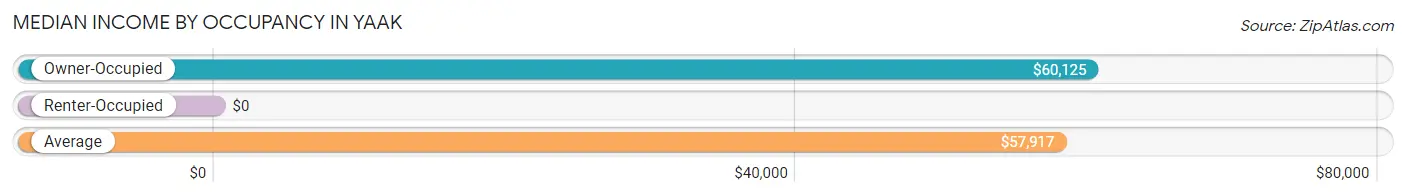
| Occupancy Type | # Households | Median Income |
| Owner-Occupied | 139 (94.6%) | $60,125 |
| Renter-Occupied | 8 (5.4%) | $0 |
| Average | 147 (100.0%) | $57,917 |
Occupancy by Householder Income Bracket in Yaak
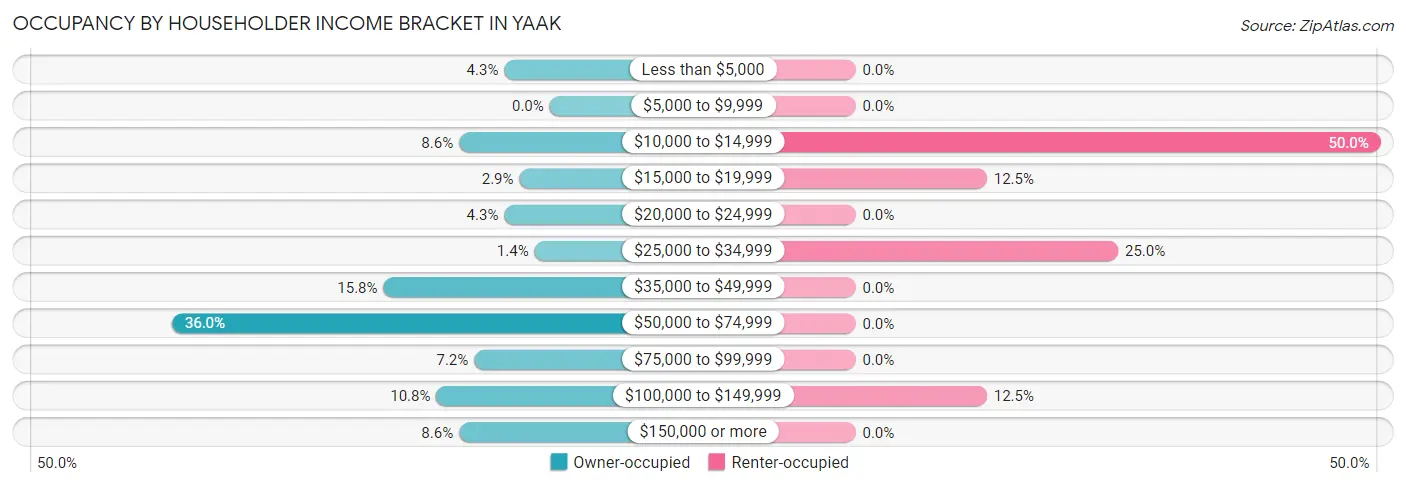
| Income Bracket | Owner-occupied | Renter-occupied |
| Less than $5,000 | 6 (4.3%) | 0 (0.0%) |
| $5,000 to $9,999 | 0 (0.0%) | 0 (0.0%) |
| $10,000 to $14,999 | 12 (8.6%) | 4 (50.0%) |
| $15,000 to $19,999 | 4 (2.9%) | 1 (12.5%) |
| $20,000 to $24,999 | 6 (4.3%) | 0 (0.0%) |
| $25,000 to $34,999 | 2 (1.4%) | 2 (25.0%) |
| $35,000 to $49,999 | 22 (15.8%) | 0 (0.0%) |
| $50,000 to $74,999 | 50 (36.0%) | 0 (0.0%) |
| $75,000 to $99,999 | 10 (7.2%) | 0 (0.0%) |
| $100,000 to $149,999 | 15 (10.8%) | 1 (12.5%) |
| $150,000 or more | 12 (8.6%) | 0 (0.0%) |
| Total | 139 (100.0%) | 8 (100.0%) |
Monthly Housing Cost Tiers in Yaak
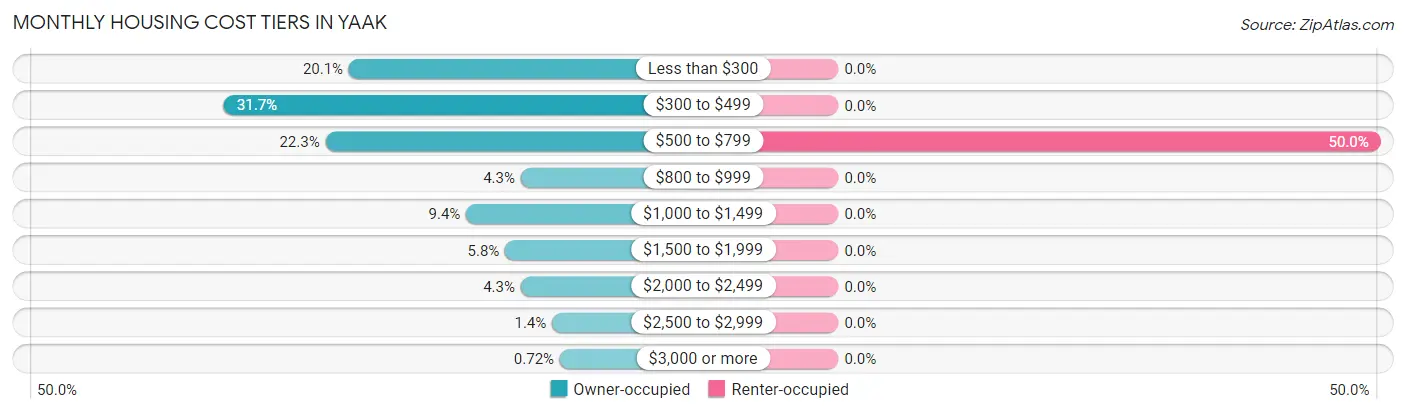
| Monthly Cost | Owner-occupied | Renter-occupied |
| Less than $300 | 28 (20.1%) | 0 (0.0%) |
| $300 to $499 | 44 (31.7%) | 0 (0.0%) |
| $500 to $799 | 31 (22.3%) | 4 (50.0%) |
| $800 to $999 | 6 (4.3%) | 0 (0.0%) |
| $1,000 to $1,499 | 13 (9.3%) | 0 (0.0%) |
| $1,500 to $1,999 | 8 (5.8%) | 0 (0.0%) |
| $2,000 to $2,499 | 6 (4.3%) | 0 (0.0%) |
| $2,500 to $2,999 | 2 (1.4%) | 0 (0.0%) |
| $3,000 or more | 1 (0.7%) | 0 (0.0%) |
| Total | 139 (100.0%) | 8 (100.0%) |
Physical Housing Characteristics in Yaak
Housing Structures in Yaak
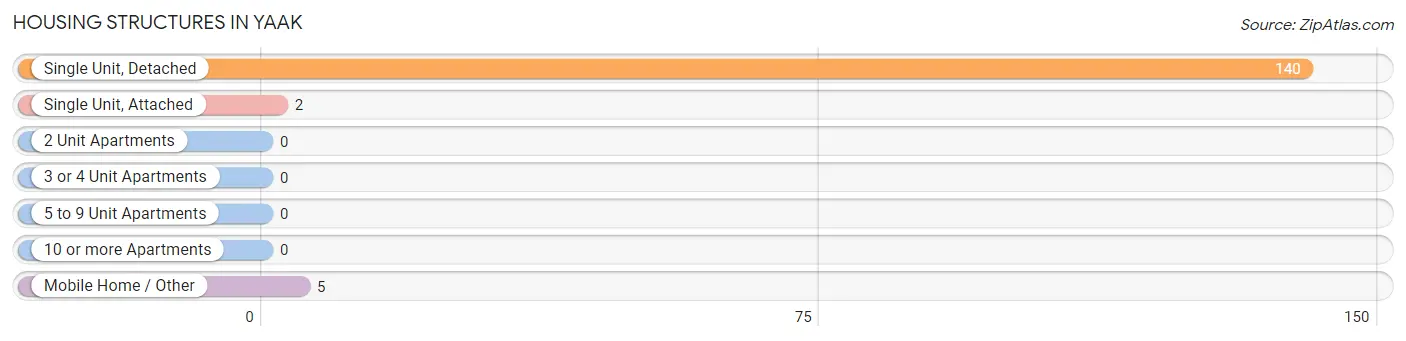
| Structure Type | # Housing Units | % Housing Units |
| Single Unit, Detached | 140 | 95.2% |
| Single Unit, Attached | 2 | 1.4% |
| 2 Unit Apartments | 0 | 0.0% |
| 3 or 4 Unit Apartments | 0 | 0.0% |
| 5 to 9 Unit Apartments | 0 | 0.0% |
| 10 or more Apartments | 0 | 0.0% |
| Mobile Home / Other | 5 | 3.4% |
| Total | 147 | 100.0% |
Housing Structures by Occupancy in Yaak
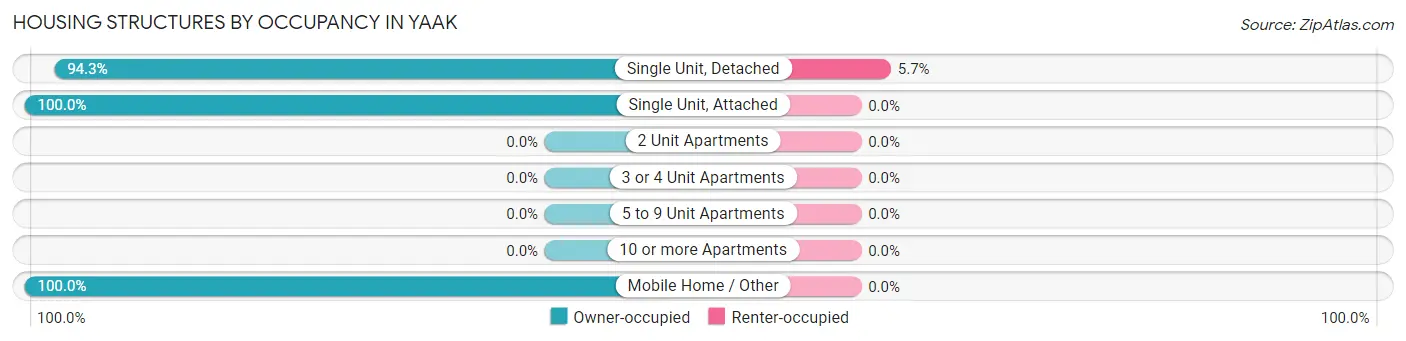
| Structure Type | Owner-occupied | Renter-occupied |
| Single Unit, Detached | 132 (94.3%) | 8 (5.7%) |
| Single Unit, Attached | 2 (100.0%) | 0 (0.0%) |
| 2 Unit Apartments | 0 (0.0%) | 0 (0.0%) |
| 3 or 4 Unit Apartments | 0 (0.0%) | 0 (0.0%) |
| 5 to 9 Unit Apartments | 0 (0.0%) | 0 (0.0%) |
| 10 or more Apartments | 0 (0.0%) | 0 (0.0%) |
| Mobile Home / Other | 5 (100.0%) | 0 (0.0%) |
| Total | 139 (94.6%) | 8 (5.4%) |
Housing Structures by Number of Rooms in Yaak
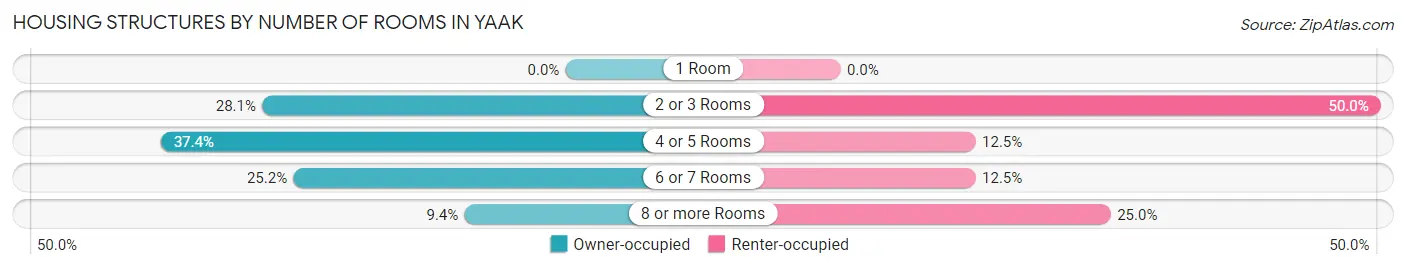
| Number of Rooms | Owner-occupied | Renter-occupied |
| 1 Room | 0 (0.0%) | 0 (0.0%) |
| 2 or 3 Rooms | 39 (28.1%) | 4 (50.0%) |
| 4 or 5 Rooms | 52 (37.4%) | 1 (12.5%) |
| 6 or 7 Rooms | 35 (25.2%) | 1 (12.5%) |
| 8 or more Rooms | 13 (9.3%) | 2 (25.0%) |
| Total | 139 (100.0%) | 8 (100.0%) |
Housing Structure by Heating Type in Yaak
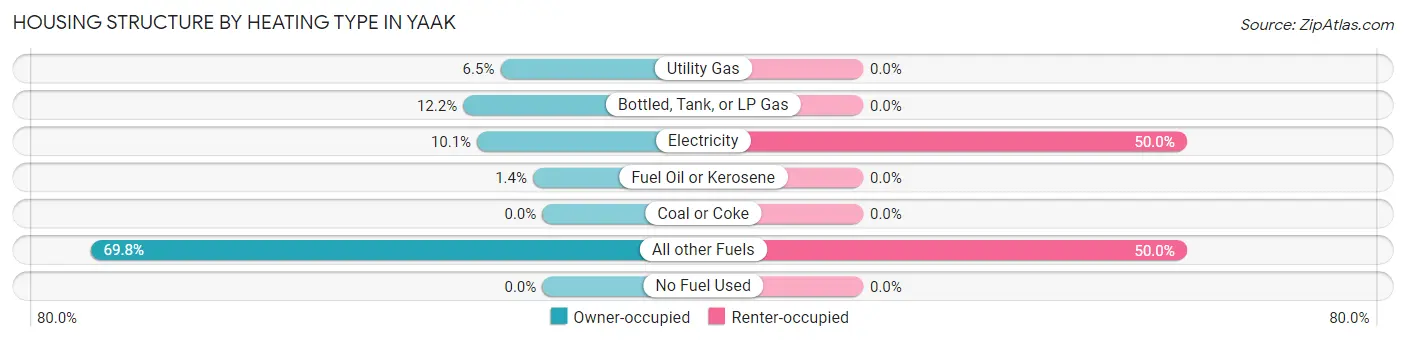
| Heating Type | Owner-occupied | Renter-occupied |
| Utility Gas | 9 (6.5%) | 0 (0.0%) |
| Bottled, Tank, or LP Gas | 17 (12.2%) | 0 (0.0%) |
| Electricity | 14 (10.1%) | 4 (50.0%) |
| Fuel Oil or Kerosene | 2 (1.4%) | 0 (0.0%) |
| Coal or Coke | 0 (0.0%) | 0 (0.0%) |
| All other Fuels | 97 (69.8%) | 4 (50.0%) |
| No Fuel Used | 0 (0.0%) | 0 (0.0%) |
| Total | 139 (100.0%) | 8 (100.0%) |
Household Vehicle Usage in Yaak
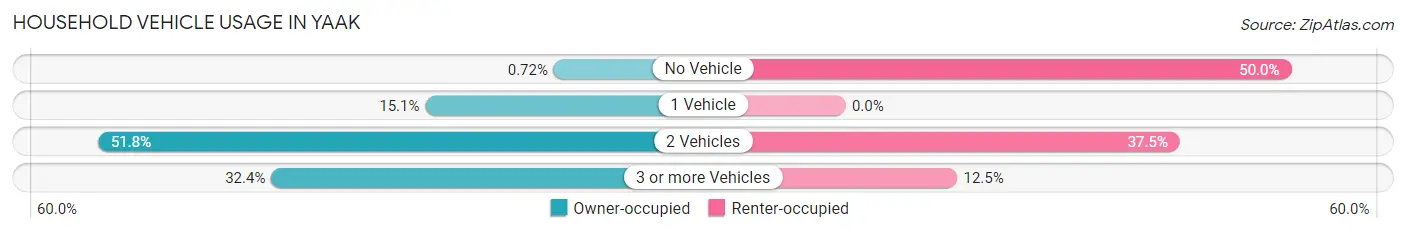
| Vehicles per Household | Owner-occupied | Renter-occupied |
| No Vehicle | 1 (0.7%) | 4 (50.0%) |
| 1 Vehicle | 21 (15.1%) | 0 (0.0%) |
| 2 Vehicles | 72 (51.8%) | 3 (37.5%) |
| 3 or more Vehicles | 45 (32.4%) | 1 (12.5%) |
| Total | 139 (100.0%) | 8 (100.0%) |
Real Estate & Mortgages in Yaak
Real Estate and Mortgage Overview in Yaak
| Characteristic | Without Mortgage | With Mortgage |
| Housing Units | 101 | 38 |
| Median Property Value | $234,700 | $383,300 |
| Median Household Income | $53,750 | $10 |
| Monthly Housing Costs | $404 | $1 |
| Real Estate Taxes | $1,625 | $0 |
Property Value by Mortgage Status in Yaak
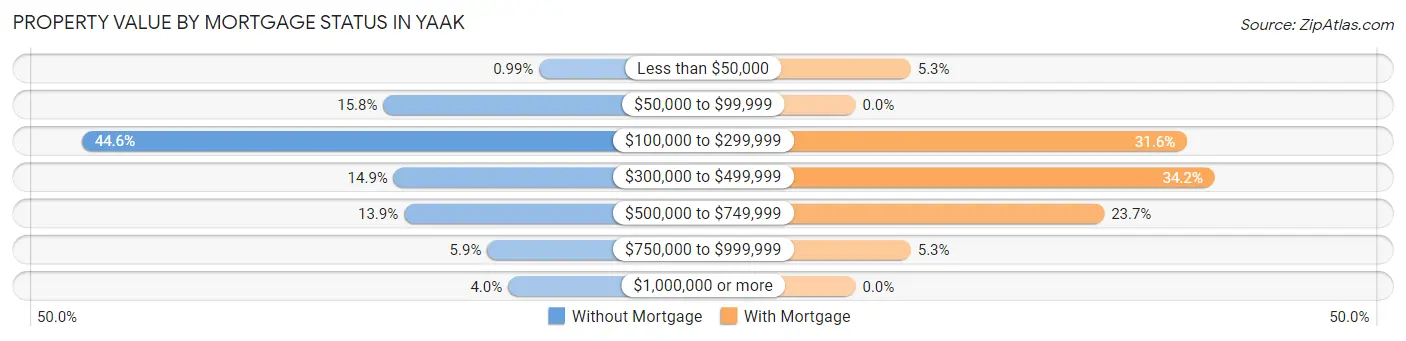
| Property Value | Without Mortgage | With Mortgage |
| Less than $50,000 | 1 (1.0%) | 2 (5.3%) |
| $50,000 to $99,999 | 16 (15.8%) | 0 (0.0%) |
| $100,000 to $299,999 | 45 (44.6%) | 12 (31.6%) |
| $300,000 to $499,999 | 15 (14.8%) | 13 (34.2%) |
| $500,000 to $749,999 | 14 (13.9%) | 9 (23.7%) |
| $750,000 to $999,999 | 6 (5.9%) | 2 (5.3%) |
| $1,000,000 or more | 4 (4.0%) | 0 (0.0%) |
| Total | 101 (100.0%) | 38 (100.0%) |
Household Income by Mortgage Status in Yaak
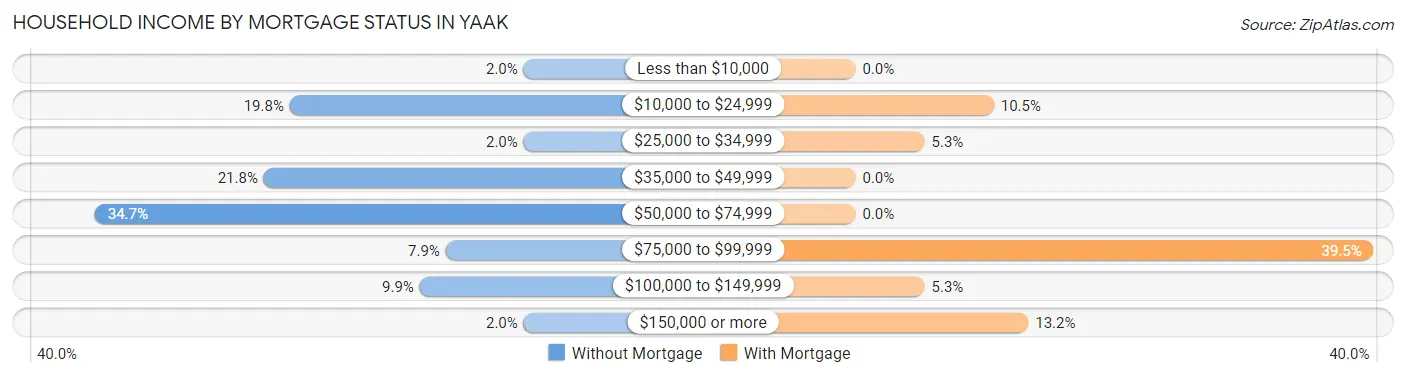
| Household Income | Without Mortgage | With Mortgage |
| Less than $10,000 | 2 (2.0%) | 0 (0.0%) |
| $10,000 to $24,999 | 20 (19.8%) | 4 (10.5%) |
| $25,000 to $34,999 | 2 (2.0%) | 2 (5.3%) |
| $35,000 to $49,999 | 22 (21.8%) | 0 (0.0%) |
| $50,000 to $74,999 | 35 (34.6%) | 0 (0.0%) |
| $75,000 to $99,999 | 8 (7.9%) | 15 (39.5%) |
| $100,000 to $149,999 | 10 (9.9%) | 2 (5.3%) |
| $150,000 or more | 2 (2.0%) | 5 (13.2%) |
| Total | 101 (100.0%) | 38 (100.0%) |
Property Value to Household Income Ratio in Yaak
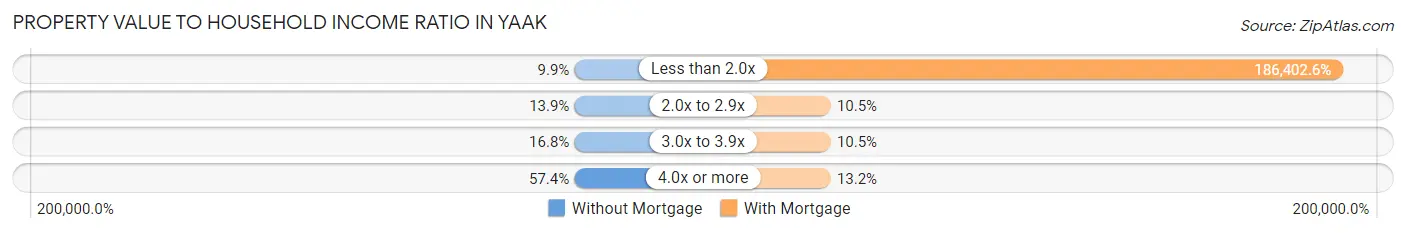
| Value-to-Income Ratio | Without Mortgage | With Mortgage |
| Less than 2.0x | 10 (9.9%) | 70,833 (186,402.6%) |
| 2.0x to 2.9x | 14 (13.9%) | 4 (10.5%) |
| 3.0x to 3.9x | 17 (16.8%) | 4 (10.5%) |
| 4.0x or more | 58 (57.4%) | 5 (13.2%) |
| Total | 101 (100.0%) | 38 (100.0%) |
Real Estate Taxes by Mortgage Status in Yaak
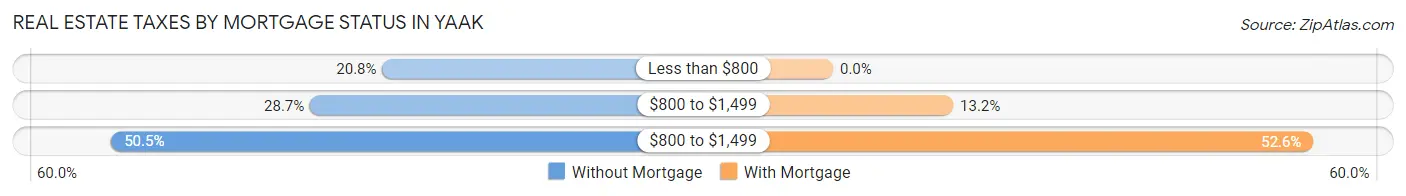
| Property Taxes | Without Mortgage | With Mortgage |
| Less than $800 | 21 (20.8%) | 0 (0.0%) |
| $800 to $1,499 | 29 (28.7%) | 5 (13.2%) |
| $800 to $1,499 | 51 (50.5%) | 20 (52.6%) |
| Total | 101 (100.0%) | 38 (100.0%) |
Health & Disability in Yaak
Health Insurance Coverage by Age in Yaak
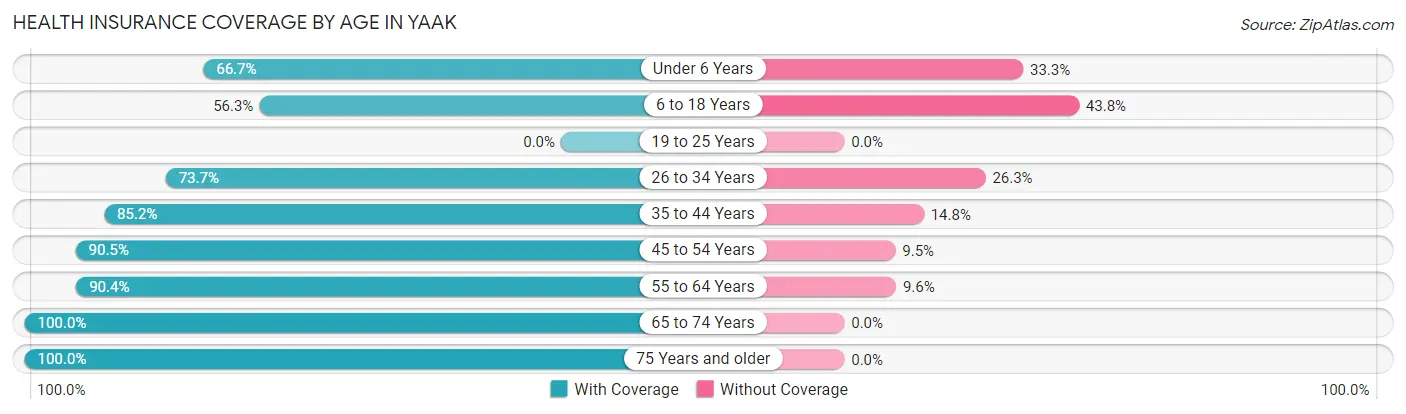
| Age Bracket | With Coverage | Without Coverage |
| Under 6 Years | 6 (66.7%) | 3 (33.3%) |
| 6 to 18 Years | 18 (56.2%) | 14 (43.8%) |
| 19 to 25 Years | 0 (0.0%) | 0 (0.0%) |
| 26 to 34 Years | 14 (73.7%) | 5 (26.3%) |
| 35 to 44 Years | 23 (85.2%) | 4 (14.8%) |
| 45 to 54 Years | 19 (90.5%) | 2 (9.5%) |
| 55 to 64 Years | 75 (90.4%) | 8 (9.6%) |
| 65 to 74 Years | 79 (100.0%) | 0 (0.0%) |
| 75 Years and older | 54 (100.0%) | 0 (0.0%) |
| Total | 288 (88.9%) | 36 (11.1%) |
Health Insurance Coverage by Citizenship Status in Yaak
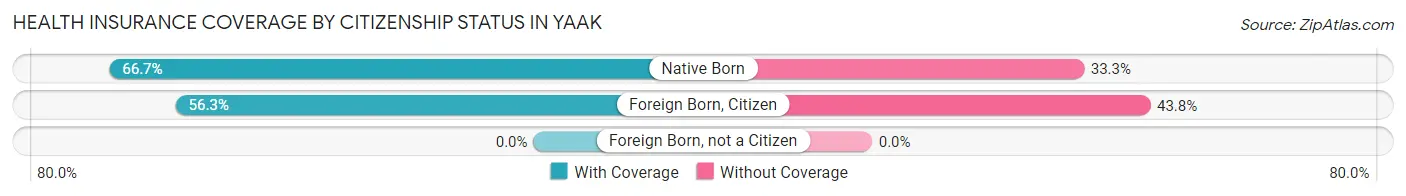
| Citizenship Status | With Coverage | Without Coverage |
| Native Born | 6 (66.7%) | 3 (33.3%) |
| Foreign Born, Citizen | 18 (56.2%) | 14 (43.8%) |
| Foreign Born, not a Citizen | 0 (0.0%) | 0 (0.0%) |
Health Insurance Coverage by Household Income in Yaak
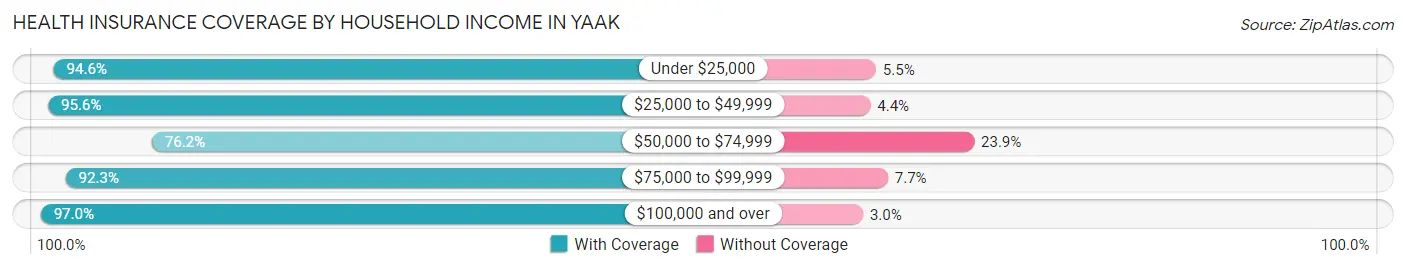
| Household Income | With Coverage | Without Coverage |
| Under $25,000 | 52 (94.6%) | 3 (5.4%) |
| $25,000 to $49,999 | 65 (95.6%) | 3 (4.4%) |
| $50,000 to $74,999 | 83 (76.1%) | 26 (23.8%) |
| $75,000 to $99,999 | 24 (92.3%) | 2 (7.7%) |
| $100,000 and over | 64 (97.0%) | 2 (3.0%) |
Public vs Private Health Insurance Coverage by Age in Yaak
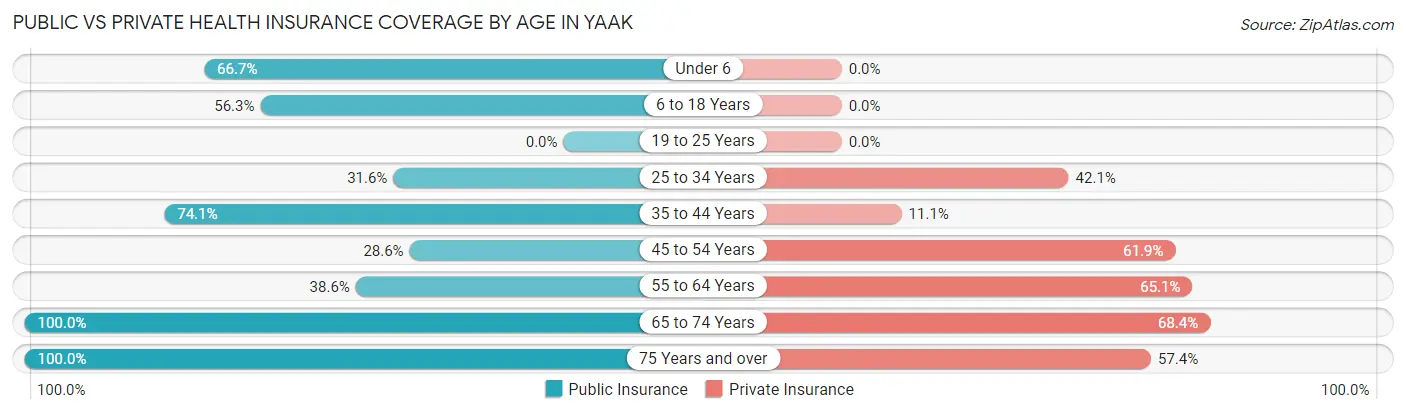
| Age Bracket | Public Insurance | Private Insurance |
| Under 6 | 6 (66.7%) | 0 (0.0%) |
| 6 to 18 Years | 18 (56.2%) | 0 (0.0%) |
| 19 to 25 Years | 0 (0.0%) | 0 (0.0%) |
| 25 to 34 Years | 6 (31.6%) | 8 (42.1%) |
| 35 to 44 Years | 20 (74.1%) | 3 (11.1%) |
| 45 to 54 Years | 6 (28.6%) | 13 (61.9%) |
| 55 to 64 Years | 32 (38.6%) | 54 (65.1%) |
| 65 to 74 Years | 79 (100.0%) | 54 (68.3%) |
| 75 Years and over | 54 (100.0%) | 31 (57.4%) |
| Total | 221 (68.2%) | 163 (50.3%) |
Disability Status by Sex by Age in Yaak
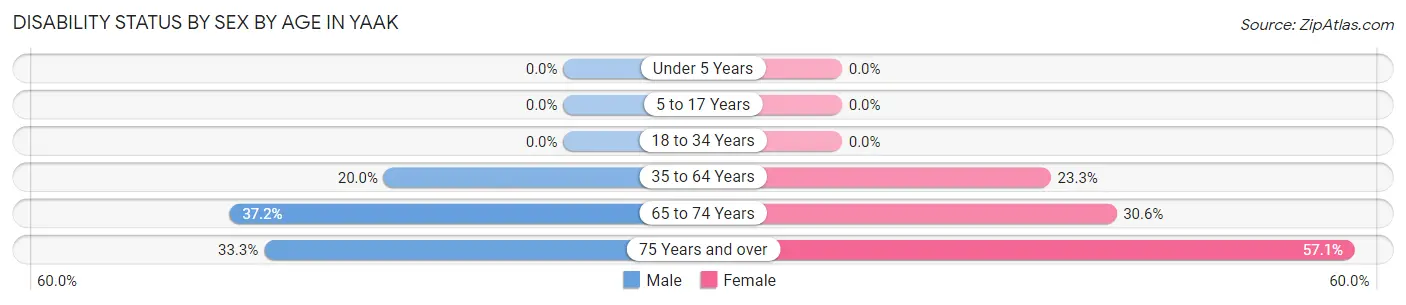
| Age Bracket | Male | Female |
| Under 5 Years | 0 (0.0%) | 0 (0.0%) |
| 5 to 17 Years | 0 (0.0%) | 0 (0.0%) |
| 18 to 34 Years | 0 (0.0%) | 0 (0.0%) |
| 35 to 64 Years | 9 (20.0%) | 20 (23.3%) |
| 65 to 74 Years | 16 (37.2%) | 11 (30.6%) |
| 75 Years and over | 11 (33.3%) | 12 (57.1%) |
Disability Class by Sex by Age in Yaak
Disability Class: Hearing Difficulty
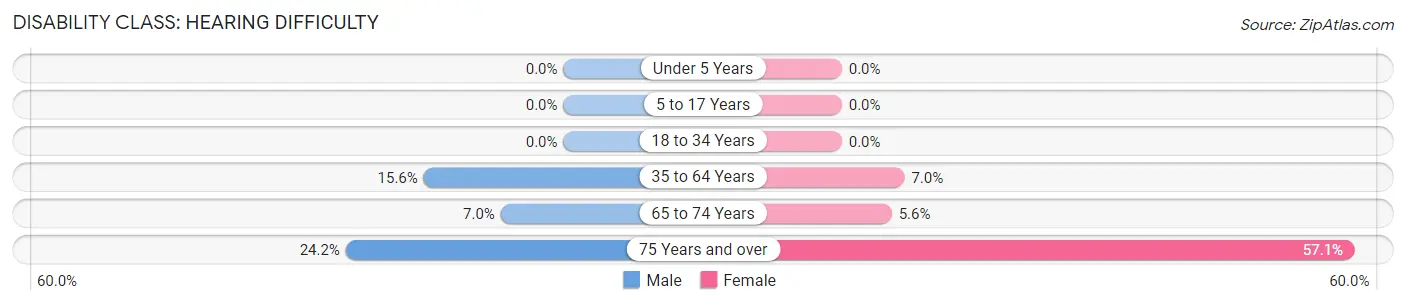
| Age Bracket | Male | Female |
| Under 5 Years | 0 (0.0%) | 0 (0.0%) |
| 5 to 17 Years | 0 (0.0%) | 0 (0.0%) |
| 18 to 34 Years | 0 (0.0%) | 0 (0.0%) |
| 35 to 64 Years | 7 (15.6%) | 6 (7.0%) |
| 65 to 74 Years | 3 (7.0%) | 2 (5.6%) |
| 75 Years and over | 8 (24.2%) | 12 (57.1%) |
Disability Class: Vision Difficulty
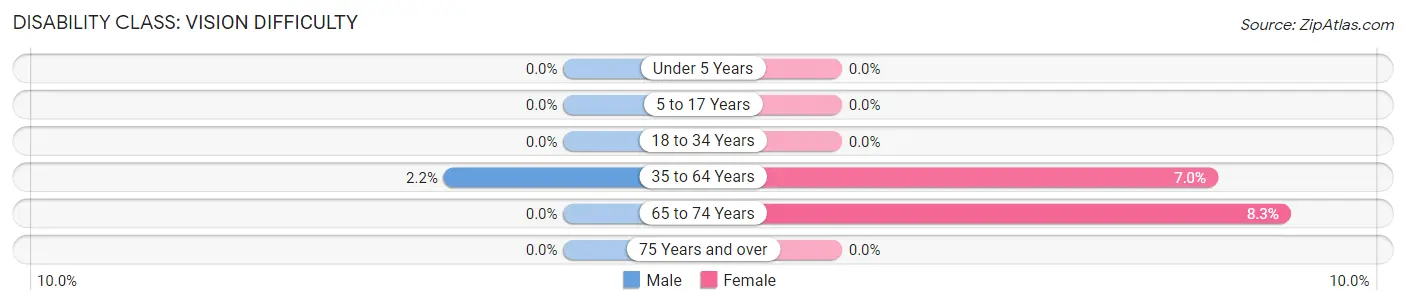
| Age Bracket | Male | Female |
| Under 5 Years | 0 (0.0%) | 0 (0.0%) |
| 5 to 17 Years | 0 (0.0%) | 0 (0.0%) |
| 18 to 34 Years | 0 (0.0%) | 0 (0.0%) |
| 35 to 64 Years | 1 (2.2%) | 6 (7.0%) |
| 65 to 74 Years | 0 (0.0%) | 3 (8.3%) |
| 75 Years and over | 0 (0.0%) | 0 (0.0%) |
Disability Class: Cognitive Difficulty
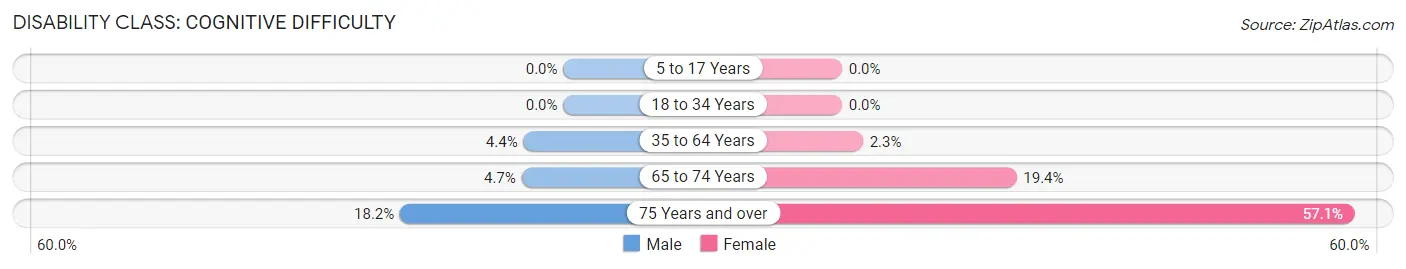
| Age Bracket | Male | Female |
| 5 to 17 Years | 0 (0.0%) | 0 (0.0%) |
| 18 to 34 Years | 0 (0.0%) | 0 (0.0%) |
| 35 to 64 Years | 2 (4.4%) | 2 (2.3%) |
| 65 to 74 Years | 2 (4.6%) | 7 (19.4%) |
| 75 Years and over | 6 (18.2%) | 12 (57.1%) |
Disability Class: Ambulatory Difficulty
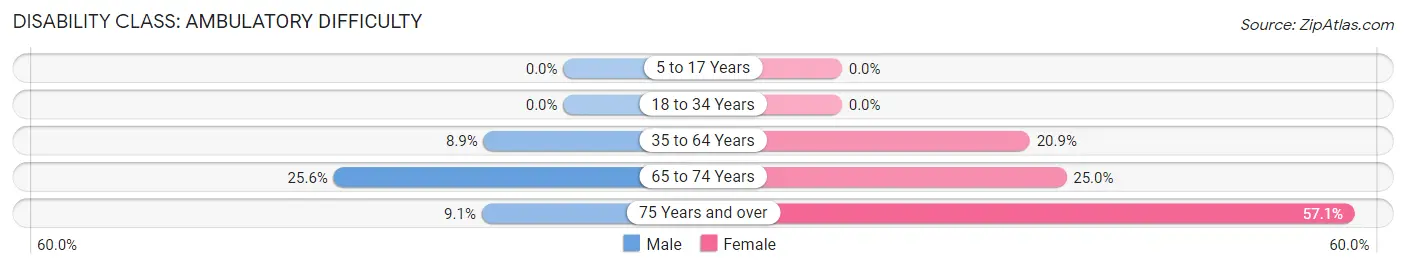
| Age Bracket | Male | Female |
| 5 to 17 Years | 0 (0.0%) | 0 (0.0%) |
| 18 to 34 Years | 0 (0.0%) | 0 (0.0%) |
| 35 to 64 Years | 4 (8.9%) | 18 (20.9%) |
| 65 to 74 Years | 11 (25.6%) | 9 (25.0%) |
| 75 Years and over | 3 (9.1%) | 12 (57.1%) |
Disability Class: Self-Care Difficulty
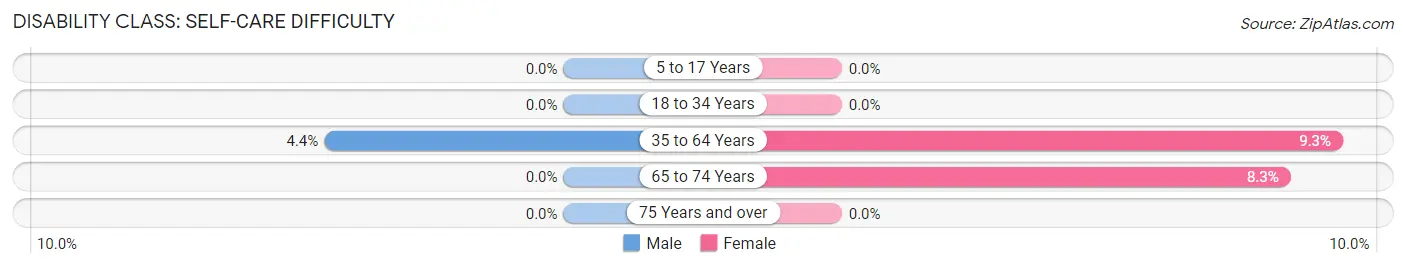
| Age Bracket | Male | Female |
| 5 to 17 Years | 0 (0.0%) | 0 (0.0%) |
| 18 to 34 Years | 0 (0.0%) | 0 (0.0%) |
| 35 to 64 Years | 2 (4.4%) | 8 (9.3%) |
| 65 to 74 Years | 0 (0.0%) | 3 (8.3%) |
| 75 Years and over | 0 (0.0%) | 0 (0.0%) |
Technology Access in Yaak
Computing Device Access in Yaak
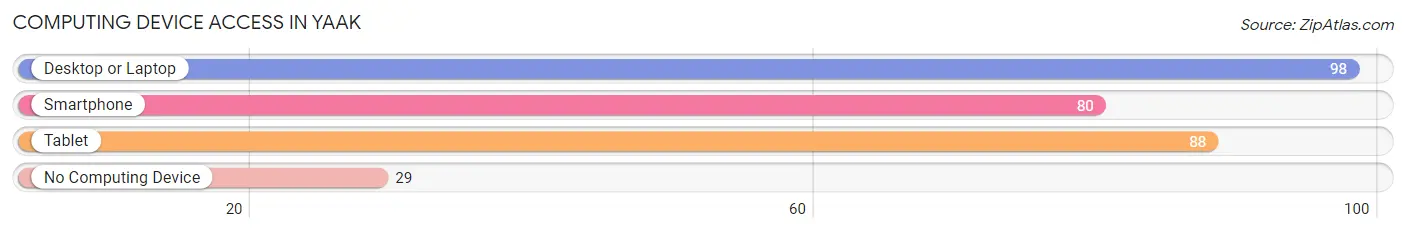
| Device Type | # Households | % Households |
| Desktop or Laptop | 98 | 66.7% |
| Smartphone | 80 | 54.4% |
| Tablet | 88 | 59.9% |
| No Computing Device | 29 | 19.7% |
| Total | 147 | 100.0% |
Internet Access in Yaak
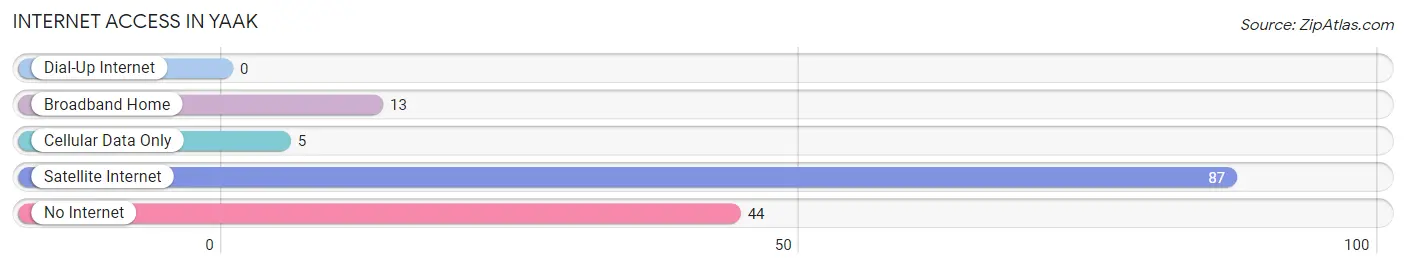
| Internet Type | # Households | % Households |
| Dial-Up Internet | 0 | 0.0% |
| Broadband Home | 13 | 8.8% |
| Cellular Data Only | 5 | 3.4% |
| Satellite Internet | 87 | 59.2% |
| No Internet | 44 | 29.9% |
| Total | 147 | 100.0% |
Yaak Summary
Yaak is a small unincorporated community located in the northwest corner of Montana, near the Idaho and Canadian borders. It is situated in the Yaak Valley, a remote area of the Kootenai National Forest. The Yaak Valley is home to a variety of wildlife, including grizzly bears, elk, moose, and wolves. The Yaak River runs through the valley, providing a source of recreation and sustenance for the local population.
History
The Yaak Valley has been inhabited by Native Americans for thousands of years. The Kootenai Tribe, a Salish-speaking people, were the first to settle in the area. The Kootenai were known for their fishing and hunting skills, and the Yaak Valley was an important source of food for them.
The first non-Native settlers arrived in the Yaak Valley in the late 1800s. These settlers were mostly loggers and miners, who came to the area in search of gold and timber. The Yaak Valley was also home to a number of homesteaders, who established small farms and ranches in the area.
The Yaak Valley was officially established as a town in 1910. The town was named after the Yaak River, which runs through the valley. The town was initially a logging and mining center, but it soon became a popular tourist destination. The Yaak Valley is known for its scenic beauty and abundant wildlife, and it has become a popular destination for hunters, fishermen, and outdoor enthusiasts.
Geography
The Yaak Valley is located in the northwest corner of Montana, near the Idaho and Canadian borders. It is situated in the Kootenai National Forest, and is surrounded by the Cabinet Mountains and the Purcell Mountains. The Yaak River runs through the valley, providing a source of recreation and sustenance for the local population.
The Yaak Valley has a humid continental climate, with cold winters and warm summers. The average annual temperature is around 40°F (4°C), and the average annual precipitation is around 20 inches (51 cm).
Economy
The economy of the Yaak Valley is largely based on tourism and logging. The Yaak Valley is a popular destination for hunters, fishermen, and outdoor enthusiasts, and it is home to a number of resorts and lodges. The Yaak Valley is also home to a number of logging companies, which harvest timber from the surrounding forests.
Demographics
The population of the Yaak Valley is around 500 people. The majority of the population is white, with a small minority of Native Americans. The median household income is around $30,000, and the median home value is around $150,000. The unemployment rate is around 5%, and the poverty rate is around 10%.
Conclusion
Yaak is a small unincorporated community located in the northwest corner of Montana, near the Idaho and Canadian borders. It is situated in the Yaak Valley, a remote area of the Kootenai National Forest. The Yaak Valley has been inhabited by Native Americans for thousands of years, and was later settled by loggers and miners in the late 1800s. The Yaak Valley is known for its scenic beauty and abundant wildlife, and it has become a popular destination for hunters, fishermen, and outdoor enthusiasts. The economy of the Yaak Valley is largely based on tourism and logging, and the population is around 500 people.
Common Questions
What is Per Capita Income in Yaak?
Per Capita income in Yaak is $29,776.
What is the Median Family Income in Yaak?
Median Family Income in Yaak is $58,333.
What is the Median Household income in Yaak?
Median Household Income in Yaak is $57,917.
What is Income or Wage Gap in Yaak?
Income or Wage Gap in Yaak is 16.4%.
Women in Yaak earn 83.6 cents for every dollar earned by a man.
What is Inequality or Gini Index in Yaak?
Inequality or Gini Index in Yaak is 0.39.
What is the Total Population of Yaak?
Total Population of Yaak is 330.
What is the Total Male Population of Yaak?
Total Male Population of Yaak is 155.
What is the Total Female Population of Yaak?
Total Female Population of Yaak is 175.
What is the Ratio of Males per 100 Females in Yaak?
There are 88.57 Males per 100 Females in Yaak.
What is the Ratio of Females per 100 Males in Yaak?
There are 112.90 Females per 100 Males in Yaak.
What is the Median Population Age in Yaak?
Median Population Age in Yaak is 63.1 Years.
What is the Average Family Size in Yaak
Average Family Size in Yaak is 2.5 People.
What is the Average Household Size in Yaak
Average Household Size in Yaak is 2.2 People.
How Large is the Labor Force in Yaak?
There are 85 People in the Labor Forcein in Yaak.
What is the Percentage of People in the Labor Force in Yaak?
29.9% of People are in the Labor Force in Yaak.
What is the Unemployment Rate in Yaak?
Unemployment Rate in Yaak is 7.1%.