Wibaux, MT Map & Demographics
Wibaux Map
Wibaux Overview
$33,708
PER CAPITA INCOME
$91,136
AVG FAMILY INCOME
$61,042
AVG HOUSEHOLD INCOME
51.9%
WAGE / INCOME GAP [ % ]
48.1¢/ $1
WAGE / INCOME GAP [ $ ]
0.38
INEQUALITY / GINI INDEX
640
TOTAL POPULATION
318
MALE POPULATION
322
FEMALE POPULATION
98.76
MALES / 100 FEMALES
101.26
FEMALES / 100 MALES
51.8
MEDIAN AGE
2.7
AVG FAMILY SIZE
2.1
AVG HOUSEHOLD SIZE
268
LABOR FORCE [ PEOPLE ]
50.4%
PERCENT IN LABOR FORCE
Wibaux Zip Codes
Wibaux Area Codes
Income in Wibaux
Income Overview in Wibaux
Per Capita Income in Wibaux is $33,708, while median incomes of families and households are $91,136 and $61,042 respectively.
| Characteristic | Number | Measure |
| Per Capita Income | 640 | $33,708 |
| Median Family Income | 172 | $91,136 |
| Mean Family Income | 172 | $85,573 |
| Median Household Income | 296 | $61,042 |
| Mean Household Income | 296 | $72,483 |
| Income Deficit | 172 | $0 |
| Wage / Income Gap (%) | 640 | 51.85% |
| Wage / Income Gap ($) | 640 | 48.15¢ per $1 |
| Gini / Inequality Index | 640 | 0.38 |
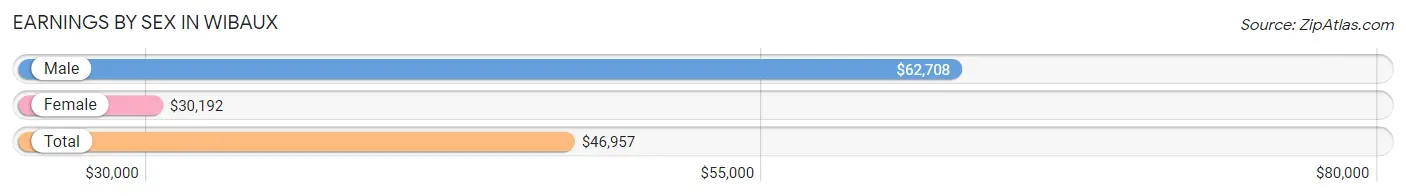
Earnings by Sex in Wibaux
Average Earnings in Wibaux are $46,957, $62,708 for men and $30,192 for women, a difference of 51.8%.
| Sex | Number | Average Earnings |
| Male | 152 (49.0%) | $62,708 |
| Female | 158 (51.0%) | $30,192 |
| Total | 310 (100.0%) | $46,957 |
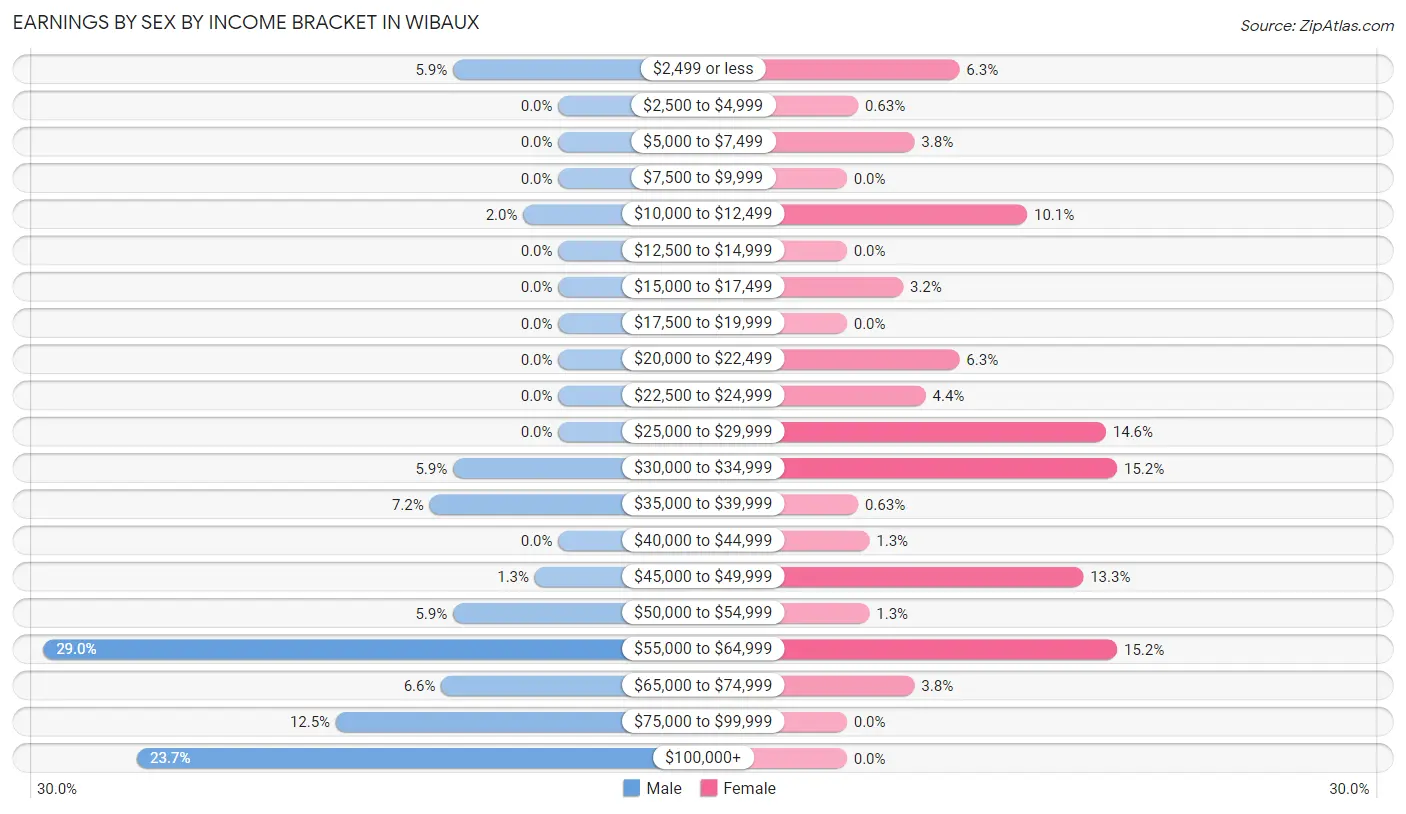
Earnings by Sex by Income Bracket in Wibaux
The most common earnings brackets in Wibaux are $55,000 to $64,999 for men (44 | 28.9%) and $30,000 to $34,999 for women (24 | 15.2%).
| Income | Male | Female |
| $2,499 or less | 9 (5.9%) | 10 (6.3%) |
| $2,500 to $4,999 | 0 (0.0%) | 1 (0.6%) |
| $5,000 to $7,499 | 0 (0.0%) | 6 (3.8%) |
| $7,500 to $9,999 | 0 (0.0%) | 0 (0.0%) |
| $10,000 to $12,499 | 3 (2.0%) | 16 (10.1%) |
| $12,500 to $14,999 | 0 (0.0%) | 0 (0.0%) |
| $15,000 to $17,499 | 0 (0.0%) | 5 (3.2%) |
| $17,500 to $19,999 | 0 (0.0%) | 0 (0.0%) |
| $20,000 to $22,499 | 0 (0.0%) | 10 (6.3%) |
| $22,500 to $24,999 | 0 (0.0%) | 7 (4.4%) |
| $25,000 to $29,999 | 0 (0.0%) | 23 (14.6%) |
| $30,000 to $34,999 | 9 (5.9%) | 24 (15.2%) |
| $35,000 to $39,999 | 11 (7.2%) | 1 (0.6%) |
| $40,000 to $44,999 | 0 (0.0%) | 2 (1.3%) |
| $45,000 to $49,999 | 2 (1.3%) | 21 (13.3%) |
| $50,000 to $54,999 | 9 (5.9%) | 2 (1.3%) |
| $55,000 to $64,999 | 44 (28.9%) | 24 (15.2%) |
| $65,000 to $74,999 | 10 (6.6%) | 6 (3.8%) |
| $75,000 to $99,999 | 19 (12.5%) | 0 (0.0%) |
| $100,000+ | 36 (23.7%) | 0 (0.0%) |
| Total | 152 (100.0%) | 158 (100.0%) |
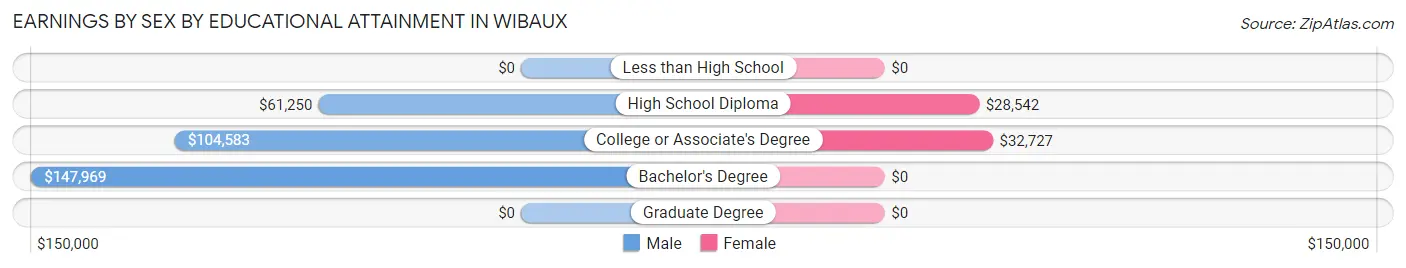
Earnings by Sex by Educational Attainment in Wibaux
Average earnings in Wibaux are $63,333 for men and $32,308 for women, a difference of 49.0%. Men with an educational attainment of bachelor's degree enjoy the highest average annual earnings of $147,969, while those with high school diploma education earn the least with $61,250. Women with an educational attainment of college or associate's degree earn the most with the average annual earnings of $32,727, while those with high school diploma education have the smallest earnings of $28,542.
| Educational Attainment | Male Income | Female Income |
| Less than High School | - | - |
| High School Diploma | $61,250 | $28,542 |
| College or Associate's Degree | $104,583 | $32,727 |
| Bachelor's Degree | $147,969 | $0 |
| Graduate Degree | - | - |
| Total | $63,333 | $32,308 |
Family Income in Wibaux
Family Income Brackets in Wibaux
According to the Wibaux family income data, there are 70 families falling into the $100,000 to $149,999 income range, which is the most common income bracket and makes up 40.7% of all families.
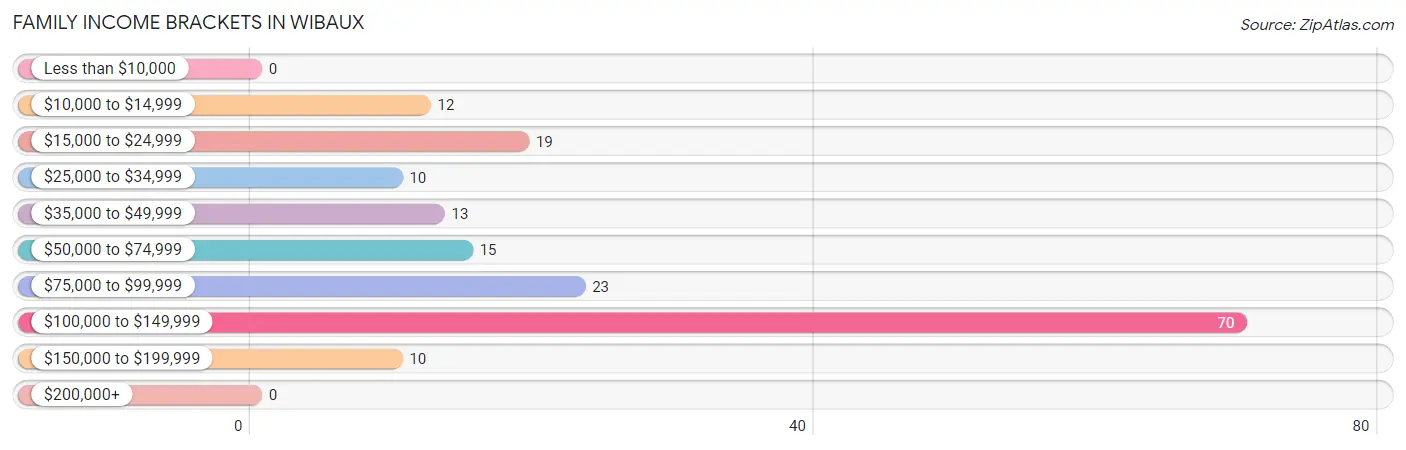
| Income Bracket | # Families | % Families |
| Less than $10,000 | 0 | 0.0% |
| $10,000 to $14,999 | 12 | 7.0% |
| $15,000 to $24,999 | 19 | 11.0% |
| $25,000 to $34,999 | 10 | 5.8% |
| $35,000 to $49,999 | 13 | 7.6% |
| $50,000 to $74,999 | 15 | 8.7% |
| $75,000 to $99,999 | 23 | 13.4% |
| $100,000 to $149,999 | 70 | 40.7% |
| $150,000 to $199,999 | 10 | 5.8% |
| $200,000+ | 0 | 0.0% |
Family Income by Famaliy Size in Wibaux
5-person families (7 | 4.1%) account for the highest median family income in Wibaux with $103,750 per family, while 2-person families (102 | 59.3%) have the highest median income of $46,875 per family member.
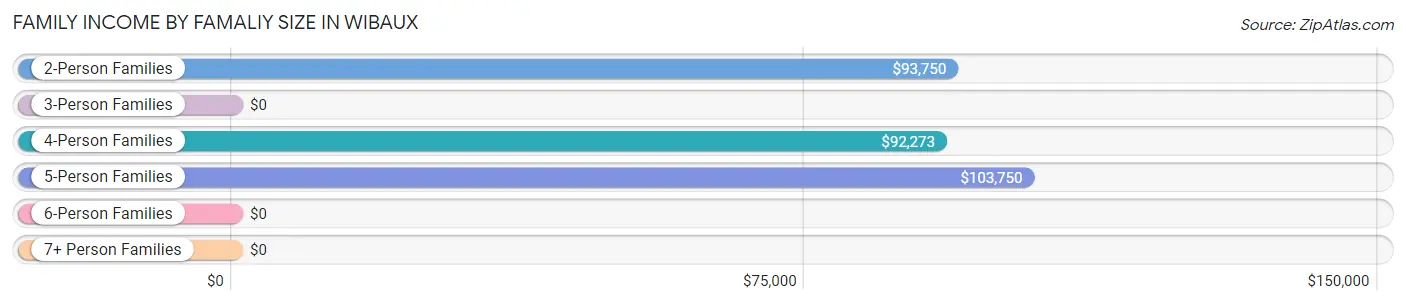
| Income Bracket | # Families | Median Income |
| 2-Person Families | 102 (59.3%) | $93,750 |
| 3-Person Families | 27 (15.7%) | $0 |
| 4-Person Families | 26 (15.1%) | $92,273 |
| 5-Person Families | 7 (4.1%) | $103,750 |
| 6-Person Families | 10 (5.8%) | $0 |
| 7+ Person Families | 0 (0.0%) | $0 |
| Total | 172 (100.0%) | $91,136 |
Family Income by Number of Earners in Wibaux
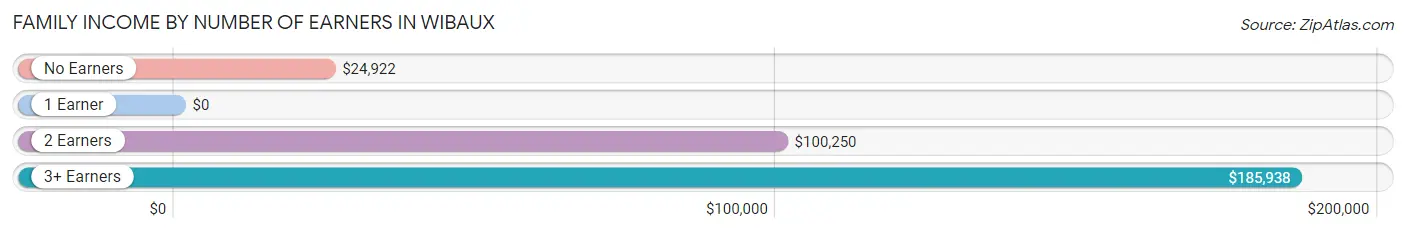
| Number of Earners | # Families | Median Income |
| No Earners | 31 (18.0%) | $24,922 |
| 1 Earner | 44 (25.6%) | $0 |
| 2 Earners | 83 (48.3%) | $100,250 |
| 3+ Earners | 14 (8.1%) | $185,938 |
| Total | 172 (100.0%) | $91,136 |
Household Income in Wibaux
Household Income Brackets in Wibaux
With 87 households falling in the category, the $100,000 to $149,999 income range is the most frequent in Wibaux, accounting for 29.4% of all households.
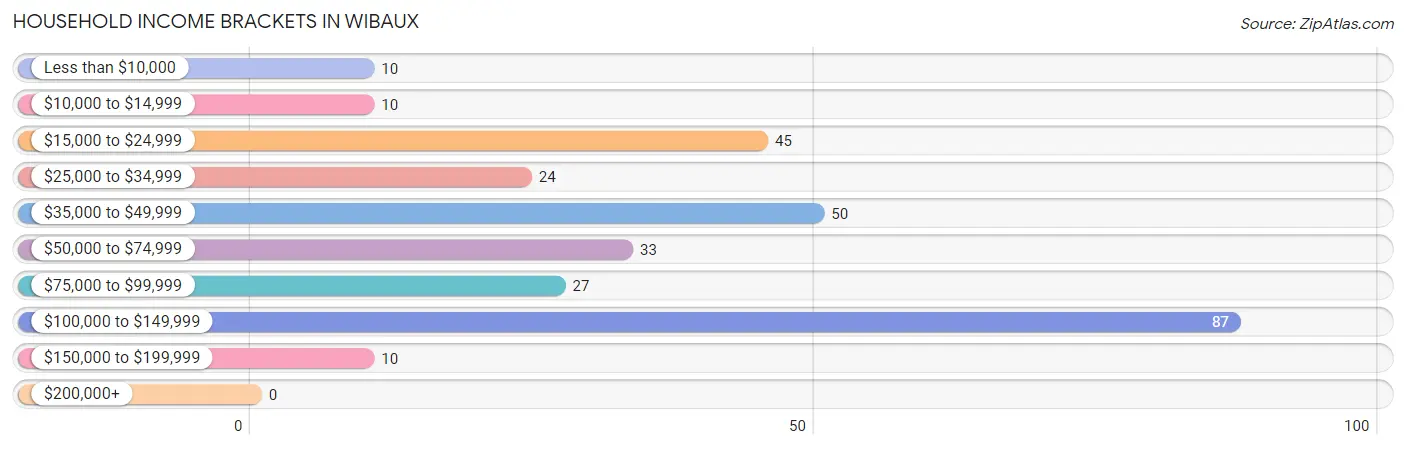
| Income Bracket | # Households | % Households |
| Less than $10,000 | 10 | 3.4% |
| $10,000 to $14,999 | 10 | 3.4% |
| $15,000 to $24,999 | 45 | 15.2% |
| $25,000 to $34,999 | 24 | 8.1% |
| $35,000 to $49,999 | 50 | 16.9% |
| $50,000 to $74,999 | 33 | 11.1% |
| $75,000 to $99,999 | 27 | 9.1% |
| $100,000 to $149,999 | 87 | 29.4% |
| $150,000 to $199,999 | 10 | 3.4% |
| $200,000+ | 0 | 0.0% |
Household Income by Householder Age in Wibaux
The median household income in Wibaux is $61,042, with the highest median household income of $123,106 found in the 45 to 64 years age bracket for the primary householder. A total of 122 households (41.2%) fall into this category. Meanwhile, the 15 to 24 years age bracket for the primary householder has the lowest median household income of $0, with 12 households (4.1%) in this group.
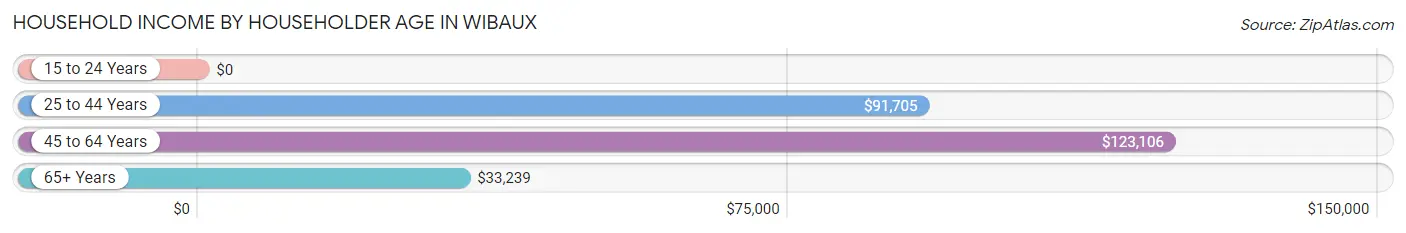
| Income Bracket | # Households | Median Income |
| 15 to 24 Years | 12 (4.1%) | $0 |
| 25 to 44 Years | 45 (15.2%) | $91,705 |
| 45 to 64 Years | 122 (41.2%) | $123,106 |
| 65+ Years | 117 (39.5%) | $33,239 |
| Total | 296 (100.0%) | $61,042 |
Poverty in Wibaux
Income Below Poverty by Sex and Age in Wibaux
With 8.3% poverty level for males and 17.5% for females among the residents of Wibaux, under 5 year old males and under 5 year old females are the most vulnerable to poverty, with 16 males (80.0%) and 10 females (100.0%) in their respective age groups living below the poverty level.
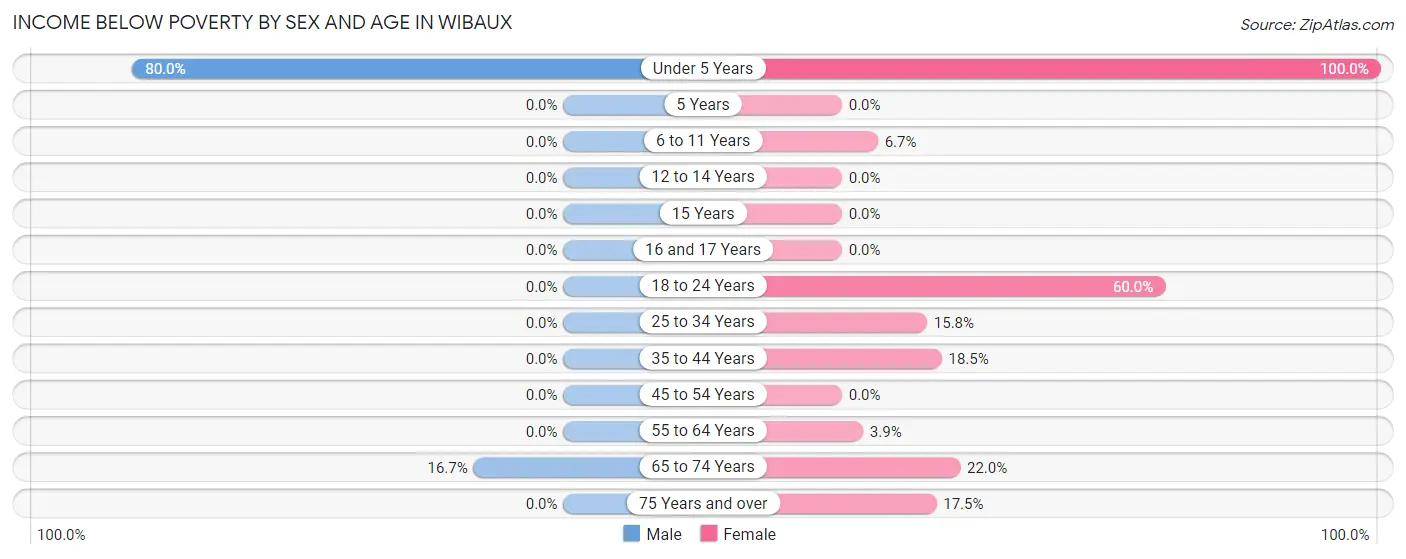
| Age Bracket | Male | Female |
| Under 5 Years | 16 (80.0%) | 10 (100.0%) |
| 5 Years | 0 (0.0%) | 0 (0.0%) |
| 6 to 11 Years | 0 (0.0%) | 2 (6.7%) |
| 12 to 14 Years | 0 (0.0%) | 0 (0.0%) |
| 15 Years | 0 (0.0%) | 0 (0.0%) |
| 16 and 17 Years | 0 (0.0%) | 0 (0.0%) |
| 18 to 24 Years | 0 (0.0%) | 12 (60.0%) |
| 25 to 34 Years | 0 (0.0%) | 3 (15.8%) |
| 35 to 44 Years | 0 (0.0%) | 5 (18.5%) |
| 45 to 54 Years | 0 (0.0%) | 0 (0.0%) |
| 55 to 64 Years | 0 (0.0%) | 2 (3.9%) |
| 65 to 74 Years | 10 (16.7%) | 9 (22.0%) |
| 75 Years and over | 0 (0.0%) | 10 (17.5%) |
| Total | 26 (8.3%) | 53 (17.5%) |
Income Above Poverty by Sex and Age in Wibaux
According to the poverty statistics in Wibaux, males aged 5 years and females aged 12 to 14 years are the age groups that are most secure financially, with 100.0% of males and 100.0% of females in these age groups living above the poverty line.
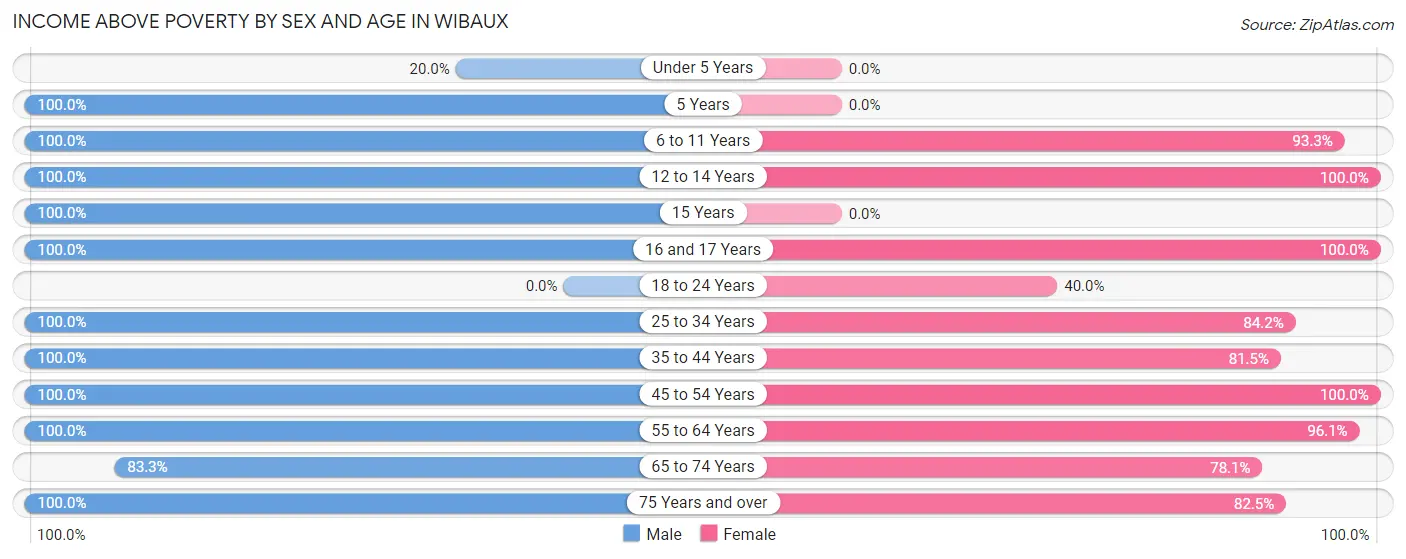
| Age Bracket | Male | Female |
| Under 5 Years | 4 (20.0%) | 0 (0.0%) |
| 5 Years | 3 (100.0%) | 0 (0.0%) |
| 6 to 11 Years | 7 (100.0%) | 28 (93.3%) |
| 12 to 14 Years | 22 (100.0%) | 2 (100.0%) |
| 15 Years | 10 (100.0%) | 0 (0.0%) |
| 16 and 17 Years | 12 (100.0%) | 9 (100.0%) |
| 18 to 24 Years | 0 (0.0%) | 8 (40.0%) |
| 25 to 34 Years | 28 (100.0%) | 16 (84.2%) |
| 35 to 44 Years | 27 (100.0%) | 22 (81.5%) |
| 45 to 54 Years | 47 (100.0%) | 37 (100.0%) |
| 55 to 64 Years | 58 (100.0%) | 49 (96.1%) |
| 65 to 74 Years | 50 (83.3%) | 32 (78.0%) |
| 75 Years and over | 19 (100.0%) | 47 (82.5%) |
| Total | 287 (91.7%) | 250 (82.5%) |
Income Below Poverty Among Married-Couple Families in Wibaux
The poverty statistics for married-couple families in Wibaux show that 6.5% or 10 of the total 154 families live below the poverty line. Families with 3 or 4 children have the highest poverty rate of 66.7%, comprising of 10 families. On the other hand, families with no children have the lowest poverty rate of 0.0%, which includes 0 families.
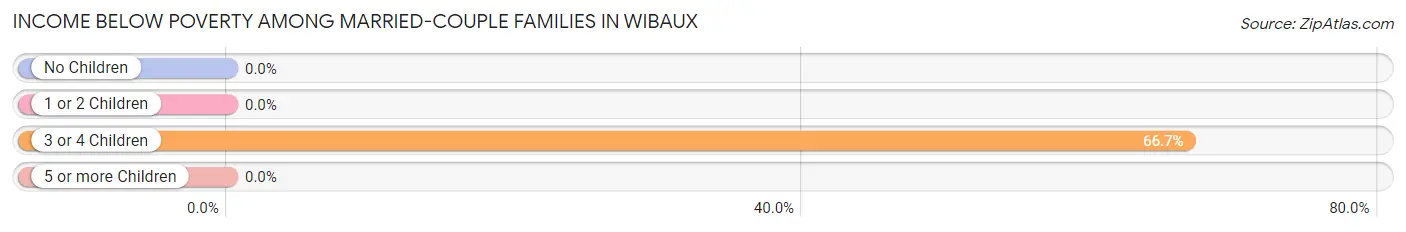
| Children | Above Poverty | Below Poverty |
| No Children | 98 (100.0%) | 0 (0.0%) |
| 1 or 2 Children | 41 (100.0%) | 0 (0.0%) |
| 3 or 4 Children | 5 (33.3%) | 10 (66.7%) |
| 5 or more Children | 0 (0.0%) | 0 (0.0%) |
| Total | 144 (93.5%) | 10 (6.5%) |
Income Below Poverty Among Single-Parent Households in Wibaux
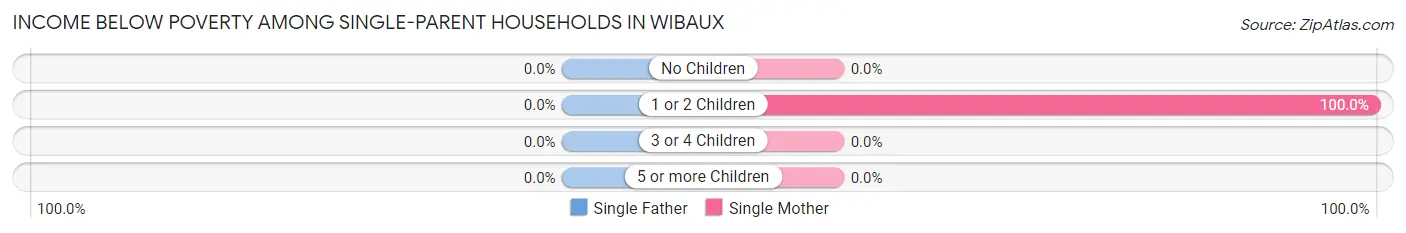
| Children | Single Father | Single Mother |
| No Children | 0 (0.0%) | 0 (0.0%) |
| 1 or 2 Children | 0 (0.0%) | 15 (100.0%) |
| 3 or 4 Children | 0 (0.0%) | 0 (0.0%) |
| 5 or more Children | 0 (0.0%) | 0 (0.0%) |
| Total | 0 (0.0%) | 15 (100.0%) |
Income Below Poverty Among Married-Couple vs Single-Parent Households in Wibaux
The poverty data for Wibaux shows that 10 of the married-couple family households (6.5%) and 15 of the single-parent households (83.3%) are living below the poverty level. Within the married-couple family households, those with 3 or 4 children have the highest poverty rate, with 10 households (66.7%) falling below the poverty line. Among the single-parent households, those with 1 or 2 children have the highest poverty rate, with 15 household (100.0%) living below poverty.
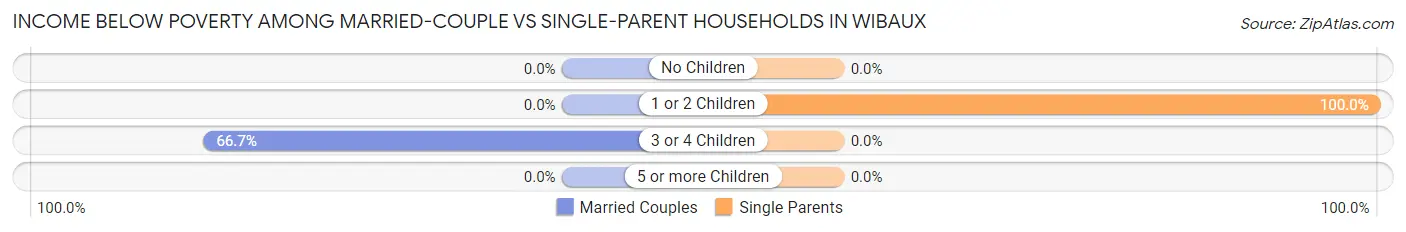
| Children | Married-Couple Families | Single-Parent Households |
| No Children | 0 (0.0%) | 0 (0.0%) |
| 1 or 2 Children | 0 (0.0%) | 15 (100.0%) |
| 3 or 4 Children | 10 (66.7%) | 0 (0.0%) |
| 5 or more Children | 0 (0.0%) | 0 (0.0%) |
| Total | 10 (6.5%) | 15 (83.3%) |
Race in Wibaux
The most populous races in Wibaux are White / Caucasian (598 | 93.4%), Hispanic or Latino (27 | 4.2%), and Two or more Races (27 | 4.2%).
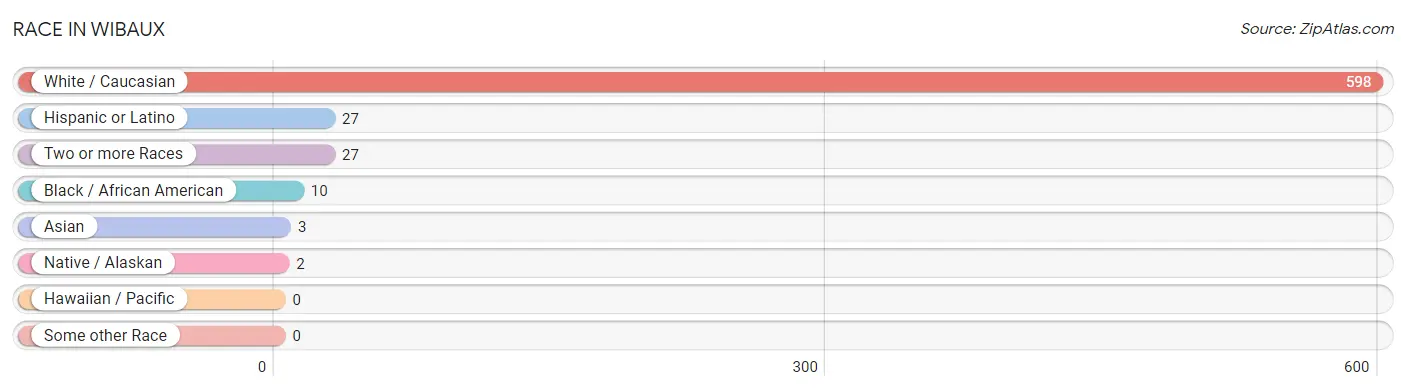
| Race | # Population | % Population |
| Asian | 3 | 0.5% |
| Black / African American | 10 | 1.6% |
| Hawaiian / Pacific | 0 | 0.0% |
| Hispanic or Latino | 27 | 4.2% |
| Native / Alaskan | 2 | 0.3% |
| White / Caucasian | 598 | 93.4% |
| Two or more Races | 27 | 4.2% |
| Some other Race | 0 | 0.0% |
| Total | 640 | 100.0% |
Ancestry in Wibaux
The most populous ancestries reported in Wibaux are English (106 | 16.6%), German (100 | 15.6%), Irish (99 | 15.5%), Norwegian (88 | 13.8%), and Polish (59 | 9.2%), together accounting for 70.6% of all Wibaux residents.
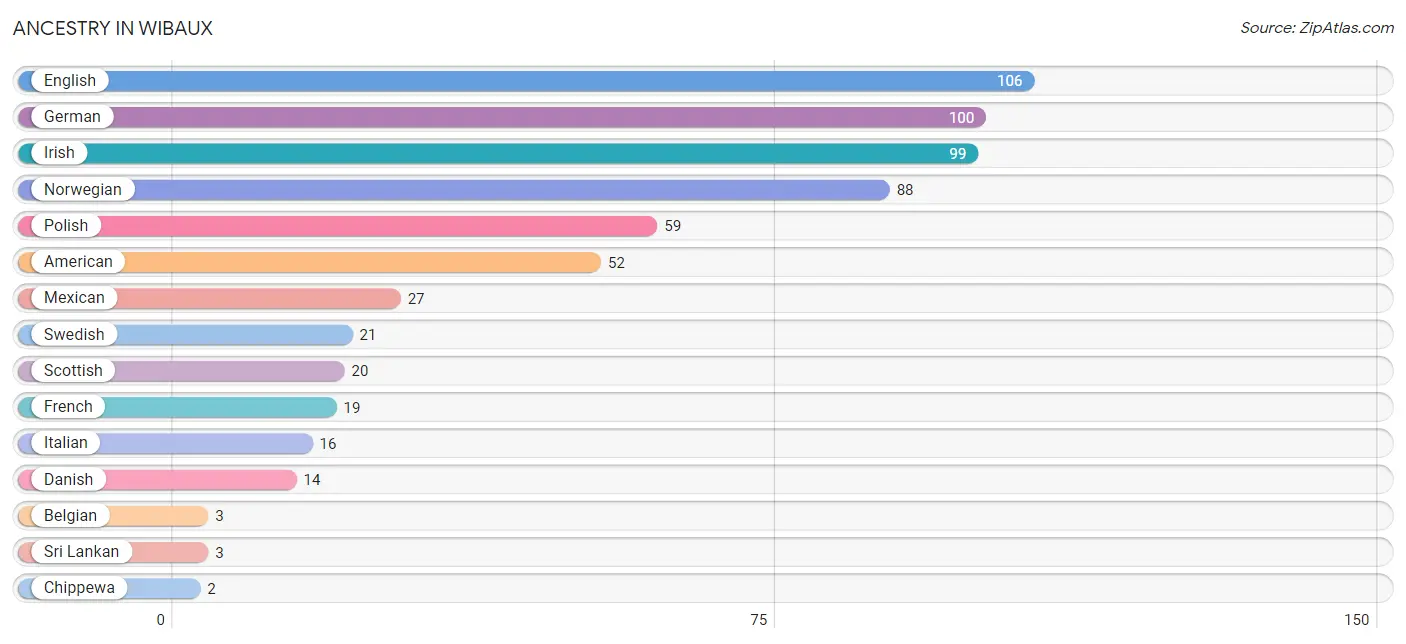
| Ancestry | # Population | % Population |
| American | 52 | 8.1% |
| Belgian | 3 | 0.5% |
| Chippewa | 2 | 0.3% |
| Danish | 14 | 2.2% |
| English | 106 | 16.6% |
| French | 19 | 3.0% |
| German | 100 | 15.6% |
| German Russian | 2 | 0.3% |
| Irish | 99 | 15.5% |
| Italian | 16 | 2.5% |
| Mexican | 27 | 4.2% |
| Norwegian | 88 | 13.8% |
| Polish | 59 | 9.2% |
| Scottish | 20 | 3.1% |
| Sri Lankan | 3 | 0.5% |
| Swedish | 21 | 3.3% | View All 16 Rows |
Immigrants in Wibaux
The most numerous immigrant groups reported in Wibaux came from Central America (27 | 4.2%), Latin America (27 | 4.2%), Mexico (27 | 4.2%), Asia (3 | 0.5%), and South Eastern Asia (3 | 0.5%), together accounting for 13.6% of all Wibaux residents.
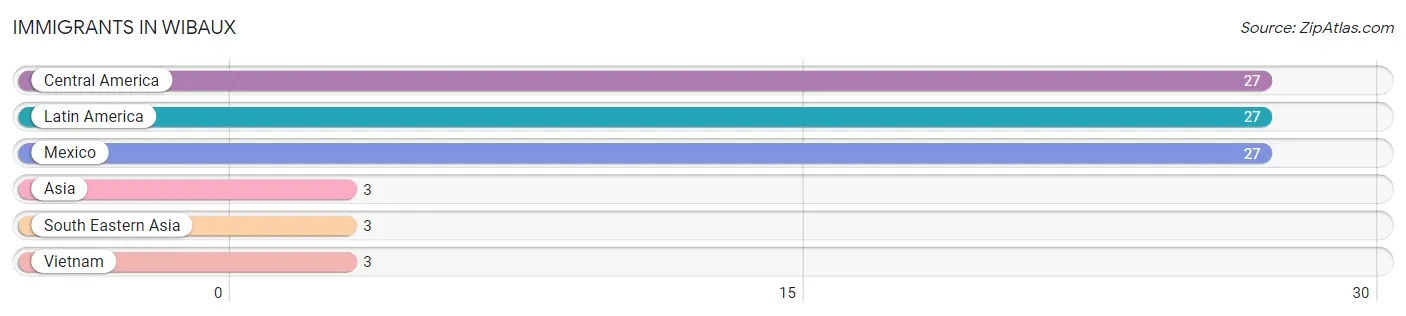
| Immigration Origin | # Population | % Population |
| Asia | 3 | 0.5% |
| Central America | 27 | 4.2% |
| Latin America | 27 | 4.2% |
| Mexico | 27 | 4.2% |
| South Eastern Asia | 3 | 0.5% |
| Vietnam | 3 | 0.5% | View All 6 Rows |
Sex and Age in Wibaux
Sex and Age in Wibaux
The most populous age groups in Wibaux are 65 to 69 Years (39 | 12.3%) for men and 60 to 64 Years (49 | 15.2%) for women.
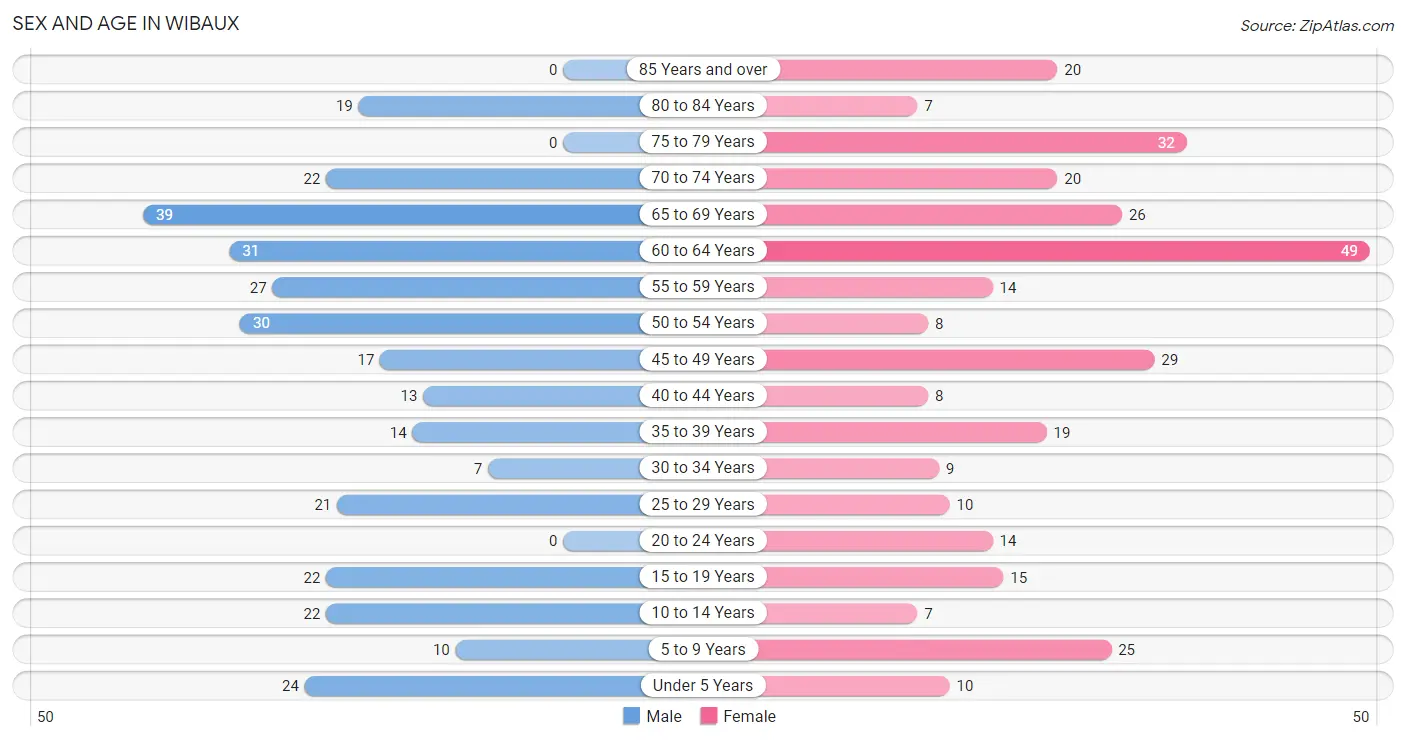
| Age Bracket | Male | Female |
| Under 5 Years | 24 (7.5%) | 10 (3.1%) |
| 5 to 9 Years | 10 (3.1%) | 25 (7.8%) |
| 10 to 14 Years | 22 (6.9%) | 7 (2.2%) |
| 15 to 19 Years | 22 (6.9%) | 15 (4.7%) |
| 20 to 24 Years | 0 (0.0%) | 14 (4.3%) |
| 25 to 29 Years | 21 (6.6%) | 10 (3.1%) |
| 30 to 34 Years | 7 (2.2%) | 9 (2.8%) |
| 35 to 39 Years | 14 (4.4%) | 19 (5.9%) |
| 40 to 44 Years | 13 (4.1%) | 8 (2.5%) |
| 45 to 49 Years | 17 (5.3%) | 29 (9.0%) |
| 50 to 54 Years | 30 (9.4%) | 8 (2.5%) |
| 55 to 59 Years | 27 (8.5%) | 14 (4.3%) |
| 60 to 64 Years | 31 (9.8%) | 49 (15.2%) |
| 65 to 69 Years | 39 (12.3%) | 26 (8.1%) |
| 70 to 74 Years | 22 (6.9%) | 20 (6.2%) |
| 75 to 79 Years | 0 (0.0%) | 32 (9.9%) |
| 80 to 84 Years | 19 (6.0%) | 7 (2.2%) |
| 85 Years and over | 0 (0.0%) | 20 (6.2%) |
| Total | 318 (100.0%) | 322 (100.0%) |
Families and Households in Wibaux
Median Family Size in Wibaux
The median family size in Wibaux is 2.73 persons per family, with married-couple families (154 | 89.5%) accounting for the largest median family size of 2.87 persons per family. On the other hand, single male/father families (3 | 1.7%) represent the smallest median family size with 1.33 persons per family.
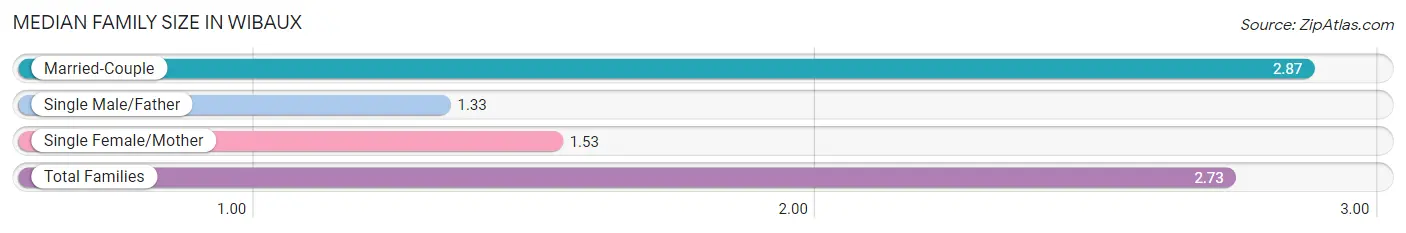
| Family Type | # Families | Family Size |
| Married-Couple | 154 (89.5%) | 2.87 |
| Single Male/Father | 3 (1.7%) | 1.33 |
| Single Female/Mother | 15 (8.7%) | 1.53 |
| Total Families | 172 (100.0%) | 2.73 |
Median Household Size in Wibaux
The median household size in Wibaux is 2.09 persons per household, with single female/mother households (15 | 5.1%) accounting for the largest median household size of 2.93 persons per household. non-family households (124 | 41.9%) represent the smallest median household size with 1.02 persons per household.
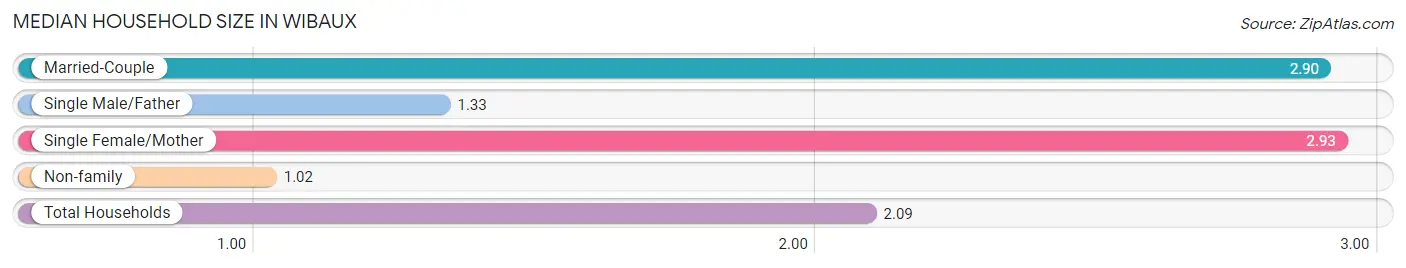
| Household Type | # Households | Household Size |
| Married-Couple | 154 (52.0%) | 2.90 |
| Single Male/Father | 3 (1.0%) | 1.33 |
| Single Female/Mother | 15 (5.1%) | 2.93 |
| Non-family | 124 (41.9%) | 1.02 |
| Total Households | 296 (100.0%) | 2.09 |
Household Size by Marriage Status in Wibaux
Out of a total of 296 households in Wibaux, 172 (58.1%) are family households, while 124 (41.9%) are nonfamily households. The most numerous type of family households are 2-person households, comprising 90, and the most common type of nonfamily households are 1-person households, comprising 120.
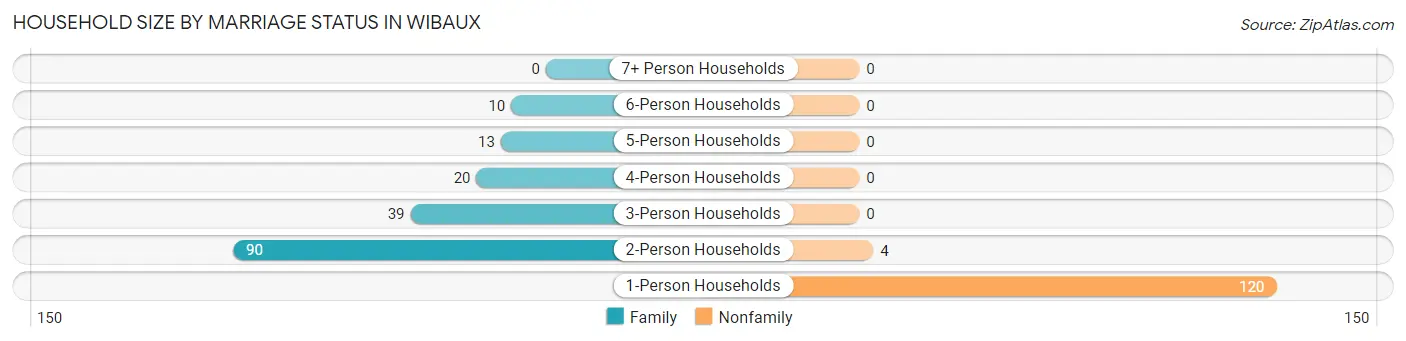
| Household Size | Family Households | Nonfamily Households |
| 1-Person Households | - | 120 (40.5%) |
| 2-Person Households | 90 (30.4%) | 4 (1.3%) |
| 3-Person Households | 39 (13.2%) | 0 (0.0%) |
| 4-Person Households | 20 (6.8%) | 0 (0.0%) |
| 5-Person Households | 13 (4.4%) | 0 (0.0%) |
| 6-Person Households | 10 (3.4%) | 0 (0.0%) |
| 7+ Person Households | 0 (0.0%) | 0 (0.0%) |
| Total | 172 (58.1%) | 124 (41.9%) |
Female Fertility in Wibaux
Fertility by Age in Wibaux
Average fertility rate in Wibaux is 115.0 births per 1,000 women. Women in the age bracket of 20 to 34 years have the highest fertility rate with 364.0 births per 1,000 women. Women in the age bracket of 20 to 34 years acount for 100.0% of all women with births.
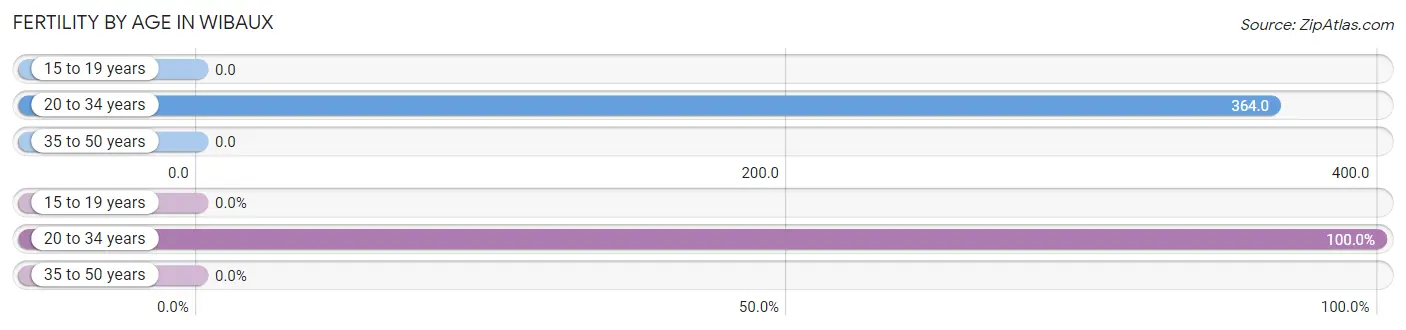
| Age Bracket | Women with Births | Births / 1,000 Women |
| 15 to 19 years | 0 (0.0%) | 0.0 |
| 20 to 34 years | 12 (100.0%) | 364.0 |
| 35 to 50 years | 0 (0.0%) | 0.0 |
| Total | 12 (100.0%) | 115.0 |
Fertility by Age by Marriage Status in Wibaux
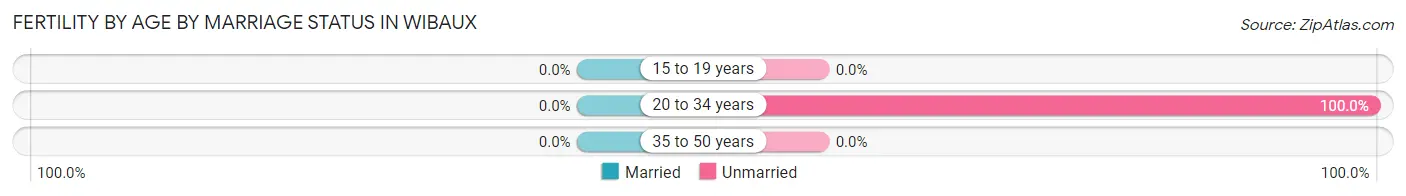
| Age Bracket | Married | Unmarried |
| 15 to 19 years | 0 (0.0%) | 0 (0.0%) |
| 20 to 34 years | 0 (0.0%) | 12 (100.0%) |
| 35 to 50 years | 0 (0.0%) | 0 (0.0%) |
| Total | 0 (0.0%) | 12 (100.0%) |
Fertility by Education in Wibaux
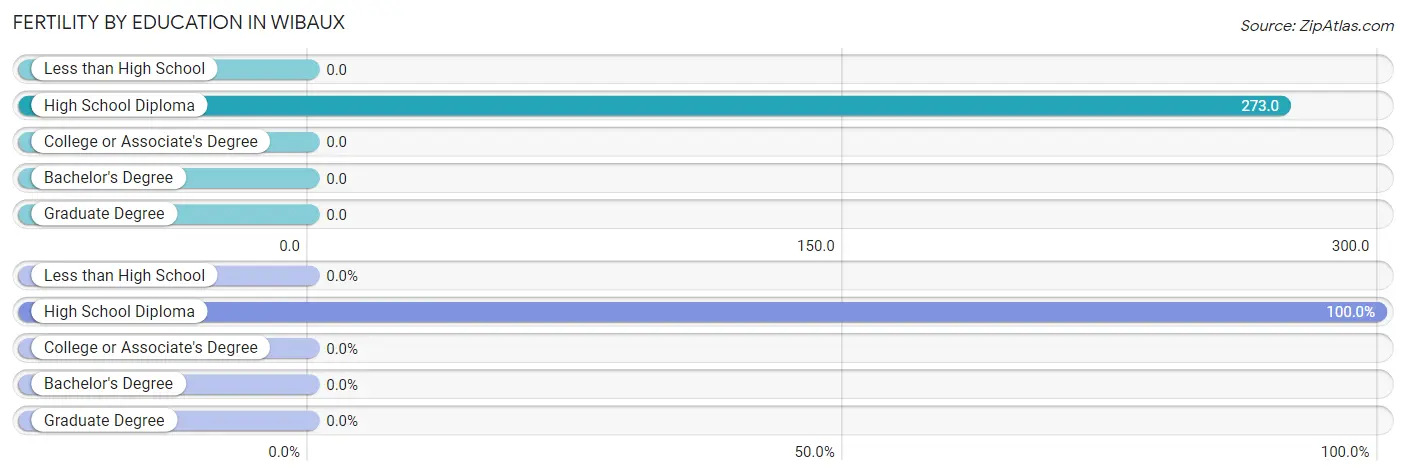
| Educational Attainment | Women with Births | Births / 1,000 Women |
| Less than High School | 0 (0.0%) | 0.0 |
| High School Diploma | 12 (100.0%) | 273.0 |
| College or Associate's Degree | 0 (0.0%) | 0.0 |
| Bachelor's Degree | 0 (0.0%) | 0.0 |
| Graduate Degree | 0 (0.0%) | 0.0 |
| Total | 12 (100.0%) | 115.0 |
Fertility by Education by Marriage Status in Wibaux
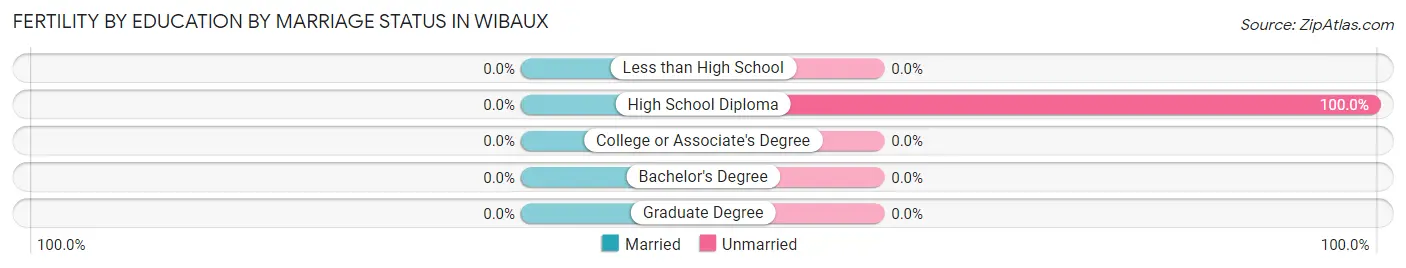
| Educational Attainment | Married | Unmarried |
| Less than High School | 0 (0.0%) | 0 (0.0%) |
| High School Diploma | 0 (0.0%) | 12 (100.0%) |
| College or Associate's Degree | 0 (0.0%) | 0 (0.0%) |
| Bachelor's Degree | 0 (0.0%) | 0 (0.0%) |
| Graduate Degree | 0 (0.0%) | 0 (0.0%) |
| Total | 0 (0.0%) | 12 (100.0%) |
Employment Characteristics in Wibaux
Employment by Class of Employer in Wibaux
Among the 268 employed individuals in Wibaux, private company employees (130 | 48.5%), not-for-profit organizations (47 | 17.5%), and local government employees (33 | 12.3%) make up the most common classes of employment.
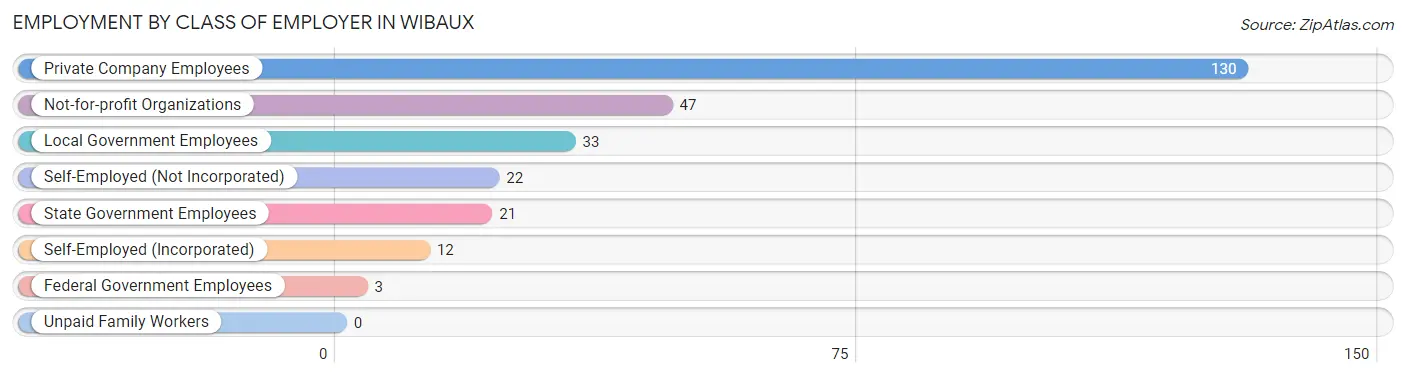
| Employer Class | # Employees | % Employees |
| Private Company Employees | 130 | 48.5% |
| Self-Employed (Incorporated) | 12 | 4.5% |
| Self-Employed (Not Incorporated) | 22 | 8.2% |
| Not-for-profit Organizations | 47 | 17.5% |
| Local Government Employees | 33 | 12.3% |
| State Government Employees | 21 | 7.8% |
| Federal Government Employees | 3 | 1.1% |
| Unpaid Family Workers | 0 | 0.0% |
| Total | 268 | 100.0% |
Employment Status by Age in Wibaux
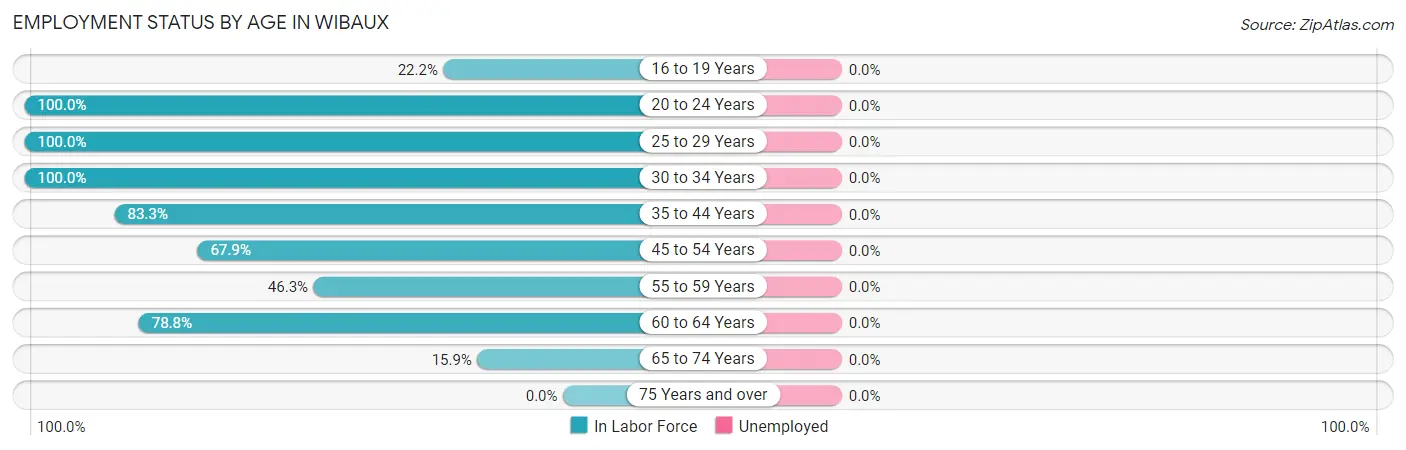
| Age Bracket | In Labor Force | Unemployed |
| 16 to 19 Years | 6 (22.2%) | 0 (0.0%) |
| 20 to 24 Years | 14 (100.0%) | 0 (0.0%) |
| 25 to 29 Years | 31 (100.0%) | 0 (0.0%) |
| 30 to 34 Years | 16 (100.0%) | 0 (0.0%) |
| 35 to 44 Years | 45 (83.3%) | 0 (0.0%) |
| 45 to 54 Years | 57 (67.9%) | 0 (0.0%) |
| 55 to 59 Years | 19 (46.3%) | 0 (0.0%) |
| 60 to 64 Years | 63 (78.8%) | 0 (0.0%) |
| 65 to 74 Years | 17 (15.9%) | 0 (0.0%) |
| 75 Years and over | 0 (0.0%) | 0 (0.0%) |
| Total | 268 (50.4%) | 0 (0.0%) |
Employment Status by Educational Attainment in Wibaux
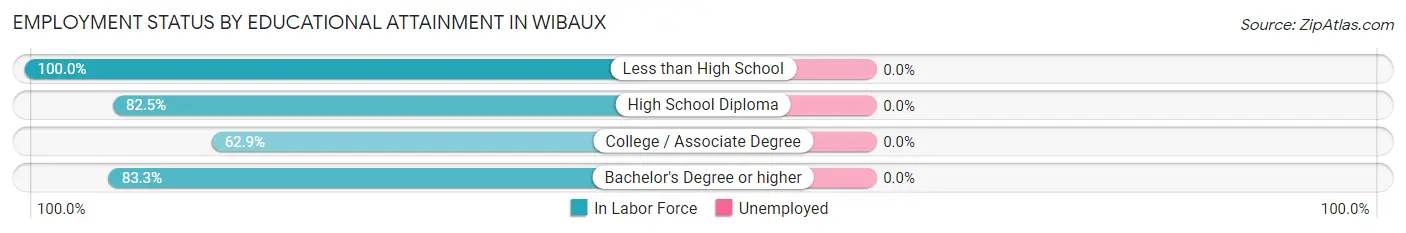
| Educational Attainment | In Labor Force | Unemployed |
| Less than High School | 5 (100.0%) | 0 (0.0%) |
| High School Diploma | 113 (82.5%) | 0 (0.0%) |
| College / Associate Degree | 73 (62.9%) | 0 (0.0%) |
| Bachelor's Degree or higher | 40 (83.3%) | 0 (0.0%) |
| Total | 231 (75.5%) | 0 (0.0%) |
Employment Occupations by Sex in Wibaux
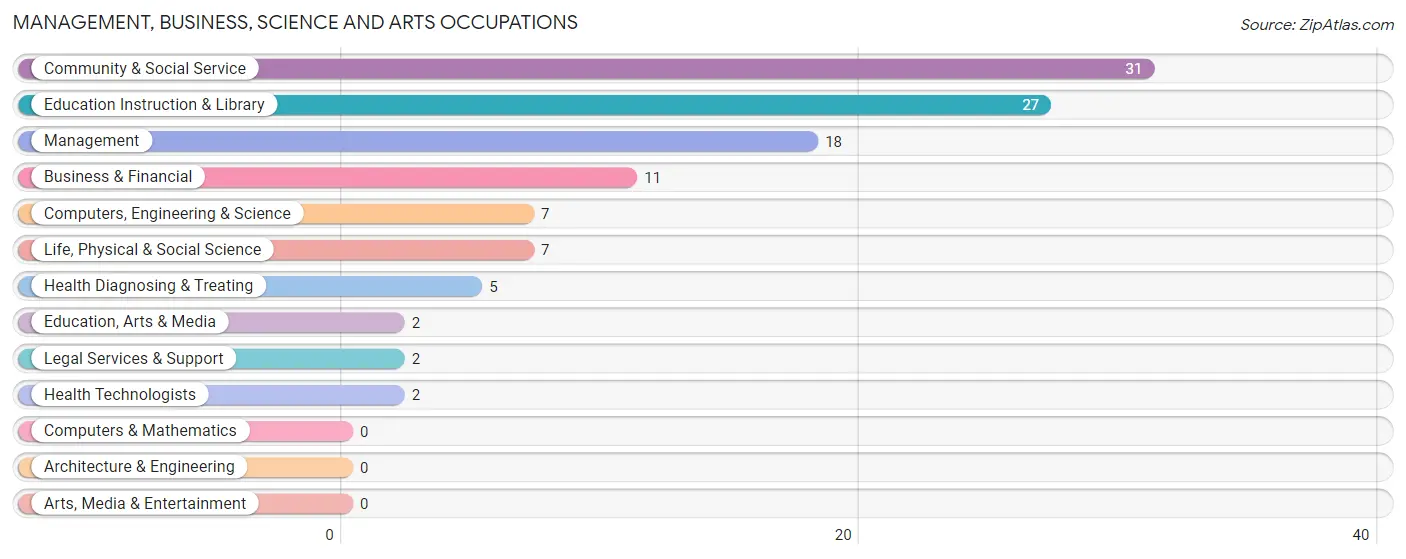
Management, Business, Science and Arts Occupations
The most common Management, Business, Science and Arts occupations in Wibaux are Community & Social Service (31 | 11.6%), Education Instruction & Library (27 | 10.1%), Management (18 | 6.7%), Business & Financial (11 | 4.1%), and Computers, Engineering & Science (7 | 2.6%).
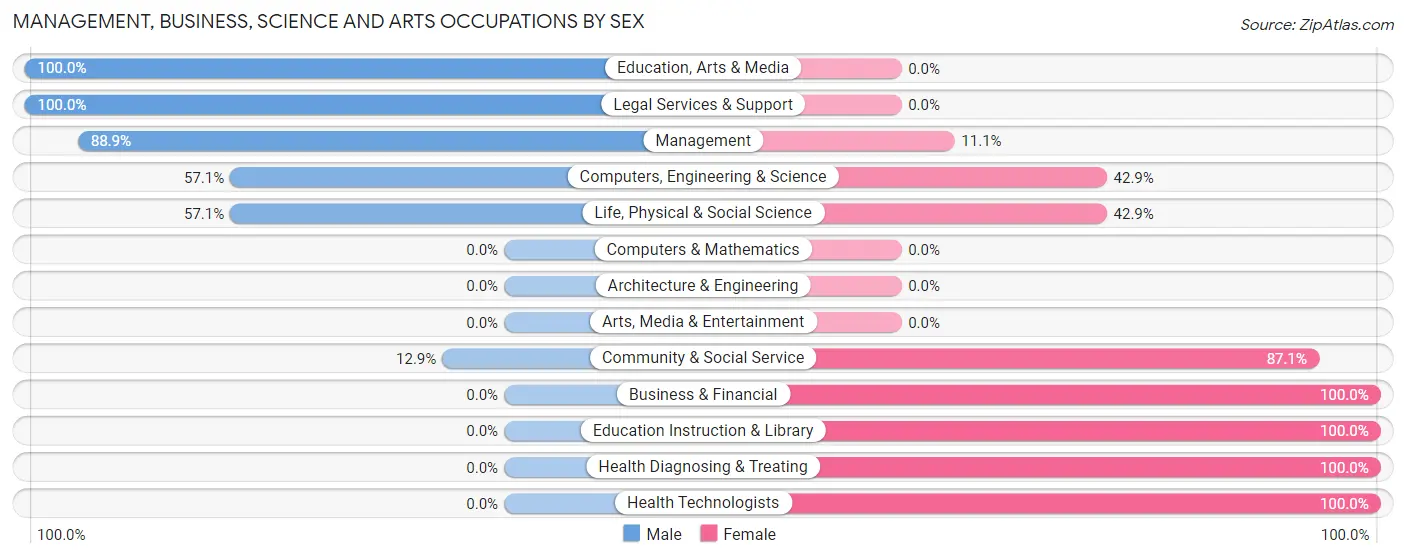
Management, Business, Science and Arts Occupations by Sex
Within the Management, Business, Science and Arts occupations in Wibaux, the most male-oriented occupations are Education, Arts & Media (100.0%), Legal Services & Support (100.0%), and Management (88.9%), while the most female-oriented occupations are Business & Financial (100.0%), Education Instruction & Library (100.0%), and Health Diagnosing & Treating (100.0%).
| Occupation | Male | Female |
| Management | 16 (88.9%) | 2 (11.1%) |
| Business & Financial | 0 (0.0%) | 11 (100.0%) |
| Computers, Engineering & Science | 4 (57.1%) | 3 (42.9%) |
| Computers & Mathematics | 0 (0.0%) | 0 (0.0%) |
| Architecture & Engineering | 0 (0.0%) | 0 (0.0%) |
| Life, Physical & Social Science | 4 (57.1%) | 3 (42.9%) |
| Community & Social Service | 4 (12.9%) | 27 (87.1%) |
| Education, Arts & Media | 2 (100.0%) | 0 (0.0%) |
| Legal Services & Support | 2 (100.0%) | 0 (0.0%) |
| Education Instruction & Library | 0 (0.0%) | 27 (100.0%) |
| Arts, Media & Entertainment | 0 (0.0%) | 0 (0.0%) |
| Health Diagnosing & Treating | 0 (0.0%) | 5 (100.0%) |
| Health Technologists | 0 (0.0%) | 2 (100.0%) |
| Total (Category) | 24 (33.3%) | 48 (66.7%) |
| Total (Overall) | 126 (47.0%) | 142 (53.0%) |
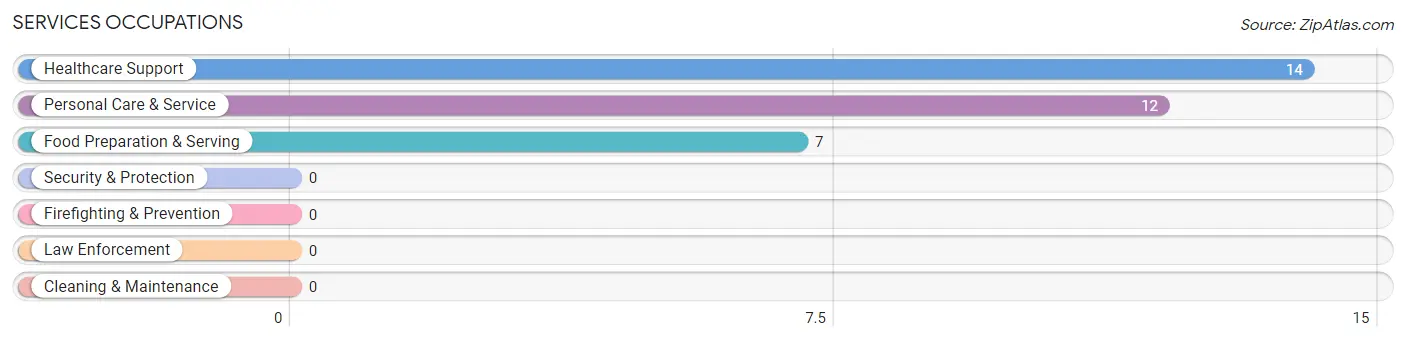
Services Occupations
The most common Services occupations in Wibaux are Healthcare Support (14 | 5.2%), Personal Care & Service (12 | 4.5%), and Food Preparation & Serving (7 | 2.6%).
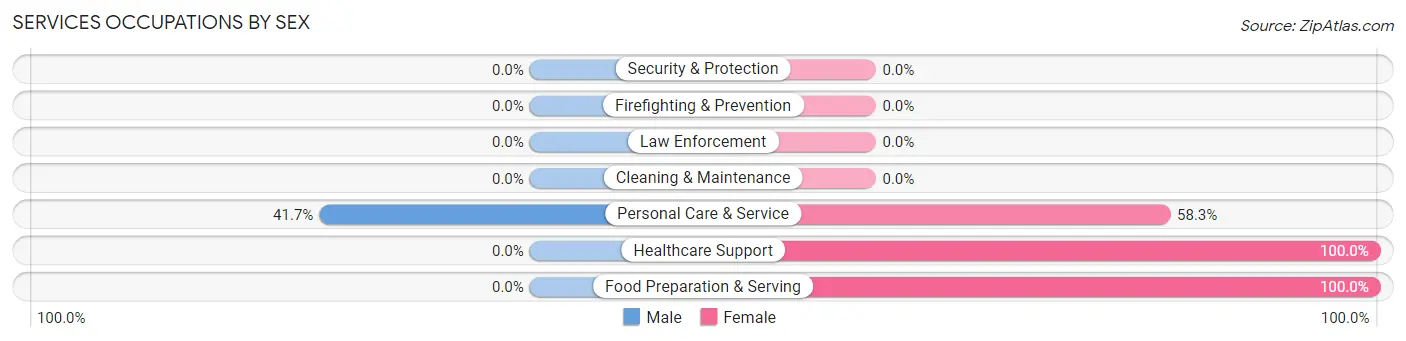
Services Occupations by Sex
| Occupation | Male | Female |
| Healthcare Support | 0 (0.0%) | 14 (100.0%) |
| Security & Protection | 0 (0.0%) | 0 (0.0%) |
| Firefighting & Prevention | 0 (0.0%) | 0 (0.0%) |
| Law Enforcement | 0 (0.0%) | 0 (0.0%) |
| Food Preparation & Serving | 0 (0.0%) | 7 (100.0%) |
| Cleaning & Maintenance | 0 (0.0%) | 0 (0.0%) |
| Personal Care & Service | 5 (41.7%) | 7 (58.3%) |
| Total (Category) | 5 (15.1%) | 28 (84.9%) |
| Total (Overall) | 126 (47.0%) | 142 (53.0%) |
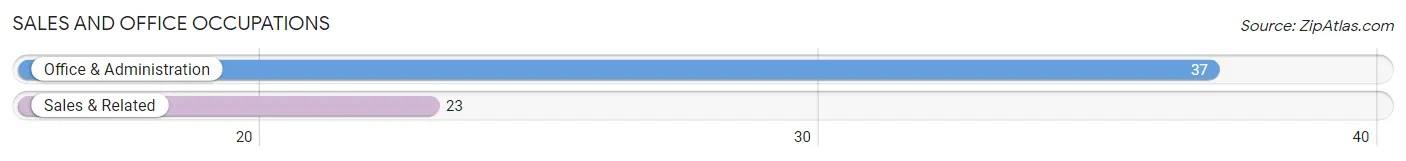
Sales and Office Occupations
The most common Sales and Office occupations in Wibaux are Office & Administration (37 | 13.8%), and Sales & Related (23 | 8.6%).
Sales and Office Occupations by Sex
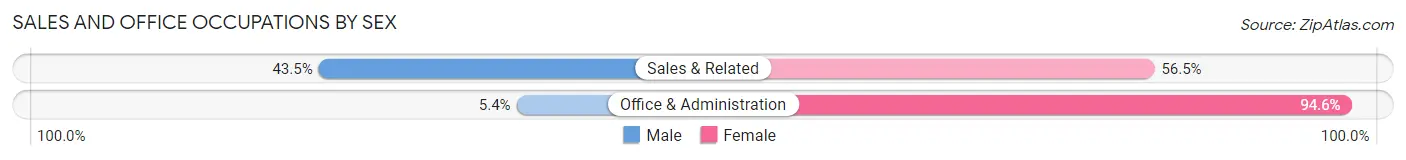
| Occupation | Male | Female |
| Sales & Related | 10 (43.5%) | 13 (56.5%) |
| Office & Administration | 2 (5.4%) | 35 (94.6%) |
| Total (Category) | 12 (20.0%) | 48 (80.0%) |
| Total (Overall) | 126 (47.0%) | 142 (53.0%) |
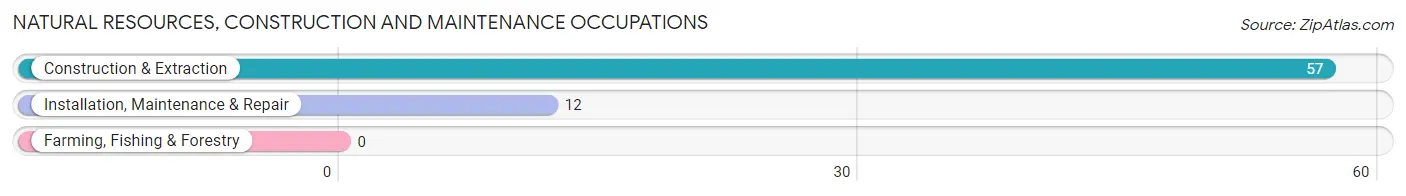
Natural Resources, Construction and Maintenance Occupations
The most common Natural Resources, Construction and Maintenance occupations in Wibaux are Construction & Extraction (57 | 21.3%), and Installation, Maintenance & Repair (12 | 4.5%).
Natural Resources, Construction and Maintenance Occupations by Sex
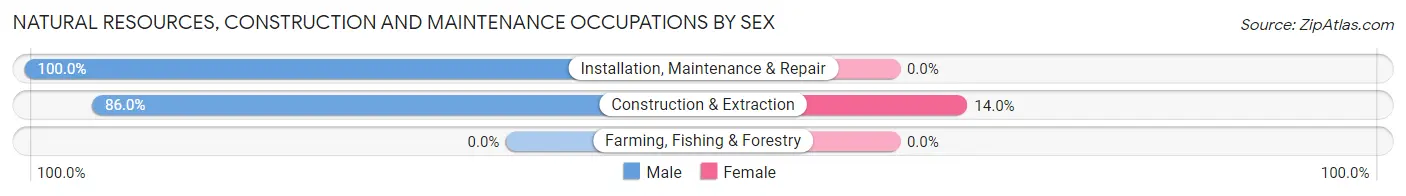
| Occupation | Male | Female |
| Farming, Fishing & Forestry | 0 (0.0%) | 0 (0.0%) |
| Construction & Extraction | 49 (86.0%) | 8 (14.0%) |
| Installation, Maintenance & Repair | 12 (100.0%) | 0 (0.0%) |
| Total (Category) | 61 (88.4%) | 8 (11.6%) |
| Total (Overall) | 126 (47.0%) | 142 (53.0%) |
Production, Transportation and Moving Occupations
The most common Production, Transportation and Moving occupations in Wibaux are Transportation (24 | 9.0%), and Material Moving (10 | 3.7%).
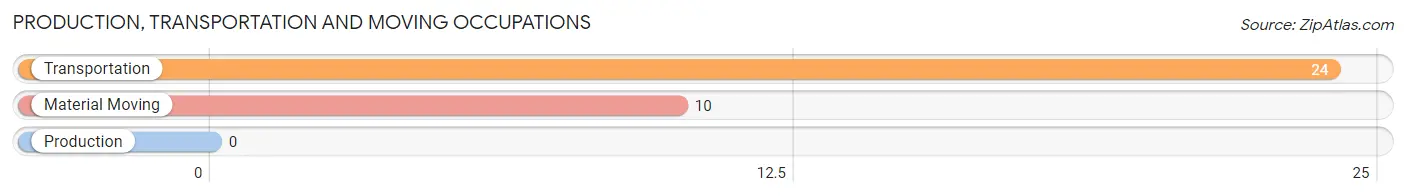
Production, Transportation and Moving Occupations by Sex
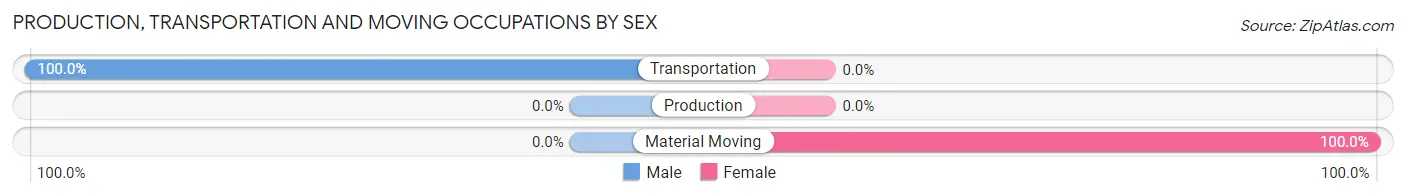
| Occupation | Male | Female |
| Production | 0 (0.0%) | 0 (0.0%) |
| Transportation | 24 (100.0%) | 0 (0.0%) |
| Material Moving | 0 (0.0%) | 10 (100.0%) |
| Total (Category) | 24 (70.6%) | 10 (29.4%) |
| Total (Overall) | 126 (47.0%) | 142 (53.0%) |
Employment Industries by Sex in Wibaux
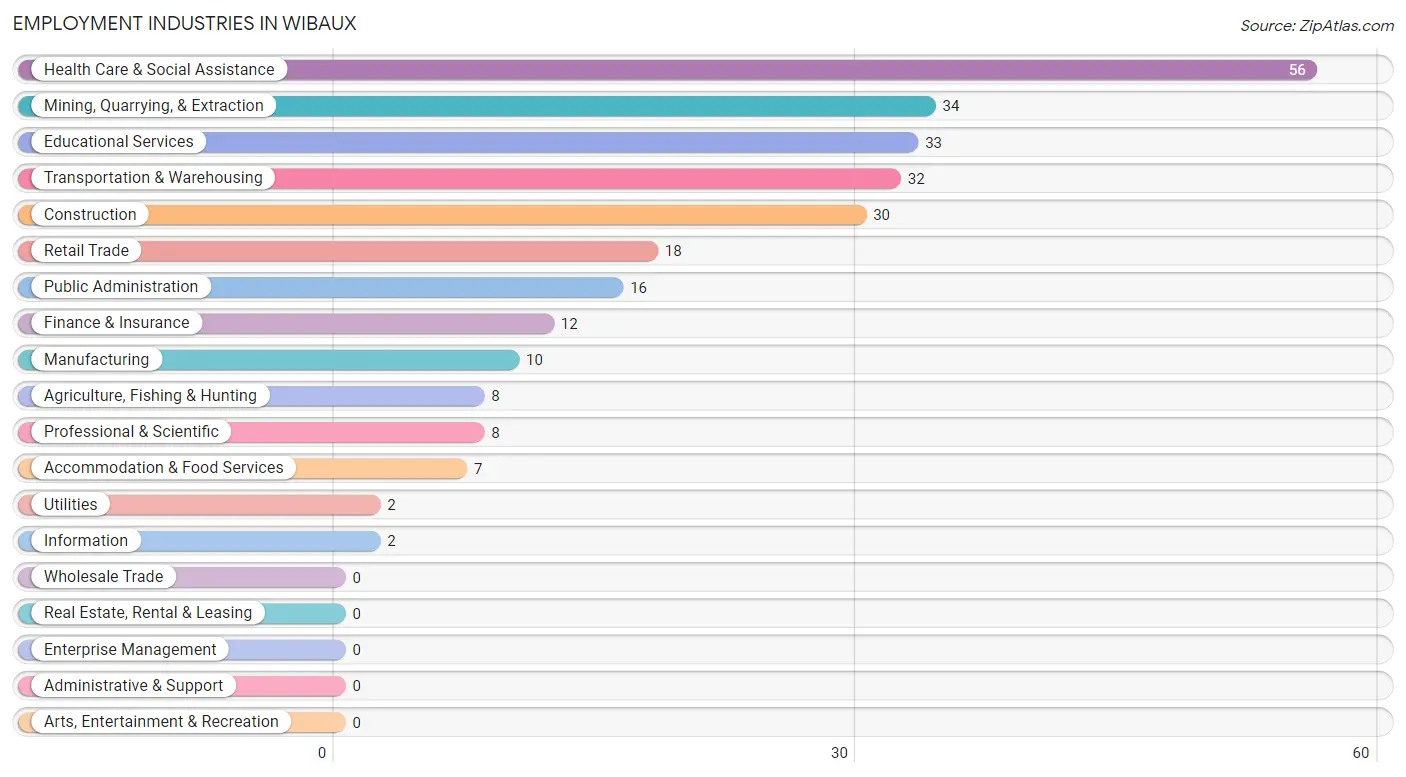
Employment Industries in Wibaux
The major employment industries in Wibaux include Health Care & Social Assistance (56 | 20.9%), Mining, Quarrying, & Extraction (34 | 12.7%), Educational Services (33 | 12.3%), Transportation & Warehousing (32 | 11.9%), and Construction (30 | 11.2%).
Employment Industries by Sex in Wibaux
The Wibaux industries that see more men than women are Agriculture, Fishing & Hunting (100.0%), Mining, Quarrying, & Extraction (100.0%), and Transportation & Warehousing (100.0%), whereas the industries that tend to have a higher number of women are Manufacturing (100.0%), Utilities (100.0%), and Information (100.0%).
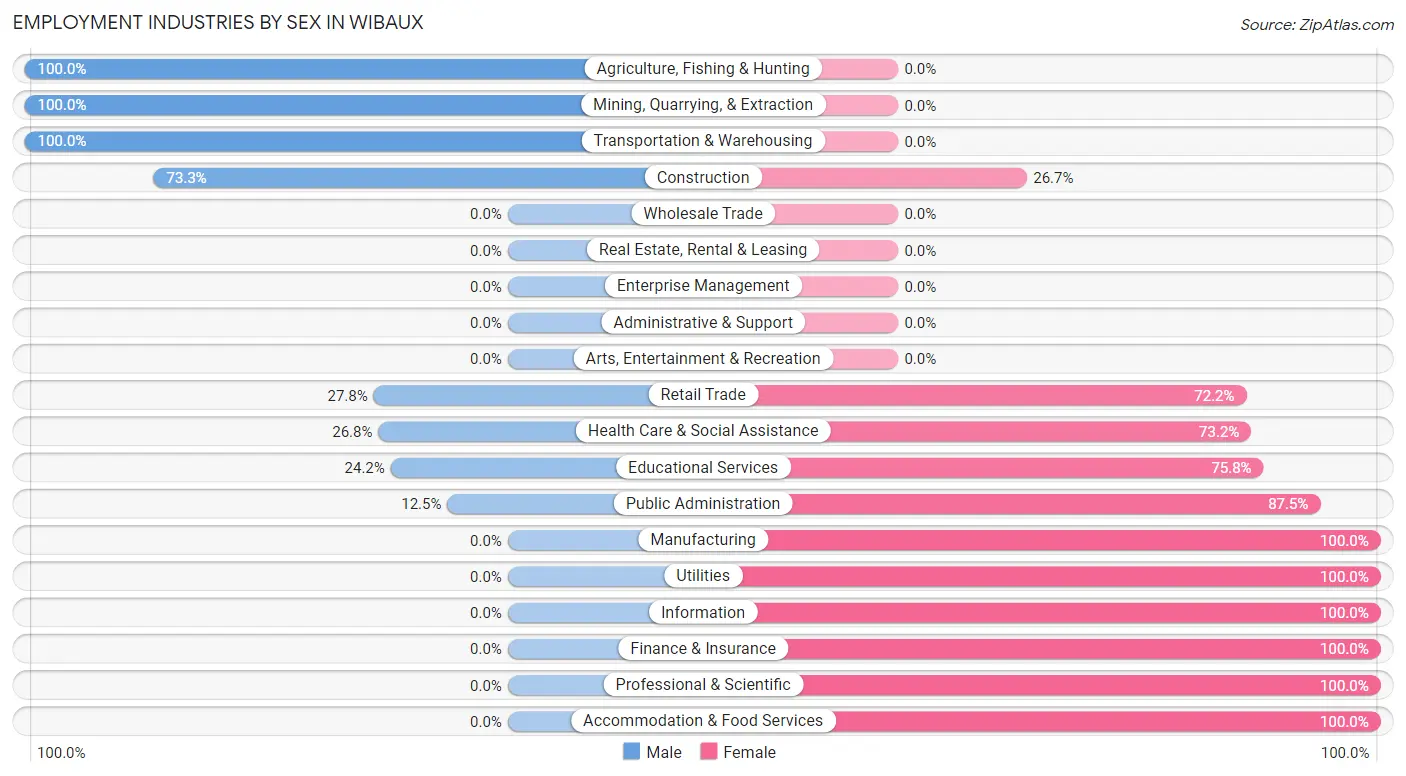
| Industry | Male | Female |
| Agriculture, Fishing & Hunting | 8 (100.0%) | 0 (0.0%) |
| Mining, Quarrying, & Extraction | 34 (100.0%) | 0 (0.0%) |
| Construction | 22 (73.3%) | 8 (26.7%) |
| Manufacturing | 0 (0.0%) | 10 (100.0%) |
| Wholesale Trade | 0 (0.0%) | 0 (0.0%) |
| Retail Trade | 5 (27.8%) | 13 (72.2%) |
| Transportation & Warehousing | 32 (100.0%) | 0 (0.0%) |
| Utilities | 0 (0.0%) | 2 (100.0%) |
| Information | 0 (0.0%) | 2 (100.0%) |
| Finance & Insurance | 0 (0.0%) | 12 (100.0%) |
| Real Estate, Rental & Leasing | 0 (0.0%) | 0 (0.0%) |
| Professional & Scientific | 0 (0.0%) | 8 (100.0%) |
| Enterprise Management | 0 (0.0%) | 0 (0.0%) |
| Administrative & Support | 0 (0.0%) | 0 (0.0%) |
| Educational Services | 8 (24.2%) | 25 (75.8%) |
| Health Care & Social Assistance | 15 (26.8%) | 41 (73.2%) |
| Arts, Entertainment & Recreation | 0 (0.0%) | 0 (0.0%) |
| Accommodation & Food Services | 0 (0.0%) | 7 (100.0%) |
| Public Administration | 2 (12.5%) | 14 (87.5%) |
| Total | 126 (47.0%) | 142 (53.0%) |
Education in Wibaux
School Enrollment in Wibaux
The most common levels of schooling among the 107 students in Wibaux are high school (39 | 36.4%), elementary school (31 | 29.0%), and middle school (25 | 23.4%).
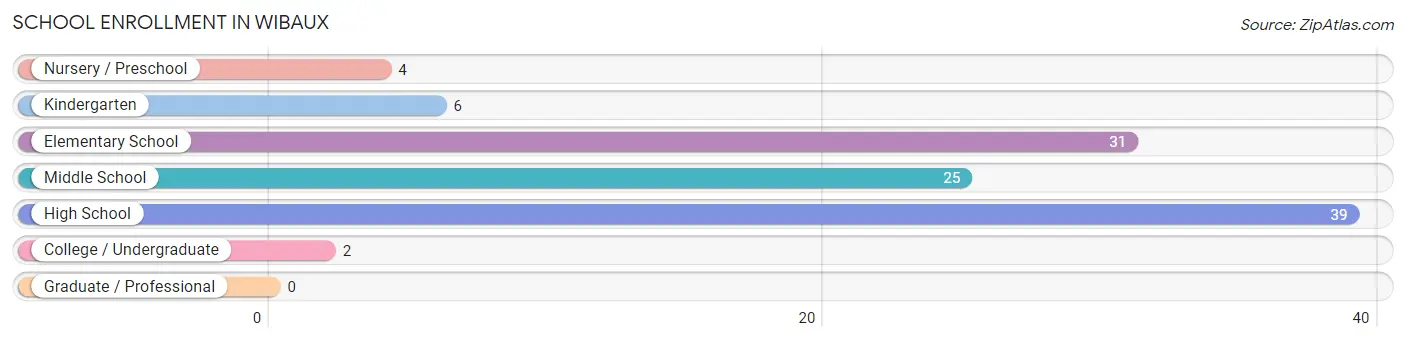
| School Level | # Students | % Students |
| Nursery / Preschool | 4 | 3.7% |
| Kindergarten | 6 | 5.6% |
| Elementary School | 31 | 29.0% |
| Middle School | 25 | 23.4% |
| High School | 39 | 36.4% |
| College / Undergraduate | 2 | 1.9% |
| Graduate / Professional | 0 | 0.0% |
| Total | 107 | 100.0% |
School Enrollment by Age by Funding Source in Wibaux
Out of a total of 107 students who are enrolled in schools in Wibaux, 10 (9.3%) attend a private institution, while the remaining 97 (90.7%) are enrolled in public schools. The age group of 15 to 17 year olds has the highest likelihood of being enrolled in private schools, with 10 (32.3% in the age bracket) enrolled. Conversely, the age group of 3 to 4 year olds has the lowest likelihood of being enrolled in a private school, with 4 (100.0% in the age bracket) attending a public institution.
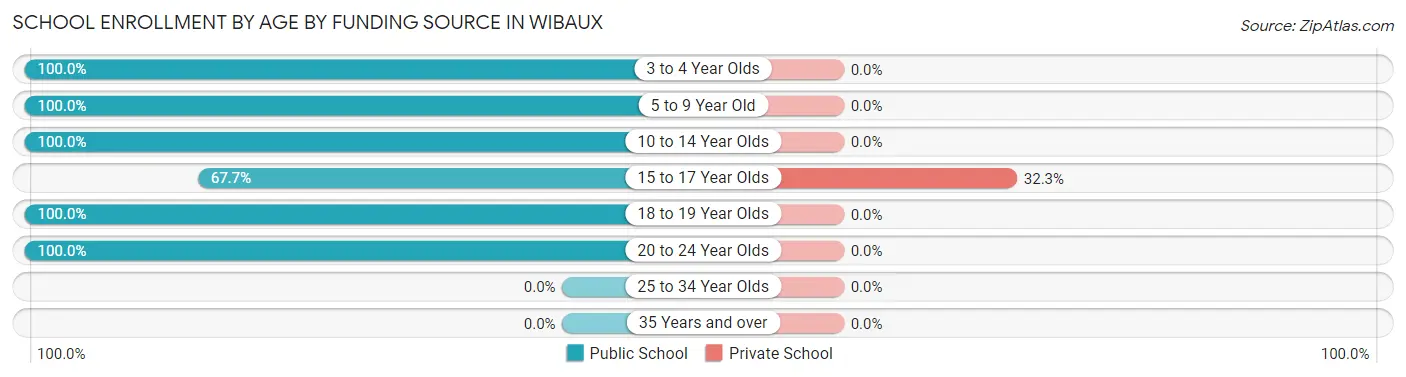
| Age Bracket | Public School | Private School |
| 3 to 4 Year Olds | 4 (100.0%) | 0 (0.0%) |
| 5 to 9 Year Old | 35 (100.0%) | 0 (0.0%) |
| 10 to 14 Year Olds | 29 (100.0%) | 0 (0.0%) |
| 15 to 17 Year Olds | 21 (67.7%) | 10 (32.3%) |
| 18 to 19 Year Olds | 6 (100.0%) | 0 (0.0%) |
| 20 to 24 Year Olds | 2 (100.0%) | 0 (0.0%) |
| 25 to 34 Year Olds | 0 (0.0%) | 0 (0.0%) |
| 35 Years and over | 0 (0.0%) | 0 (0.0%) |
| Total | 97 (90.7%) | 10 (9.3%) |
Educational Attainment by Field of Study in Wibaux
Education (48 | 51.1%), arts & humanities (21 | 22.3%), bio, nature & agricultural (7 | 7.4%), physical & health sciences (5 | 5.3%), and business (5 | 5.3%) are the most common fields of study among 94 individuals in Wibaux who have obtained a bachelor's degree or higher.
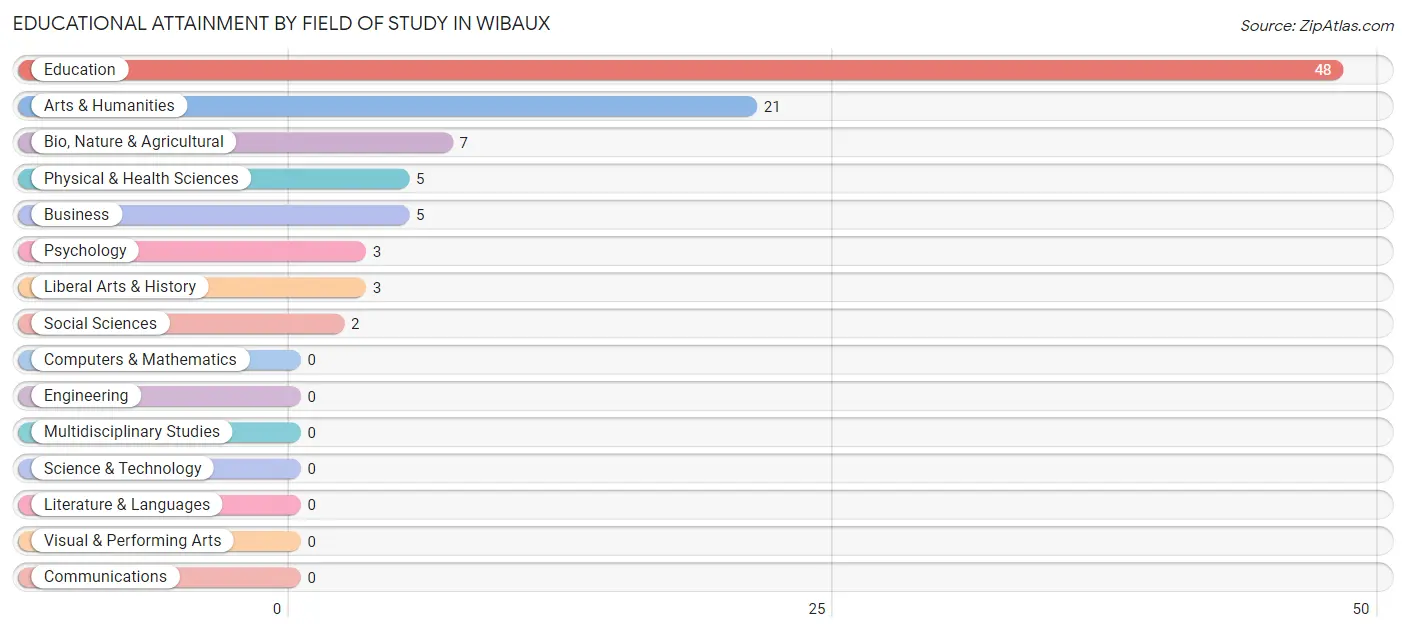
| Field of Study | # Graduates | % Graduates |
| Computers & Mathematics | 0 | 0.0% |
| Bio, Nature & Agricultural | 7 | 7.4% |
| Physical & Health Sciences | 5 | 5.3% |
| Psychology | 3 | 3.2% |
| Social Sciences | 2 | 2.1% |
| Engineering | 0 | 0.0% |
| Multidisciplinary Studies | 0 | 0.0% |
| Science & Technology | 0 | 0.0% |
| Business | 5 | 5.3% |
| Education | 48 | 51.1% |
| Literature & Languages | 0 | 0.0% |
| Liberal Arts & History | 3 | 3.2% |
| Visual & Performing Arts | 0 | 0.0% |
| Communications | 0 | 0.0% |
| Arts & Humanities | 21 | 22.3% |
| Total | 94 | 100.0% |
Transportation & Commute in Wibaux
Vehicle Availability by Sex in Wibaux
The most prevalent vehicle ownership categories in Wibaux are males with 3 vehicles (46, accounting for 36.5%) and females with 3 vehicles (50, making up 32.4%).
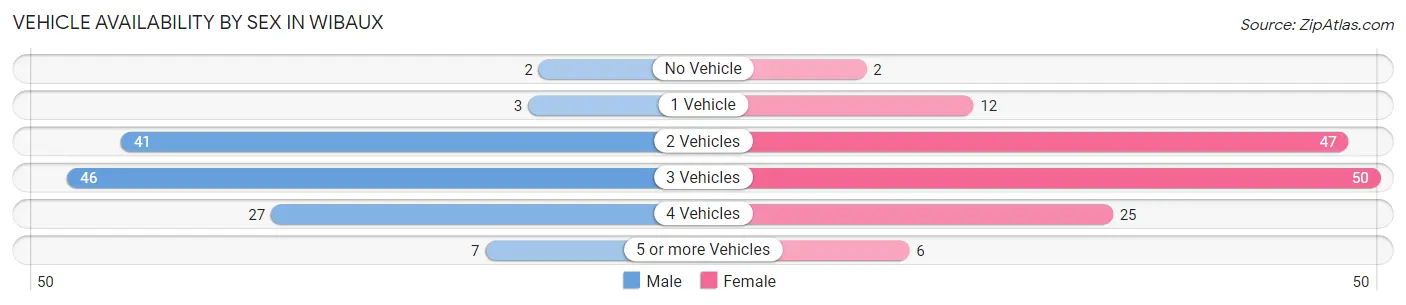
| Vehicles Available | Male | Female |
| No Vehicle | 2 (1.6%) | 2 (1.4%) |
| 1 Vehicle | 3 (2.4%) | 12 (8.5%) |
| 2 Vehicles | 41 (32.5%) | 47 (33.1%) |
| 3 Vehicles | 46 (36.5%) | 50 (35.2%) |
| 4 Vehicles | 27 (21.4%) | 25 (17.6%) |
| 5 or more Vehicles | 7 (5.6%) | 6 (4.2%) |
| Total | 126 (100.0%) | 142 (100.0%) |
Commute Time in Wibaux
The most frequently occuring commute durations in Wibaux are 5 to 9 minutes (73 commuters, 29.4%), less than 5 minutes (52 commuters, 21.0%), and 15 to 19 minutes (38 commuters, 15.3%).
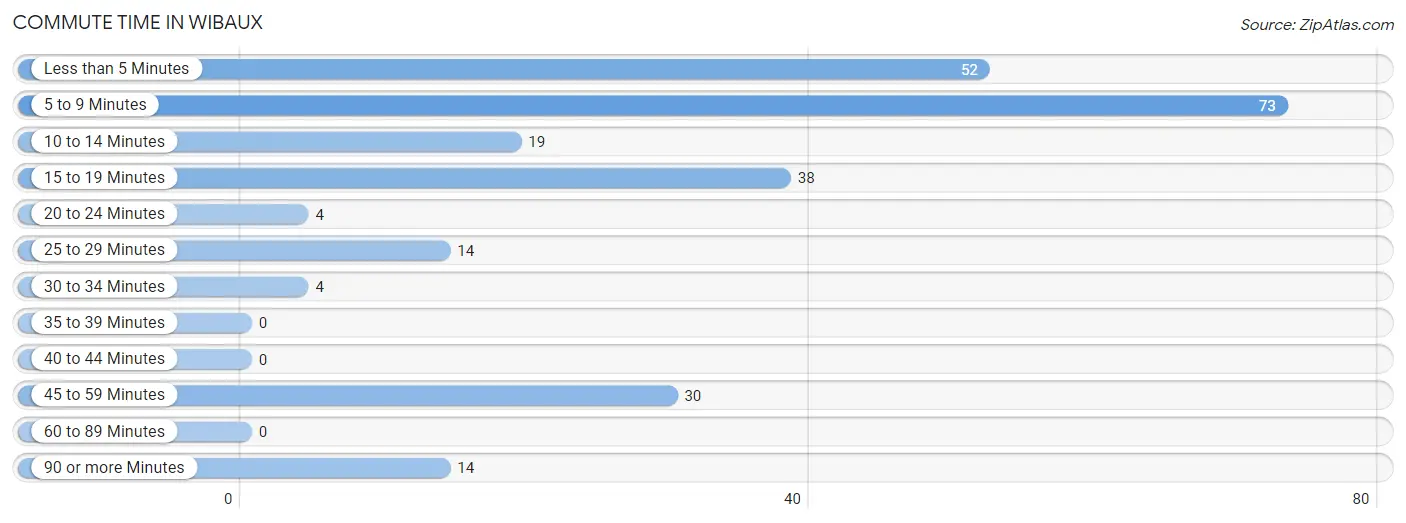
| Commute Time | # Commuters | % Commuters |
| Less than 5 Minutes | 52 | 21.0% |
| 5 to 9 Minutes | 73 | 29.4% |
| 10 to 14 Minutes | 19 | 7.7% |
| 15 to 19 Minutes | 38 | 15.3% |
| 20 to 24 Minutes | 4 | 1.6% |
| 25 to 29 Minutes | 14 | 5.7% |
| 30 to 34 Minutes | 4 | 1.6% |
| 35 to 39 Minutes | 0 | 0.0% |
| 40 to 44 Minutes | 0 | 0.0% |
| 45 to 59 Minutes | 30 | 12.1% |
| 60 to 89 Minutes | 0 | 0.0% |
| 90 or more Minutes | 14 | 5.7% |
Commute Time by Sex in Wibaux
The most common commute times in Wibaux are 45 to 59 minutes (30 commuters, 25.6%) for males and 5 to 9 minutes (46 commuters, 35.1%) for females.
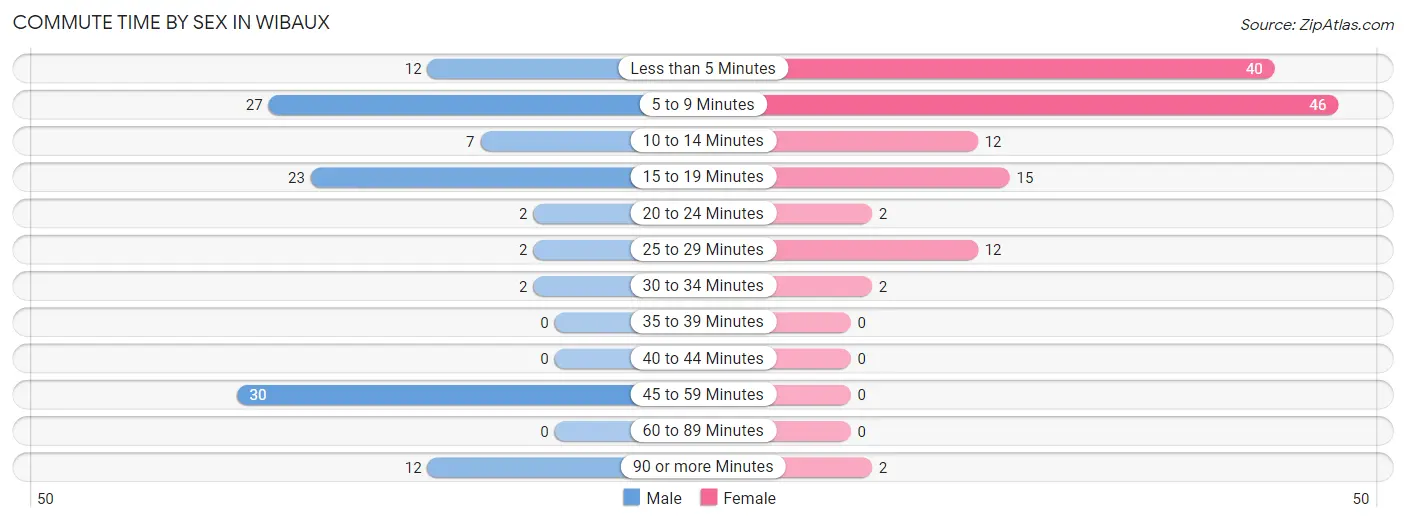
| Commute Time | Male | Female |
| Less than 5 Minutes | 12 (10.3%) | 40 (30.5%) |
| 5 to 9 Minutes | 27 (23.1%) | 46 (35.1%) |
| 10 to 14 Minutes | 7 (6.0%) | 12 (9.2%) |
| 15 to 19 Minutes | 23 (19.7%) | 15 (11.5%) |
| 20 to 24 Minutes | 2 (1.7%) | 2 (1.5%) |
| 25 to 29 Minutes | 2 (1.7%) | 12 (9.2%) |
| 30 to 34 Minutes | 2 (1.7%) | 2 (1.5%) |
| 35 to 39 Minutes | 0 (0.0%) | 0 (0.0%) |
| 40 to 44 Minutes | 0 (0.0%) | 0 (0.0%) |
| 45 to 59 Minutes | 30 (25.6%) | 0 (0.0%) |
| 60 to 89 Minutes | 0 (0.0%) | 0 (0.0%) |
| 90 or more Minutes | 12 (10.3%) | 2 (1.5%) |
Time of Departure to Work by Sex in Wibaux
The most frequent times of departure to work in Wibaux are 12:00 AM to 4:59 AM (24, 20.5%) for males and 7:30 AM to 7:59 AM (57, 43.5%) for females.
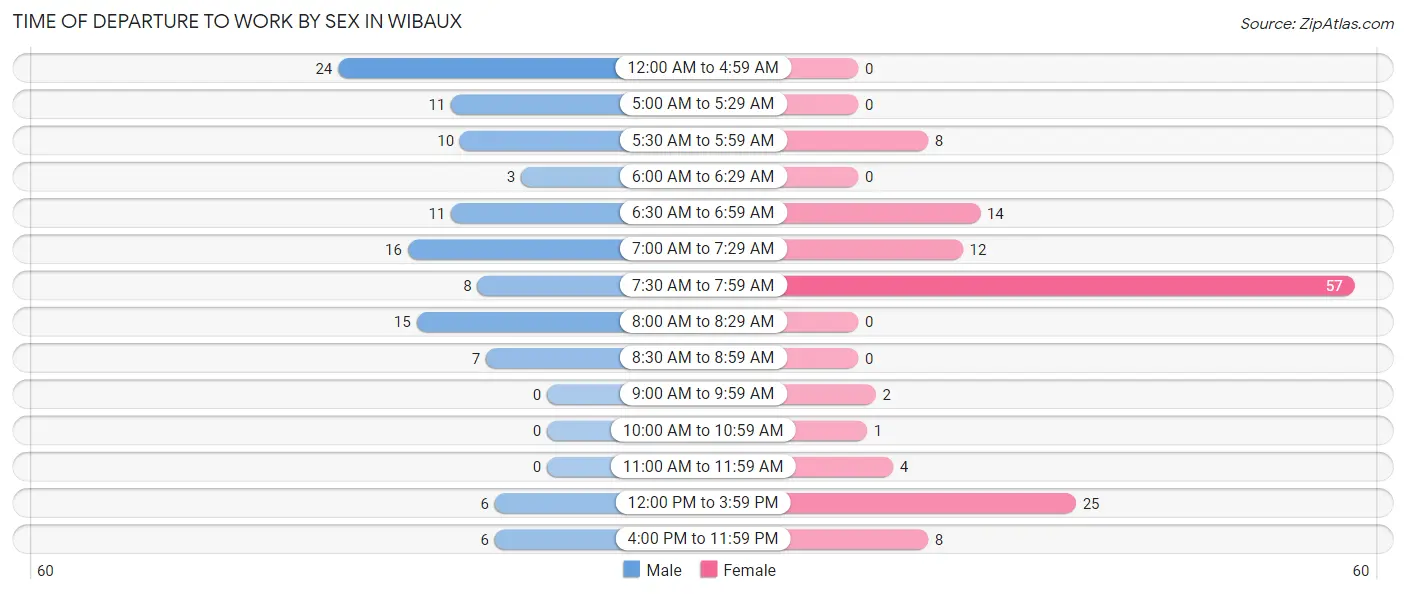
| Time of Departure | Male | Female |
| 12:00 AM to 4:59 AM | 24 (20.5%) | 0 (0.0%) |
| 5:00 AM to 5:29 AM | 11 (9.4%) | 0 (0.0%) |
| 5:30 AM to 5:59 AM | 10 (8.6%) | 8 (6.1%) |
| 6:00 AM to 6:29 AM | 3 (2.6%) | 0 (0.0%) |
| 6:30 AM to 6:59 AM | 11 (9.4%) | 14 (10.7%) |
| 7:00 AM to 7:29 AM | 16 (13.7%) | 12 (9.2%) |
| 7:30 AM to 7:59 AM | 8 (6.8%) | 57 (43.5%) |
| 8:00 AM to 8:29 AM | 15 (12.8%) | 0 (0.0%) |
| 8:30 AM to 8:59 AM | 7 (6.0%) | 0 (0.0%) |
| 9:00 AM to 9:59 AM | 0 (0.0%) | 2 (1.5%) |
| 10:00 AM to 10:59 AM | 0 (0.0%) | 1 (0.8%) |
| 11:00 AM to 11:59 AM | 0 (0.0%) | 4 (3.0%) |
| 12:00 PM to 3:59 PM | 6 (5.1%) | 25 (19.1%) |
| 4:00 PM to 11:59 PM | 6 (5.1%) | 8 (6.1%) |
| Total | 117 (100.0%) | 131 (100.0%) |
Housing Occupancy in Wibaux
Occupancy by Ownership in Wibaux
Of the total 296 dwellings in Wibaux, owner-occupied units account for 244 (82.4%), while renter-occupied units make up 52 (17.6%).
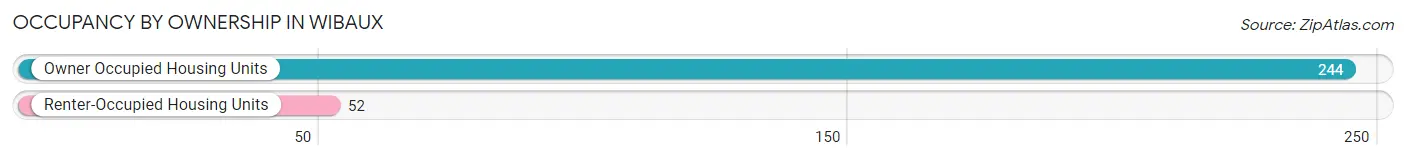
| Occupancy | # Housing Units | % Housing Units |
| Owner Occupied Housing Units | 244 | 82.4% |
| Renter-Occupied Housing Units | 52 | 17.6% |
| Total Occupied Housing Units | 296 | 100.0% |
Occupancy by Household Size in Wibaux
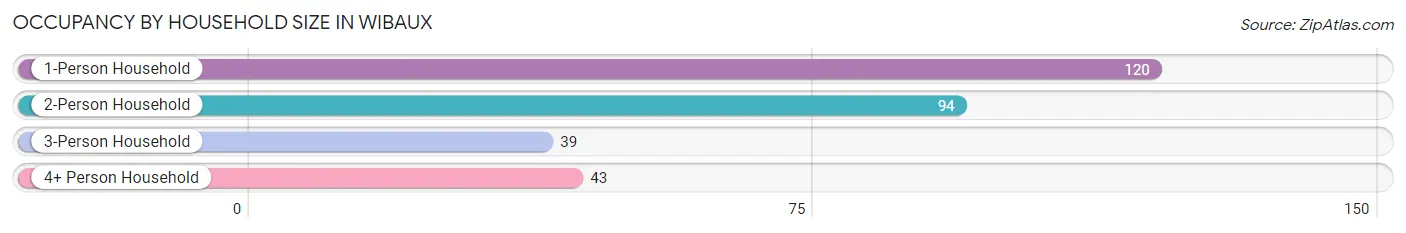
| Household Size | # Housing Units | % Housing Units |
| 1-Person Household | 120 | 40.5% |
| 2-Person Household | 94 | 31.8% |
| 3-Person Household | 39 | 13.2% |
| 4+ Person Household | 43 | 14.5% |
| Total Housing Units | 296 | 100.0% |
Occupancy by Ownership by Household Size in Wibaux
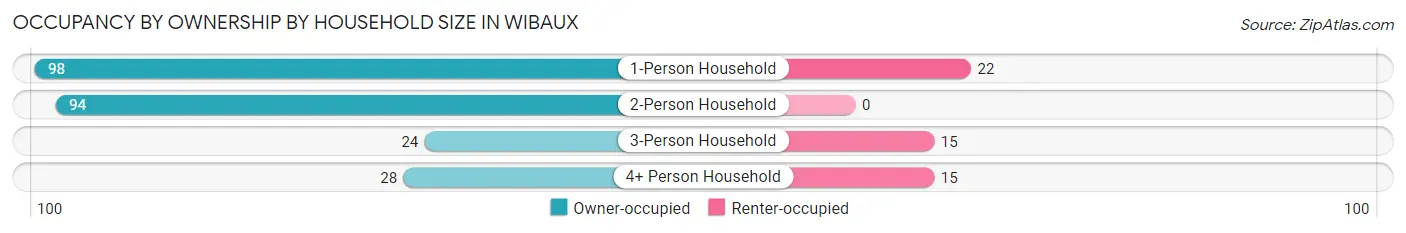
| Household Size | Owner-occupied | Renter-occupied |
| 1-Person Household | 98 (81.7%) | 22 (18.3%) |
| 2-Person Household | 94 (100.0%) | 0 (0.0%) |
| 3-Person Household | 24 (61.5%) | 15 (38.5%) |
| 4+ Person Household | 28 (65.1%) | 15 (34.9%) |
| Total Housing Units | 244 (82.4%) | 52 (17.6%) |
Occupancy by Educational Attainment in Wibaux
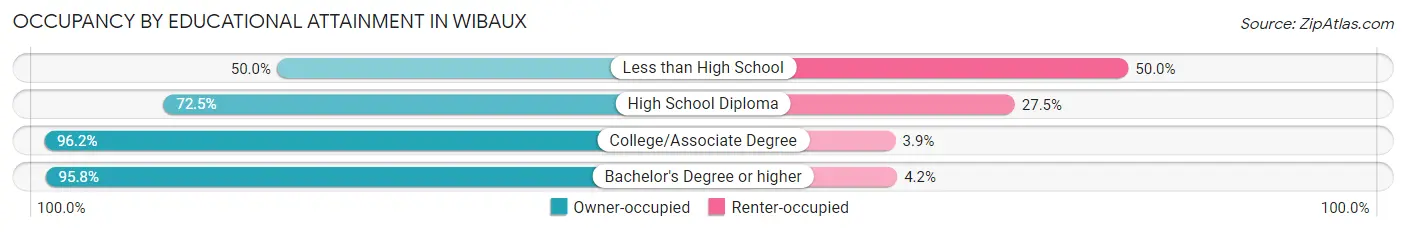
| Household Size | Owner-occupied | Renter-occupied |
| Less than High School | 13 (50.0%) | 13 (50.0%) |
| High School Diploma | 87 (72.5%) | 33 (27.5%) |
| College/Associate Degree | 75 (96.2%) | 3 (3.8%) |
| Bachelor's Degree or higher | 69 (95.8%) | 3 (4.2%) |
Occupancy by Age of Householder in Wibaux
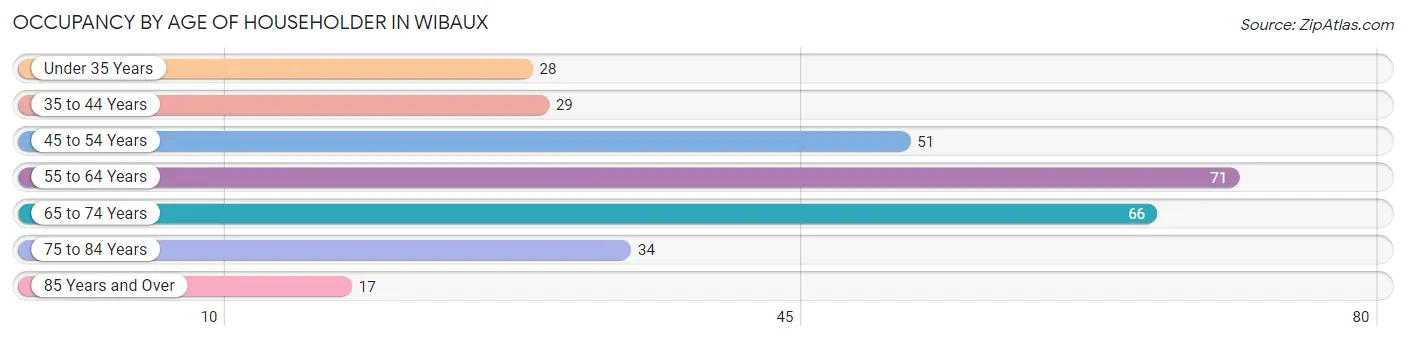
| Age Bracket | # Households | % Households |
| Under 35 Years | 28 | 9.5% |
| 35 to 44 Years | 29 | 9.8% |
| 45 to 54 Years | 51 | 17.2% |
| 55 to 64 Years | 71 | 24.0% |
| 65 to 74 Years | 66 | 22.3% |
| 75 to 84 Years | 34 | 11.5% |
| 85 Years and Over | 17 | 5.7% |
| Total | 296 | 100.0% |
Housing Finances in Wibaux
Median Income by Occupancy in Wibaux
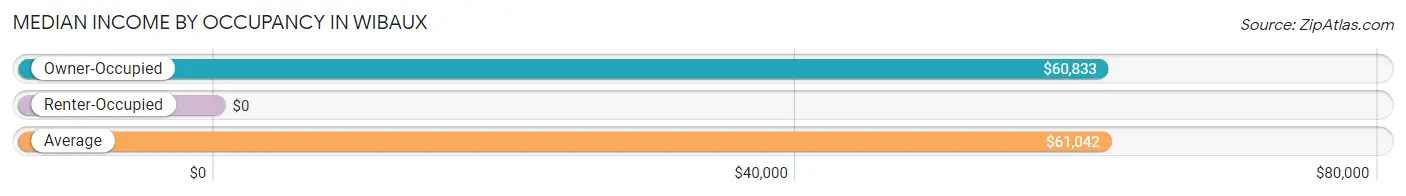
| Occupancy Type | # Households | Median Income |
| Owner-Occupied | 244 (82.4%) | $60,833 |
| Renter-Occupied | 52 (17.6%) | $0 |
| Average | 296 (100.0%) | $61,042 |
Occupancy by Householder Income Bracket in Wibaux
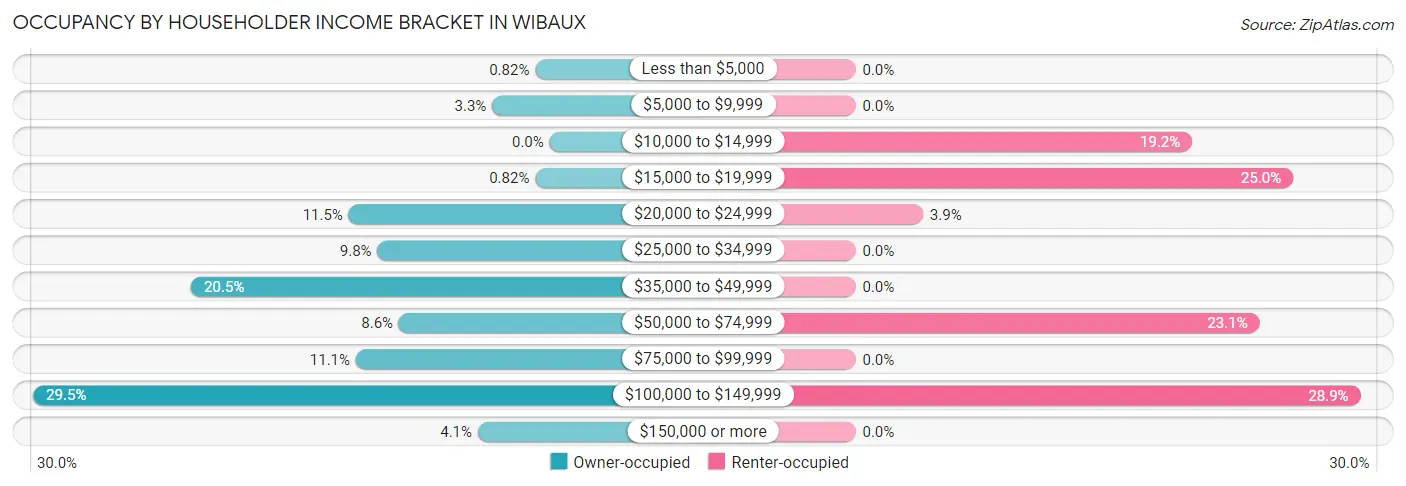
| Income Bracket | Owner-occupied | Renter-occupied |
| Less than $5,000 | 2 (0.8%) | 0 (0.0%) |
| $5,000 to $9,999 | 8 (3.3%) | 0 (0.0%) |
| $10,000 to $14,999 | 0 (0.0%) | 10 (19.2%) |
| $15,000 to $19,999 | 2 (0.8%) | 13 (25.0%) |
| $20,000 to $24,999 | 28 (11.5%) | 2 (3.8%) |
| $25,000 to $34,999 | 24 (9.8%) | 0 (0.0%) |
| $35,000 to $49,999 | 50 (20.5%) | 0 (0.0%) |
| $50,000 to $74,999 | 21 (8.6%) | 12 (23.1%) |
| $75,000 to $99,999 | 27 (11.1%) | 0 (0.0%) |
| $100,000 to $149,999 | 72 (29.5%) | 15 (28.8%) |
| $150,000 or more | 10 (4.1%) | 0 (0.0%) |
| Total | 244 (100.0%) | 52 (100.0%) |
Monthly Housing Cost Tiers in Wibaux
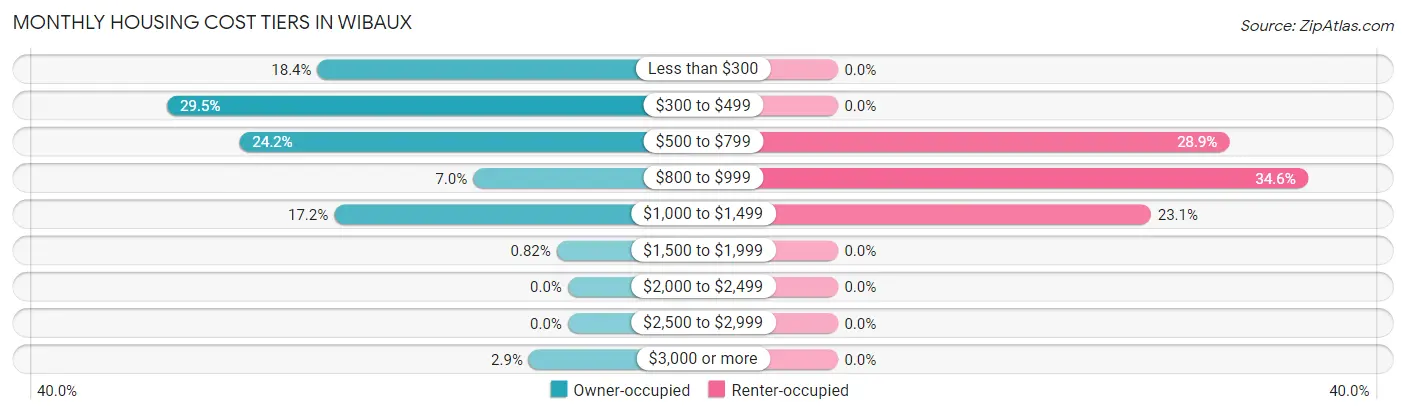
| Monthly Cost | Owner-occupied | Renter-occupied |
| Less than $300 | 45 (18.4%) | 0 (0.0%) |
| $300 to $499 | 72 (29.5%) | 0 (0.0%) |
| $500 to $799 | 59 (24.2%) | 15 (28.8%) |
| $800 to $999 | 17 (7.0%) | 18 (34.6%) |
| $1,000 to $1,499 | 42 (17.2%) | 12 (23.1%) |
| $1,500 to $1,999 | 2 (0.8%) | 0 (0.0%) |
| $2,000 to $2,499 | 0 (0.0%) | 0 (0.0%) |
| $2,500 to $2,999 | 0 (0.0%) | 0 (0.0%) |
| $3,000 or more | 7 (2.9%) | 0 (0.0%) |
| Total | 244 (100.0%) | 52 (100.0%) |
Physical Housing Characteristics in Wibaux
Housing Structures in Wibaux
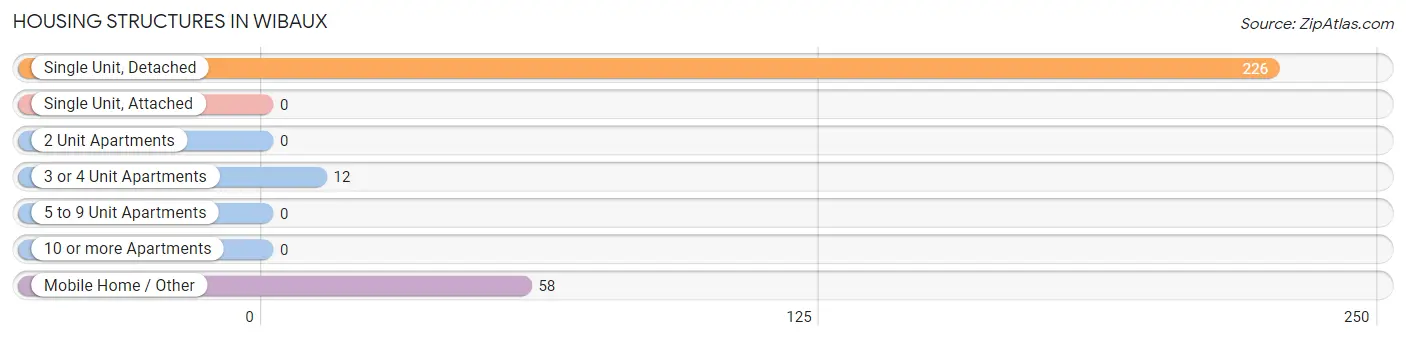
| Structure Type | # Housing Units | % Housing Units |
| Single Unit, Detached | 226 | 76.3% |
| Single Unit, Attached | 0 | 0.0% |
| 2 Unit Apartments | 0 | 0.0% |
| 3 or 4 Unit Apartments | 12 | 4.1% |
| 5 to 9 Unit Apartments | 0 | 0.0% |
| 10 or more Apartments | 0 | 0.0% |
| Mobile Home / Other | 58 | 19.6% |
| Total | 296 | 100.0% |
Housing Structures by Occupancy in Wibaux
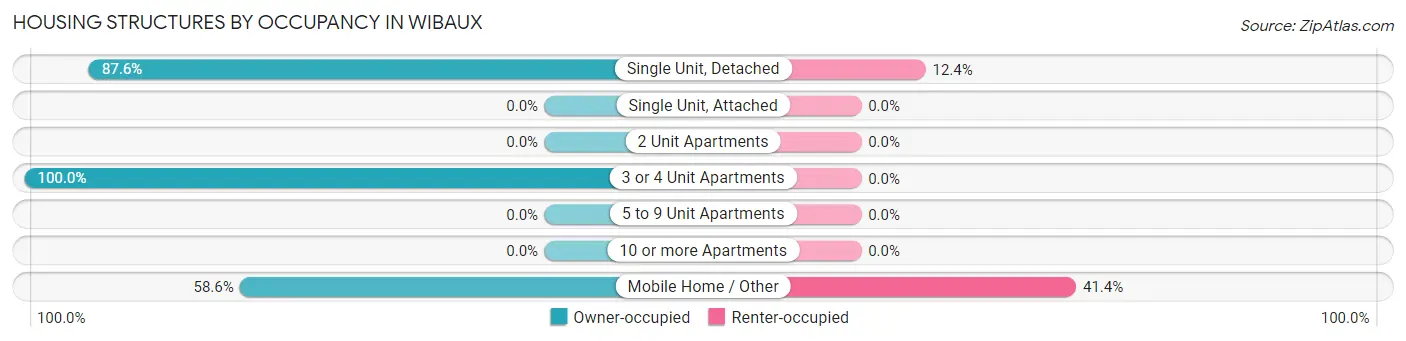
| Structure Type | Owner-occupied | Renter-occupied |
| Single Unit, Detached | 198 (87.6%) | 28 (12.4%) |
| Single Unit, Attached | 0 (0.0%) | 0 (0.0%) |
| 2 Unit Apartments | 0 (0.0%) | 0 (0.0%) |
| 3 or 4 Unit Apartments | 12 (100.0%) | 0 (0.0%) |
| 5 to 9 Unit Apartments | 0 (0.0%) | 0 (0.0%) |
| 10 or more Apartments | 0 (0.0%) | 0 (0.0%) |
| Mobile Home / Other | 34 (58.6%) | 24 (41.4%) |
| Total | 244 (82.4%) | 52 (17.6%) |
Housing Structures by Number of Rooms in Wibaux
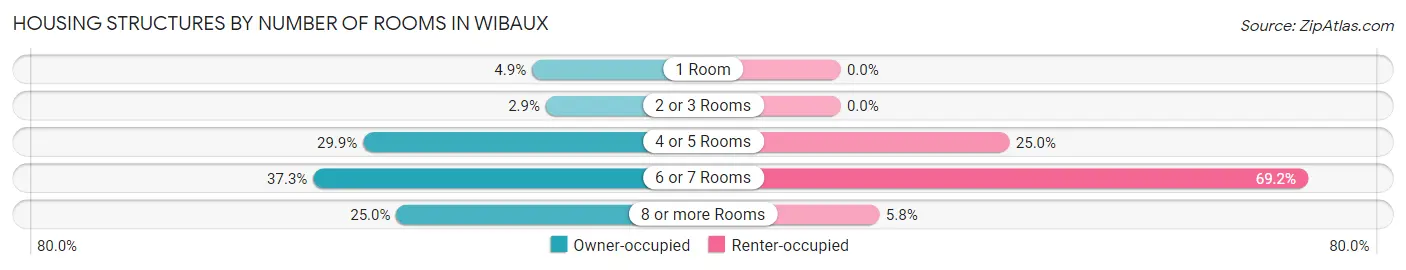
| Number of Rooms | Owner-occupied | Renter-occupied |
| 1 Room | 12 (4.9%) | 0 (0.0%) |
| 2 or 3 Rooms | 7 (2.9%) | 0 (0.0%) |
| 4 or 5 Rooms | 73 (29.9%) | 13 (25.0%) |
| 6 or 7 Rooms | 91 (37.3%) | 36 (69.2%) |
| 8 or more Rooms | 61 (25.0%) | 3 (5.8%) |
| Total | 244 (100.0%) | 52 (100.0%) |
Housing Structure by Heating Type in Wibaux
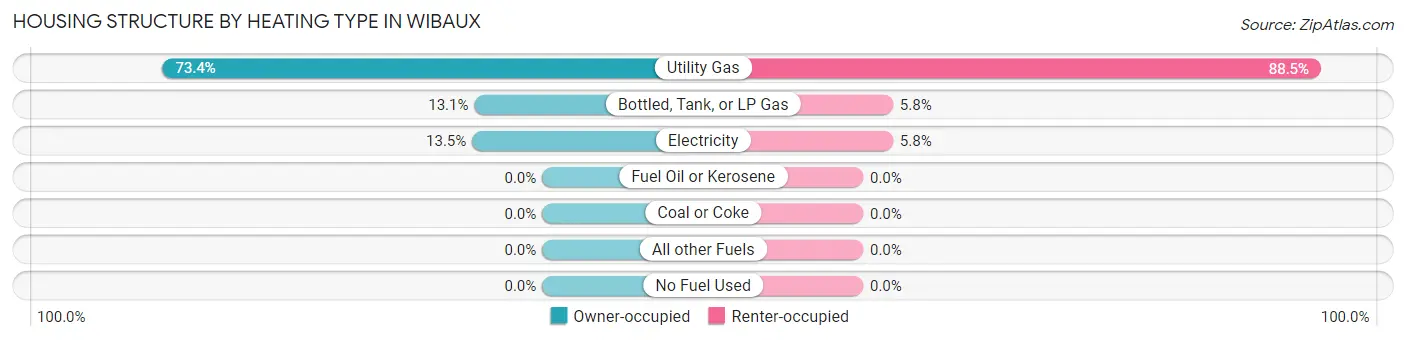
| Heating Type | Owner-occupied | Renter-occupied |
| Utility Gas | 179 (73.4%) | 46 (88.5%) |
| Bottled, Tank, or LP Gas | 32 (13.1%) | 3 (5.8%) |
| Electricity | 33 (13.5%) | 3 (5.8%) |
| Fuel Oil or Kerosene | 0 (0.0%) | 0 (0.0%) |
| Coal or Coke | 0 (0.0%) | 0 (0.0%) |
| All other Fuels | 0 (0.0%) | 0 (0.0%) |
| No Fuel Used | 0 (0.0%) | 0 (0.0%) |
| Total | 244 (100.0%) | 52 (100.0%) |
Household Vehicle Usage in Wibaux
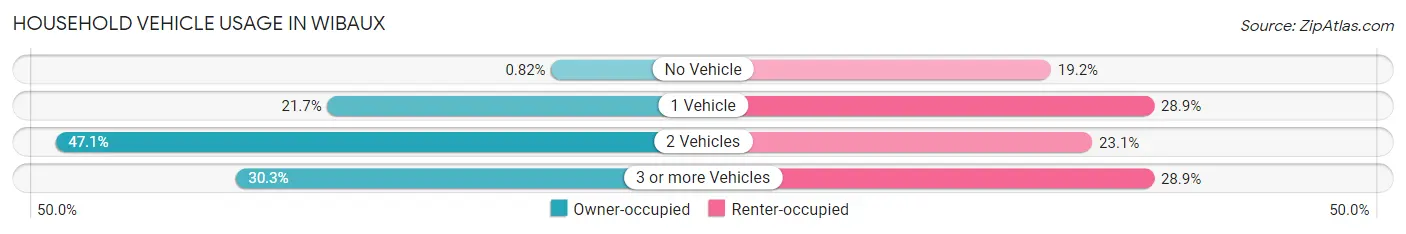
| Vehicles per Household | Owner-occupied | Renter-occupied |
| No Vehicle | 2 (0.8%) | 10 (19.2%) |
| 1 Vehicle | 53 (21.7%) | 15 (28.8%) |
| 2 Vehicles | 115 (47.1%) | 12 (23.1%) |
| 3 or more Vehicles | 74 (30.3%) | 15 (28.8%) |
| Total | 244 (100.0%) | 52 (100.0%) |
Real Estate & Mortgages in Wibaux
Real Estate and Mortgage Overview in Wibaux
| Characteristic | Without Mortgage | With Mortgage |
| Housing Units | 172 | 72 |
| Median Property Value | $88,200 | $99,100 |
| Median Household Income | $60,000 | $8 |
| Monthly Housing Costs | $356 | $7 |
| Real Estate Taxes | $537 | $7 |
Property Value by Mortgage Status in Wibaux
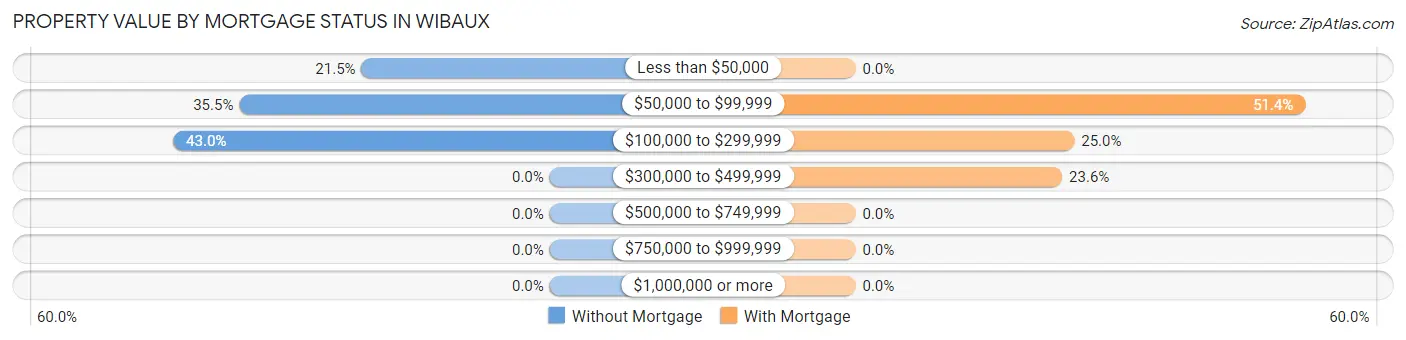
| Property Value | Without Mortgage | With Mortgage |
| Less than $50,000 | 37 (21.5%) | 0 (0.0%) |
| $50,000 to $99,999 | 61 (35.5%) | 37 (51.4%) |
| $100,000 to $299,999 | 74 (43.0%) | 18 (25.0%) |
| $300,000 to $499,999 | 0 (0.0%) | 17 (23.6%) |
| $500,000 to $749,999 | 0 (0.0%) | 0 (0.0%) |
| $750,000 to $999,999 | 0 (0.0%) | 0 (0.0%) |
| $1,000,000 or more | 0 (0.0%) | 0 (0.0%) |
| Total | 172 (100.0%) | 72 (100.0%) |
Household Income by Mortgage Status in Wibaux
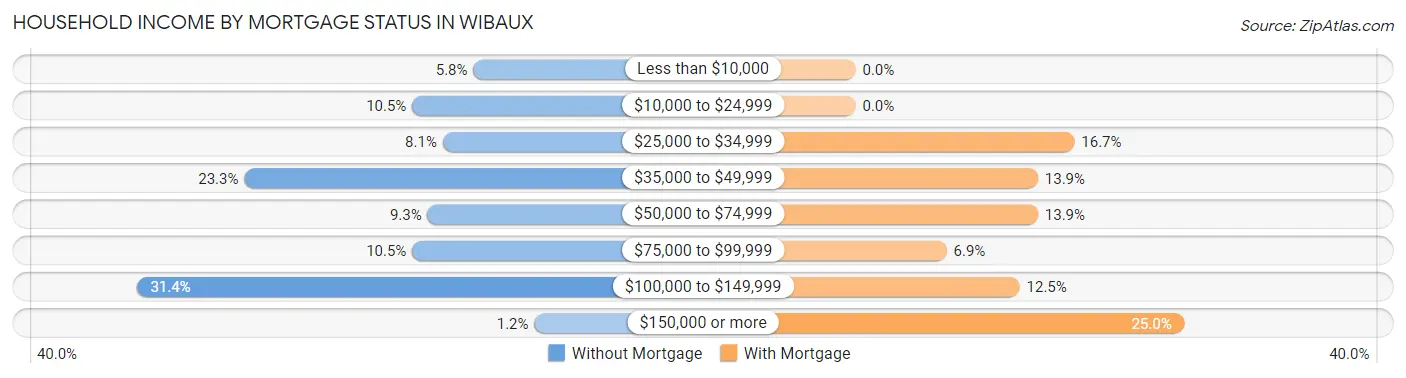
| Household Income | Without Mortgage | With Mortgage |
| Less than $10,000 | 10 (5.8%) | 0 (0.0%) |
| $10,000 to $24,999 | 18 (10.5%) | 0 (0.0%) |
| $25,000 to $34,999 | 14 (8.1%) | 12 (16.7%) |
| $35,000 to $49,999 | 40 (23.3%) | 10 (13.9%) |
| $50,000 to $74,999 | 16 (9.3%) | 10 (13.9%) |
| $75,000 to $99,999 | 18 (10.5%) | 5 (6.9%) |
| $100,000 to $149,999 | 54 (31.4%) | 9 (12.5%) |
| $150,000 or more | 2 (1.2%) | 18 (25.0%) |
| Total | 172 (100.0%) | 72 (100.0%) |
Property Value to Household Income Ratio in Wibaux
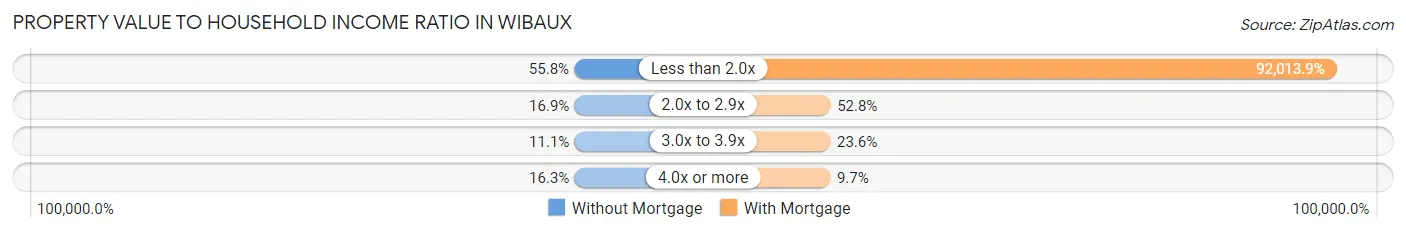
| Value-to-Income Ratio | Without Mortgage | With Mortgage |
| Less than 2.0x | 96 (55.8%) | 66,250 (92,013.9%) |
| 2.0x to 2.9x | 29 (16.9%) | 38 (52.8%) |
| 3.0x to 3.9x | 19 (11.1%) | 17 (23.6%) |
| 4.0x or more | 28 (16.3%) | 7 (9.7%) |
| Total | 172 (100.0%) | 72 (100.0%) |
Real Estate Taxes by Mortgage Status in Wibaux
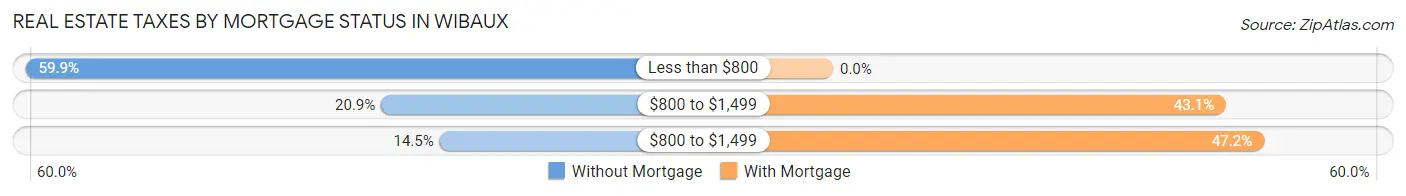
| Property Taxes | Without Mortgage | With Mortgage |
| Less than $800 | 103 (59.9%) | 0 (0.0%) |
| $800 to $1,499 | 36 (20.9%) | 31 (43.1%) |
| $800 to $1,499 | 25 (14.5%) | 34 (47.2%) |
| Total | 172 (100.0%) | 72 (100.0%) |
Health & Disability in Wibaux
Health Insurance Coverage by Age in Wibaux
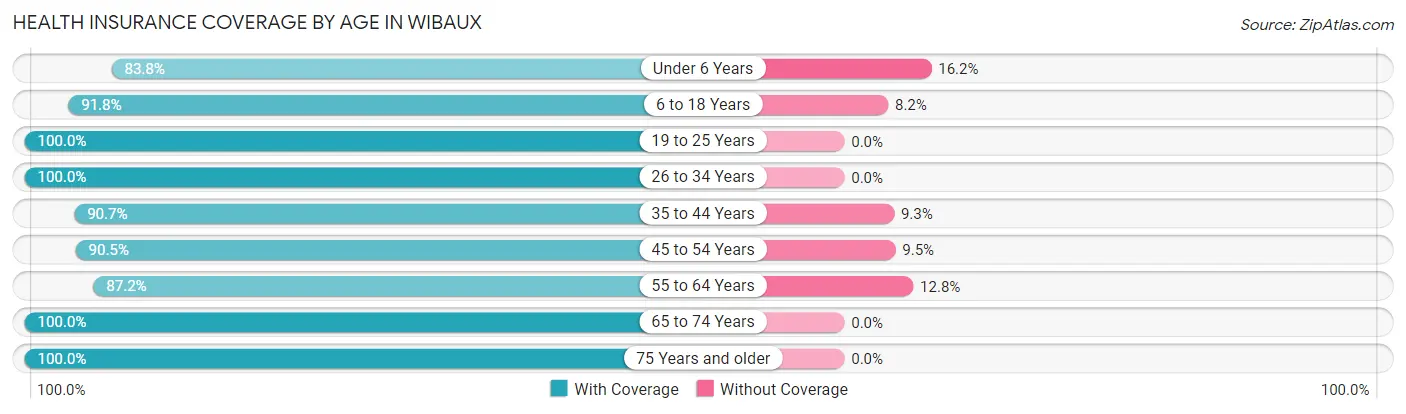
| Age Bracket | With Coverage | Without Coverage |
| Under 6 Years | 31 (83.8%) | 6 (16.2%) |
| 6 to 18 Years | 90 (91.8%) | 8 (8.2%) |
| 19 to 25 Years | 14 (100.0%) | 0 (0.0%) |
| 26 to 34 Years | 47 (100.0%) | 0 (0.0%) |
| 35 to 44 Years | 49 (90.7%) | 5 (9.3%) |
| 45 to 54 Years | 76 (90.5%) | 8 (9.5%) |
| 55 to 64 Years | 95 (87.2%) | 14 (12.8%) |
| 65 to 74 Years | 101 (100.0%) | 0 (0.0%) |
| 75 Years and older | 76 (100.0%) | 0 (0.0%) |
| Total | 579 (93.4%) | 41 (6.6%) |
Health Insurance Coverage by Citizenship Status in Wibaux
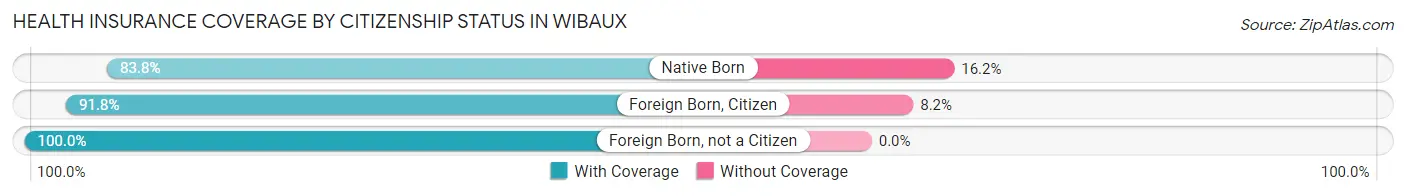
| Citizenship Status | With Coverage | Without Coverage |
| Native Born | 31 (83.8%) | 6 (16.2%) |
| Foreign Born, Citizen | 90 (91.8%) | 8 (8.2%) |
| Foreign Born, not a Citizen | 14 (100.0%) | 0 (0.0%) |
Health Insurance Coverage by Household Income in Wibaux
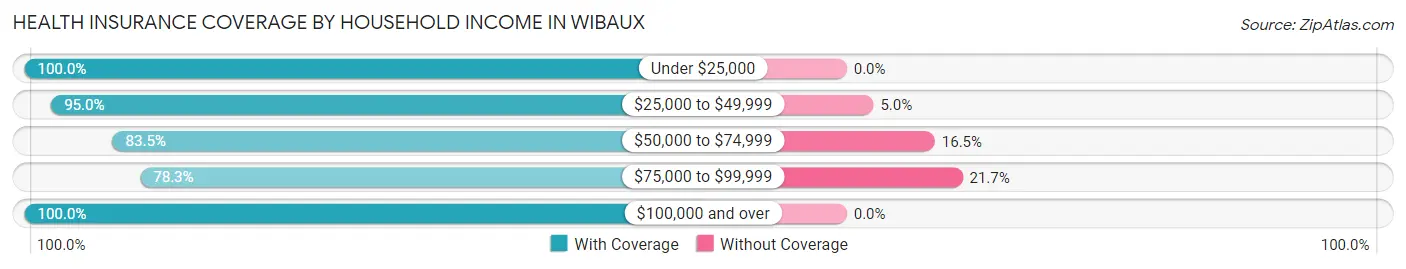
| Household Income | With Coverage | Without Coverage |
| Under $25,000 | 90 (100.0%) | 0 (0.0%) |
| $25,000 to $49,999 | 114 (95.0%) | 6 (5.0%) |
| $50,000 to $74,999 | 86 (83.5%) | 17 (16.5%) |
| $75,000 to $99,999 | 65 (78.3%) | 18 (21.7%) |
| $100,000 and over | 224 (100.0%) | 0 (0.0%) |
Public vs Private Health Insurance Coverage by Age in Wibaux
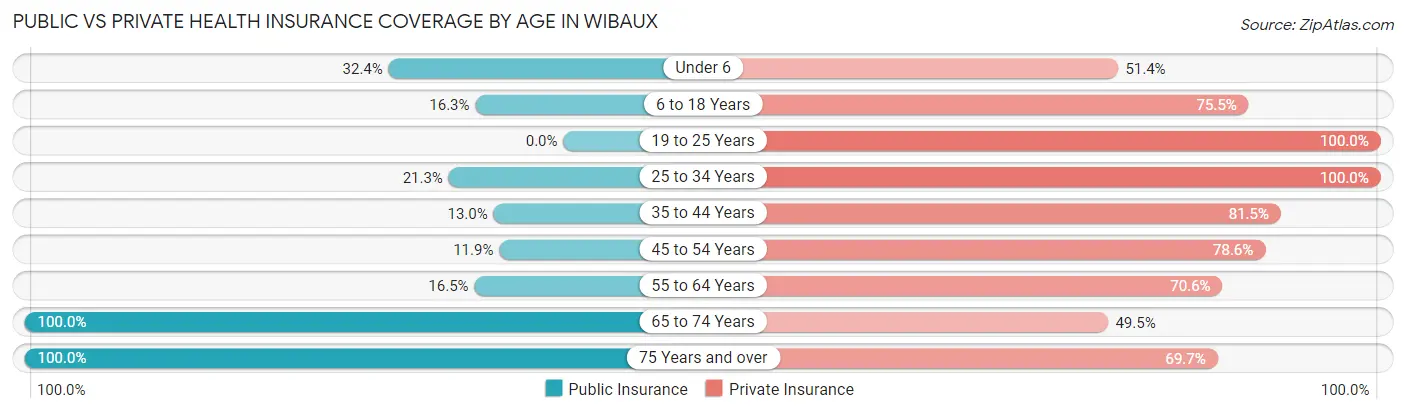
| Age Bracket | Public Insurance | Private Insurance |
| Under 6 | 12 (32.4%) | 19 (51.3%) |
| 6 to 18 Years | 16 (16.3%) | 74 (75.5%) |
| 19 to 25 Years | 0 (0.0%) | 14 (100.0%) |
| 25 to 34 Years | 10 (21.3%) | 47 (100.0%) |
| 35 to 44 Years | 7 (13.0%) | 44 (81.5%) |
| 45 to 54 Years | 10 (11.9%) | 66 (78.6%) |
| 55 to 64 Years | 18 (16.5%) | 77 (70.6%) |
| 65 to 74 Years | 101 (100.0%) | 50 (49.5%) |
| 75 Years and over | 76 (100.0%) | 53 (69.7%) |
| Total | 250 (40.3%) | 444 (71.6%) |
Disability Status by Sex by Age in Wibaux
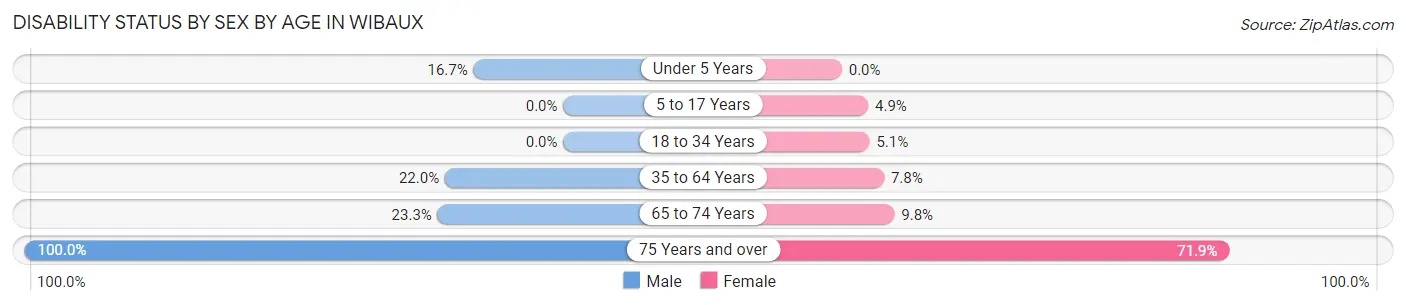
| Age Bracket | Male | Female |
| Under 5 Years | 4 (16.7%) | 0 (0.0%) |
| 5 to 17 Years | 0 (0.0%) | 2 (4.9%) |
| 18 to 34 Years | 0 (0.0%) | 2 (5.1%) |
| 35 to 64 Years | 29 (22.0%) | 9 (7.8%) |
| 65 to 74 Years | 14 (23.3%) | 4 (9.8%) |
| 75 Years and over | 19 (100.0%) | 41 (71.9%) |
Disability Class by Sex by Age in Wibaux
Disability Class: Hearing Difficulty
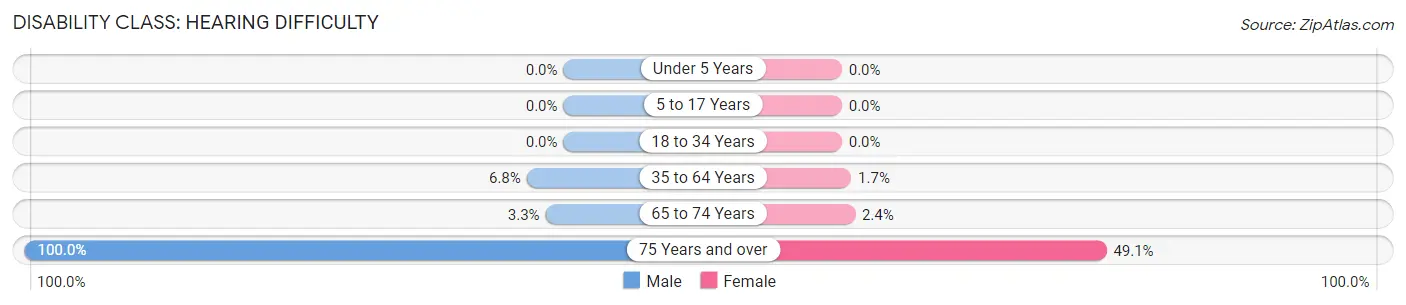
| Age Bracket | Male | Female |
| Under 5 Years | 0 (0.0%) | 0 (0.0%) |
| 5 to 17 Years | 0 (0.0%) | 0 (0.0%) |
| 18 to 34 Years | 0 (0.0%) | 0 (0.0%) |
| 35 to 64 Years | 9 (6.8%) | 2 (1.7%) |
| 65 to 74 Years | 2 (3.3%) | 1 (2.4%) |
| 75 Years and over | 19 (100.0%) | 28 (49.1%) |
Disability Class: Vision Difficulty
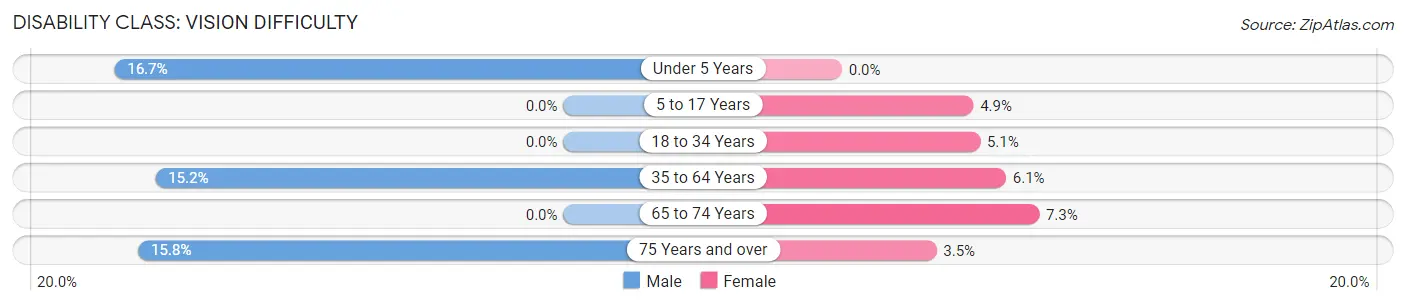
| Age Bracket | Male | Female |
| Under 5 Years | 4 (16.7%) | 0 (0.0%) |
| 5 to 17 Years | 0 (0.0%) | 2 (4.9%) |
| 18 to 34 Years | 0 (0.0%) | 2 (5.1%) |
| 35 to 64 Years | 20 (15.1%) | 7 (6.1%) |
| 65 to 74 Years | 0 (0.0%) | 3 (7.3%) |
| 75 Years and over | 3 (15.8%) | 2 (3.5%) |
Disability Class: Cognitive Difficulty
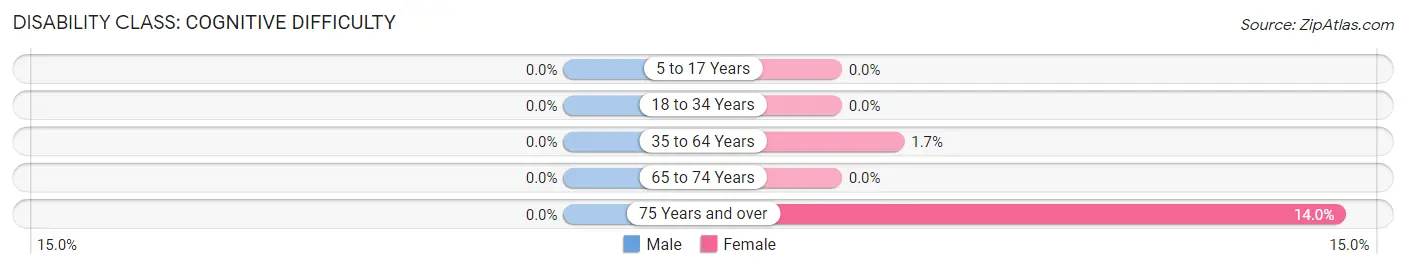
| Age Bracket | Male | Female |
| 5 to 17 Years | 0 (0.0%) | 0 (0.0%) |
| 18 to 34 Years | 0 (0.0%) | 0 (0.0%) |
| 35 to 64 Years | 0 (0.0%) | 2 (1.7%) |
| 65 to 74 Years | 0 (0.0%) | 0 (0.0%) |
| 75 Years and over | 0 (0.0%) | 8 (14.0%) |
Disability Class: Ambulatory Difficulty
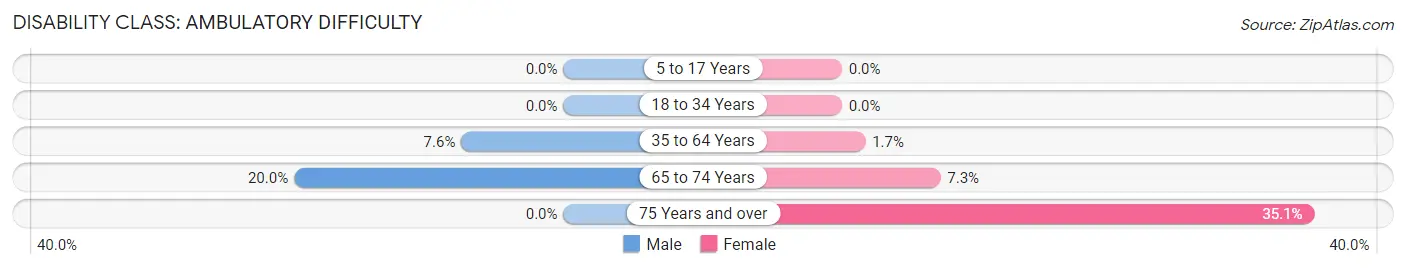
| Age Bracket | Male | Female |
| 5 to 17 Years | 0 (0.0%) | 0 (0.0%) |
| 18 to 34 Years | 0 (0.0%) | 0 (0.0%) |
| 35 to 64 Years | 10 (7.6%) | 2 (1.7%) |
| 65 to 74 Years | 12 (20.0%) | 3 (7.3%) |
| 75 Years and over | 0 (0.0%) | 20 (35.1%) |
Disability Class: Self-Care Difficulty
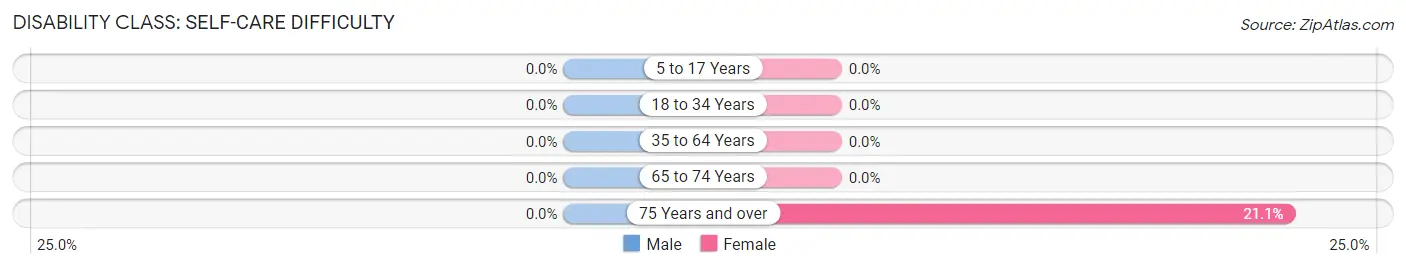
| Age Bracket | Male | Female |
| 5 to 17 Years | 0 (0.0%) | 0 (0.0%) |
| 18 to 34 Years | 0 (0.0%) | 0 (0.0%) |
| 35 to 64 Years | 0 (0.0%) | 0 (0.0%) |
| 65 to 74 Years | 0 (0.0%) | 0 (0.0%) |
| 75 Years and over | 0 (0.0%) | 12 (21.0%) |
Technology Access in Wibaux
Computing Device Access in Wibaux
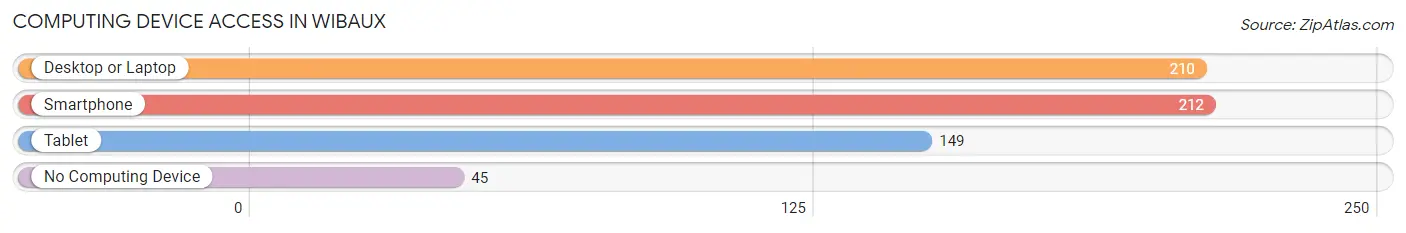
| Device Type | # Households | % Households |
| Desktop or Laptop | 210 | 71.0% |
| Smartphone | 212 | 71.6% |
| Tablet | 149 | 50.3% |
| No Computing Device | 45 | 15.2% |
| Total | 296 | 100.0% |
Internet Access in Wibaux
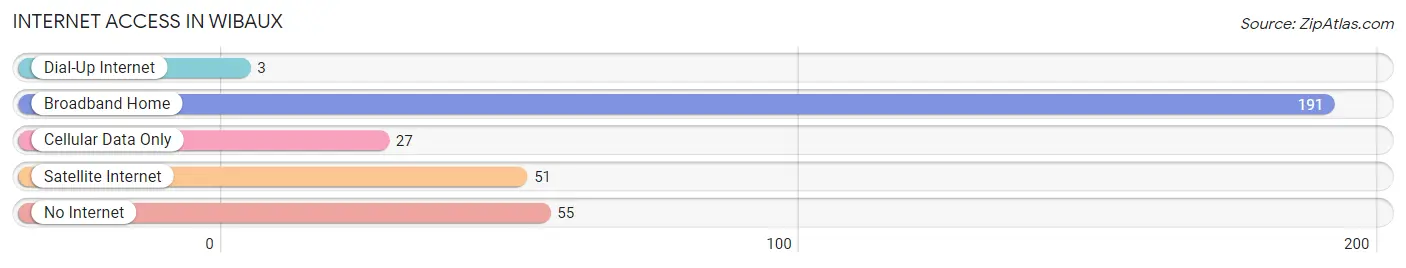
| Internet Type | # Households | % Households |
| Dial-Up Internet | 3 | 1.0% |
| Broadband Home | 191 | 64.5% |
| Cellular Data Only | 27 | 9.1% |
| Satellite Internet | 51 | 17.2% |
| No Internet | 55 | 18.6% |
| Total | 296 | 100.0% |
Wibaux Summary
Wibaux, Montana is a small town located in the southeastern corner of the state, near the North Dakota border. It is the county seat of Wibaux County, and has a population of just over 500 people. The town was founded in 1906, and was named after Pierre Wibaux, a French-Canadian fur trader who had a trading post in the area in the late 1800s.
Geographically, Wibaux is located in the Great Plains region of the United States. The town is situated on the banks of the Little Missouri River, and is surrounded by rolling hills and prairies. The climate is semi-arid, with hot summers and cold winters. The average annual precipitation is just over 16 inches, and the average annual temperature is around 48 degrees Fahrenheit.
The economy of Wibaux is largely based on agriculture and ranching. The town is home to several large ranches, and the surrounding area is used for cattle and sheep grazing. The town also has a small manufacturing sector, with a few small businesses producing agricultural equipment and other goods.
Demographically, Wibaux is a predominantly white town, with a small Hispanic population. The median household income is around $35,000, and the median home value is around $90,000. The town has a low unemployment rate, and the poverty rate is below the national average.
Wibaux is a small, rural town with a rich history and a strong sense of community. The town is home to several historic buildings, including the Wibaux County Courthouse, which was built in 1909. The town also has a number of parks and recreational areas, including the Wibaux County Park, which features a playground, picnic area, and walking trails. The town is also home to a number of churches, including the First Presbyterian Church, which was founded in 1906.
Overall, Wibaux is a small, rural town with a strong sense of community and a rich history. The town is home to a number of historic buildings and recreational areas, and the economy is largely based on agriculture and ranching. The town has a low unemployment rate and a median household income of around $35,000. The town is predominantly white, with a small Hispanic population.
Common Questions
What is Per Capita Income in Wibaux?
Per Capita income in Wibaux is $33,708.
What is the Median Family Income in Wibaux?
Median Family Income in Wibaux is $91,136.
What is the Median Household income in Wibaux?
Median Household Income in Wibaux is $61,042.
What is Income or Wage Gap in Wibaux?
Income or Wage Gap in Wibaux is 51.9%.
Women in Wibaux earn 48.1 cents for every dollar earned by a man.
What is Inequality or Gini Index in Wibaux?
Inequality or Gini Index in Wibaux is 0.38.
What is the Total Population of Wibaux?
Total Population of Wibaux is 640.
What is the Total Male Population of Wibaux?
Total Male Population of Wibaux is 318.
What is the Total Female Population of Wibaux?
Total Female Population of Wibaux is 322.
What is the Ratio of Males per 100 Females in Wibaux?
There are 98.76 Males per 100 Females in Wibaux.
What is the Ratio of Females per 100 Males in Wibaux?
There are 101.26 Females per 100 Males in Wibaux.
What is the Median Population Age in Wibaux?
Median Population Age in Wibaux is 51.8 Years.
What is the Average Family Size in Wibaux
Average Family Size in Wibaux is 2.7 People.
What is the Average Household Size in Wibaux
Average Household Size in Wibaux is 2.1 People.
How Large is the Labor Force in Wibaux?
There are 268 People in the Labor Forcein in Wibaux.
What is the Percentage of People in the Labor Force in Wibaux?
50.4% of People are in the Labor Force in Wibaux.