Westby, MT Map & Demographics
Westby Map
Westby Overview
$41,453
PER CAPITA INCOME
$47,500
AVG FAMILY INCOME
$40,625
AVG HOUSEHOLD INCOME
0.43
INEQUALITY / GINI INDEX
213
TOTAL POPULATION
96
MALE POPULATION
117
FEMALE POPULATION
82.05
MALES / 100 FEMALES
121.88
FEMALES / 100 MALES
53.8
MEDIAN AGE
3.6
AVG FAMILY SIZE
2.7
AVG HOUSEHOLD SIZE
132
LABOR FORCE [ PEOPLE ]
62.9%
PERCENT IN LABOR FORCE
Westby Zip Codes
Westby Area Codes
Income in Westby
Income Overview in Westby
Per Capita Income in Westby is $41,453, while median incomes of families and households are $47,500 and $40,625 respectively.
| Characteristic | Number | Measure |
| Per Capita Income | 213 | $41,453 |
| Median Family Income | 36 | $47,500 |
| Mean Family Income | 36 | $72,231 |
| Median Household Income | 79 | $40,625 |
| Mean Household Income | 79 | $58,401 |
| Income Deficit | 36 | $0 |
| Wage / Income Gap (%) | 213 | 0.00% |
| Wage / Income Gap ($) | 213 | 100.00¢ per $1 |
| Gini / Inequality Index | 213 | 0.43 |
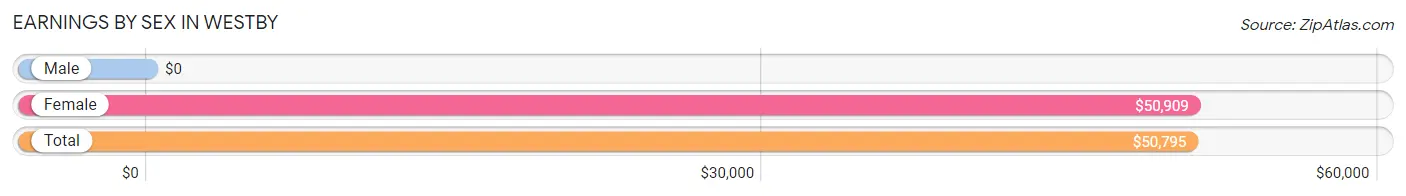
Earnings by Sex in Westby
| Sex | Number | Average Earnings |
| Male | 50 (34.3%) | $0 |
| Female | 96 (65.7%) | $50,909 |
| Total | 146 (100.0%) | $50,795 |
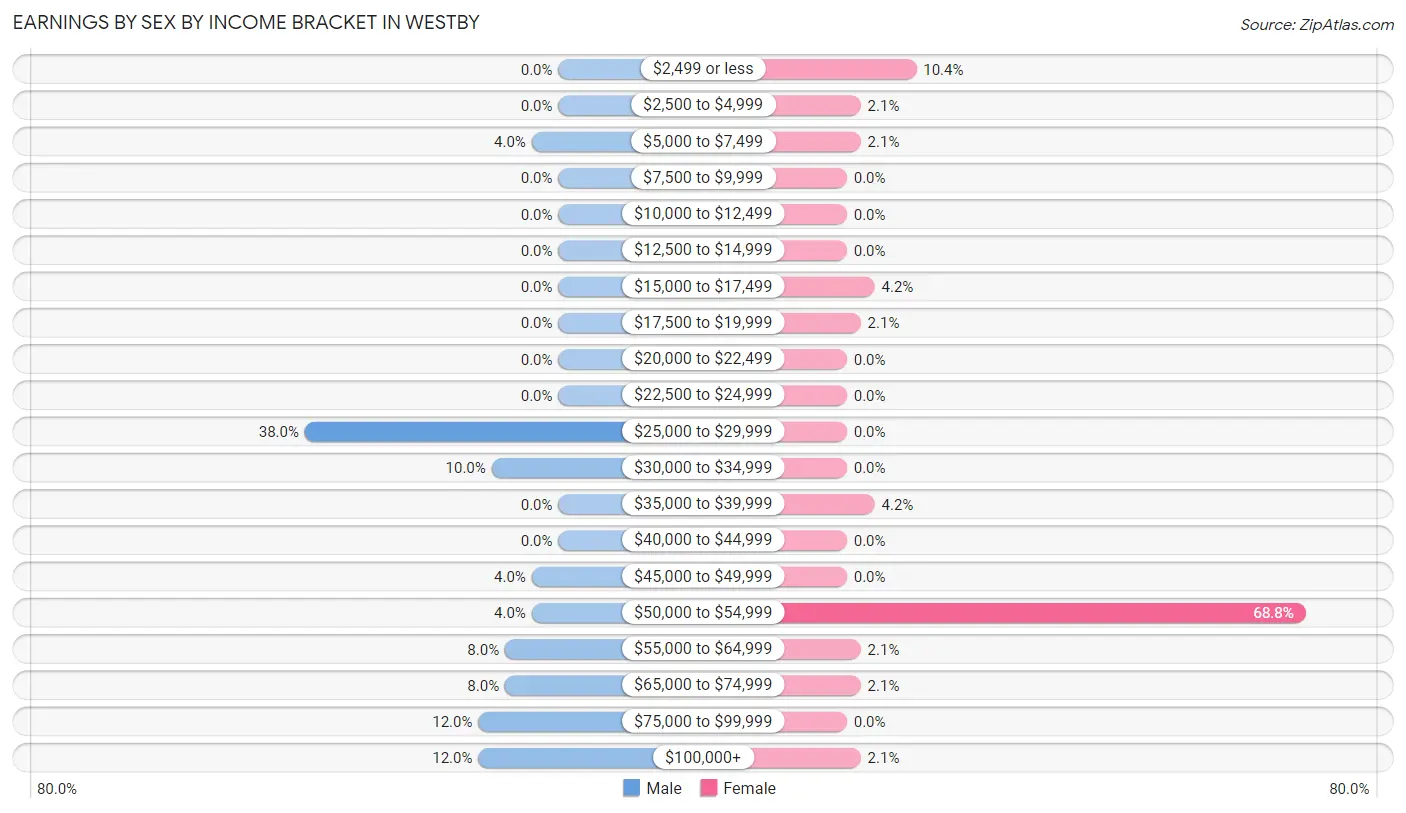
Earnings by Sex by Income Bracket in Westby
The most common earnings brackets in Westby are $25,000 to $29,999 for men (19 | 38.0%) and $50,000 to $54,999 for women (66 | 68.8%).
| Income | Male | Female |
| $2,499 or less | 0 (0.0%) | 10 (10.4%) |
| $2,500 to $4,999 | 0 (0.0%) | 2 (2.1%) |
| $5,000 to $7,499 | 2 (4.0%) | 2 (2.1%) |
| $7,500 to $9,999 | 0 (0.0%) | 0 (0.0%) |
| $10,000 to $12,499 | 0 (0.0%) | 0 (0.0%) |
| $12,500 to $14,999 | 0 (0.0%) | 0 (0.0%) |
| $15,000 to $17,499 | 0 (0.0%) | 4 (4.2%) |
| $17,500 to $19,999 | 0 (0.0%) | 2 (2.1%) |
| $20,000 to $22,499 | 0 (0.0%) | 0 (0.0%) |
| $22,500 to $24,999 | 0 (0.0%) | 0 (0.0%) |
| $25,000 to $29,999 | 19 (38.0%) | 0 (0.0%) |
| $30,000 to $34,999 | 5 (10.0%) | 0 (0.0%) |
| $35,000 to $39,999 | 0 (0.0%) | 4 (4.2%) |
| $40,000 to $44,999 | 0 (0.0%) | 0 (0.0%) |
| $45,000 to $49,999 | 2 (4.0%) | 0 (0.0%) |
| $50,000 to $54,999 | 2 (4.0%) | 66 (68.8%) |
| $55,000 to $64,999 | 4 (8.0%) | 2 (2.1%) |
| $65,000 to $74,999 | 4 (8.0%) | 2 (2.1%) |
| $75,000 to $99,999 | 6 (12.0%) | 0 (0.0%) |
| $100,000+ | 6 (12.0%) | 2 (2.1%) |
| Total | 50 (100.0%) | 96 (100.0%) |
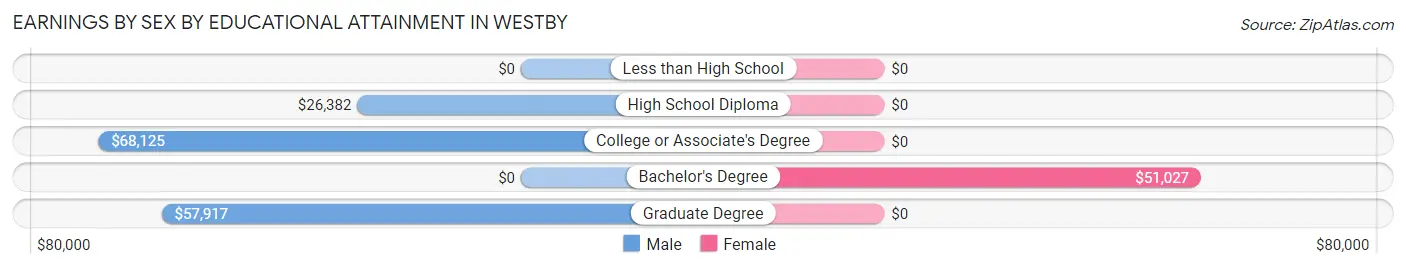
Earnings by Sex by Educational Attainment in Westby
| Educational Attainment | Male Income | Female Income |
| Less than High School | - | - |
| High School Diploma | $26,382 | $0 |
| College or Associate's Degree | $68,125 | $0 |
| Bachelor's Degree | - | - |
| Graduate Degree | $57,917 | $0 |
| Total | - | - |
Family Income in Westby
Family Income Brackets in Westby
According to the Westby family income data, there are 9 families falling into the $15,000 to $24,999 income range, which is the most common income bracket and makes up 25.0% of all families.
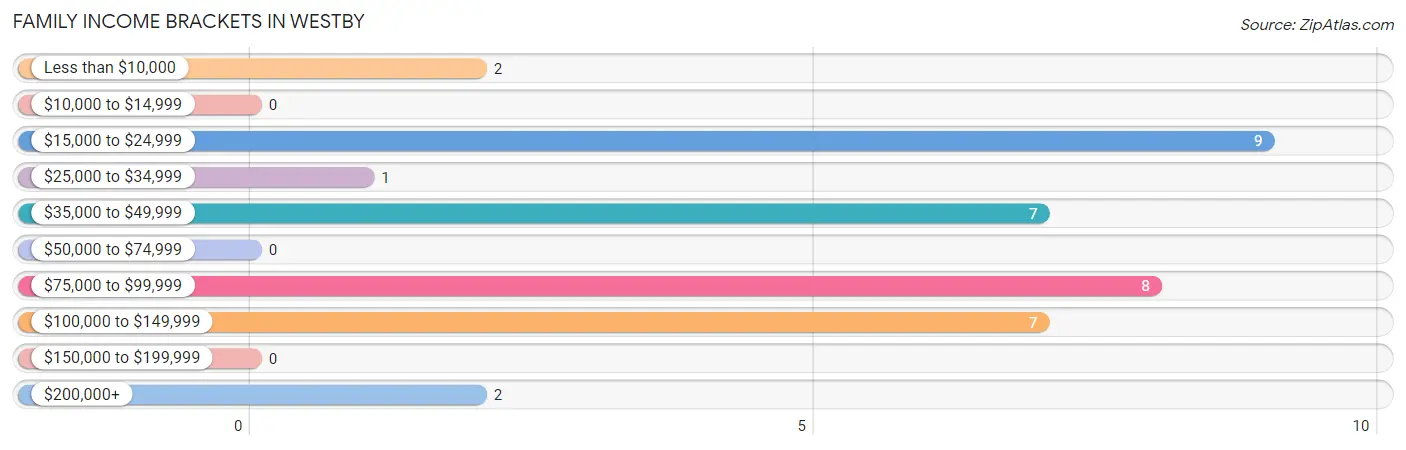
| Income Bracket | # Families | % Families |
| Less than $10,000 | 2 | 5.6% |
| $10,000 to $14,999 | 0 | 0.0% |
| $15,000 to $24,999 | 9 | 25.0% |
| $25,000 to $34,999 | 1 | 2.8% |
| $35,000 to $49,999 | 7 | 19.4% |
| $50,000 to $74,999 | 0 | 0.0% |
| $75,000 to $99,999 | 8 | 22.2% |
| $100,000 to $149,999 | 7 | 19.4% |
| $150,000 to $199,999 | 0 | 0.0% |
| $200,000+ | 2 | 5.6% |
Family Income by Famaliy Size in Westby
3-person families (8 | 22.2%) account for the highest median family income in Westby with $47,000 per family, while 3-person families (8 | 22.2%) have the highest median income of $15,667 per family member.
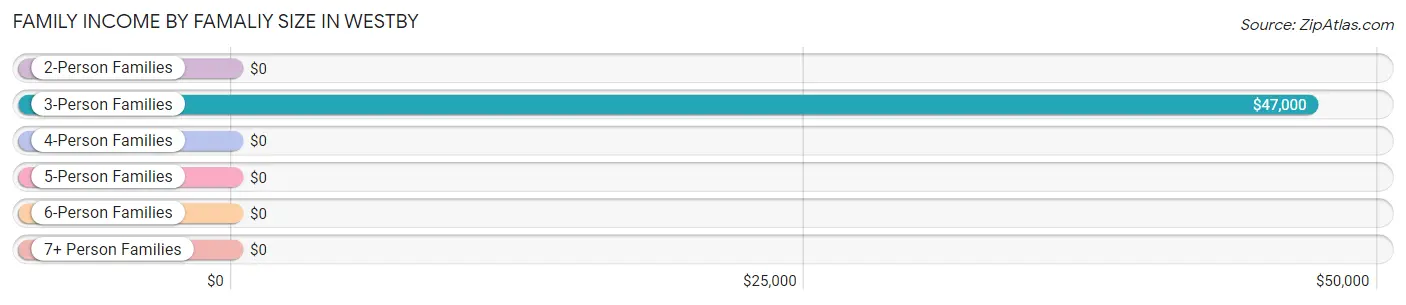
| Income Bracket | # Families | Median Income |
| 2-Person Families | 27 (75.0%) | $0 |
| 3-Person Families | 8 (22.2%) | $47,000 |
| 4-Person Families | 0 (0.0%) | $0 |
| 5-Person Families | 1 (2.8%) | $0 |
| 6-Person Families | 0 (0.0%) | $0 |
| 7+ Person Families | 0 (0.0%) | $0 |
| Total | 36 (100.0%) | $47,500 |
Family Income by Number of Earners in Westby
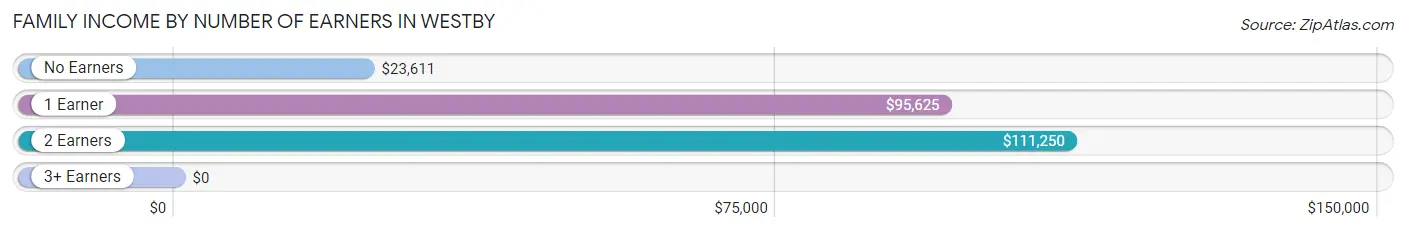
| Number of Earners | # Families | Median Income |
| No Earners | 12 (33.3%) | $23,611 |
| 1 Earner | 5 (13.9%) | $95,625 |
| 2 Earners | 14 (38.9%) | $111,250 |
| 3+ Earners | 5 (13.9%) | $0 |
| Total | 36 (100.0%) | $47,500 |
Household Income in Westby
Household Income Brackets in Westby
With 32 households falling in the category, the $15,000 to $24,999 income range is the most frequent in Westby, accounting for 40.5% of all households. In contrast, only 1 households (1.3%) fall into the $25,000 to $34,999 income bracket, making it the least populous group.
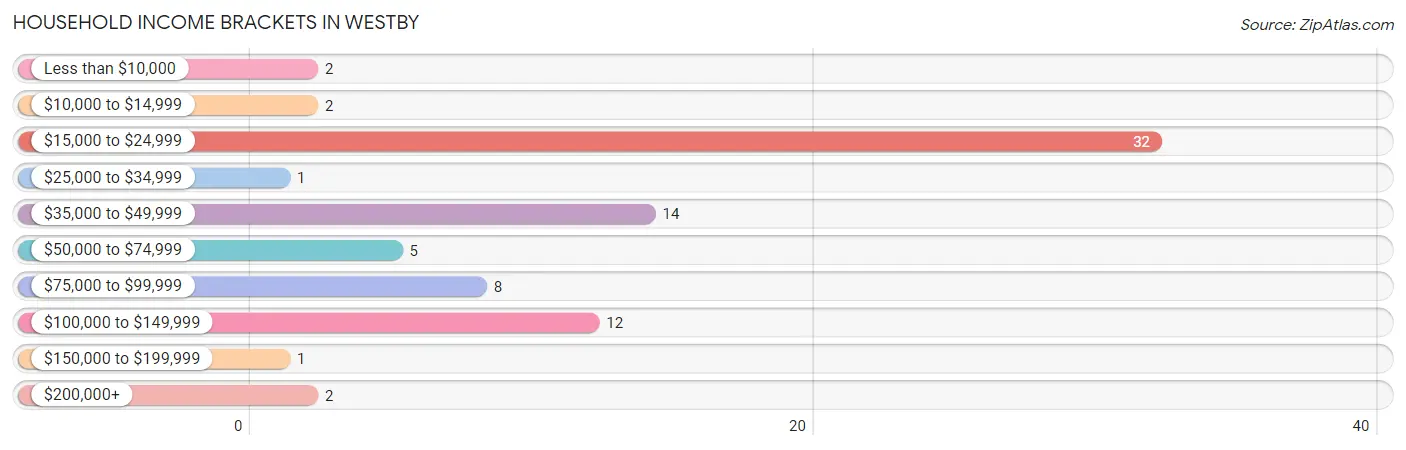
| Income Bracket | # Households | % Households |
| Less than $10,000 | 2 | 2.5% |
| $10,000 to $14,999 | 2 | 2.5% |
| $15,000 to $24,999 | 32 | 40.5% |
| $25,000 to $34,999 | 1 | 1.3% |
| $35,000 to $49,999 | 14 | 17.7% |
| $50,000 to $74,999 | 5 | 6.3% |
| $75,000 to $99,999 | 8 | 10.1% |
| $100,000 to $149,999 | 12 | 15.2% |
| $150,000 to $199,999 | 1 | 1.3% |
| $200,000+ | 2 | 2.5% |
Household Income by Householder Age in Westby
The median household income in Westby is $40,625, with the highest median household income of $97,500 found in the 25 to 44 years age bracket for the primary householder. A total of 6 households (7.6%) fall into this category. Meanwhile, the 15 to 24 years age bracket for the primary householder has the lowest median household income of $0, with 2 households (2.5%) in this group.
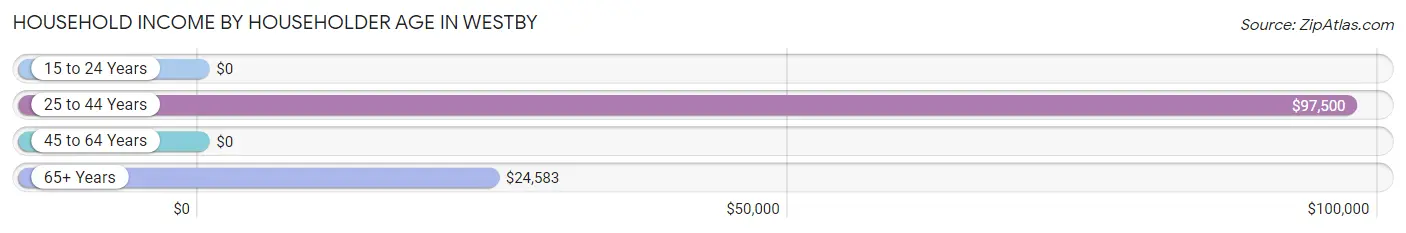
| Income Bracket | # Households | Median Income |
| 15 to 24 Years | 2 (2.5%) | $0 |
| 25 to 44 Years | 6 (7.6%) | $97,500 |
| 45 to 64 Years | 40 (50.6%) | $0 |
| 65+ Years | 31 (39.2%) | $24,583 |
| Total | 79 (100.0%) | $40,625 |
Poverty in Westby
Income Below Poverty by Sex and Age in Westby
With 2.1% poverty level for males and 6.0% for females among the residents of Westby, 75 year old and over males and 35 to 44 year old females are the most vulnerable to poverty, with 2 males (11.8%) and 2 females (33.3%) in their respective age groups living below the poverty level.
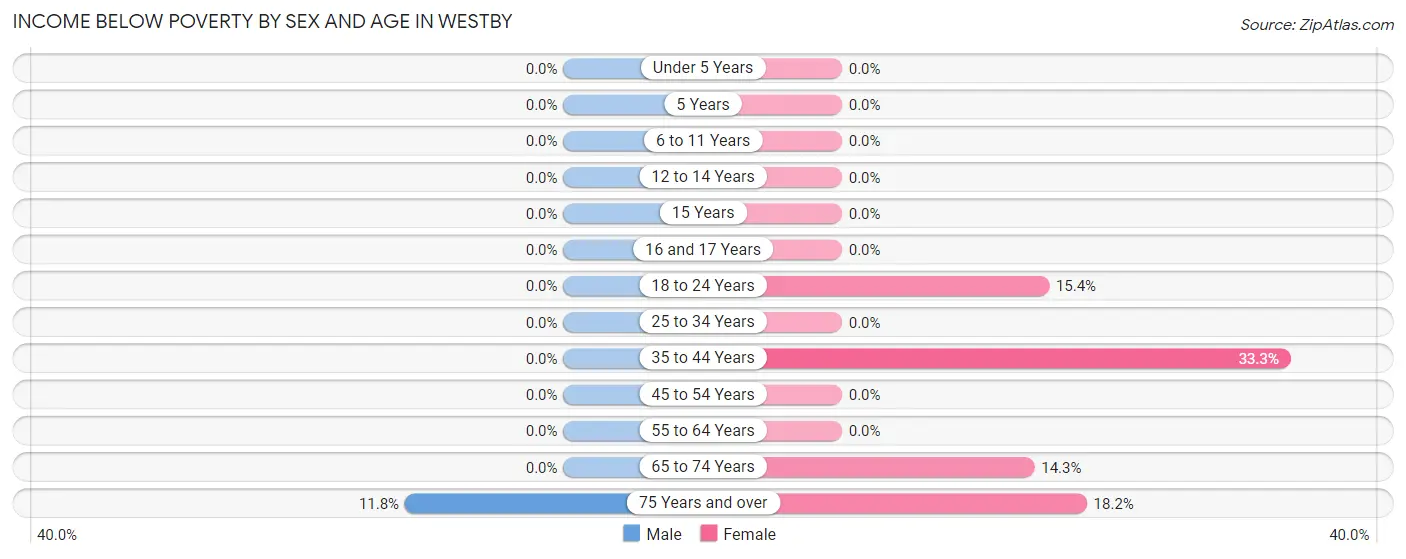
| Age Bracket | Male | Female |
| Under 5 Years | 0 (0.0%) | 0 (0.0%) |
| 5 Years | 0 (0.0%) | 0 (0.0%) |
| 6 to 11 Years | 0 (0.0%) | 0 (0.0%) |
| 12 to 14 Years | 0 (0.0%) | 0 (0.0%) |
| 15 Years | 0 (0.0%) | 0 (0.0%) |
| 16 and 17 Years | 0 (0.0%) | 0 (0.0%) |
| 18 to 24 Years | 0 (0.0%) | 2 (15.4%) |
| 25 to 34 Years | 0 (0.0%) | 0 (0.0%) |
| 35 to 44 Years | 0 (0.0%) | 2 (33.3%) |
| 45 to 54 Years | 0 (0.0%) | 0 (0.0%) |
| 55 to 64 Years | 0 (0.0%) | 0 (0.0%) |
| 65 to 74 Years | 0 (0.0%) | 1 (14.3%) |
| 75 Years and over | 2 (11.8%) | 2 (18.2%) |
| Total | 2 (2.1%) | 7 (6.0%) |
Income Above Poverty by Sex and Age in Westby
According to the poverty statistics in Westby, males aged 12 to 14 years and females aged 5 years are the age groups that are most secure financially, with 100.0% of males and 100.0% of females in these age groups living above the poverty line.
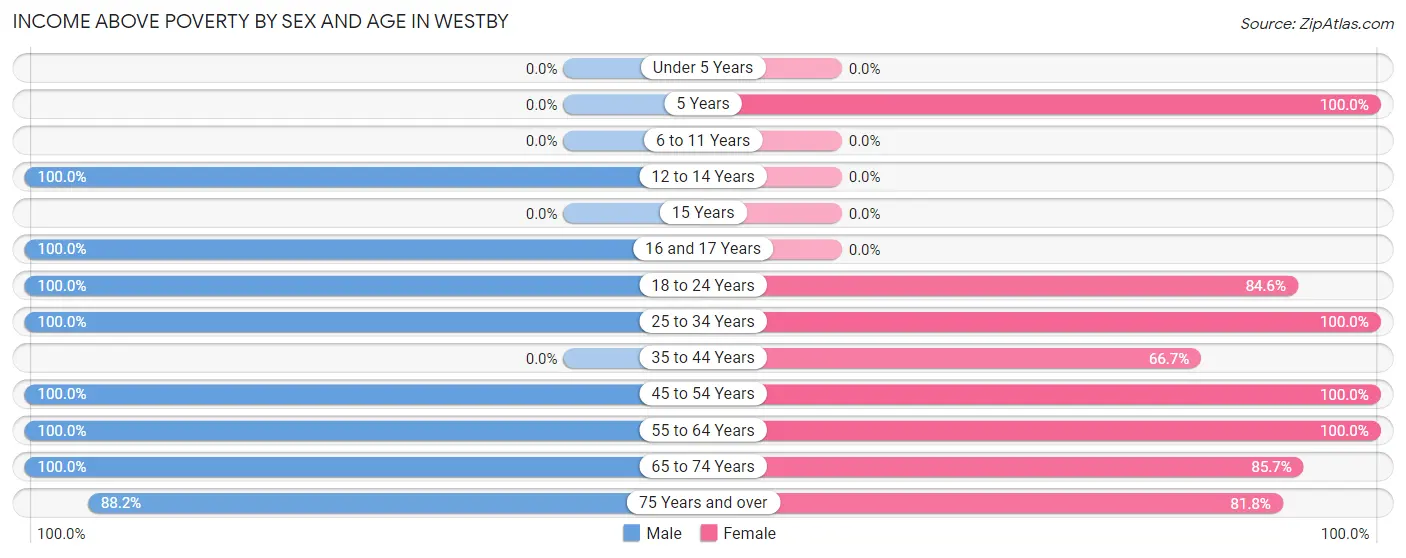
| Age Bracket | Male | Female |
| Under 5 Years | 0 (0.0%) | 0 (0.0%) |
| 5 Years | 0 (0.0%) | 2 (100.0%) |
| 6 to 11 Years | 0 (0.0%) | 0 (0.0%) |
| 12 to 14 Years | 1 (100.0%) | 0 (0.0%) |
| 15 Years | 0 (0.0%) | 0 (0.0%) |
| 16 and 17 Years | 2 (100.0%) | 0 (0.0%) |
| 18 to 24 Years | 2 (100.0%) | 11 (84.6%) |
| 25 to 34 Years | 5 (100.0%) | 4 (100.0%) |
| 35 to 44 Years | 0 (0.0%) | 4 (66.7%) |
| 45 to 54 Years | 12 (100.0%) | 69 (100.0%) |
| 55 to 64 Years | 47 (100.0%) | 5 (100.0%) |
| 65 to 74 Years | 10 (100.0%) | 6 (85.7%) |
| 75 Years and over | 15 (88.2%) | 9 (81.8%) |
| Total | 94 (97.9%) | 110 (94.0%) |
Income Below Poverty Among Married-Couple Families in Westby
The poverty statistics for married-couple families in Westby show that 5.7% or 2 of the total 35 families live below the poverty line. Families with no children have the highest poverty rate of 6.2%, comprising of 2 families. On the other hand, families with 1 or 2 children have the lowest poverty rate of 0.0%, which includes 0 families.
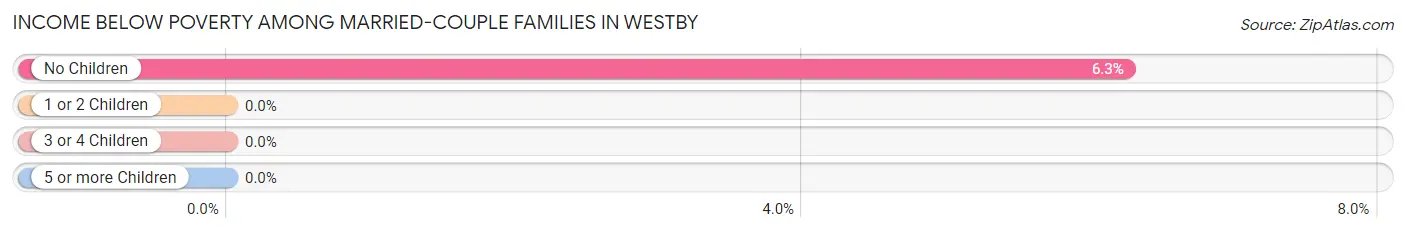
| Children | Above Poverty | Below Poverty |
| No Children | 30 (93.8%) | 2 (6.2%) |
| 1 or 2 Children | 3 (100.0%) | 0 (0.0%) |
| 3 or 4 Children | 0 (0.0%) | 0 (0.0%) |
| 5 or more Children | 0 (0.0%) | 0 (0.0%) |
| Total | 33 (94.3%) | 2 (5.7%) |
Income Below Poverty Among Single-Parent Households in Westby
| Children | Single Father | Single Mother |
| No Children | 0 (0.0%) | 0 (0.0%) |
| 1 or 2 Children | 0 (0.0%) | 0 (0.0%) |
| 3 or 4 Children | 0 (0.0%) | 0 (0.0%) |
| 5 or more Children | 0 (0.0%) | 0 (0.0%) |
| Total | 0 (0.0%) | 0 (0.0%) |
Income Below Poverty Among Married-Couple vs Single-Parent Households in Westby
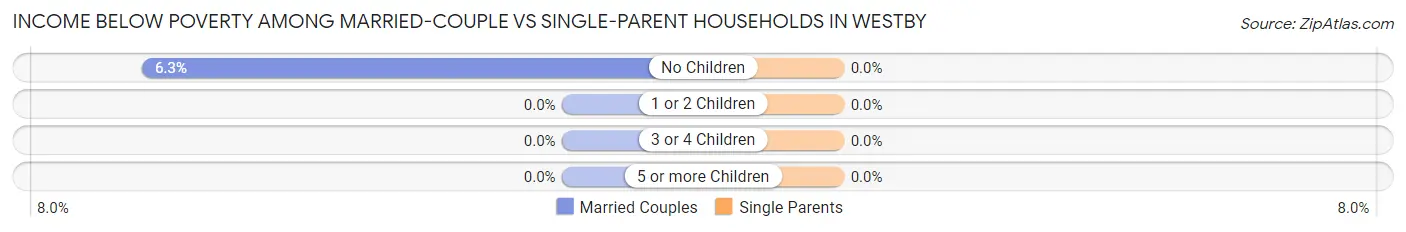
| Children | Married-Couple Families | Single-Parent Households |
| No Children | 2 (6.2%) | 0 (0.0%) |
| 1 or 2 Children | 0 (0.0%) | 0 (0.0%) |
| 3 or 4 Children | 0 (0.0%) | 0 (0.0%) |
| 5 or more Children | 0 (0.0%) | 0 (0.0%) |
| Total | 2 (5.7%) | 0 (0.0%) |
Race in Westby
The most populous races in Westby are , and White / Caucasian (213 | 100.0%).
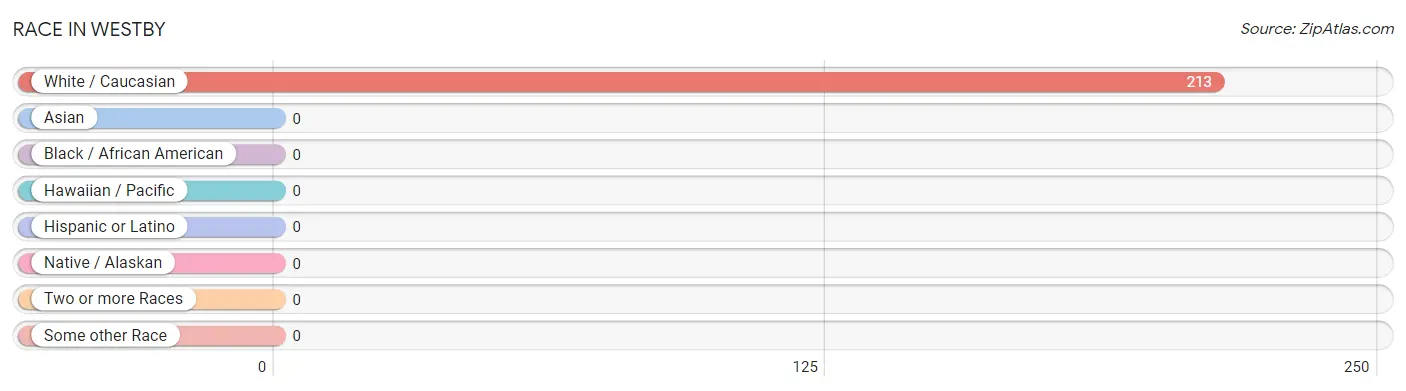
| Race | # Population | % Population |
| Asian | 0 | 0.0% |
| Black / African American | 0 | 0.0% |
| Hawaiian / Pacific | 0 | 0.0% |
| Hispanic or Latino | 0 | 0.0% |
| Native / Alaskan | 0 | 0.0% |
| White / Caucasian | 213 | 100.0% |
| Two or more Races | 0 | 0.0% |
| Some other Race | 0 | 0.0% |
| Total | 213 | 100.0% |
Ancestry in Westby
The most populous ancestries reported in Westby are Norwegian (58 | 27.2%), German (26 | 12.2%), Danish (17 | 8.0%), Swedish (13 | 6.1%), and Irish (7 | 3.3%), together accounting for 56.8% of all Westby residents.
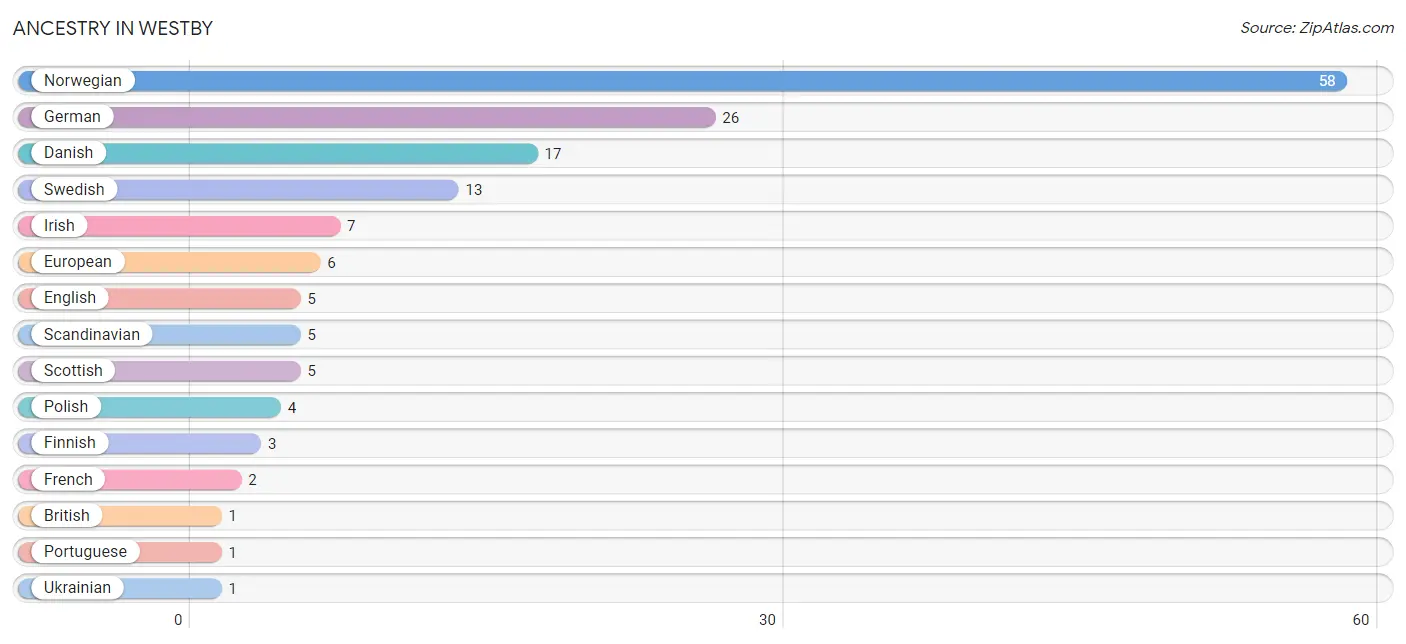
| Ancestry | # Population | % Population |
| British | 1 | 0.5% |
| Danish | 17 | 8.0% |
| English | 5 | 2.4% |
| European | 6 | 2.8% |
| Finnish | 3 | 1.4% |
| French | 2 | 0.9% |
| German | 26 | 12.2% |
| Irish | 7 | 3.3% |
| Norwegian | 58 | 27.2% |
| Polish | 4 | 1.9% |
| Portuguese | 1 | 0.5% |
| Scandinavian | 5 | 2.4% |
| Scottish | 5 | 2.4% |
| Swedish | 13 | 6.1% |
| Ukrainian | 1 | 0.5% | View All 15 Rows |
Immigrants in Westby

| Immigration Origin | # Population | % Population | View All 0 Rows |
Sex and Age in Westby
Sex and Age in Westby
The most populous age groups in Westby are 60 to 64 Years (26 | 27.1%) for men and 50 to 54 Years (40 | 34.2%) for women.
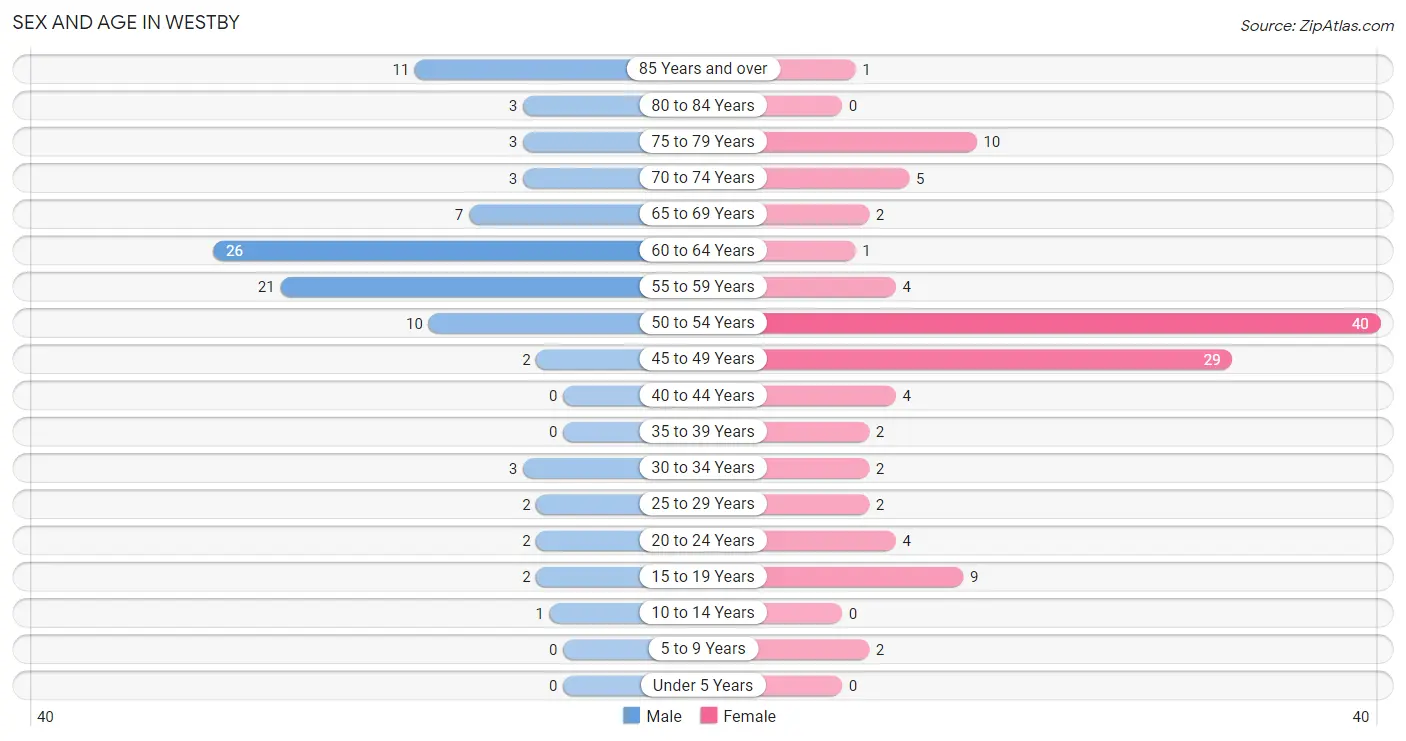
| Age Bracket | Male | Female |
| Under 5 Years | 0 (0.0%) | 0 (0.0%) |
| 5 to 9 Years | 0 (0.0%) | 2 (1.7%) |
| 10 to 14 Years | 1 (1.0%) | 0 (0.0%) |
| 15 to 19 Years | 2 (2.1%) | 9 (7.7%) |
| 20 to 24 Years | 2 (2.1%) | 4 (3.4%) |
| 25 to 29 Years | 2 (2.1%) | 2 (1.7%) |
| 30 to 34 Years | 3 (3.1%) | 2 (1.7%) |
| 35 to 39 Years | 0 (0.0%) | 2 (1.7%) |
| 40 to 44 Years | 0 (0.0%) | 4 (3.4%) |
| 45 to 49 Years | 2 (2.1%) | 29 (24.8%) |
| 50 to 54 Years | 10 (10.4%) | 40 (34.2%) |
| 55 to 59 Years | 21 (21.9%) | 4 (3.4%) |
| 60 to 64 Years | 26 (27.1%) | 1 (0.9%) |
| 65 to 69 Years | 7 (7.3%) | 2 (1.7%) |
| 70 to 74 Years | 3 (3.1%) | 5 (4.3%) |
| 75 to 79 Years | 3 (3.1%) | 10 (8.6%) |
| 80 to 84 Years | 3 (3.1%) | 0 (0.0%) |
| 85 Years and over | 11 (11.5%) | 1 (0.9%) |
| Total | 96 (100.0%) | 117 (100.0%) |
Families and Households in Westby
Median Family Size in Westby
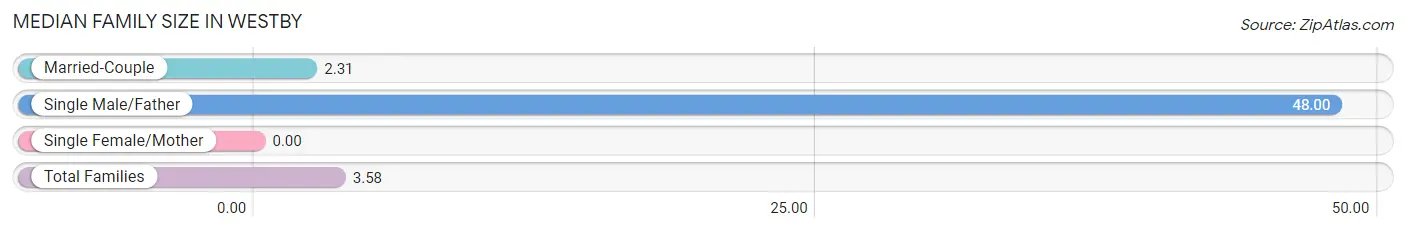
| Family Type | # Families | Family Size |
| Married-Couple | 35 (97.2%) | 2.31 |
| Single Male/Father | 1 (2.8%) | 48.00 |
| Single Female/Mother | 0 (0.0%) | - |
| Total Families | 36 (100.0%) | 3.58 |
Median Household Size in Westby
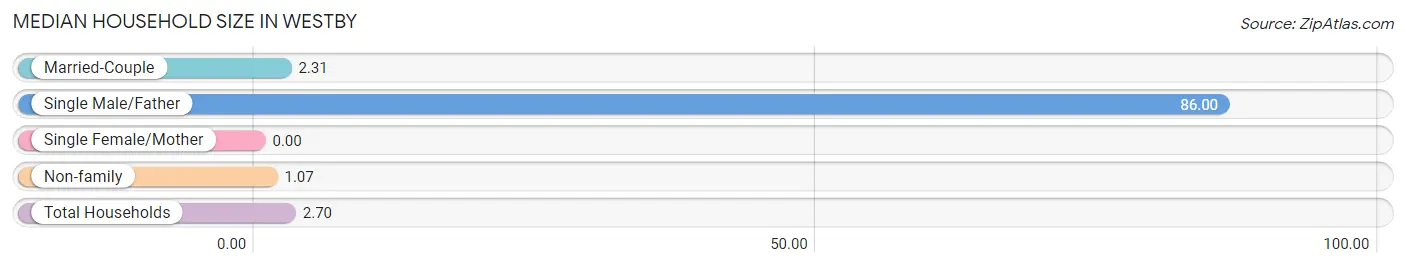
| Household Type | # Households | Household Size |
| Married-Couple | 35 (44.3%) | 2.31 |
| Single Male/Father | 1 (1.3%) | 86.00 |
| Single Female/Mother | 0 (0.0%) | - |
| Non-family | 43 (54.4%) | 1.07 |
| Total Households | 79 (100.0%) | 2.70 |
Household Size by Marriage Status in Westby
Out of a total of 79 households in Westby, 36 (45.6%) are family households, while 43 (54.4%) are nonfamily households. The most numerous type of family households are 2-person households, comprising 27, and the most common type of nonfamily households are 1-person households, comprising 39.
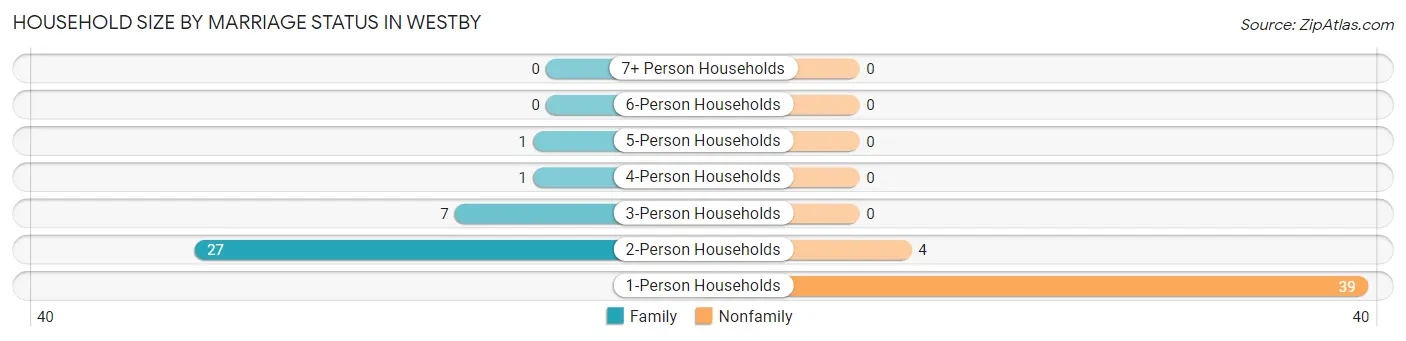
| Household Size | Family Households | Nonfamily Households |
| 1-Person Households | - | 39 (49.4%) |
| 2-Person Households | 27 (34.2%) | 4 (5.1%) |
| 3-Person Households | 7 (8.9%) | 0 (0.0%) |
| 4-Person Households | 1 (1.3%) | 0 (0.0%) |
| 5-Person Households | 1 (1.3%) | 0 (0.0%) |
| 6-Person Households | 0 (0.0%) | 0 (0.0%) |
| 7+ Person Households | 0 (0.0%) | 0 (0.0%) |
| Total | 36 (45.6%) | 43 (54.4%) |
Female Fertility in Westby
Fertility by Age in Westby
| Age Bracket | Women with Births | Births / 1,000 Women |
| 15 to 19 years | 0 (0.0%) | 0.0 |
| 20 to 34 years | 0 (0.0%) | 0.0 |
| 35 to 50 years | 0 (0.0%) | 0.0 |
| Total | 0 (0.0%) | 0.0 |
Fertility by Age by Marriage Status in Westby
| Age Bracket | Married | Unmarried |
| 15 to 19 years | 0 (0.0%) | 0 (0.0%) |
| 20 to 34 years | 0 (0.0%) | 0 (0.0%) |
| 35 to 50 years | 0 (0.0%) | 0 (0.0%) |
| Total | 0 (0.0%) | 0 (0.0%) |
Fertility by Education in Westby
| Educational Attainment | Women with Births | Births / 1,000 Women |
| Less than High School | 0 (0.0%) | 0.0 |
| High School Diploma | 0 (0.0%) | 0.0 |
| College or Associate's Degree | 0 (0.0%) | 0.0 |
| Bachelor's Degree | 0 (0.0%) | 0.0 |
| Graduate Degree | 0 (0.0%) | 0.0 |
| Total | 0 (0.0%) | 0.0 |
Fertility by Education by Marriage Status in Westby
| Educational Attainment | Married | Unmarried |
| Less than High School | 0 (0.0%) | 0 (0.0%) |
| High School Diploma | 0 (0.0%) | 0 (0.0%) |
| College or Associate's Degree | 0 (0.0%) | 0 (0.0%) |
| Bachelor's Degree | 0 (0.0%) | 0 (0.0%) |
| Graduate Degree | 0 (0.0%) | 0 (0.0%) |
| Total | 0 (0.0%) | 0 (0.0%) |
Employment Characteristics in Westby
Employment by Class of Employer in Westby
Among the 132 employed individuals in Westby, private company employees (105 | 79.5%), local government employees (12 | 9.1%), and self-employed (incorporated) (11 | 8.3%) make up the most common classes of employment.
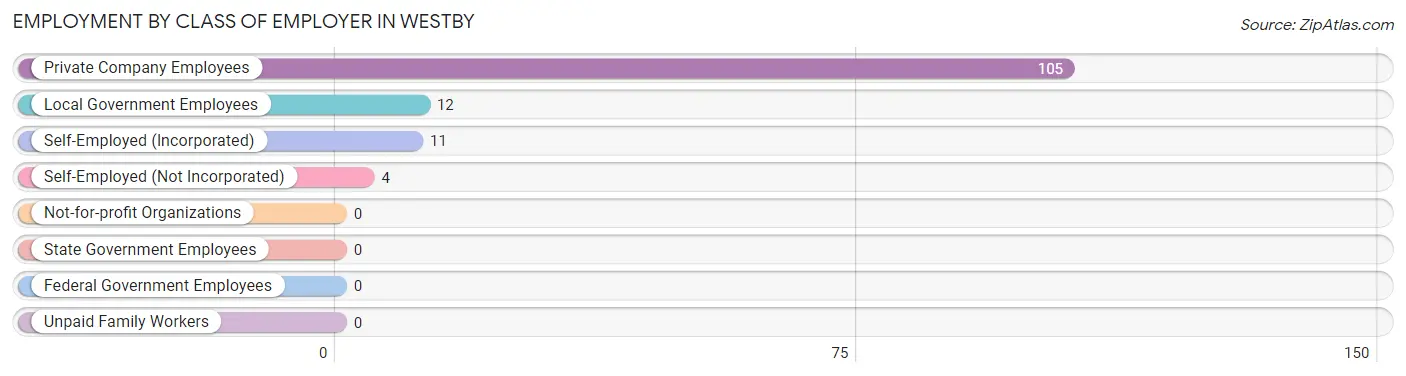
| Employer Class | # Employees | % Employees |
| Private Company Employees | 105 | 79.5% |
| Self-Employed (Incorporated) | 11 | 8.3% |
| Self-Employed (Not Incorporated) | 4 | 3.0% |
| Not-for-profit Organizations | 0 | 0.0% |
| Local Government Employees | 12 | 9.1% |
| State Government Employees | 0 | 0.0% |
| Federal Government Employees | 0 | 0.0% |
| Unpaid Family Workers | 0 | 0.0% |
| Total | 132 | 100.0% |
Employment Status by Age in Westby
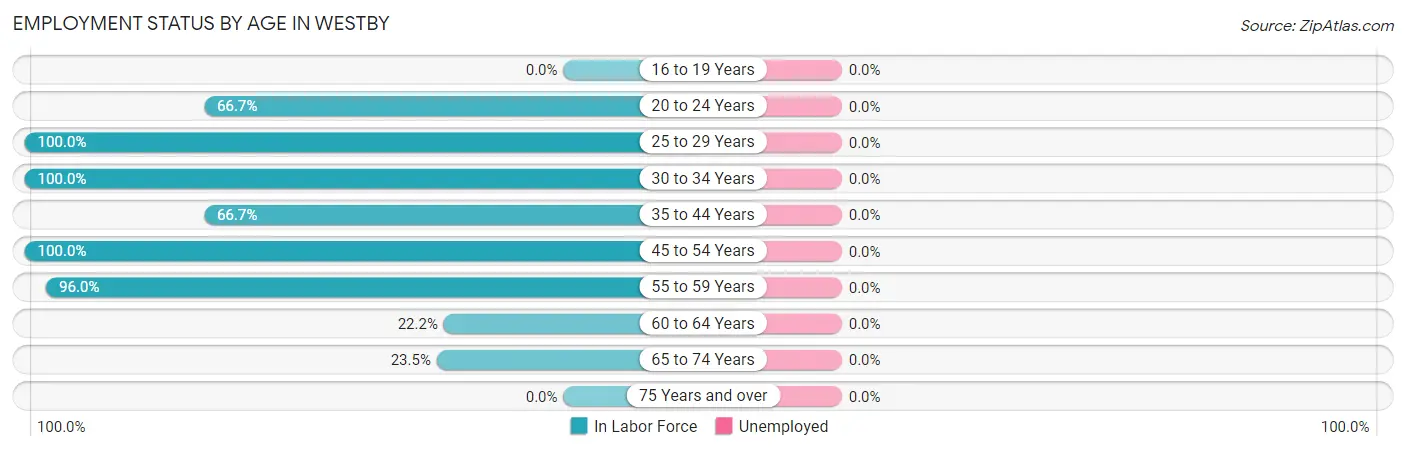
| Age Bracket | In Labor Force | Unemployed |
| 16 to 19 Years | 0 (0.0%) | 0 (0.0%) |
| 20 to 24 Years | 4 (66.7%) | 0 (0.0%) |
| 25 to 29 Years | 4 (100.0%) | 0 (0.0%) |
| 30 to 34 Years | 5 (100.0%) | 0 (0.0%) |
| 35 to 44 Years | 4 (66.7%) | 0 (0.0%) |
| 45 to 54 Years | 81 (100.0%) | 0 (0.0%) |
| 55 to 59 Years | 24 (96.0%) | 0 (0.0%) |
| 60 to 64 Years | 6 (22.2%) | 0 (0.0%) |
| 65 to 74 Years | 4 (23.5%) | 0 (0.0%) |
| 75 Years and over | 0 (0.0%) | 0 (0.0%) |
| Total | 132 (62.9%) | 0 (0.0%) |
Employment Status by Educational Attainment in Westby
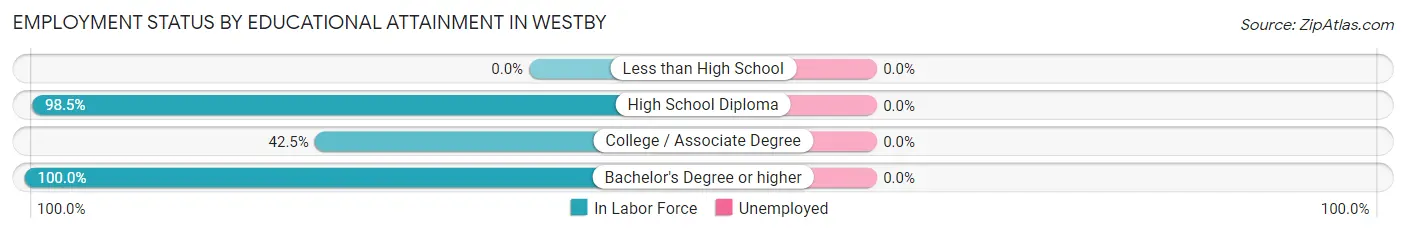
| Educational Attainment | In Labor Force | Unemployed |
| Less than High School | 0 (0.0%) | 0 (0.0%) |
| High School Diploma | 65 (98.5%) | 0 (0.0%) |
| College / Associate Degree | 17 (42.5%) | 0 (0.0%) |
| Bachelor's Degree or higher | 42 (100.0%) | 0 (0.0%) |
| Total | 124 (83.8%) | 0 (0.0%) |
Employment Occupations by Sex in Westby
Management, Business, Science and Arts Occupations
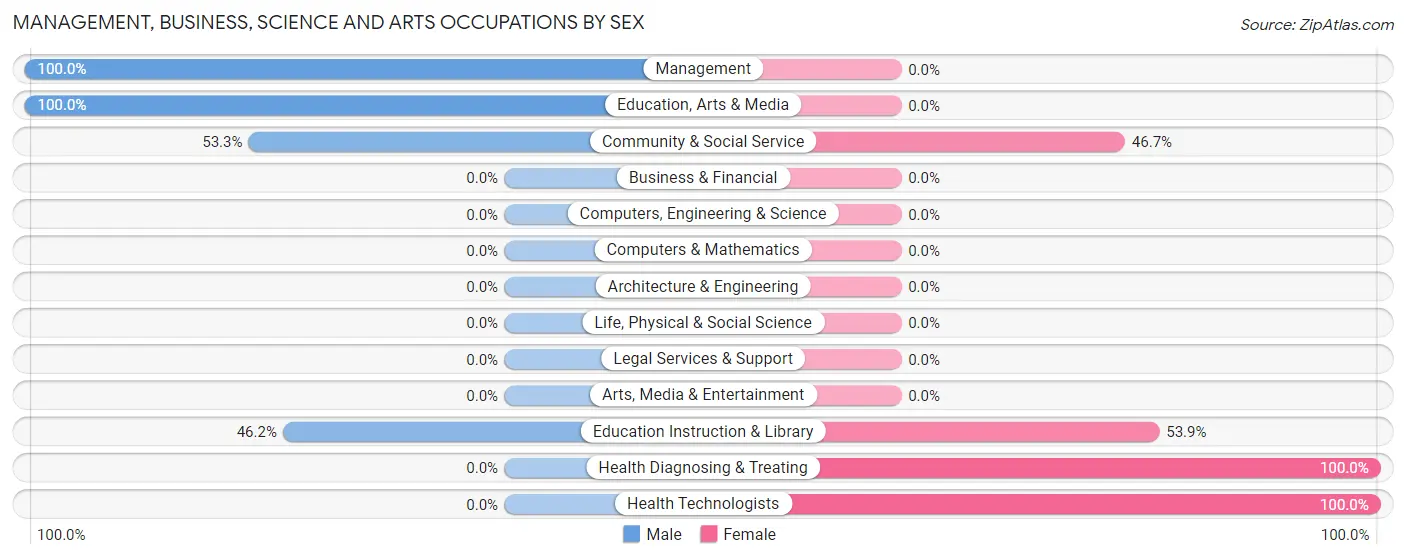
The most common Management, Business, Science and Arts occupations in Westby are Community & Social Service (15 | 11.4%), Education Instruction & Library (13 | 9.9%), Management (2 | 1.5%), Education, Arts & Media (2 | 1.5%), and Health Diagnosing & Treating (1 | 0.8%).
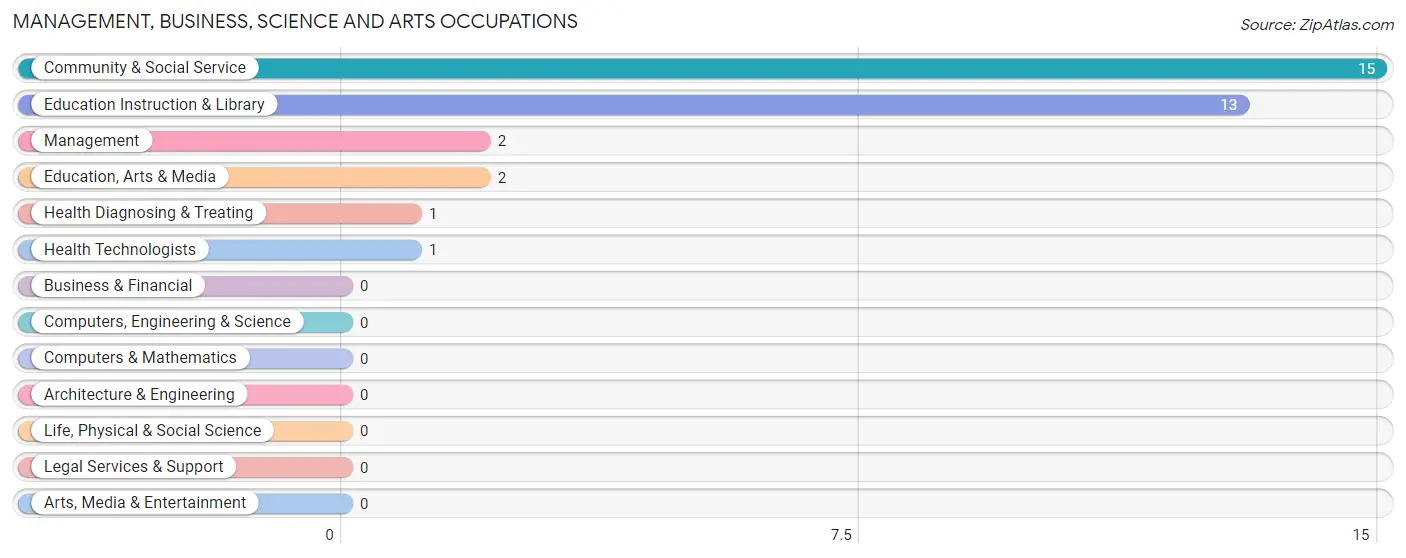
Management, Business, Science and Arts Occupations by Sex
Within the Management, Business, Science and Arts occupations in Westby, the most male-oriented occupations are Management (100.0%), Education, Arts & Media (100.0%), and Community & Social Service (53.3%), while the most female-oriented occupations are Health Diagnosing & Treating (100.0%), Health Technologists (100.0%), and Education Instruction & Library (53.8%).
| Occupation | Male | Female |
| Management | 2 (100.0%) | 0 (0.0%) |
| Business & Financial | 0 (0.0%) | 0 (0.0%) |
| Computers, Engineering & Science | 0 (0.0%) | 0 (0.0%) |
| Computers & Mathematics | 0 (0.0%) | 0 (0.0%) |
| Architecture & Engineering | 0 (0.0%) | 0 (0.0%) |
| Life, Physical & Social Science | 0 (0.0%) | 0 (0.0%) |
| Community & Social Service | 8 (53.3%) | 7 (46.7%) |
| Education, Arts & Media | 2 (100.0%) | 0 (0.0%) |
| Legal Services & Support | 0 (0.0%) | 0 (0.0%) |
| Education Instruction & Library | 6 (46.2%) | 7 (53.8%) |
| Arts, Media & Entertainment | 0 (0.0%) | 0 (0.0%) |
| Health Diagnosing & Treating | 0 (0.0%) | 1 (100.0%) |
| Health Technologists | 0 (0.0%) | 1 (100.0%) |
| Total (Category) | 10 (55.6%) | 8 (44.4%) |
| Total (Overall) | 49 (37.1%) | 83 (62.9%) |
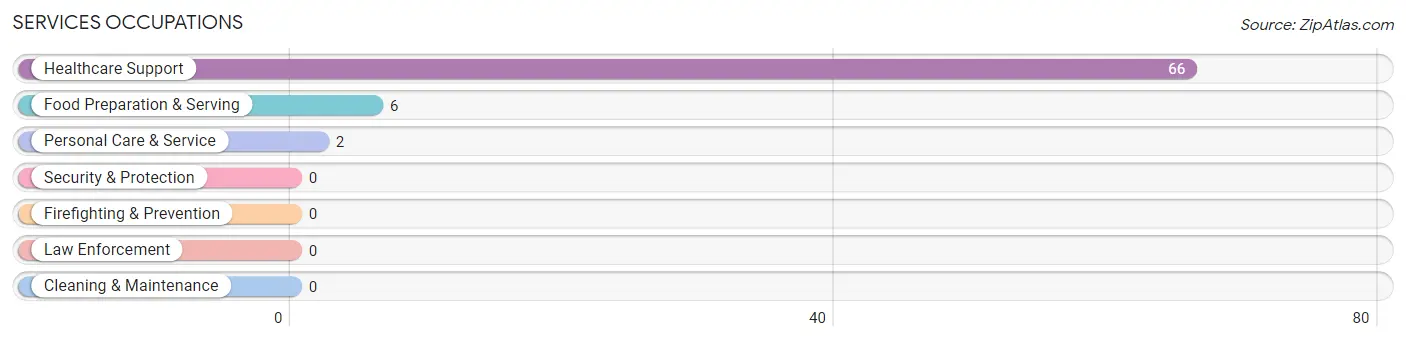
Services Occupations
The most common Services occupations in Westby are Healthcare Support (66 | 50.0%), Food Preparation & Serving (6 | 4.5%), and Personal Care & Service (2 | 1.5%).
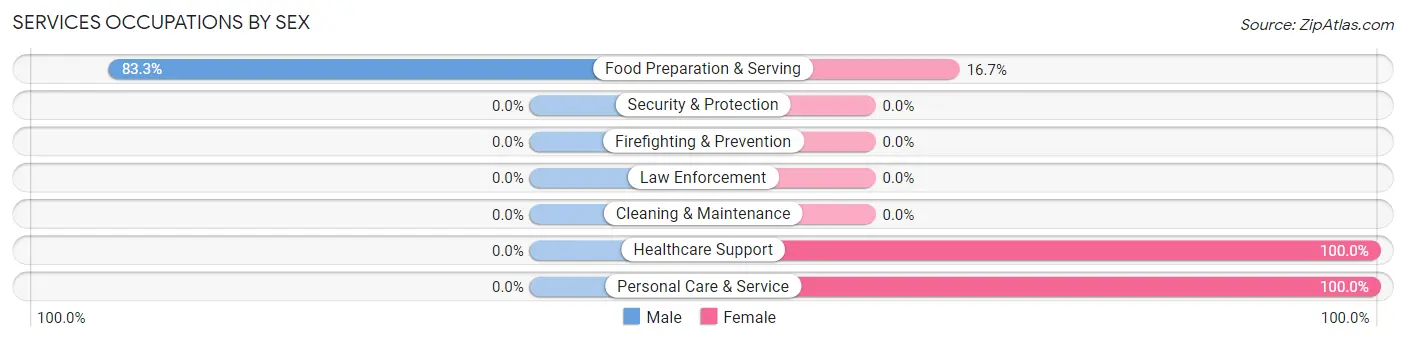
Services Occupations by Sex
| Occupation | Male | Female |
| Healthcare Support | 0 (0.0%) | 66 (100.0%) |
| Security & Protection | 0 (0.0%) | 0 (0.0%) |
| Firefighting & Prevention | 0 (0.0%) | 0 (0.0%) |
| Law Enforcement | 0 (0.0%) | 0 (0.0%) |
| Food Preparation & Serving | 5 (83.3%) | 1 (16.7%) |
| Cleaning & Maintenance | 0 (0.0%) | 0 (0.0%) |
| Personal Care & Service | 0 (0.0%) | 2 (100.0%) |
| Total (Category) | 5 (6.8%) | 69 (93.2%) |
| Total (Overall) | 49 (37.1%) | 83 (62.9%) |
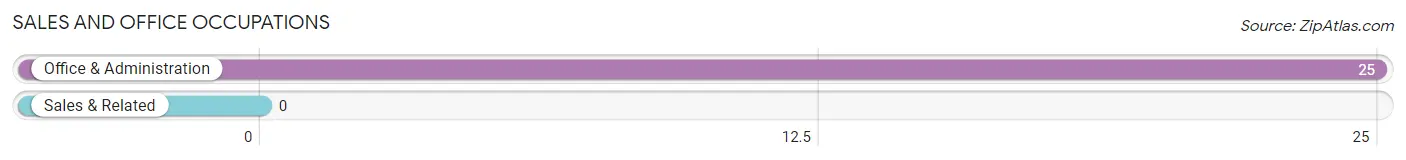
Sales and Office Occupations
The most common Sales and Office occupations in Westby are , and Office & Administration (25 | 18.9%).
Sales and Office Occupations by Sex
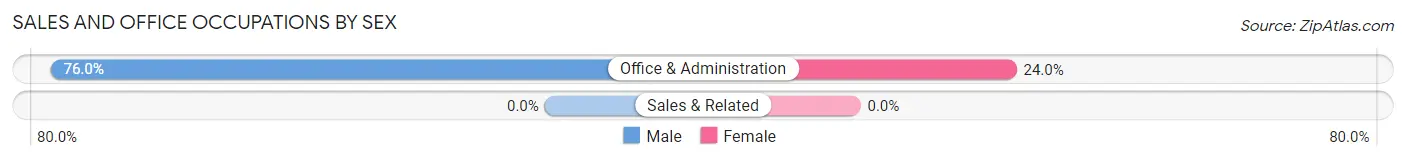
| Occupation | Male | Female |
| Sales & Related | 0 (0.0%) | 0 (0.0%) |
| Office & Administration | 19 (76.0%) | 6 (24.0%) |
| Total (Category) | 19 (76.0%) | 6 (24.0%) |
| Total (Overall) | 49 (37.1%) | 83 (62.9%) |
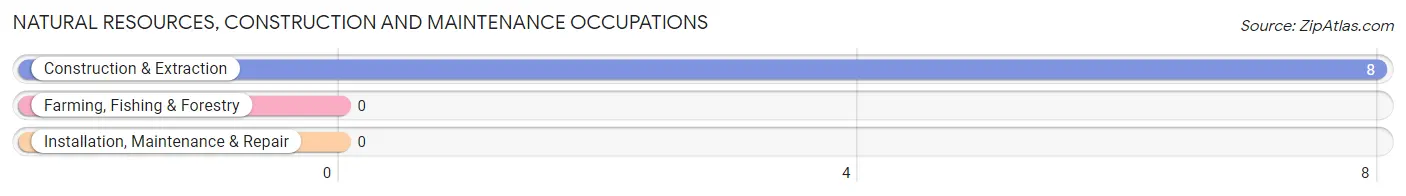
Natural Resources, Construction and Maintenance Occupations
The most common Natural Resources, Construction and Maintenance occupations in Westby are , and Construction & Extraction (8 | 6.1%).
Natural Resources, Construction and Maintenance Occupations by Sex
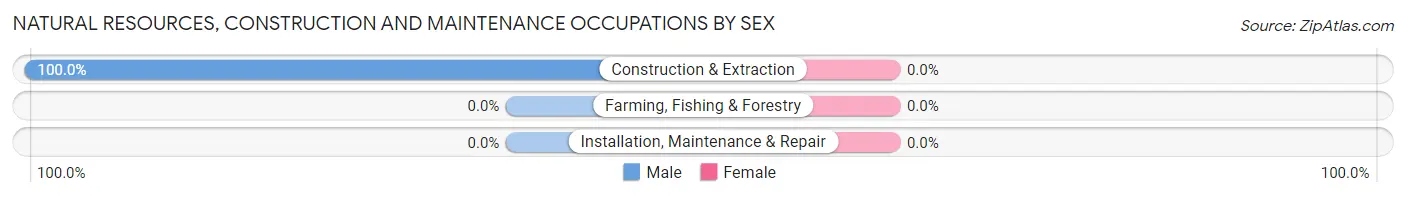
| Occupation | Male | Female |
| Farming, Fishing & Forestry | 0 (0.0%) | 0 (0.0%) |
| Construction & Extraction | 8 (100.0%) | 0 (0.0%) |
| Installation, Maintenance & Repair | 0 (0.0%) | 0 (0.0%) |
| Total (Category) | 8 (100.0%) | 0 (0.0%) |
| Total (Overall) | 49 (37.1%) | 83 (62.9%) |
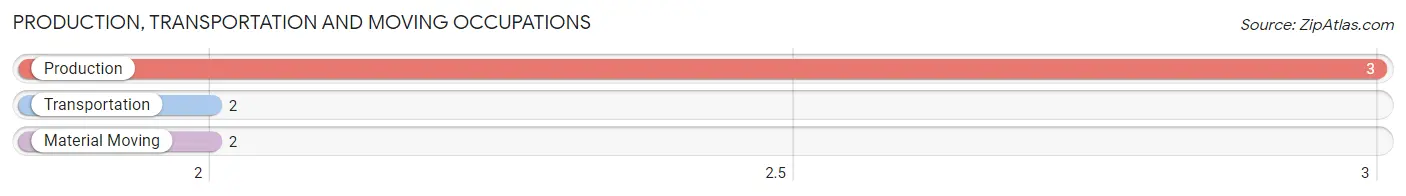
Production, Transportation and Moving Occupations
The most common Production, Transportation and Moving occupations in Westby are Production (3 | 2.3%), Transportation (2 | 1.5%), and Material Moving (2 | 1.5%).
Production, Transportation and Moving Occupations by Sex
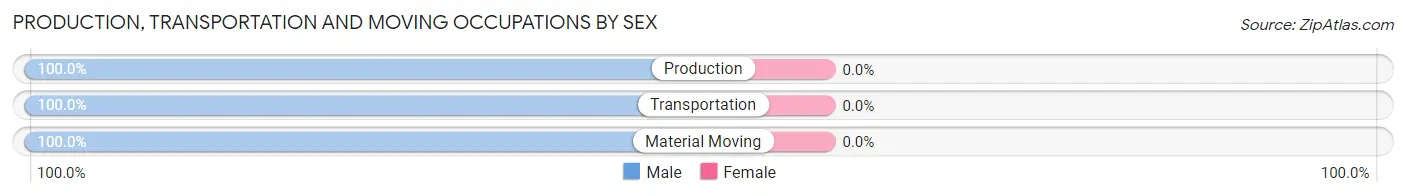
| Occupation | Male | Female |
| Production | 3 (100.0%) | 0 (0.0%) |
| Transportation | 2 (100.0%) | 0 (0.0%) |
| Material Moving | 2 (100.0%) | 0 (0.0%) |
| Total (Category) | 7 (100.0%) | 0 (0.0%) |
| Total (Overall) | 49 (37.1%) | 83 (62.9%) |
Employment Industries by Sex in Westby
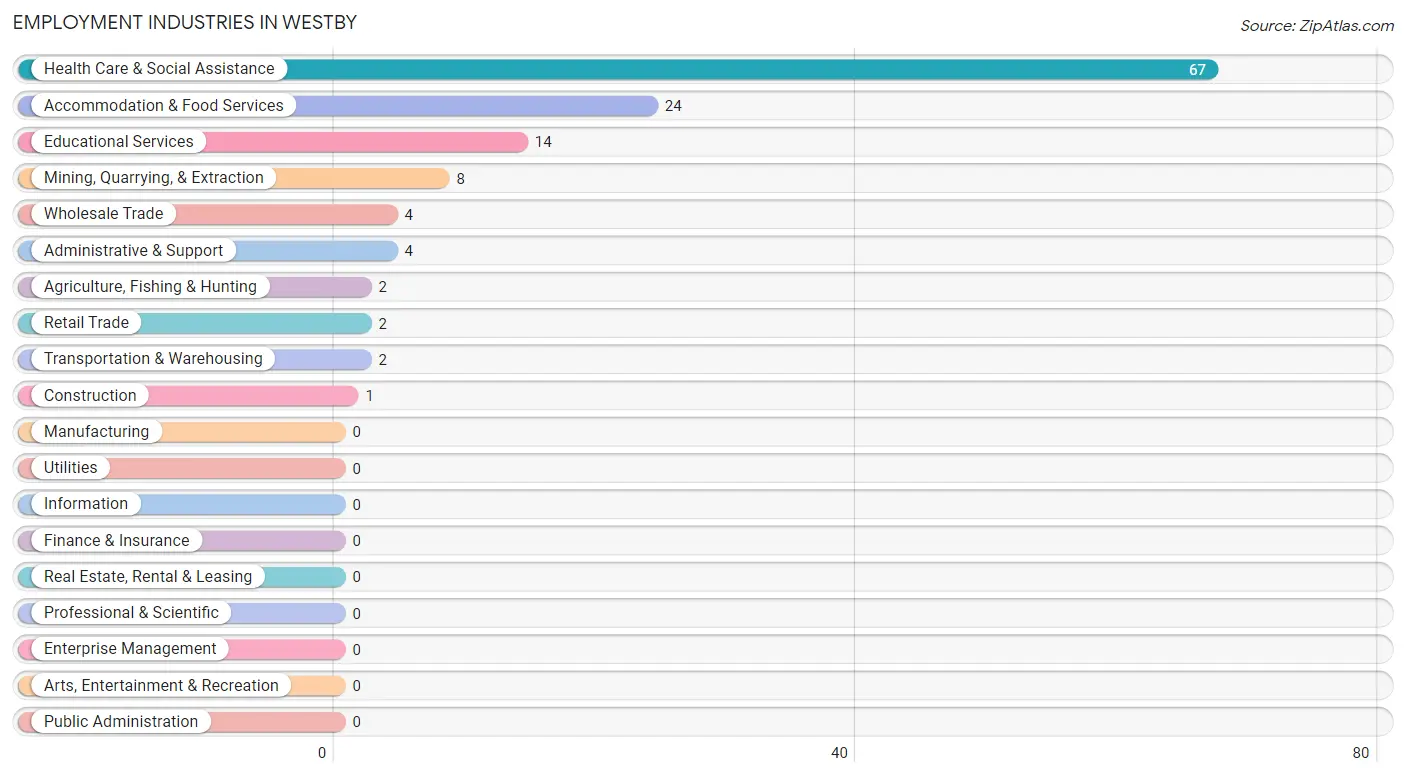
Employment Industries in Westby
The major employment industries in Westby include Health Care & Social Assistance (67 | 50.8%), Accommodation & Food Services (24 | 18.2%), Educational Services (14 | 10.6%), Mining, Quarrying, & Extraction (8 | 6.1%), and Wholesale Trade (4 | 3.0%).
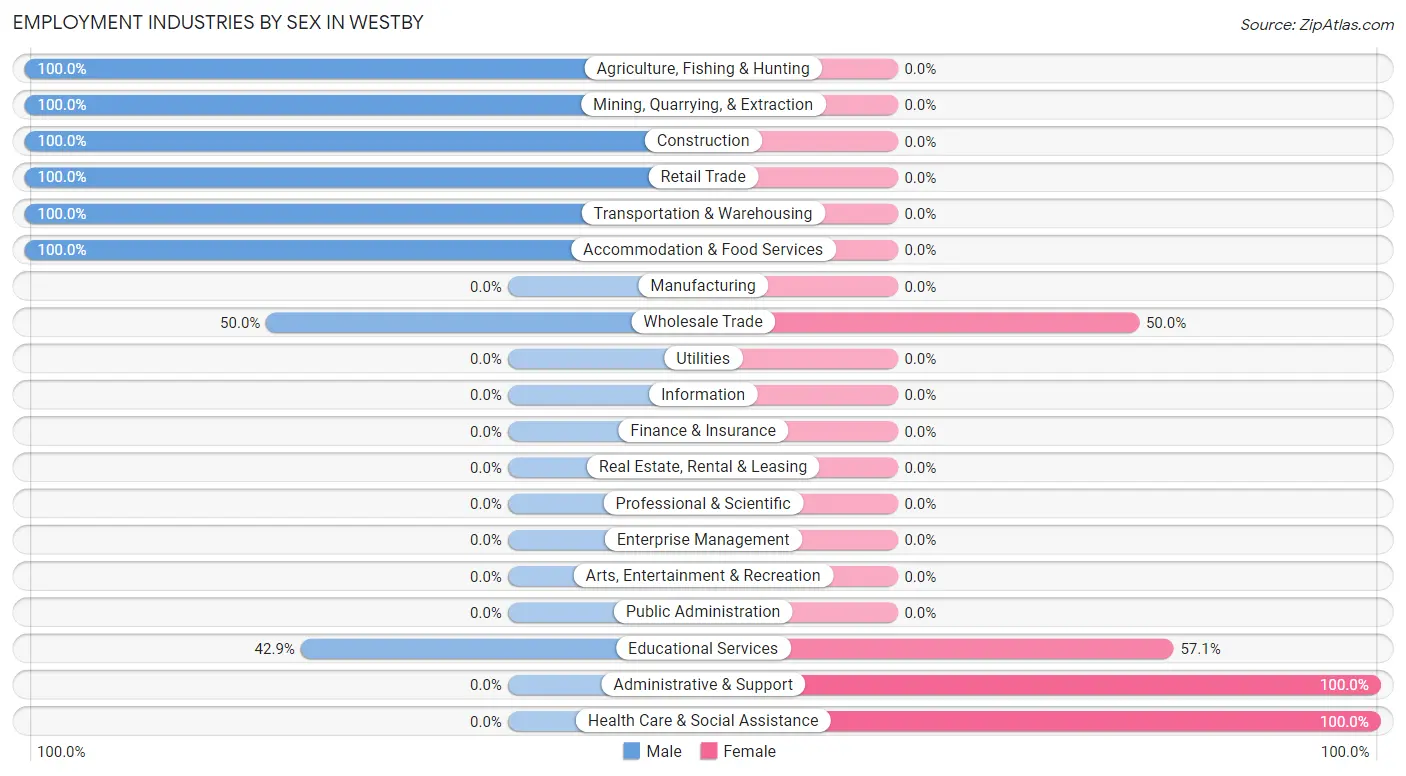
Employment Industries by Sex in Westby
The Westby industries that see more men than women are Agriculture, Fishing & Hunting (100.0%), Mining, Quarrying, & Extraction (100.0%), and Construction (100.0%), whereas the industries that tend to have a higher number of women are Administrative & Support (100.0%), Health Care & Social Assistance (100.0%), and Educational Services (57.1%).
| Industry | Male | Female |
| Agriculture, Fishing & Hunting | 2 (100.0%) | 0 (0.0%) |
| Mining, Quarrying, & Extraction | 8 (100.0%) | 0 (0.0%) |
| Construction | 1 (100.0%) | 0 (0.0%) |
| Manufacturing | 0 (0.0%) | 0 (0.0%) |
| Wholesale Trade | 2 (50.0%) | 2 (50.0%) |
| Retail Trade | 2 (100.0%) | 0 (0.0%) |
| Transportation & Warehousing | 2 (100.0%) | 0 (0.0%) |
| Utilities | 0 (0.0%) | 0 (0.0%) |
| Information | 0 (0.0%) | 0 (0.0%) |
| Finance & Insurance | 0 (0.0%) | 0 (0.0%) |
| Real Estate, Rental & Leasing | 0 (0.0%) | 0 (0.0%) |
| Professional & Scientific | 0 (0.0%) | 0 (0.0%) |
| Enterprise Management | 0 (0.0%) | 0 (0.0%) |
| Administrative & Support | 0 (0.0%) | 4 (100.0%) |
| Educational Services | 6 (42.9%) | 8 (57.1%) |
| Health Care & Social Assistance | 0 (0.0%) | 67 (100.0%) |
| Arts, Entertainment & Recreation | 0 (0.0%) | 0 (0.0%) |
| Accommodation & Food Services | 24 (100.0%) | 0 (0.0%) |
| Public Administration | 0 (0.0%) | 0 (0.0%) |
| Total | 49 (37.1%) | 83 (62.9%) |
Education in Westby
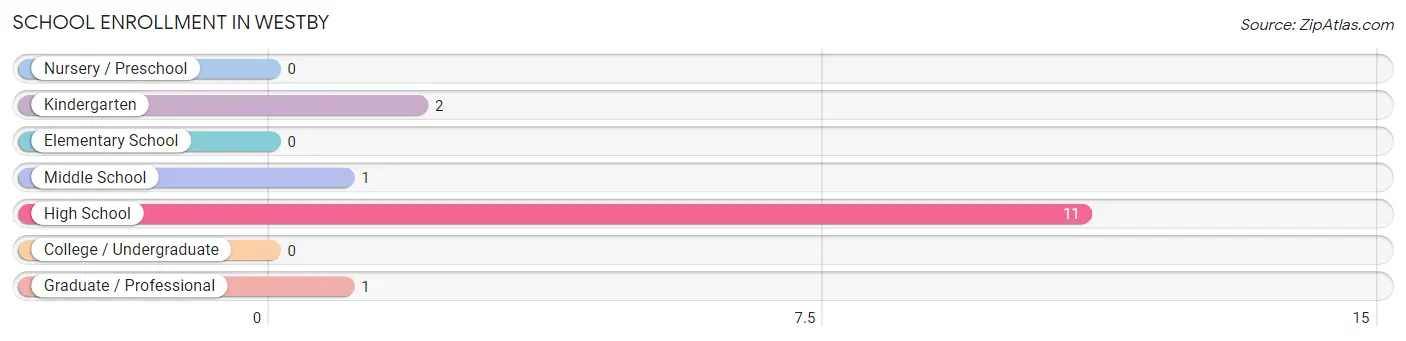
School Enrollment in Westby
The most common levels of schooling among the 15 students in Westby are high school (11 | 73.3%), kindergarten (2 | 13.3%), and middle school (1 | 6.7%).
| School Level | # Students | % Students |
| Nursery / Preschool | 0 | 0.0% |
| Kindergarten | 2 | 13.3% |
| Elementary School | 0 | 0.0% |
| Middle School | 1 | 6.7% |
| High School | 11 | 73.3% |
| College / Undergraduate | 0 | 0.0% |
| Graduate / Professional | 1 | 6.7% |
| Total | 15 | 100.0% |
School Enrollment by Age by Funding Source in Westby
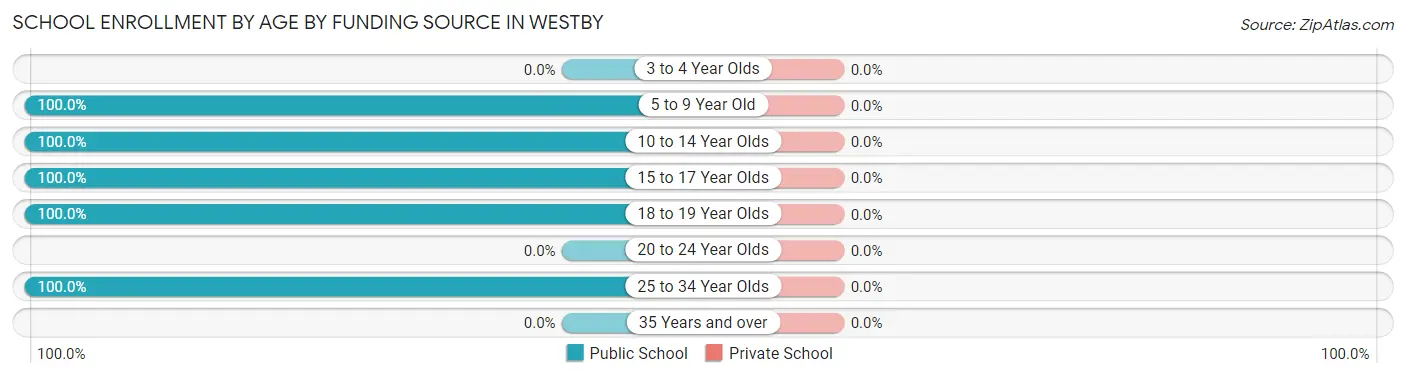
| Age Bracket | Public School | Private School |
| 3 to 4 Year Olds | 0 (0.0%) | 0 (0.0%) |
| 5 to 9 Year Old | 2 (100.0%) | 0 (0.0%) |
| 10 to 14 Year Olds | 1 (100.0%) | 0 (0.0%) |
| 15 to 17 Year Olds | 2 (100.0%) | 0 (0.0%) |
| 18 to 19 Year Olds | 9 (100.0%) | 0 (0.0%) |
| 20 to 24 Year Olds | 0 (0.0%) | 0 (0.0%) |
| 25 to 34 Year Olds | 1 (100.0%) | 0 (0.0%) |
| 35 Years and over | 0 (0.0%) | 0 (0.0%) |
| Total | 15 (100.0%) | 0 (0.0%) |
Educational Attainment by Field of Study in Westby
Business (29 | 61.7%), education (8 | 17.0%), literature & languages (7 | 14.9%), science & technology (2 | 4.3%), and liberal arts & history (1 | 2.1%) are the most common fields of study among 47 individuals in Westby who have obtained a bachelor's degree or higher.
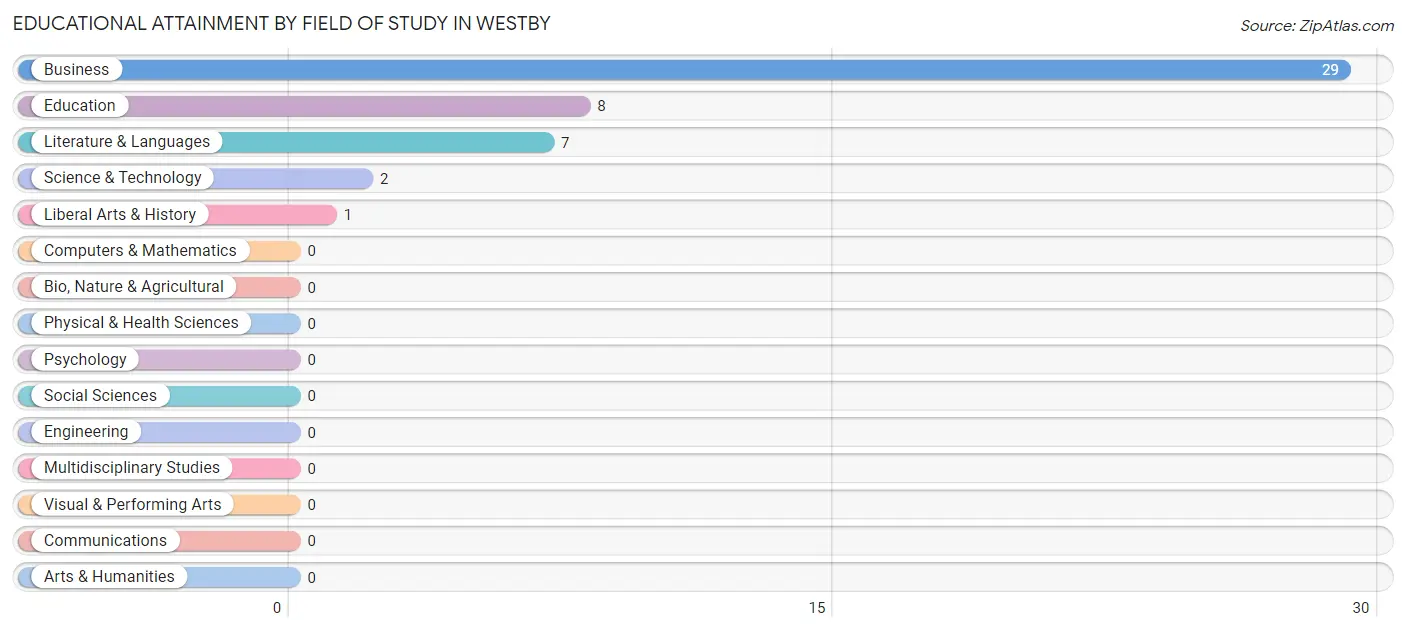
| Field of Study | # Graduates | % Graduates |
| Computers & Mathematics | 0 | 0.0% |
| Bio, Nature & Agricultural | 0 | 0.0% |
| Physical & Health Sciences | 0 | 0.0% |
| Psychology | 0 | 0.0% |
| Social Sciences | 0 | 0.0% |
| Engineering | 0 | 0.0% |
| Multidisciplinary Studies | 0 | 0.0% |
| Science & Technology | 2 | 4.3% |
| Business | 29 | 61.7% |
| Education | 8 | 17.0% |
| Literature & Languages | 7 | 14.9% |
| Liberal Arts & History | 1 | 2.1% |
| Visual & Performing Arts | 0 | 0.0% |
| Communications | 0 | 0.0% |
| Arts & Humanities | 0 | 0.0% |
| Total | 47 | 100.0% |
Transportation & Commute in Westby
Vehicle Availability by Sex in Westby
The most prevalent vehicle ownership categories in Westby are males with 4 vehicles (24, accounting for 49.0%) and females with 4 vehicles (72, making up 28.9%).
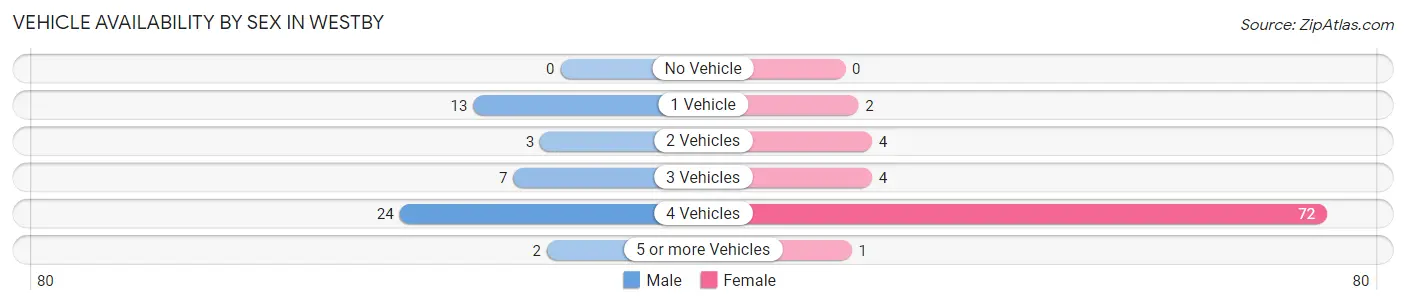
| Vehicles Available | Male | Female |
| No Vehicle | 0 (0.0%) | 0 (0.0%) |
| 1 Vehicle | 13 (26.5%) | 2 (2.4%) |
| 2 Vehicles | 3 (6.1%) | 4 (4.8%) |
| 3 Vehicles | 7 (14.3%) | 4 (4.8%) |
| 4 Vehicles | 24 (49.0%) | 72 (86.8%) |
| 5 or more Vehicles | 2 (4.1%) | 1 (1.2%) |
| Total | 49 (100.0%) | 83 (100.0%) |
Commute Time in Westby
The most frequently occuring commute durations in Westby are 10 to 14 minutes (61 commuters, 46.2%), 20 to 24 minutes (28 commuters, 21.2%), and 5 to 9 minutes (14 commuters, 10.6%).
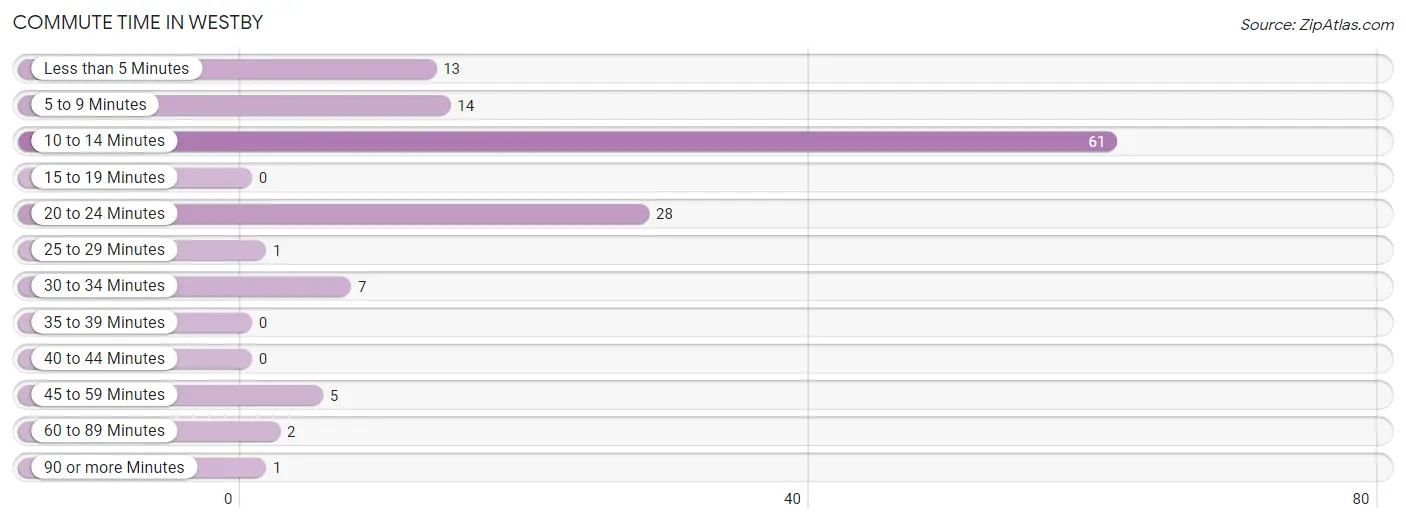
| Commute Time | # Commuters | % Commuters |
| Less than 5 Minutes | 13 | 9.9% |
| 5 to 9 Minutes | 14 | 10.6% |
| 10 to 14 Minutes | 61 | 46.2% |
| 15 to 19 Minutes | 0 | 0.0% |
| 20 to 24 Minutes | 28 | 21.2% |
| 25 to 29 Minutes | 1 | 0.8% |
| 30 to 34 Minutes | 7 | 5.3% |
| 35 to 39 Minutes | 0 | 0.0% |
| 40 to 44 Minutes | 0 | 0.0% |
| 45 to 59 Minutes | 5 | 3.8% |
| 60 to 89 Minutes | 2 | 1.5% |
| 90 or more Minutes | 1 | 0.8% |
Commute Time by Sex in Westby
The most common commute times in Westby are 10 to 14 minutes (21 commuters, 42.9%) for males and 10 to 14 minutes (40 commuters, 48.2%) for females.
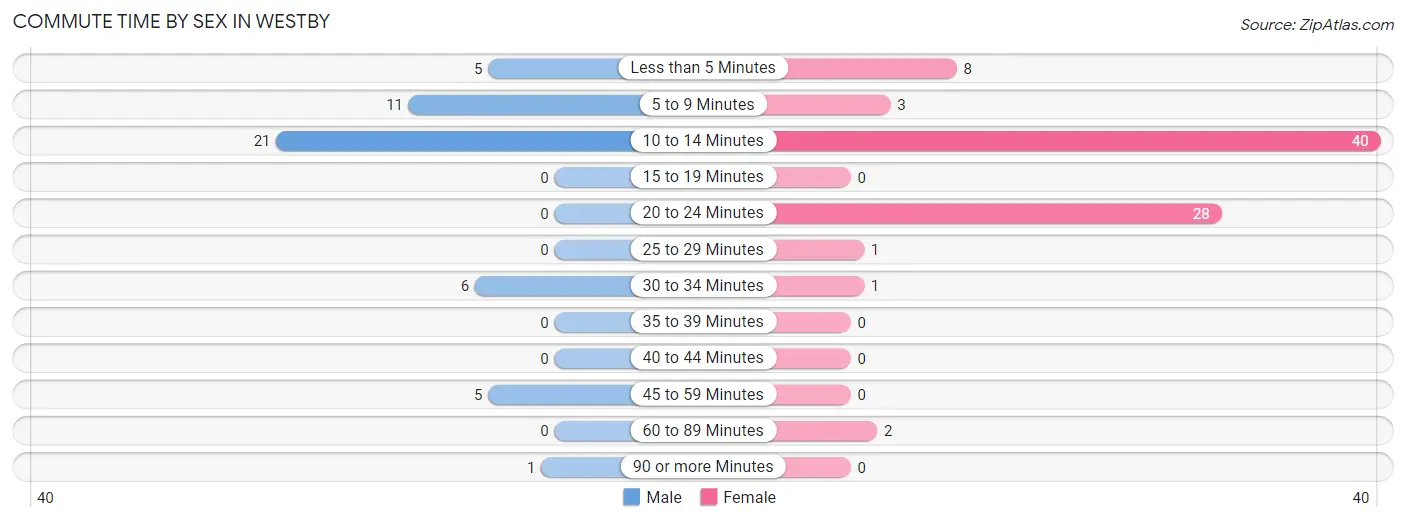
| Commute Time | Male | Female |
| Less than 5 Minutes | 5 (10.2%) | 8 (9.6%) |
| 5 to 9 Minutes | 11 (22.5%) | 3 (3.6%) |
| 10 to 14 Minutes | 21 (42.9%) | 40 (48.2%) |
| 15 to 19 Minutes | 0 (0.0%) | 0 (0.0%) |
| 20 to 24 Minutes | 0 (0.0%) | 28 (33.7%) |
| 25 to 29 Minutes | 0 (0.0%) | 1 (1.2%) |
| 30 to 34 Minutes | 6 (12.2%) | 1 (1.2%) |
| 35 to 39 Minutes | 0 (0.0%) | 0 (0.0%) |
| 40 to 44 Minutes | 0 (0.0%) | 0 (0.0%) |
| 45 to 59 Minutes | 5 (10.2%) | 0 (0.0%) |
| 60 to 89 Minutes | 0 (0.0%) | 2 (2.4%) |
| 90 or more Minutes | 1 (2.0%) | 0 (0.0%) |
Time of Departure to Work by Sex in Westby
The most frequent times of departure to work in Westby are 8:00 AM to 8:29 AM (27, 55.1%) for males and 11:00 AM to 11:59 AM (40, 48.2%) for females.
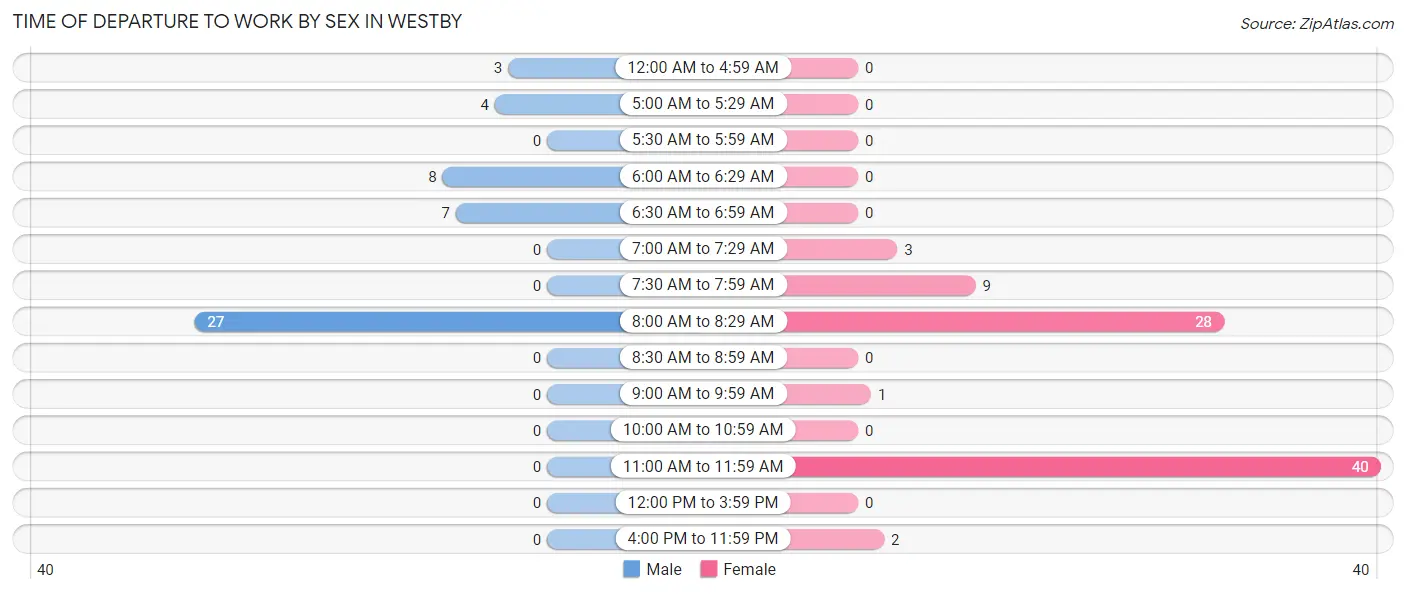
| Time of Departure | Male | Female |
| 12:00 AM to 4:59 AM | 3 (6.1%) | 0 (0.0%) |
| 5:00 AM to 5:29 AM | 4 (8.2%) | 0 (0.0%) |
| 5:30 AM to 5:59 AM | 0 (0.0%) | 0 (0.0%) |
| 6:00 AM to 6:29 AM | 8 (16.3%) | 0 (0.0%) |
| 6:30 AM to 6:59 AM | 7 (14.3%) | 0 (0.0%) |
| 7:00 AM to 7:29 AM | 0 (0.0%) | 3 (3.6%) |
| 7:30 AM to 7:59 AM | 0 (0.0%) | 9 (10.8%) |
| 8:00 AM to 8:29 AM | 27 (55.1%) | 28 (33.7%) |
| 8:30 AM to 8:59 AM | 0 (0.0%) | 0 (0.0%) |
| 9:00 AM to 9:59 AM | 0 (0.0%) | 1 (1.2%) |
| 10:00 AM to 10:59 AM | 0 (0.0%) | 0 (0.0%) |
| 11:00 AM to 11:59 AM | 0 (0.0%) | 40 (48.2%) |
| 12:00 PM to 3:59 PM | 0 (0.0%) | 0 (0.0%) |
| 4:00 PM to 11:59 PM | 0 (0.0%) | 2 (2.4%) |
| Total | 49 (100.0%) | 83 (100.0%) |
Housing Occupancy in Westby
Occupancy by Ownership in Westby
Of the total 79 dwellings in Westby, owner-occupied units account for 66 (83.5%), while renter-occupied units make up 13 (16.5%).
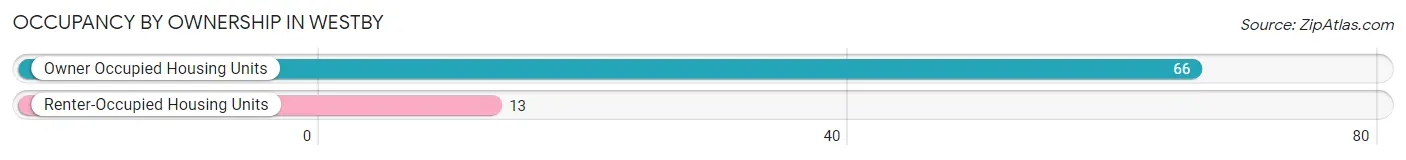
| Occupancy | # Housing Units | % Housing Units |
| Owner Occupied Housing Units | 66 | 83.5% |
| Renter-Occupied Housing Units | 13 | 16.5% |
| Total Occupied Housing Units | 79 | 100.0% |
Occupancy by Household Size in Westby
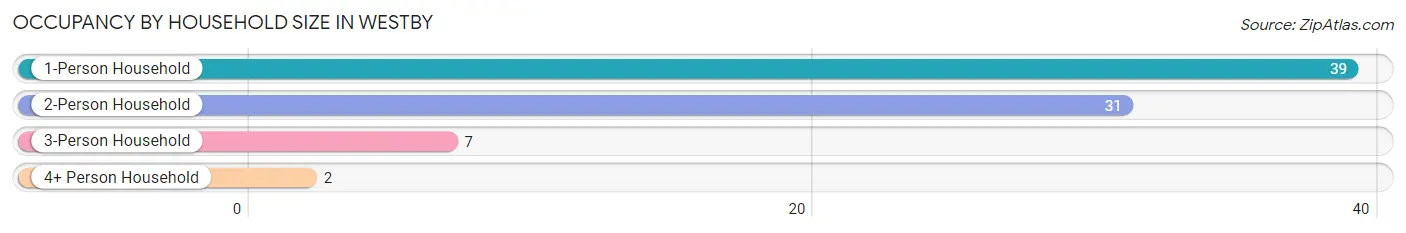
| Household Size | # Housing Units | % Housing Units |
| 1-Person Household | 39 | 49.4% |
| 2-Person Household | 31 | 39.2% |
| 3-Person Household | 7 | 8.9% |
| 4+ Person Household | 2 | 2.5% |
| Total Housing Units | 79 | 100.0% |
Occupancy by Ownership by Household Size in Westby
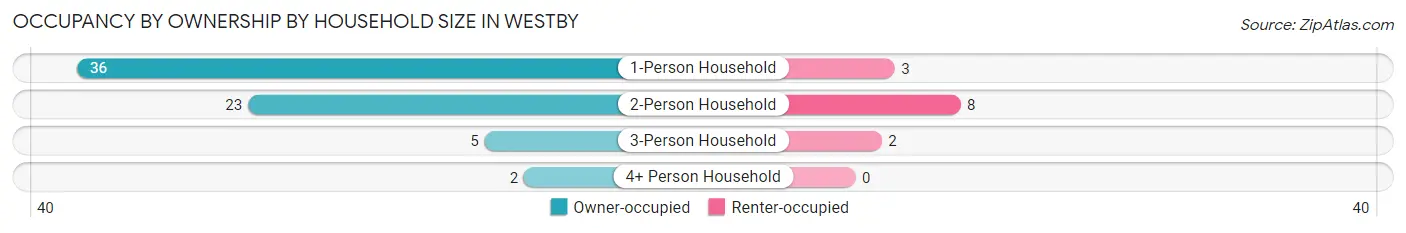
| Household Size | Owner-occupied | Renter-occupied |
| 1-Person Household | 36 (92.3%) | 3 (7.7%) |
| 2-Person Household | 23 (74.2%) | 8 (25.8%) |
| 3-Person Household | 5 (71.4%) | 2 (28.6%) |
| 4+ Person Household | 2 (100.0%) | 0 (0.0%) |
| Total Housing Units | 66 (83.5%) | 13 (16.5%) |
Occupancy by Educational Attainment in Westby
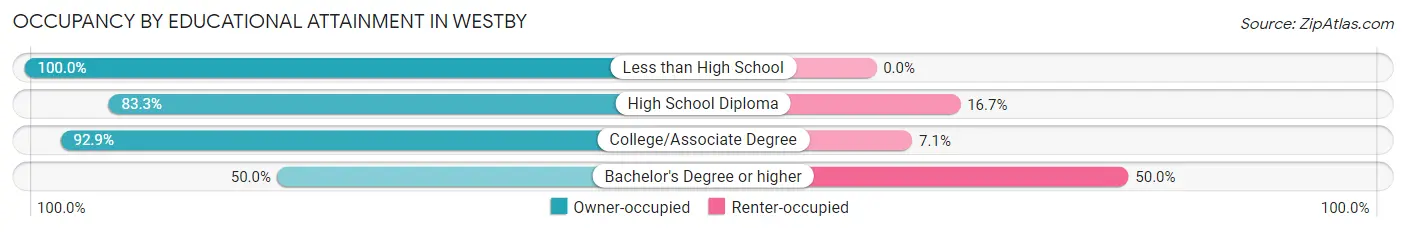
| Household Size | Owner-occupied | Renter-occupied |
| Less than High School | 1 (100.0%) | 0 (0.0%) |
| High School Diploma | 20 (83.3%) | 4 (16.7%) |
| College/Associate Degree | 39 (92.9%) | 3 (7.1%) |
| Bachelor's Degree or higher | 6 (50.0%) | 6 (50.0%) |
Occupancy by Age of Householder in Westby
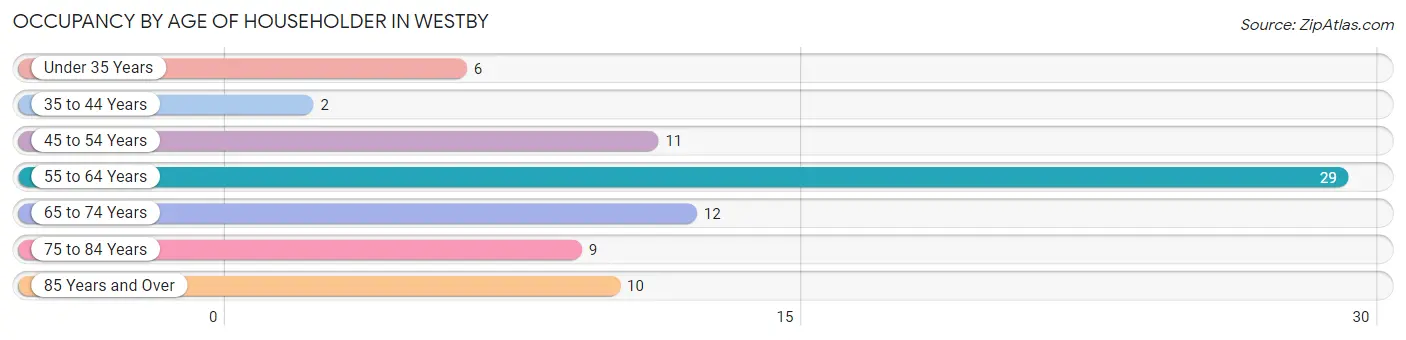
| Age Bracket | # Households | % Households |
| Under 35 Years | 6 | 7.6% |
| 35 to 44 Years | 2 | 2.5% |
| 45 to 54 Years | 11 | 13.9% |
| 55 to 64 Years | 29 | 36.7% |
| 65 to 74 Years | 12 | 15.2% |
| 75 to 84 Years | 9 | 11.4% |
| 85 Years and Over | 10 | 12.7% |
| Total | 79 | 100.0% |
Housing Finances in Westby
Median Income by Occupancy in Westby
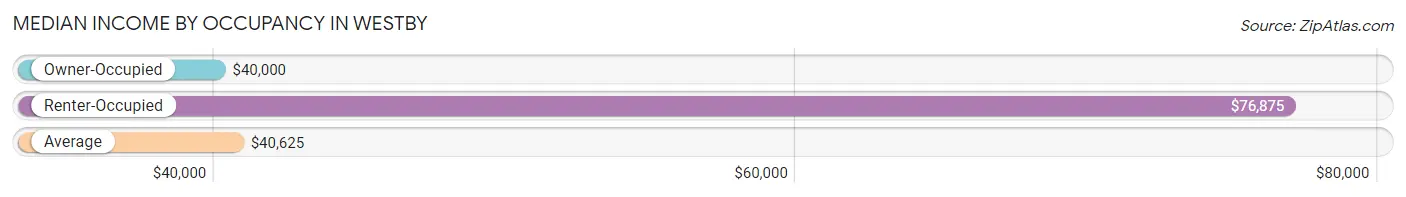
| Occupancy Type | # Households | Median Income |
| Owner-Occupied | 66 (83.5%) | $40,000 |
| Renter-Occupied | 13 (16.5%) | $76,875 |
| Average | 79 (100.0%) | $40,625 |
Occupancy by Householder Income Bracket in Westby
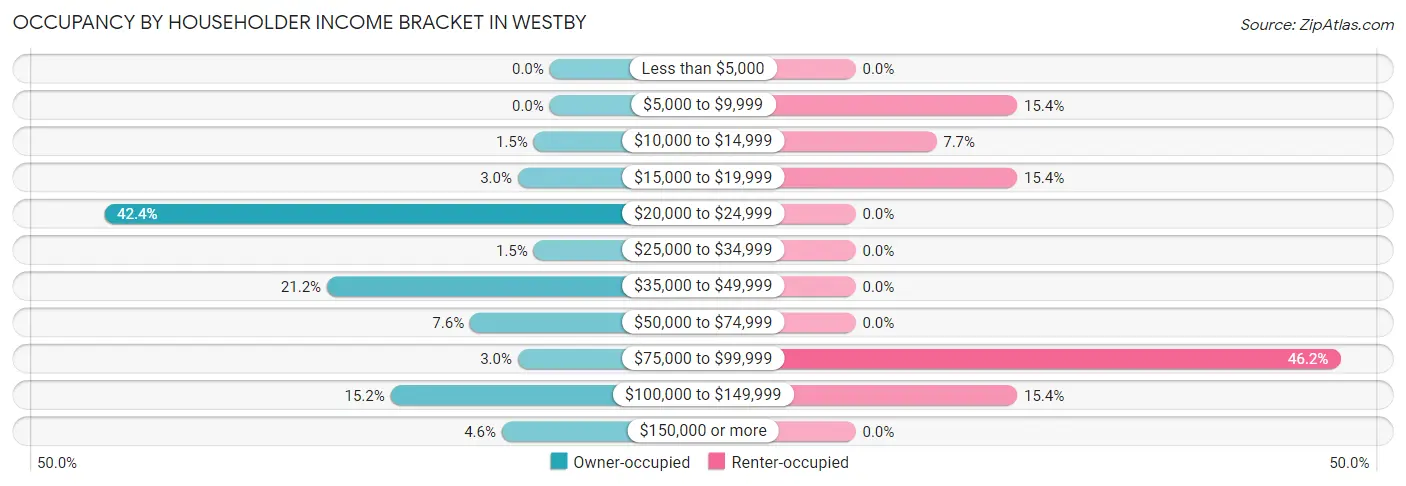
| Income Bracket | Owner-occupied | Renter-occupied |
| Less than $5,000 | 0 (0.0%) | 0 (0.0%) |
| $5,000 to $9,999 | 0 (0.0%) | 2 (15.4%) |
| $10,000 to $14,999 | 1 (1.5%) | 1 (7.7%) |
| $15,000 to $19,999 | 2 (3.0%) | 2 (15.4%) |
| $20,000 to $24,999 | 28 (42.4%) | 0 (0.0%) |
| $25,000 to $34,999 | 1 (1.5%) | 0 (0.0%) |
| $35,000 to $49,999 | 14 (21.2%) | 0 (0.0%) |
| $50,000 to $74,999 | 5 (7.6%) | 0 (0.0%) |
| $75,000 to $99,999 | 2 (3.0%) | 6 (46.2%) |
| $100,000 to $149,999 | 10 (15.1%) | 2 (15.4%) |
| $150,000 or more | 3 (4.5%) | 0 (0.0%) |
| Total | 66 (100.0%) | 13 (100.0%) |
Monthly Housing Cost Tiers in Westby
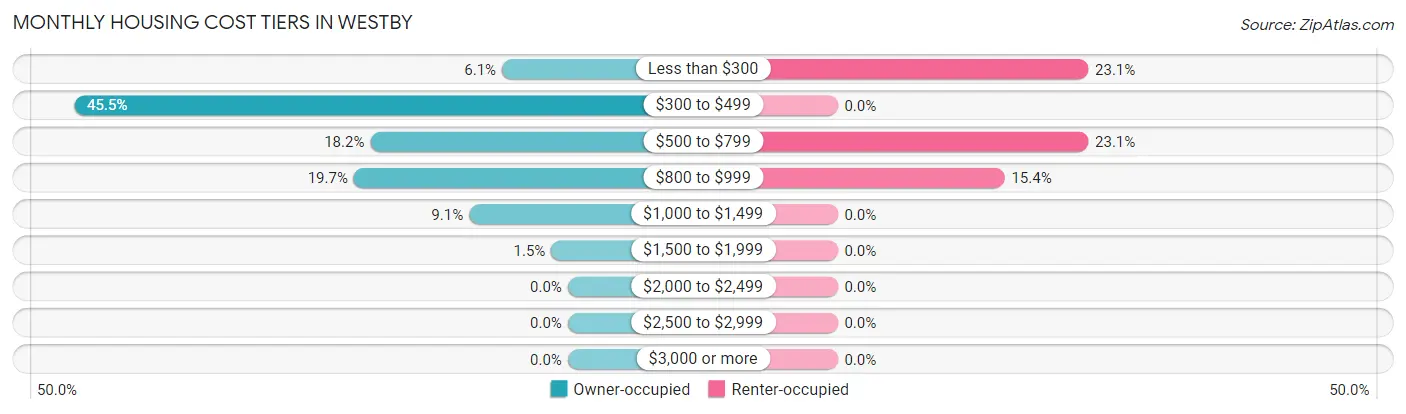
| Monthly Cost | Owner-occupied | Renter-occupied |
| Less than $300 | 4 (6.1%) | 3 (23.1%) |
| $300 to $499 | 30 (45.5%) | 0 (0.0%) |
| $500 to $799 | 12 (18.2%) | 3 (23.1%) |
| $800 to $999 | 13 (19.7%) | 2 (15.4%) |
| $1,000 to $1,499 | 6 (9.1%) | 0 (0.0%) |
| $1,500 to $1,999 | 1 (1.5%) | 0 (0.0%) |
| $2,000 to $2,499 | 0 (0.0%) | 0 (0.0%) |
| $2,500 to $2,999 | 0 (0.0%) | 0 (0.0%) |
| $3,000 or more | 0 (0.0%) | 0 (0.0%) |
| Total | 66 (100.0%) | 13 (100.0%) |
Physical Housing Characteristics in Westby
Housing Structures in Westby
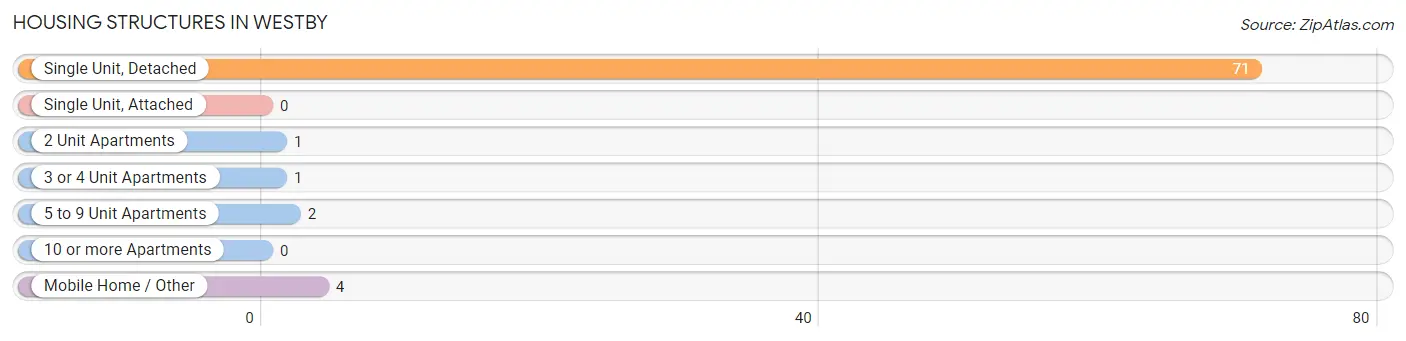
| Structure Type | # Housing Units | % Housing Units |
| Single Unit, Detached | 71 | 89.9% |
| Single Unit, Attached | 0 | 0.0% |
| 2 Unit Apartments | 1 | 1.3% |
| 3 or 4 Unit Apartments | 1 | 1.3% |
| 5 to 9 Unit Apartments | 2 | 2.5% |
| 10 or more Apartments | 0 | 0.0% |
| Mobile Home / Other | 4 | 5.1% |
| Total | 79 | 100.0% |
Housing Structures by Occupancy in Westby
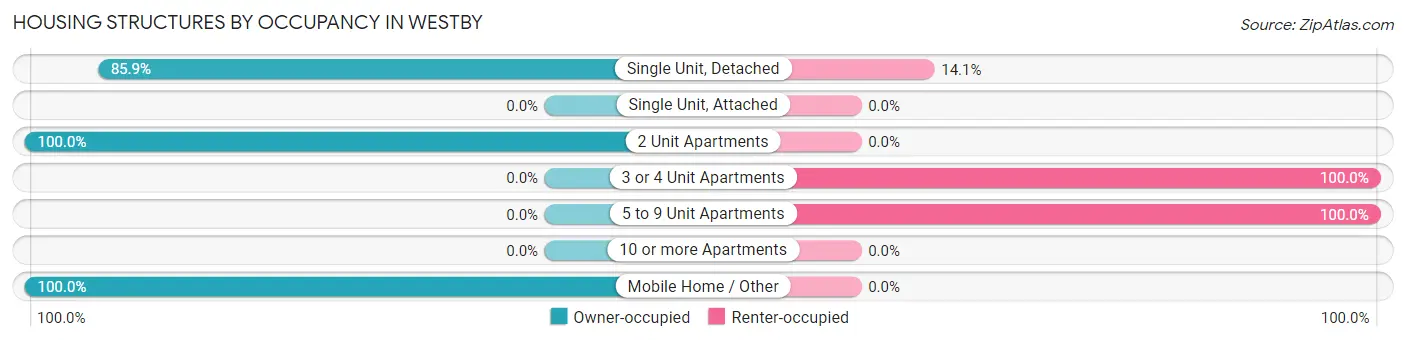
| Structure Type | Owner-occupied | Renter-occupied |
| Single Unit, Detached | 61 (85.9%) | 10 (14.1%) |
| Single Unit, Attached | 0 (0.0%) | 0 (0.0%) |
| 2 Unit Apartments | 1 (100.0%) | 0 (0.0%) |
| 3 or 4 Unit Apartments | 0 (0.0%) | 1 (100.0%) |
| 5 to 9 Unit Apartments | 0 (0.0%) | 2 (100.0%) |
| 10 or more Apartments | 0 (0.0%) | 0 (0.0%) |
| Mobile Home / Other | 4 (100.0%) | 0 (0.0%) |
| Total | 66 (83.5%) | 13 (16.5%) |
Housing Structures by Number of Rooms in Westby
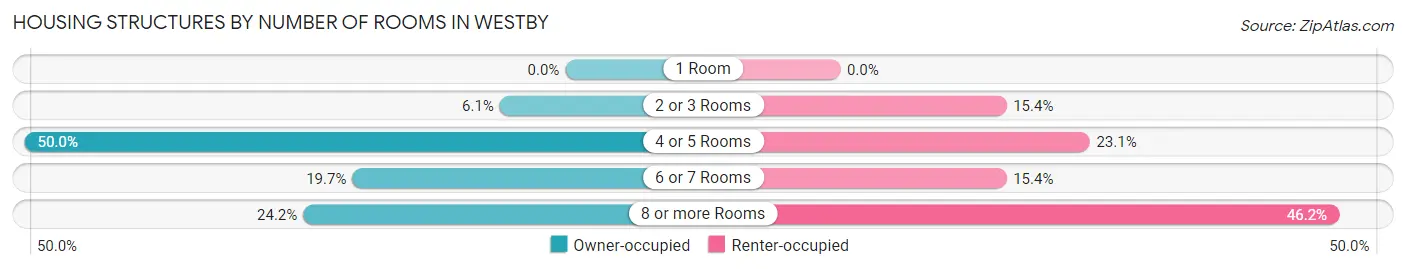
| Number of Rooms | Owner-occupied | Renter-occupied |
| 1 Room | 0 (0.0%) | 0 (0.0%) |
| 2 or 3 Rooms | 4 (6.1%) | 2 (15.4%) |
| 4 or 5 Rooms | 33 (50.0%) | 3 (23.1%) |
| 6 or 7 Rooms | 13 (19.7%) | 2 (15.4%) |
| 8 or more Rooms | 16 (24.2%) | 6 (46.2%) |
| Total | 66 (100.0%) | 13 (100.0%) |
Housing Structure by Heating Type in Westby
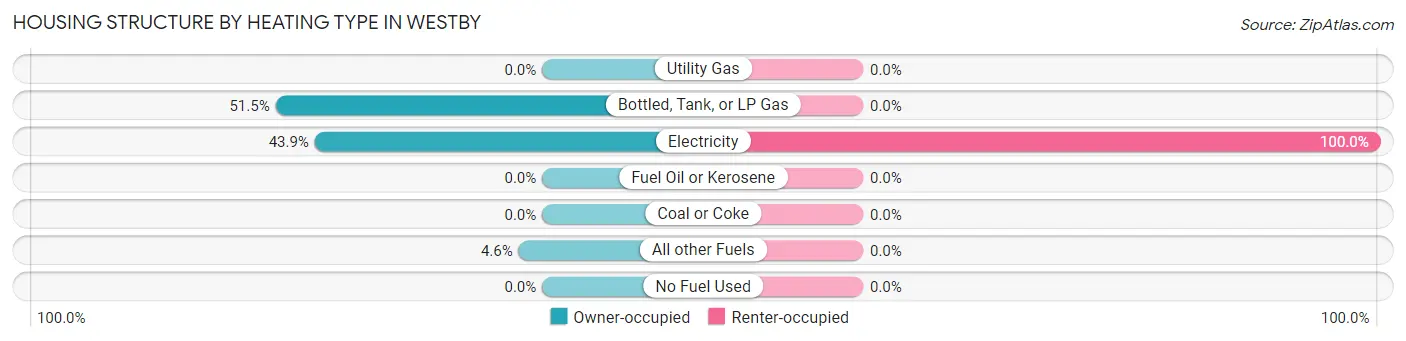
| Heating Type | Owner-occupied | Renter-occupied |
| Utility Gas | 0 (0.0%) | 0 (0.0%) |
| Bottled, Tank, or LP Gas | 34 (51.5%) | 0 (0.0%) |
| Electricity | 29 (43.9%) | 13 (100.0%) |
| Fuel Oil or Kerosene | 0 (0.0%) | 0 (0.0%) |
| Coal or Coke | 0 (0.0%) | 0 (0.0%) |
| All other Fuels | 3 (4.5%) | 0 (0.0%) |
| No Fuel Used | 0 (0.0%) | 0 (0.0%) |
| Total | 66 (100.0%) | 13 (100.0%) |
Household Vehicle Usage in Westby
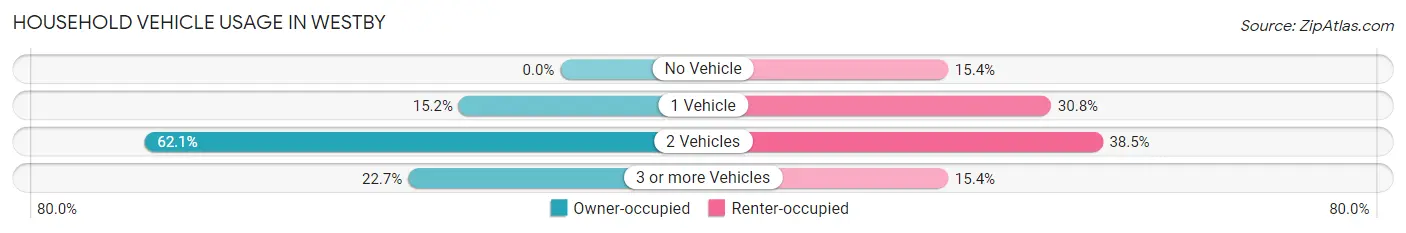
| Vehicles per Household | Owner-occupied | Renter-occupied |
| No Vehicle | 0 (0.0%) | 2 (15.4%) |
| 1 Vehicle | 10 (15.1%) | 4 (30.8%) |
| 2 Vehicles | 41 (62.1%) | 5 (38.5%) |
| 3 or more Vehicles | 15 (22.7%) | 2 (15.4%) |
| Total | 66 (100.0%) | 13 (100.0%) |
Real Estate & Mortgages in Westby
Real Estate and Mortgage Overview in Westby
| Characteristic | Without Mortgage | With Mortgage |
| Housing Units | 57 | 9 |
| Median Property Value | $53,000 | $69,000 |
| Median Household Income | - | - |
| Monthly Housing Costs | $475 | $0 |
| Real Estate Taxes | - | - |
Property Value by Mortgage Status in Westby
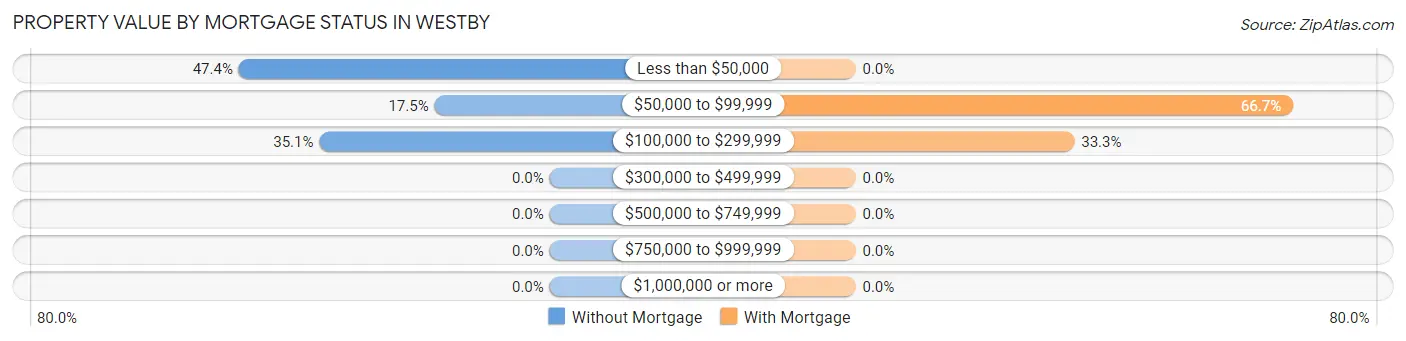
| Property Value | Without Mortgage | With Mortgage |
| Less than $50,000 | 27 (47.4%) | 0 (0.0%) |
| $50,000 to $99,999 | 10 (17.5%) | 6 (66.7%) |
| $100,000 to $299,999 | 20 (35.1%) | 3 (33.3%) |
| $300,000 to $499,999 | 0 (0.0%) | 0 (0.0%) |
| $500,000 to $749,999 | 0 (0.0%) | 0 (0.0%) |
| $750,000 to $999,999 | 0 (0.0%) | 0 (0.0%) |
| $1,000,000 or more | 0 (0.0%) | 0 (0.0%) |
| Total | 57 (100.0%) | 9 (100.0%) |
Household Income by Mortgage Status in Westby
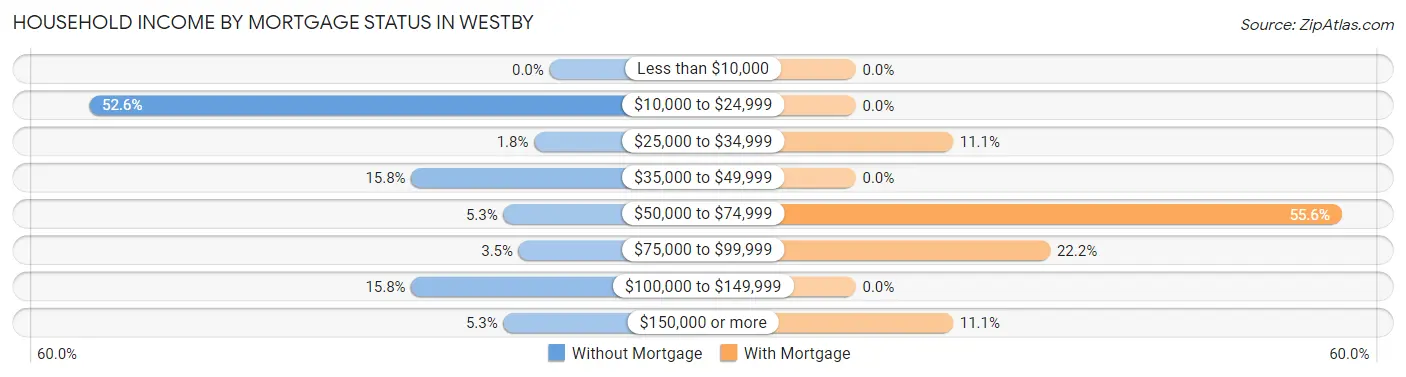
| Household Income | Without Mortgage | With Mortgage |
| Less than $10,000 | 0 (0.0%) | 0 (0.0%) |
| $10,000 to $24,999 | 30 (52.6%) | 0 (0.0%) |
| $25,000 to $34,999 | 1 (1.8%) | 1 (11.1%) |
| $35,000 to $49,999 | 9 (15.8%) | 0 (0.0%) |
| $50,000 to $74,999 | 3 (5.3%) | 5 (55.6%) |
| $75,000 to $99,999 | 2 (3.5%) | 2 (22.2%) |
| $100,000 to $149,999 | 9 (15.8%) | 0 (0.0%) |
| $150,000 or more | 3 (5.3%) | 1 (11.1%) |
| Total | 57 (100.0%) | 9 (100.0%) |
Property Value to Household Income Ratio in Westby
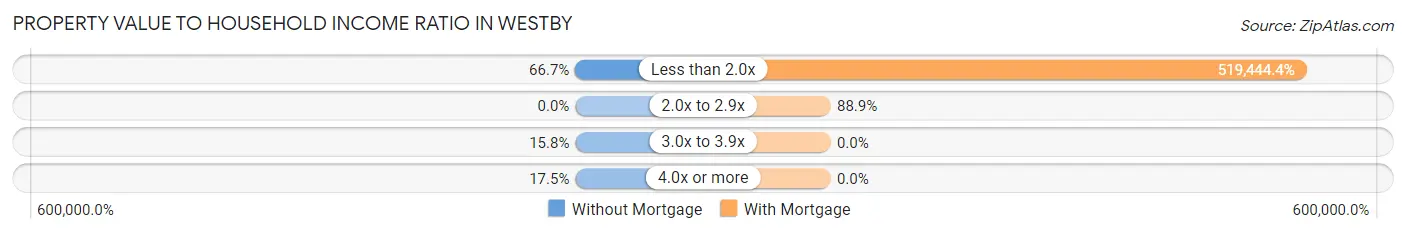
| Value-to-Income Ratio | Without Mortgage | With Mortgage |
| Less than 2.0x | 38 (66.7%) | 46,750 (519,444.4%) |
| 2.0x to 2.9x | 0 (0.0%) | 8 (88.9%) |
| 3.0x to 3.9x | 9 (15.8%) | 0 (0.0%) |
| 4.0x or more | 10 (17.5%) | 0 (0.0%) |
| Total | 57 (100.0%) | 9 (100.0%) |
Real Estate Taxes by Mortgage Status in Westby
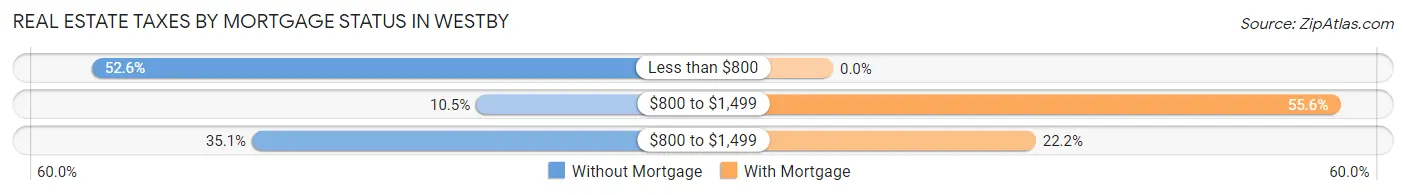
| Property Taxes | Without Mortgage | With Mortgage |
| Less than $800 | 30 (52.6%) | 0 (0.0%) |
| $800 to $1,499 | 6 (10.5%) | 5 (55.6%) |
| $800 to $1,499 | 20 (35.1%) | 2 (22.2%) |
| Total | 57 (100.0%) | 9 (100.0%) |
Health & Disability in Westby
Health Insurance Coverage by Age in Westby
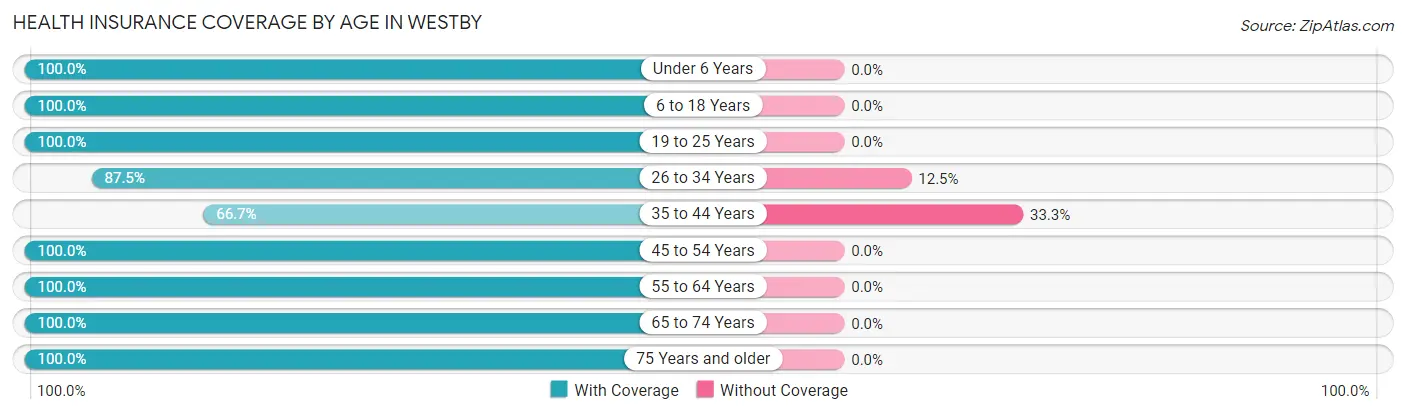
| Age Bracket | With Coverage | Without Coverage |
| Under 6 Years | 2 (100.0%) | 0 (0.0%) |
| 6 to 18 Years | 12 (100.0%) | 0 (0.0%) |
| 19 to 25 Years | 7 (100.0%) | 0 (0.0%) |
| 26 to 34 Years | 7 (87.5%) | 1 (12.5%) |
| 35 to 44 Years | 4 (66.7%) | 2 (33.3%) |
| 45 to 54 Years | 81 (100.0%) | 0 (0.0%) |
| 55 to 64 Years | 52 (100.0%) | 0 (0.0%) |
| 65 to 74 Years | 17 (100.0%) | 0 (0.0%) |
| 75 Years and older | 28 (100.0%) | 0 (0.0%) |
| Total | 210 (98.6%) | 3 (1.4%) |
Health Insurance Coverage by Citizenship Status in Westby
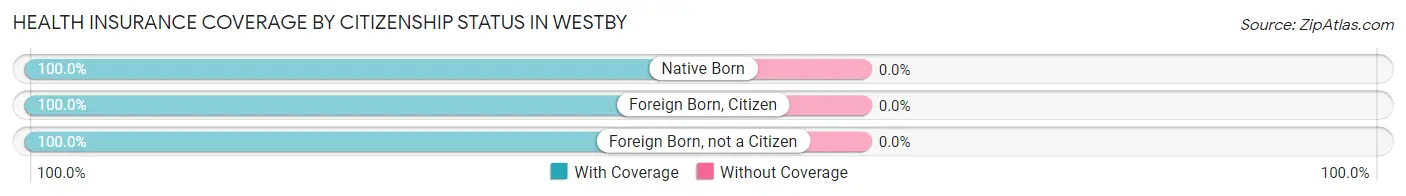
| Citizenship Status | With Coverage | Without Coverage |
| Native Born | 2 (100.0%) | 0 (0.0%) |
| Foreign Born, Citizen | 12 (100.0%) | 0 (0.0%) |
| Foreign Born, not a Citizen | 7 (100.0%) | 0 (0.0%) |
Health Insurance Coverage by Household Income in Westby
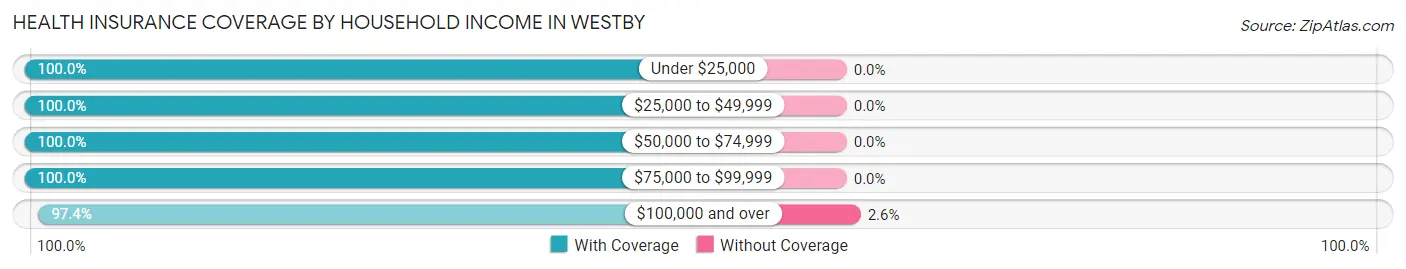
| Household Income | With Coverage | Without Coverage |
| Under $25,000 | 43 (100.0%) | 0 (0.0%) |
| $25,000 to $49,999 | 32 (100.0%) | 0 (0.0%) |
| $50,000 to $74,999 | 7 (100.0%) | 0 (0.0%) |
| $75,000 to $99,999 | 16 (100.0%) | 0 (0.0%) |
| $100,000 and over | 112 (97.4%) | 3 (2.6%) |
Public vs Private Health Insurance Coverage by Age in Westby
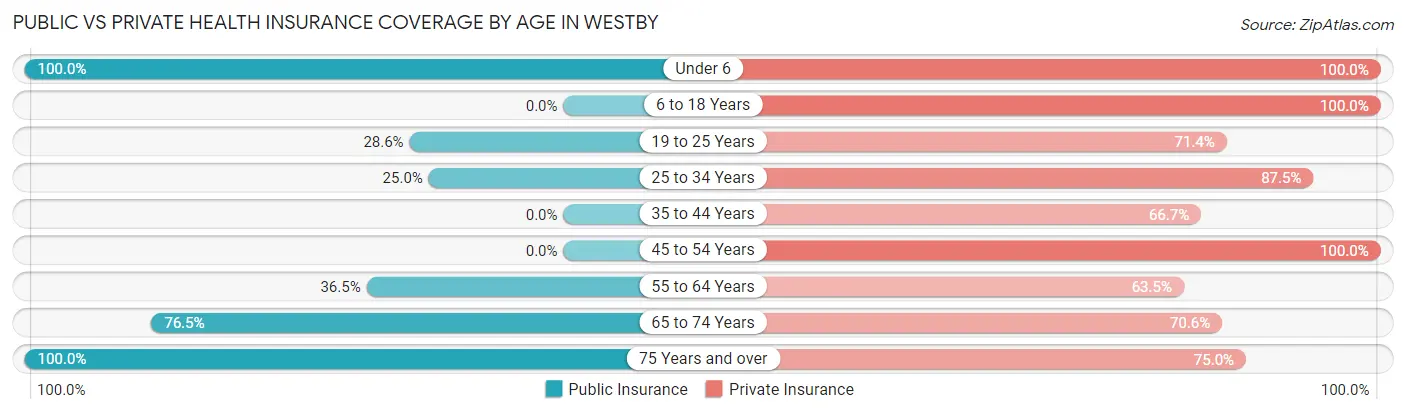
| Age Bracket | Public Insurance | Private Insurance |
| Under 6 | 2 (100.0%) | 2 (100.0%) |
| 6 to 18 Years | 0 (0.0%) | 12 (100.0%) |
| 19 to 25 Years | 2 (28.6%) | 5 (71.4%) |
| 25 to 34 Years | 2 (25.0%) | 7 (87.5%) |
| 35 to 44 Years | 0 (0.0%) | 4 (66.7%) |
| 45 to 54 Years | 0 (0.0%) | 81 (100.0%) |
| 55 to 64 Years | 19 (36.5%) | 33 (63.5%) |
| 65 to 74 Years | 13 (76.5%) | 12 (70.6%) |
| 75 Years and over | 28 (100.0%) | 21 (75.0%) |
| Total | 66 (31.0%) | 177 (83.1%) |
Disability Status by Sex by Age in Westby
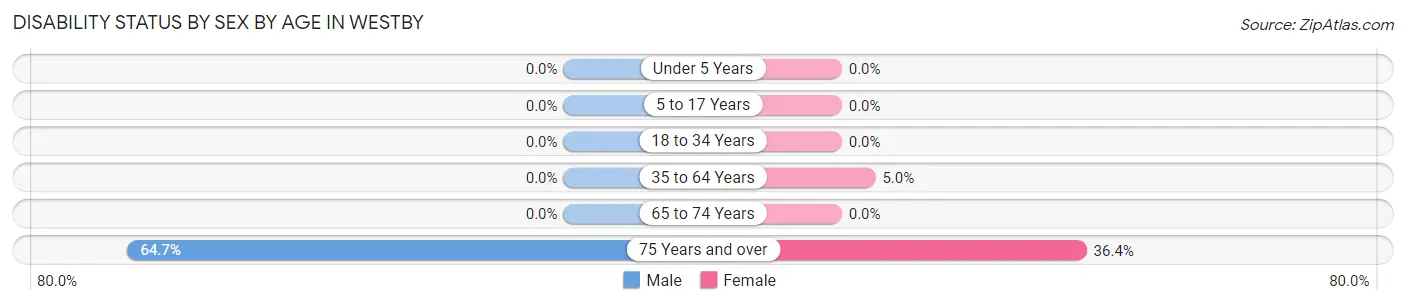
| Age Bracket | Male | Female |
| Under 5 Years | 0 (0.0%) | 0 (0.0%) |
| 5 to 17 Years | 0 (0.0%) | 0 (0.0%) |
| 18 to 34 Years | 0 (0.0%) | 0 (0.0%) |
| 35 to 64 Years | 0 (0.0%) | 4 (5.0%) |
| 65 to 74 Years | 0 (0.0%) | 0 (0.0%) |
| 75 Years and over | 11 (64.7%) | 4 (36.4%) |
Disability Class by Sex by Age in Westby
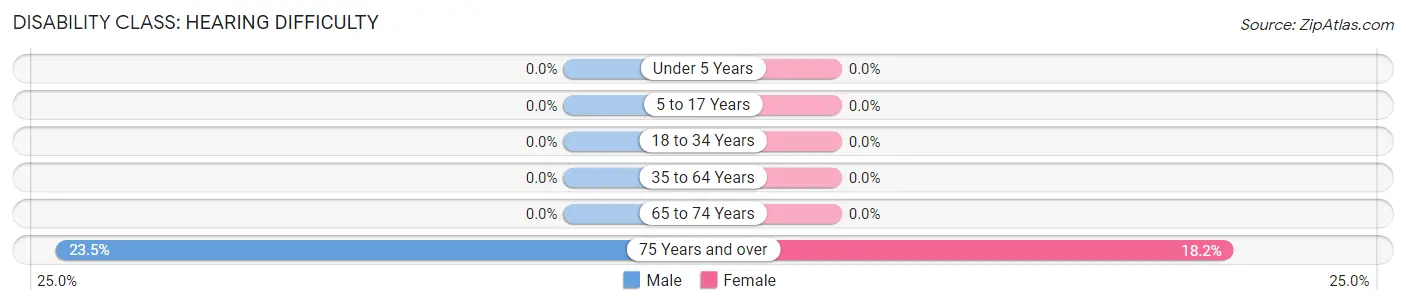
Disability Class: Hearing Difficulty
| Age Bracket | Male | Female |
| Under 5 Years | 0 (0.0%) | 0 (0.0%) |
| 5 to 17 Years | 0 (0.0%) | 0 (0.0%) |
| 18 to 34 Years | 0 (0.0%) | 0 (0.0%) |
| 35 to 64 Years | 0 (0.0%) | 0 (0.0%) |
| 65 to 74 Years | 0 (0.0%) | 0 (0.0%) |
| 75 Years and over | 4 (23.5%) | 2 (18.2%) |
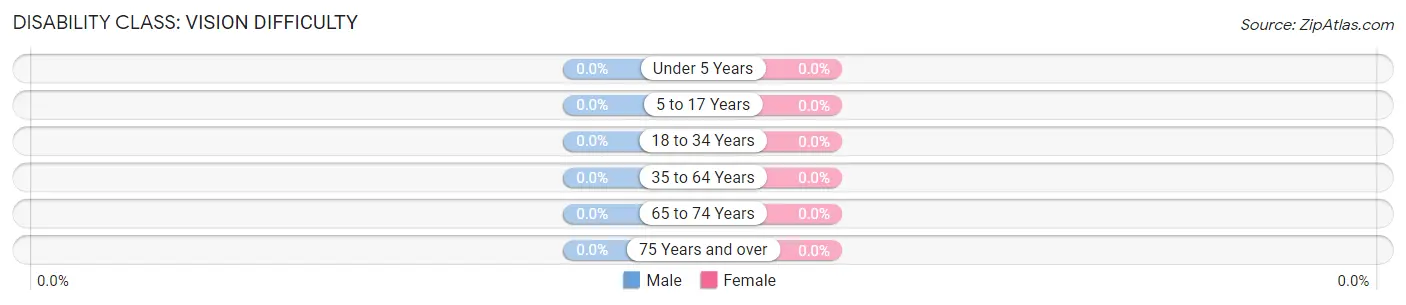
Disability Class: Vision Difficulty
| Age Bracket | Male | Female |
| Under 5 Years | 0 (0.0%) | 0 (0.0%) |
| 5 to 17 Years | 0 (0.0%) | 0 (0.0%) |
| 18 to 34 Years | 0 (0.0%) | 0 (0.0%) |
| 35 to 64 Years | 0 (0.0%) | 0 (0.0%) |
| 65 to 74 Years | 0 (0.0%) | 0 (0.0%) |
| 75 Years and over | 0 (0.0%) | 0 (0.0%) |
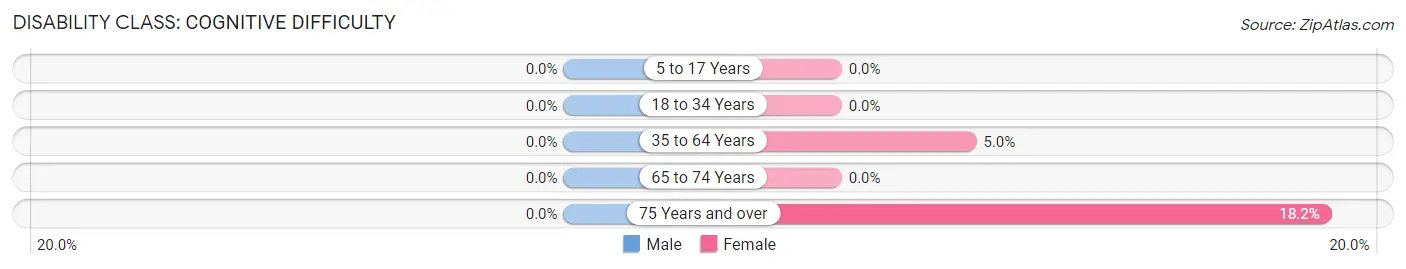
Disability Class: Cognitive Difficulty
| Age Bracket | Male | Female |
| 5 to 17 Years | 0 (0.0%) | 0 (0.0%) |
| 18 to 34 Years | 0 (0.0%) | 0 (0.0%) |
| 35 to 64 Years | 0 (0.0%) | 4 (5.0%) |
| 65 to 74 Years | 0 (0.0%) | 0 (0.0%) |
| 75 Years and over | 0 (0.0%) | 2 (18.2%) |
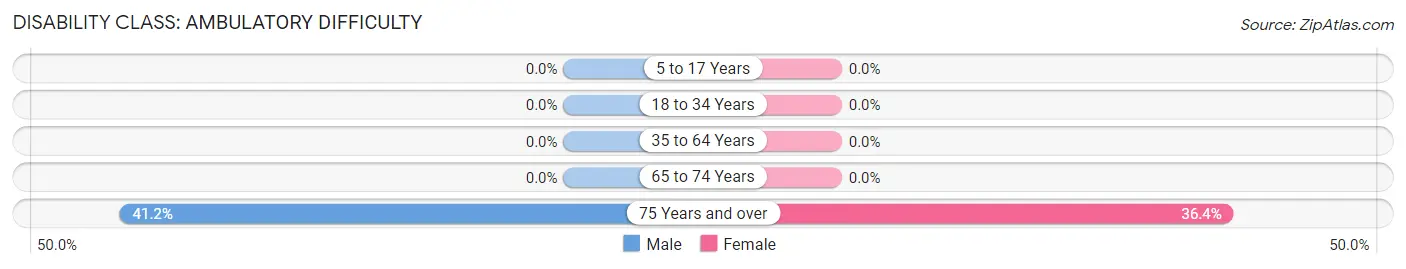
Disability Class: Ambulatory Difficulty
| Age Bracket | Male | Female |
| 5 to 17 Years | 0 (0.0%) | 0 (0.0%) |
| 18 to 34 Years | 0 (0.0%) | 0 (0.0%) |
| 35 to 64 Years | 0 (0.0%) | 0 (0.0%) |
| 65 to 74 Years | 0 (0.0%) | 0 (0.0%) |
| 75 Years and over | 7 (41.2%) | 4 (36.4%) |
Disability Class: Self-Care Difficulty
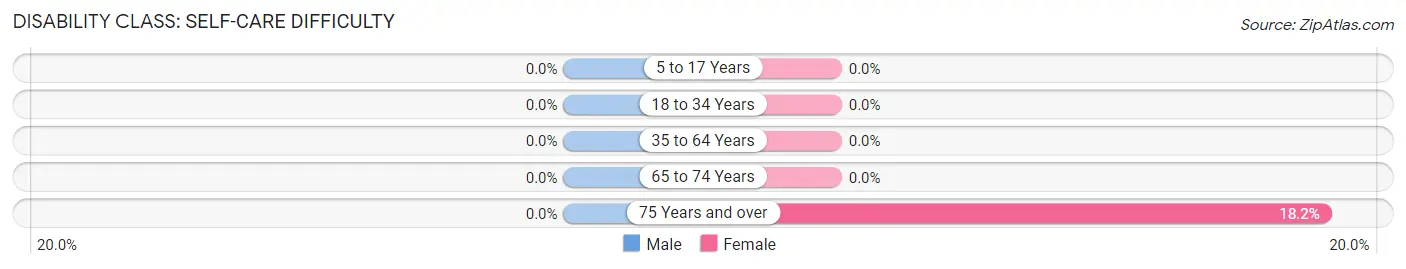
| Age Bracket | Male | Female |
| 5 to 17 Years | 0 (0.0%) | 0 (0.0%) |
| 18 to 34 Years | 0 (0.0%) | 0 (0.0%) |
| 35 to 64 Years | 0 (0.0%) | 0 (0.0%) |
| 65 to 74 Years | 0 (0.0%) | 0 (0.0%) |
| 75 Years and over | 0 (0.0%) | 2 (18.2%) |
Technology Access in Westby
Computing Device Access in Westby
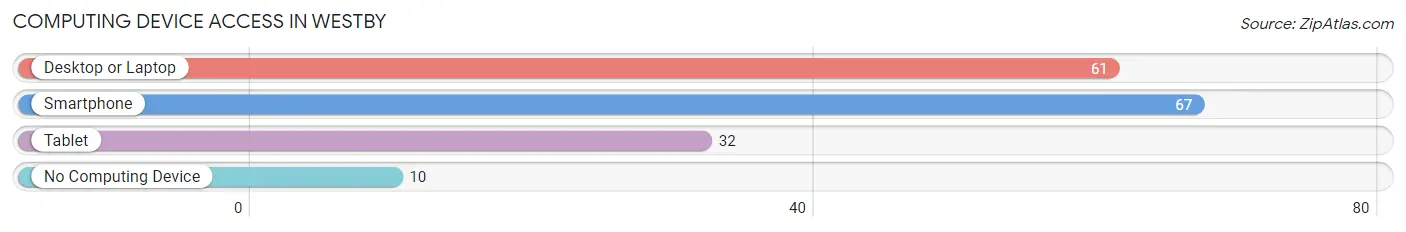
| Device Type | # Households | % Households |
| Desktop or Laptop | 61 | 77.2% |
| Smartphone | 67 | 84.8% |
| Tablet | 32 | 40.5% |
| No Computing Device | 10 | 12.7% |
| Total | 79 | 100.0% |
Internet Access in Westby
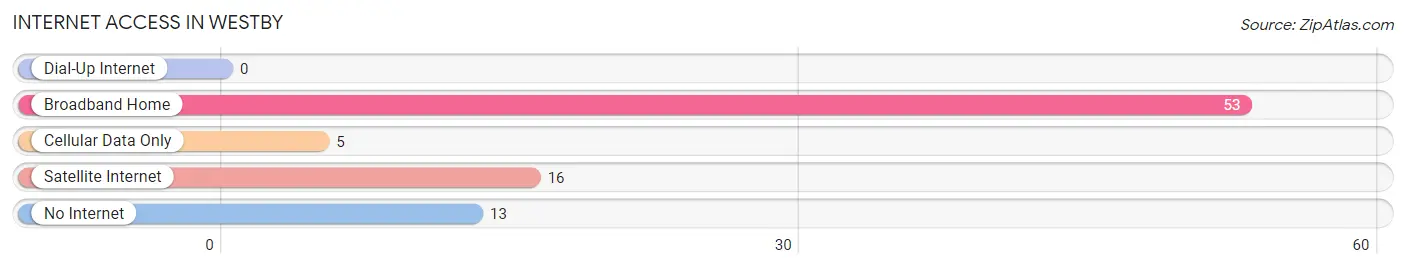
| Internet Type | # Households | % Households |
| Dial-Up Internet | 0 | 0.0% |
| Broadband Home | 53 | 67.1% |
| Cellular Data Only | 5 | 6.3% |
| Satellite Internet | 16 | 20.3% |
| No Internet | 13 | 16.5% |
| Total | 79 | 100.0% |
Westby Summary
Westby, Montana is a small town located in the southeastern corner of the state, near the border with North Dakota. It is situated in the Yellowstone River Valley, and is surrounded by rolling hills and prairies. The town has a population of just over 500 people, and is the county seat of Richland County.
History
Westby was founded in 1882 by Norwegian immigrants who had come to the area to homestead. The town was named after the Norwegian town of Westby, and the settlers brought with them many of the customs and traditions of their homeland. The town quickly grew, and by the early 1900s, it had become a thriving agricultural center. The town was also home to a number of businesses, including a bank, a hotel, a general store, and a blacksmith shop.
In the early 1900s, Westby was also home to a number of churches, including the Norwegian Lutheran Church, the Methodist Episcopal Church, and the Catholic Church. The town also had a school, which was built in 1902.
Geography
Westby is located in the Yellowstone River Valley, and is surrounded by rolling hills and prairies. The town is situated at an elevation of 2,845 feet, and is located about 25 miles south of the city of Billings. The town is located in the Central Time Zone, and is about a two-hour drive from the state capital of Helena.
The climate in Westby is semi-arid, with hot summers and cold winters. The average annual temperature is around 50 degrees Fahrenheit, and the average annual precipitation is around 15 inches.
Economy
The economy of Westby is largely based on agriculture. The town is home to a number of farms, which produce a variety of crops, including wheat, barley, oats, and hay. The town is also home to a number of businesses, including a bank, a hotel, a general store, and a blacksmith shop.
Demographics
As of the 2010 census, the population of Westby was 514 people. The racial makeup of the town was 97.3% White, 0.6% Native American, 0.2% Asian, 0.2% from other races, and 1.7% from two or more races. The median household income was $37,500, and the median family income was $45,000. The per capita income was $18,000.
Conclusion
Westby, Montana is a small town located in the southeastern corner of the state, near the border with North Dakota. It is situated in the Yellowstone River Valley, and is surrounded by rolling hills and prairies. The town has a population of just over 500 people, and is the county seat of Richland County. The economy of Westby is largely based on agriculture, and the town is home to a number of businesses. The racial makeup of the town is predominantly White, and the median household income is around $37,500. Westby is a small town with a rich history and a bright future.
Common Questions
What is Per Capita Income in Westby?
Per Capita income in Westby is $41,453.
What is the Median Family Income in Westby?
Median Family Income in Westby is $47,500.
What is the Median Household income in Westby?
Median Household Income in Westby is $40,625.
What is Inequality or Gini Index in Westby?
Inequality or Gini Index in Westby is 0.43.
What is the Total Population of Westby?
Total Population of Westby is 213.
What is the Total Male Population of Westby?
Total Male Population of Westby is 96.
What is the Total Female Population of Westby?
Total Female Population of Westby is 117.
What is the Ratio of Males per 100 Females in Westby?
There are 82.05 Males per 100 Females in Westby.
What is the Ratio of Females per 100 Males in Westby?
There are 121.88 Females per 100 Males in Westby.
What is the Median Population Age in Westby?
Median Population Age in Westby is 53.8 Years.
What is the Average Family Size in Westby
Average Family Size in Westby is 3.6 People.
What is the Average Household Size in Westby
Average Household Size in Westby is 2.7 People.
How Large is the Labor Force in Westby?
There are 132 People in the Labor Forcein in Westby.
What is the Percentage of People in the Labor Force in Westby?
62.9% of People are in the Labor Force in Westby.