Twin Bridges, MT Map & Demographics
Twin Bridges Map
Twin Bridges Overview
$28,234
PER CAPITA INCOME
$58,750
AVG FAMILY INCOME
$53,500
AVG HOUSEHOLD INCOME
71.3%
WAGE / INCOME GAP [ % ]
28.7¢/ $1
WAGE / INCOME GAP [ $ ]
0.33
INEQUALITY / GINI INDEX
237
TOTAL POPULATION
112
MALE POPULATION
125
FEMALE POPULATION
89.60
MALES / 100 FEMALES
111.61
FEMALES / 100 MALES
61.2
MEDIAN AGE
3.1
AVG FAMILY SIZE
2.0
AVG HOUSEHOLD SIZE
67
LABOR FORCE [ PEOPLE ]
33.7%
PERCENT IN LABOR FORCE
Twin Bridges Zip Codes
Twin Bridges Area Codes
Income in Twin Bridges
Income Overview in Twin Bridges
Per Capita Income in Twin Bridges is $28,234, while median incomes of families and households are $58,750 and $53,500 respectively.
| Characteristic | Number | Measure |
| Per Capita Income | 237 | $28,234 |
| Median Family Income | 55 | $58,750 |
| Mean Family Income | 55 | $59,904 |
| Median Household Income | 116 | $53,500 |
| Mean Household Income | 116 | $53,213 |
| Income Deficit | 55 | $0 |
| Wage / Income Gap (%) | 237 | 71.26% |
| Wage / Income Gap ($) | 237 | 28.74¢ per $1 |
| Gini / Inequality Index | 237 | 0.33 |
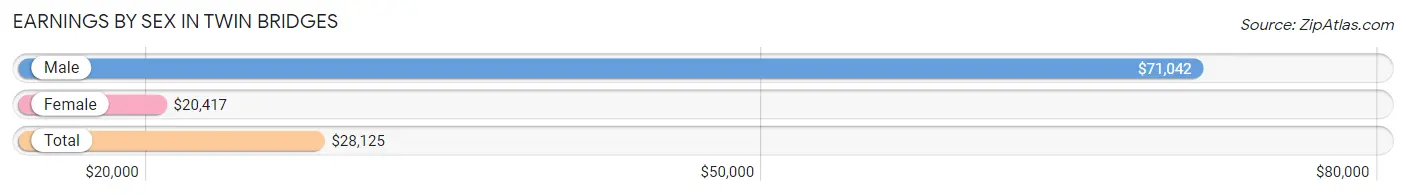
Earnings by Sex in Twin Bridges
Average Earnings in Twin Bridges are $28,125, $71,042 for men and $20,417 for women, a difference of 71.3%.
| Sex | Number | Average Earnings |
| Male | 32 (40.5%) | $71,042 |
| Female | 47 (59.5%) | $20,417 |
| Total | 79 (100.0%) | $28,125 |
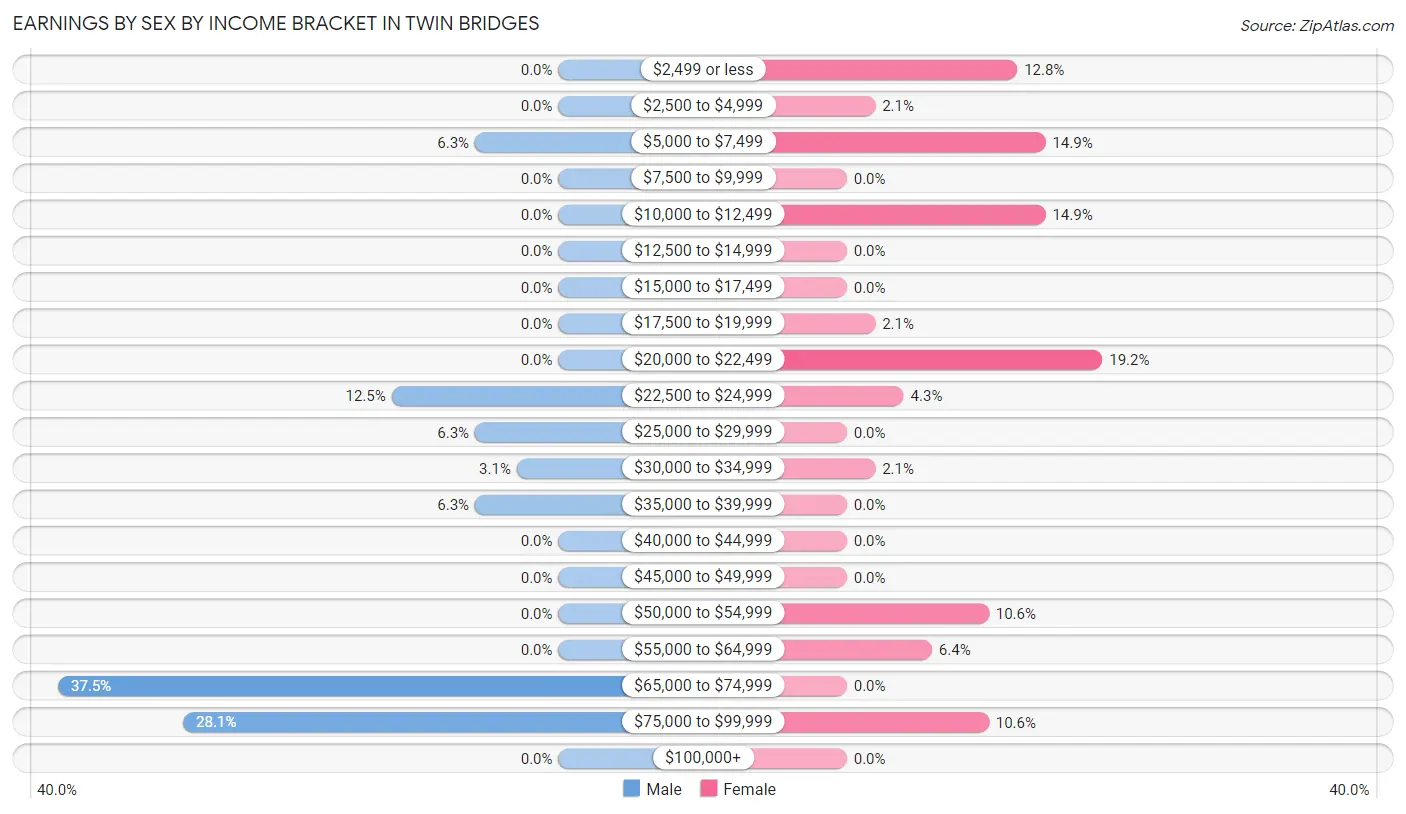
Earnings by Sex by Income Bracket in Twin Bridges
The most common earnings brackets in Twin Bridges are $65,000 to $74,999 for men (12 | 37.5%) and $20,000 to $22,499 for women (9 | 19.2%).
| Income | Male | Female |
| $2,499 or less | 0 (0.0%) | 6 (12.8%) |
| $2,500 to $4,999 | 0 (0.0%) | 1 (2.1%) |
| $5,000 to $7,499 | 2 (6.2%) | 7 (14.9%) |
| $7,500 to $9,999 | 0 (0.0%) | 0 (0.0%) |
| $10,000 to $12,499 | 0 (0.0%) | 7 (14.9%) |
| $12,500 to $14,999 | 0 (0.0%) | 0 (0.0%) |
| $15,000 to $17,499 | 0 (0.0%) | 0 (0.0%) |
| $17,500 to $19,999 | 0 (0.0%) | 1 (2.1%) |
| $20,000 to $22,499 | 0 (0.0%) | 9 (19.2%) |
| $22,500 to $24,999 | 4 (12.5%) | 2 (4.3%) |
| $25,000 to $29,999 | 2 (6.2%) | 0 (0.0%) |
| $30,000 to $34,999 | 1 (3.1%) | 1 (2.1%) |
| $35,000 to $39,999 | 2 (6.2%) | 0 (0.0%) |
| $40,000 to $44,999 | 0 (0.0%) | 0 (0.0%) |
| $45,000 to $49,999 | 0 (0.0%) | 0 (0.0%) |
| $50,000 to $54,999 | 0 (0.0%) | 5 (10.6%) |
| $55,000 to $64,999 | 0 (0.0%) | 3 (6.4%) |
| $65,000 to $74,999 | 12 (37.5%) | 0 (0.0%) |
| $75,000 to $99,999 | 9 (28.1%) | 5 (10.6%) |
| $100,000+ | 0 (0.0%) | 0 (0.0%) |
| Total | 32 (100.0%) | 47 (100.0%) |
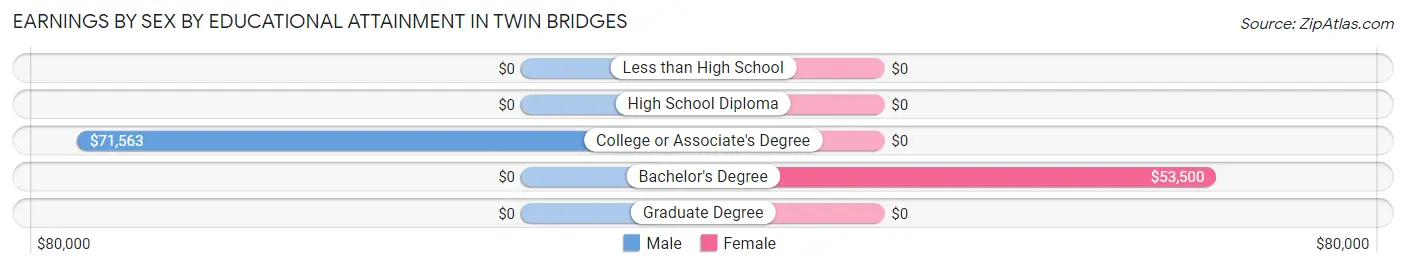
Earnings by Sex by Educational Attainment in Twin Bridges
Average earnings in Twin Bridges are $71,042 for men and $20,278 for women, a difference of 71.5%. Men with an educational attainment of college or associate's degree enjoy the highest average annual earnings of $71,563, while those with college or associate's degree education earn the least with $71,563. Women with an educational attainment of bachelor's degree earn the most with the average annual earnings of $53,500, while those with bachelor's degree education have the smallest earnings of $53,500.
| Educational Attainment | Male Income | Female Income |
| Less than High School | - | - |
| High School Diploma | - | - |
| College or Associate's Degree | $71,563 | $0 |
| Bachelor's Degree | - | - |
| Graduate Degree | - | - |
| Total | $71,042 | $20,278 |
Family Income in Twin Bridges
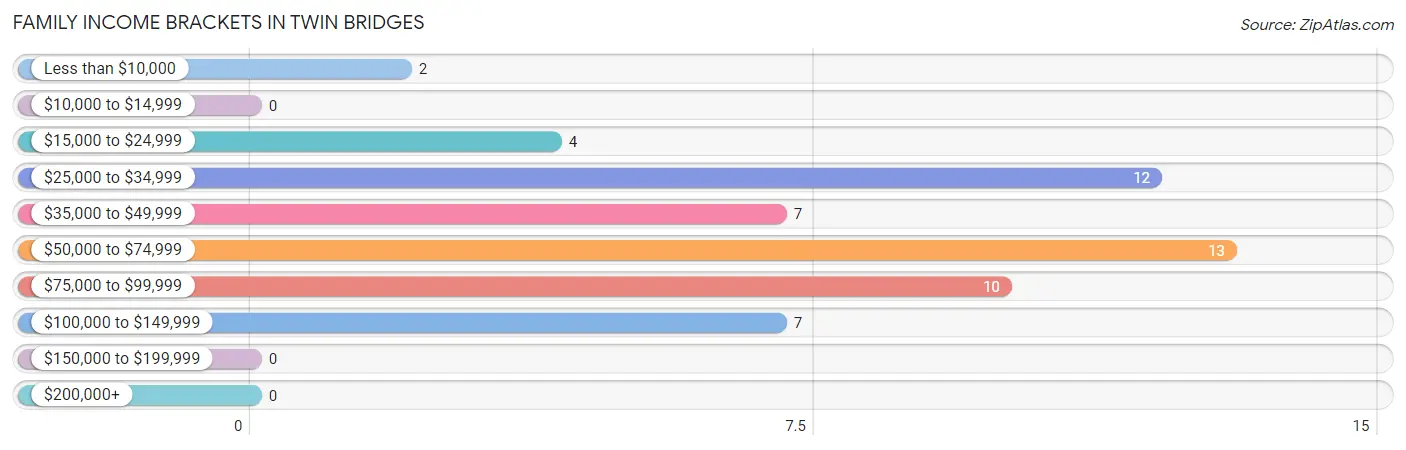
Family Income Brackets in Twin Bridges
According to the Twin Bridges family income data, there are 13 families falling into the $50,000 to $74,999 income range, which is the most common income bracket and makes up 23.6% of all families.
| Income Bracket | # Families | % Families |
| Less than $10,000 | 2 | 3.6% |
| $10,000 to $14,999 | 0 | 0.0% |
| $15,000 to $24,999 | 4 | 7.3% |
| $25,000 to $34,999 | 12 | 21.8% |
| $35,000 to $49,999 | 7 | 12.7% |
| $50,000 to $74,999 | 13 | 23.6% |
| $75,000 to $99,999 | 10 | 18.2% |
| $100,000 to $149,999 | 7 | 12.7% |
| $150,000 to $199,999 | 0 | 0.0% |
| $200,000+ | 0 | 0.0% |
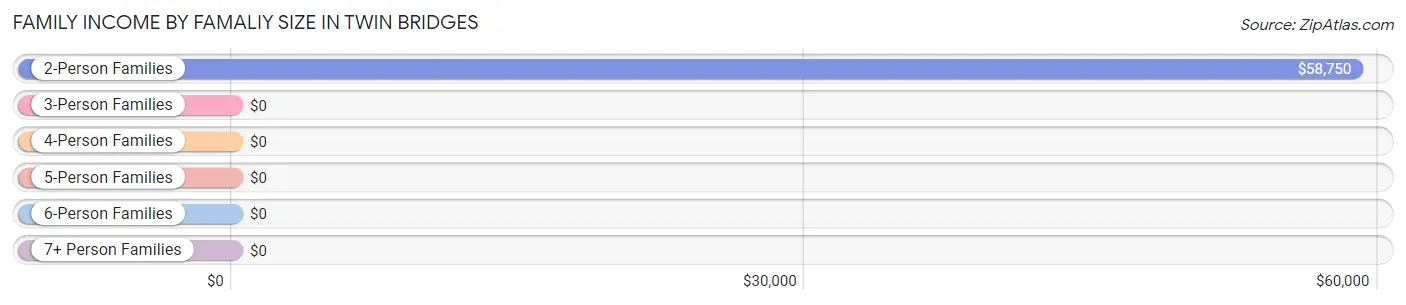
Family Income by Famaliy Size in Twin Bridges
2-person families (37 | 67.3%) account for the highest median family income in Twin Bridges with $58,750 per family, while 2-person families (37 | 67.3%) have the highest median income of $29,375 per family member.
| Income Bracket | # Families | Median Income |
| 2-Person Families | 37 (67.3%) | $58,750 |
| 3-Person Families | 5 (9.1%) | $0 |
| 4-Person Families | 4 (7.3%) | $0 |
| 5-Person Families | 9 (16.4%) | $0 |
| 6-Person Families | 0 (0.0%) | $0 |
| 7+ Person Families | 0 (0.0%) | $0 |
| Total | 55 (100.0%) | $58,750 |
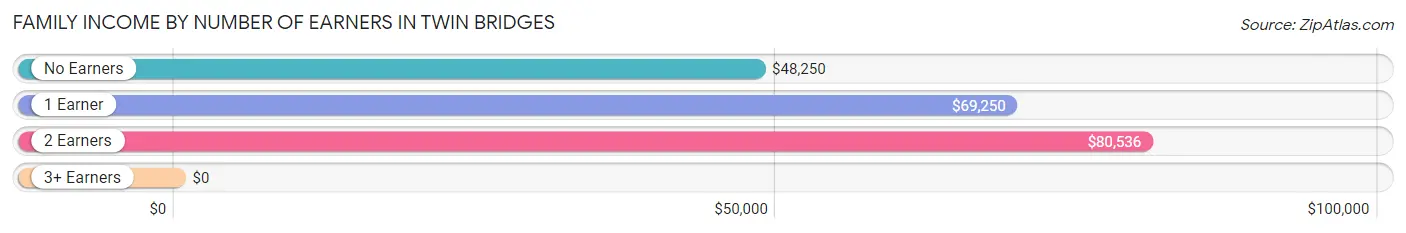
Family Income by Number of Earners in Twin Bridges
| Number of Earners | # Families | Median Income |
| No Earners | 19 (34.5%) | $48,250 |
| 1 Earner | 19 (34.5%) | $69,250 |
| 2 Earners | 15 (27.3%) | $80,536 |
| 3+ Earners | 2 (3.6%) | $0 |
| Total | 55 (100.0%) | $58,750 |
Household Income in Twin Bridges
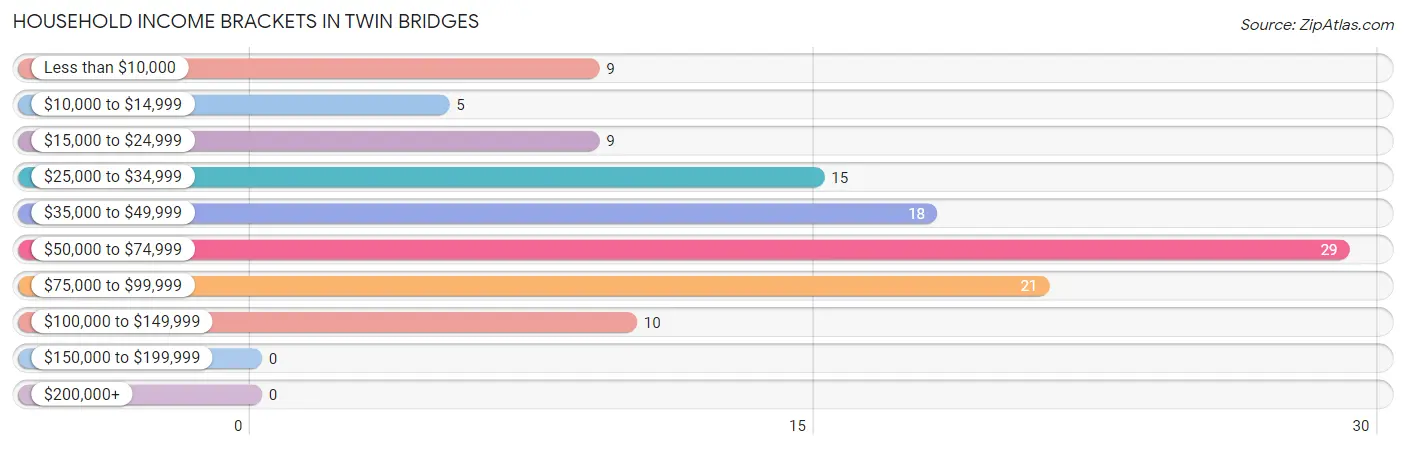
Household Income Brackets in Twin Bridges
With 29 households falling in the category, the $50,000 to $74,999 income range is the most frequent in Twin Bridges, accounting for 25.0% of all households.
| Income Bracket | # Households | % Households |
| Less than $10,000 | 9 | 7.8% |
| $10,000 to $14,999 | 5 | 4.3% |
| $15,000 to $24,999 | 9 | 7.8% |
| $25,000 to $34,999 | 15 | 12.9% |
| $35,000 to $49,999 | 18 | 15.5% |
| $50,000 to $74,999 | 29 | 25.0% |
| $75,000 to $99,999 | 21 | 18.1% |
| $100,000 to $149,999 | 10 | 8.6% |
| $150,000 to $199,999 | 0 | 0.0% |
| $200,000+ | 0 | 0.0% |
Household Income by Householder Age in Twin Bridges
The median household income in Twin Bridges is $53,500, with the highest median household income of $69,792 found in the 45 to 64 years age bracket for the primary householder. A total of 39 households (33.6%) fall into this category. Meanwhile, the 15 to 24 years age bracket for the primary householder has the lowest median household income of $0, with 2 households (1.7%) in this group.
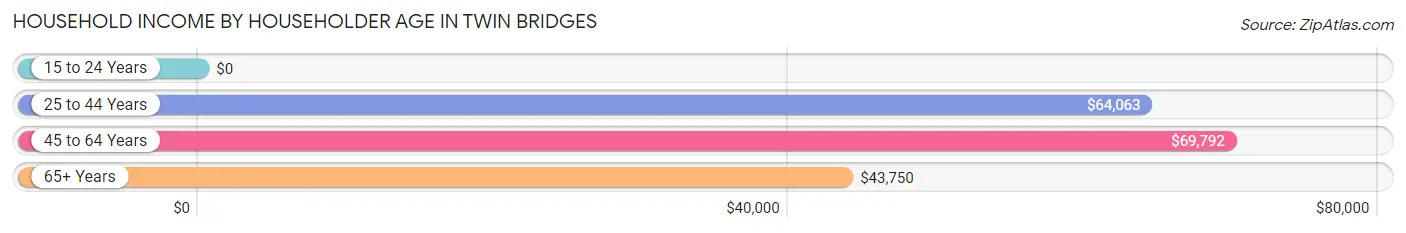
| Income Bracket | # Households | Median Income |
| 15 to 24 Years | 2 (1.7%) | $0 |
| 25 to 44 Years | 17 (14.7%) | $64,063 |
| 45 to 64 Years | 39 (33.6%) | $69,792 |
| 65+ Years | 58 (50.0%) | $43,750 |
| Total | 116 (100.0%) | $53,500 |
Poverty in Twin Bridges
Income Below Poverty by Sex and Age in Twin Bridges
With 11.6% poverty level for males and 11.2% for females among the residents of Twin Bridges, 25 to 34 year old males and under 5 year old females are the most vulnerable to poverty, with 2 males (66.7%) and 5 females (100.0%) in their respective age groups living below the poverty level.
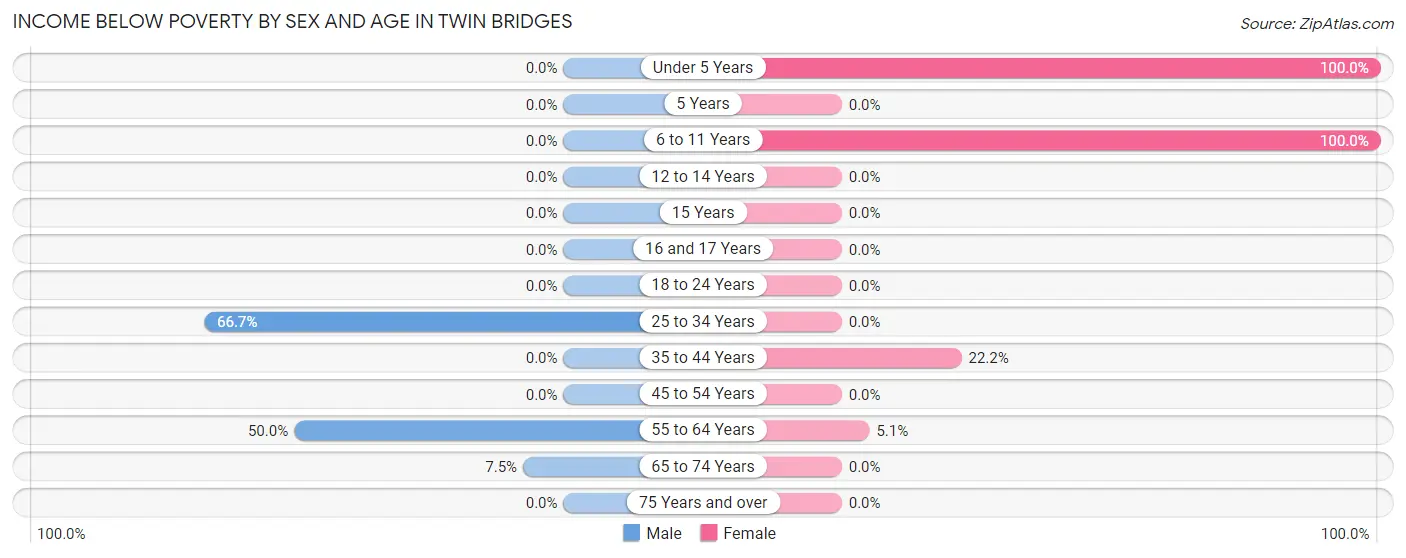
| Age Bracket | Male | Female |
| Under 5 Years | 0 (0.0%) | 5 (100.0%) |
| 5 Years | 0 (0.0%) | 0 (0.0%) |
| 6 to 11 Years | 0 (0.0%) | 3 (100.0%) |
| 12 to 14 Years | 0 (0.0%) | 0 (0.0%) |
| 15 Years | 0 (0.0%) | 0 (0.0%) |
| 16 and 17 Years | 0 (0.0%) | 0 (0.0%) |
| 18 to 24 Years | 0 (0.0%) | 0 (0.0%) |
| 25 to 34 Years | 2 (66.7%) | 0 (0.0%) |
| 35 to 44 Years | 0 (0.0%) | 4 (22.2%) |
| 45 to 54 Years | 0 (0.0%) | 0 (0.0%) |
| 55 to 64 Years | 8 (50.0%) | 2 (5.1%) |
| 65 to 74 Years | 3 (7.5%) | 0 (0.0%) |
| 75 Years and over | 0 (0.0%) | 0 (0.0%) |
| Total | 13 (11.6%) | 14 (11.2%) |
Income Above Poverty by Sex and Age in Twin Bridges
According to the poverty statistics in Twin Bridges, males aged 6 to 11 years and females aged 12 to 14 years are the age groups that are most secure financially, with 100.0% of males and 100.0% of females in these age groups living above the poverty line.
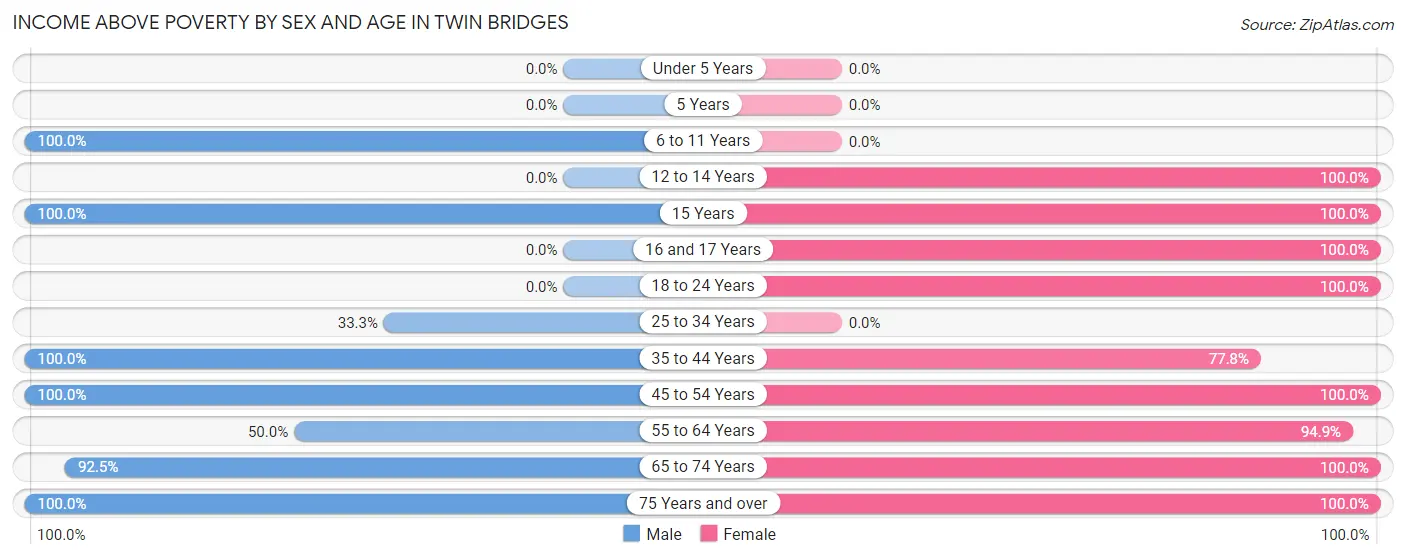
| Age Bracket | Male | Female |
| Under 5 Years | 0 (0.0%) | 0 (0.0%) |
| 5 Years | 0 (0.0%) | 0 (0.0%) |
| 6 to 11 Years | 16 (100.0%) | 0 (0.0%) |
| 12 to 14 Years | 0 (0.0%) | 1 (100.0%) |
| 15 Years | 9 (100.0%) | 4 (100.0%) |
| 16 and 17 Years | 0 (0.0%) | 1 (100.0%) |
| 18 to 24 Years | 0 (0.0%) | 13 (100.0%) |
| 25 to 34 Years | 1 (33.3%) | 0 (0.0%) |
| 35 to 44 Years | 2 (100.0%) | 14 (77.8%) |
| 45 to 54 Years | 16 (100.0%) | 5 (100.0%) |
| 55 to 64 Years | 8 (50.0%) | 37 (94.9%) |
| 65 to 74 Years | 37 (92.5%) | 26 (100.0%) |
| 75 Years and over | 10 (100.0%) | 10 (100.0%) |
| Total | 99 (88.4%) | 111 (88.8%) |
Income Below Poverty Among Married-Couple Families in Twin Bridges
The poverty statistics for married-couple families in Twin Bridges show that 13.3% or 6 of the total 45 families live below the poverty line. Families with 1 or 2 children have the highest poverty rate of 100.0%, comprising of 4 families. On the other hand, families with 3 or 4 children have the lowest poverty rate of 0.0%, which includes 0 families.
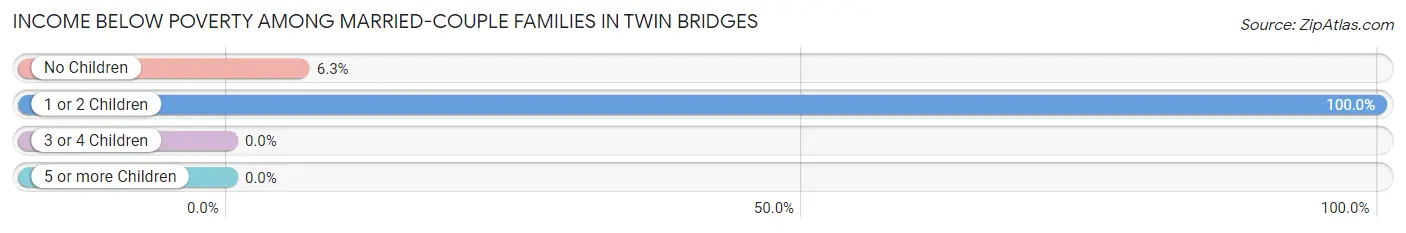
| Children | Above Poverty | Below Poverty |
| No Children | 30 (93.8%) | 2 (6.2%) |
| 1 or 2 Children | 0 (0.0%) | 4 (100.0%) |
| 3 or 4 Children | 9 (100.0%) | 0 (0.0%) |
| 5 or more Children | 0 (0.0%) | 0 (0.0%) |
| Total | 39 (86.7%) | 6 (13.3%) |
Income Below Poverty Among Single-Parent Households in Twin Bridges
| Children | Single Father | Single Mother |
| No Children | 0 (0.0%) | 0 (0.0%) |
| 1 or 2 Children | 0 (0.0%) | 0 (0.0%) |
| 3 or 4 Children | 0 (0.0%) | 0 (0.0%) |
| 5 or more Children | 0 (0.0%) | 0 (0.0%) |
| Total | 0 (0.0%) | 0 (0.0%) |
Income Below Poverty Among Married-Couple vs Single-Parent Households in Twin Bridges
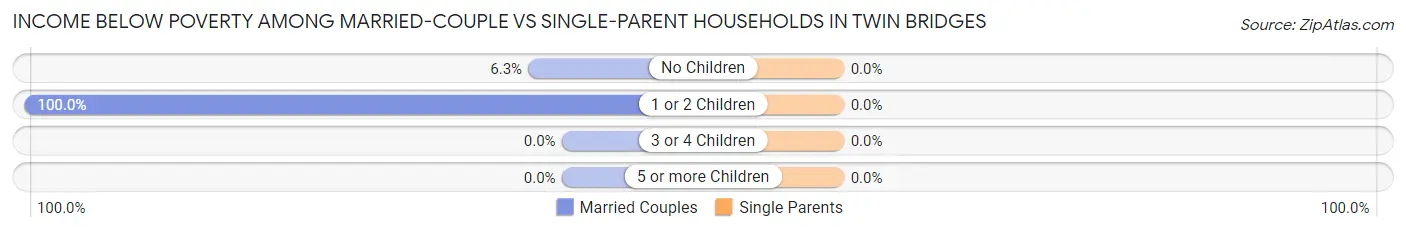
| Children | Married-Couple Families | Single-Parent Households |
| No Children | 2 (6.2%) | 0 (0.0%) |
| 1 or 2 Children | 4 (100.0%) | 0 (0.0%) |
| 3 or 4 Children | 0 (0.0%) | 0 (0.0%) |
| 5 or more Children | 0 (0.0%) | 0 (0.0%) |
| Total | 6 (13.3%) | 0 (0.0%) |
Race in Twin Bridges
The most populous races in Twin Bridges are White / Caucasian (224 | 94.5%), Two or more Races (5 | 2.1%), and Hispanic or Latino (4 | 1.7%).
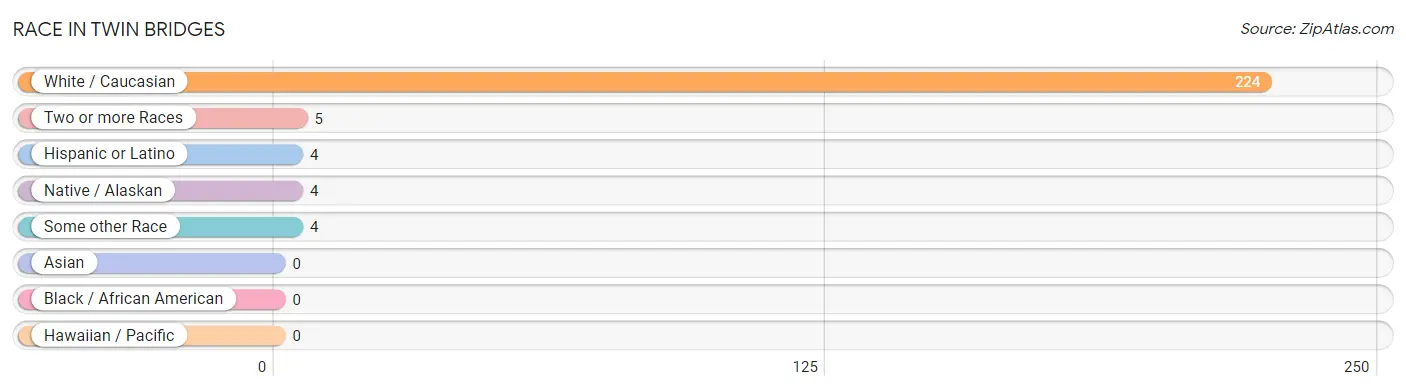
| Race | # Population | % Population |
| Asian | 0 | 0.0% |
| Black / African American | 0 | 0.0% |
| Hawaiian / Pacific | 0 | 0.0% |
| Hispanic or Latino | 4 | 1.7% |
| Native / Alaskan | 4 | 1.7% |
| White / Caucasian | 224 | 94.5% |
| Two or more Races | 5 | 2.1% |
| Some other Race | 4 | 1.7% |
| Total | 237 | 100.0% |
Ancestry in Twin Bridges
The most populous ancestries reported in Twin Bridges are English (87 | 36.7%), Irish (73 | 30.8%), German (66 | 27.9%), Scotch-Irish (9 | 3.8%), and Scottish (9 | 3.8%), together accounting for 103.0% of all Twin Bridges residents.
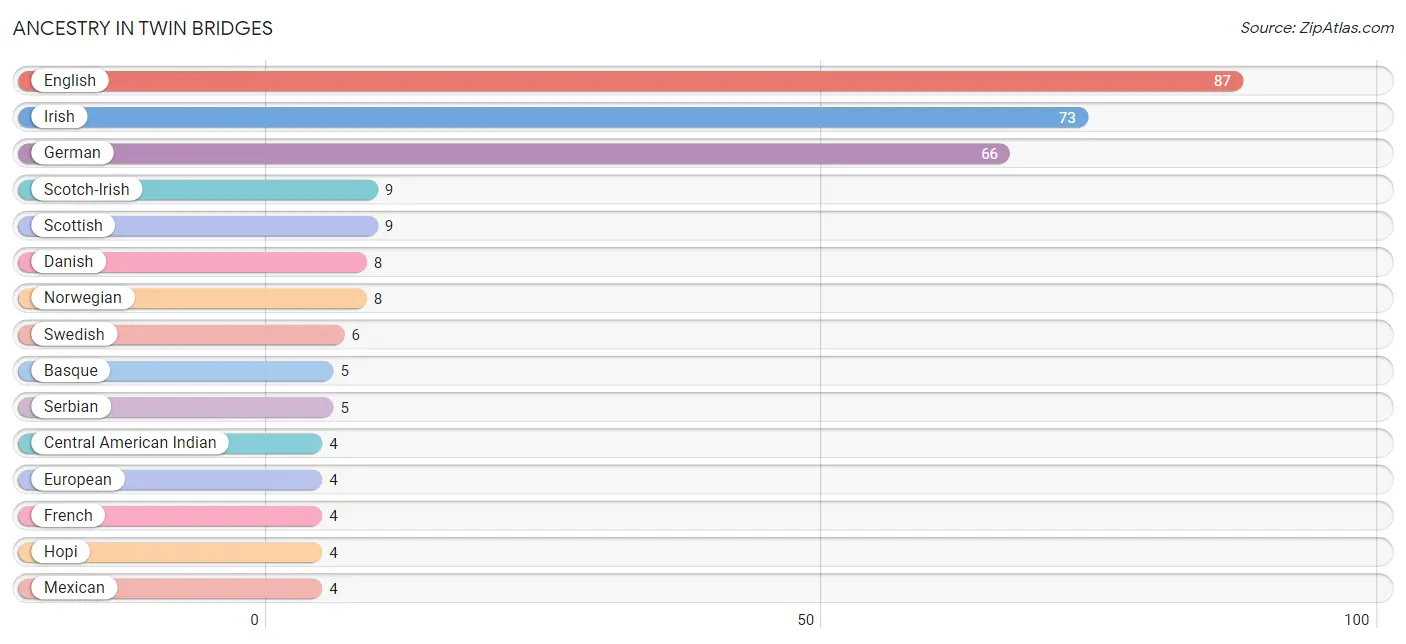
| Ancestry | # Population | % Population |
| Basque | 5 | 2.1% |
| Central American Indian | 4 | 1.7% |
| Czech | 3 | 1.3% |
| Danish | 8 | 3.4% |
| Eastern European | 2 | 0.8% |
| English | 87 | 36.7% |
| European | 4 | 1.7% |
| French | 4 | 1.7% |
| German | 66 | 27.9% |
| Hopi | 4 | 1.7% |
| Irish | 73 | 30.8% |
| Mexican | 4 | 1.7% |
| Norwegian | 8 | 3.4% |
| Polish | 1 | 0.4% |
| Scandinavian | 2 | 0.8% |
| Scotch-Irish | 9 | 3.8% |
| Scottish | 9 | 3.8% |
| Serbian | 5 | 2.1% |
| Swedish | 6 | 2.5% | View All 19 Rows |
Immigrants in Twin Bridges
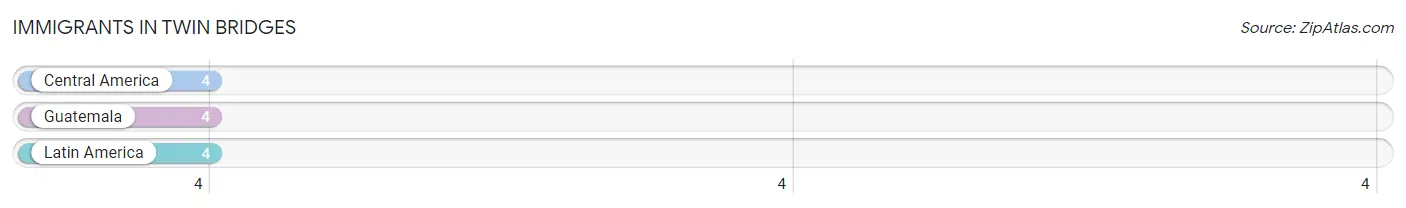
The most numerous immigrant groups reported in Twin Bridges came from Central America (4 | 1.7%), Guatemala (4 | 1.7%), and Latin America (4 | 1.7%), together accounting for 5.1% of all Twin Bridges residents.
| Immigration Origin | # Population | % Population |
| Central America | 4 | 1.7% |
| Guatemala | 4 | 1.7% |
| Latin America | 4 | 1.7% | View All 3 Rows |
Sex and Age in Twin Bridges
Sex and Age in Twin Bridges
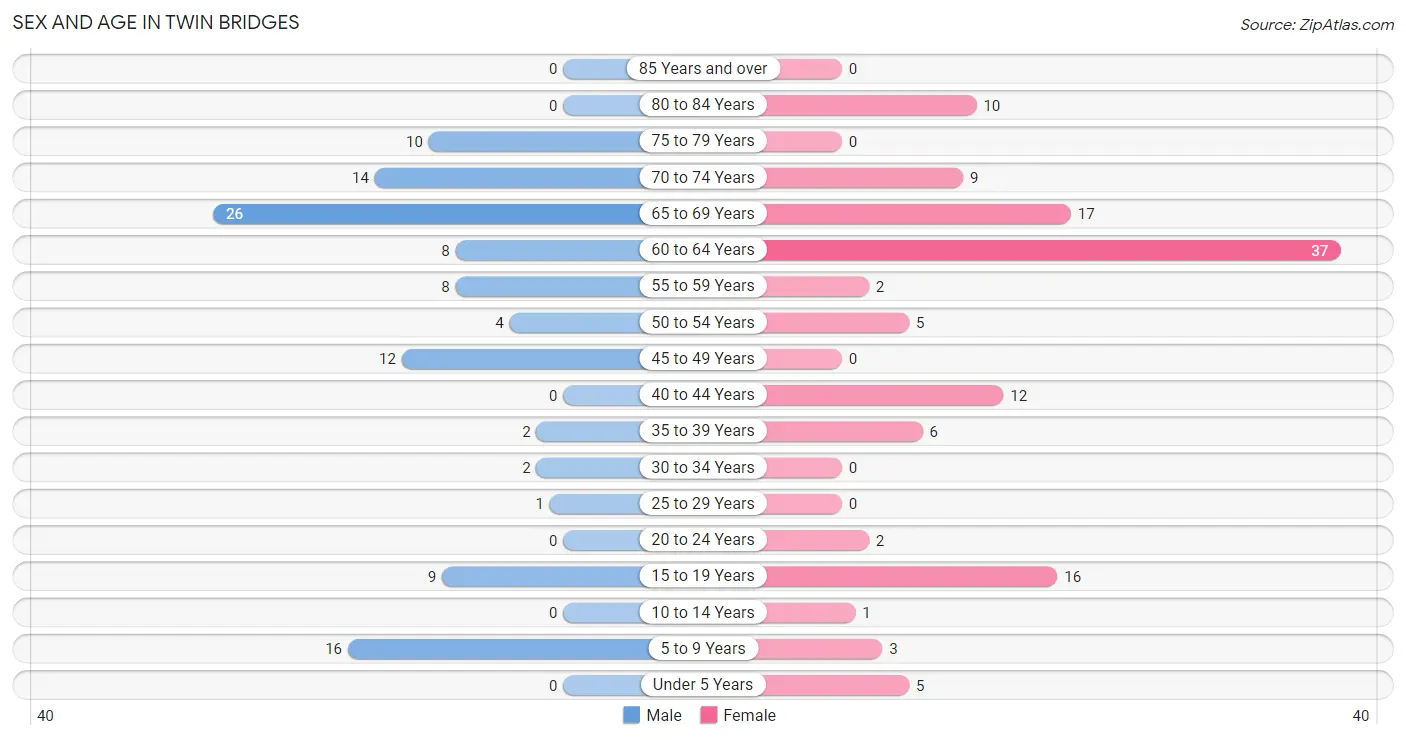
The most populous age groups in Twin Bridges are 65 to 69 Years (26 | 23.2%) for men and 60 to 64 Years (37 | 29.6%) for women.
| Age Bracket | Male | Female |
| Under 5 Years | 0 (0.0%) | 5 (4.0%) |
| 5 to 9 Years | 16 (14.3%) | 3 (2.4%) |
| 10 to 14 Years | 0 (0.0%) | 1 (0.8%) |
| 15 to 19 Years | 9 (8.0%) | 16 (12.8%) |
| 20 to 24 Years | 0 (0.0%) | 2 (1.6%) |
| 25 to 29 Years | 1 (0.9%) | 0 (0.0%) |
| 30 to 34 Years | 2 (1.8%) | 0 (0.0%) |
| 35 to 39 Years | 2 (1.8%) | 6 (4.8%) |
| 40 to 44 Years | 0 (0.0%) | 12 (9.6%) |
| 45 to 49 Years | 12 (10.7%) | 0 (0.0%) |
| 50 to 54 Years | 4 (3.6%) | 5 (4.0%) |
| 55 to 59 Years | 8 (7.1%) | 2 (1.6%) |
| 60 to 64 Years | 8 (7.1%) | 37 (29.6%) |
| 65 to 69 Years | 26 (23.2%) | 17 (13.6%) |
| 70 to 74 Years | 14 (12.5%) | 9 (7.2%) |
| 75 to 79 Years | 10 (8.9%) | 0 (0.0%) |
| 80 to 84 Years | 0 (0.0%) | 10 (8.0%) |
| 85 Years and over | 0 (0.0%) | 0 (0.0%) |
| Total | 112 (100.0%) | 125 (100.0%) |
Families and Households in Twin Bridges
Median Family Size in Twin Bridges
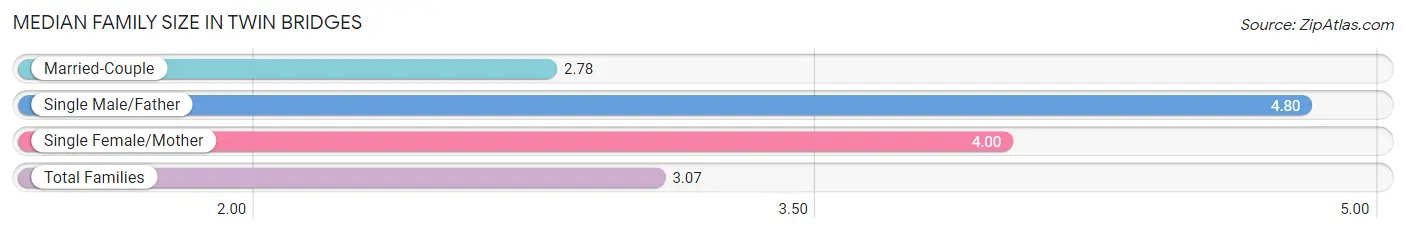
The median family size in Twin Bridges is 3.07 persons per family, with single male/father families (5 | 9.1%) accounting for the largest median family size of 4.8 persons per family. On the other hand, married-couple families (45 | 81.8%) represent the smallest median family size with 2.78 persons per family.
| Family Type | # Families | Family Size |
| Married-Couple | 45 (81.8%) | 2.78 |
| Single Male/Father | 5 (9.1%) | 4.80 |
| Single Female/Mother | 5 (9.1%) | 4.00 |
| Total Families | 55 (100.0%) | 3.07 |
Median Household Size in Twin Bridges
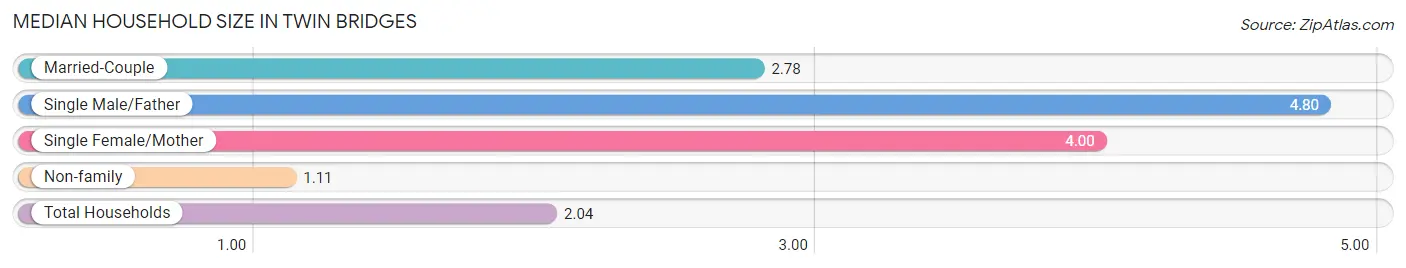
The median household size in Twin Bridges is 2.04 persons per household, with single male/father households (5 | 4.3%) accounting for the largest median household size of 4.8 persons per household. non-family households (61 | 52.6%) represent the smallest median household size with 1.11 persons per household.
| Household Type | # Households | Household Size |
| Married-Couple | 45 (38.8%) | 2.78 |
| Single Male/Father | 5 (4.3%) | 4.80 |
| Single Female/Mother | 5 (4.3%) | 4.00 |
| Non-family | 61 (52.6%) | 1.11 |
| Total Households | 116 (100.0%) | 2.04 |
Household Size by Marriage Status in Twin Bridges
Out of a total of 116 households in Twin Bridges, 55 (47.4%) are family households, while 61 (52.6%) are nonfamily households. The most numerous type of family households are 2-person households, comprising 37, and the most common type of nonfamily households are 1-person households, comprising 53.
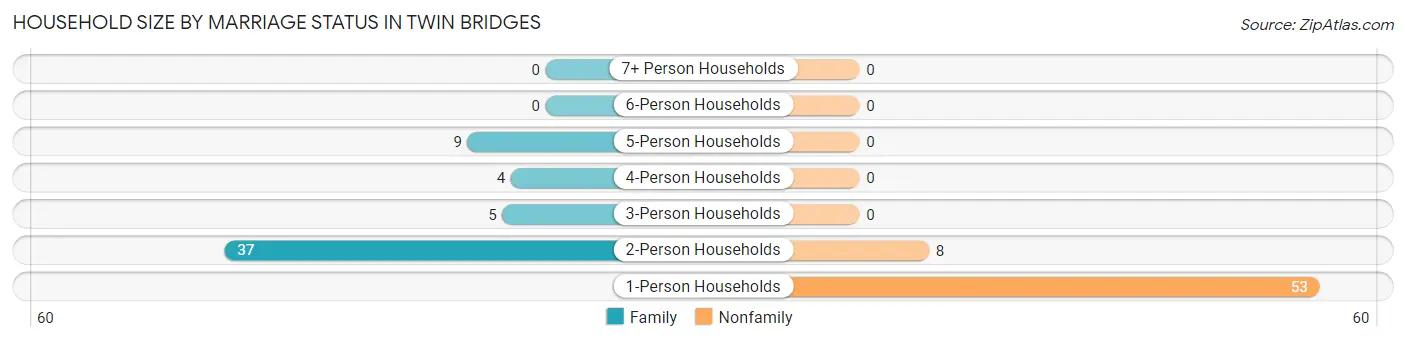
| Household Size | Family Households | Nonfamily Households |
| 1-Person Households | - | 53 (45.7%) |
| 2-Person Households | 37 (31.9%) | 8 (6.9%) |
| 3-Person Households | 5 (4.3%) | 0 (0.0%) |
| 4-Person Households | 4 (3.5%) | 0 (0.0%) |
| 5-Person Households | 9 (7.8%) | 0 (0.0%) |
| 6-Person Households | 0 (0.0%) | 0 (0.0%) |
| 7+ Person Households | 0 (0.0%) | 0 (0.0%) |
| Total | 55 (47.4%) | 61 (52.6%) |
Female Fertility in Twin Bridges
Fertility by Age in Twin Bridges
| Age Bracket | Women with Births | Births / 1,000 Women |
| 15 to 19 years | 0 (0.0%) | 0.0 |
| 20 to 34 years | 0 (0.0%) | 0.0 |
| 35 to 50 years | 0 (0.0%) | 0.0 |
| Total | 0 (0.0%) | 0.0 |
Fertility by Age by Marriage Status in Twin Bridges
| Age Bracket | Married | Unmarried |
| 15 to 19 years | 0 (0.0%) | 0 (0.0%) |
| 20 to 34 years | 0 (0.0%) | 0 (0.0%) |
| 35 to 50 years | 0 (0.0%) | 0 (0.0%) |
| Total | 0 (0.0%) | 0 (0.0%) |
Fertility by Education in Twin Bridges
| Educational Attainment | Women with Births | Births / 1,000 Women |
| Less than High School | 0 (0.0%) | 0.0 |
| High School Diploma | 0 (0.0%) | 0.0 |
| College or Associate's Degree | 0 (0.0%) | 0.0 |
| Bachelor's Degree | 0 (0.0%) | 0.0 |
| Graduate Degree | 0 (0.0%) | 0.0 |
| Total | 0 (0.0%) | 0.0 |
Fertility by Education by Marriage Status in Twin Bridges
| Educational Attainment | Married | Unmarried |
| Less than High School | 0 (0.0%) | 0 (0.0%) |
| High School Diploma | 0 (0.0%) | 0 (0.0%) |
| College or Associate's Degree | 0 (0.0%) | 0 (0.0%) |
| Bachelor's Degree | 0 (0.0%) | 0 (0.0%) |
| Graduate Degree | 0 (0.0%) | 0 (0.0%) |
| Total | 0 (0.0%) | 0 (0.0%) |
Employment Characteristics in Twin Bridges
Employment by Class of Employer in Twin Bridges
Among the 67 employed individuals in Twin Bridges, private company employees (45 | 67.2%), local government employees (8 | 11.9%), and state government employees (8 | 11.9%) make up the most common classes of employment.
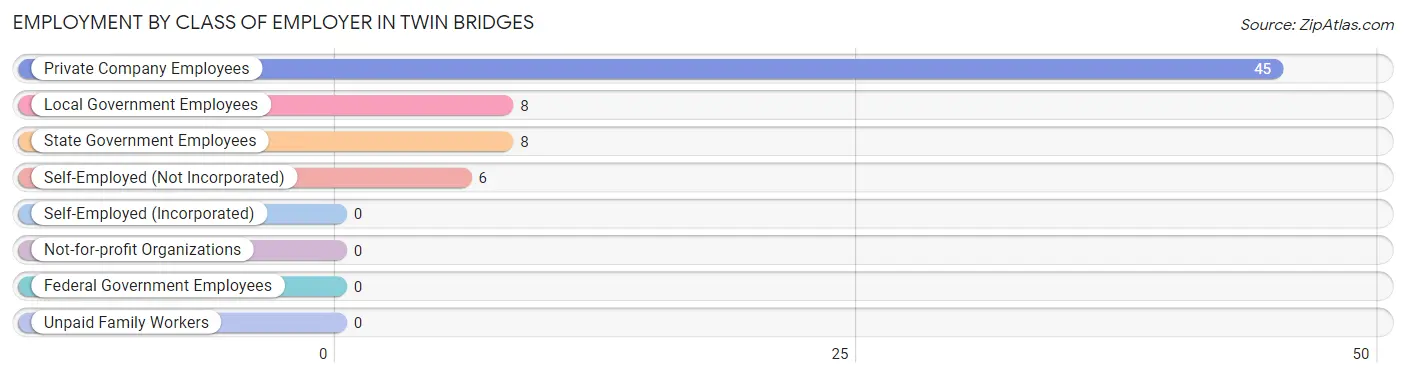
| Employer Class | # Employees | % Employees |
| Private Company Employees | 45 | 67.2% |
| Self-Employed (Incorporated) | 0 | 0.0% |
| Self-Employed (Not Incorporated) | 6 | 9.0% |
| Not-for-profit Organizations | 0 | 0.0% |
| Local Government Employees | 8 | 11.9% |
| State Government Employees | 8 | 11.9% |
| Federal Government Employees | 0 | 0.0% |
| Unpaid Family Workers | 0 | 0.0% |
| Total | 67 | 100.0% |
Employment Status by Age in Twin Bridges
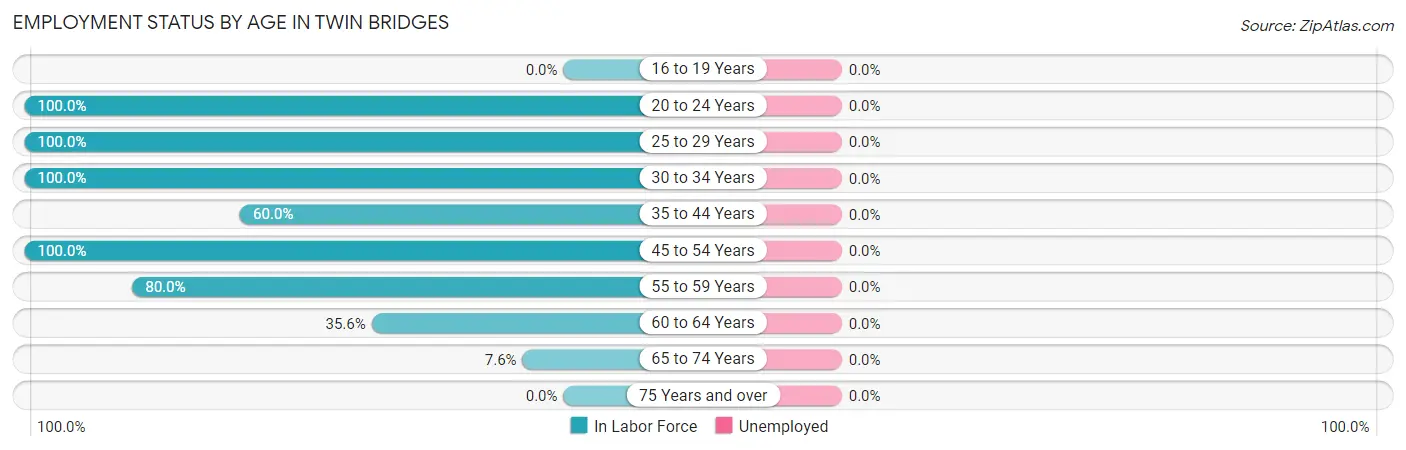
| Age Bracket | In Labor Force | Unemployed |
| 16 to 19 Years | 0 (0.0%) | 0 (0.0%) |
| 20 to 24 Years | 2 (100.0%) | 0 (0.0%) |
| 25 to 29 Years | 1 (100.0%) | 0 (0.0%) |
| 30 to 34 Years | 2 (100.0%) | 0 (0.0%) |
| 35 to 44 Years | 12 (60.0%) | 0 (0.0%) |
| 45 to 54 Years | 21 (100.0%) | 0 (0.0%) |
| 55 to 59 Years | 8 (80.0%) | 0 (0.0%) |
| 60 to 64 Years | 16 (35.6%) | 0 (0.0%) |
| 65 to 74 Years | 5 (7.6%) | 0 (0.0%) |
| 75 Years and over | 0 (0.0%) | 0 (0.0%) |
| Total | 67 (33.7%) | 0 (0.0%) |
Employment Status by Educational Attainment in Twin Bridges
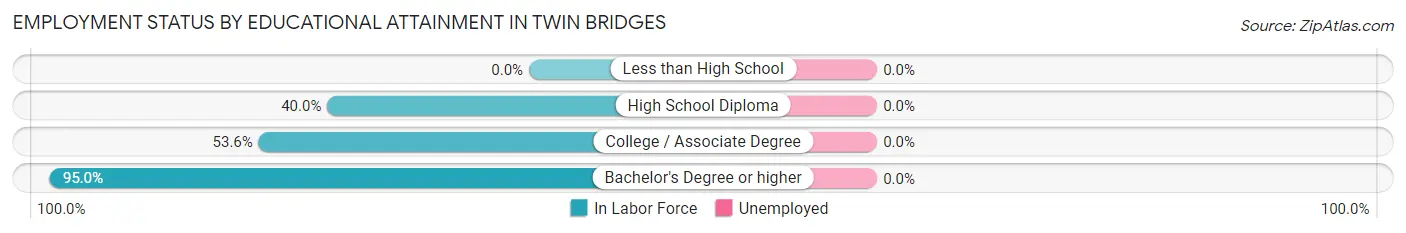
| Educational Attainment | In Labor Force | Unemployed |
| Less than High School | 0 (0.0%) | 0 (0.0%) |
| High School Diploma | 4 (40.0%) | 0 (0.0%) |
| College / Associate Degree | 37 (53.6%) | 0 (0.0%) |
| Bachelor's Degree or higher | 19 (95.0%) | 0 (0.0%) |
| Total | 60 (60.6%) | 0 (0.0%) |
Employment Occupations by Sex in Twin Bridges
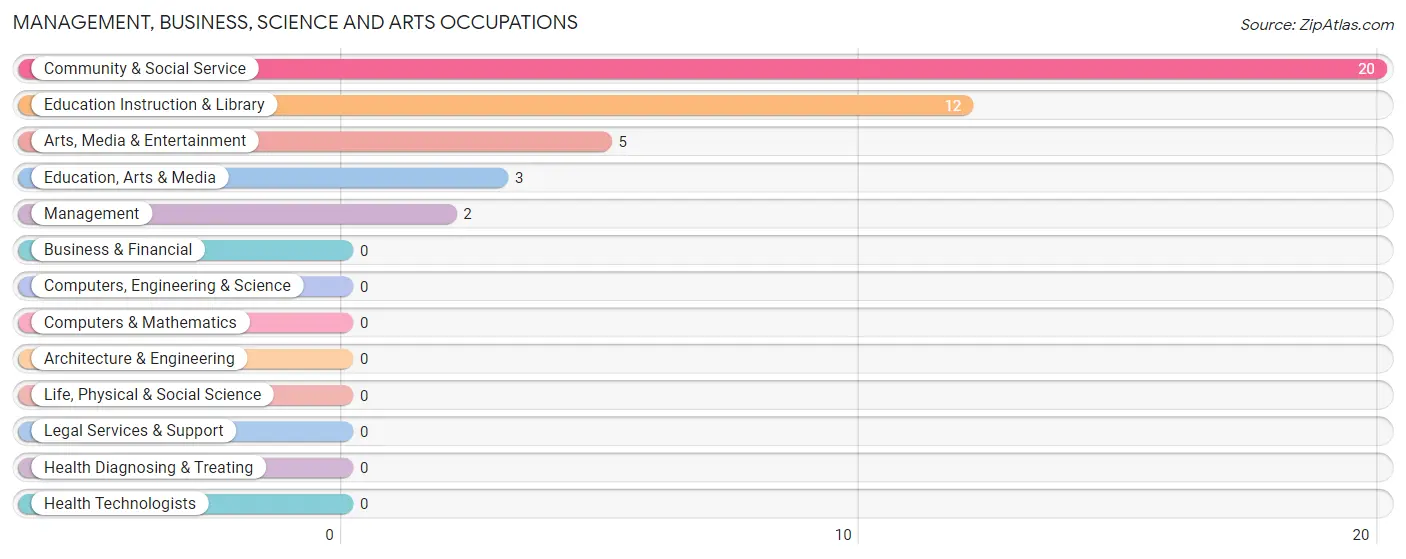
Management, Business, Science and Arts Occupations
The most common Management, Business, Science and Arts occupations in Twin Bridges are Community & Social Service (20 | 29.8%), Education Instruction & Library (12 | 17.9%), Arts, Media & Entertainment (5 | 7.5%), Education, Arts & Media (3 | 4.5%), and Management (2 | 3.0%).
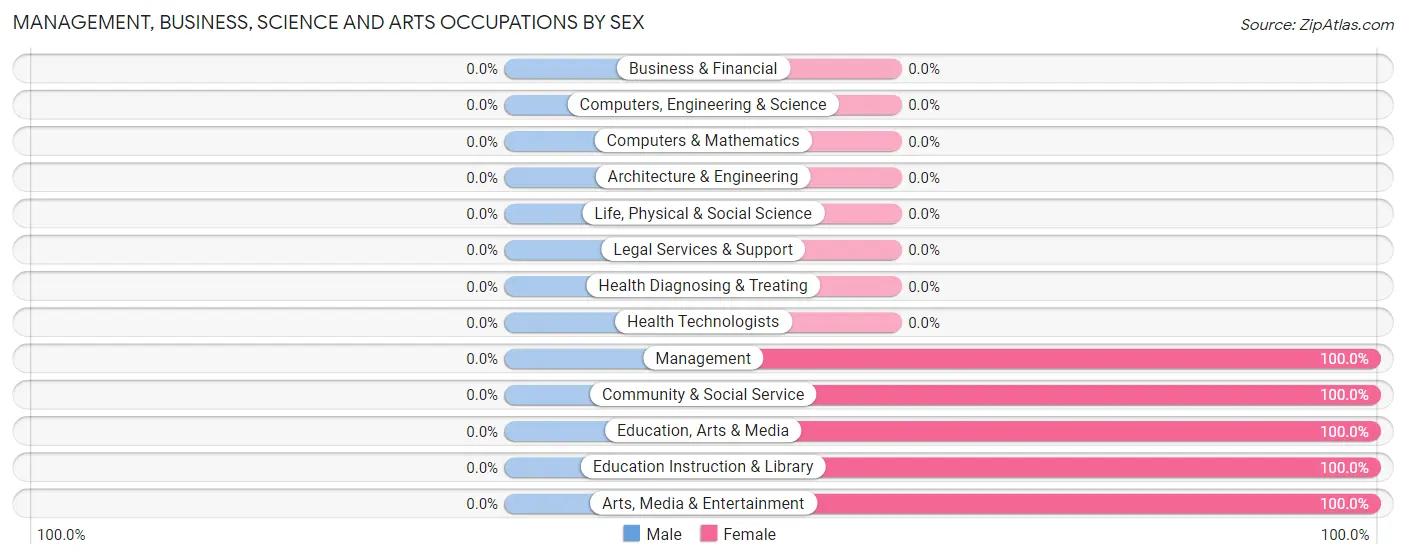
Management, Business, Science and Arts Occupations by Sex
| Occupation | Male | Female |
| Management | 0 (0.0%) | 2 (100.0%) |
| Business & Financial | 0 (0.0%) | 0 (0.0%) |
| Computers, Engineering & Science | 0 (0.0%) | 0 (0.0%) |
| Computers & Mathematics | 0 (0.0%) | 0 (0.0%) |
| Architecture & Engineering | 0 (0.0%) | 0 (0.0%) |
| Life, Physical & Social Science | 0 (0.0%) | 0 (0.0%) |
| Community & Social Service | 0 (0.0%) | 20 (100.0%) |
| Education, Arts & Media | 0 (0.0%) | 3 (100.0%) |
| Legal Services & Support | 0 (0.0%) | 0 (0.0%) |
| Education Instruction & Library | 0 (0.0%) | 12 (100.0%) |
| Arts, Media & Entertainment | 0 (0.0%) | 5 (100.0%) |
| Health Diagnosing & Treating | 0 (0.0%) | 0 (0.0%) |
| Health Technologists | 0 (0.0%) | 0 (0.0%) |
| Total (Category) | 0 (0.0%) | 22 (100.0%) |
| Total (Overall) | 31 (46.3%) | 36 (53.7%) |
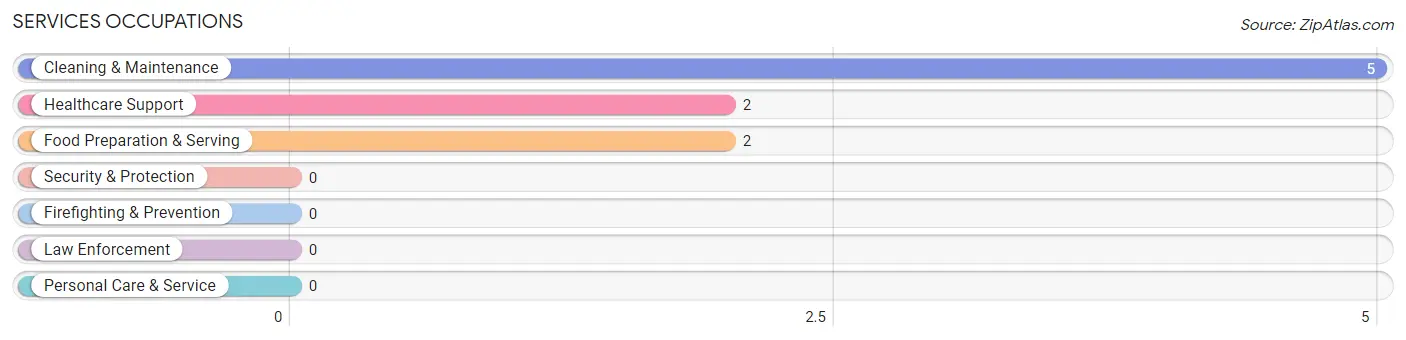
Services Occupations
The most common Services occupations in Twin Bridges are Cleaning & Maintenance (5 | 7.5%), Healthcare Support (2 | 3.0%), and Food Preparation & Serving (2 | 3.0%).
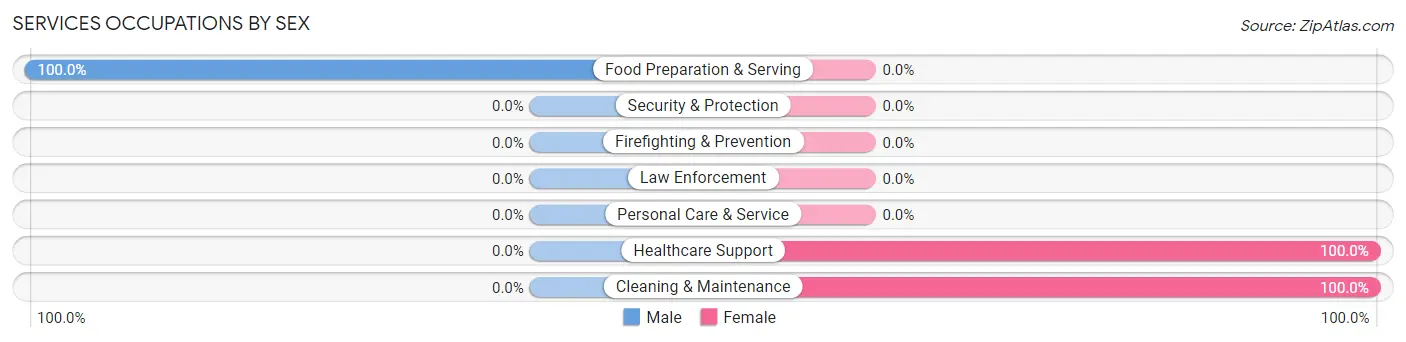
Services Occupations by Sex
| Occupation | Male | Female |
| Healthcare Support | 0 (0.0%) | 2 (100.0%) |
| Security & Protection | 0 (0.0%) | 0 (0.0%) |
| Firefighting & Prevention | 0 (0.0%) | 0 (0.0%) |
| Law Enforcement | 0 (0.0%) | 0 (0.0%) |
| Food Preparation & Serving | 2 (100.0%) | 0 (0.0%) |
| Cleaning & Maintenance | 0 (0.0%) | 5 (100.0%) |
| Personal Care & Service | 0 (0.0%) | 0 (0.0%) |
| Total (Category) | 2 (22.2%) | 7 (77.8%) |
| Total (Overall) | 31 (46.3%) | 36 (53.7%) |
Sales and Office Occupations
The most common Sales and Office occupations in Twin Bridges are Sales & Related (7 | 10.4%), and Office & Administration (4 | 6.0%).
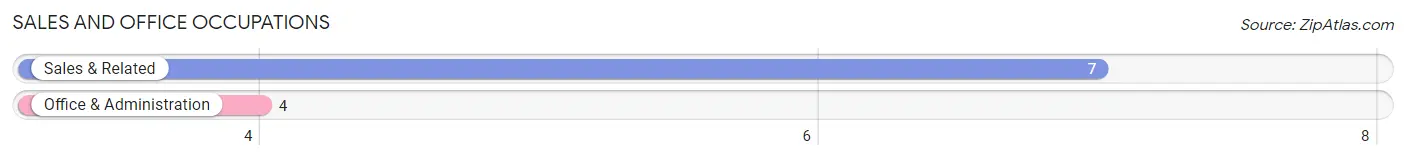
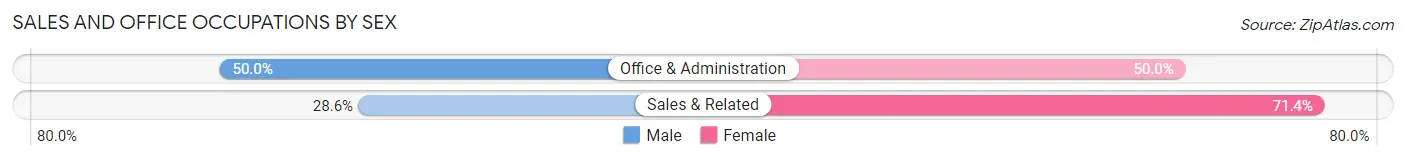
Sales and Office Occupations by Sex
| Occupation | Male | Female |
| Sales & Related | 2 (28.6%) | 5 (71.4%) |
| Office & Administration | 2 (50.0%) | 2 (50.0%) |
| Total (Category) | 4 (36.4%) | 7 (63.6%) |
| Total (Overall) | 31 (46.3%) | 36 (53.7%) |
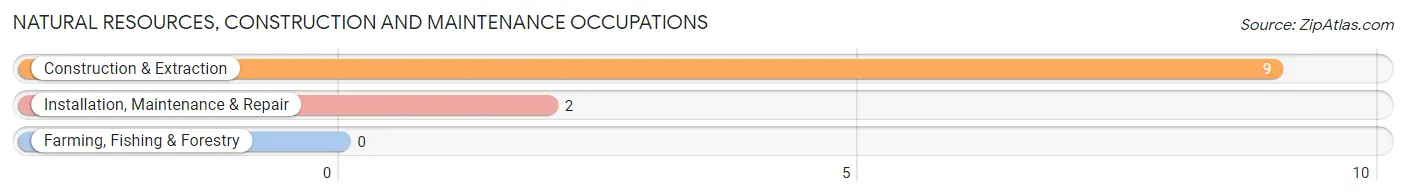
Natural Resources, Construction and Maintenance Occupations
The most common Natural Resources, Construction and Maintenance occupations in Twin Bridges are Construction & Extraction (9 | 13.4%), and Installation, Maintenance & Repair (2 | 3.0%).
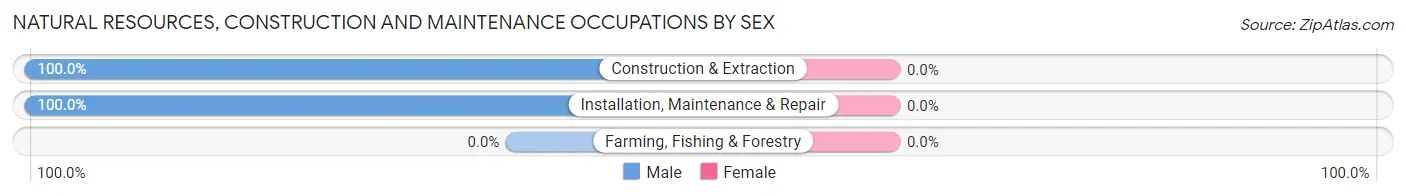
Natural Resources, Construction and Maintenance Occupations by Sex
| Occupation | Male | Female |
| Farming, Fishing & Forestry | 0 (0.0%) | 0 (0.0%) |
| Construction & Extraction | 9 (100.0%) | 0 (0.0%) |
| Installation, Maintenance & Repair | 2 (100.0%) | 0 (0.0%) |
| Total (Category) | 11 (100.0%) | 0 (0.0%) |
| Total (Overall) | 31 (46.3%) | 36 (53.7%) |
Production, Transportation and Moving Occupations
The most common Production, Transportation and Moving occupations in Twin Bridges are , and Transportation (14 | 20.9%).
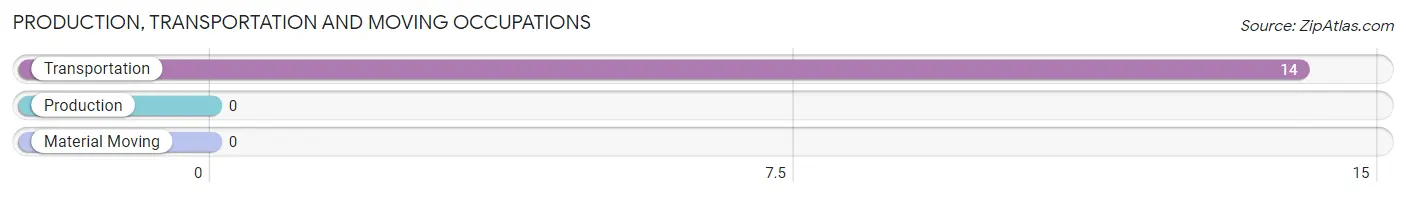
Production, Transportation and Moving Occupations by Sex
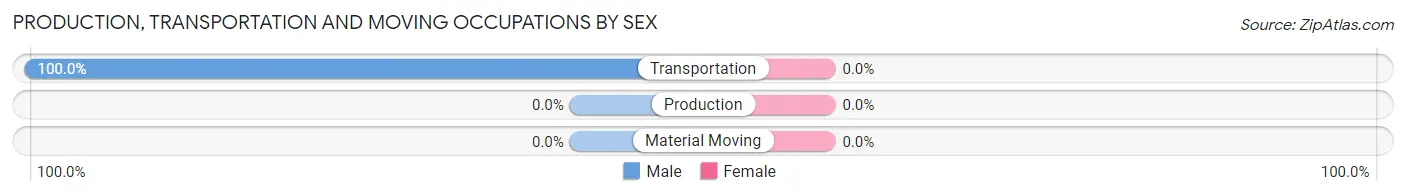
| Occupation | Male | Female |
| Production | 0 (0.0%) | 0 (0.0%) |
| Transportation | 14 (100.0%) | 0 (0.0%) |
| Material Moving | 0 (0.0%) | 0 (0.0%) |
| Total (Category) | 14 (100.0%) | 0 (0.0%) |
| Total (Overall) | 31 (46.3%) | 36 (53.7%) |
Employment Industries by Sex in Twin Bridges
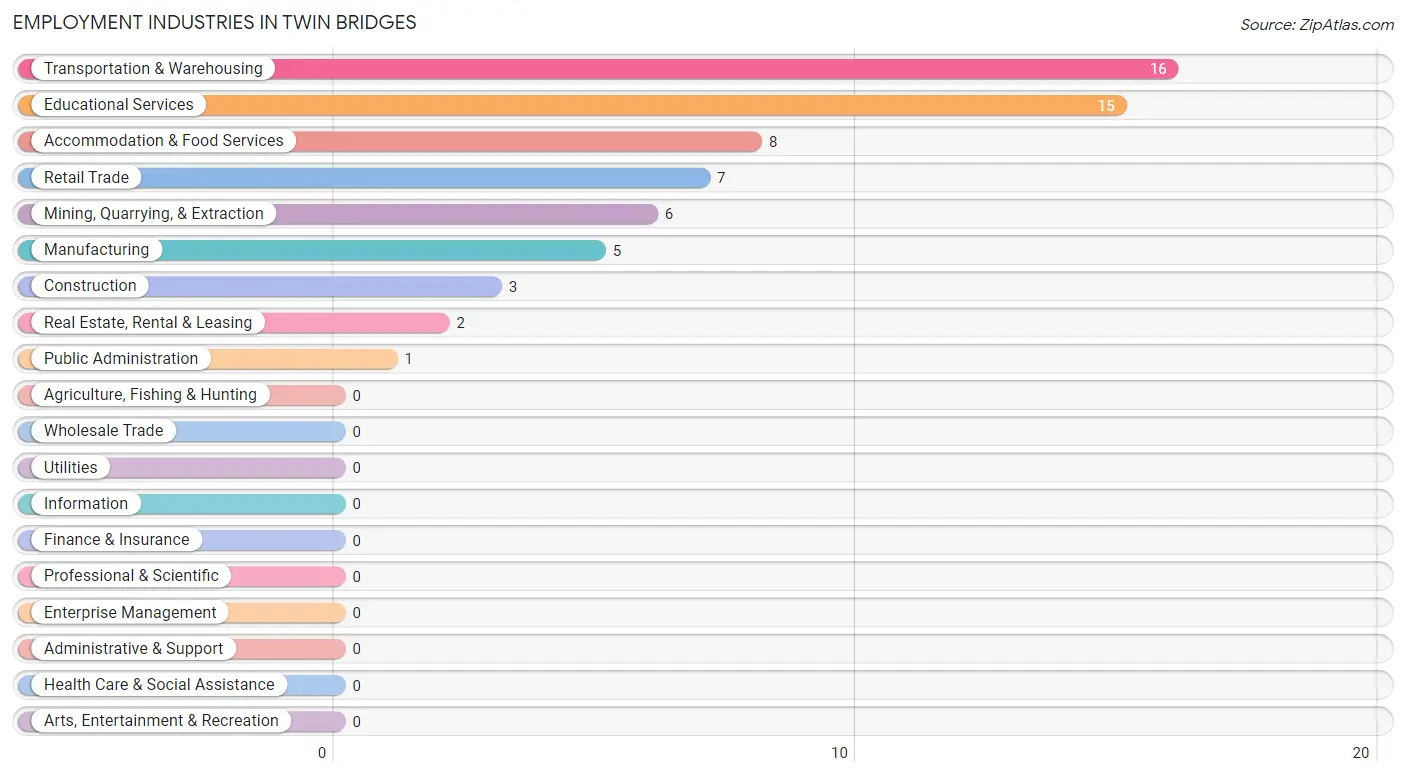
Employment Industries in Twin Bridges
The major employment industries in Twin Bridges include Transportation & Warehousing (16 | 23.9%), Educational Services (15 | 22.4%), Accommodation & Food Services (8 | 11.9%), Retail Trade (7 | 10.4%), and Mining, Quarrying, & Extraction (6 | 9.0%).
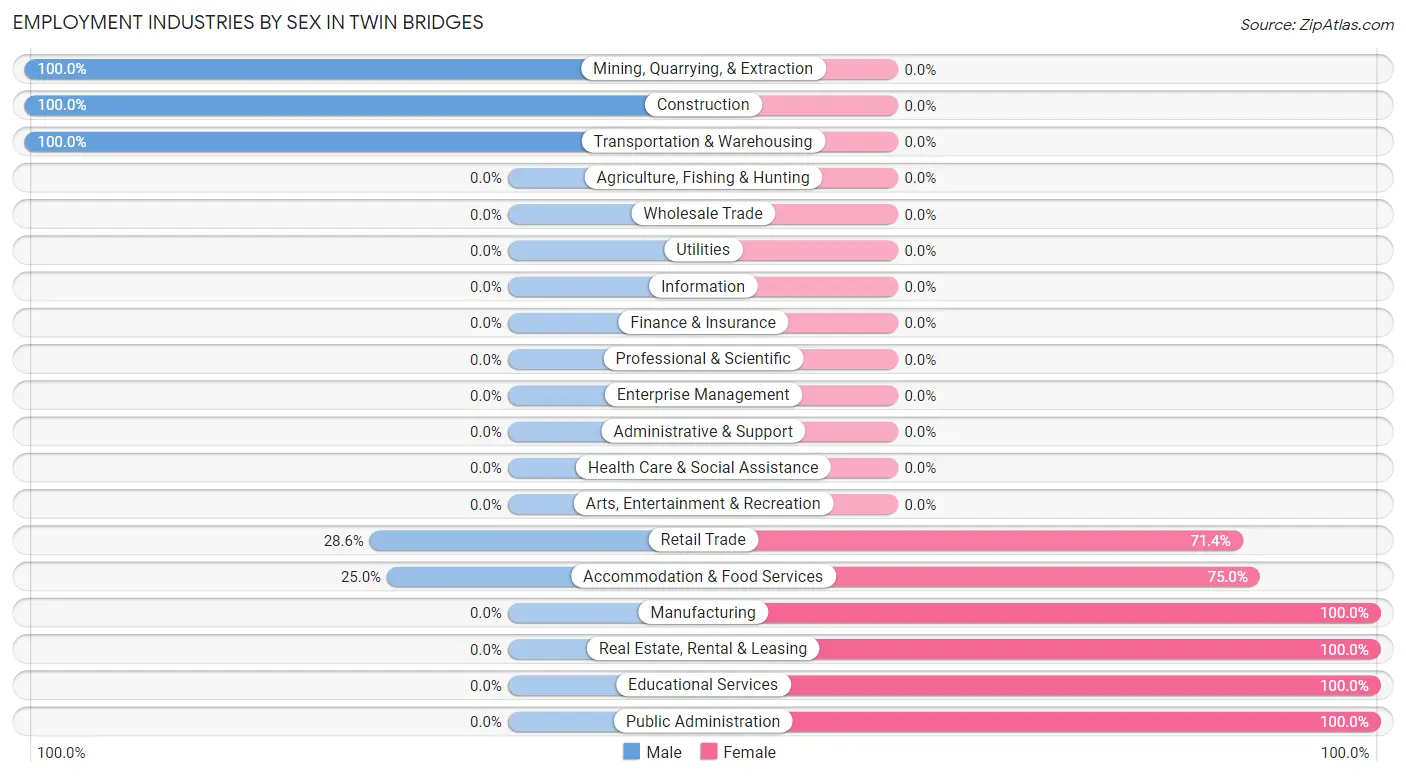
Employment Industries by Sex in Twin Bridges
The Twin Bridges industries that see more men than women are Mining, Quarrying, & Extraction (100.0%), Construction (100.0%), and Transportation & Warehousing (100.0%), whereas the industries that tend to have a higher number of women are Manufacturing (100.0%), Real Estate, Rental & Leasing (100.0%), and Educational Services (100.0%).
| Industry | Male | Female |
| Agriculture, Fishing & Hunting | 0 (0.0%) | 0 (0.0%) |
| Mining, Quarrying, & Extraction | 6 (100.0%) | 0 (0.0%) |
| Construction | 3 (100.0%) | 0 (0.0%) |
| Manufacturing | 0 (0.0%) | 5 (100.0%) |
| Wholesale Trade | 0 (0.0%) | 0 (0.0%) |
| Retail Trade | 2 (28.6%) | 5 (71.4%) |
| Transportation & Warehousing | 16 (100.0%) | 0 (0.0%) |
| Utilities | 0 (0.0%) | 0 (0.0%) |
| Information | 0 (0.0%) | 0 (0.0%) |
| Finance & Insurance | 0 (0.0%) | 0 (0.0%) |
| Real Estate, Rental & Leasing | 0 (0.0%) | 2 (100.0%) |
| Professional & Scientific | 0 (0.0%) | 0 (0.0%) |
| Enterprise Management | 0 (0.0%) | 0 (0.0%) |
| Administrative & Support | 0 (0.0%) | 0 (0.0%) |
| Educational Services | 0 (0.0%) | 15 (100.0%) |
| Health Care & Social Assistance | 0 (0.0%) | 0 (0.0%) |
| Arts, Entertainment & Recreation | 0 (0.0%) | 0 (0.0%) |
| Accommodation & Food Services | 2 (25.0%) | 6 (75.0%) |
| Public Administration | 0 (0.0%) | 1 (100.0%) |
| Total | 31 (46.3%) | 36 (53.7%) |
Education in Twin Bridges
School Enrollment in Twin Bridges
The most common levels of schooling among the 45 students in Twin Bridges are elementary school (19 | 42.2%), high school (14 | 31.1%), and graduate / professional (6 | 13.3%).
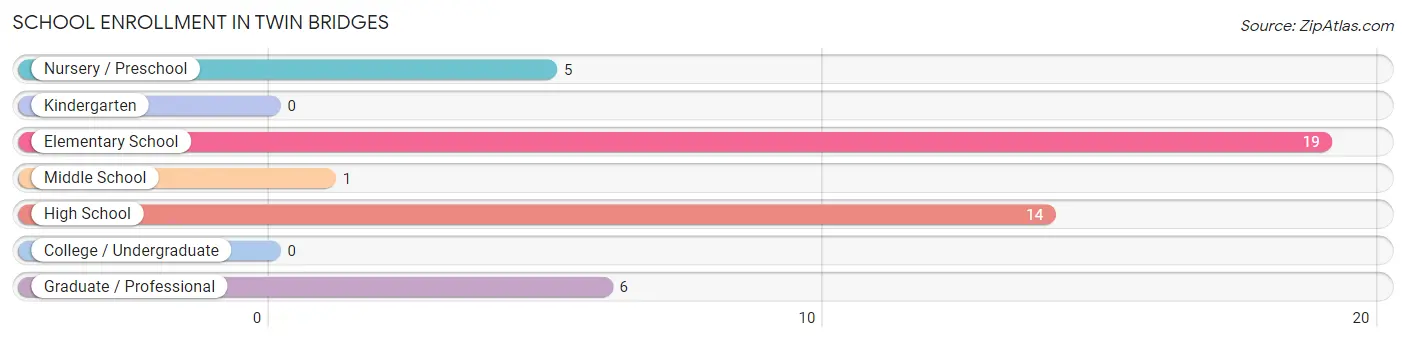
| School Level | # Students | % Students |
| Nursery / Preschool | 5 | 11.1% |
| Kindergarten | 0 | 0.0% |
| Elementary School | 19 | 42.2% |
| Middle School | 1 | 2.2% |
| High School | 14 | 31.1% |
| College / Undergraduate | 0 | 0.0% |
| Graduate / Professional | 6 | 13.3% |
| Total | 45 | 100.0% |
School Enrollment by Age by Funding Source in Twin Bridges
Out of a total of 45 students who are enrolled in schools in Twin Bridges, 1 (2.2%) attend a private institution, while the remaining 44 (97.8%) are enrolled in public schools. The age group of 35 years and over has the highest likelihood of being enrolled in private schools, with 1 (16.7% in the age bracket) enrolled. Conversely, the age group of 3 to 4 year olds has the lowest likelihood of being enrolled in a private school, with 5 (100.0% in the age bracket) attending a public institution.
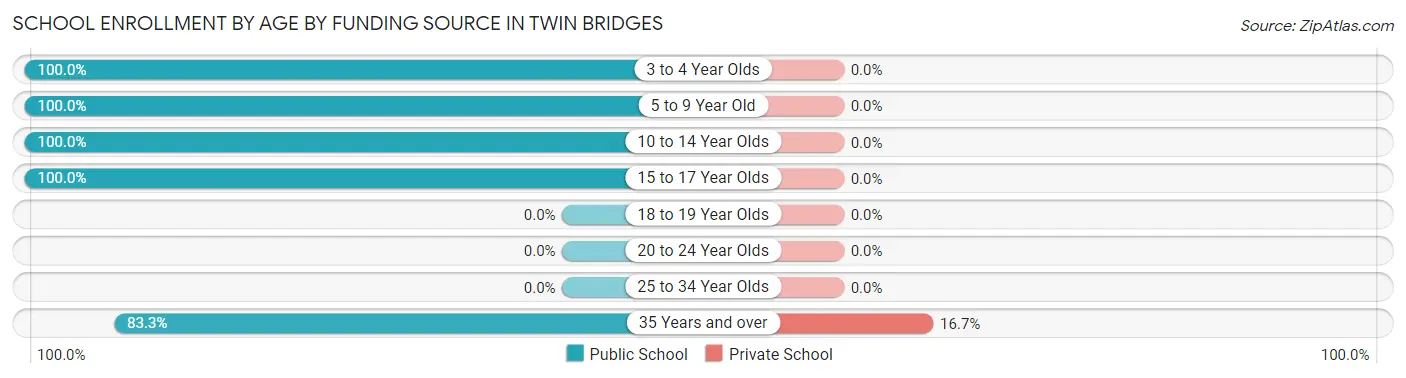
| Age Bracket | Public School | Private School |
| 3 to 4 Year Olds | 5 (100.0%) | 0 (0.0%) |
| 5 to 9 Year Old | 19 (100.0%) | 0 (0.0%) |
| 10 to 14 Year Olds | 1 (100.0%) | 0 (0.0%) |
| 15 to 17 Year Olds | 14 (100.0%) | 0 (0.0%) |
| 18 to 19 Year Olds | 0 (0.0%) | 0 (0.0%) |
| 20 to 24 Year Olds | 0 (0.0%) | 0 (0.0%) |
| 25 to 34 Year Olds | 0 (0.0%) | 0 (0.0%) |
| 35 Years and over | 5 (83.3%) | 1 (16.7%) |
| Total | 44 (97.8%) | 1 (2.2%) |
Educational Attainment by Field of Study in Twin Bridges
Education (14 | 31.8%), business (12 | 27.3%), science & technology (7 | 15.9%), bio, nature & agricultural (4 | 9.1%), and visual & performing arts (3 | 6.8%) are the most common fields of study among 44 individuals in Twin Bridges who have obtained a bachelor's degree or higher.
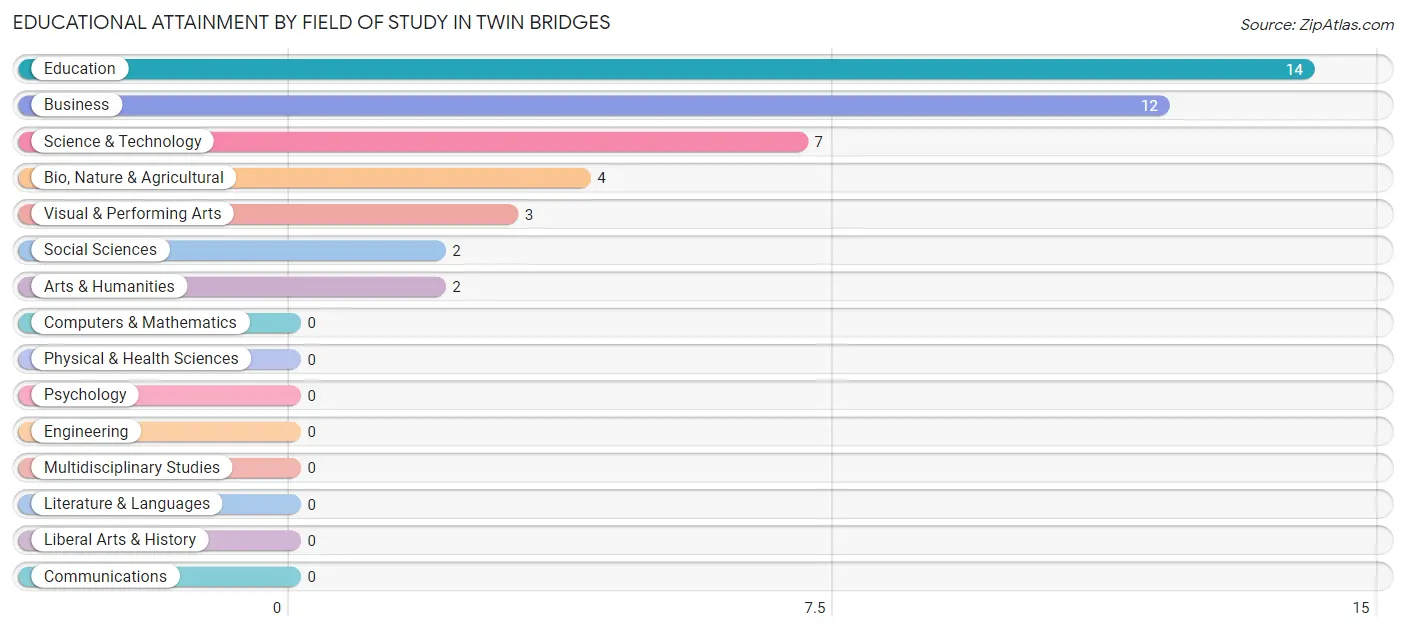
| Field of Study | # Graduates | % Graduates |
| Computers & Mathematics | 0 | 0.0% |
| Bio, Nature & Agricultural | 4 | 9.1% |
| Physical & Health Sciences | 0 | 0.0% |
| Psychology | 0 | 0.0% |
| Social Sciences | 2 | 4.5% |
| Engineering | 0 | 0.0% |
| Multidisciplinary Studies | 0 | 0.0% |
| Science & Technology | 7 | 15.9% |
| Business | 12 | 27.3% |
| Education | 14 | 31.8% |
| Literature & Languages | 0 | 0.0% |
| Liberal Arts & History | 0 | 0.0% |
| Visual & Performing Arts | 3 | 6.8% |
| Communications | 0 | 0.0% |
| Arts & Humanities | 2 | 4.5% |
| Total | 44 | 100.0% |
Transportation & Commute in Twin Bridges
Vehicle Availability by Sex in Twin Bridges
The most prevalent vehicle ownership categories in Twin Bridges are males with 4 vehicles (21, accounting for 67.7%) and females with 4 vehicles (9, making up 58.3%).
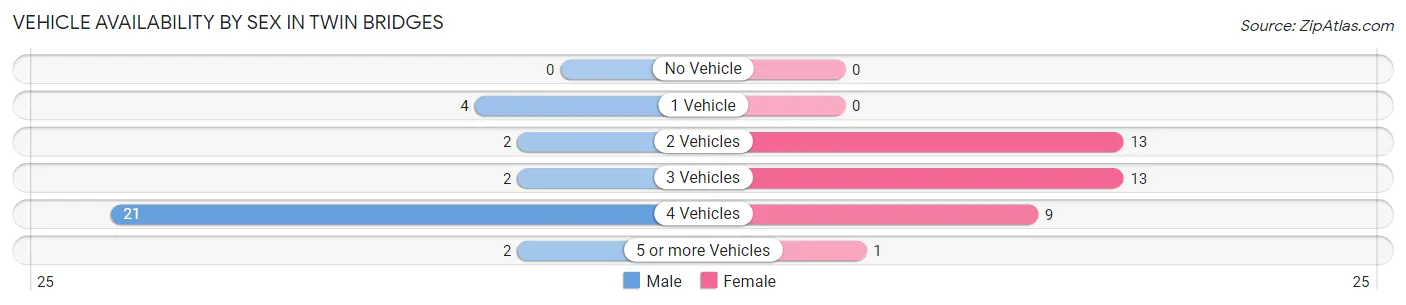
| Vehicles Available | Male | Female |
| No Vehicle | 0 (0.0%) | 0 (0.0%) |
| 1 Vehicle | 4 (12.9%) | 0 (0.0%) |
| 2 Vehicles | 2 (6.5%) | 13 (36.1%) |
| 3 Vehicles | 2 (6.5%) | 13 (36.1%) |
| 4 Vehicles | 21 (67.7%) | 9 (25.0%) |
| 5 or more Vehicles | 2 (6.5%) | 1 (2.8%) |
| Total | 31 (100.0%) | 36 (100.0%) |
Commute Time in Twin Bridges
The most frequently occuring commute durations in Twin Bridges are 5 to 9 minutes (17 commuters, 26.2%), 90 or more minutes (15 commuters, 23.1%), and 30 to 34 minutes (10 commuters, 15.4%).
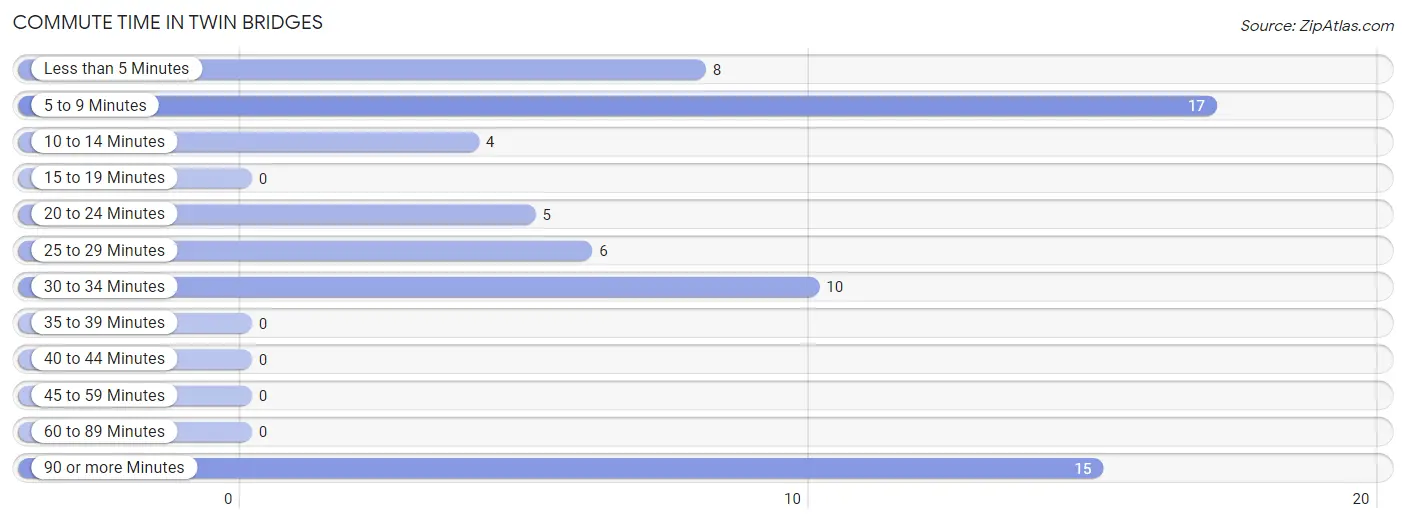
| Commute Time | # Commuters | % Commuters |
| Less than 5 Minutes | 8 | 12.3% |
| 5 to 9 Minutes | 17 | 26.2% |
| 10 to 14 Minutes | 4 | 6.1% |
| 15 to 19 Minutes | 0 | 0.0% |
| 20 to 24 Minutes | 5 | 7.7% |
| 25 to 29 Minutes | 6 | 9.2% |
| 30 to 34 Minutes | 10 | 15.4% |
| 35 to 39 Minutes | 0 | 0.0% |
| 40 to 44 Minutes | 0 | 0.0% |
| 45 to 59 Minutes | 0 | 0.0% |
| 60 to 89 Minutes | 0 | 0.0% |
| 90 or more Minutes | 15 | 23.1% |
Commute Time by Sex in Twin Bridges
The most common commute times in Twin Bridges are 90 or more minutes (15 commuters, 48.4%) for males and 5 to 9 minutes (15 commuters, 44.1%) for females.
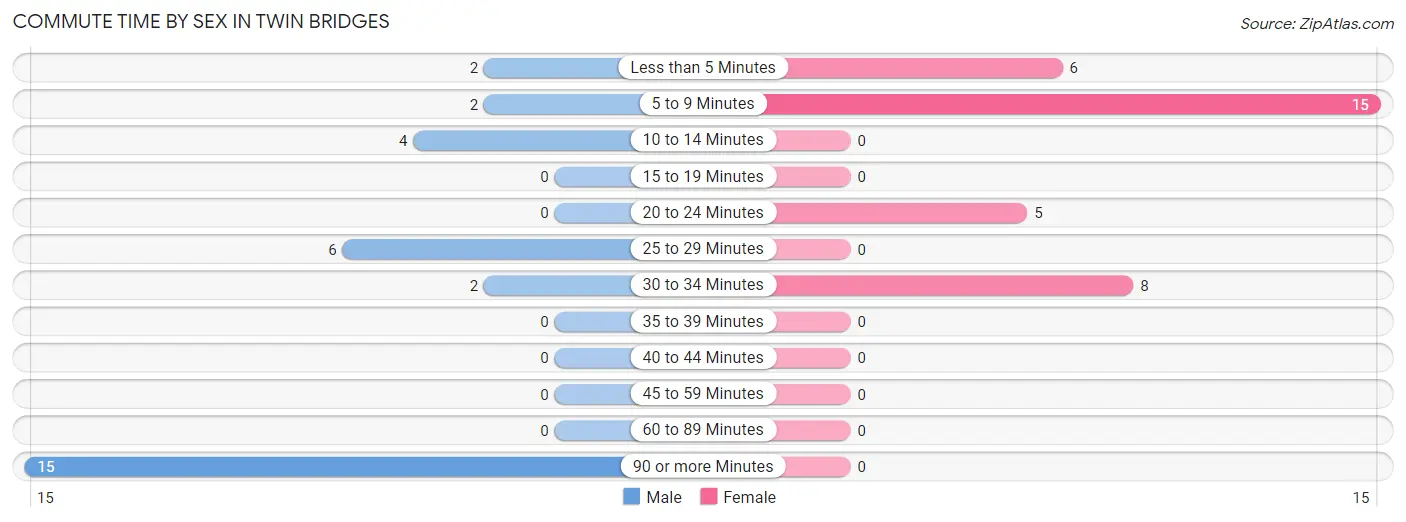
| Commute Time | Male | Female |
| Less than 5 Minutes | 2 (6.5%) | 6 (17.6%) |
| 5 to 9 Minutes | 2 (6.5%) | 15 (44.1%) |
| 10 to 14 Minutes | 4 (12.9%) | 0 (0.0%) |
| 15 to 19 Minutes | 0 (0.0%) | 0 (0.0%) |
| 20 to 24 Minutes | 0 (0.0%) | 5 (14.7%) |
| 25 to 29 Minutes | 6 (19.4%) | 0 (0.0%) |
| 30 to 34 Minutes | 2 (6.5%) | 8 (23.5%) |
| 35 to 39 Minutes | 0 (0.0%) | 0 (0.0%) |
| 40 to 44 Minutes | 0 (0.0%) | 0 (0.0%) |
| 45 to 59 Minutes | 0 (0.0%) | 0 (0.0%) |
| 60 to 89 Minutes | 0 (0.0%) | 0 (0.0%) |
| 90 or more Minutes | 15 (48.4%) | 0 (0.0%) |
Time of Departure to Work by Sex in Twin Bridges
The most frequent times of departure to work in Twin Bridges are 6:00 AM to 6:29 AM (16, 51.6%) for males and 11:00 AM to 11:59 AM (7, 20.6%) for females.
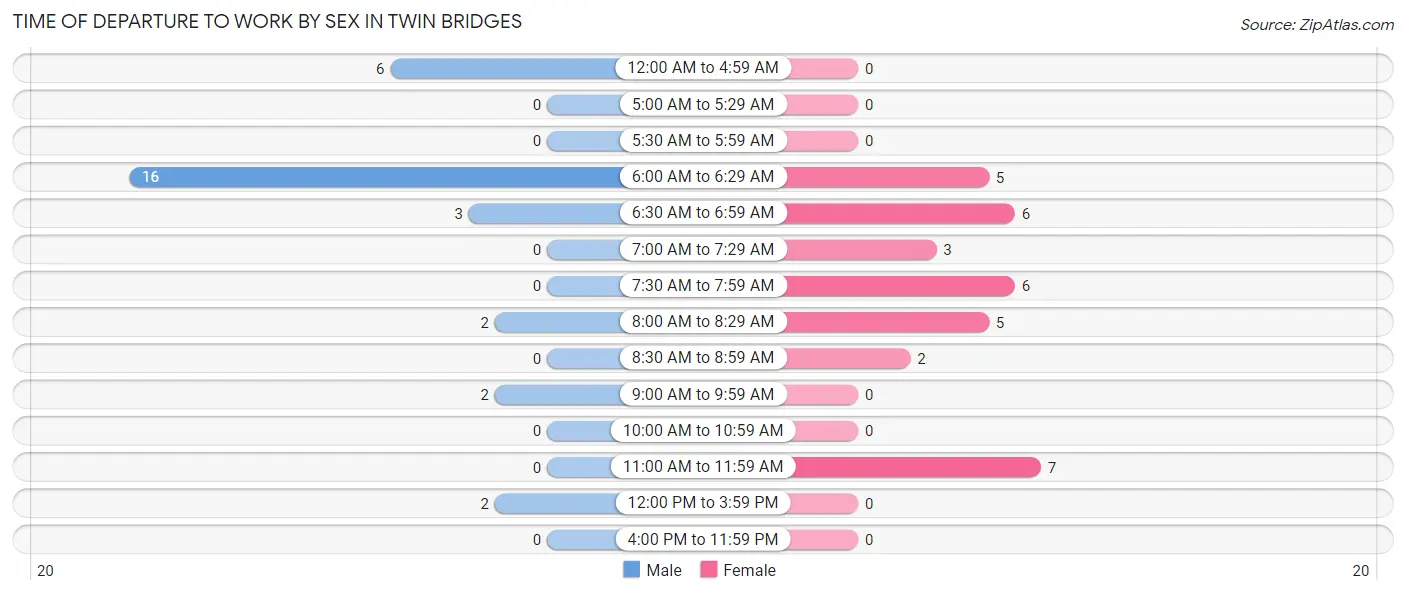
| Time of Departure | Male | Female |
| 12:00 AM to 4:59 AM | 6 (19.4%) | 0 (0.0%) |
| 5:00 AM to 5:29 AM | 0 (0.0%) | 0 (0.0%) |
| 5:30 AM to 5:59 AM | 0 (0.0%) | 0 (0.0%) |
| 6:00 AM to 6:29 AM | 16 (51.6%) | 5 (14.7%) |
| 6:30 AM to 6:59 AM | 3 (9.7%) | 6 (17.6%) |
| 7:00 AM to 7:29 AM | 0 (0.0%) | 3 (8.8%) |
| 7:30 AM to 7:59 AM | 0 (0.0%) | 6 (17.6%) |
| 8:00 AM to 8:29 AM | 2 (6.5%) | 5 (14.7%) |
| 8:30 AM to 8:59 AM | 0 (0.0%) | 2 (5.9%) |
| 9:00 AM to 9:59 AM | 2 (6.5%) | 0 (0.0%) |
| 10:00 AM to 10:59 AM | 0 (0.0%) | 0 (0.0%) |
| 11:00 AM to 11:59 AM | 0 (0.0%) | 7 (20.6%) |
| 12:00 PM to 3:59 PM | 2 (6.5%) | 0 (0.0%) |
| 4:00 PM to 11:59 PM | 0 (0.0%) | 0 (0.0%) |
| Total | 31 (100.0%) | 34 (100.0%) |
Housing Occupancy in Twin Bridges
Occupancy by Ownership in Twin Bridges
Of the total 116 dwellings in Twin Bridges, owner-occupied units account for 90 (77.6%), while renter-occupied units make up 26 (22.4%).
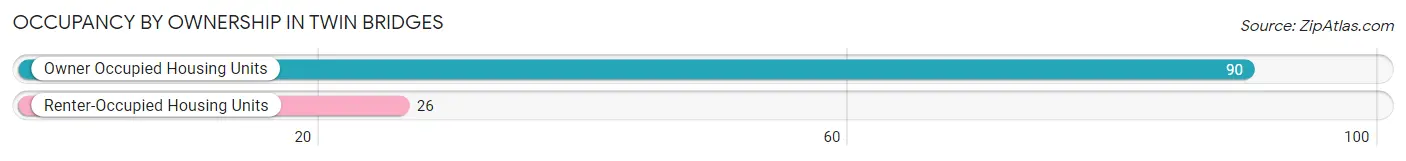
| Occupancy | # Housing Units | % Housing Units |
| Owner Occupied Housing Units | 90 | 77.6% |
| Renter-Occupied Housing Units | 26 | 22.4% |
| Total Occupied Housing Units | 116 | 100.0% |
Occupancy by Household Size in Twin Bridges
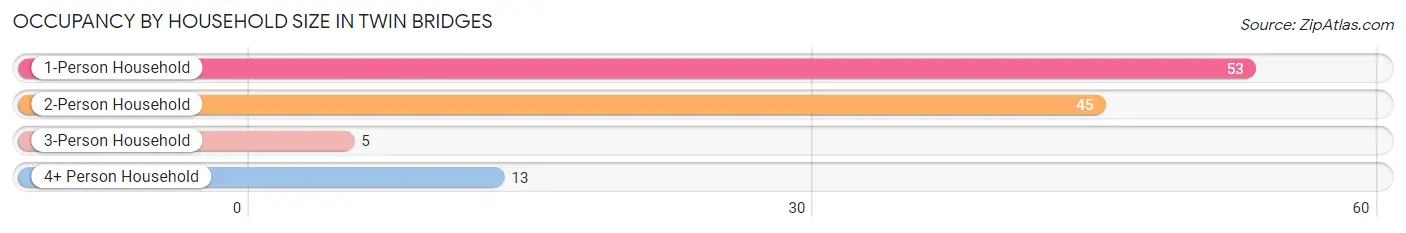
| Household Size | # Housing Units | % Housing Units |
| 1-Person Household | 53 | 45.7% |
| 2-Person Household | 45 | 38.8% |
| 3-Person Household | 5 | 4.3% |
| 4+ Person Household | 13 | 11.2% |
| Total Housing Units | 116 | 100.0% |
Occupancy by Ownership by Household Size in Twin Bridges
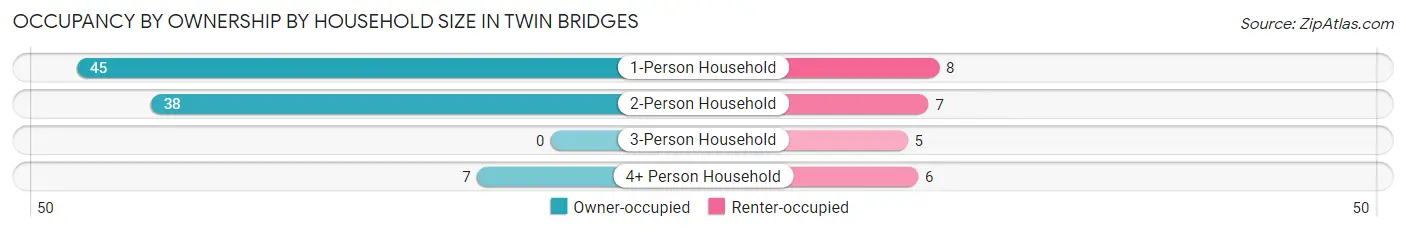
| Household Size | Owner-occupied | Renter-occupied |
| 1-Person Household | 45 (84.9%) | 8 (15.1%) |
| 2-Person Household | 38 (84.4%) | 7 (15.6%) |
| 3-Person Household | 0 (0.0%) | 5 (100.0%) |
| 4+ Person Household | 7 (53.8%) | 6 (46.2%) |
| Total Housing Units | 90 (77.6%) | 26 (22.4%) |
Occupancy by Educational Attainment in Twin Bridges
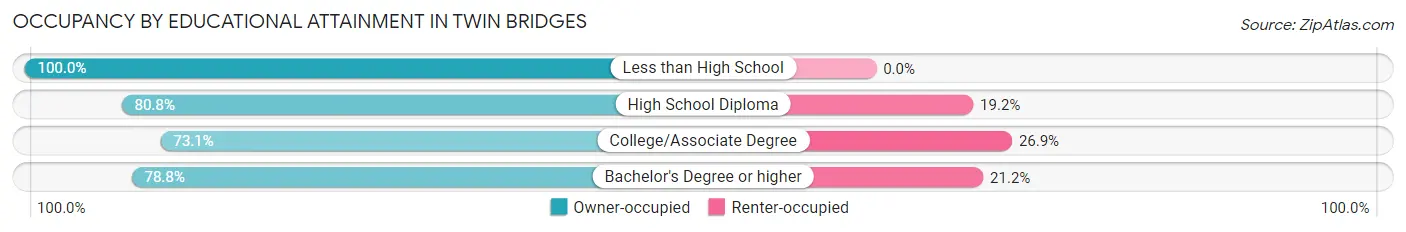
| Household Size | Owner-occupied | Renter-occupied |
| Less than High School | 5 (100.0%) | 0 (0.0%) |
| High School Diploma | 21 (80.8%) | 5 (19.2%) |
| College/Associate Degree | 38 (73.1%) | 14 (26.9%) |
| Bachelor's Degree or higher | 26 (78.8%) | 7 (21.2%) |
Occupancy by Age of Householder in Twin Bridges
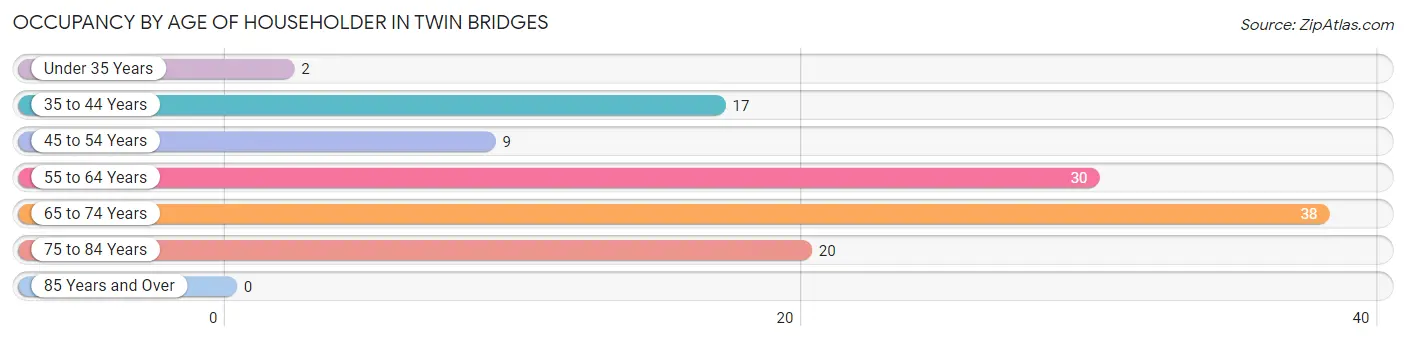
| Age Bracket | # Households | % Households |
| Under 35 Years | 2 | 1.7% |
| 35 to 44 Years | 17 | 14.7% |
| 45 to 54 Years | 9 | 7.8% |
| 55 to 64 Years | 30 | 25.9% |
| 65 to 74 Years | 38 | 32.8% |
| 75 to 84 Years | 20 | 17.2% |
| 85 Years and Over | 0 | 0.0% |
| Total | 116 | 100.0% |
Housing Finances in Twin Bridges
Median Income by Occupancy in Twin Bridges
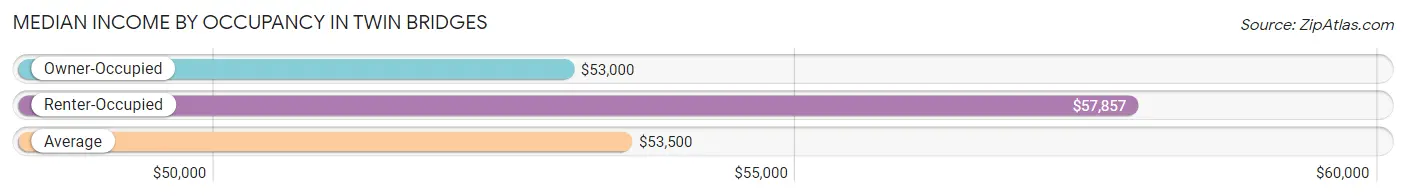
| Occupancy Type | # Households | Median Income |
| Owner-Occupied | 90 (77.6%) | $53,000 |
| Renter-Occupied | 26 (22.4%) | $57,857 |
| Average | 116 (100.0%) | $53,500 |
Occupancy by Householder Income Bracket in Twin Bridges
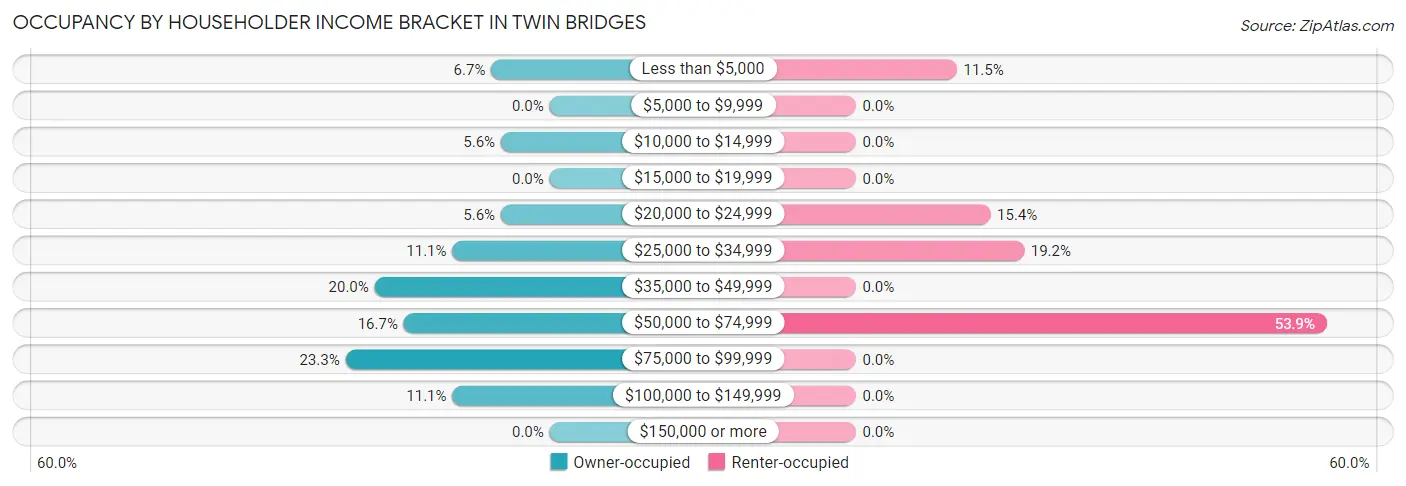
| Income Bracket | Owner-occupied | Renter-occupied |
| Less than $5,000 | 6 (6.7%) | 3 (11.5%) |
| $5,000 to $9,999 | 0 (0.0%) | 0 (0.0%) |
| $10,000 to $14,999 | 5 (5.6%) | 0 (0.0%) |
| $15,000 to $19,999 | 0 (0.0%) | 0 (0.0%) |
| $20,000 to $24,999 | 5 (5.6%) | 4 (15.4%) |
| $25,000 to $34,999 | 10 (11.1%) | 5 (19.2%) |
| $35,000 to $49,999 | 18 (20.0%) | 0 (0.0%) |
| $50,000 to $74,999 | 15 (16.7%) | 14 (53.8%) |
| $75,000 to $99,999 | 21 (23.3%) | 0 (0.0%) |
| $100,000 to $149,999 | 10 (11.1%) | 0 (0.0%) |
| $150,000 or more | 0 (0.0%) | 0 (0.0%) |
| Total | 90 (100.0%) | 26 (100.0%) |
Monthly Housing Cost Tiers in Twin Bridges
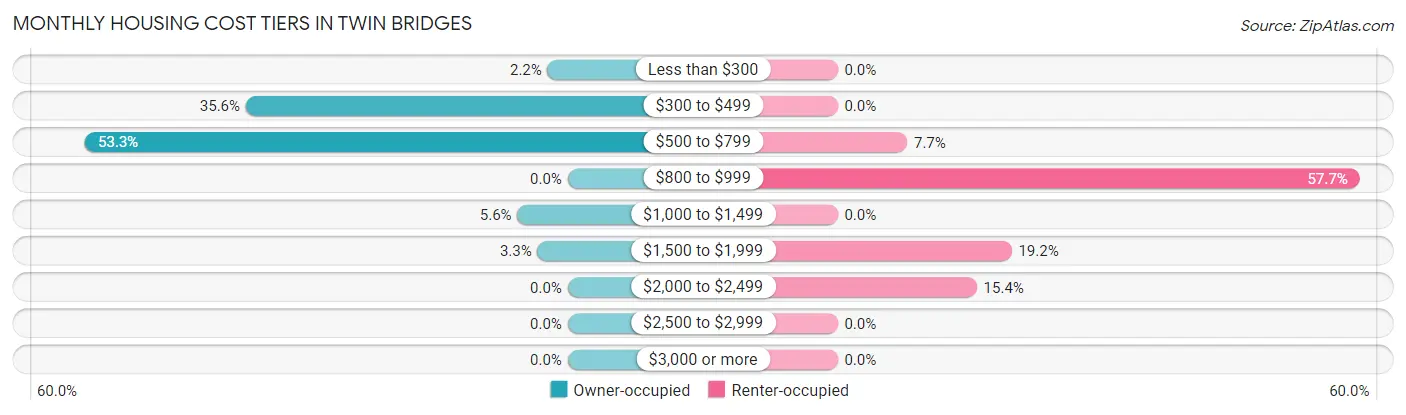
| Monthly Cost | Owner-occupied | Renter-occupied |
| Less than $300 | 2 (2.2%) | 0 (0.0%) |
| $300 to $499 | 32 (35.6%) | 0 (0.0%) |
| $500 to $799 | 48 (53.3%) | 2 (7.7%) |
| $800 to $999 | 0 (0.0%) | 15 (57.7%) |
| $1,000 to $1,499 | 5 (5.6%) | 0 (0.0%) |
| $1,500 to $1,999 | 3 (3.3%) | 5 (19.2%) |
| $2,000 to $2,499 | 0 (0.0%) | 4 (15.4%) |
| $2,500 to $2,999 | 0 (0.0%) | 0 (0.0%) |
| $3,000 or more | 0 (0.0%) | 0 (0.0%) |
| Total | 90 (100.0%) | 26 (100.0%) |
Physical Housing Characteristics in Twin Bridges
Housing Structures in Twin Bridges
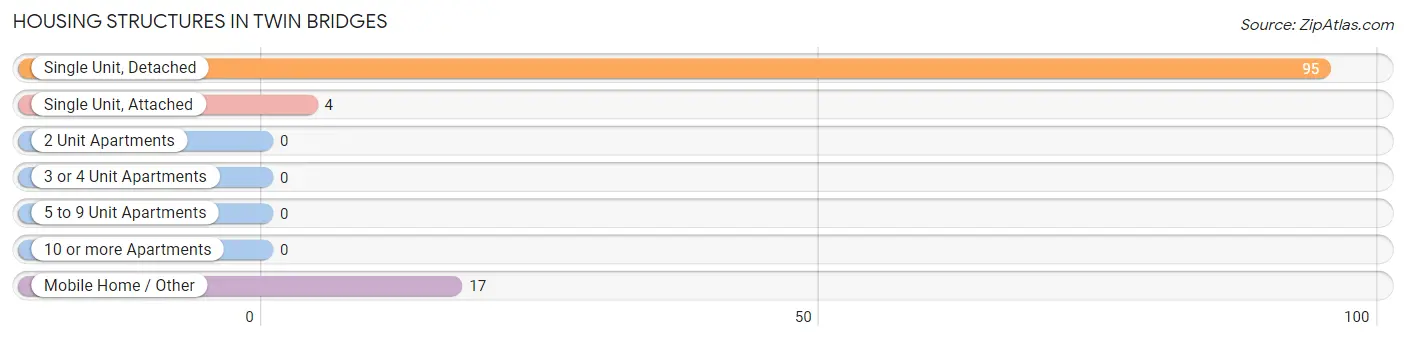
| Structure Type | # Housing Units | % Housing Units |
| Single Unit, Detached | 95 | 81.9% |
| Single Unit, Attached | 4 | 3.5% |
| 2 Unit Apartments | 0 | 0.0% |
| 3 or 4 Unit Apartments | 0 | 0.0% |
| 5 to 9 Unit Apartments | 0 | 0.0% |
| 10 or more Apartments | 0 | 0.0% |
| Mobile Home / Other | 17 | 14.7% |
| Total | 116 | 100.0% |
Housing Structures by Occupancy in Twin Bridges
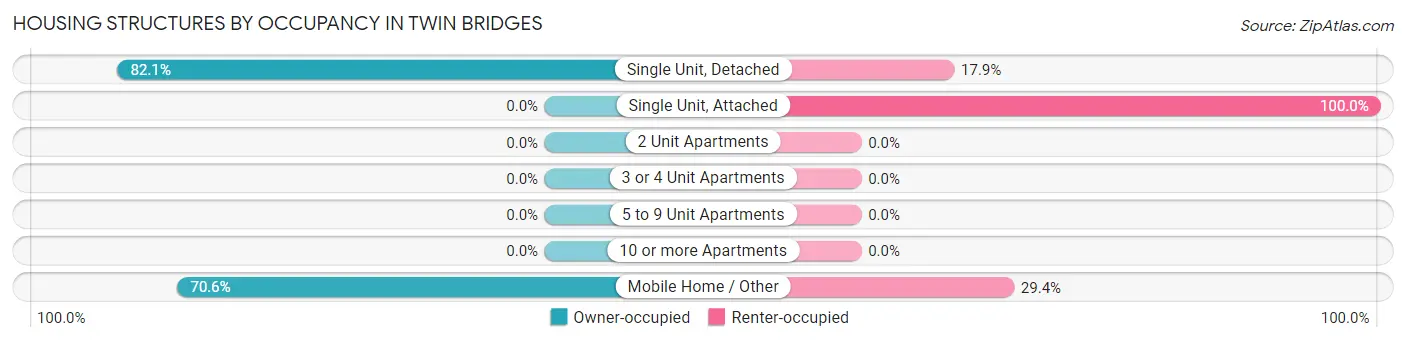
| Structure Type | Owner-occupied | Renter-occupied |
| Single Unit, Detached | 78 (82.1%) | 17 (17.9%) |
| Single Unit, Attached | 0 (0.0%) | 4 (100.0%) |
| 2 Unit Apartments | 0 (0.0%) | 0 (0.0%) |
| 3 or 4 Unit Apartments | 0 (0.0%) | 0 (0.0%) |
| 5 to 9 Unit Apartments | 0 (0.0%) | 0 (0.0%) |
| 10 or more Apartments | 0 (0.0%) | 0 (0.0%) |
| Mobile Home / Other | 12 (70.6%) | 5 (29.4%) |
| Total | 90 (77.6%) | 26 (22.4%) |
Housing Structures by Number of Rooms in Twin Bridges
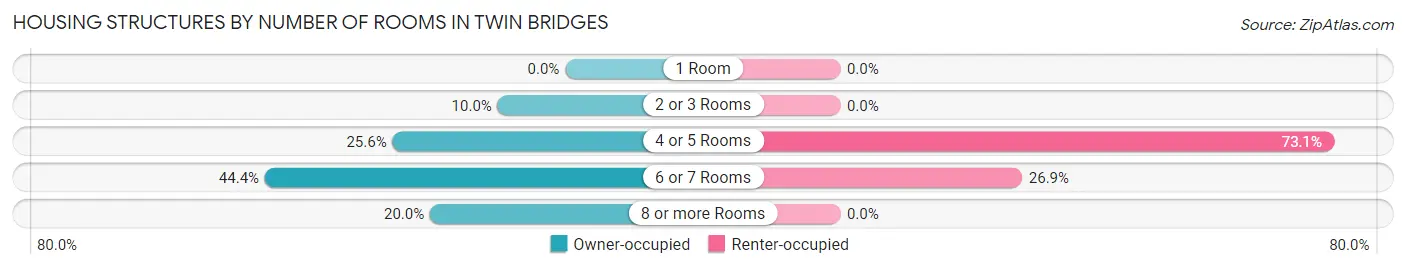
| Number of Rooms | Owner-occupied | Renter-occupied |
| 1 Room | 0 (0.0%) | 0 (0.0%) |
| 2 or 3 Rooms | 9 (10.0%) | 0 (0.0%) |
| 4 or 5 Rooms | 23 (25.6%) | 19 (73.1%) |
| 6 or 7 Rooms | 40 (44.4%) | 7 (26.9%) |
| 8 or more Rooms | 18 (20.0%) | 0 (0.0%) |
| Total | 90 (100.0%) | 26 (100.0%) |
Housing Structure by Heating Type in Twin Bridges
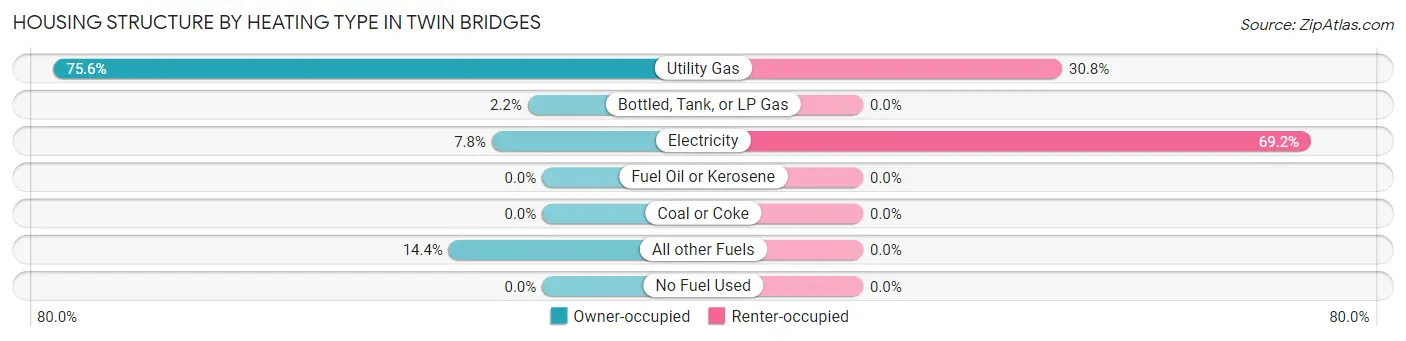
| Heating Type | Owner-occupied | Renter-occupied |
| Utility Gas | 68 (75.6%) | 8 (30.8%) |
| Bottled, Tank, or LP Gas | 2 (2.2%) | 0 (0.0%) |
| Electricity | 7 (7.8%) | 18 (69.2%) |
| Fuel Oil or Kerosene | 0 (0.0%) | 0 (0.0%) |
| Coal or Coke | 0 (0.0%) | 0 (0.0%) |
| All other Fuels | 13 (14.4%) | 0 (0.0%) |
| No Fuel Used | 0 (0.0%) | 0 (0.0%) |
| Total | 90 (100.0%) | 26 (100.0%) |
Household Vehicle Usage in Twin Bridges
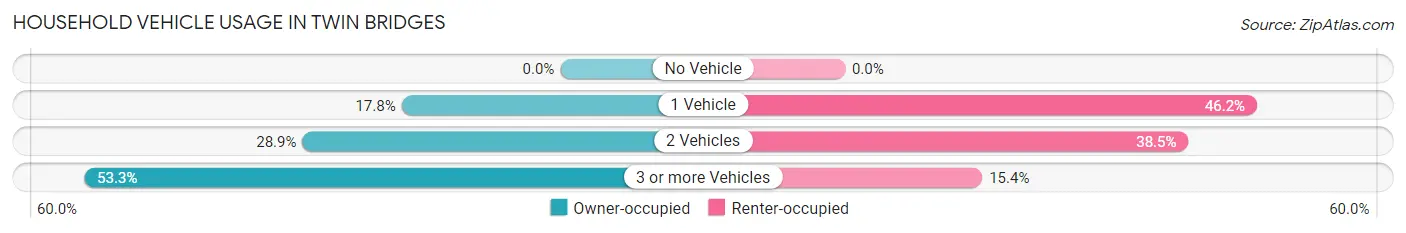
| Vehicles per Household | Owner-occupied | Renter-occupied |
| No Vehicle | 0 (0.0%) | 0 (0.0%) |
| 1 Vehicle | 16 (17.8%) | 12 (46.2%) |
| 2 Vehicles | 26 (28.9%) | 10 (38.5%) |
| 3 or more Vehicles | 48 (53.3%) | 4 (15.4%) |
| Total | 90 (100.0%) | 26 (100.0%) |
Real Estate & Mortgages in Twin Bridges
Real Estate and Mortgage Overview in Twin Bridges
| Characteristic | Without Mortgage | With Mortgage |
| Housing Units | 77 | 13 |
| Median Property Value | $252,700 | $189,100 |
| Median Household Income | $58,438 | $0 |
| Monthly Housing Costs | $517 | $0 |
| Real Estate Taxes | $1,850 | $0 |
Property Value by Mortgage Status in Twin Bridges
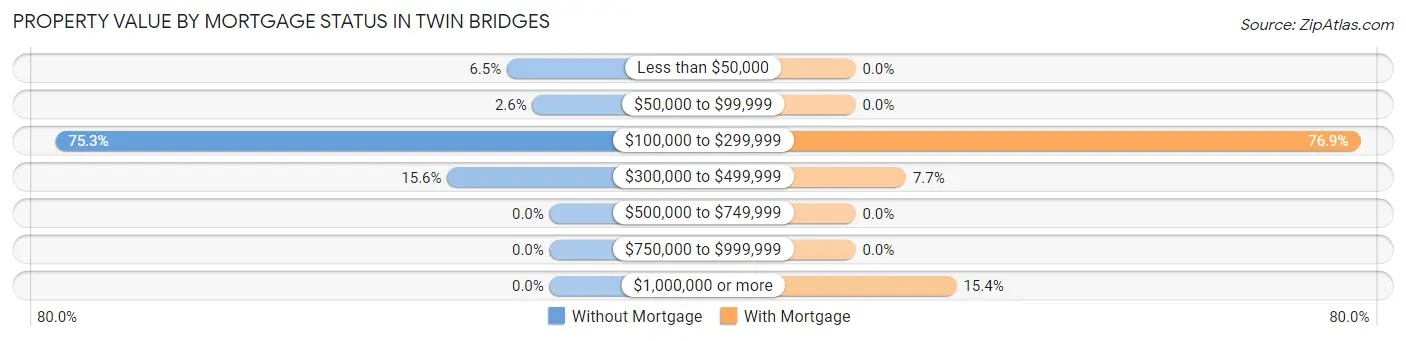
| Property Value | Without Mortgage | With Mortgage |
| Less than $50,000 | 5 (6.5%) | 0 (0.0%) |
| $50,000 to $99,999 | 2 (2.6%) | 0 (0.0%) |
| $100,000 to $299,999 | 58 (75.3%) | 10 (76.9%) |
| $300,000 to $499,999 | 12 (15.6%) | 1 (7.7%) |
| $500,000 to $749,999 | 0 (0.0%) | 0 (0.0%) |
| $750,000 to $999,999 | 0 (0.0%) | 0 (0.0%) |
| $1,000,000 or more | 0 (0.0%) | 2 (15.4%) |
| Total | 77 (100.0%) | 13 (100.0%) |
Household Income by Mortgage Status in Twin Bridges
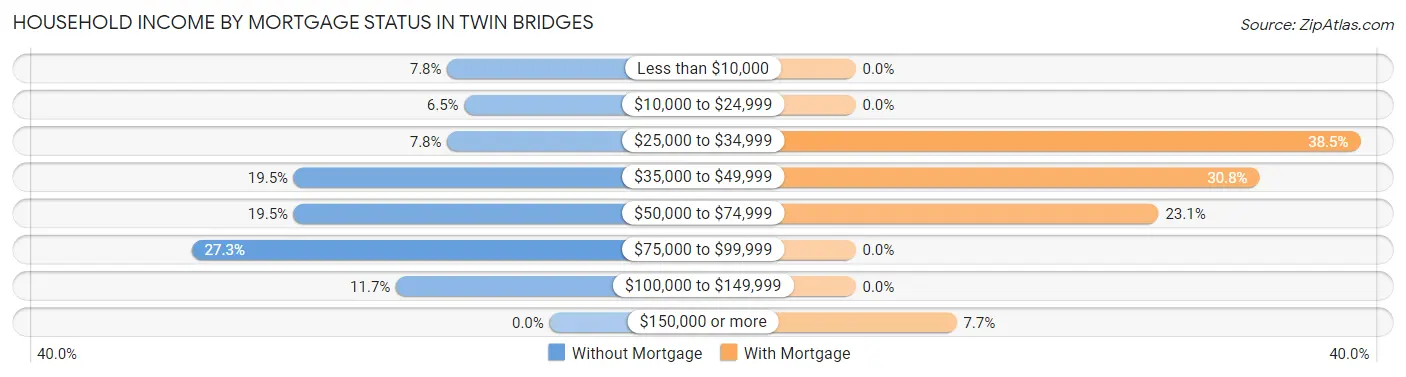
| Household Income | Without Mortgage | With Mortgage |
| Less than $10,000 | 6 (7.8%) | 0 (0.0%) |
| $10,000 to $24,999 | 5 (6.5%) | 0 (0.0%) |
| $25,000 to $34,999 | 6 (7.8%) | 5 (38.5%) |
| $35,000 to $49,999 | 15 (19.5%) | 4 (30.8%) |
| $50,000 to $74,999 | 15 (19.5%) | 3 (23.1%) |
| $75,000 to $99,999 | 21 (27.3%) | 0 (0.0%) |
| $100,000 to $149,999 | 9 (11.7%) | 0 (0.0%) |
| $150,000 or more | 0 (0.0%) | 1 (7.7%) |
| Total | 77 (100.0%) | 13 (100.0%) |
Property Value to Household Income Ratio in Twin Bridges
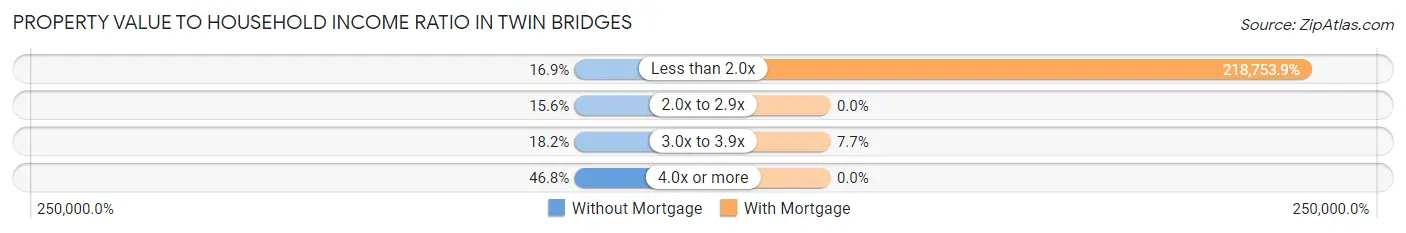
| Value-to-Income Ratio | Without Mortgage | With Mortgage |
| Less than 2.0x | 13 (16.9%) | 28,438 (218,753.9%) |
| 2.0x to 2.9x | 12 (15.6%) | 0 (0.0%) |
| 3.0x to 3.9x | 14 (18.2%) | 1 (7.7%) |
| 4.0x or more | 36 (46.8%) | 0 (0.0%) |
| Total | 77 (100.0%) | 13 (100.0%) |
Real Estate Taxes by Mortgage Status in Twin Bridges
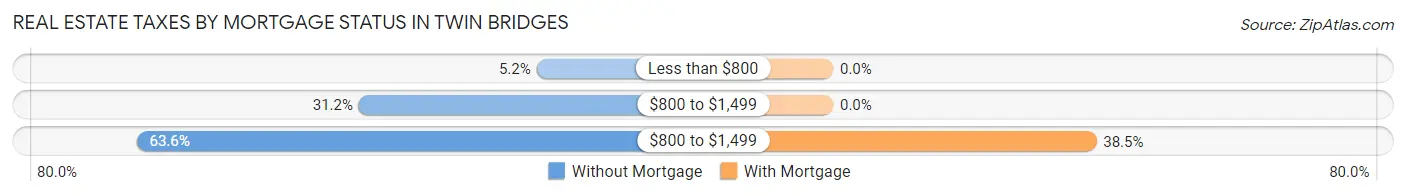
| Property Taxes | Without Mortgage | With Mortgage |
| Less than $800 | 4 (5.2%) | 0 (0.0%) |
| $800 to $1,499 | 24 (31.2%) | 0 (0.0%) |
| $800 to $1,499 | 49 (63.6%) | 5 (38.5%) |
| Total | 77 (100.0%) | 13 (100.0%) |
Health & Disability in Twin Bridges
Health Insurance Coverage by Age in Twin Bridges
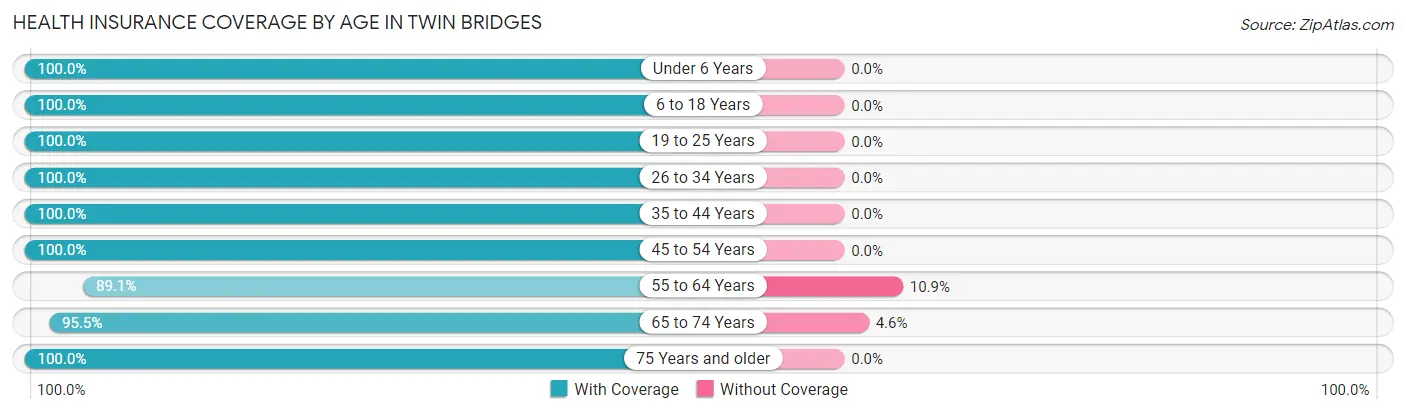
| Age Bracket | With Coverage | Without Coverage |
| Under 6 Years | 5 (100.0%) | 0 (0.0%) |
| 6 to 18 Years | 34 (100.0%) | 0 (0.0%) |
| 19 to 25 Years | 14 (100.0%) | 0 (0.0%) |
| 26 to 34 Years | 2 (100.0%) | 0 (0.0%) |
| 35 to 44 Years | 20 (100.0%) | 0 (0.0%) |
| 45 to 54 Years | 21 (100.0%) | 0 (0.0%) |
| 55 to 64 Years | 49 (89.1%) | 6 (10.9%) |
| 65 to 74 Years | 63 (95.5%) | 3 (4.5%) |
| 75 Years and older | 20 (100.0%) | 0 (0.0%) |
| Total | 228 (96.2%) | 9 (3.8%) |
Health Insurance Coverage by Citizenship Status in Twin Bridges
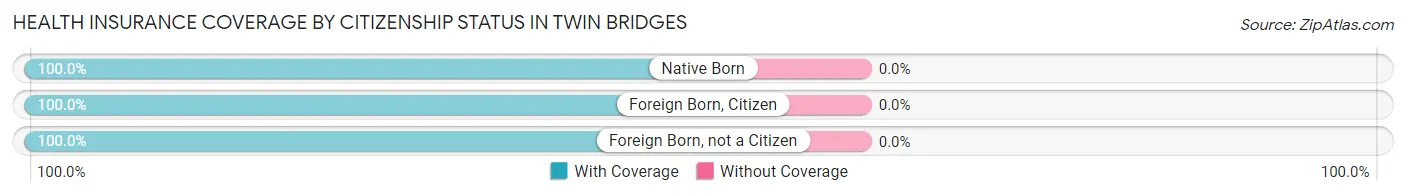
| Citizenship Status | With Coverage | Without Coverage |
| Native Born | 5 (100.0%) | 0 (0.0%) |
| Foreign Born, Citizen | 34 (100.0%) | 0 (0.0%) |
| Foreign Born, not a Citizen | 14 (100.0%) | 0 (0.0%) |
Health Insurance Coverage by Household Income in Twin Bridges
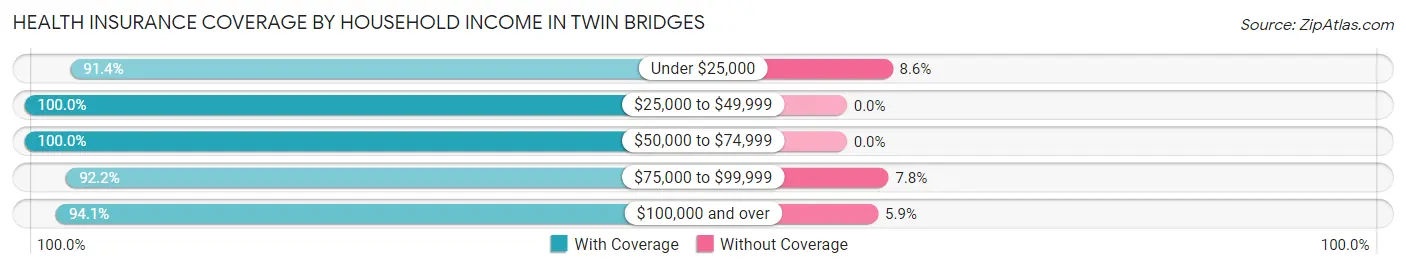
| Household Income | With Coverage | Without Coverage |
| Under $25,000 | 32 (91.4%) | 3 (8.6%) |
| $25,000 to $49,999 | 63 (100.0%) | 0 (0.0%) |
| $50,000 to $74,999 | 58 (100.0%) | 0 (0.0%) |
| $75,000 to $99,999 | 59 (92.2%) | 5 (7.8%) |
| $100,000 and over | 16 (94.1%) | 1 (5.9%) |
Public vs Private Health Insurance Coverage by Age in Twin Bridges
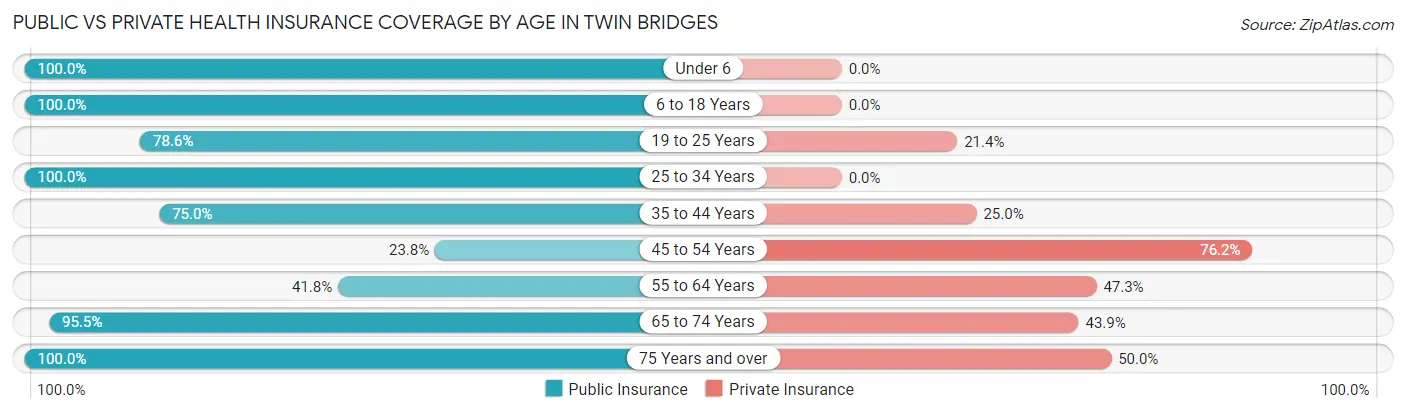
| Age Bracket | Public Insurance | Private Insurance |
| Under 6 | 5 (100.0%) | 0 (0.0%) |
| 6 to 18 Years | 34 (100.0%) | 0 (0.0%) |
| 19 to 25 Years | 11 (78.6%) | 3 (21.4%) |
| 25 to 34 Years | 2 (100.0%) | 0 (0.0%) |
| 35 to 44 Years | 15 (75.0%) | 5 (25.0%) |
| 45 to 54 Years | 5 (23.8%) | 16 (76.2%) |
| 55 to 64 Years | 23 (41.8%) | 26 (47.3%) |
| 65 to 74 Years | 63 (95.5%) | 29 (43.9%) |
| 75 Years and over | 20 (100.0%) | 10 (50.0%) |
| Total | 178 (75.1%) | 89 (37.6%) |
Disability Status by Sex by Age in Twin Bridges
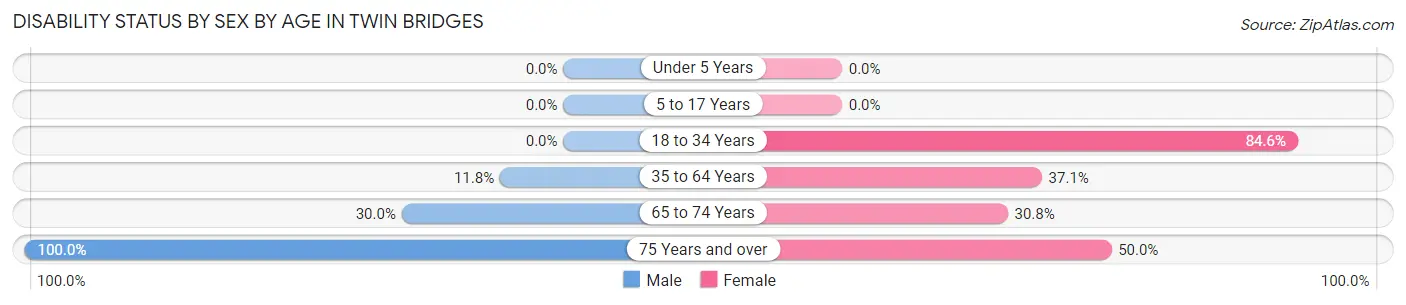
| Age Bracket | Male | Female |
| Under 5 Years | 0 (0.0%) | 0 (0.0%) |
| 5 to 17 Years | 0 (0.0%) | 0 (0.0%) |
| 18 to 34 Years | 0 (0.0%) | 11 (84.6%) |
| 35 to 64 Years | 4 (11.8%) | 23 (37.1%) |
| 65 to 74 Years | 12 (30.0%) | 8 (30.8%) |
| 75 Years and over | 10 (100.0%) | 5 (50.0%) |
Disability Class by Sex by Age in Twin Bridges
Disability Class: Hearing Difficulty
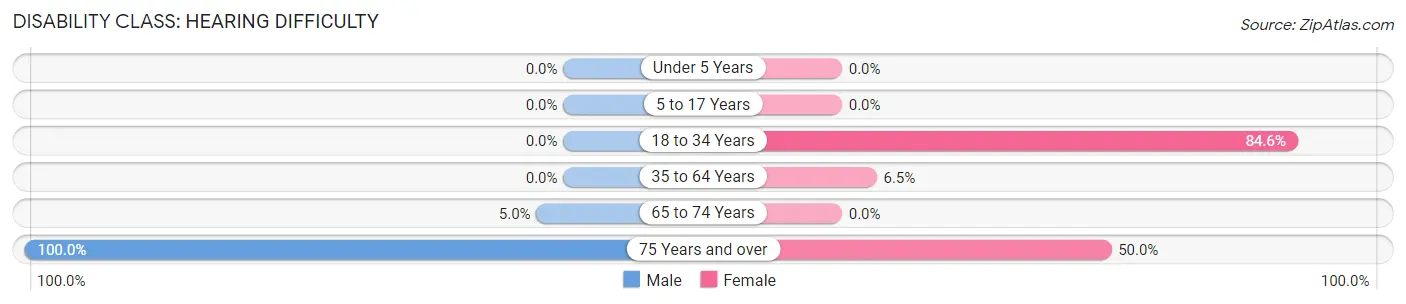
| Age Bracket | Male | Female |
| Under 5 Years | 0 (0.0%) | 0 (0.0%) |
| 5 to 17 Years | 0 (0.0%) | 0 (0.0%) |
| 18 to 34 Years | 0 (0.0%) | 11 (84.6%) |
| 35 to 64 Years | 0 (0.0%) | 4 (6.5%) |
| 65 to 74 Years | 2 (5.0%) | 0 (0.0%) |
| 75 Years and over | 10 (100.0%) | 5 (50.0%) |
Disability Class: Vision Difficulty
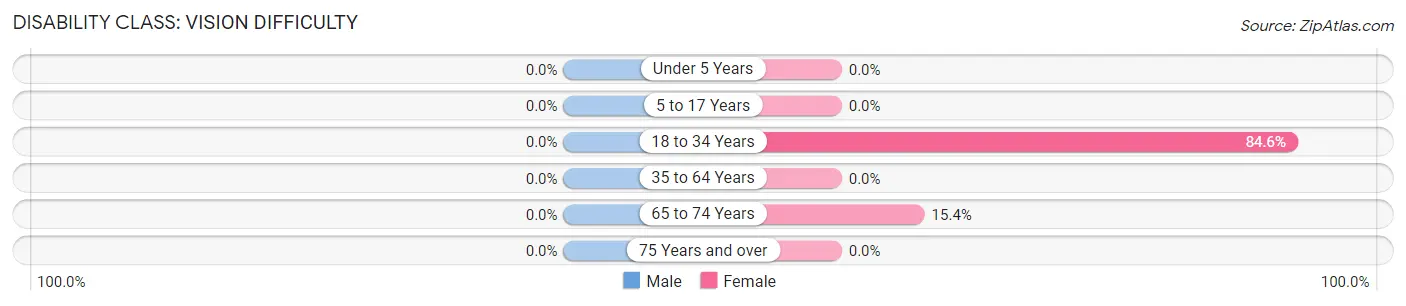
| Age Bracket | Male | Female |
| Under 5 Years | 0 (0.0%) | 0 (0.0%) |
| 5 to 17 Years | 0 (0.0%) | 0 (0.0%) |
| 18 to 34 Years | 0 (0.0%) | 11 (84.6%) |
| 35 to 64 Years | 0 (0.0%) | 0 (0.0%) |
| 65 to 74 Years | 0 (0.0%) | 4 (15.4%) |
| 75 Years and over | 0 (0.0%) | 0 (0.0%) |
Disability Class: Cognitive Difficulty
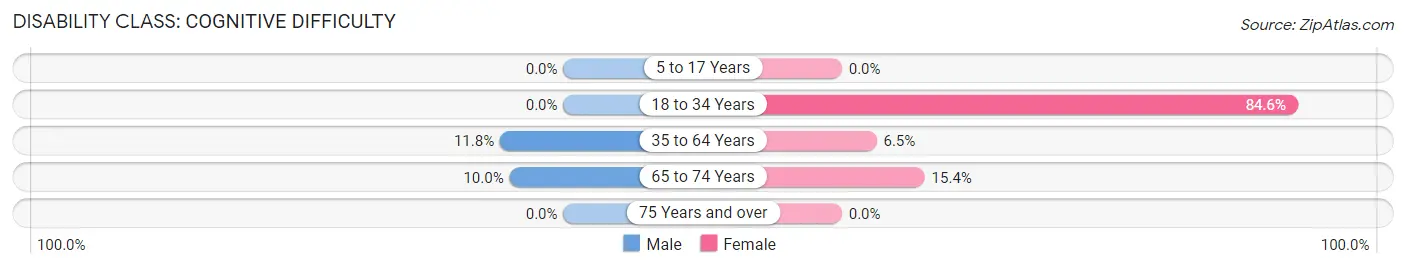
| Age Bracket | Male | Female |
| 5 to 17 Years | 0 (0.0%) | 0 (0.0%) |
| 18 to 34 Years | 0 (0.0%) | 11 (84.6%) |
| 35 to 64 Years | 4 (11.8%) | 4 (6.5%) |
| 65 to 74 Years | 4 (10.0%) | 4 (15.4%) |
| 75 Years and over | 0 (0.0%) | 0 (0.0%) |
Disability Class: Ambulatory Difficulty
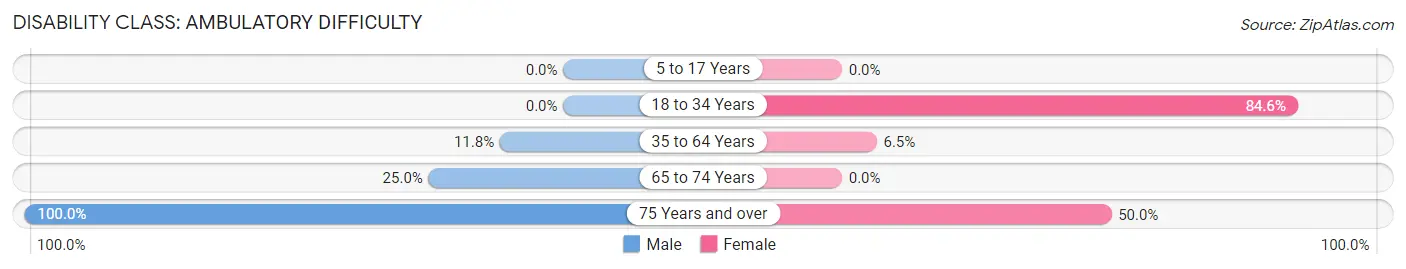
| Age Bracket | Male | Female |
| 5 to 17 Years | 0 (0.0%) | 0 (0.0%) |
| 18 to 34 Years | 0 (0.0%) | 11 (84.6%) |
| 35 to 64 Years | 4 (11.8%) | 4 (6.5%) |
| 65 to 74 Years | 10 (25.0%) | 0 (0.0%) |
| 75 Years and over | 10 (100.0%) | 5 (50.0%) |
Disability Class: Self-Care Difficulty
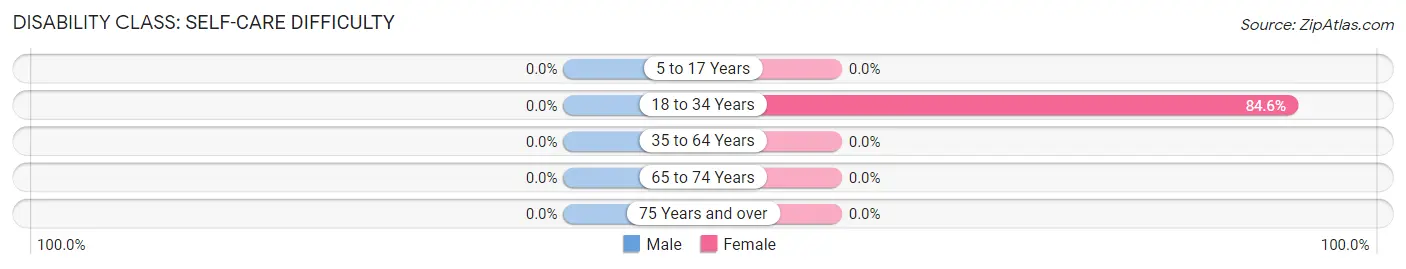
| Age Bracket | Male | Female |
| 5 to 17 Years | 0 (0.0%) | 0 (0.0%) |
| 18 to 34 Years | 0 (0.0%) | 11 (84.6%) |
| 35 to 64 Years | 0 (0.0%) | 0 (0.0%) |
| 65 to 74 Years | 0 (0.0%) | 0 (0.0%) |
| 75 Years and over | 0 (0.0%) | 0 (0.0%) |
Technology Access in Twin Bridges
Computing Device Access in Twin Bridges
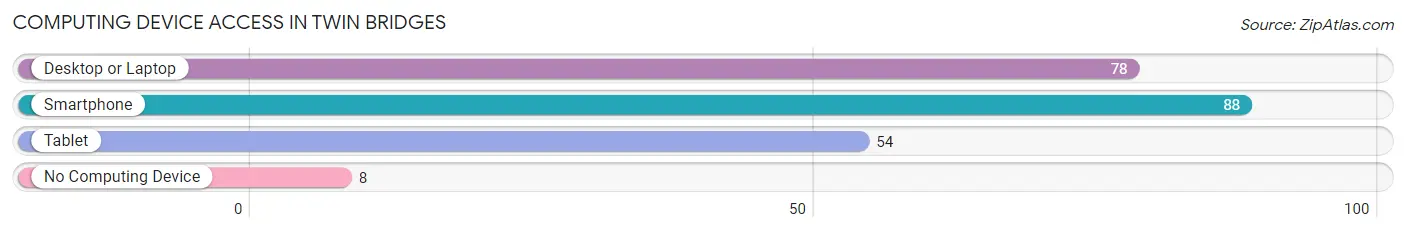
| Device Type | # Households | % Households |
| Desktop or Laptop | 78 | 67.2% |
| Smartphone | 88 | 75.9% |
| Tablet | 54 | 46.6% |
| No Computing Device | 8 | 6.9% |
| Total | 116 | 100.0% |
Internet Access in Twin Bridges
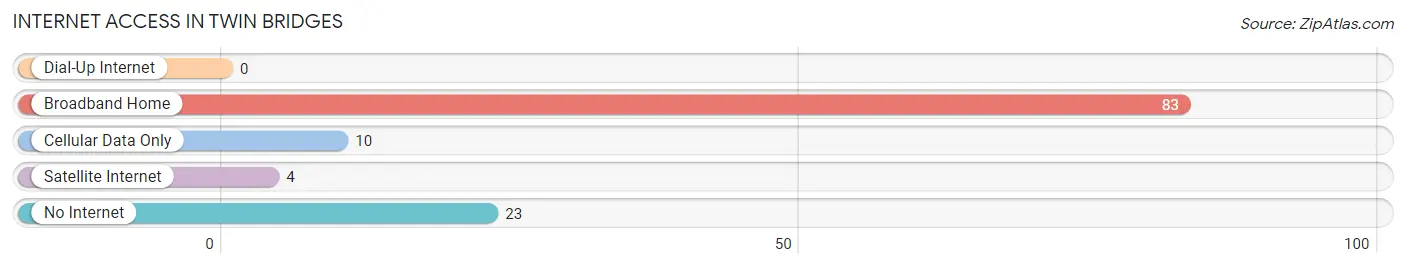
| Internet Type | # Households | % Households |
| Dial-Up Internet | 0 | 0.0% |
| Broadband Home | 83 | 71.6% |
| Cellular Data Only | 10 | 8.6% |
| Satellite Internet | 4 | 3.5% |
| No Internet | 23 | 19.8% |
| Total | 116 | 100.0% |
Twin Bridges Summary
Twin Bridges is a small town located in southwestern Montana, in Madison County. It is situated along the banks of the Ruby River, and is surrounded by the Tobacco Root Mountains. The town was founded in the late 1800s, and has a population of approximately 500 people.
History
Twin Bridges was founded in 1883 by two brothers, John and William Bridges. The brothers had come to the area to prospect for gold, but instead found a large deposit of copper. They decided to build a bridge across the Ruby River, and the town was named after them.
The town grew quickly, and soon became a hub for the surrounding area. It was a popular stop for travelers, and the local economy was based on ranching, farming, and mining. The town was also home to a number of saloons, hotels, and stores.
In the early 1900s, the town was connected to the rest of the state by the Montana Central Railway. This allowed for the transportation of goods and people, and helped to further develop the local economy.
Geography
Twin Bridges is located in southwestern Montana, in Madison County. It is situated along the banks of the Ruby River, and is surrounded by the Tobacco Root Mountains. The town is located at an elevation of 4,890 feet, and has a total area of 0.7 square miles.
The climate in Twin Bridges is semi-arid, with hot summers and cold winters. The average annual temperature is 44 degrees Fahrenheit, and the average annual precipitation is 12.5 inches.
Economy
The economy of Twin Bridges is based primarily on agriculture and tourism. The town is home to several farms, which produce hay, wheat, barley, and other crops. The local economy is also supported by tourism, as the town is a popular destination for outdoor activities such as fishing, hunting, and camping.
The town is also home to several businesses, including a grocery store, a hardware store, and a restaurant. There are also several bed and breakfasts in the area, as well as a few small hotels.
Demographics
As of the 2010 census, the population of Twin Bridges was 498. The racial makeup of the town was 97.2% White, 0.2% African American, 0.4% Native American, 0.2% Asian, 0.2% from other races, and 1.9% from two or more races. Hispanic or Latino of any race were 1.2% of the population.
The median household income in Twin Bridges was $37,500, and the median family income was $45,000. The per capita income was $19,000. About 11.2% of families and 14.2% of the population were below the poverty line, including 18.2% of those under age 18 and 8.3% of those age 65 or over.
Common Questions
What is Per Capita Income in Twin Bridges?
Per Capita income in Twin Bridges is $28,234.
What is the Median Family Income in Twin Bridges?
Median Family Income in Twin Bridges is $58,750.
What is the Median Household income in Twin Bridges?
Median Household Income in Twin Bridges is $53,500.
What is Income or Wage Gap in Twin Bridges?
Income or Wage Gap in Twin Bridges is 71.3%.
Women in Twin Bridges earn 28.7 cents for every dollar earned by a man.
What is Inequality or Gini Index in Twin Bridges?
Inequality or Gini Index in Twin Bridges is 0.33.
What is the Total Population of Twin Bridges?
Total Population of Twin Bridges is 237.
What is the Total Male Population of Twin Bridges?
Total Male Population of Twin Bridges is 112.
What is the Total Female Population of Twin Bridges?
Total Female Population of Twin Bridges is 125.
What is the Ratio of Males per 100 Females in Twin Bridges?
There are 89.60 Males per 100 Females in Twin Bridges.
What is the Ratio of Females per 100 Males in Twin Bridges?
There are 111.61 Females per 100 Males in Twin Bridges.
What is the Median Population Age in Twin Bridges?
Median Population Age in Twin Bridges is 61.2 Years.
What is the Average Family Size in Twin Bridges
Average Family Size in Twin Bridges is 3.1 People.
What is the Average Household Size in Twin Bridges
Average Household Size in Twin Bridges is 2.0 People.
How Large is the Labor Force in Twin Bridges?
There are 67 People in the Labor Forcein in Twin Bridges.
What is the Percentage of People in the Labor Force in Twin Bridges?
33.7% of People are in the Labor Force in Twin Bridges.