Springhill, MT Map & Demographics
Springhill Map
Springhill Overview
$37,670
PER CAPITA INCOME
$89,688
AVG FAMILY INCOME
$79,500
AVG HOUSEHOLD INCOME
8.7%
WAGE / INCOME GAP [ % ]
91.3¢/ $1
WAGE / INCOME GAP [ $ ]
0.30
INEQUALITY / GINI INDEX
199
TOTAL POPULATION
92
MALE POPULATION
107
FEMALE POPULATION
85.98
MALES / 100 FEMALES
116.30
FEMALES / 100 MALES
53.5
MEDIAN AGE
3.0
AVG FAMILY SIZE
2.5
AVG HOUSEHOLD SIZE
124
LABOR FORCE [ PEOPLE ]
70.9%
PERCENT IN LABOR FORCE
Income in Springhill
Income Overview in Springhill
Per Capita Income in Springhill is $37,670, while median incomes of families and households are $89,688 and $79,500 respectively.
| Characteristic | Number | Measure |
| Per Capita Income | 199 | $37,670 |
| Median Family Income | 43 | $89,688 |
| Mean Family Income | 43 | $109,707 |
| Median Household Income | 80 | $79,500 |
| Mean Household Income | 80 | $93,581 |
| Income Deficit | 43 | $0 |
| Wage / Income Gap (%) | 199 | 8.68% |
| Wage / Income Gap ($) | 199 | 91.32¢ per $1 |
| Gini / Inequality Index | 199 | 0.30 |
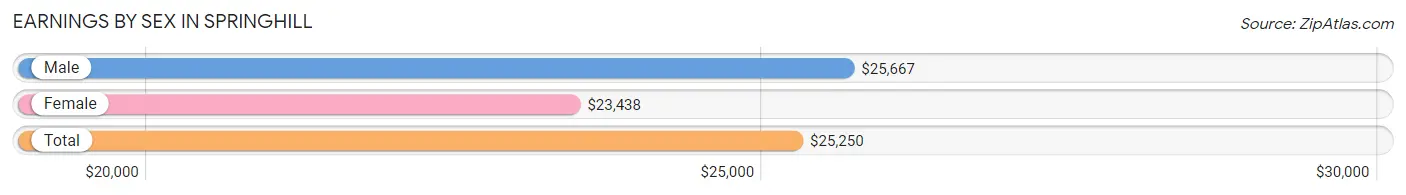
Earnings by Sex in Springhill
Average Earnings in Springhill are $25,250, $25,667 for men and $23,438 for women, a difference of 8.7%.
| Sex | Number | Average Earnings |
| Male | 92 (61.7%) | $25,667 |
| Female | 57 (38.3%) | $23,438 |
| Total | 149 (100.0%) | $25,250 |
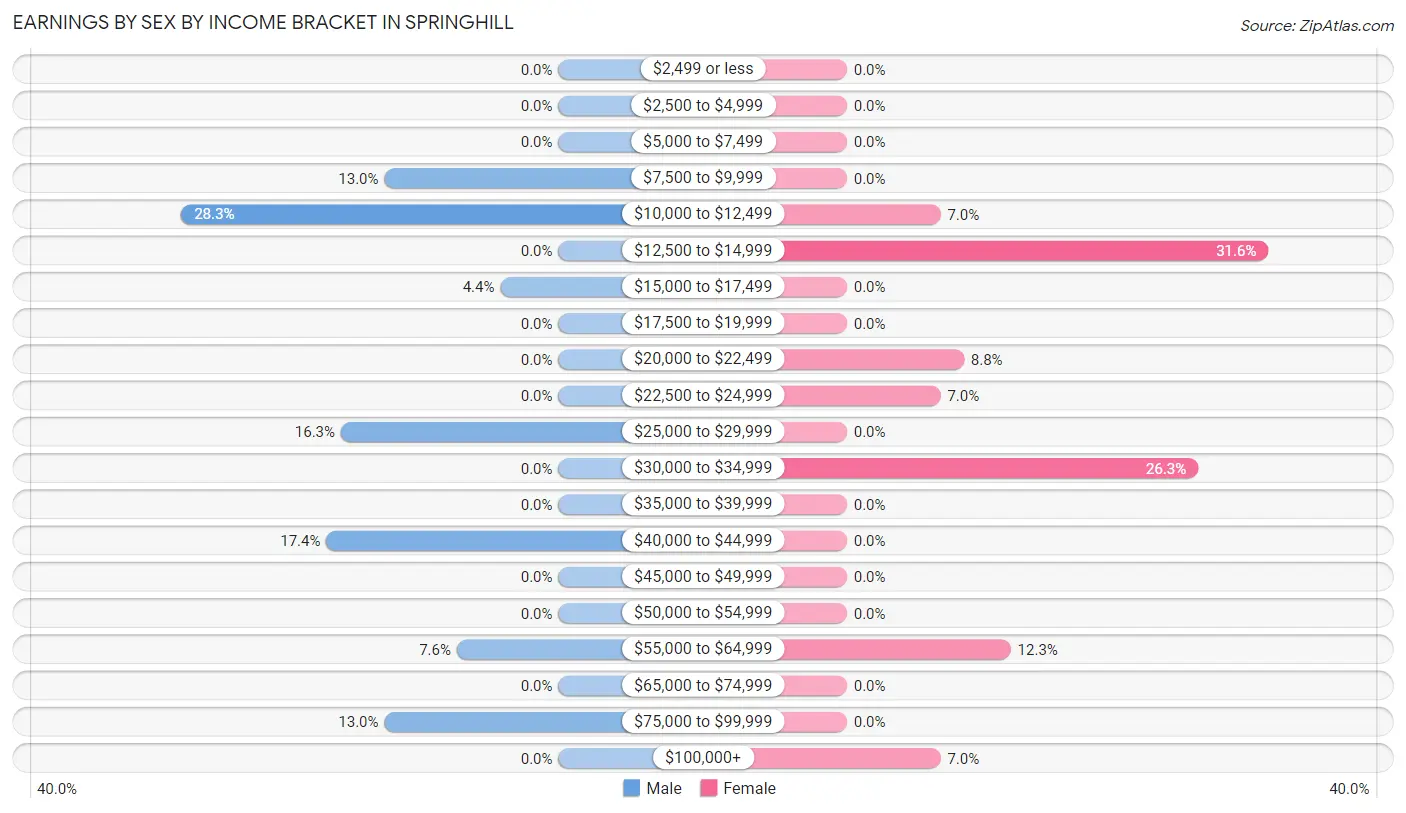
Earnings by Sex by Income Bracket in Springhill
The most common earnings brackets in Springhill are $10,000 to $12,499 for men (26 | 28.3%) and $12,500 to $14,999 for women (18 | 31.6%).
| Income | Male | Female |
| $2,499 or less | 0 (0.0%) | 0 (0.0%) |
| $2,500 to $4,999 | 0 (0.0%) | 0 (0.0%) |
| $5,000 to $7,499 | 0 (0.0%) | 0 (0.0%) |
| $7,500 to $9,999 | 12 (13.0%) | 0 (0.0%) |
| $10,000 to $12,499 | 26 (28.3%) | 4 (7.0%) |
| $12,500 to $14,999 | 0 (0.0%) | 18 (31.6%) |
| $15,000 to $17,499 | 4 (4.3%) | 0 (0.0%) |
| $17,500 to $19,999 | 0 (0.0%) | 0 (0.0%) |
| $20,000 to $22,499 | 0 (0.0%) | 5 (8.8%) |
| $22,500 to $24,999 | 0 (0.0%) | 4 (7.0%) |
| $25,000 to $29,999 | 15 (16.3%) | 0 (0.0%) |
| $30,000 to $34,999 | 0 (0.0%) | 15 (26.3%) |
| $35,000 to $39,999 | 0 (0.0%) | 0 (0.0%) |
| $40,000 to $44,999 | 16 (17.4%) | 0 (0.0%) |
| $45,000 to $49,999 | 0 (0.0%) | 0 (0.0%) |
| $50,000 to $54,999 | 0 (0.0%) | 0 (0.0%) |
| $55,000 to $64,999 | 7 (7.6%) | 7 (12.3%) |
| $65,000 to $74,999 | 0 (0.0%) | 0 (0.0%) |
| $75,000 to $99,999 | 12 (13.0%) | 0 (0.0%) |
| $100,000+ | 0 (0.0%) | 4 (7.0%) |
| Total | 92 (100.0%) | 57 (100.0%) |
Earnings by Sex by Educational Attainment in Springhill
| Educational Attainment | Male Income | Female Income |
| Less than High School | - | - |
| High School Diploma | - | - |
| College or Associate's Degree | - | - |
| Bachelor's Degree | - | - |
| Graduate Degree | - | - |
| Total | $25,667 | $31,083 |
Family Income in Springhill
Family Income Brackets in Springhill
According to the Springhill family income data, there are 28 families falling into the $75,000 to $99,999 income range, which is the most common income bracket and makes up 65.1% of all families.
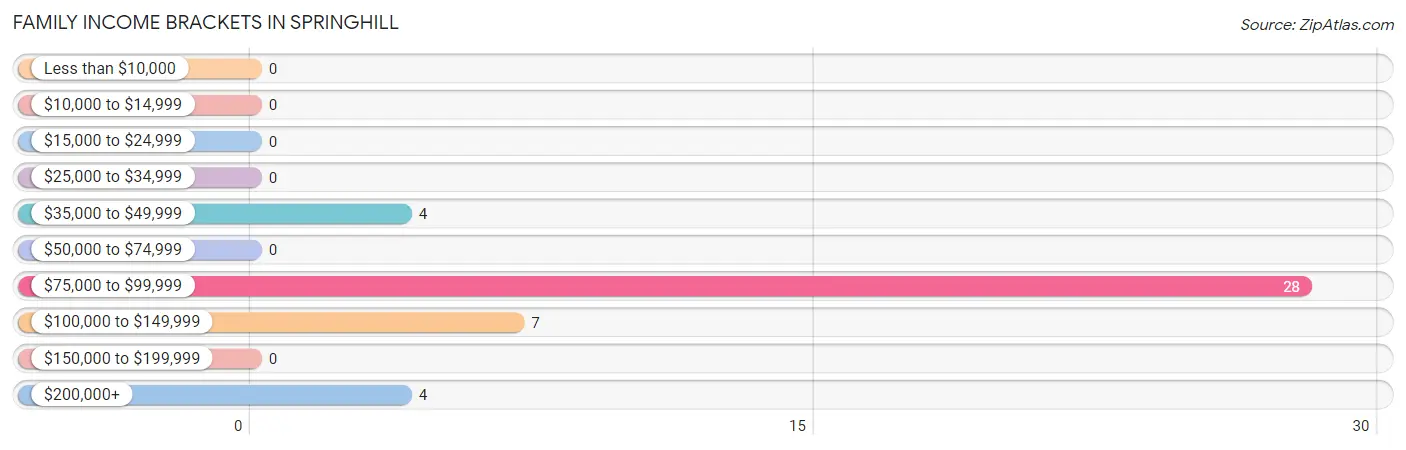
| Income Bracket | # Families | % Families |
| Less than $10,000 | 0 | 0.0% |
| $10,000 to $14,999 | 0 | 0.0% |
| $15,000 to $24,999 | 0 | 0.0% |
| $25,000 to $34,999 | 0 | 0.0% |
| $35,000 to $49,999 | 4 | 9.3% |
| $50,000 to $74,999 | 0 | 0.0% |
| $75,000 to $99,999 | 28 | 65.1% |
| $100,000 to $149,999 | 7 | 16.3% |
| $150,000 to $199,999 | 0 | 0.0% |
| $200,000+ | 4 | 9.3% |
Family Income by Famaliy Size in Springhill
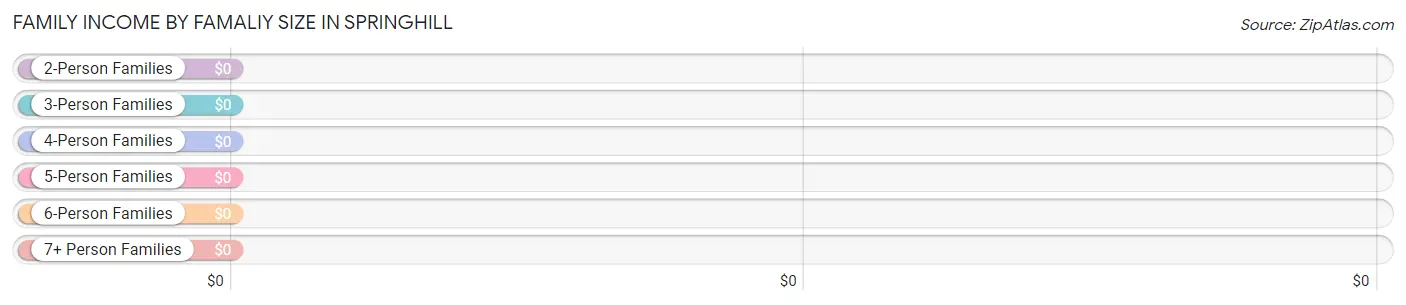
| Income Bracket | # Families | Median Income |
| 2-Person Families | 12 (27.9%) | $0 |
| 3-Person Families | 23 (53.5%) | $0 |
| 4-Person Families | 8 (18.6%) | $0 |
| 5-Person Families | 0 (0.0%) | $0 |
| 6-Person Families | 0 (0.0%) | $0 |
| 7+ Person Families | 0 (0.0%) | $0 |
| Total | 43 (100.0%) | $89,688 |
Family Income by Number of Earners in Springhill
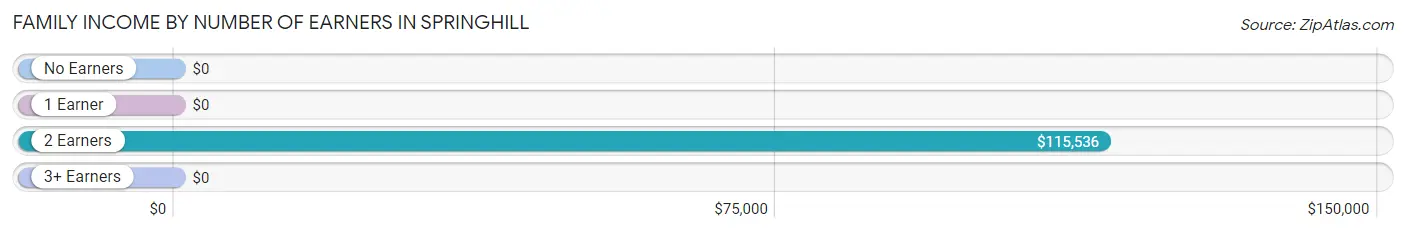
| Number of Earners | # Families | Median Income |
| No Earners | 0 (0.0%) | $0 |
| 1 Earner | 8 (18.6%) | $0 |
| 2 Earners | 19 (44.2%) | $115,536 |
| 3+ Earners | 16 (37.2%) | $0 |
| Total | 43 (100.0%) | $89,688 |
Household Income in Springhill
Household Income Brackets in Springhill
With 23 households falling in the category, the $100,000 to $149,999 income range is the most frequent in Springhill, accounting for 28.7% of all households.
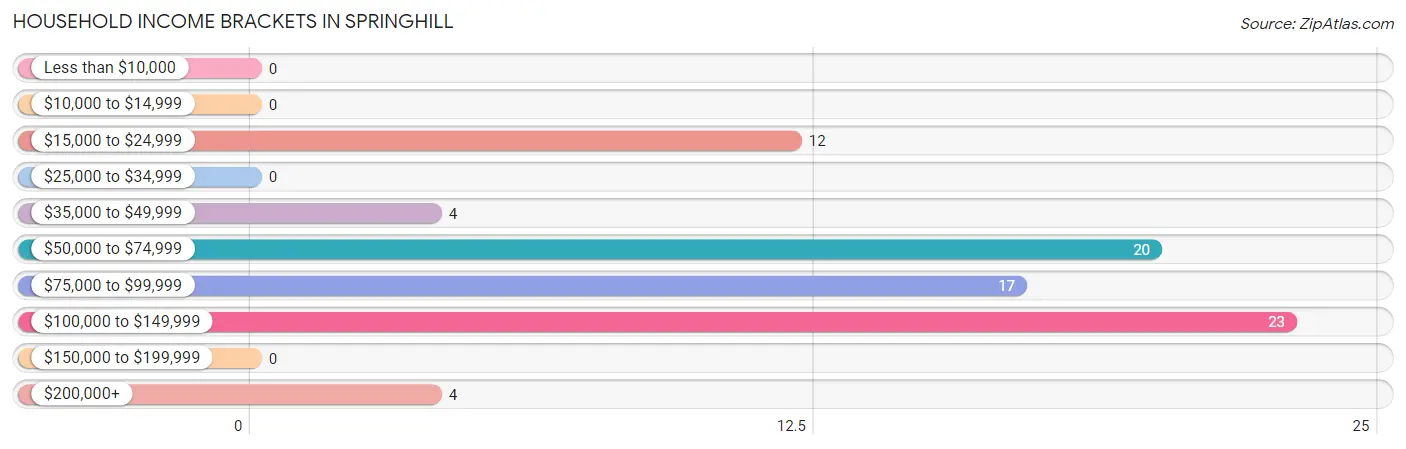
| Income Bracket | # Households | % Households |
| Less than $10,000 | 0 | 0.0% |
| $10,000 to $14,999 | 0 | 0.0% |
| $15,000 to $24,999 | 12 | 15.0% |
| $25,000 to $34,999 | 0 | 0.0% |
| $35,000 to $49,999 | 4 | 5.0% |
| $50,000 to $74,999 | 20 | 25.0% |
| $75,000 to $99,999 | 17 | 21.3% |
| $100,000 to $149,999 | 23 | 28.8% |
| $150,000 to $199,999 | 0 | 0.0% |
| $200,000+ | 4 | 5.0% |
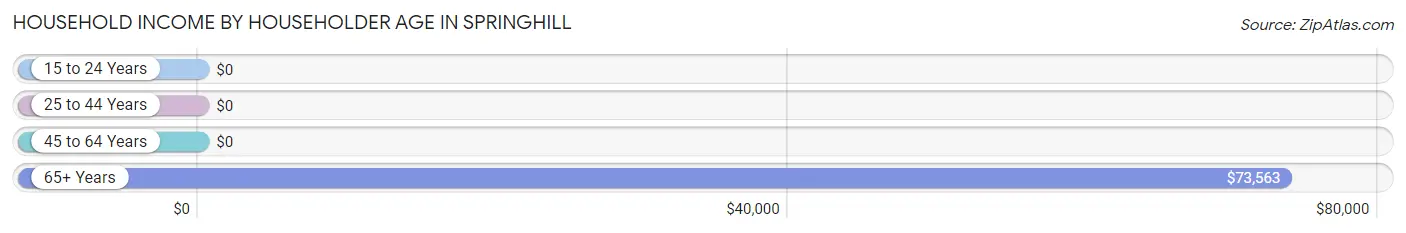
Household Income by Householder Age in Springhill
The median household income in Springhill is $79,500, with the highest median household income of $73,563 found in the 65+ years age bracket for the primary householder. A total of 41 households (51.2%) fall into this category.
| Income Bracket | # Households | Median Income |
| 15 to 24 Years | 0 (0.0%) | $0 |
| 25 to 44 Years | 16 (20.0%) | $0 |
| 45 to 64 Years | 23 (28.7%) | $0 |
| 65+ Years | 41 (51.2%) | $73,563 |
| Total | 80 (100.0%) | $79,500 |
Poverty in Springhill
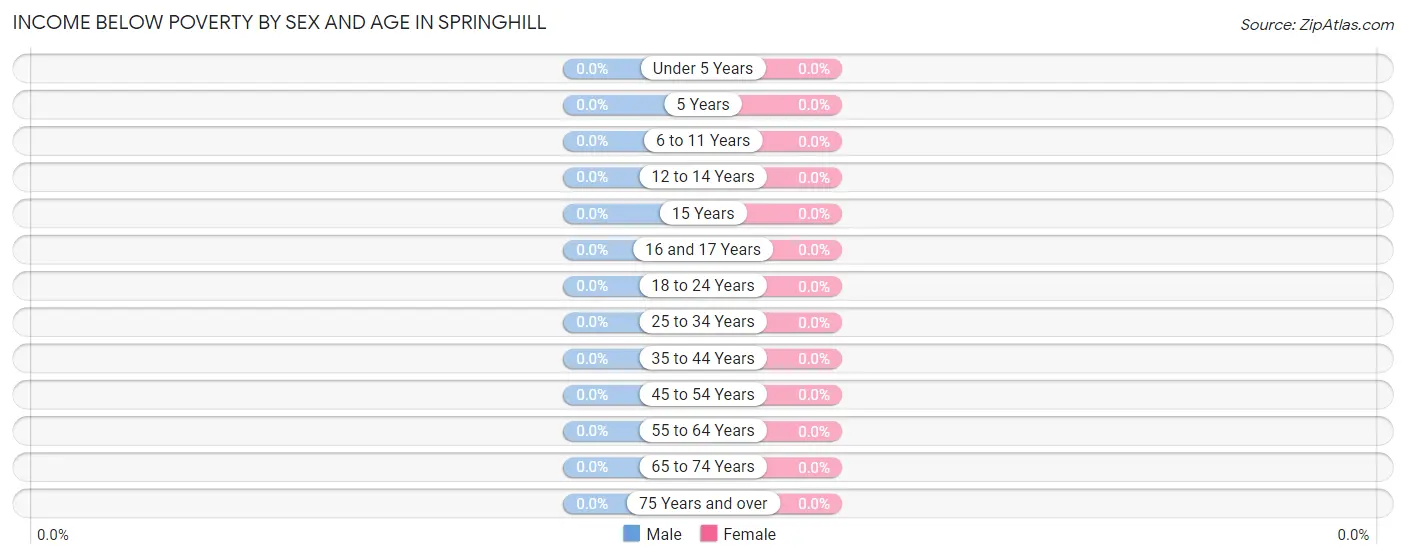
Income Below Poverty by Sex and Age in Springhill
| Age Bracket | Male | Female |
| Under 5 Years | 0 (0.0%) | 0 (0.0%) |
| 5 Years | 0 (0.0%) | 0 (0.0%) |
| 6 to 11 Years | 0 (0.0%) | 0 (0.0%) |
| 12 to 14 Years | 0 (0.0%) | 0 (0.0%) |
| 15 Years | 0 (0.0%) | 0 (0.0%) |
| 16 and 17 Years | 0 (0.0%) | 0 (0.0%) |
| 18 to 24 Years | 0 (0.0%) | 0 (0.0%) |
| 25 to 34 Years | 0 (0.0%) | 0 (0.0%) |
| 35 to 44 Years | 0 (0.0%) | 0 (0.0%) |
| 45 to 54 Years | 0 (0.0%) | 0 (0.0%) |
| 55 to 64 Years | 0 (0.0%) | 0 (0.0%) |
| 65 to 74 Years | 0 (0.0%) | 0 (0.0%) |
| 75 Years and over | 0 (0.0%) | 0 (0.0%) |
| Total | 0 (0.0%) | 0 (0.0%) |
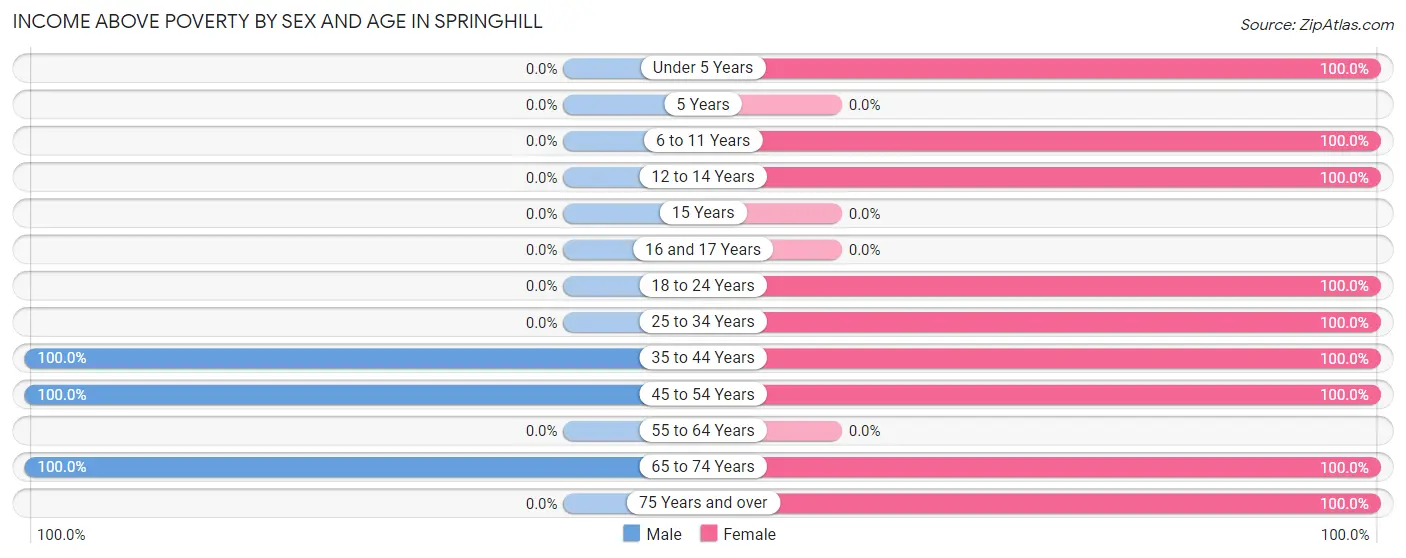
Income Above Poverty by Sex and Age in Springhill
According to the poverty statistics in Springhill, males aged 35 to 44 years and females aged under 5 years are the age groups that are most secure financially, with 100.0% of males and 100.0% of females in these age groups living above the poverty line.
| Age Bracket | Male | Female |
| Under 5 Years | 0 (0.0%) | 9 (100.0%) |
| 5 Years | 0 (0.0%) | 0 (0.0%) |
| 6 to 11 Years | 0 (0.0%) | 8 (100.0%) |
| 12 to 14 Years | 0 (0.0%) | 7 (100.0%) |
| 15 Years | 0 (0.0%) | 0 (0.0%) |
| 16 and 17 Years | 0 (0.0%) | 0 (0.0%) |
| 18 to 24 Years | 0 (0.0%) | 18 (100.0%) |
| 25 to 34 Years | 0 (0.0%) | 4 (100.0%) |
| 35 to 44 Years | 16 (100.0%) | 12 (100.0%) |
| 45 to 54 Years | 23 (100.0%) | 22 (100.0%) |
| 55 to 64 Years | 0 (0.0%) | 0 (0.0%) |
| 65 to 74 Years | 53 (100.0%) | 22 (100.0%) |
| 75 Years and over | 0 (0.0%) | 5 (100.0%) |
| Total | 92 (100.0%) | 107 (100.0%) |
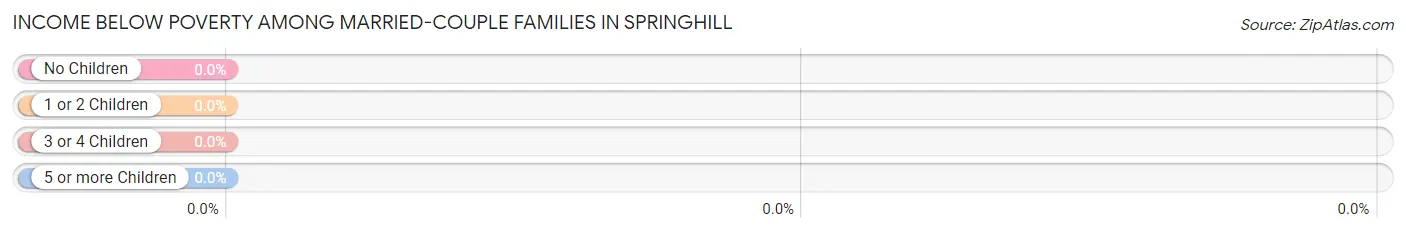
Income Below Poverty Among Married-Couple Families in Springhill
| Children | Above Poverty | Below Poverty |
| No Children | 28 (100.0%) | 0 (0.0%) |
| 1 or 2 Children | 15 (100.0%) | 0 (0.0%) |
| 3 or 4 Children | 0 (0.0%) | 0 (0.0%) |
| 5 or more Children | 0 (0.0%) | 0 (0.0%) |
| Total | 43 (100.0%) | 0 (0.0%) |
Income Below Poverty Among Single-Parent Households in Springhill
| Children | Single Father | Single Mother |
| No Children | 0 (0.0%) | 0 (0.0%) |
| 1 or 2 Children | 0 (0.0%) | 0 (0.0%) |
| 3 or 4 Children | 0 (0.0%) | 0 (0.0%) |
| 5 or more Children | 0 (0.0%) | 0 (0.0%) |
| Total | 0 (0.0%) | 0 (0.0%) |
Income Below Poverty Among Married-Couple vs Single-Parent Households in Springhill
| Children | Married-Couple Families | Single-Parent Households |
| No Children | 0 (0.0%) | 0 (0.0%) |
| 1 or 2 Children | 0 (0.0%) | 0 (0.0%) |
| 3 or 4 Children | 0 (0.0%) | 0 (0.0%) |
| 5 or more Children | 0 (0.0%) | 0 (0.0%) |
| Total | 0 (0.0%) | 0 (0.0%) |
Race in Springhill
The most populous races in Springhill are , and White / Caucasian (199 | 100.0%).
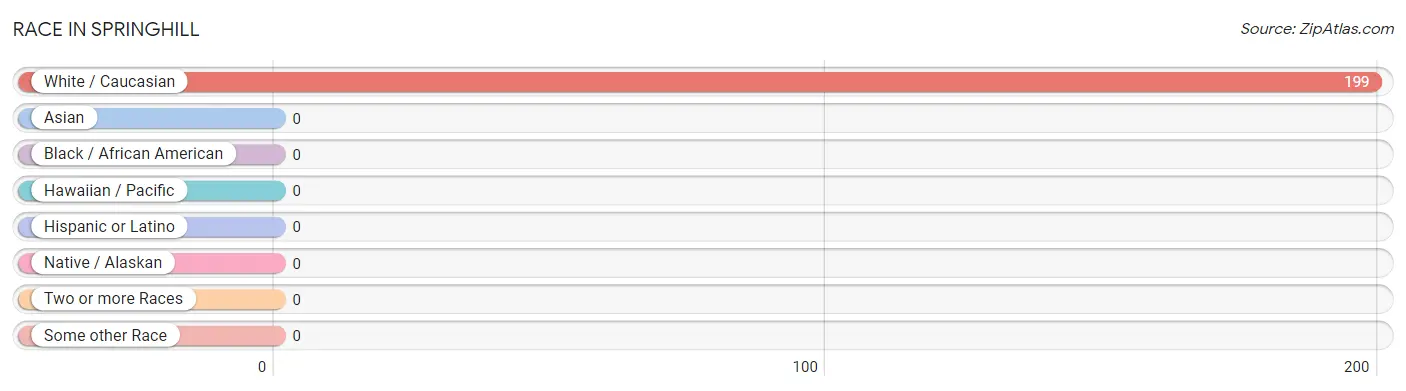
| Race | # Population | % Population |
| Asian | 0 | 0.0% |
| Black / African American | 0 | 0.0% |
| Hawaiian / Pacific | 0 | 0.0% |
| Hispanic or Latino | 0 | 0.0% |
| Native / Alaskan | 0 | 0.0% |
| White / Caucasian | 199 | 100.0% |
| Two or more Races | 0 | 0.0% |
| Some other Race | 0 | 0.0% |
| Total | 199 | 100.0% |
Ancestry in Springhill
The most populous ancestries reported in Springhill are Norwegian (63 | 31.7%), Danish (37 | 18.6%), Swedish (24 | 12.1%), German (21 | 10.5%), and Irish (18 | 9.0%), together accounting for 81.9% of all Springhill residents.
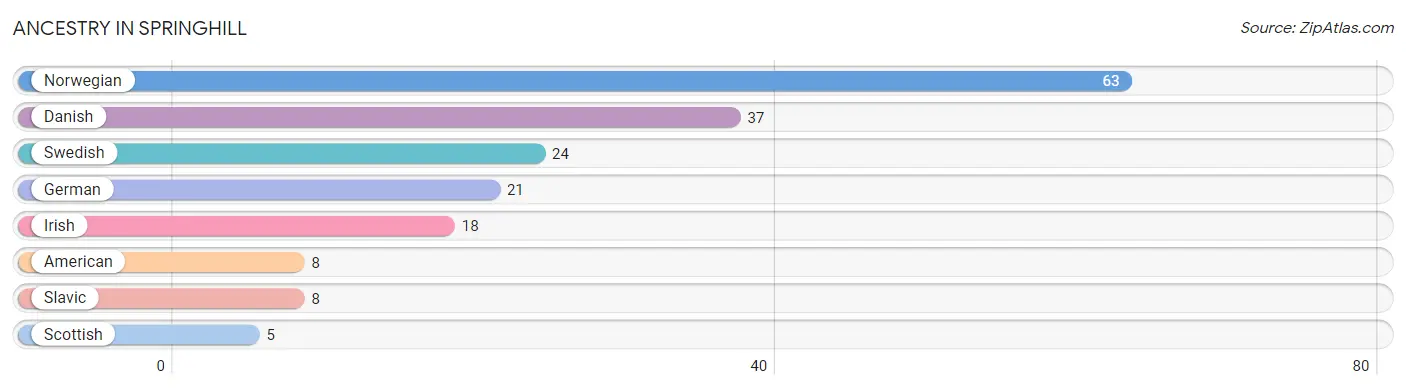
| Ancestry | # Population | % Population |
| American | 8 | 4.0% |
| Danish | 37 | 18.6% |
| German | 21 | 10.5% |
| Irish | 18 | 9.0% |
| Norwegian | 63 | 31.7% |
| Scottish | 5 | 2.5% |
| Slavic | 8 | 4.0% |
| Swedish | 24 | 12.1% | View All 8 Rows |
Immigrants in Springhill

| Immigration Origin | # Population | % Population | View All 0 Rows |
Sex and Age in Springhill
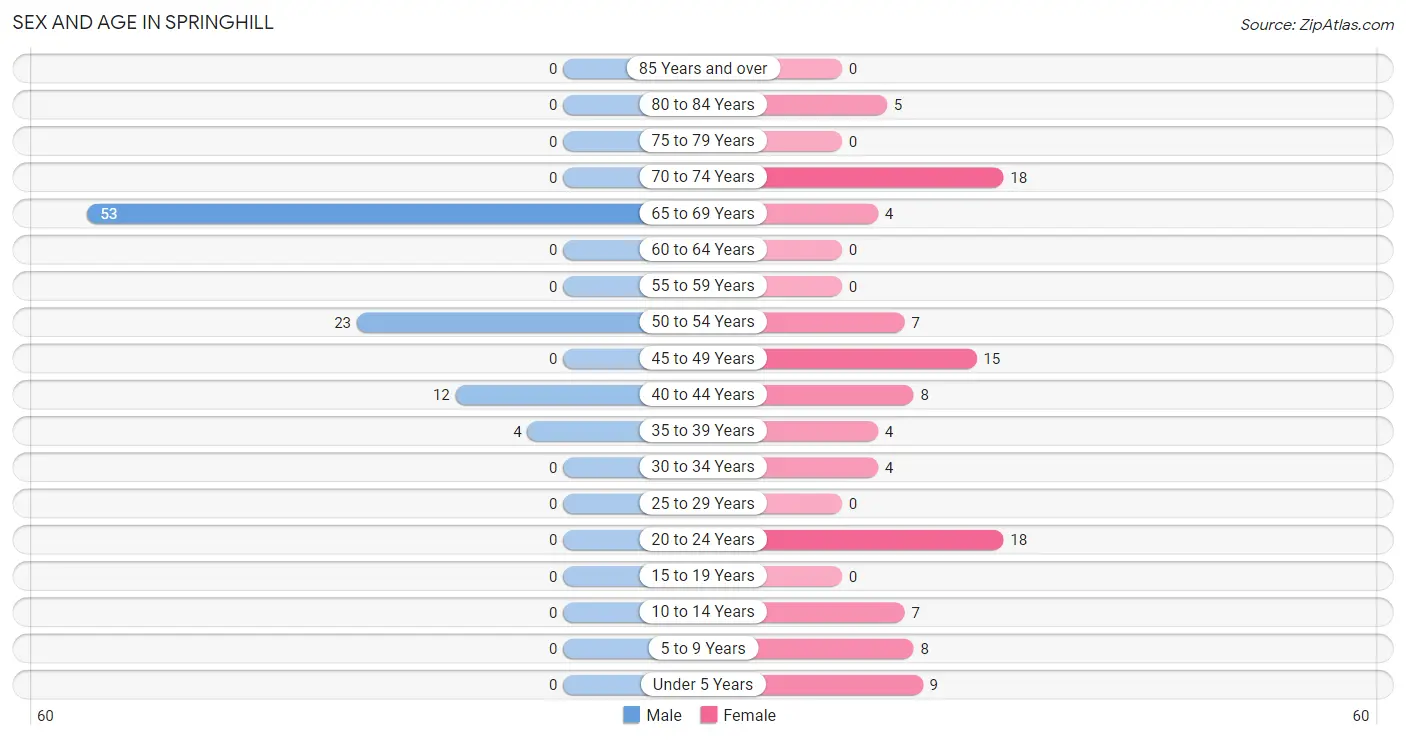
Sex and Age in Springhill
The most populous age groups in Springhill are 65 to 69 Years (53 | 57.6%) for men and 20 to 24 Years (18 | 16.8%) for women.
| Age Bracket | Male | Female |
| Under 5 Years | 0 (0.0%) | 9 (8.4%) |
| 5 to 9 Years | 0 (0.0%) | 8 (7.5%) |
| 10 to 14 Years | 0 (0.0%) | 7 (6.5%) |
| 15 to 19 Years | 0 (0.0%) | 0 (0.0%) |
| 20 to 24 Years | 0 (0.0%) | 18 (16.8%) |
| 25 to 29 Years | 0 (0.0%) | 0 (0.0%) |
| 30 to 34 Years | 0 (0.0%) | 4 (3.7%) |
| 35 to 39 Years | 4 (4.3%) | 4 (3.7%) |
| 40 to 44 Years | 12 (13.0%) | 8 (7.5%) |
| 45 to 49 Years | 0 (0.0%) | 15 (14.0%) |
| 50 to 54 Years | 23 (25.0%) | 7 (6.5%) |
| 55 to 59 Years | 0 (0.0%) | 0 (0.0%) |
| 60 to 64 Years | 0 (0.0%) | 0 (0.0%) |
| 65 to 69 Years | 53 (57.6%) | 4 (3.7%) |
| 70 to 74 Years | 0 (0.0%) | 18 (16.8%) |
| 75 to 79 Years | 0 (0.0%) | 0 (0.0%) |
| 80 to 84 Years | 0 (0.0%) | 5 (4.7%) |
| 85 Years and over | 0 (0.0%) | 0 (0.0%) |
| Total | 92 (100.0%) | 107 (100.0%) |
Families and Households in Springhill
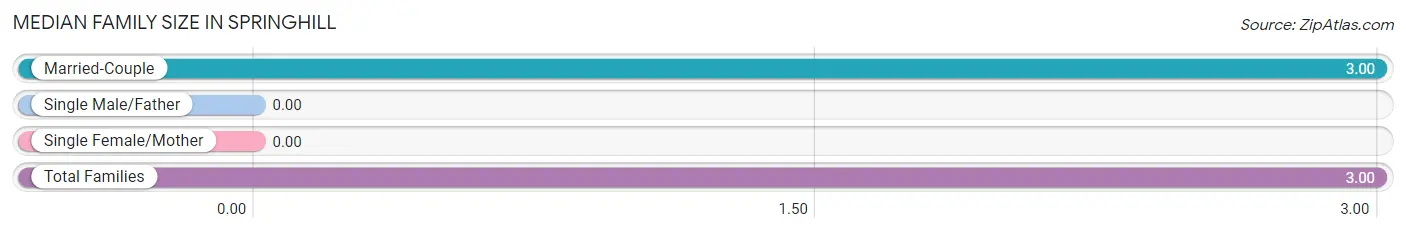
Median Family Size in Springhill
| Family Type | # Families | Family Size |
| Married-Couple | 43 (100.0%) | 3.00 |
| Single Male/Father | 0 (0.0%) | - |
| Single Female/Mother | 0 (0.0%) | - |
| Total Families | 43 (100.0%) | 3.00 |
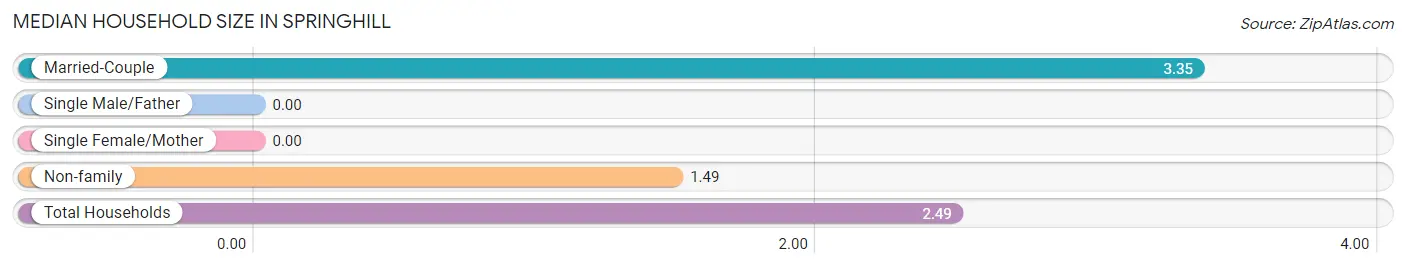
Median Household Size in Springhill
| Household Type | # Households | Household Size |
| Married-Couple | 43 (53.7%) | 3.35 |
| Single Male/Father | 0 (0.0%) | - |
| Single Female/Mother | 0 (0.0%) | - |
| Non-family | 37 (46.3%) | 1.49 |
| Total Households | 80 (100.0%) | 2.49 |
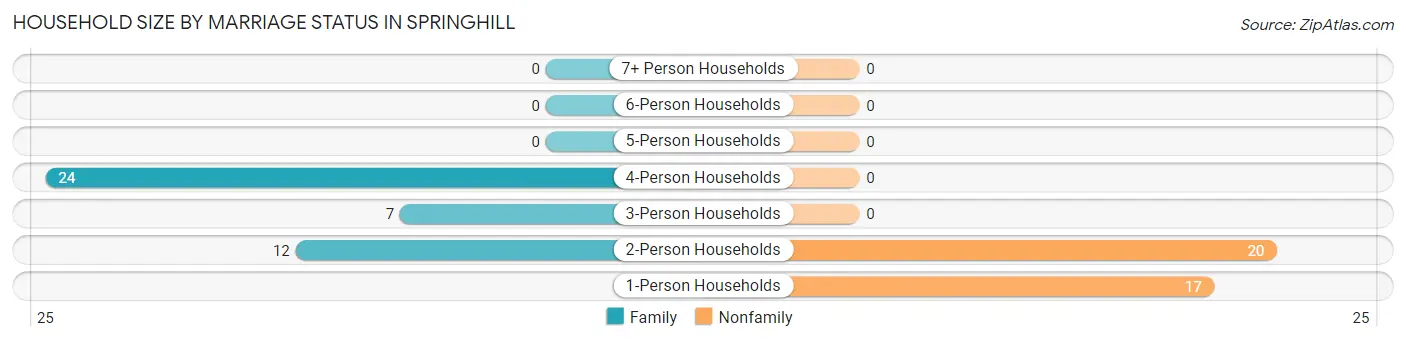
Household Size by Marriage Status in Springhill
Out of a total of 80 households in Springhill, 43 (53.7%) are family households, while 37 (46.3%) are nonfamily households. The most numerous type of family households are 4-person households, comprising 24, and the most common type of nonfamily households are 2-person households, comprising 20.
| Household Size | Family Households | Nonfamily Households |
| 1-Person Households | - | 17 (21.2%) |
| 2-Person Households | 12 (15.0%) | 20 (25.0%) |
| 3-Person Households | 7 (8.7%) | 0 (0.0%) |
| 4-Person Households | 24 (30.0%) | 0 (0.0%) |
| 5-Person Households | 0 (0.0%) | 0 (0.0%) |
| 6-Person Households | 0 (0.0%) | 0 (0.0%) |
| 7+ Person Households | 0 (0.0%) | 0 (0.0%) |
| Total | 43 (53.7%) | 37 (46.3%) |
Female Fertility in Springhill
Fertility by Age in Springhill
| Age Bracket | Women with Births | Births / 1,000 Women |
| 15 to 19 years | 0 (0.0%) | 0.0 |
| 20 to 34 years | 0 (0.0%) | 0.0 |
| 35 to 50 years | 0 (0.0%) | 0.0 |
| Total | 0 (0.0%) | 0.0 |
Fertility by Age by Marriage Status in Springhill
| Age Bracket | Married | Unmarried |
| 15 to 19 years | 0 (0.0%) | 0 (0.0%) |
| 20 to 34 years | 0 (0.0%) | 0 (0.0%) |
| 35 to 50 years | 0 (0.0%) | 0 (0.0%) |
| Total | 0 (0.0%) | 0 (0.0%) |
Fertility by Education in Springhill
| Educational Attainment | Women with Births | Births / 1,000 Women |
| Less than High School | 0 (0.0%) | 0.0 |
| High School Diploma | 0 (0.0%) | 0.0 |
| College or Associate's Degree | 0 (0.0%) | 0.0 |
| Bachelor's Degree | 0 (0.0%) | 0.0 |
| Graduate Degree | 0 (0.0%) | 0.0 |
| Total | 0 (0.0%) | 0.0 |
Fertility by Education by Marriage Status in Springhill
| Educational Attainment | Married | Unmarried |
| Less than High School | 0 (0.0%) | 0 (0.0%) |
| High School Diploma | 0 (0.0%) | 0 (0.0%) |
| College or Associate's Degree | 0 (0.0%) | 0 (0.0%) |
| Bachelor's Degree | 0 (0.0%) | 0 (0.0%) |
| Graduate Degree | 0 (0.0%) | 0 (0.0%) |
| Total | 0 (0.0%) | 0 (0.0%) |
Employment Characteristics in Springhill
Employment by Class of Employer in Springhill
Among the 124 employed individuals in Springhill, private company employees (70 | 56.5%), self-employed (not incorporated) (39 | 31.5%), and local government employees (15 | 12.1%) make up the most common classes of employment.
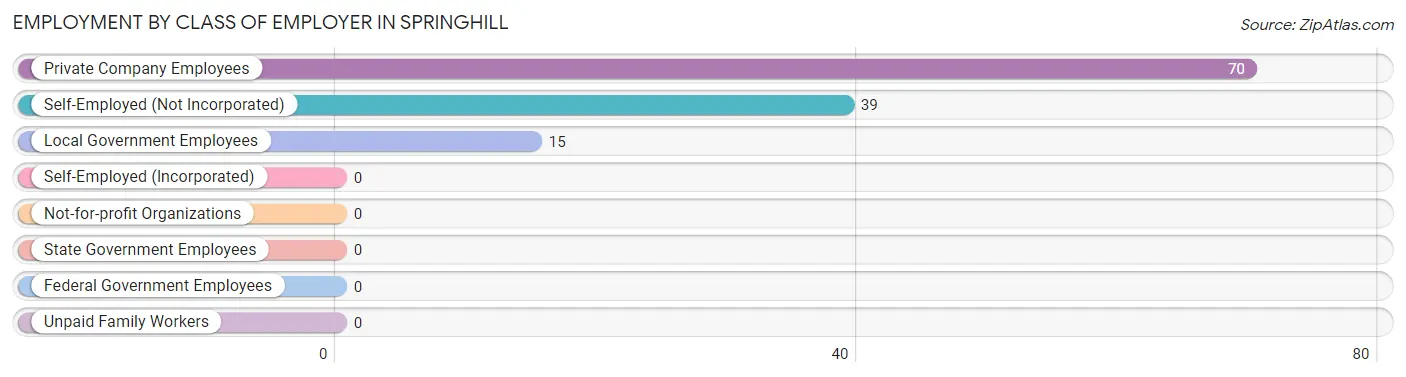
| Employer Class | # Employees | % Employees |
| Private Company Employees | 70 | 56.5% |
| Self-Employed (Incorporated) | 0 | 0.0% |
| Self-Employed (Not Incorporated) | 39 | 31.5% |
| Not-for-profit Organizations | 0 | 0.0% |
| Local Government Employees | 15 | 12.1% |
| State Government Employees | 0 | 0.0% |
| Federal Government Employees | 0 | 0.0% |
| Unpaid Family Workers | 0 | 0.0% |
| Total | 124 | 100.0% |
Employment Status by Age in Springhill
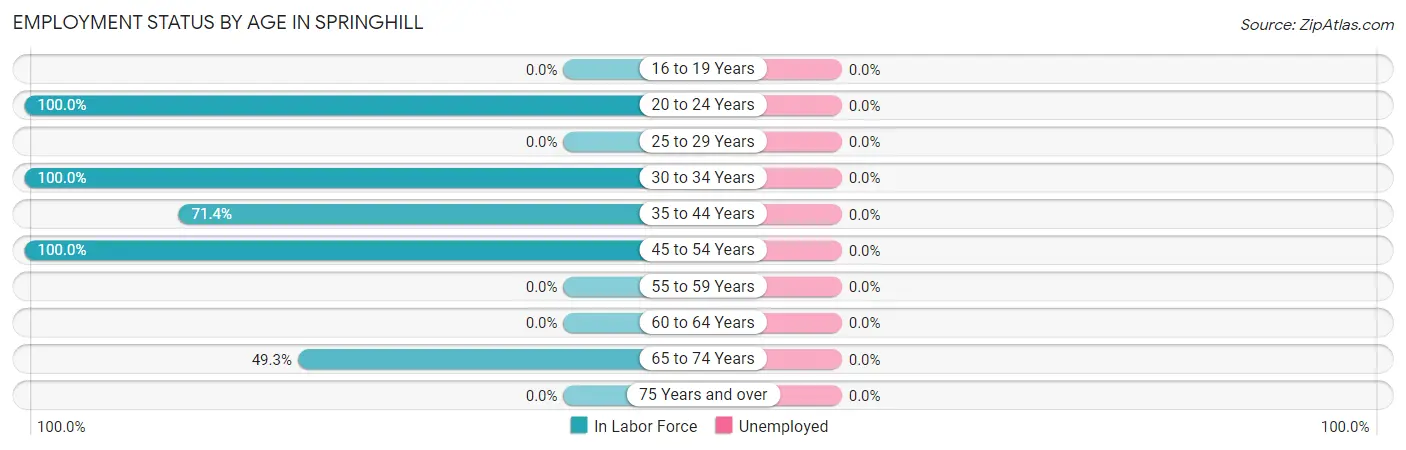
| Age Bracket | In Labor Force | Unemployed |
| 16 to 19 Years | 0 (0.0%) | 0 (0.0%) |
| 20 to 24 Years | 18 (100.0%) | 0 (0.0%) |
| 25 to 29 Years | 0 (0.0%) | 0 (0.0%) |
| 30 to 34 Years | 4 (100.0%) | 0 (0.0%) |
| 35 to 44 Years | 20 (71.4%) | 0 (0.0%) |
| 45 to 54 Years | 45 (100.0%) | 0 (0.0%) |
| 55 to 59 Years | 0 (0.0%) | 0 (0.0%) |
| 60 to 64 Years | 0 (0.0%) | 0 (0.0%) |
| 65 to 74 Years | 37 (49.3%) | 0 (0.0%) |
| 75 Years and over | 0 (0.0%) | 0 (0.0%) |
| Total | 124 (70.9%) | 0 (0.0%) |
Employment Status by Educational Attainment in Springhill
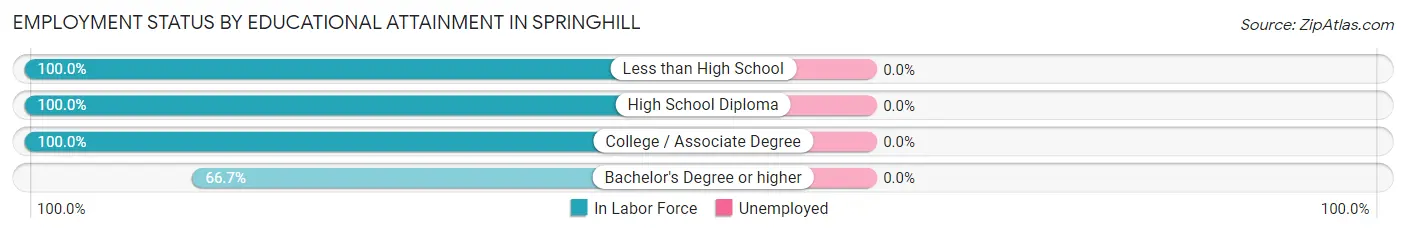
| Educational Attainment | In Labor Force | Unemployed |
| Less than High School | 16 (100.0%) | 0 (0.0%) |
| High School Diploma | 11 (100.0%) | 0 (0.0%) |
| College / Associate Degree | 26 (100.0%) | 0 (0.0%) |
| Bachelor's Degree or higher | 16 (66.7%) | 0 (0.0%) |
| Total | 69 (89.6%) | 0 (0.0%) |
Employment Occupations by Sex in Springhill
Management, Business, Science and Arts Occupations
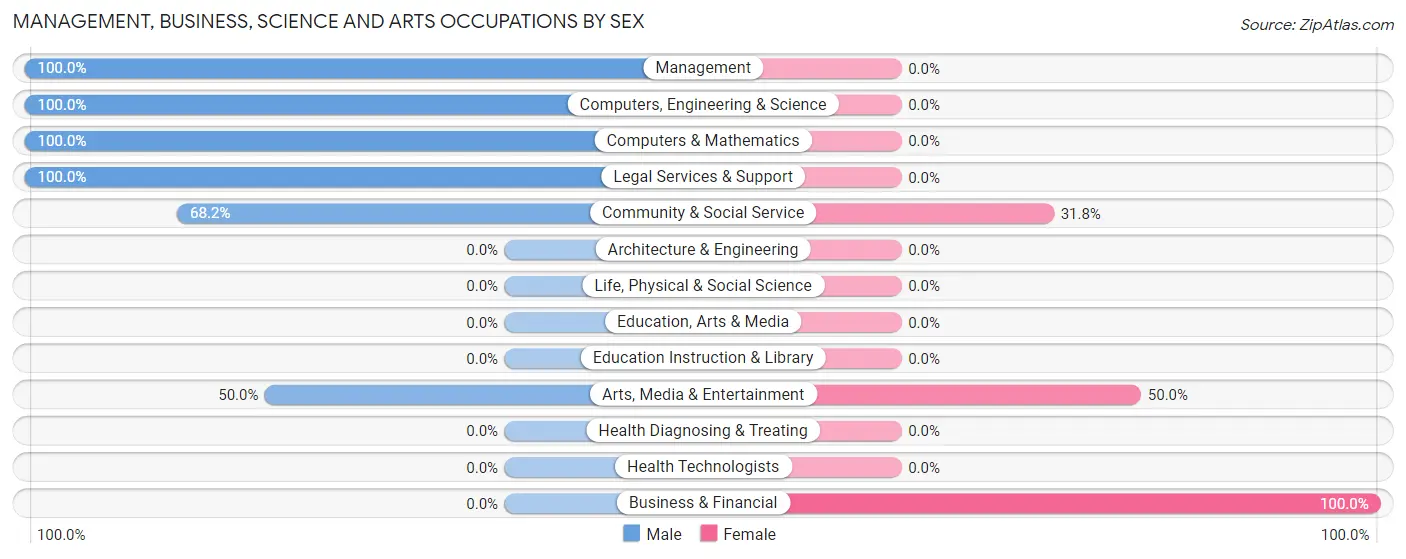
The most common Management, Business, Science and Arts occupations in Springhill are Community & Social Service (22 | 17.7%), Business & Financial (19 | 15.3%), Arts, Media & Entertainment (14 | 11.3%), Computers, Engineering & Science (12 | 9.7%), and Computers & Mathematics (12 | 9.7%).
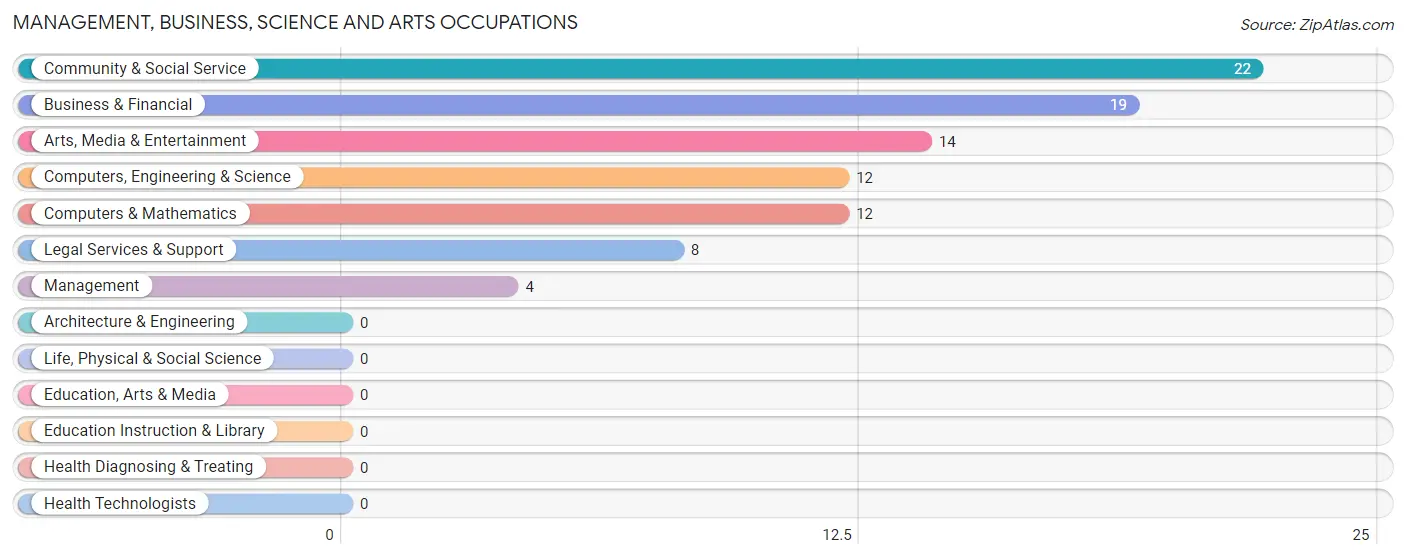
Management, Business, Science and Arts Occupations by Sex
Within the Management, Business, Science and Arts occupations in Springhill, the most male-oriented occupations are Management (100.0%), Computers, Engineering & Science (100.0%), and Computers & Mathematics (100.0%), while the most female-oriented occupations are Business & Financial (100.0%), Arts, Media & Entertainment (50.0%), and Community & Social Service (31.8%).
| Occupation | Male | Female |
| Management | 4 (100.0%) | 0 (0.0%) |
| Business & Financial | 0 (0.0%) | 19 (100.0%) |
| Computers, Engineering & Science | 12 (100.0%) | 0 (0.0%) |
| Computers & Mathematics | 12 (100.0%) | 0 (0.0%) |
| Architecture & Engineering | 0 (0.0%) | 0 (0.0%) |
| Life, Physical & Social Science | 0 (0.0%) | 0 (0.0%) |
| Community & Social Service | 15 (68.2%) | 7 (31.8%) |
| Education, Arts & Media | 0 (0.0%) | 0 (0.0%) |
| Legal Services & Support | 8 (100.0%) | 0 (0.0%) |
| Education Instruction & Library | 0 (0.0%) | 0 (0.0%) |
| Arts, Media & Entertainment | 7 (50.0%) | 7 (50.0%) |
| Health Diagnosing & Treating | 0 (0.0%) | 0 (0.0%) |
| Health Technologists | 0 (0.0%) | 0 (0.0%) |
| Total (Category) | 31 (54.4%) | 26 (45.6%) |
| Total (Overall) | 72 (58.1%) | 52 (41.9%) |
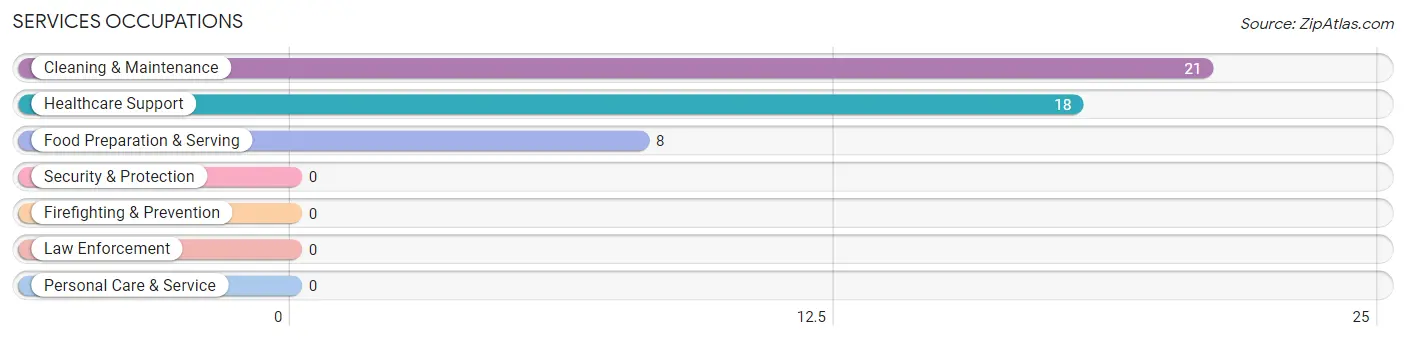
Services Occupations
The most common Services occupations in Springhill are Cleaning & Maintenance (21 | 16.9%), Healthcare Support (18 | 14.5%), and Food Preparation & Serving (8 | 6.5%).
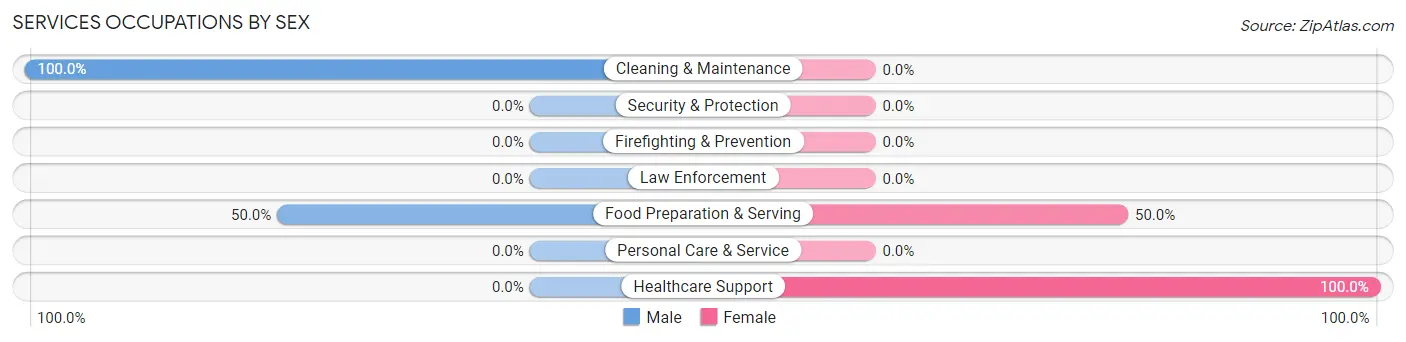
Services Occupations by Sex
Within the Services occupations in Springhill, the most male-oriented occupations are Cleaning & Maintenance (100.0%), and Food Preparation & Serving (50.0%), while the most female-oriented occupations are Healthcare Support (100.0%), and Food Preparation & Serving (50.0%).
| Occupation | Male | Female |
| Healthcare Support | 0 (0.0%) | 18 (100.0%) |
| Security & Protection | 0 (0.0%) | 0 (0.0%) |
| Firefighting & Prevention | 0 (0.0%) | 0 (0.0%) |
| Law Enforcement | 0 (0.0%) | 0 (0.0%) |
| Food Preparation & Serving | 4 (50.0%) | 4 (50.0%) |
| Cleaning & Maintenance | 21 (100.0%) | 0 (0.0%) |
| Personal Care & Service | 0 (0.0%) | 0 (0.0%) |
| Total (Category) | 25 (53.2%) | 22 (46.8%) |
| Total (Overall) | 72 (58.1%) | 52 (41.9%) |
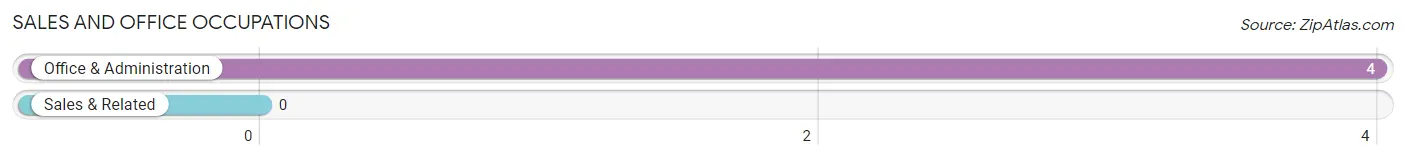
Sales and Office Occupations
The most common Sales and Office occupations in Springhill are , and Office & Administration (4 | 3.2%).
Sales and Office Occupations by Sex
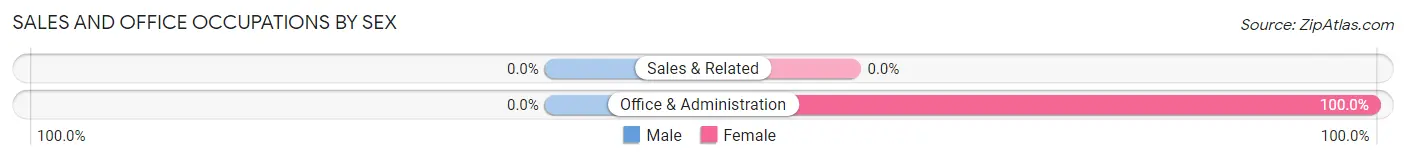
| Occupation | Male | Female |
| Sales & Related | 0 (0.0%) | 0 (0.0%) |
| Office & Administration | 0 (0.0%) | 4 (100.0%) |
| Total (Category) | 0 (0.0%) | 4 (100.0%) |
| Total (Overall) | 72 (58.1%) | 52 (41.9%) |
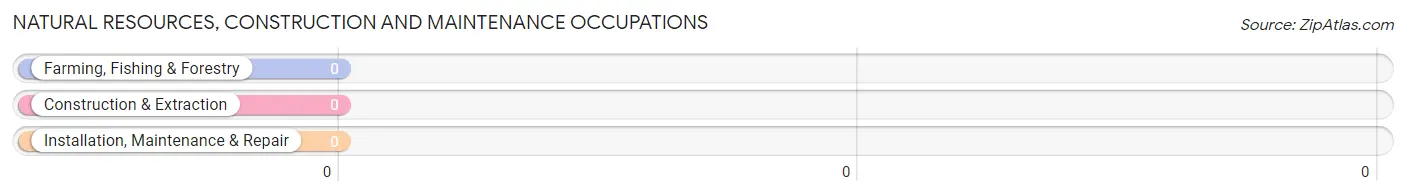
Natural Resources, Construction and Maintenance Occupations
Natural Resources, Construction and Maintenance Occupations by Sex
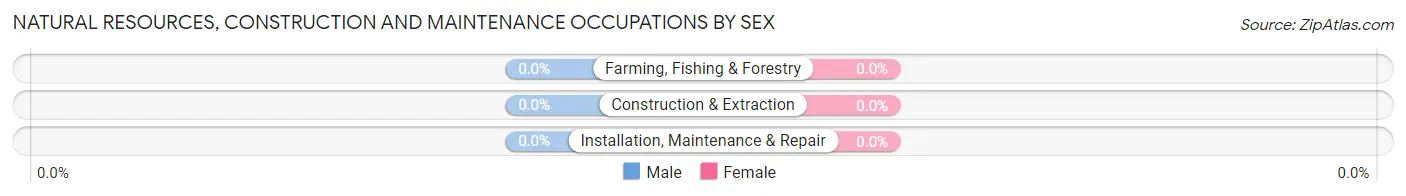
| Occupation | Male | Female |
| Farming, Fishing & Forestry | 0 (0.0%) | 0 (0.0%) |
| Construction & Extraction | 0 (0.0%) | 0 (0.0%) |
| Installation, Maintenance & Repair | 0 (0.0%) | 0 (0.0%) |
| Total (Category) | 0 (0.0%) | 0 (0.0%) |
| Total (Overall) | 72 (58.1%) | 52 (41.9%) |
Production, Transportation and Moving Occupations
The most common Production, Transportation and Moving occupations in Springhill are , and Transportation (16 | 12.9%).
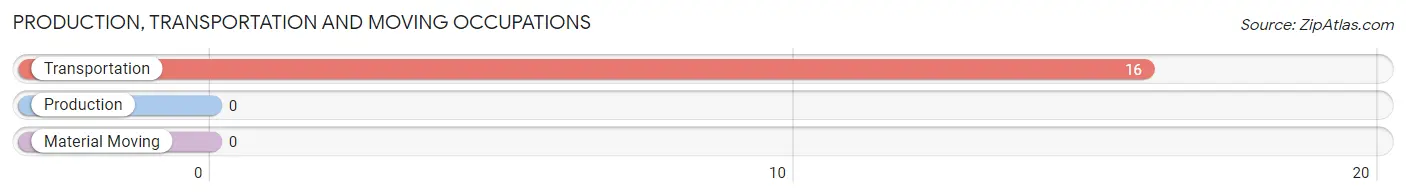
Production, Transportation and Moving Occupations by Sex
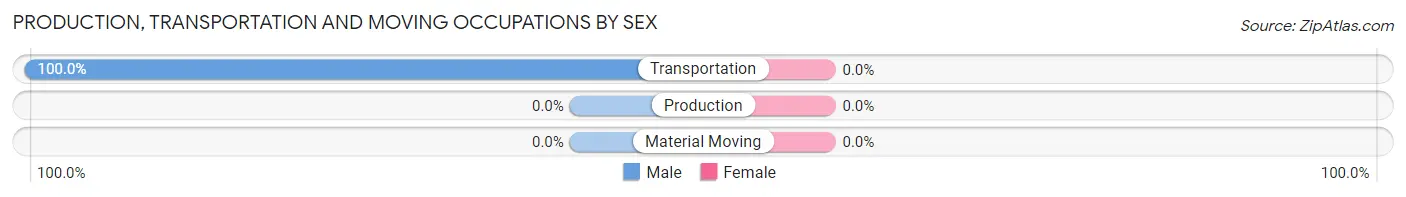
| Occupation | Male | Female |
| Production | 0 (0.0%) | 0 (0.0%) |
| Transportation | 16 (100.0%) | 0 (0.0%) |
| Material Moving | 0 (0.0%) | 0 (0.0%) |
| Total (Category) | 16 (100.0%) | 0 (0.0%) |
| Total (Overall) | 72 (58.1%) | 52 (41.9%) |
Employment Industries by Sex in Springhill
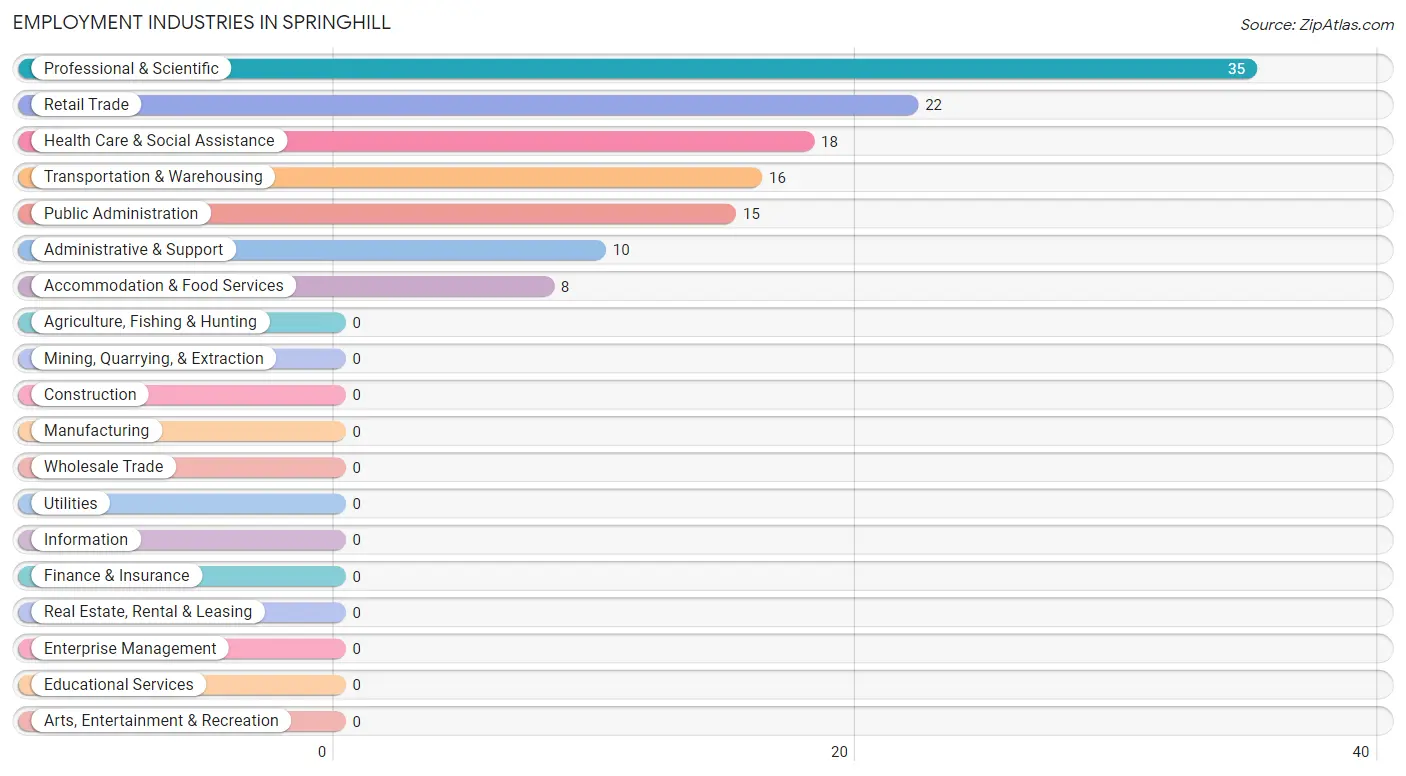
Employment Industries in Springhill
The major employment industries in Springhill include Professional & Scientific (35 | 28.2%), Retail Trade (22 | 17.7%), Health Care & Social Assistance (18 | 14.5%), Transportation & Warehousing (16 | 12.9%), and Public Administration (15 | 12.1%).
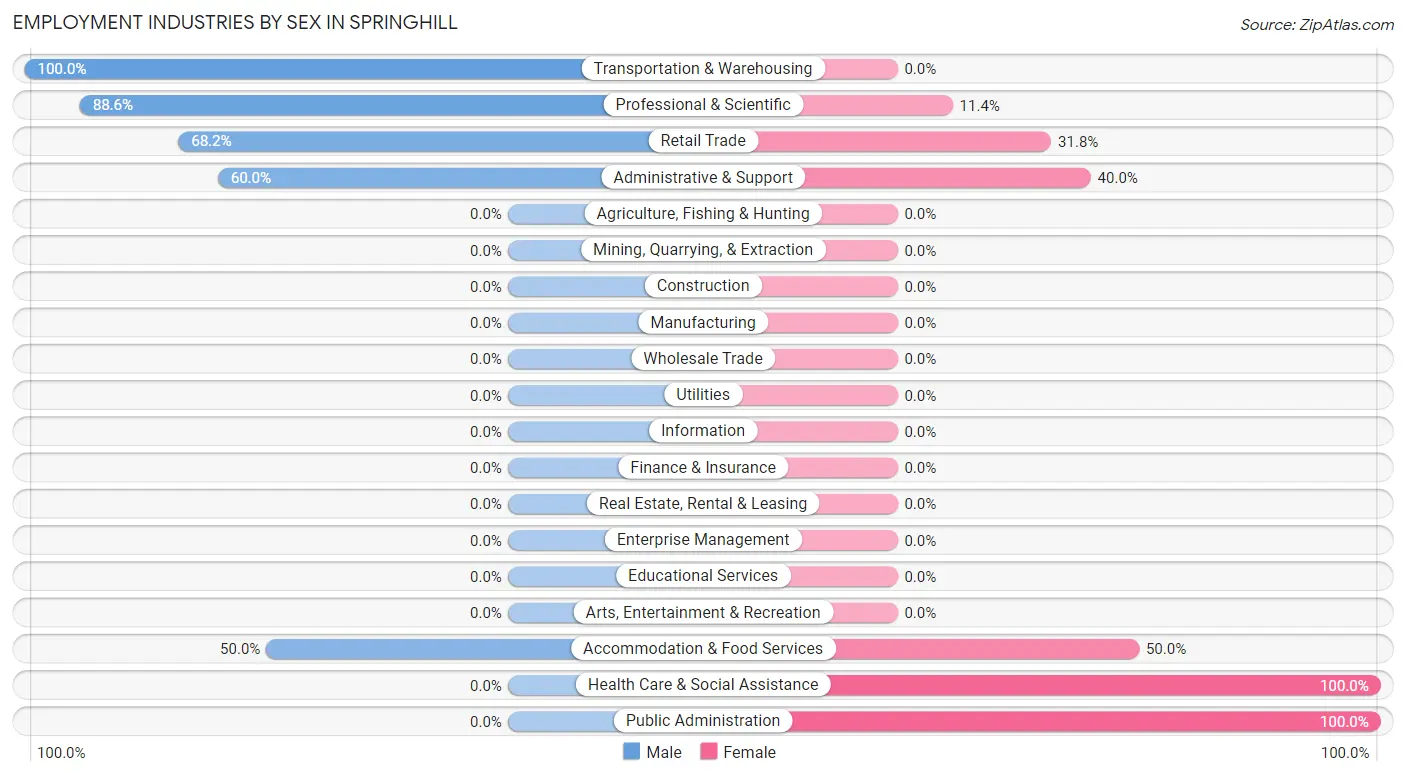
Employment Industries by Sex in Springhill
The Springhill industries that see more men than women are Transportation & Warehousing (100.0%), Professional & Scientific (88.6%), and Retail Trade (68.2%), whereas the industries that tend to have a higher number of women are Health Care & Social Assistance (100.0%), Public Administration (100.0%), and Accommodation & Food Services (50.0%).
| Industry | Male | Female |
| Agriculture, Fishing & Hunting | 0 (0.0%) | 0 (0.0%) |
| Mining, Quarrying, & Extraction | 0 (0.0%) | 0 (0.0%) |
| Construction | 0 (0.0%) | 0 (0.0%) |
| Manufacturing | 0 (0.0%) | 0 (0.0%) |
| Wholesale Trade | 0 (0.0%) | 0 (0.0%) |
| Retail Trade | 15 (68.2%) | 7 (31.8%) |
| Transportation & Warehousing | 16 (100.0%) | 0 (0.0%) |
| Utilities | 0 (0.0%) | 0 (0.0%) |
| Information | 0 (0.0%) | 0 (0.0%) |
| Finance & Insurance | 0 (0.0%) | 0 (0.0%) |
| Real Estate, Rental & Leasing | 0 (0.0%) | 0 (0.0%) |
| Professional & Scientific | 31 (88.6%) | 4 (11.4%) |
| Enterprise Management | 0 (0.0%) | 0 (0.0%) |
| Administrative & Support | 6 (60.0%) | 4 (40.0%) |
| Educational Services | 0 (0.0%) | 0 (0.0%) |
| Health Care & Social Assistance | 0 (0.0%) | 18 (100.0%) |
| Arts, Entertainment & Recreation | 0 (0.0%) | 0 (0.0%) |
| Accommodation & Food Services | 4 (50.0%) | 4 (50.0%) |
| Public Administration | 0 (0.0%) | 15 (100.0%) |
| Total | 72 (58.1%) | 52 (41.9%) |
Education in Springhill
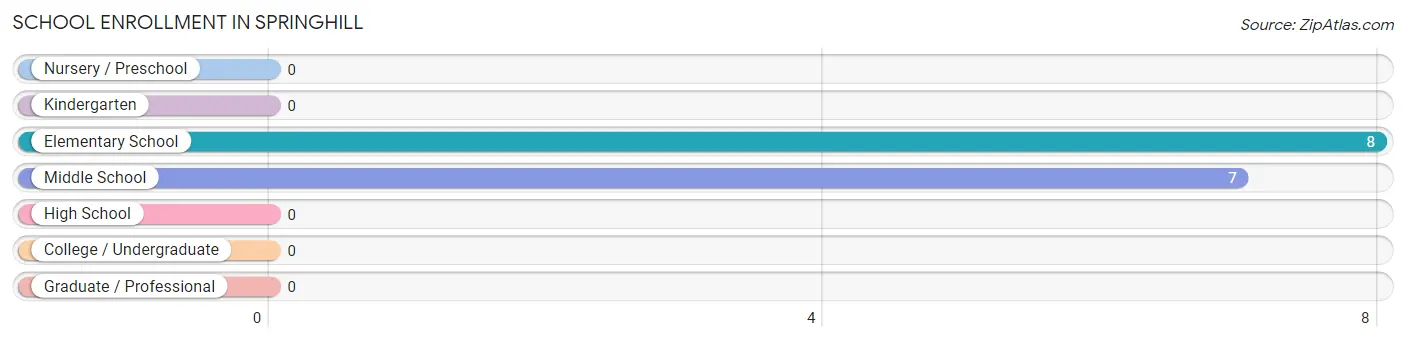
School Enrollment in Springhill
The most common levels of schooling among the 15 students in Springhill are elementary school (8 | 53.3%), and middle school (7 | 46.7%).
| School Level | # Students | % Students |
| Nursery / Preschool | 0 | 0.0% |
| Kindergarten | 0 | 0.0% |
| Elementary School | 8 | 53.3% |
| Middle School | 7 | 46.7% |
| High School | 0 | 0.0% |
| College / Undergraduate | 0 | 0.0% |
| Graduate / Professional | 0 | 0.0% |
| Total | 15 | 100.0% |
School Enrollment by Age by Funding Source in Springhill
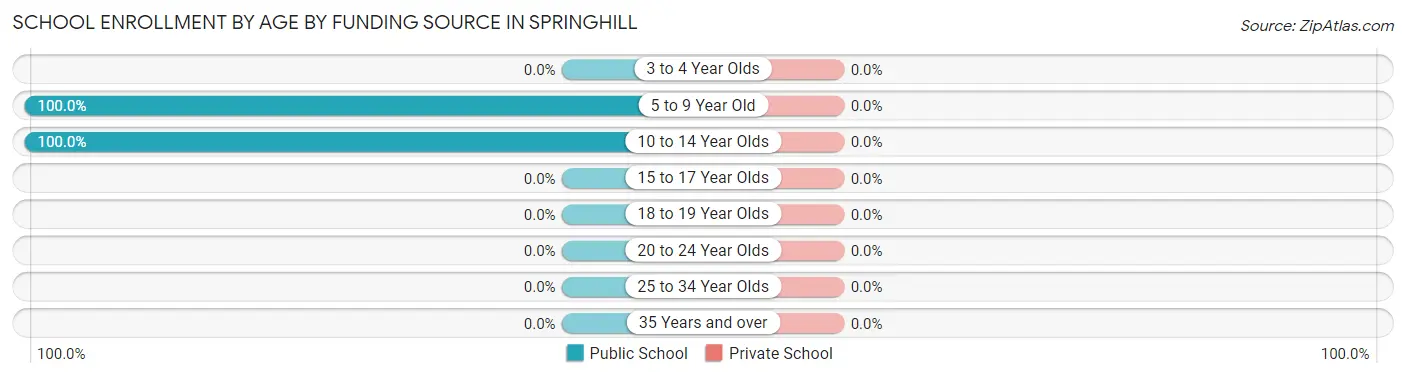
| Age Bracket | Public School | Private School |
| 3 to 4 Year Olds | 0 (0.0%) | 0 (0.0%) |
| 5 to 9 Year Old | 8 (100.0%) | 0 (0.0%) |
| 10 to 14 Year Olds | 7 (100.0%) | 0 (0.0%) |
| 15 to 17 Year Olds | 0 (0.0%) | 0 (0.0%) |
| 18 to 19 Year Olds | 0 (0.0%) | 0 (0.0%) |
| 20 to 24 Year Olds | 0 (0.0%) | 0 (0.0%) |
| 25 to 34 Year Olds | 0 (0.0%) | 0 (0.0%) |
| 35 Years and over | 0 (0.0%) | 0 (0.0%) |
| Total | 15 (100.0%) | 0 (0.0%) |
Educational Attainment by Field of Study in Springhill
Science & technology (24 | 19.7%), bio, nature & agricultural (23 | 18.9%), business (20 | 16.4%), computers & mathematics (18 | 14.7%), and literature & languages (16 | 13.1%) are the most common fields of study among 122 individuals in Springhill who have obtained a bachelor's degree or higher.
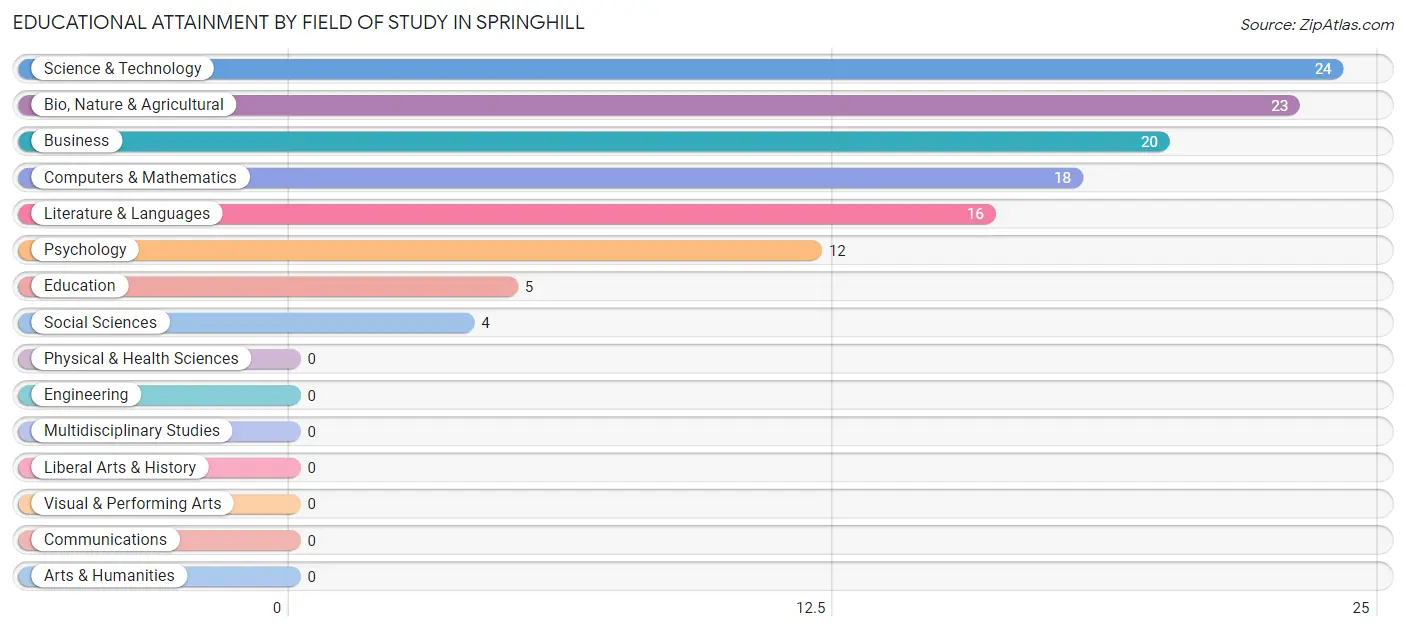
| Field of Study | # Graduates | % Graduates |
| Computers & Mathematics | 18 | 14.7% |
| Bio, Nature & Agricultural | 23 | 18.9% |
| Physical & Health Sciences | 0 | 0.0% |
| Psychology | 12 | 9.8% |
| Social Sciences | 4 | 3.3% |
| Engineering | 0 | 0.0% |
| Multidisciplinary Studies | 0 | 0.0% |
| Science & Technology | 24 | 19.7% |
| Business | 20 | 16.4% |
| Education | 5 | 4.1% |
| Literature & Languages | 16 | 13.1% |
| Liberal Arts & History | 0 | 0.0% |
| Visual & Performing Arts | 0 | 0.0% |
| Communications | 0 | 0.0% |
| Arts & Humanities | 0 | 0.0% |
| Total | 122 | 100.0% |
Transportation & Commute in Springhill
Vehicle Availability by Sex in Springhill
The most prevalent vehicle ownership categories in Springhill are males with 2 vehicles (43, accounting for 59.7%) and females with 2 vehicles (37, making up 82.7%).
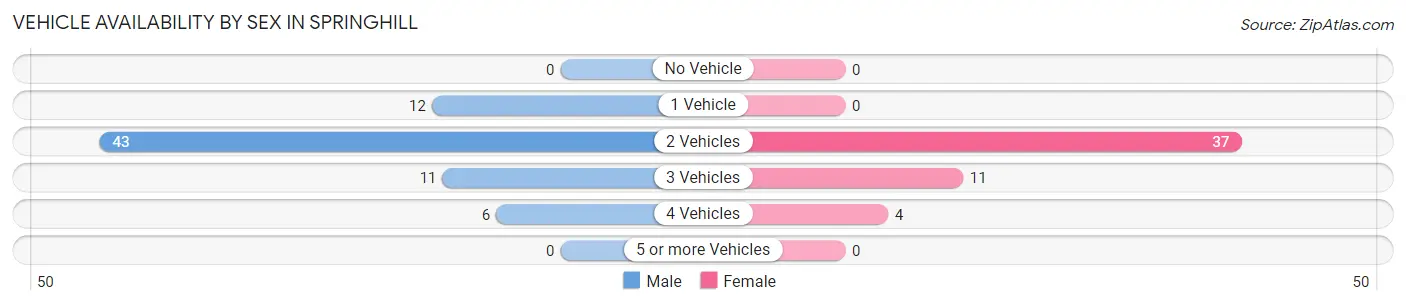
| Vehicles Available | Male | Female |
| No Vehicle | 0 (0.0%) | 0 (0.0%) |
| 1 Vehicle | 12 (16.7%) | 0 (0.0%) |
| 2 Vehicles | 43 (59.7%) | 37 (71.2%) |
| 3 Vehicles | 11 (15.3%) | 11 (21.1%) |
| 4 Vehicles | 6 (8.3%) | 4 (7.7%) |
| 5 or more Vehicles | 0 (0.0%) | 0 (0.0%) |
| Total | 72 (100.0%) | 52 (100.0%) |
Commute Time in Springhill
The most frequently occuring commute durations in Springhill are 25 to 29 minutes (32 commuters, 54.2%), 30 to 34 minutes (23 commuters, 39.0%), and 15 to 19 minutes (4 commuters, 6.8%).
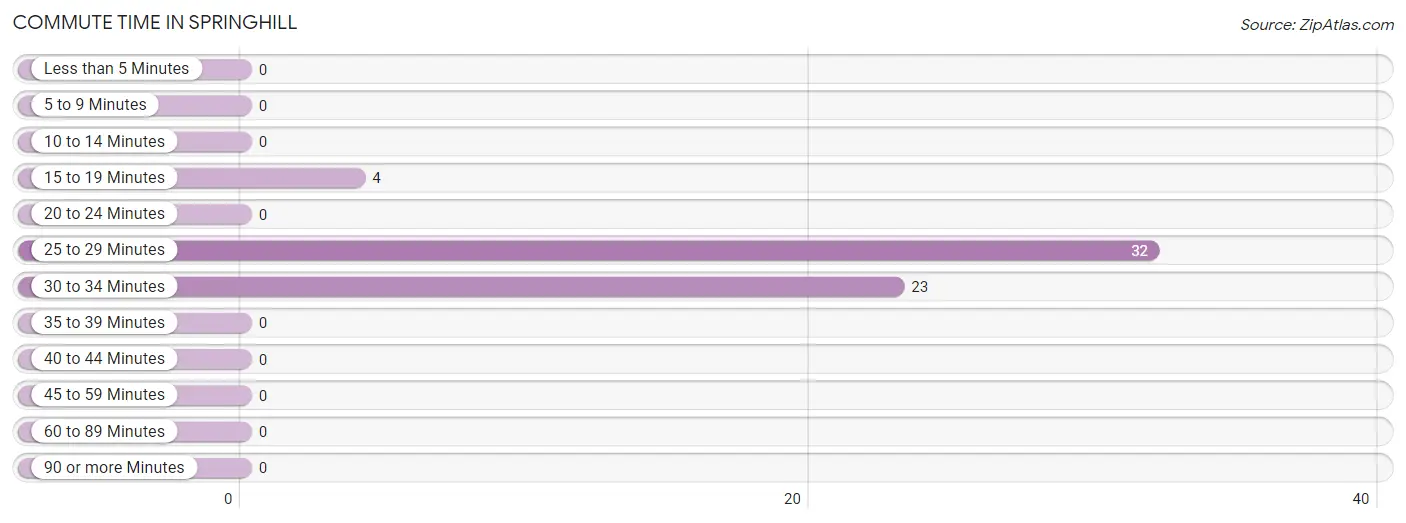
| Commute Time | # Commuters | % Commuters |
| Less than 5 Minutes | 0 | 0.0% |
| 5 to 9 Minutes | 0 | 0.0% |
| 10 to 14 Minutes | 0 | 0.0% |
| 15 to 19 Minutes | 4 | 6.8% |
| 20 to 24 Minutes | 0 | 0.0% |
| 25 to 29 Minutes | 32 | 54.2% |
| 30 to 34 Minutes | 23 | 39.0% |
| 35 to 39 Minutes | 0 | 0.0% |
| 40 to 44 Minutes | 0 | 0.0% |
| 45 to 59 Minutes | 0 | 0.0% |
| 60 to 89 Minutes | 0 | 0.0% |
| 90 or more Minutes | 0 | 0.0% |
Commute Time by Sex in Springhill
The most common commute times in Springhill are 30 to 34 minutes (23 commuters, 62.2%) for males and 25 to 29 minutes (22 commuters, 100.0%) for females.
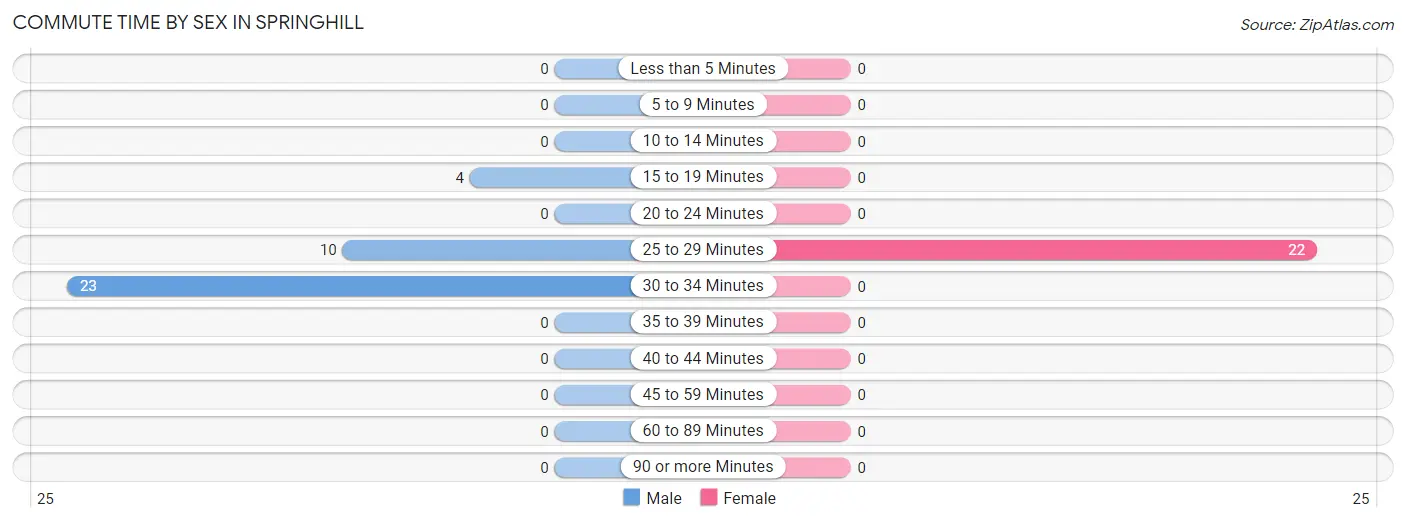
| Commute Time | Male | Female |
| Less than 5 Minutes | 0 (0.0%) | 0 (0.0%) |
| 5 to 9 Minutes | 0 (0.0%) | 0 (0.0%) |
| 10 to 14 Minutes | 0 (0.0%) | 0 (0.0%) |
| 15 to 19 Minutes | 4 (10.8%) | 0 (0.0%) |
| 20 to 24 Minutes | 0 (0.0%) | 0 (0.0%) |
| 25 to 29 Minutes | 10 (27.0%) | 22 (100.0%) |
| 30 to 34 Minutes | 23 (62.2%) | 0 (0.0%) |
| 35 to 39 Minutes | 0 (0.0%) | 0 (0.0%) |
| 40 to 44 Minutes | 0 (0.0%) | 0 (0.0%) |
| 45 to 59 Minutes | 0 (0.0%) | 0 (0.0%) |
| 60 to 89 Minutes | 0 (0.0%) | 0 (0.0%) |
| 90 or more Minutes | 0 (0.0%) | 0 (0.0%) |
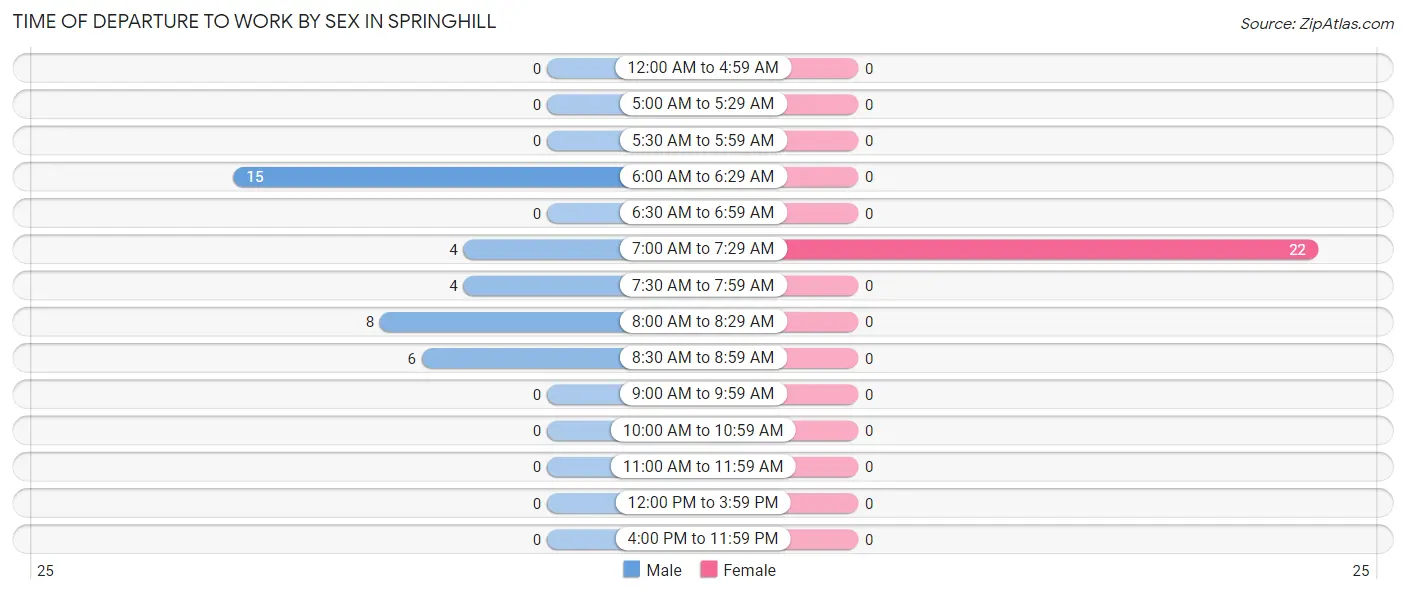
Time of Departure to Work by Sex in Springhill
The most frequent times of departure to work in Springhill are 6:00 AM to 6:29 AM (15, 40.5%) for males and 7:00 AM to 7:29 AM (22, 100.0%) for females.
| Time of Departure | Male | Female |
| 12:00 AM to 4:59 AM | 0 (0.0%) | 0 (0.0%) |
| 5:00 AM to 5:29 AM | 0 (0.0%) | 0 (0.0%) |
| 5:30 AM to 5:59 AM | 0 (0.0%) | 0 (0.0%) |
| 6:00 AM to 6:29 AM | 15 (40.5%) | 0 (0.0%) |
| 6:30 AM to 6:59 AM | 0 (0.0%) | 0 (0.0%) |
| 7:00 AM to 7:29 AM | 4 (10.8%) | 22 (100.0%) |
| 7:30 AM to 7:59 AM | 4 (10.8%) | 0 (0.0%) |
| 8:00 AM to 8:29 AM | 8 (21.6%) | 0 (0.0%) |
| 8:30 AM to 8:59 AM | 6 (16.2%) | 0 (0.0%) |
| 9:00 AM to 9:59 AM | 0 (0.0%) | 0 (0.0%) |
| 10:00 AM to 10:59 AM | 0 (0.0%) | 0 (0.0%) |
| 11:00 AM to 11:59 AM | 0 (0.0%) | 0 (0.0%) |
| 12:00 PM to 3:59 PM | 0 (0.0%) | 0 (0.0%) |
| 4:00 PM to 11:59 PM | 0 (0.0%) | 0 (0.0%) |
| Total | 37 (100.0%) | 22 (100.0%) |
Housing Occupancy in Springhill
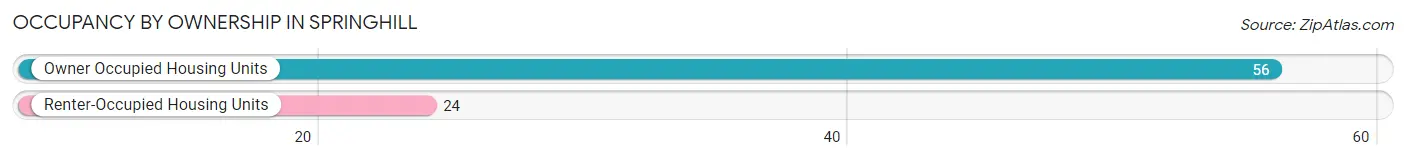
Occupancy by Ownership in Springhill
Of the total 80 dwellings in Springhill, owner-occupied units account for 56 (70.0%), while renter-occupied units make up 24 (30.0%).
| Occupancy | # Housing Units | % Housing Units |
| Owner Occupied Housing Units | 56 | 70.0% |
| Renter-Occupied Housing Units | 24 | 30.0% |
| Total Occupied Housing Units | 80 | 100.0% |
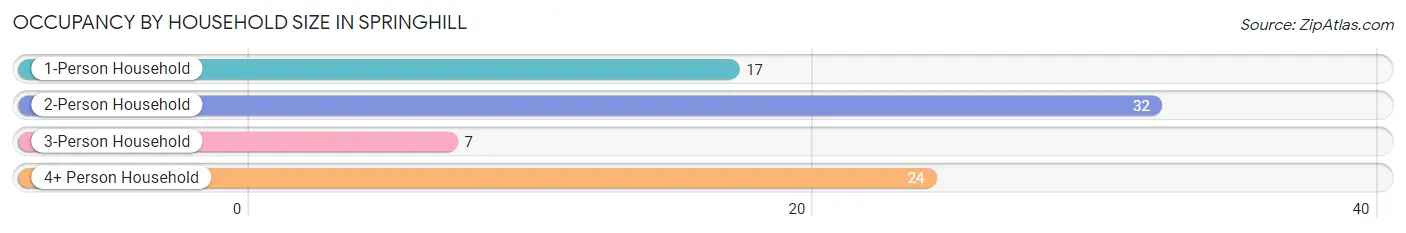
Occupancy by Household Size in Springhill
| Household Size | # Housing Units | % Housing Units |
| 1-Person Household | 17 | 21.2% |
| 2-Person Household | 32 | 40.0% |
| 3-Person Household | 7 | 8.7% |
| 4+ Person Household | 24 | 30.0% |
| Total Housing Units | 80 | 100.0% |
Occupancy by Ownership by Household Size in Springhill
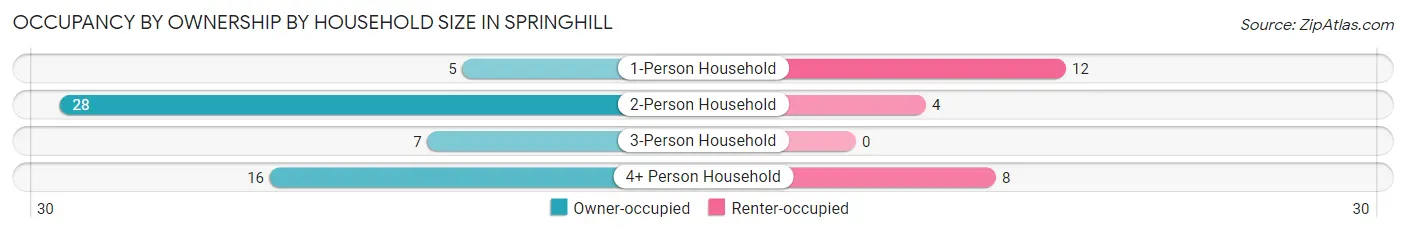
| Household Size | Owner-occupied | Renter-occupied |
| 1-Person Household | 5 (29.4%) | 12 (70.6%) |
| 2-Person Household | 28 (87.5%) | 4 (12.5%) |
| 3-Person Household | 7 (100.0%) | 0 (0.0%) |
| 4+ Person Household | 16 (66.7%) | 8 (33.3%) |
| Total Housing Units | 56 (70.0%) | 24 (30.0%) |
Occupancy by Educational Attainment in Springhill
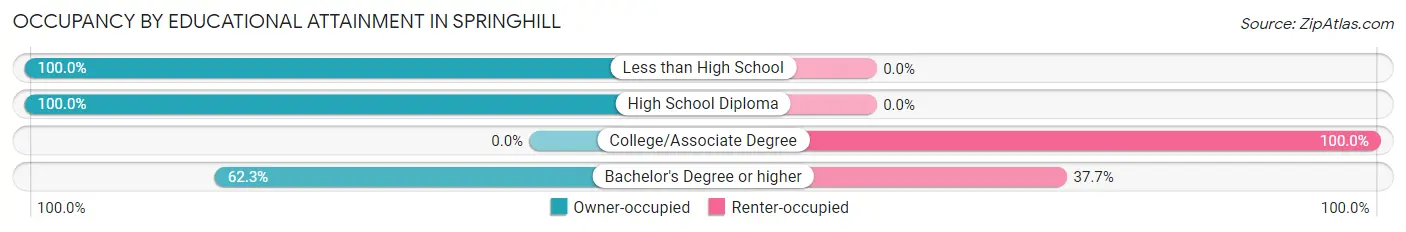
| Household Size | Owner-occupied | Renter-occupied |
| Less than High School | 16 (100.0%) | 0 (0.0%) |
| High School Diploma | 7 (100.0%) | 0 (0.0%) |
| College/Associate Degree | 0 (0.0%) | 4 (100.0%) |
| Bachelor's Degree or higher | 33 (62.3%) | 20 (37.7%) |
Occupancy by Age of Householder in Springhill
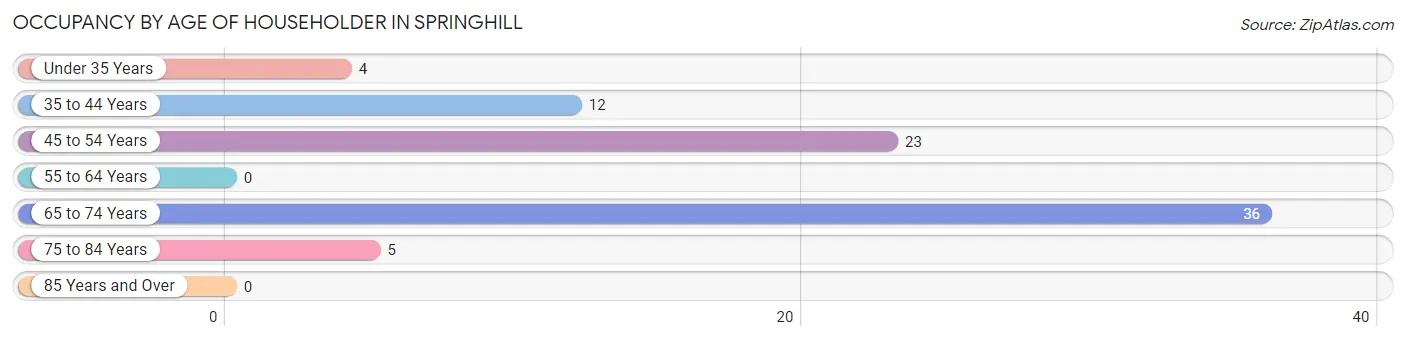
| Age Bracket | # Households | % Households |
| Under 35 Years | 4 | 5.0% |
| 35 to 44 Years | 12 | 15.0% |
| 45 to 54 Years | 23 | 28.7% |
| 55 to 64 Years | 0 | 0.0% |
| 65 to 74 Years | 36 | 45.0% |
| 75 to 84 Years | 5 | 6.2% |
| 85 Years and Over | 0 | 0.0% |
| Total | 80 | 100.0% |
Housing Finances in Springhill
Median Income by Occupancy in Springhill
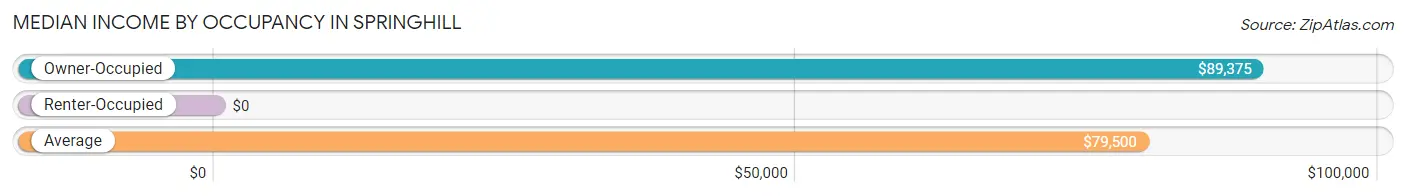
| Occupancy Type | # Households | Median Income |
| Owner-Occupied | 56 (70.0%) | $89,375 |
| Renter-Occupied | 24 (30.0%) | $0 |
| Average | 80 (100.0%) | $79,500 |
Occupancy by Householder Income Bracket in Springhill
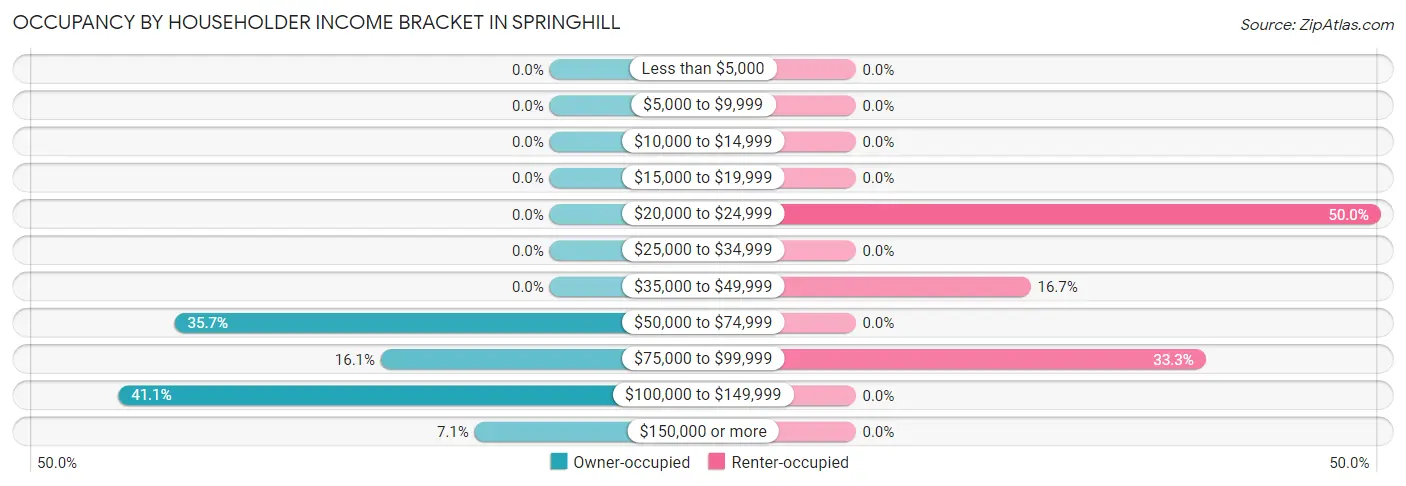
| Income Bracket | Owner-occupied | Renter-occupied |
| Less than $5,000 | 0 (0.0%) | 0 (0.0%) |
| $5,000 to $9,999 | 0 (0.0%) | 0 (0.0%) |
| $10,000 to $14,999 | 0 (0.0%) | 0 (0.0%) |
| $15,000 to $19,999 | 0 (0.0%) | 0 (0.0%) |
| $20,000 to $24,999 | 0 (0.0%) | 12 (50.0%) |
| $25,000 to $34,999 | 0 (0.0%) | 0 (0.0%) |
| $35,000 to $49,999 | 0 (0.0%) | 4 (16.7%) |
| $50,000 to $74,999 | 20 (35.7%) | 0 (0.0%) |
| $75,000 to $99,999 | 9 (16.1%) | 8 (33.3%) |
| $100,000 to $149,999 | 23 (41.1%) | 0 (0.0%) |
| $150,000 or more | 4 (7.1%) | 0 (0.0%) |
| Total | 56 (100.0%) | 24 (100.0%) |
Monthly Housing Cost Tiers in Springhill
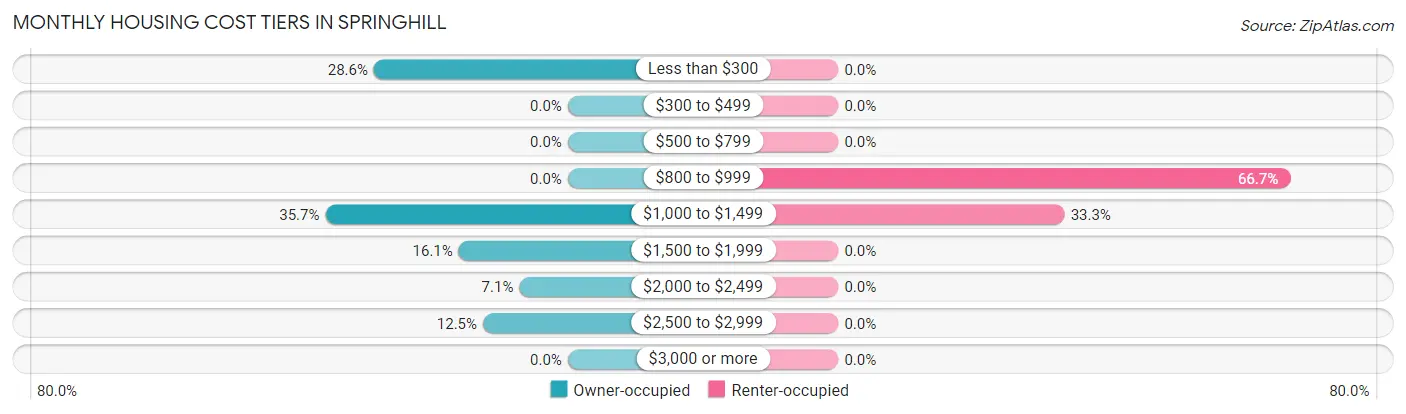
| Monthly Cost | Owner-occupied | Renter-occupied |
| Less than $300 | 16 (28.6%) | 0 (0.0%) |
| $300 to $499 | 0 (0.0%) | 0 (0.0%) |
| $500 to $799 | 0 (0.0%) | 0 (0.0%) |
| $800 to $999 | 0 (0.0%) | 16 (66.7%) |
| $1,000 to $1,499 | 20 (35.7%) | 8 (33.3%) |
| $1,500 to $1,999 | 9 (16.1%) | 0 (0.0%) |
| $2,000 to $2,499 | 4 (7.1%) | 0 (0.0%) |
| $2,500 to $2,999 | 7 (12.5%) | 0 (0.0%) |
| $3,000 or more | 0 (0.0%) | 0 (0.0%) |
| Total | 56 (100.0%) | 24 (100.0%) |
Physical Housing Characteristics in Springhill
Housing Structures in Springhill
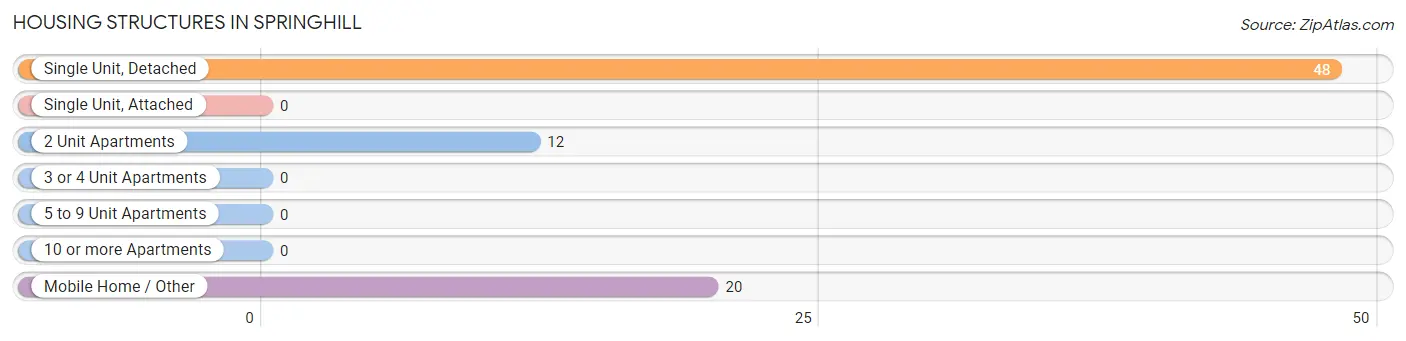
| Structure Type | # Housing Units | % Housing Units |
| Single Unit, Detached | 48 | 60.0% |
| Single Unit, Attached | 0 | 0.0% |
| 2 Unit Apartments | 12 | 15.0% |
| 3 or 4 Unit Apartments | 0 | 0.0% |
| 5 to 9 Unit Apartments | 0 | 0.0% |
| 10 or more Apartments | 0 | 0.0% |
| Mobile Home / Other | 20 | 25.0% |
| Total | 80 | 100.0% |
Housing Structures by Occupancy in Springhill
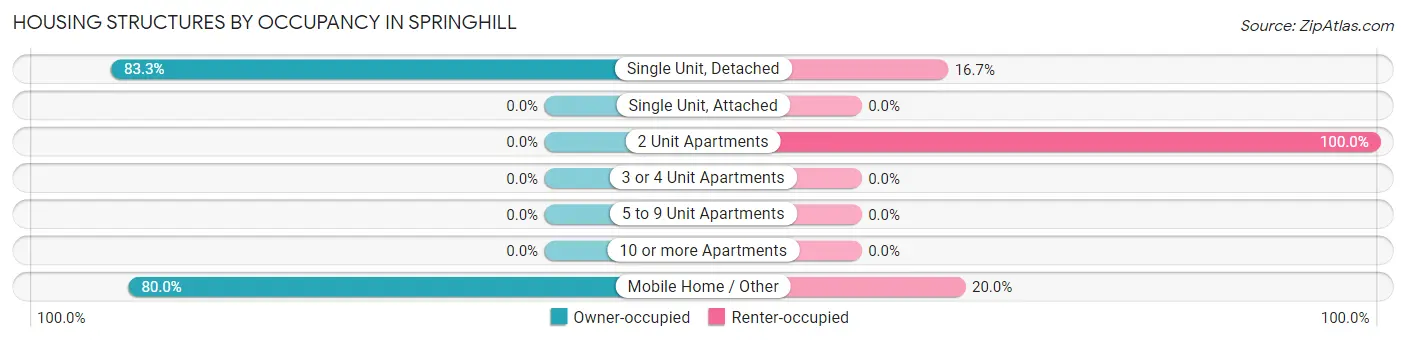
| Structure Type | Owner-occupied | Renter-occupied |
| Single Unit, Detached | 40 (83.3%) | 8 (16.7%) |
| Single Unit, Attached | 0 (0.0%) | 0 (0.0%) |
| 2 Unit Apartments | 0 (0.0%) | 12 (100.0%) |
| 3 or 4 Unit Apartments | 0 (0.0%) | 0 (0.0%) |
| 5 to 9 Unit Apartments | 0 (0.0%) | 0 (0.0%) |
| 10 or more Apartments | 0 (0.0%) | 0 (0.0%) |
| Mobile Home / Other | 16 (80.0%) | 4 (20.0%) |
| Total | 56 (70.0%) | 24 (30.0%) |
Housing Structures by Number of Rooms in Springhill
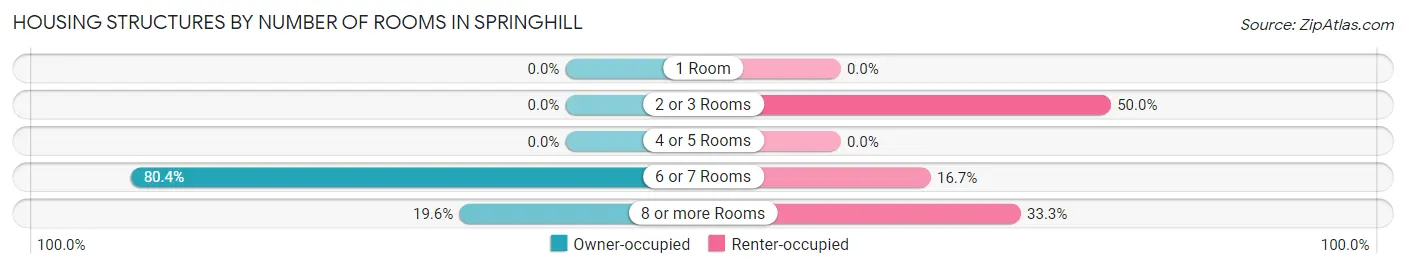
| Number of Rooms | Owner-occupied | Renter-occupied |
| 1 Room | 0 (0.0%) | 0 (0.0%) |
| 2 or 3 Rooms | 0 (0.0%) | 12 (50.0%) |
| 4 or 5 Rooms | 0 (0.0%) | 0 (0.0%) |
| 6 or 7 Rooms | 45 (80.4%) | 4 (16.7%) |
| 8 or more Rooms | 11 (19.6%) | 8 (33.3%) |
| Total | 56 (100.0%) | 24 (100.0%) |
Housing Structure by Heating Type in Springhill
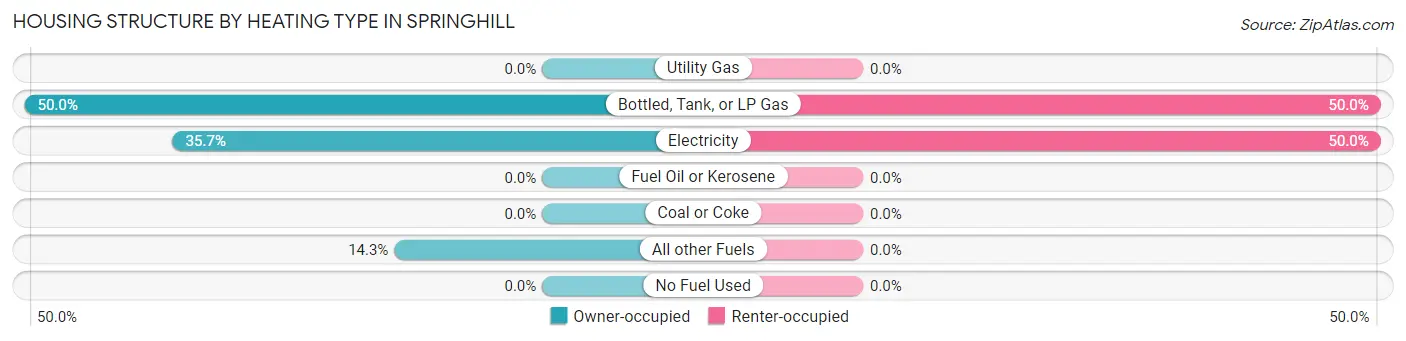
| Heating Type | Owner-occupied | Renter-occupied |
| Utility Gas | 0 (0.0%) | 0 (0.0%) |
| Bottled, Tank, or LP Gas | 28 (50.0%) | 12 (50.0%) |
| Electricity | 20 (35.7%) | 12 (50.0%) |
| Fuel Oil or Kerosene | 0 (0.0%) | 0 (0.0%) |
| Coal or Coke | 0 (0.0%) | 0 (0.0%) |
| All other Fuels | 8 (14.3%) | 0 (0.0%) |
| No Fuel Used | 0 (0.0%) | 0 (0.0%) |
| Total | 56 (100.0%) | 24 (100.0%) |
Household Vehicle Usage in Springhill
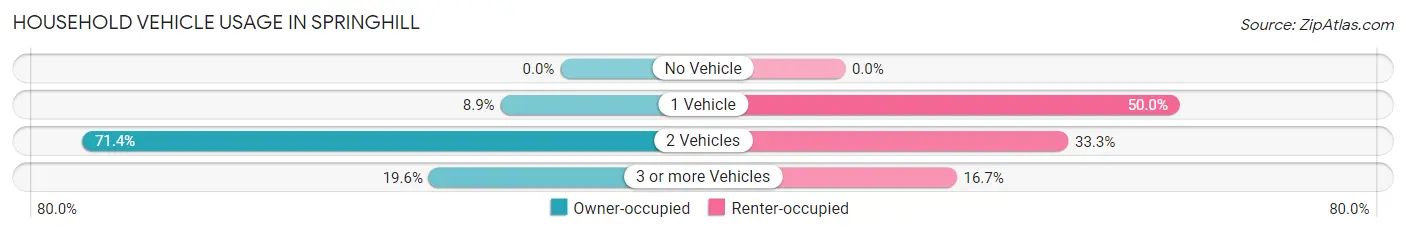
| Vehicles per Household | Owner-occupied | Renter-occupied |
| No Vehicle | 0 (0.0%) | 0 (0.0%) |
| 1 Vehicle | 5 (8.9%) | 12 (50.0%) |
| 2 Vehicles | 40 (71.4%) | 8 (33.3%) |
| 3 or more Vehicles | 11 (19.6%) | 4 (16.7%) |
| Total | 56 (100.0%) | 24 (100.0%) |
Real Estate & Mortgages in Springhill
Real Estate and Mortgage Overview in Springhill
| Characteristic | Without Mortgage | With Mortgage |
| Housing Units | 16 | 40 |
| Median Property Value | - | - |
| Median Household Income | - | - |
| Monthly Housing Costs | - | - |
| Real Estate Taxes | - | - |
Property Value by Mortgage Status in Springhill
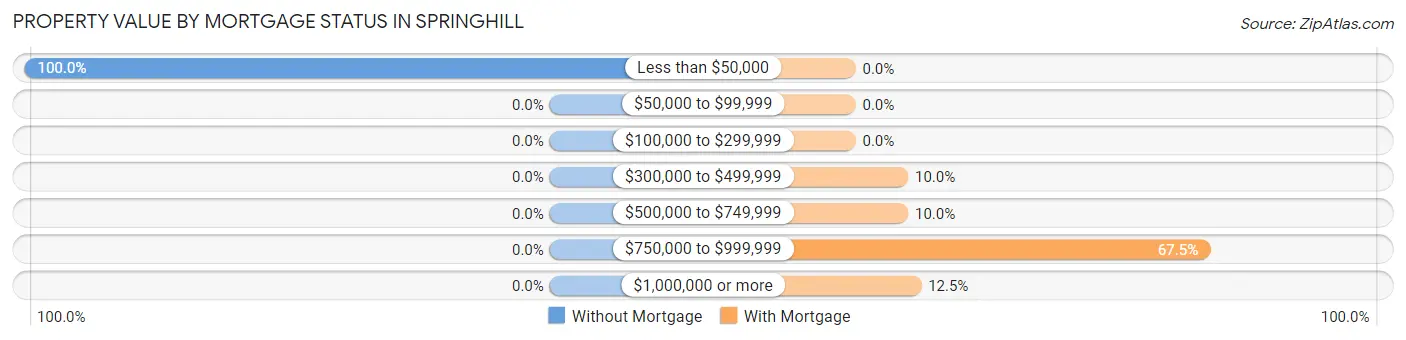
| Property Value | Without Mortgage | With Mortgage |
| Less than $50,000 | 16 (100.0%) | 0 (0.0%) |
| $50,000 to $99,999 | 0 (0.0%) | 0 (0.0%) |
| $100,000 to $299,999 | 0 (0.0%) | 0 (0.0%) |
| $300,000 to $499,999 | 0 (0.0%) | 4 (10.0%) |
| $500,000 to $749,999 | 0 (0.0%) | 4 (10.0%) |
| $750,000 to $999,999 | 0 (0.0%) | 27 (67.5%) |
| $1,000,000 or more | 0 (0.0%) | 5 (12.5%) |
| Total | 16 (100.0%) | 40 (100.0%) |
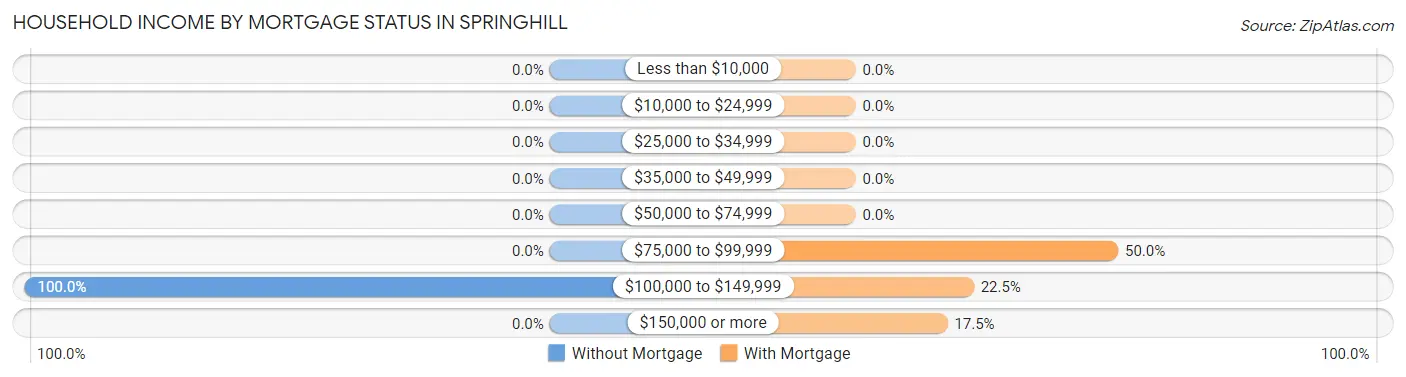
Household Income by Mortgage Status in Springhill
| Household Income | Without Mortgage | With Mortgage |
| Less than $10,000 | 0 (0.0%) | 0 (0.0%) |
| $10,000 to $24,999 | 0 (0.0%) | 0 (0.0%) |
| $25,000 to $34,999 | 0 (0.0%) | 0 (0.0%) |
| $35,000 to $49,999 | 0 (0.0%) | 0 (0.0%) |
| $50,000 to $74,999 | 0 (0.0%) | 0 (0.0%) |
| $75,000 to $99,999 | 0 (0.0%) | 20 (50.0%) |
| $100,000 to $149,999 | 16 (100.0%) | 9 (22.5%) |
| $150,000 or more | 0 (0.0%) | 7 (17.5%) |
| Total | 16 (100.0%) | 40 (100.0%) |
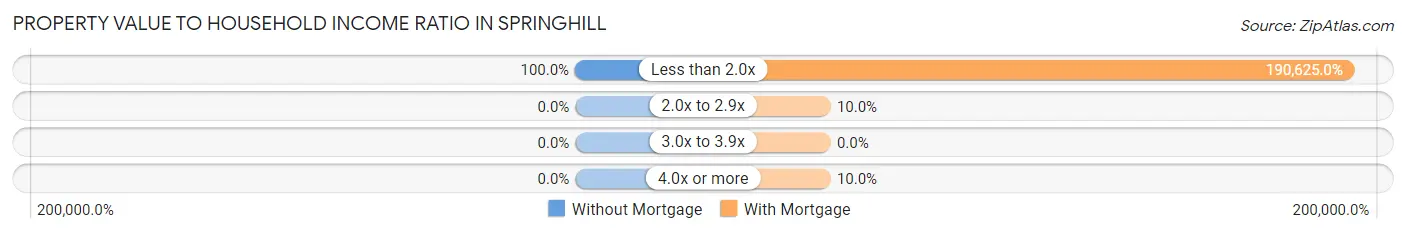
Property Value to Household Income Ratio in Springhill
| Value-to-Income Ratio | Without Mortgage | With Mortgage |
| Less than 2.0x | 16 (100.0%) | 76,250 (190,625.0%) |
| 2.0x to 2.9x | 0 (0.0%) | 4 (10.0%) |
| 3.0x to 3.9x | 0 (0.0%) | 0 (0.0%) |
| 4.0x or more | 0 (0.0%) | 4 (10.0%) |
| Total | 16 (100.0%) | 40 (100.0%) |
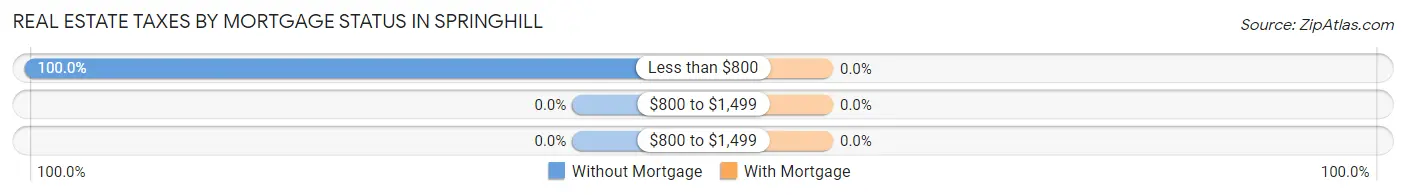
Real Estate Taxes by Mortgage Status in Springhill
| Property Taxes | Without Mortgage | With Mortgage |
| Less than $800 | 16 (100.0%) | 0 (0.0%) |
| $800 to $1,499 | 0 (0.0%) | 0 (0.0%) |
| $800 to $1,499 | 0 (0.0%) | 0 (0.0%) |
| Total | 16 (100.0%) | 40 (100.0%) |
Health & Disability in Springhill
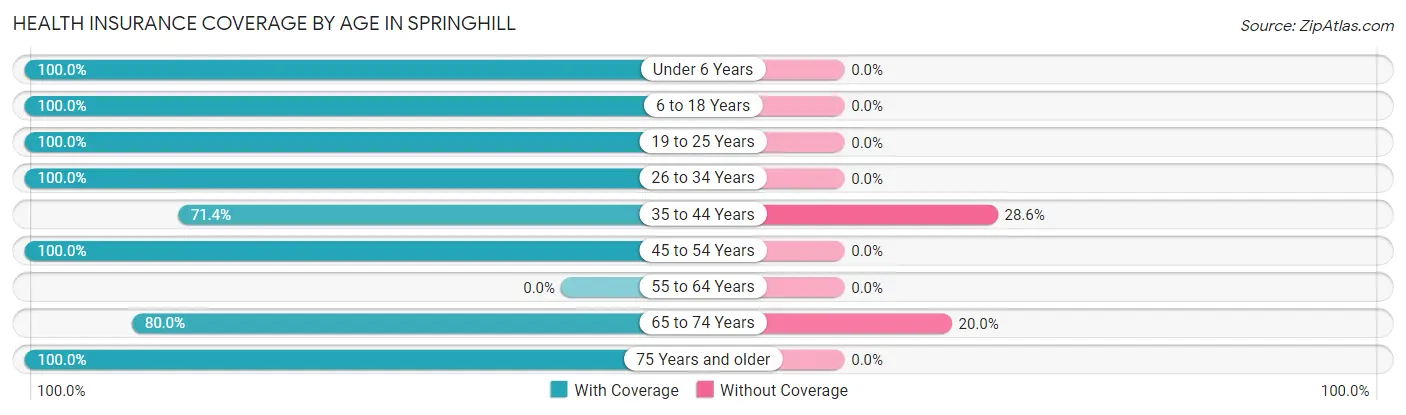
Health Insurance Coverage by Age in Springhill
| Age Bracket | With Coverage | Without Coverage |
| Under 6 Years | 9 (100.0%) | 0 (0.0%) |
| 6 to 18 Years | 15 (100.0%) | 0 (0.0%) |
| 19 to 25 Years | 18 (100.0%) | 0 (0.0%) |
| 26 to 34 Years | 4 (100.0%) | 0 (0.0%) |
| 35 to 44 Years | 20 (71.4%) | 8 (28.6%) |
| 45 to 54 Years | 45 (100.0%) | 0 (0.0%) |
| 55 to 64 Years | 0 (0.0%) | 0 (0.0%) |
| 65 to 74 Years | 60 (80.0%) | 15 (20.0%) |
| 75 Years and older | 5 (100.0%) | 0 (0.0%) |
| Total | 176 (88.4%) | 23 (11.6%) |
Health Insurance Coverage by Citizenship Status in Springhill
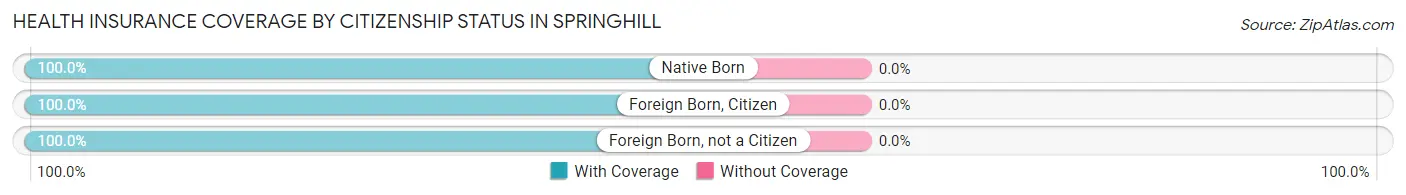
| Citizenship Status | With Coverage | Without Coverage |
| Native Born | 9 (100.0%) | 0 (0.0%) |
| Foreign Born, Citizen | 15 (100.0%) | 0 (0.0%) |
| Foreign Born, not a Citizen | 18 (100.0%) | 0 (0.0%) |
Health Insurance Coverage by Household Income in Springhill
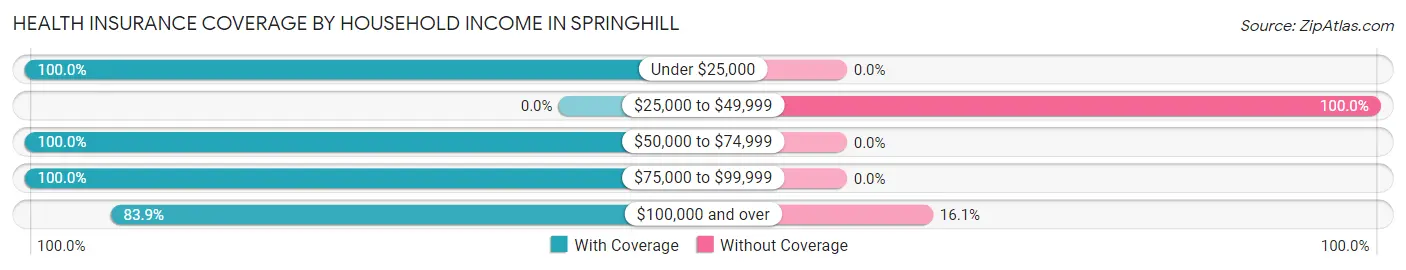
| Household Income | With Coverage | Without Coverage |
| Under $25,000 | 12 (100.0%) | 0 (0.0%) |
| $25,000 to $49,999 | 0 (0.0%) | 8 (100.0%) |
| $50,000 to $74,999 | 38 (100.0%) | 0 (0.0%) |
| $75,000 to $99,999 | 48 (100.0%) | 0 (0.0%) |
| $100,000 and over | 78 (83.9%) | 15 (16.1%) |
Public vs Private Health Insurance Coverage by Age in Springhill
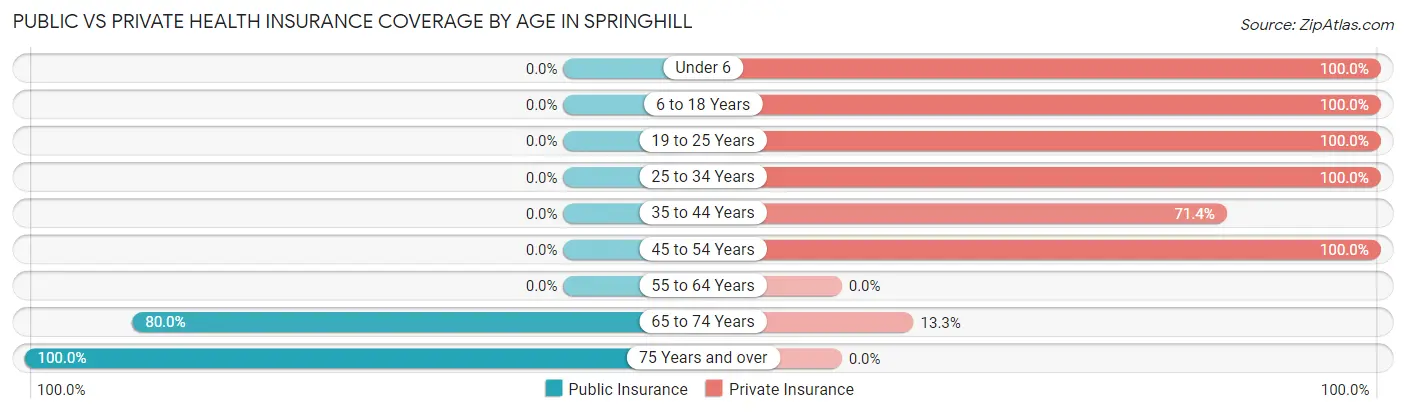
| Age Bracket | Public Insurance | Private Insurance |
| Under 6 | 0 (0.0%) | 9 (100.0%) |
| 6 to 18 Years | 0 (0.0%) | 15 (100.0%) |
| 19 to 25 Years | 0 (0.0%) | 18 (100.0%) |
| 25 to 34 Years | 0 (0.0%) | 4 (100.0%) |
| 35 to 44 Years | 0 (0.0%) | 20 (71.4%) |
| 45 to 54 Years | 0 (0.0%) | 45 (100.0%) |
| 55 to 64 Years | 0 (0.0%) | 0 (0.0%) |
| 65 to 74 Years | 60 (80.0%) | 10 (13.3%) |
| 75 Years and over | 5 (100.0%) | 0 (0.0%) |
| Total | 65 (32.7%) | 121 (60.8%) |
Disability Status by Sex by Age in Springhill
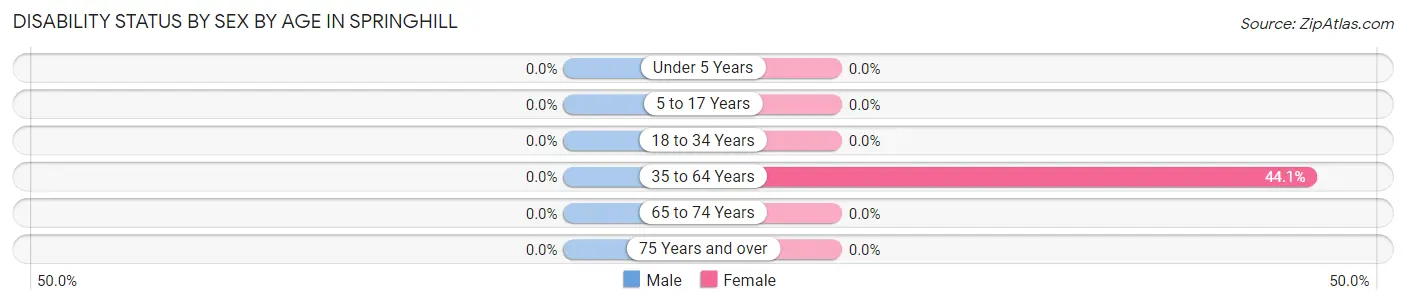
| Age Bracket | Male | Female |
| Under 5 Years | 0 (0.0%) | 0 (0.0%) |
| 5 to 17 Years | 0 (0.0%) | 0 (0.0%) |
| 18 to 34 Years | 0 (0.0%) | 0 (0.0%) |
| 35 to 64 Years | 0 (0.0%) | 15 (44.1%) |
| 65 to 74 Years | 0 (0.0%) | 0 (0.0%) |
| 75 Years and over | 0 (0.0%) | 0 (0.0%) |
Disability Class by Sex by Age in Springhill
Disability Class: Hearing Difficulty
| Age Bracket | Male | Female |
| Under 5 Years | 0 (0.0%) | 0 (0.0%) |
| 5 to 17 Years | 0 (0.0%) | 0 (0.0%) |
| 18 to 34 Years | 0 (0.0%) | 0 (0.0%) |
| 35 to 64 Years | 0 (0.0%) | 0 (0.0%) |
| 65 to 74 Years | 0 (0.0%) | 0 (0.0%) |
| 75 Years and over | 0 (0.0%) | 0 (0.0%) |
Disability Class: Vision Difficulty
| Age Bracket | Male | Female |
| Under 5 Years | 0 (0.0%) | 0 (0.0%) |
| 5 to 17 Years | 0 (0.0%) | 0 (0.0%) |
| 18 to 34 Years | 0 (0.0%) | 0 (0.0%) |
| 35 to 64 Years | 0 (0.0%) | 0 (0.0%) |
| 65 to 74 Years | 0 (0.0%) | 0 (0.0%) |
| 75 Years and over | 0 (0.0%) | 0 (0.0%) |
Disability Class: Cognitive Difficulty
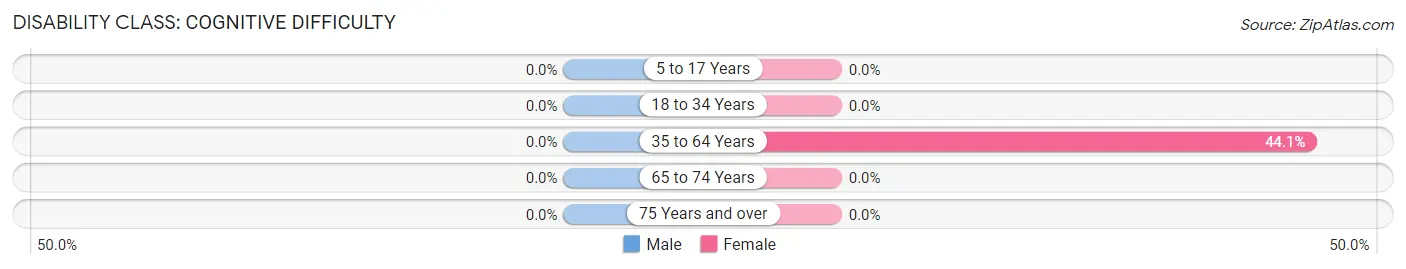
| Age Bracket | Male | Female |
| 5 to 17 Years | 0 (0.0%) | 0 (0.0%) |
| 18 to 34 Years | 0 (0.0%) | 0 (0.0%) |
| 35 to 64 Years | 0 (0.0%) | 15 (44.1%) |
| 65 to 74 Years | 0 (0.0%) | 0 (0.0%) |
| 75 Years and over | 0 (0.0%) | 0 (0.0%) |
Disability Class: Ambulatory Difficulty
| Age Bracket | Male | Female |
| 5 to 17 Years | 0 (0.0%) | 0 (0.0%) |
| 18 to 34 Years | 0 (0.0%) | 0 (0.0%) |
| 35 to 64 Years | 0 (0.0%) | 0 (0.0%) |
| 65 to 74 Years | 0 (0.0%) | 0 (0.0%) |
| 75 Years and over | 0 (0.0%) | 0 (0.0%) |
Disability Class: Self-Care Difficulty
| Age Bracket | Male | Female |
| 5 to 17 Years | 0 (0.0%) | 0 (0.0%) |
| 18 to 34 Years | 0 (0.0%) | 0 (0.0%) |
| 35 to 64 Years | 0 (0.0%) | 0 (0.0%) |
| 65 to 74 Years | 0 (0.0%) | 0 (0.0%) |
| 75 Years and over | 0 (0.0%) | 0 (0.0%) |
Technology Access in Springhill
Computing Device Access in Springhill
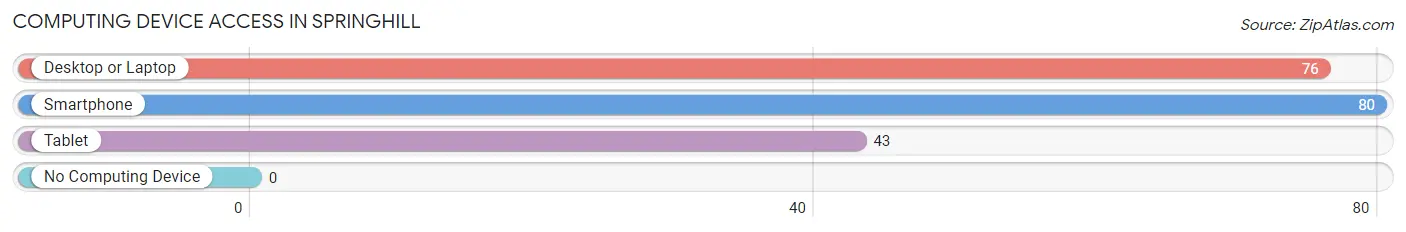
| Device Type | # Households | % Households |
| Desktop or Laptop | 76 | 95.0% |
| Smartphone | 80 | 100.0% |
| Tablet | 43 | 53.7% |
| No Computing Device | 0 | 0.0% |
| Total | 80 | 100.0% |
Internet Access in Springhill
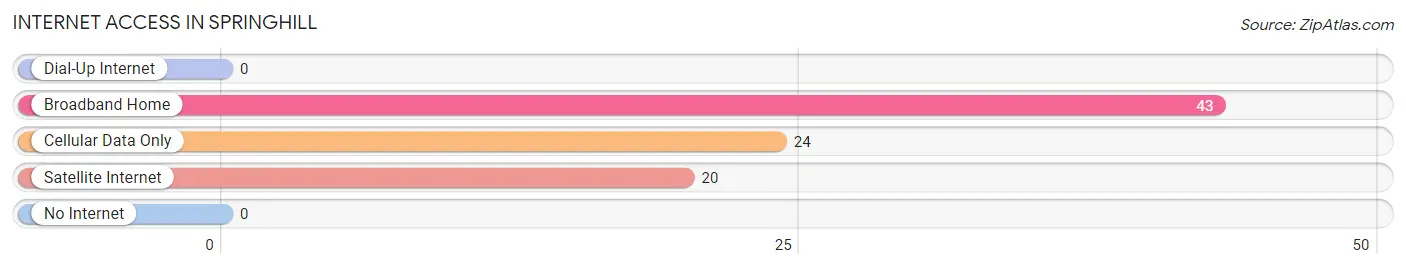
| Internet Type | # Households | % Households |
| Dial-Up Internet | 0 | 0.0% |
| Broadband Home | 43 | 53.7% |
| Cellular Data Only | 24 | 30.0% |
| Satellite Internet | 20 | 25.0% |
| No Internet | 0 | 0.0% |
| Total | 80 | 100.0% |
Springhill Summary
History
The town of Springhill, Montana is located in the south-central part of the state, in the foothills of the Rocky Mountains. It is situated in the Madison Valley, which is a long, narrow valley that runs from the Madison River in the north to the Yellowstone River in the south. The town was founded in 1864 by a group of settlers from the Midwest who were looking for a place to settle and start a new life. The town was named after the nearby spring that provided the settlers with fresh water.
The town quickly grew and prospered, becoming a hub for the surrounding area. It was a popular stop for travelers and traders, and the town soon became known for its hospitality and friendly atmosphere. The town was also known for its excellent hunting and fishing, and it was a popular destination for tourists.
In the late 1800s, the town began to experience a decline in population as many of the settlers moved away to other parts of the state. However, the town was able to remain prosperous due to its strong agricultural base. The town was also home to several businesses, including a sawmill, a flour mill, and a blacksmith shop.
In the early 1900s, the town experienced a resurgence in population as new settlers moved in and the town began to experience a period of growth and prosperity. The town was home to several churches, a school, and a library. The town also had a thriving business district, with several stores, restaurants, and other businesses.
The town continued to grow and prosper until the Great Depression, when the town experienced a period of decline. The town was able to survive the depression, however, and continued to grow and prosper throughout the 20th century.
Geography
Springhill is located in the south-central part of Montana, in the foothills of the Rocky Mountains. It is situated in the Madison Valley, which is a long, narrow valley that runs from the Madison River in the north to the Yellowstone River in the south. The town is located at an elevation of 4,500 feet, and the surrounding area is mostly flat, with rolling hills and mountains in the distance.
The town is located in a semi-arid climate, with hot summers and cold winters. The average annual temperature is around 50 degrees Fahrenheit, and the average annual precipitation is around 15 inches.
Economy
The economy of Springhill is largely based on agriculture and tourism. The town is home to several farms, which produce a variety of crops, including wheat, barley, hay, and alfalfa. The town is also home to several ranches, which raise cattle and horses.
The town is also a popular tourist destination, with several attractions, including the Madison Valley Museum, the Springhill Historical Society, and the Springhill Nature Center. The town is also home to several restaurants, bars, and other businesses.
Demographics
As of the 2010 census, the population of Springhill was 1,845. The population is mostly white (94.3%), with a small percentage of Native Americans (2.2%) and African Americans (1.2%). The median household income is $41,250, and the median age is 44.7 years. The town has a high rate of homeownership (77.2%), and the unemployment rate is 4.2%.
Common Questions
What is Per Capita Income in Springhill?
Per Capita income in Springhill is $37,670.
What is the Median Family Income in Springhill?
Median Family Income in Springhill is $89,688.
What is the Median Household income in Springhill?
Median Household Income in Springhill is $79,500.
What is Income or Wage Gap in Springhill?
Income or Wage Gap in Springhill is 8.7%.
Women in Springhill earn 91.3 cents for every dollar earned by a man.
What is Inequality or Gini Index in Springhill?
Inequality or Gini Index in Springhill is 0.30.
What is the Total Population of Springhill?
Total Population of Springhill is 199.
What is the Total Male Population of Springhill?
Total Male Population of Springhill is 92.
What is the Total Female Population of Springhill?
Total Female Population of Springhill is 107.
What is the Ratio of Males per 100 Females in Springhill?
There are 85.98 Males per 100 Females in Springhill.
What is the Ratio of Females per 100 Males in Springhill?
There are 116.30 Females per 100 Males in Springhill.
What is the Median Population Age in Springhill?
Median Population Age in Springhill is 53.5 Years.
What is the Average Family Size in Springhill
Average Family Size in Springhill is 3.0 People.
What is the Average Household Size in Springhill
Average Household Size in Springhill is 2.5 People.
How Large is the Labor Force in Springhill?
There are 124 People in the Labor Forcein in Springhill.
What is the Percentage of People in the Labor Force in Springhill?
70.9% of People are in the Labor Force in Springhill.