Scobey, MT Map & Demographics
Scobey Map
Scobey Overview
$33,354
PER CAPITA INCOME
$83,594
AVG FAMILY INCOME
$44,583
AVG HOUSEHOLD INCOME
22.6%
WAGE / INCOME GAP [ % ]
77.4¢/ $1
WAGE / INCOME GAP [ $ ]
0.39
INEQUALITY / GINI INDEX
791
TOTAL POPULATION
380
MALE POPULATION
411
FEMALE POPULATION
92.46
MALES / 100 FEMALES
108.16
FEMALES / 100 MALES
58.4
MEDIAN AGE
2.9
AVG FAMILY SIZE
1.8
AVG HOUSEHOLD SIZE
408
LABOR FORCE [ PEOPLE ]
58.5%
PERCENT IN LABOR FORCE
1.7%
UNEMPLOYMENT RATE
Scobey Zip Codes
Scobey Area Codes
Income in Scobey
Income Overview in Scobey
Per Capita Income in Scobey is $33,354, while median incomes of families and households are $83,594 and $44,583 respectively.
| Characteristic | Number | Measure |
| Per Capita Income | 791 | $33,354 |
| Median Family Income | 170 | $83,594 |
| Mean Family Income | 170 | $83,196 |
| Median Household Income | 425 | $44,583 |
| Mean Household Income | 425 | $57,914 |
| Income Deficit | 170 | $0 |
| Wage / Income Gap (%) | 791 | 22.59% |
| Wage / Income Gap ($) | 791 | 77.41¢ per $1 |
| Gini / Inequality Index | 791 | 0.39 |
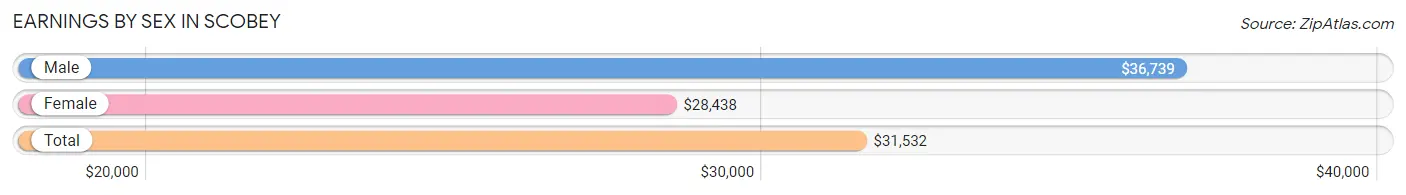
Earnings by Sex in Scobey
Average Earnings in Scobey are $31,532, $36,739 for men and $28,438 for women, a difference of 22.6%.
| Sex | Number | Average Earnings |
| Male | 244 (57.3%) | $36,739 |
| Female | 182 (42.7%) | $28,438 |
| Total | 426 (100.0%) | $31,532 |
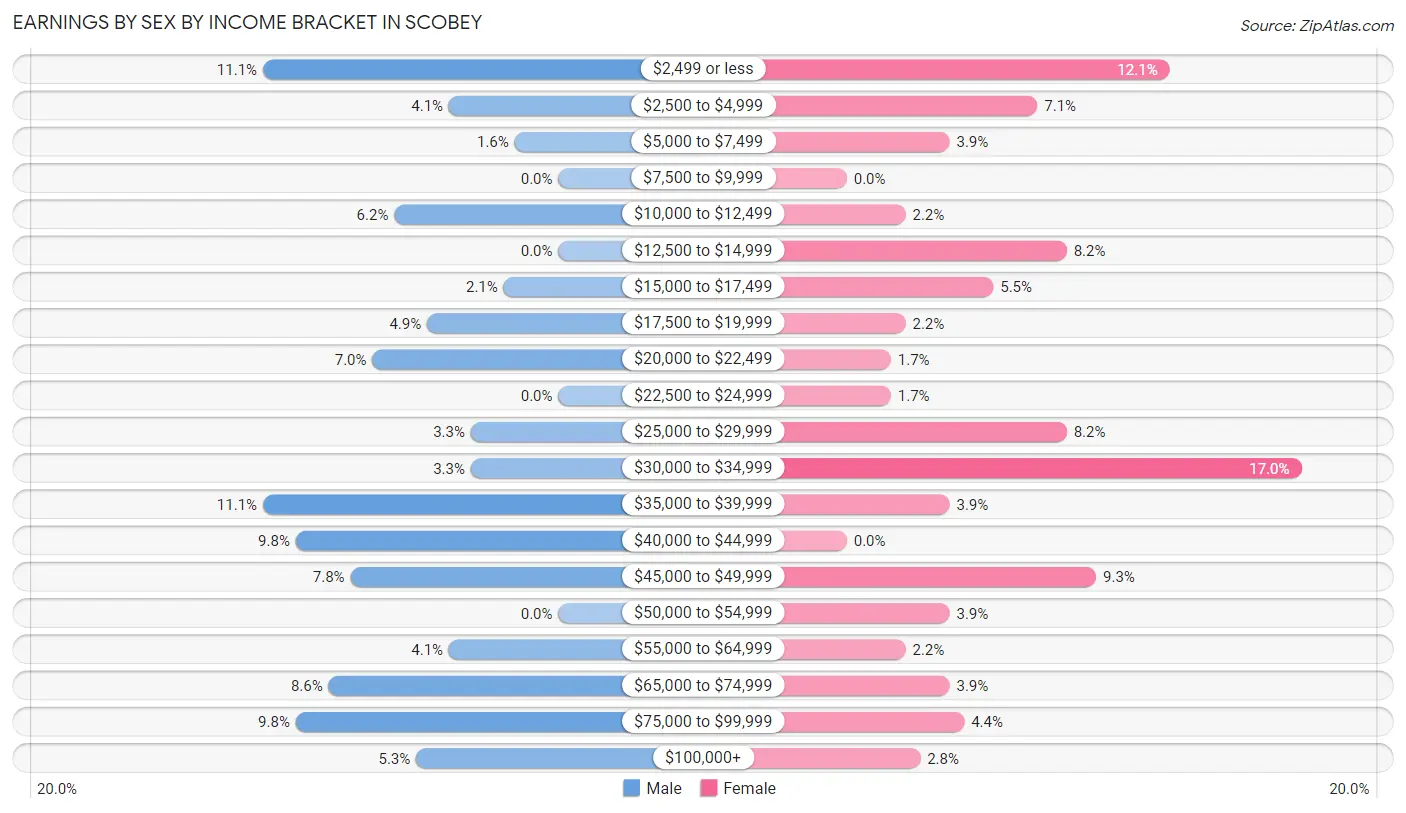
Earnings by Sex by Income Bracket in Scobey
The most common earnings brackets in Scobey are $2,499 or less for men (27 | 11.1%) and $30,000 to $34,999 for women (31 | 17.0%).
| Income | Male | Female |
| $2,499 or less | 27 (11.1%) | 22 (12.1%) |
| $2,500 to $4,999 | 10 (4.1%) | 13 (7.1%) |
| $5,000 to $7,499 | 4 (1.6%) | 7 (3.8%) |
| $7,500 to $9,999 | 0 (0.0%) | 0 (0.0%) |
| $10,000 to $12,499 | 15 (6.1%) | 4 (2.2%) |
| $12,500 to $14,999 | 0 (0.0%) | 15 (8.2%) |
| $15,000 to $17,499 | 5 (2.1%) | 10 (5.5%) |
| $17,500 to $19,999 | 12 (4.9%) | 4 (2.2%) |
| $20,000 to $22,499 | 17 (7.0%) | 3 (1.7%) |
| $22,500 to $24,999 | 0 (0.0%) | 3 (1.7%) |
| $25,000 to $29,999 | 8 (3.3%) | 15 (8.2%) |
| $30,000 to $34,999 | 8 (3.3%) | 31 (17.0%) |
| $35,000 to $39,999 | 27 (11.1%) | 7 (3.8%) |
| $40,000 to $44,999 | 24 (9.8%) | 0 (0.0%) |
| $45,000 to $49,999 | 19 (7.8%) | 17 (9.3%) |
| $50,000 to $54,999 | 0 (0.0%) | 7 (3.8%) |
| $55,000 to $64,999 | 10 (4.1%) | 4 (2.2%) |
| $65,000 to $74,999 | 21 (8.6%) | 7 (3.8%) |
| $75,000 to $99,999 | 24 (9.8%) | 8 (4.4%) |
| $100,000+ | 13 (5.3%) | 5 (2.8%) |
| Total | 244 (100.0%) | 182 (100.0%) |
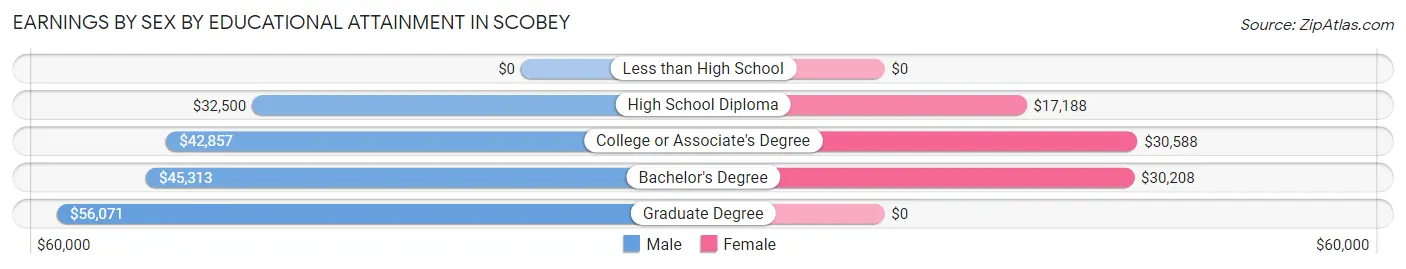
Earnings by Sex by Educational Attainment in Scobey
Average earnings in Scobey are $42,560 for men and $30,000 for women, a difference of 29.5%. Men with an educational attainment of graduate degree enjoy the highest average annual earnings of $56,071, while those with high school diploma education earn the least with $32,500. Women with an educational attainment of college or associate's degree earn the most with the average annual earnings of $30,588, while those with high school diploma education have the smallest earnings of $17,188.
| Educational Attainment | Male Income | Female Income |
| Less than High School | - | - |
| High School Diploma | $32,500 | $17,188 |
| College or Associate's Degree | $42,857 | $30,588 |
| Bachelor's Degree | $45,313 | $30,208 |
| Graduate Degree | $56,071 | $0 |
| Total | $42,560 | $30,000 |
Family Income in Scobey
Family Income Brackets in Scobey
According to the Scobey family income data, there are 52 families falling into the $75,000 to $99,999 income range, which is the most common income bracket and makes up 30.6% of all families.
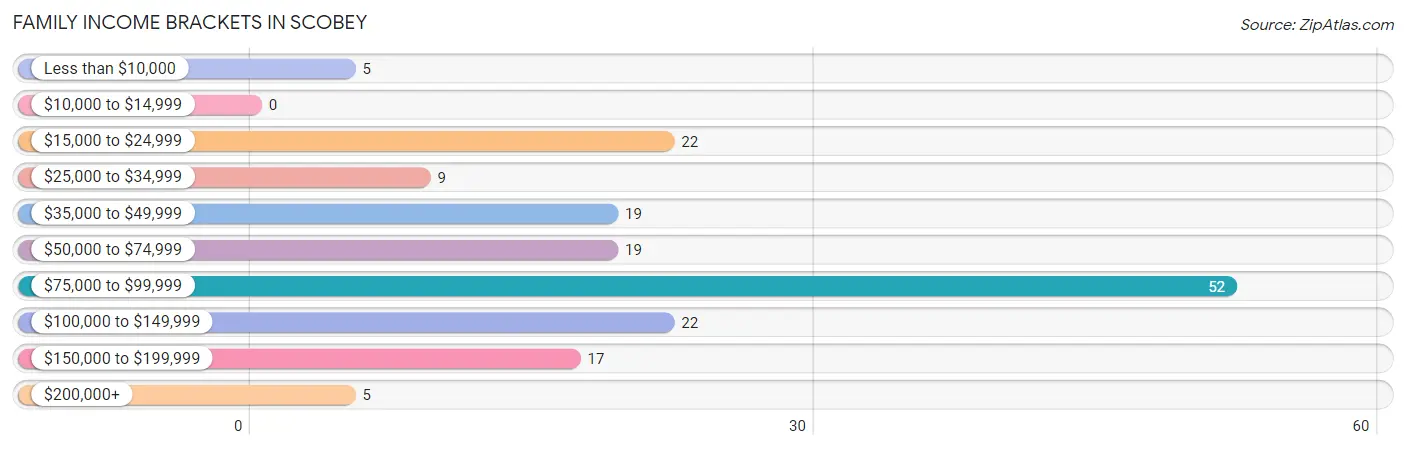
| Income Bracket | # Families | % Families |
| Less than $10,000 | 5 | 2.9% |
| $10,000 to $14,999 | 0 | 0.0% |
| $15,000 to $24,999 | 22 | 12.9% |
| $25,000 to $34,999 | 9 | 5.3% |
| $35,000 to $49,999 | 19 | 11.2% |
| $50,000 to $74,999 | 19 | 11.2% |
| $75,000 to $99,999 | 52 | 30.6% |
| $100,000 to $149,999 | 22 | 12.9% |
| $150,000 to $199,999 | 17 | 10.0% |
| $200,000+ | 5 | 2.9% |
Family Income by Famaliy Size in Scobey
4-person families (11 | 6.5%) account for the highest median family income in Scobey with $87,292 per family, while 2-person families (121 | 71.2%) have the highest median income of $38,594 per family member.
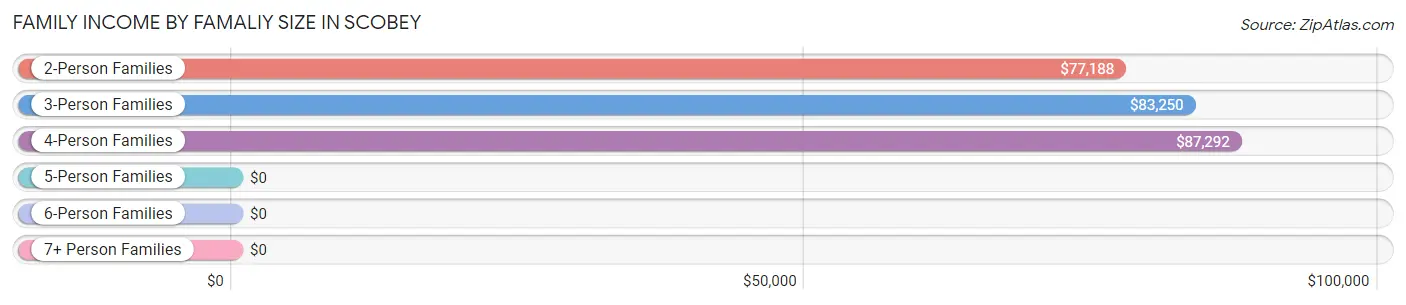
| Income Bracket | # Families | Median Income |
| 2-Person Families | 121 (71.2%) | $77,188 |
| 3-Person Families | 30 (17.6%) | $83,250 |
| 4-Person Families | 11 (6.5%) | $87,292 |
| 5-Person Families | 5 (2.9%) | $0 |
| 6-Person Families | 3 (1.8%) | $0 |
| 7+ Person Families | 0 (0.0%) | $0 |
| Total | 170 (100.0%) | $83,594 |
Family Income by Number of Earners in Scobey
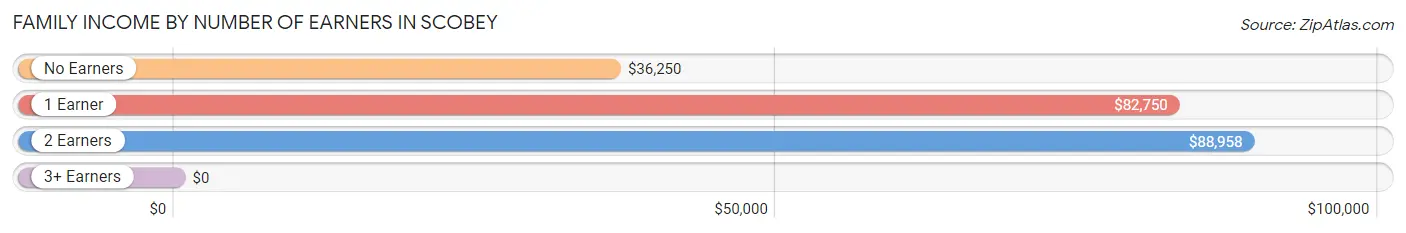
| Number of Earners | # Families | Median Income |
| No Earners | 30 (17.6%) | $36,250 |
| 1 Earner | 59 (34.7%) | $82,750 |
| 2 Earners | 71 (41.8%) | $88,958 |
| 3+ Earners | 10 (5.9%) | $0 |
| Total | 170 (100.0%) | $83,594 |
Household Income in Scobey
Household Income Brackets in Scobey
With 111 households falling in the category, the $35,000 to $49,999 income range is the most frequent in Scobey, accounting for 26.1% of all households. In contrast, only 5 households (1.2%) fall into the $200,000+ income bracket, making it the least populous group.
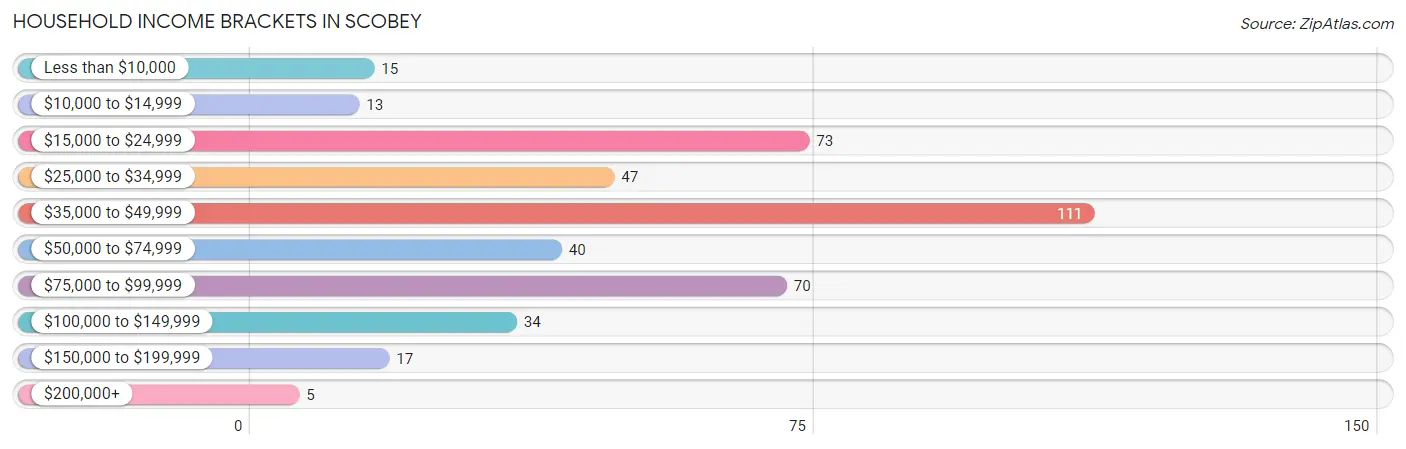
| Income Bracket | # Households | % Households |
| Less than $10,000 | 15 | 3.5% |
| $10,000 to $14,999 | 13 | 3.1% |
| $15,000 to $24,999 | 73 | 17.2% |
| $25,000 to $34,999 | 47 | 11.1% |
| $35,000 to $49,999 | 111 | 26.1% |
| $50,000 to $74,999 | 40 | 9.4% |
| $75,000 to $99,999 | 70 | 16.5% |
| $100,000 to $149,999 | 34 | 8.0% |
| $150,000 to $199,999 | 17 | 4.0% |
| $200,000+ | 5 | 1.2% |
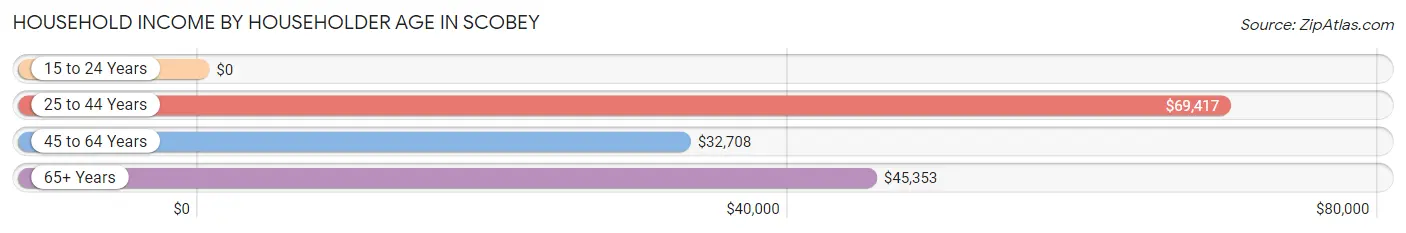
Household Income by Householder Age in Scobey
The median household income in Scobey is $44,583, with the highest median household income of $69,417 found in the 25 to 44 years age bracket for the primary householder. A total of 93 households (21.9%) fall into this category.
| Income Bracket | # Households | Median Income |
| 15 to 24 Years | 0 (0.0%) | $0 |
| 25 to 44 Years | 93 (21.9%) | $69,417 |
| 45 to 64 Years | 111 (26.1%) | $32,708 |
| 65+ Years | 221 (52.0%) | $45,353 |
| Total | 425 (100.0%) | $44,583 |
Poverty in Scobey
Income Below Poverty by Sex and Age in Scobey
With 3.5% poverty level for males and 8.4% for females among the residents of Scobey, 45 to 54 year old males and 45 to 54 year old females are the most vulnerable to poverty, with 5 males (12.2%) and 9 females (27.3%) in their respective age groups living below the poverty level.
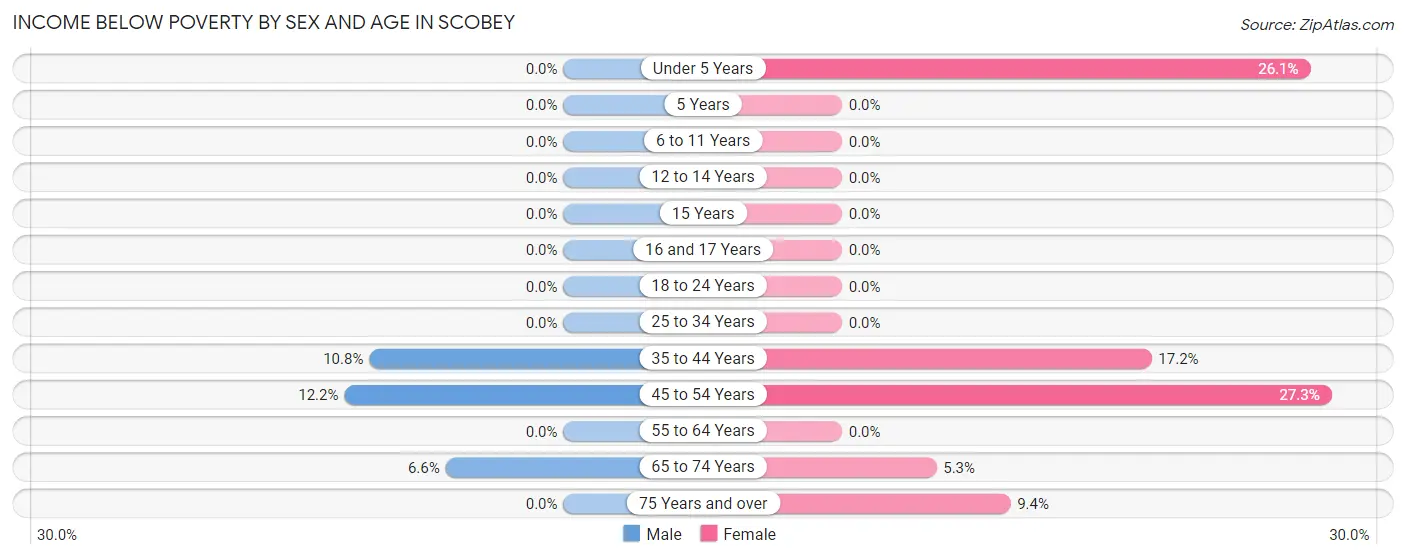
| Age Bracket | Male | Female |
| Under 5 Years | 0 (0.0%) | 6 (26.1%) |
| 5 Years | 0 (0.0%) | 0 (0.0%) |
| 6 to 11 Years | 0 (0.0%) | 0 (0.0%) |
| 12 to 14 Years | 0 (0.0%) | 0 (0.0%) |
| 15 Years | 0 (0.0%) | 0 (0.0%) |
| 16 and 17 Years | 0 (0.0%) | 0 (0.0%) |
| 18 to 24 Years | 0 (0.0%) | 0 (0.0%) |
| 25 to 34 Years | 0 (0.0%) | 0 (0.0%) |
| 35 to 44 Years | 4 (10.8%) | 5 (17.2%) |
| 45 to 54 Years | 5 (12.2%) | 9 (27.3%) |
| 55 to 64 Years | 0 (0.0%) | 0 (0.0%) |
| 65 to 74 Years | 4 (6.6%) | 7 (5.3%) |
| 75 Years and over | 0 (0.0%) | 6 (9.4%) |
| Total | 13 (3.5%) | 33 (8.4%) |
Income Above Poverty by Sex and Age in Scobey
According to the poverty statistics in Scobey, males aged under 5 years and females aged 6 to 11 years are the age groups that are most secure financially, with 100.0% of males and 100.0% of females in these age groups living above the poverty line.
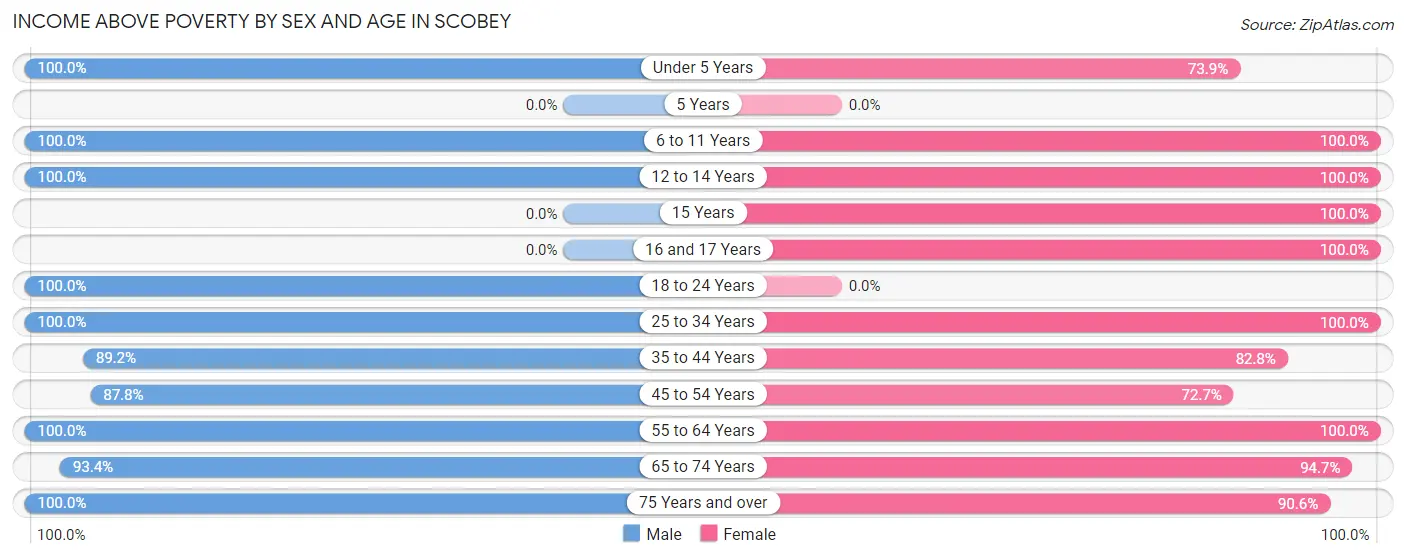
| Age Bracket | Male | Female |
| Under 5 Years | 11 (100.0%) | 17 (73.9%) |
| 5 Years | 0 (0.0%) | 0 (0.0%) |
| 6 to 11 Years | 13 (100.0%) | 6 (100.0%) |
| 12 to 14 Years | 16 (100.0%) | 20 (100.0%) |
| 15 Years | 0 (0.0%) | 4 (100.0%) |
| 16 and 17 Years | 0 (0.0%) | 20 (100.0%) |
| 18 to 24 Years | 29 (100.0%) | 0 (0.0%) |
| 25 to 34 Years | 60 (100.0%) | 27 (100.0%) |
| 35 to 44 Years | 33 (89.2%) | 24 (82.8%) |
| 45 to 54 Years | 36 (87.8%) | 24 (72.7%) |
| 55 to 64 Years | 60 (100.0%) | 35 (100.0%) |
| 65 to 74 Years | 57 (93.4%) | 126 (94.7%) |
| 75 Years and over | 44 (100.0%) | 58 (90.6%) |
| Total | 359 (96.5%) | 361 (91.6%) |
Income Below Poverty Among Married-Couple Families in Scobey
The poverty statistics for married-couple families in Scobey show that 3.7% or 5 of the total 136 families live below the poverty line. Families with no children have the highest poverty rate of 4.5%, comprising of 5 families. On the other hand, families with 1 or 2 children have the lowest poverty rate of 0.0%, which includes 0 families.
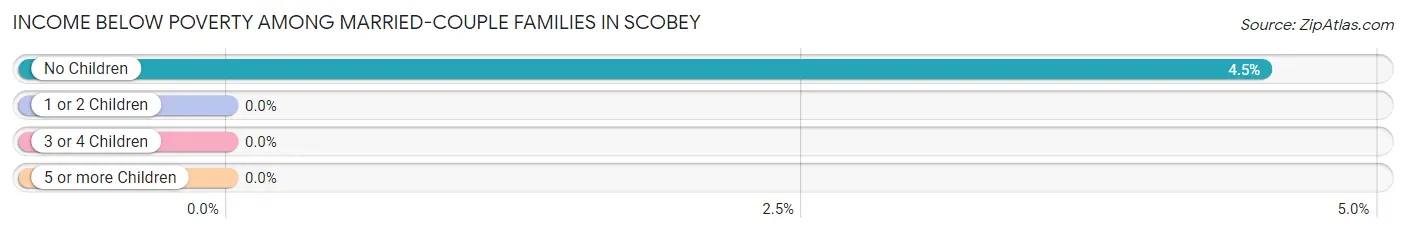
| Children | Above Poverty | Below Poverty |
| No Children | 106 (95.5%) | 5 (4.5%) |
| 1 or 2 Children | 22 (100.0%) | 0 (0.0%) |
| 3 or 4 Children | 3 (100.0%) | 0 (0.0%) |
| 5 or more Children | 0 (0.0%) | 0 (0.0%) |
| Total | 131 (96.3%) | 5 (3.7%) |
Income Below Poverty Among Single-Parent Households in Scobey
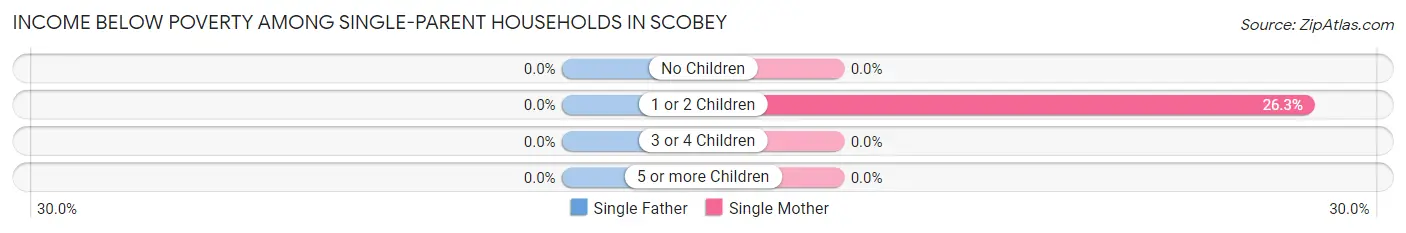
| Children | Single Father | Single Mother |
| No Children | 0 (0.0%) | 0 (0.0%) |
| 1 or 2 Children | 0 (0.0%) | 5 (26.3%) |
| 3 or 4 Children | 0 (0.0%) | 0 (0.0%) |
| 5 or more Children | 0 (0.0%) | 0 (0.0%) |
| Total | 0 (0.0%) | 5 (17.2%) |
Income Below Poverty Among Married-Couple vs Single-Parent Households in Scobey
The poverty data for Scobey shows that 5 of the married-couple family households (3.7%) and 5 of the single-parent households (14.7%) are living below the poverty level. Within the married-couple family households, those with no children have the highest poverty rate, with 5 households (4.5%) falling below the poverty line. Among the single-parent households, those with 1 or 2 children have the highest poverty rate, with 5 household (26.3%) living below poverty.
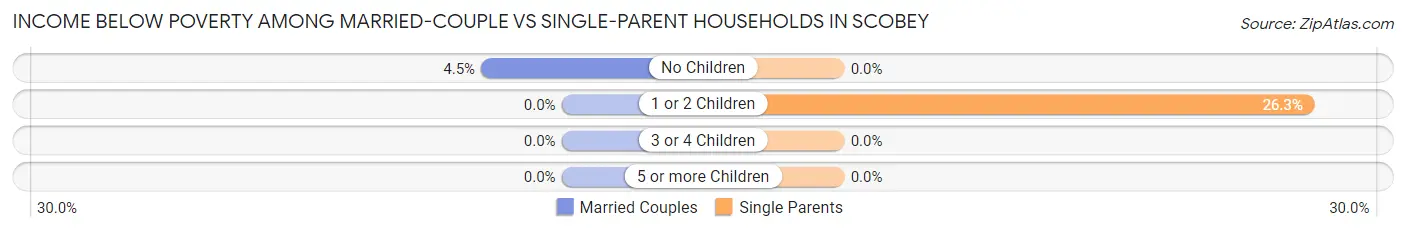
| Children | Married-Couple Families | Single-Parent Households |
| No Children | 5 (4.5%) | 0 (0.0%) |
| 1 or 2 Children | 0 (0.0%) | 5 (26.3%) |
| 3 or 4 Children | 0 (0.0%) | 0 (0.0%) |
| 5 or more Children | 0 (0.0%) | 0 (0.0%) |
| Total | 5 (3.7%) | 5 (14.7%) |
Race in Scobey
The most populous races in Scobey are White / Caucasian (714 | 90.3%), Two or more Races (35 | 4.4%), and Native / Alaskan (24 | 3.0%).
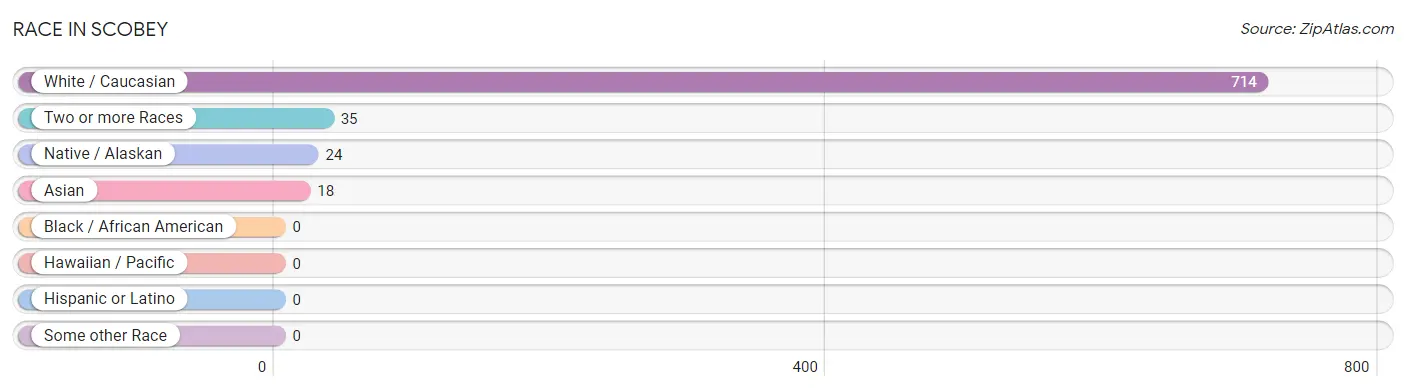
| Race | # Population | % Population |
| Asian | 18 | 2.3% |
| Black / African American | 0 | 0.0% |
| Hawaiian / Pacific | 0 | 0.0% |
| Hispanic or Latino | 0 | 0.0% |
| Native / Alaskan | 24 | 3.0% |
| White / Caucasian | 714 | 90.3% |
| Two or more Races | 35 | 4.4% |
| Some other Race | 0 | 0.0% |
| Total | 791 | 100.0% |
Ancestry in Scobey
The most populous ancestries reported in Scobey are Norwegian (217 | 27.4%), German (156 | 19.7%), European (88 | 11.1%), American (53 | 6.7%), and English (52 | 6.6%), together accounting for 71.5% of all Scobey residents.
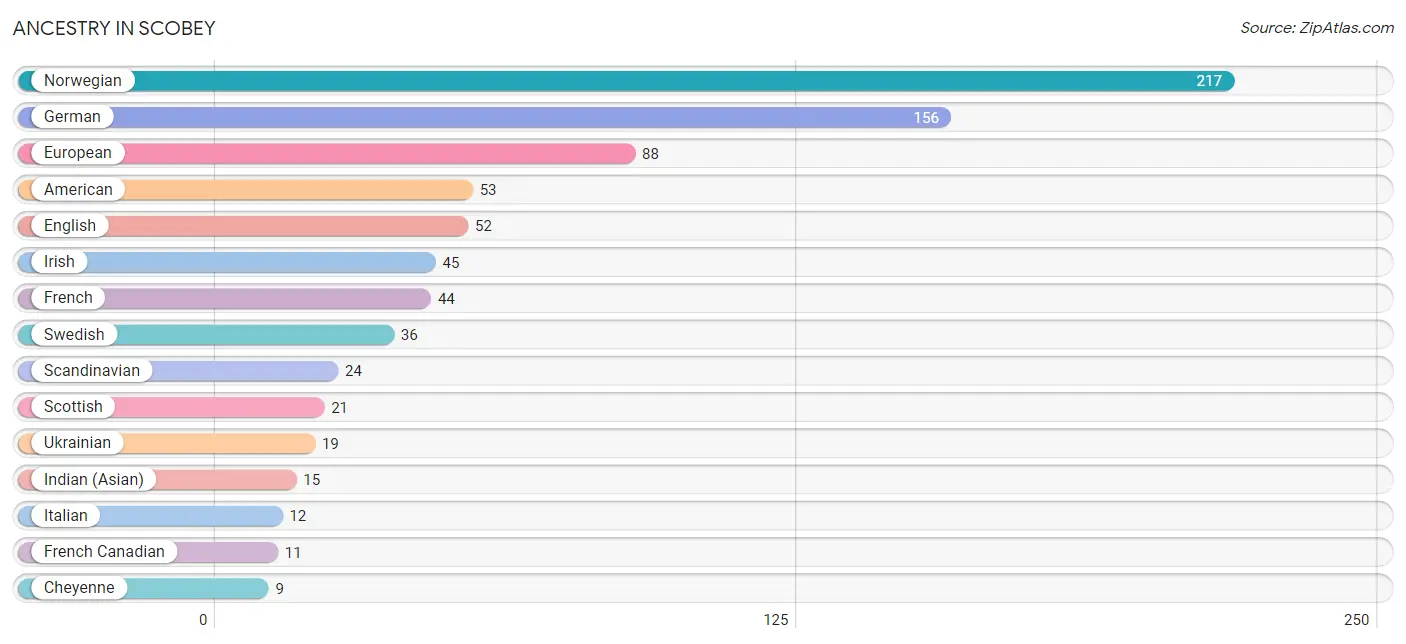
| Ancestry | # Population | % Population |
| American | 53 | 6.7% |
| Australian | 3 | 0.4% |
| Blackfeet | 1 | 0.1% |
| Cheyenne | 9 | 1.1% |
| Crow | 1 | 0.1% |
| Czech | 8 | 1.0% |
| Danish | 3 | 0.4% |
| Dutch | 6 | 0.8% |
| English | 52 | 6.6% |
| European | 88 | 11.1% |
| French | 44 | 5.6% |
| French Canadian | 11 | 1.4% |
| German | 156 | 19.7% |
| Greek | 8 | 1.0% |
| Indian (Asian) | 15 | 1.9% |
| Irish | 45 | 5.7% |
| Italian | 12 | 1.5% |
| Latvian | 3 | 0.4% |
| Northern European | 7 | 0.9% |
| Norwegian | 217 | 27.4% |
| Pakistani | 3 | 0.4% |
| Romanian | 5 | 0.6% |
| Scandinavian | 24 | 3.0% |
| Scottish | 21 | 2.6% |
| Swedish | 36 | 4.5% |
| Ukrainian | 19 | 2.4% | View All 26 Rows |
Immigrants in Scobey
The most numerous immigrant groups reported in Scobey came from Asia (18 | 2.3%), China (15 | 1.9%), Eastern Asia (15 | 1.9%), Taiwan (15 | 1.9%), and Eastern Europe (5 | 0.6%), together accounting for 8.6% of all Scobey residents.
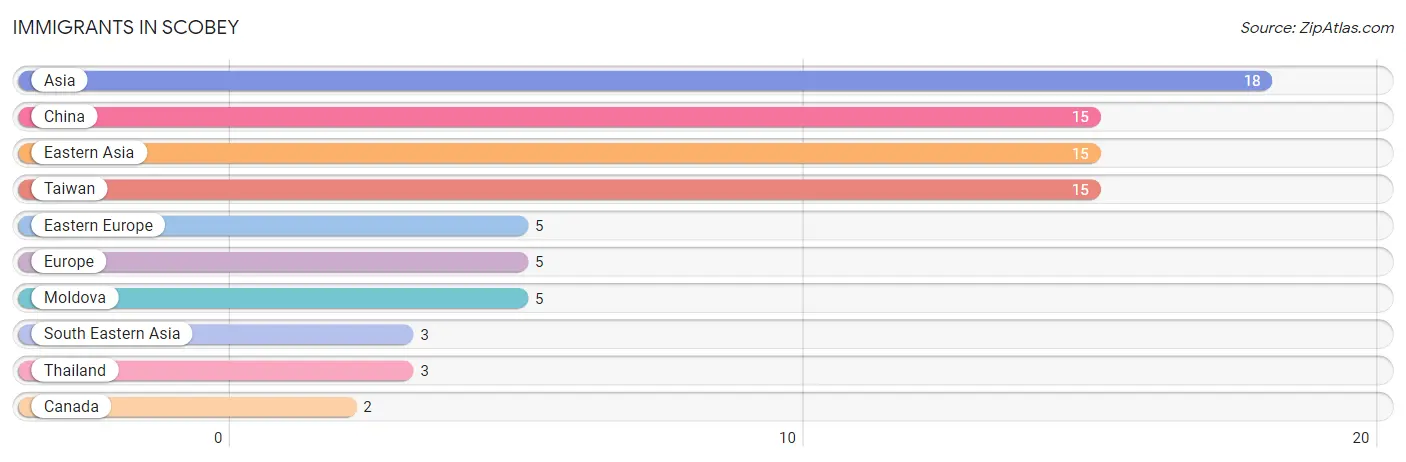
| Immigration Origin | # Population | % Population |
| Asia | 18 | 2.3% |
| Canada | 2 | 0.3% |
| China | 15 | 1.9% |
| Eastern Asia | 15 | 1.9% |
| Eastern Europe | 5 | 0.6% |
| Europe | 5 | 0.6% |
| Moldova | 5 | 0.6% |
| South Eastern Asia | 3 | 0.4% |
| Taiwan | 15 | 1.9% |
| Thailand | 3 | 0.4% | View All 10 Rows |
Sex and Age in Scobey
Sex and Age in Scobey
The most populous age groups in Scobey are 65 to 69 Years (50 | 13.2%) for men and 65 to 69 Years (72 | 17.5%) for women.
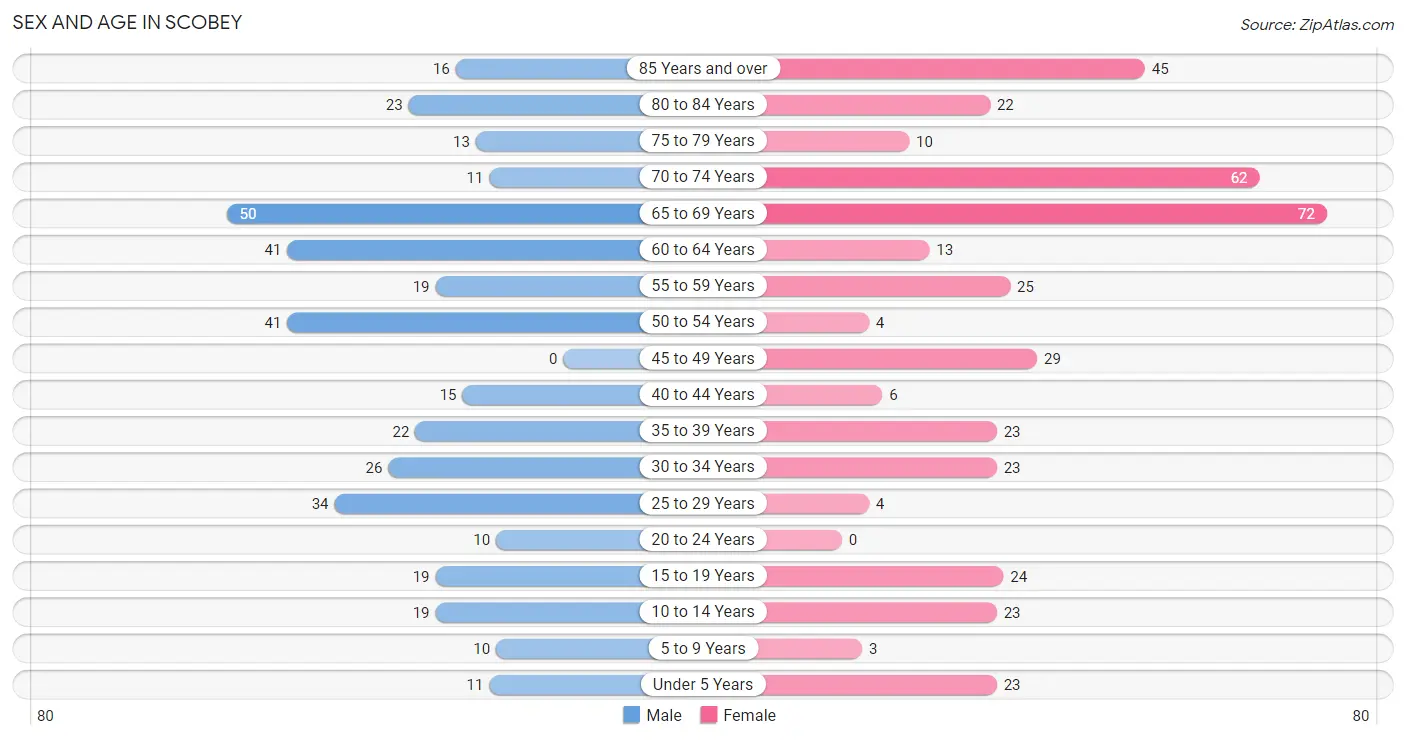
| Age Bracket | Male | Female |
| Under 5 Years | 11 (2.9%) | 23 (5.6%) |
| 5 to 9 Years | 10 (2.6%) | 3 (0.7%) |
| 10 to 14 Years | 19 (5.0%) | 23 (5.6%) |
| 15 to 19 Years | 19 (5.0%) | 24 (5.8%) |
| 20 to 24 Years | 10 (2.6%) | 0 (0.0%) |
| 25 to 29 Years | 34 (8.9%) | 4 (1.0%) |
| 30 to 34 Years | 26 (6.8%) | 23 (5.6%) |
| 35 to 39 Years | 22 (5.8%) | 23 (5.6%) |
| 40 to 44 Years | 15 (4.0%) | 6 (1.5%) |
| 45 to 49 Years | 0 (0.0%) | 29 (7.1%) |
| 50 to 54 Years | 41 (10.8%) | 4 (1.0%) |
| 55 to 59 Years | 19 (5.0%) | 25 (6.1%) |
| 60 to 64 Years | 41 (10.8%) | 13 (3.2%) |
| 65 to 69 Years | 50 (13.2%) | 72 (17.5%) |
| 70 to 74 Years | 11 (2.9%) | 62 (15.1%) |
| 75 to 79 Years | 13 (3.4%) | 10 (2.4%) |
| 80 to 84 Years | 23 (6.0%) | 22 (5.3%) |
| 85 Years and over | 16 (4.2%) | 45 (11.0%) |
| Total | 380 (100.0%) | 411 (100.0%) |
Families and Households in Scobey
Median Family Size in Scobey
The median family size in Scobey is 2.88 persons per family, with single female/mother families (29 | 17.1%) accounting for the largest median family size of 4.1 persons per family. On the other hand, married-couple families (136 | 80.0%) represent the smallest median family size with 2.60 persons per family.
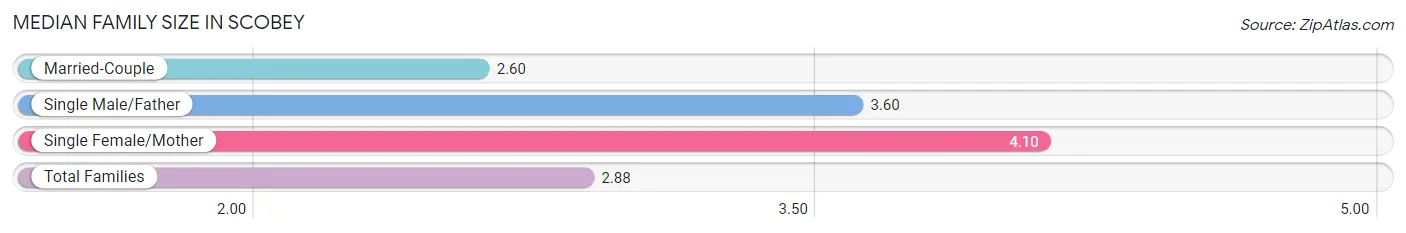
| Family Type | # Families | Family Size |
| Married-Couple | 136 (80.0%) | 2.60 |
| Single Male/Father | 5 (2.9%) | 3.60 |
| Single Female/Mother | 29 (17.1%) | 4.10 |
| Total Families | 170 (100.0%) | 2.88 |
Median Household Size in Scobey
The median household size in Scobey is 1.80 persons per household, with single female/mother households (29 | 6.8%) accounting for the largest median household size of 4.24 persons per household. non-family households (255 | 60.0%) represent the smallest median household size with 1.07 persons per household.
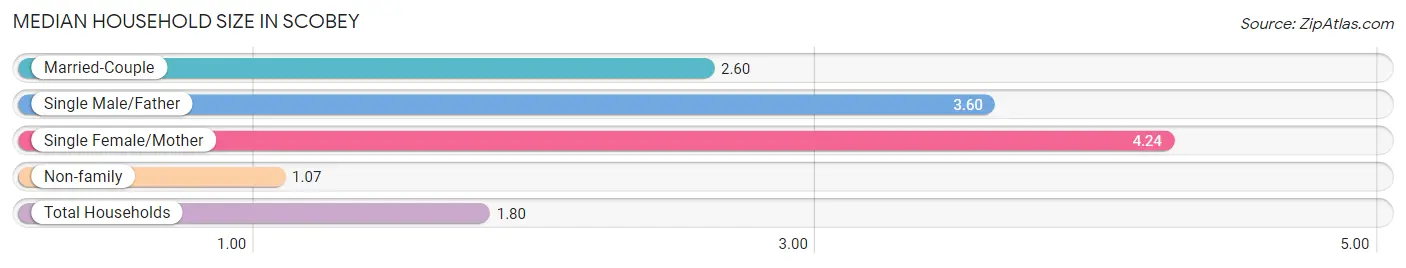
| Household Type | # Households | Household Size |
| Married-Couple | 136 (32.0%) | 2.60 |
| Single Male/Father | 5 (1.2%) | 3.60 |
| Single Female/Mother | 29 (6.8%) | 4.24 |
| Non-family | 255 (60.0%) | 1.07 |
| Total Households | 425 (100.0%) | 1.80 |
Household Size by Marriage Status in Scobey
Out of a total of 425 households in Scobey, 170 (40.0%) are family households, while 255 (60.0%) are nonfamily households. The most numerous type of family households are 2-person households, comprising 116, and the most common type of nonfamily households are 1-person households, comprising 243.
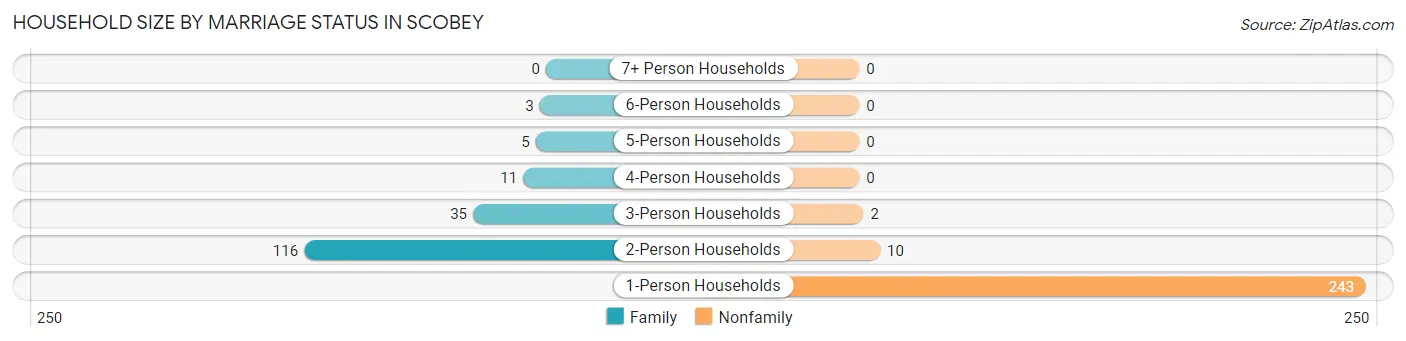
| Household Size | Family Households | Nonfamily Households |
| 1-Person Households | - | 243 (57.2%) |
| 2-Person Households | 116 (27.3%) | 10 (2.4%) |
| 3-Person Households | 35 (8.2%) | 2 (0.5%) |
| 4-Person Households | 11 (2.6%) | 0 (0.0%) |
| 5-Person Households | 5 (1.2%) | 0 (0.0%) |
| 6-Person Households | 3 (0.7%) | 0 (0.0%) |
| 7+ Person Households | 0 (0.0%) | 0 (0.0%) |
| Total | 170 (40.0%) | 255 (60.0%) |
Female Fertility in Scobey
Fertility by Age in Scobey
Average fertility rate in Scobey is 119.0 births per 1,000 women. Women in the age bracket of 35 to 50 years have the highest fertility rate with 224.0 births per 1,000 women. Women in the age bracket of 35 to 50 years acount for 100.0% of all women with births.
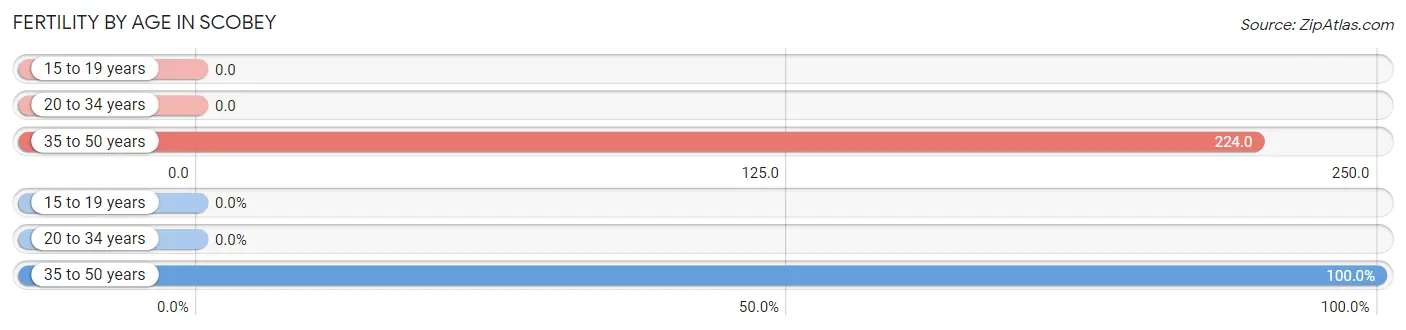
| Age Bracket | Women with Births | Births / 1,000 Women |
| 15 to 19 years | 0 (0.0%) | 0.0 |
| 20 to 34 years | 0 (0.0%) | 0.0 |
| 35 to 50 years | 13 (100.0%) | 224.0 |
| Total | 13 (100.0%) | 119.0 |
Fertility by Age by Marriage Status in Scobey
23.1% of women with births (13) in Scobey are married. The highest percentage of unmarried women with births falls into 35 to 50 years age bracket with 76.9% of them unmarried at the time of birth, while the lowest percentage of unmarried women with births belong to 35 to 50 years age bracket with 76.9% of them unmarried.
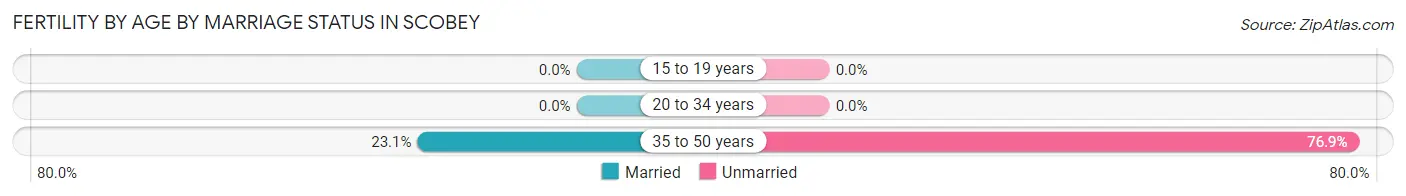
| Age Bracket | Married | Unmarried |
| 15 to 19 years | 0 (0.0%) | 0 (0.0%) |
| 20 to 34 years | 0 (0.0%) | 0 (0.0%) |
| 35 to 50 years | 3 (23.1%) | 10 (76.9%) |
| Total | 3 (23.1%) | 10 (76.9%) |
Fertility by Education in Scobey
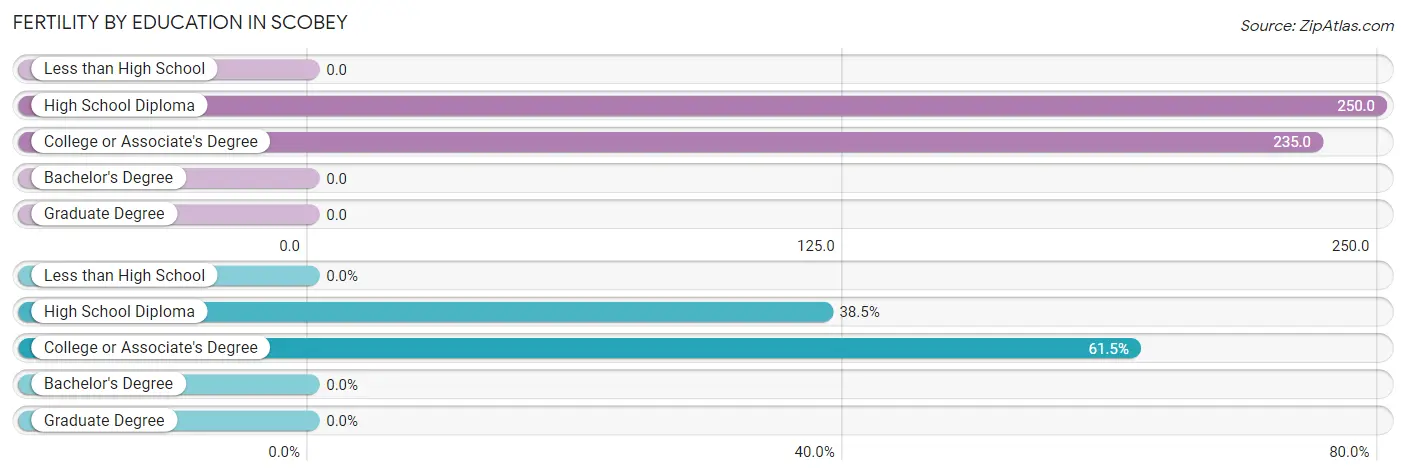
| Educational Attainment | Women with Births | Births / 1,000 Women |
| Less than High School | 0 (0.0%) | 0.0 |
| High School Diploma | 5 (38.5%) | 250.0 |
| College or Associate's Degree | 8 (61.5%) | 235.0 |
| Bachelor's Degree | 0 (0.0%) | 0.0 |
| Graduate Degree | 0 (0.0%) | 0.0 |
| Total | 13 (100.0%) | 119.0 |
Fertility by Education by Marriage Status in Scobey
76.9% of women with births in Scobey are unmarried. Women with the educational attainment of college or associate's degree are most likely to be married with 37.5% of them married at childbirth, while women with the educational attainment of high school diploma are least likely to be married with 100.0% of them unmarried at childbirth.
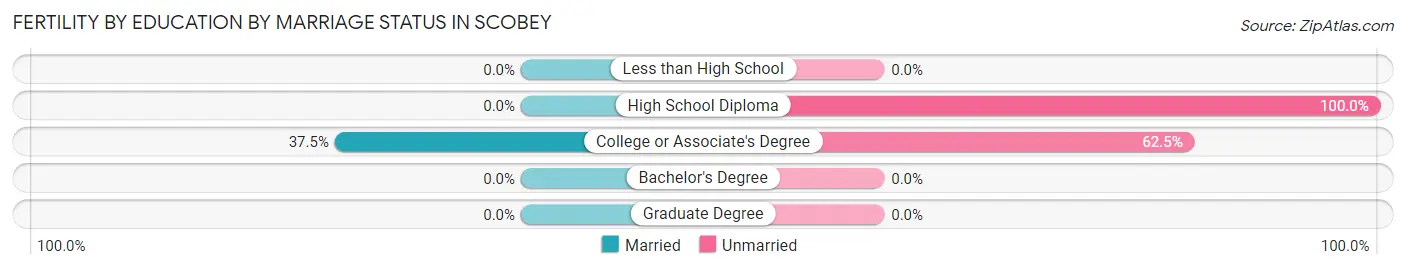
| Educational Attainment | Married | Unmarried |
| Less than High School | 0 (0.0%) | 0 (0.0%) |
| High School Diploma | 0 (0.0%) | 5 (100.0%) |
| College or Associate's Degree | 3 (37.5%) | 5 (62.5%) |
| Bachelor's Degree | 0 (0.0%) | 0 (0.0%) |
| Graduate Degree | 0 (0.0%) | 0 (0.0%) |
| Total | 3 (23.1%) | 10 (76.9%) |
Employment Characteristics in Scobey
Employment by Class of Employer in Scobey
Among the 384 employed individuals in Scobey, private company employees (194 | 50.5%), self-employed (not incorporated) (63 | 16.4%), and local government employees (54 | 14.1%) make up the most common classes of employment.
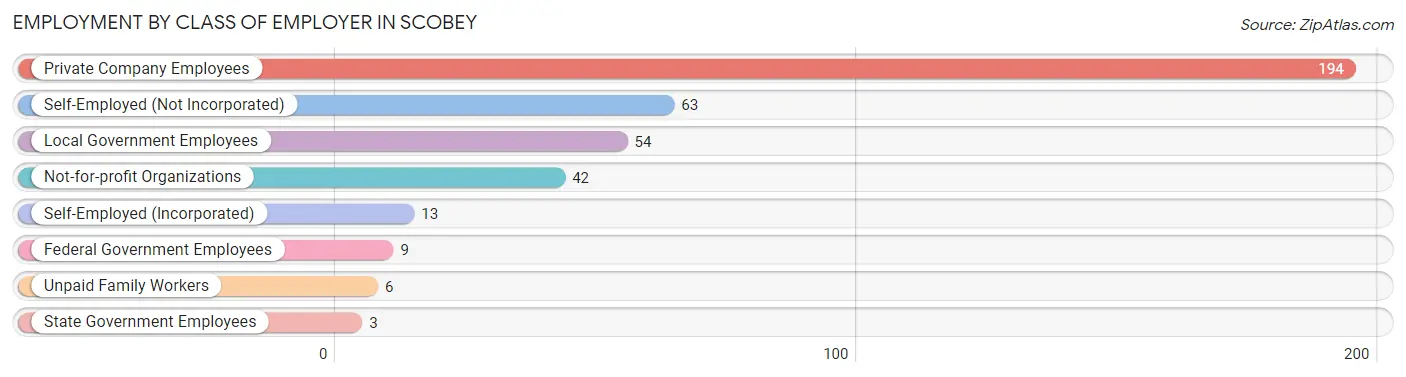
| Employer Class | # Employees | % Employees |
| Private Company Employees | 194 | 50.5% |
| Self-Employed (Incorporated) | 13 | 3.4% |
| Self-Employed (Not Incorporated) | 63 | 16.4% |
| Not-for-profit Organizations | 42 | 10.9% |
| Local Government Employees | 54 | 14.1% |
| State Government Employees | 3 | 0.8% |
| Federal Government Employees | 9 | 2.3% |
| Unpaid Family Workers | 6 | 1.6% |
| Total | 384 | 100.0% |
Employment Status by Age in Scobey
According to the labor force statistics for Scobey, out of the total population over 16 years of age (698), 58.5% or 408 individuals are in the labor force, with 1.7% or 7 of them unemployed. The age group with the highest labor force participation rate is 20 to 24 years, with 100.0% or 10 individuals in the labor force. Within the labor force, the 35 to 44 years age range has the highest percentage of unemployed individuals, with 6.8% or 4 of them being unemployed.
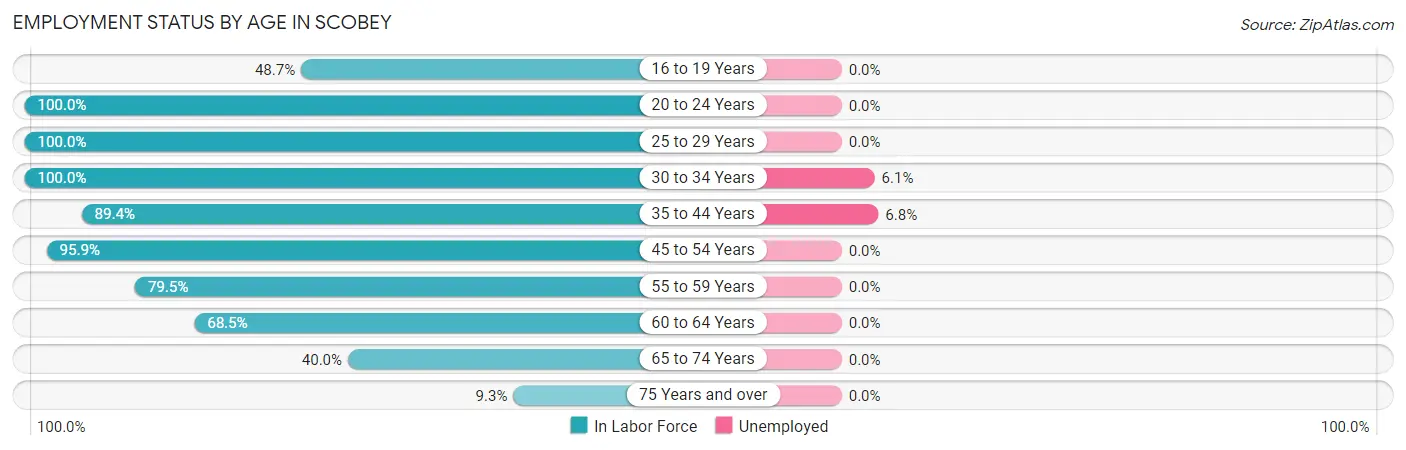
| Age Bracket | In Labor Force | Unemployed |
| 16 to 19 Years | 19 (48.7%) | 0 (0.0%) |
| 20 to 24 Years | 10 (100.0%) | 0 (0.0%) |
| 25 to 29 Years | 38 (100.0%) | 0 (0.0%) |
| 30 to 34 Years | 49 (100.0%) | 3 (6.1%) |
| 35 to 44 Years | 59 (89.4%) | 4 (6.8%) |
| 45 to 54 Years | 71 (95.9%) | 0 (0.0%) |
| 55 to 59 Years | 35 (79.5%) | 0 (0.0%) |
| 60 to 64 Years | 37 (68.5%) | 0 (0.0%) |
| 65 to 74 Years | 78 (40.0%) | 0 (0.0%) |
| 75 Years and over | 12 (9.3%) | 0 (0.0%) |
| Total | 408 (58.5%) | 7 (1.7%) |
Employment Status by Educational Attainment in Scobey
According to labor force statistics for Scobey, 88.9% of individuals (289) out of the total population between 25 and 64 years of age (325) are in the labor force, with 2.4% or 7 of them being unemployed. The group with the highest labor force participation rate are those with the educational attainment of bachelor's degree or higher, with 100.0% or 81 individuals in the labor force. Within the labor force, individuals with high school diploma education have the highest percentage of unemployment, with 4.9% or 4 of them being unemployed.
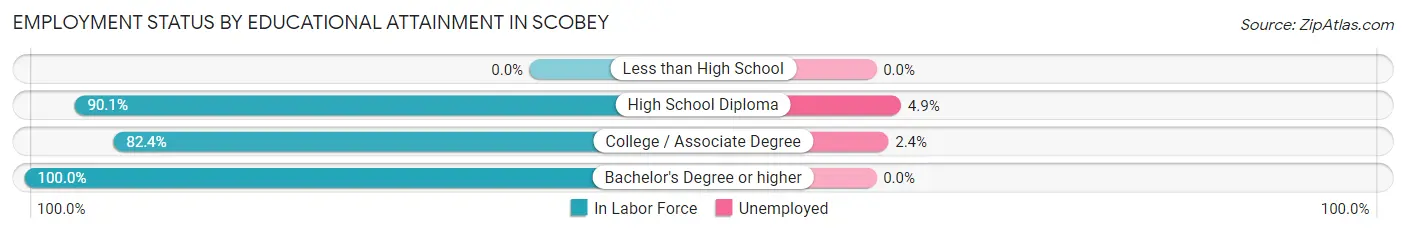
| Educational Attainment | In Labor Force | Unemployed |
| Less than High School | 0 (0.0%) | 0 (0.0%) |
| High School Diploma | 82 (90.1%) | 4 (4.9%) |
| College / Associate Degree | 126 (82.4%) | 4 (2.4%) |
| Bachelor's Degree or higher | 81 (100.0%) | 0 (0.0%) |
| Total | 289 (88.9%) | 8 (2.4%) |
Employment Occupations by Sex in Scobey
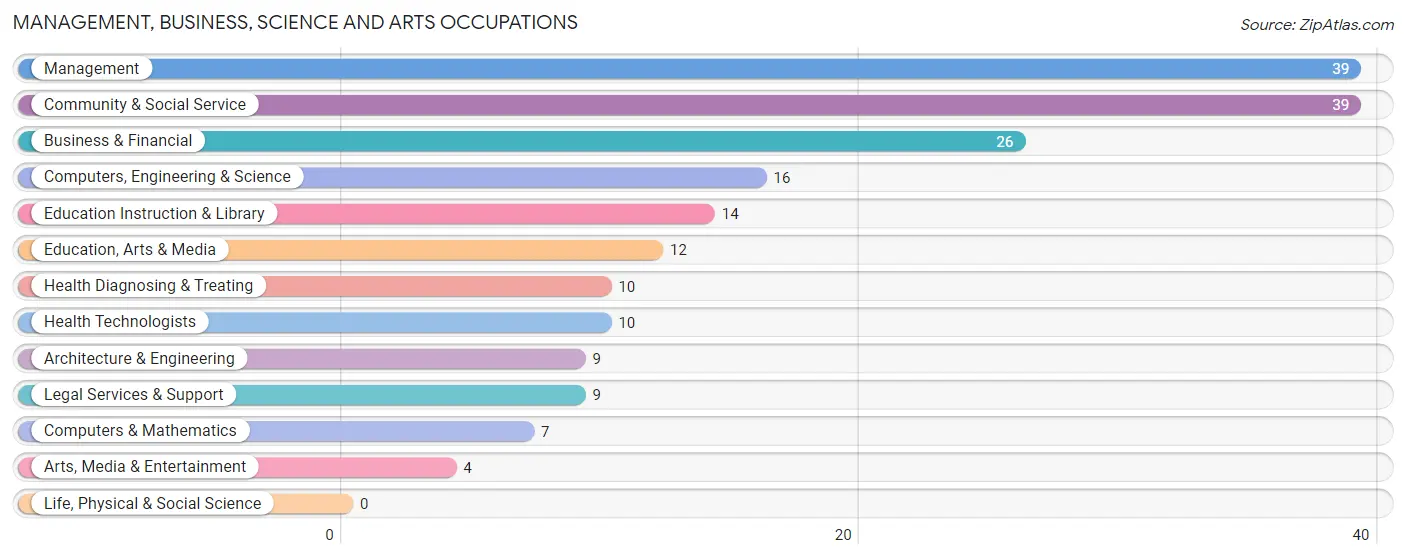
Management, Business, Science and Arts Occupations
The most common Management, Business, Science and Arts occupations in Scobey are Management (39 | 9.7%), Community & Social Service (39 | 9.7%), Business & Financial (26 | 6.5%), Computers, Engineering & Science (16 | 4.0%), and Education Instruction & Library (14 | 3.5%).
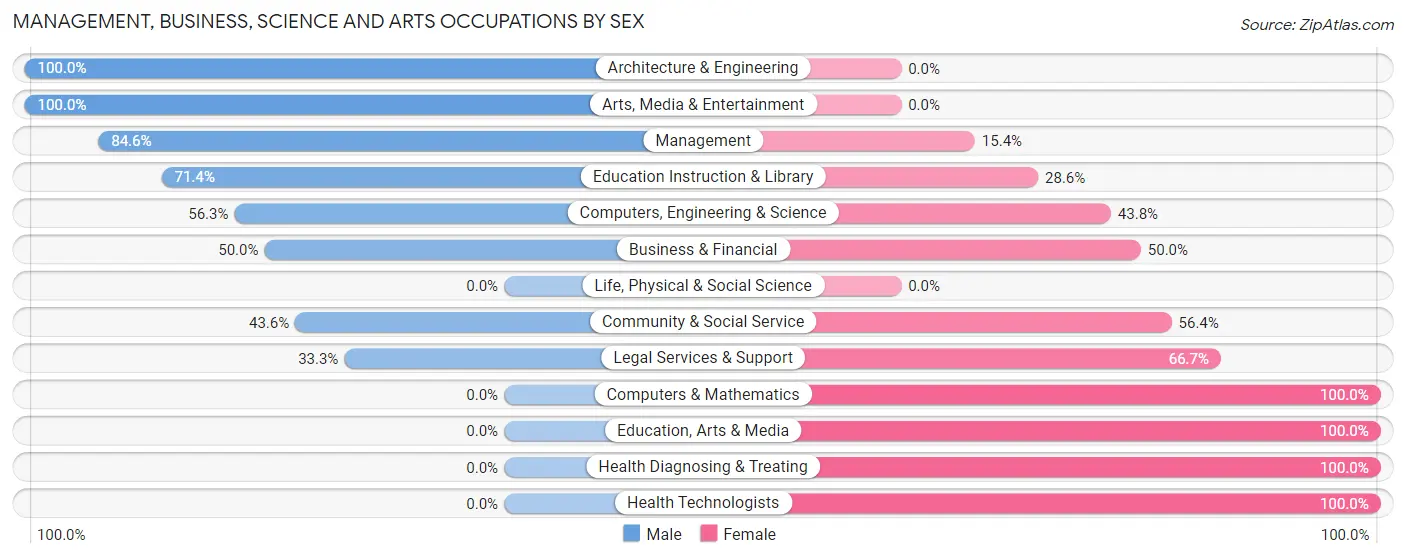
Management, Business, Science and Arts Occupations by Sex
Within the Management, Business, Science and Arts occupations in Scobey, the most male-oriented occupations are Architecture & Engineering (100.0%), Arts, Media & Entertainment (100.0%), and Management (84.6%), while the most female-oriented occupations are Computers & Mathematics (100.0%), Education, Arts & Media (100.0%), and Health Diagnosing & Treating (100.0%).
| Occupation | Male | Female |
| Management | 33 (84.6%) | 6 (15.4%) |
| Business & Financial | 13 (50.0%) | 13 (50.0%) |
| Computers, Engineering & Science | 9 (56.2%) | 7 (43.8%) |
| Computers & Mathematics | 0 (0.0%) | 7 (100.0%) |
| Architecture & Engineering | 9 (100.0%) | 0 (0.0%) |
| Life, Physical & Social Science | 0 (0.0%) | 0 (0.0%) |
| Community & Social Service | 17 (43.6%) | 22 (56.4%) |
| Education, Arts & Media | 0 (0.0%) | 12 (100.0%) |
| Legal Services & Support | 3 (33.3%) | 6 (66.7%) |
| Education Instruction & Library | 10 (71.4%) | 4 (28.6%) |
| Arts, Media & Entertainment | 4 (100.0%) | 0 (0.0%) |
| Health Diagnosing & Treating | 0 (0.0%) | 10 (100.0%) |
| Health Technologists | 0 (0.0%) | 10 (100.0%) |
| Total (Category) | 72 (55.4%) | 58 (44.6%) |
| Total (Overall) | 229 (57.1%) | 172 (42.9%) |
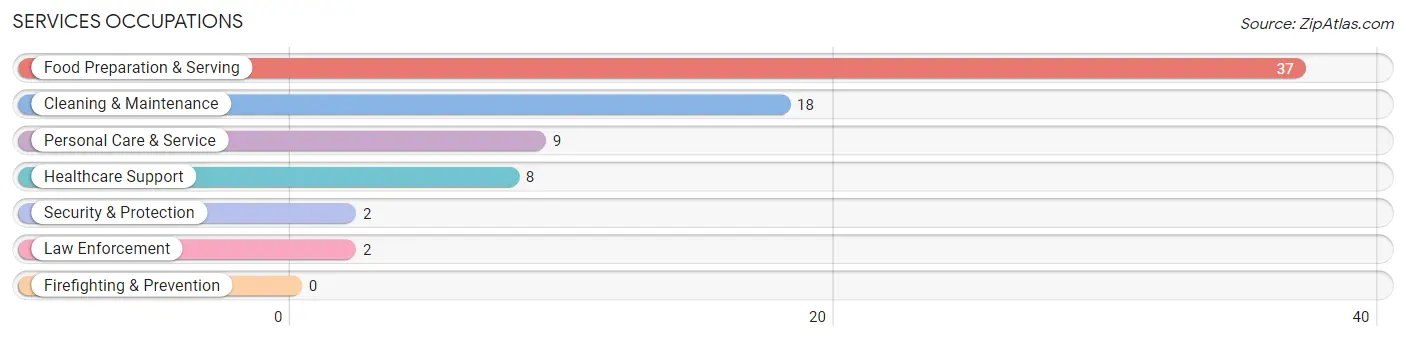
Services Occupations
The most common Services occupations in Scobey are Food Preparation & Serving (37 | 9.2%), Cleaning & Maintenance (18 | 4.5%), Personal Care & Service (9 | 2.2%), Healthcare Support (8 | 2.0%), and Security & Protection (2 | 0.5%).
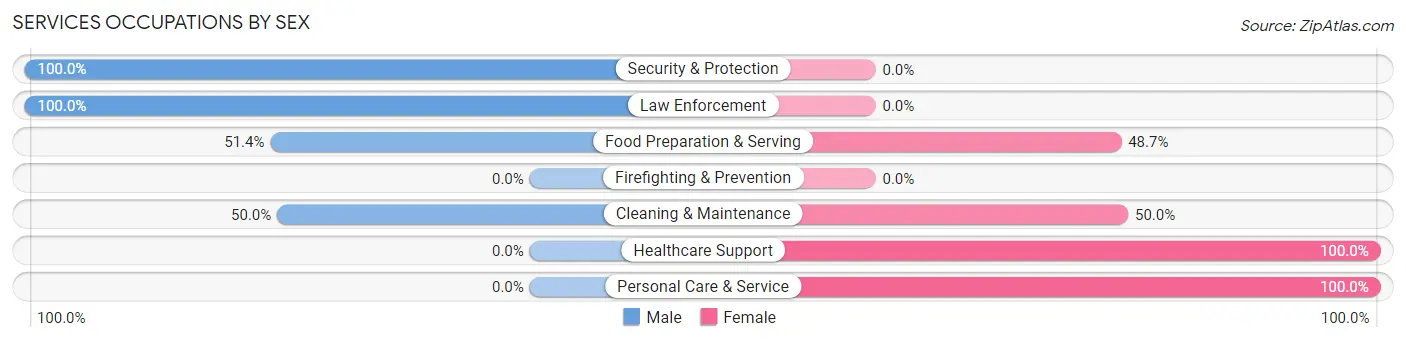
Services Occupations by Sex
Within the Services occupations in Scobey, the most male-oriented occupations are Security & Protection (100.0%), Law Enforcement (100.0%), and Food Preparation & Serving (51.3%), while the most female-oriented occupations are Healthcare Support (100.0%), Personal Care & Service (100.0%), and Cleaning & Maintenance (50.0%).
| Occupation | Male | Female |
| Healthcare Support | 0 (0.0%) | 8 (100.0%) |
| Security & Protection | 2 (100.0%) | 0 (0.0%) |
| Firefighting & Prevention | 0 (0.0%) | 0 (0.0%) |
| Law Enforcement | 2 (100.0%) | 0 (0.0%) |
| Food Preparation & Serving | 19 (51.3%) | 18 (48.6%) |
| Cleaning & Maintenance | 9 (50.0%) | 9 (50.0%) |
| Personal Care & Service | 0 (0.0%) | 9 (100.0%) |
| Total (Category) | 30 (40.5%) | 44 (59.5%) |
| Total (Overall) | 229 (57.1%) | 172 (42.9%) |
Sales and Office Occupations
The most common Sales and Office occupations in Scobey are Office & Administration (56 | 14.0%), and Sales & Related (10 | 2.5%).
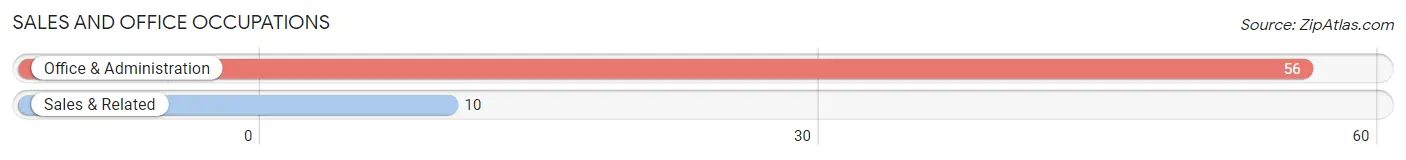
Sales and Office Occupations by Sex
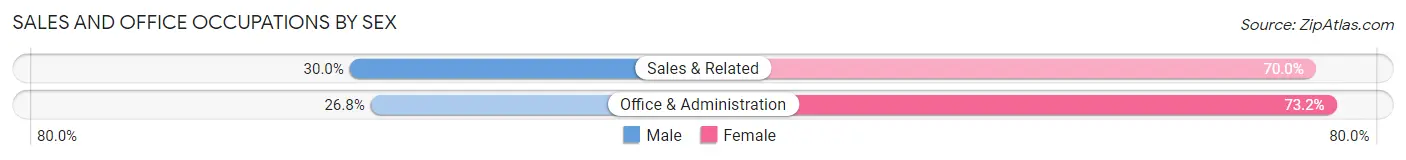
| Occupation | Male | Female |
| Sales & Related | 3 (30.0%) | 7 (70.0%) |
| Office & Administration | 15 (26.8%) | 41 (73.2%) |
| Total (Category) | 18 (27.3%) | 48 (72.7%) |
| Total (Overall) | 229 (57.1%) | 172 (42.9%) |
Natural Resources, Construction and Maintenance Occupations
The most common Natural Resources, Construction and Maintenance occupations in Scobey are Installation, Maintenance & Repair (40 | 10.0%), Farming, Fishing & Forestry (38 | 9.5%), and Construction & Extraction (4 | 1.0%).
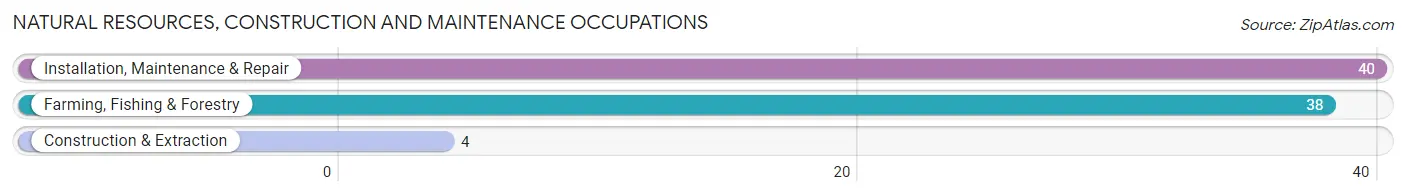
Natural Resources, Construction and Maintenance Occupations by Sex
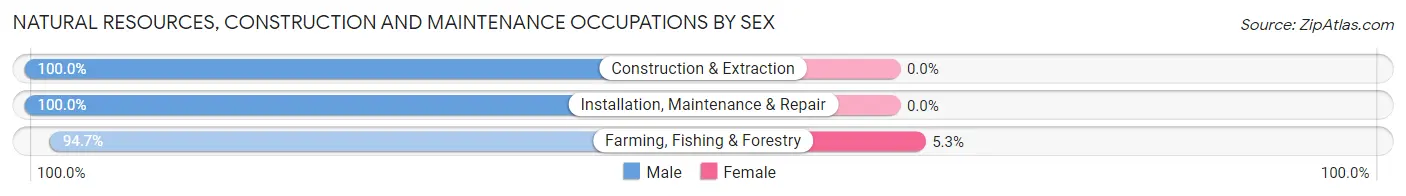
| Occupation | Male | Female |
| Farming, Fishing & Forestry | 36 (94.7%) | 2 (5.3%) |
| Construction & Extraction | 4 (100.0%) | 0 (0.0%) |
| Installation, Maintenance & Repair | 40 (100.0%) | 0 (0.0%) |
| Total (Category) | 80 (97.6%) | 2 (2.4%) |
| Total (Overall) | 229 (57.1%) | 172 (42.9%) |
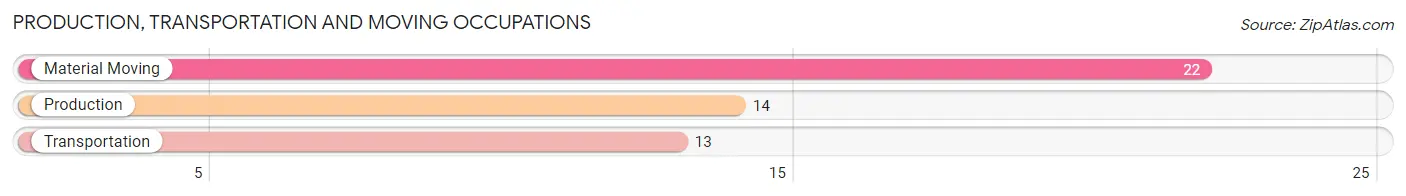
Production, Transportation and Moving Occupations
The most common Production, Transportation and Moving occupations in Scobey are Material Moving (22 | 5.5%), Production (14 | 3.5%), and Transportation (13 | 3.2%).
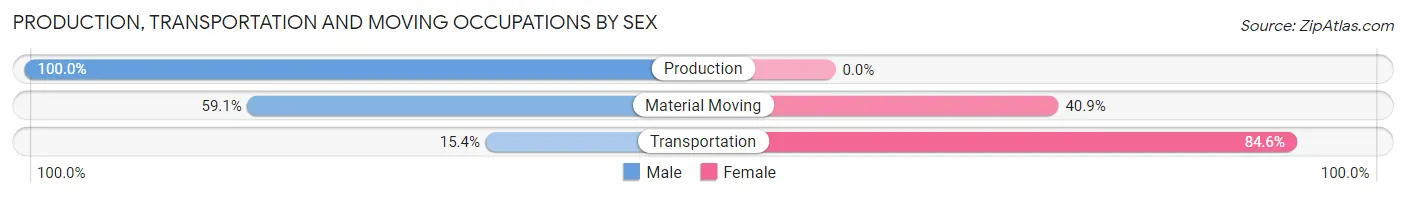
Production, Transportation and Moving Occupations by Sex
| Occupation | Male | Female |
| Production | 14 (100.0%) | 0 (0.0%) |
| Transportation | 2 (15.4%) | 11 (84.6%) |
| Material Moving | 13 (59.1%) | 9 (40.9%) |
| Total (Category) | 29 (59.2%) | 20 (40.8%) |
| Total (Overall) | 229 (57.1%) | 172 (42.9%) |
Employment Industries by Sex in Scobey
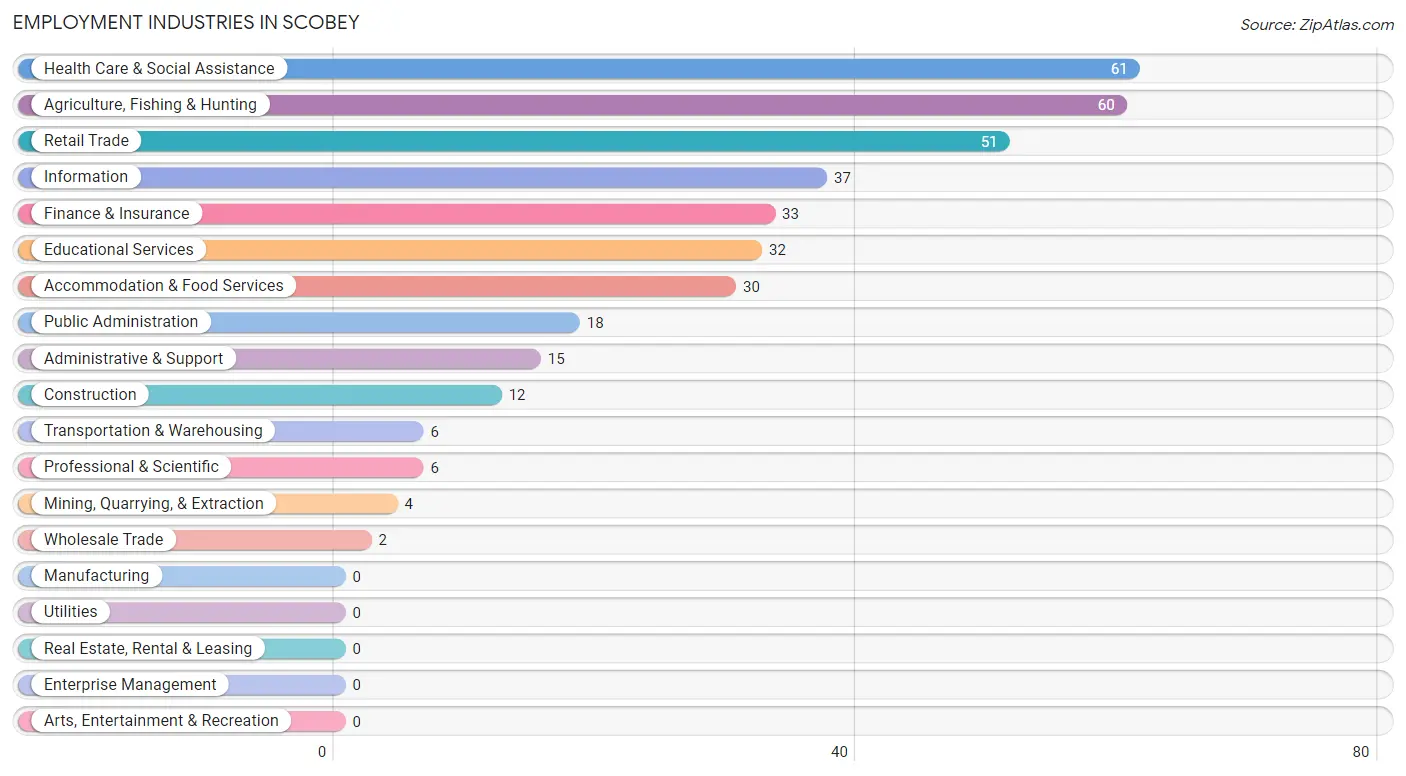
Employment Industries in Scobey
The major employment industries in Scobey include Health Care & Social Assistance (61 | 15.2%), Agriculture, Fishing & Hunting (60 | 15.0%), Retail Trade (51 | 12.7%), Information (37 | 9.2%), and Finance & Insurance (33 | 8.2%).
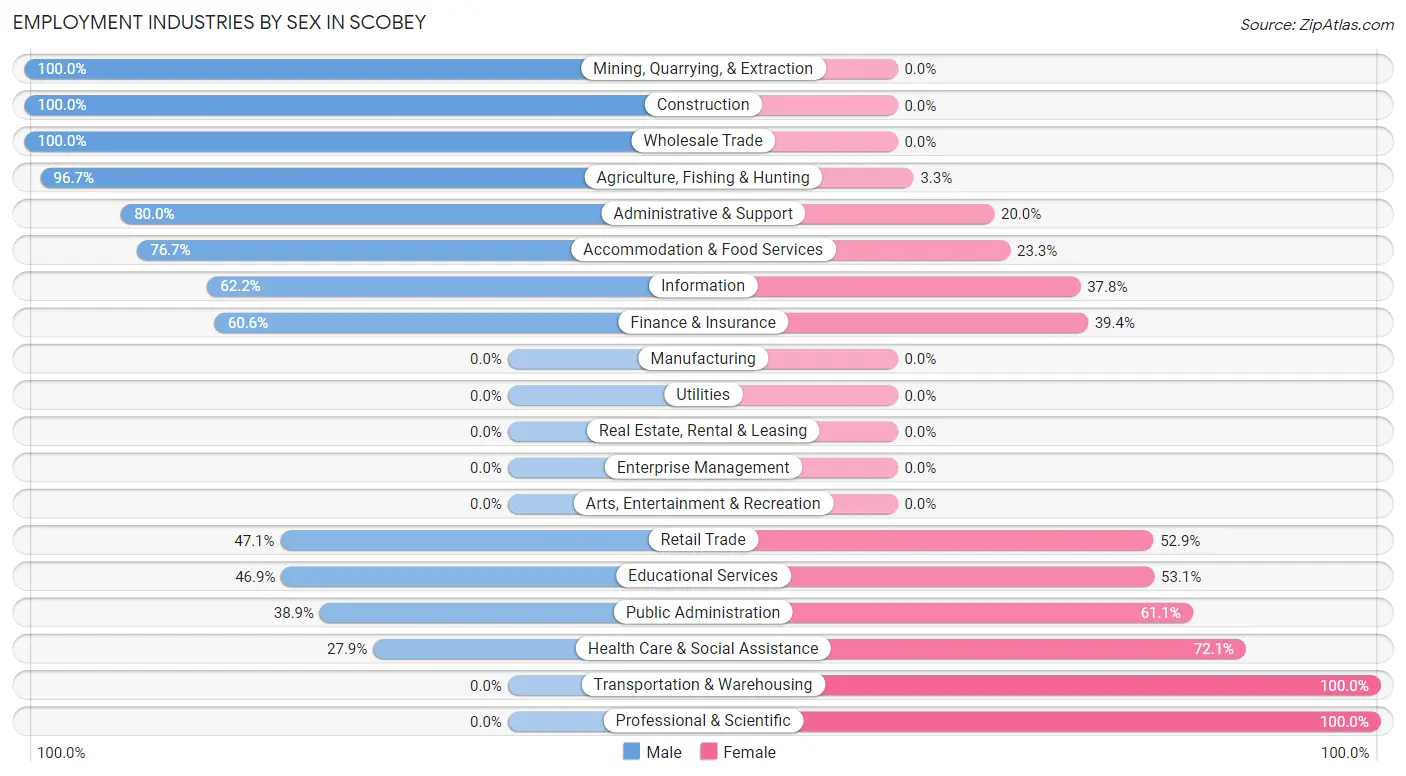
Employment Industries by Sex in Scobey
The Scobey industries that see more men than women are Mining, Quarrying, & Extraction (100.0%), Construction (100.0%), and Wholesale Trade (100.0%), whereas the industries that tend to have a higher number of women are Transportation & Warehousing (100.0%), Professional & Scientific (100.0%), and Health Care & Social Assistance (72.1%).
| Industry | Male | Female |
| Agriculture, Fishing & Hunting | 58 (96.7%) | 2 (3.3%) |
| Mining, Quarrying, & Extraction | 4 (100.0%) | 0 (0.0%) |
| Construction | 12 (100.0%) | 0 (0.0%) |
| Manufacturing | 0 (0.0%) | 0 (0.0%) |
| Wholesale Trade | 2 (100.0%) | 0 (0.0%) |
| Retail Trade | 24 (47.1%) | 27 (52.9%) |
| Transportation & Warehousing | 0 (0.0%) | 6 (100.0%) |
| Utilities | 0 (0.0%) | 0 (0.0%) |
| Information | 23 (62.2%) | 14 (37.8%) |
| Finance & Insurance | 20 (60.6%) | 13 (39.4%) |
| Real Estate, Rental & Leasing | 0 (0.0%) | 0 (0.0%) |
| Professional & Scientific | 0 (0.0%) | 6 (100.0%) |
| Enterprise Management | 0 (0.0%) | 0 (0.0%) |
| Administrative & Support | 12 (80.0%) | 3 (20.0%) |
| Educational Services | 15 (46.9%) | 17 (53.1%) |
| Health Care & Social Assistance | 17 (27.9%) | 44 (72.1%) |
| Arts, Entertainment & Recreation | 0 (0.0%) | 0 (0.0%) |
| Accommodation & Food Services | 23 (76.7%) | 7 (23.3%) |
| Public Administration | 7 (38.9%) | 11 (61.1%) |
| Total | 229 (57.1%) | 172 (42.9%) |
Education in Scobey
School Enrollment in Scobey
The most common levels of schooling among the 88 students in Scobey are high school (46 | 52.3%), middle school (29 | 33.0%), and elementary school (10 | 11.4%).
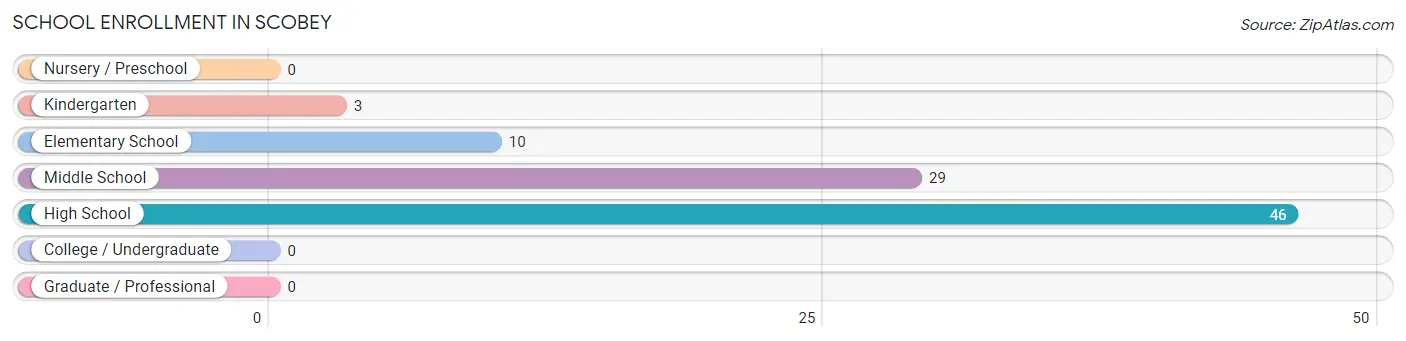
| School Level | # Students | % Students |
| Nursery / Preschool | 0 | 0.0% |
| Kindergarten | 3 | 3.4% |
| Elementary School | 10 | 11.4% |
| Middle School | 29 | 33.0% |
| High School | 46 | 52.3% |
| College / Undergraduate | 0 | 0.0% |
| Graduate / Professional | 0 | 0.0% |
| Total | 88 | 100.0% |
School Enrollment by Age by Funding Source in Scobey
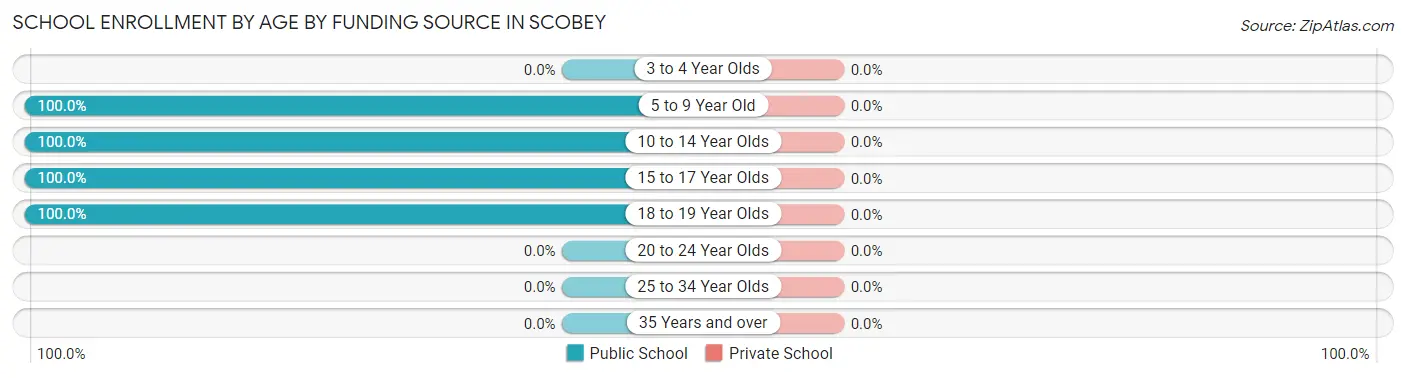
| Age Bracket | Public School | Private School |
| 3 to 4 Year Olds | 0 (0.0%) | 0 (0.0%) |
| 5 to 9 Year Old | 13 (100.0%) | 0 (0.0%) |
| 10 to 14 Year Olds | 42 (100.0%) | 0 (0.0%) |
| 15 to 17 Year Olds | 24 (100.0%) | 0 (0.0%) |
| 18 to 19 Year Olds | 9 (100.0%) | 0 (0.0%) |
| 20 to 24 Year Olds | 0 (0.0%) | 0 (0.0%) |
| 25 to 34 Year Olds | 0 (0.0%) | 0 (0.0%) |
| 35 Years and over | 0 (0.0%) | 0 (0.0%) |
| Total | 88 (100.0%) | 0 (0.0%) |
Educational Attainment by Field of Study in Scobey
Education (48 | 28.2%), business (46 | 27.1%), social sciences (17 | 10.0%), bio, nature & agricultural (16 | 9.4%), and science & technology (14 | 8.2%) are the most common fields of study among 170 individuals in Scobey who have obtained a bachelor's degree or higher.
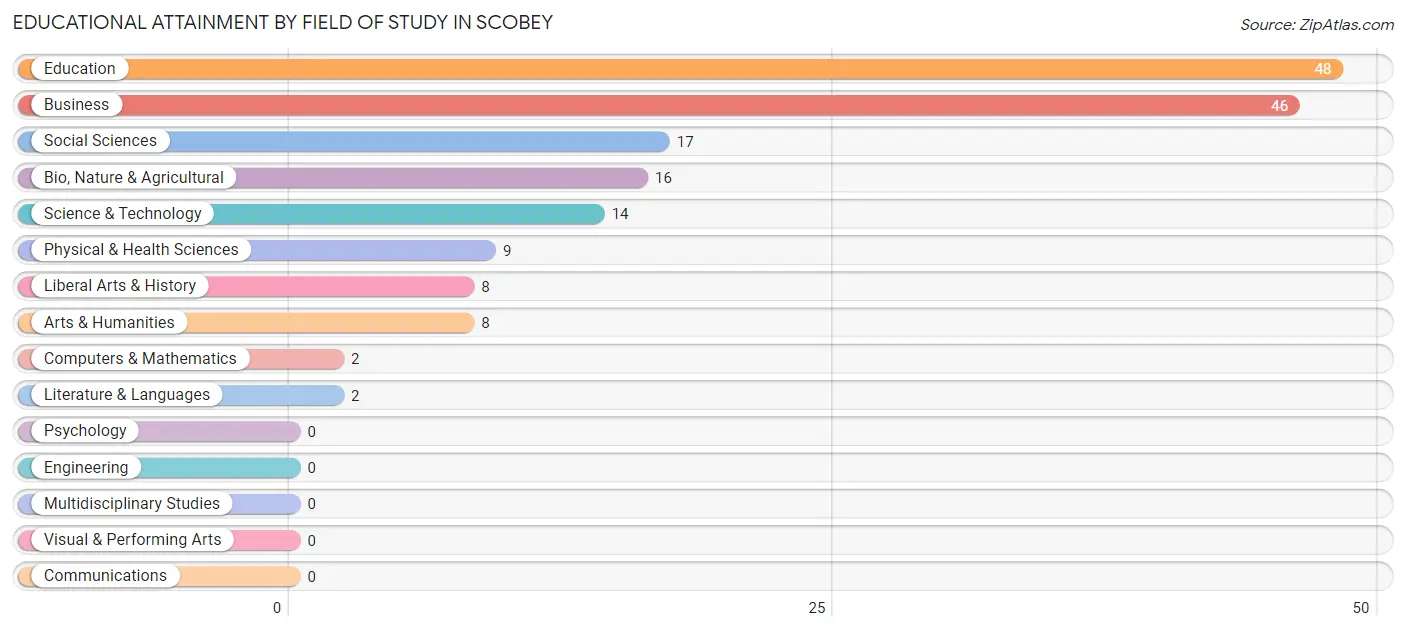
| Field of Study | # Graduates | % Graduates |
| Computers & Mathematics | 2 | 1.2% |
| Bio, Nature & Agricultural | 16 | 9.4% |
| Physical & Health Sciences | 9 | 5.3% |
| Psychology | 0 | 0.0% |
| Social Sciences | 17 | 10.0% |
| Engineering | 0 | 0.0% |
| Multidisciplinary Studies | 0 | 0.0% |
| Science & Technology | 14 | 8.2% |
| Business | 46 | 27.1% |
| Education | 48 | 28.2% |
| Literature & Languages | 2 | 1.2% |
| Liberal Arts & History | 8 | 4.7% |
| Visual & Performing Arts | 0 | 0.0% |
| Communications | 0 | 0.0% |
| Arts & Humanities | 8 | 4.7% |
| Total | 170 | 100.0% |
Transportation & Commute in Scobey
Vehicle Availability by Sex in Scobey
The most prevalent vehicle ownership categories in Scobey are males with 2 vehicles (71, accounting for 32.7%) and females with 2 vehicles (70, making up 42.5%).
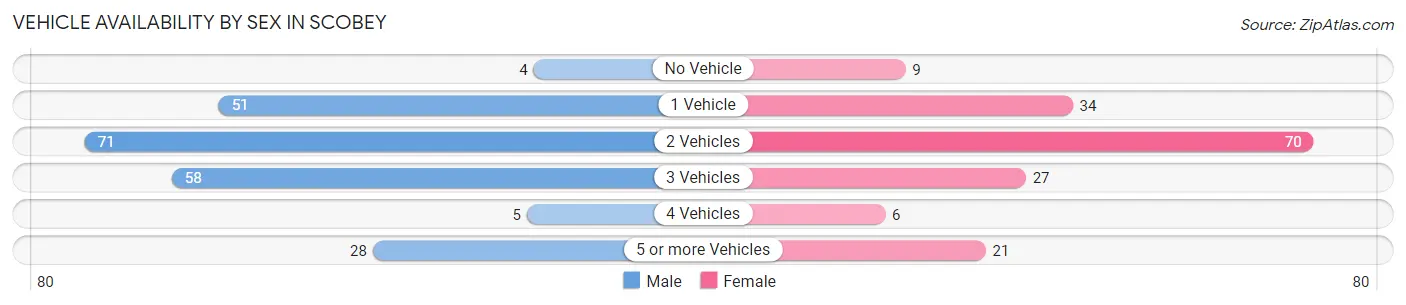
| Vehicles Available | Male | Female |
| No Vehicle | 4 (1.8%) | 9 (5.4%) |
| 1 Vehicle | 51 (23.5%) | 34 (20.4%) |
| 2 Vehicles | 71 (32.7%) | 70 (41.9%) |
| 3 Vehicles | 58 (26.7%) | 27 (16.2%) |
| 4 Vehicles | 5 (2.3%) | 6 (3.6%) |
| 5 or more Vehicles | 28 (12.9%) | 21 (12.6%) |
| Total | 217 (100.0%) | 167 (100.0%) |
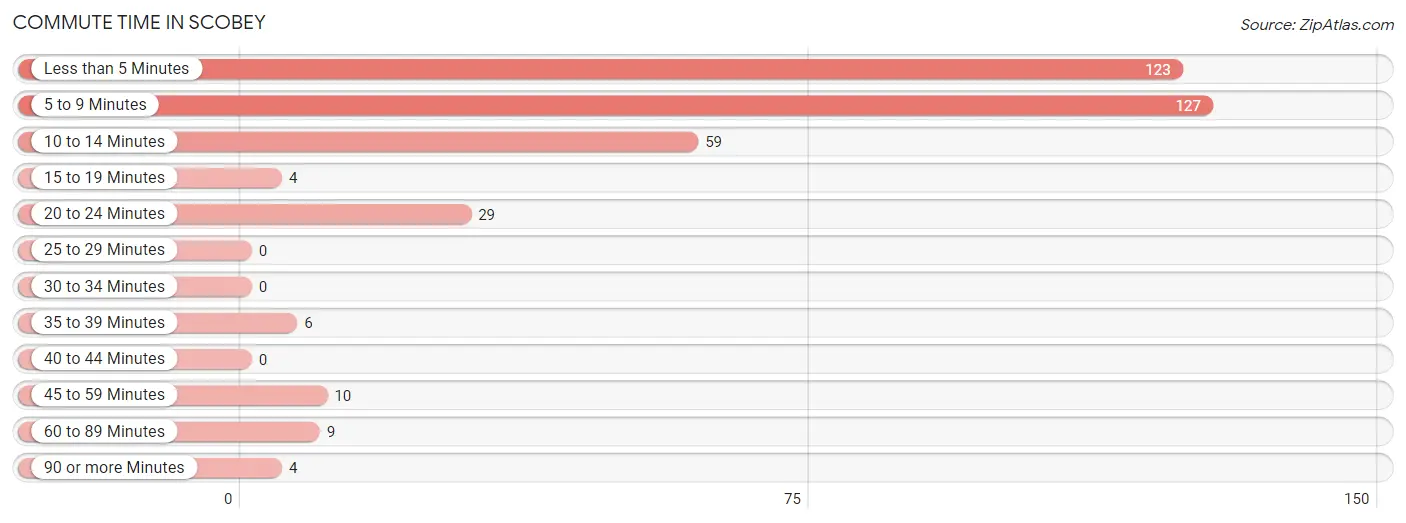
Commute Time in Scobey
The most frequently occuring commute durations in Scobey are 5 to 9 minutes (127 commuters, 34.2%), less than 5 minutes (123 commuters, 33.2%), and 10 to 14 minutes (59 commuters, 15.9%).
| Commute Time | # Commuters | % Commuters |
| Less than 5 Minutes | 123 | 33.2% |
| 5 to 9 Minutes | 127 | 34.2% |
| 10 to 14 Minutes | 59 | 15.9% |
| 15 to 19 Minutes | 4 | 1.1% |
| 20 to 24 Minutes | 29 | 7.8% |
| 25 to 29 Minutes | 0 | 0.0% |
| 30 to 34 Minutes | 0 | 0.0% |
| 35 to 39 Minutes | 6 | 1.6% |
| 40 to 44 Minutes | 0 | 0.0% |
| 45 to 59 Minutes | 10 | 2.7% |
| 60 to 89 Minutes | 9 | 2.4% |
| 90 or more Minutes | 4 | 1.1% |
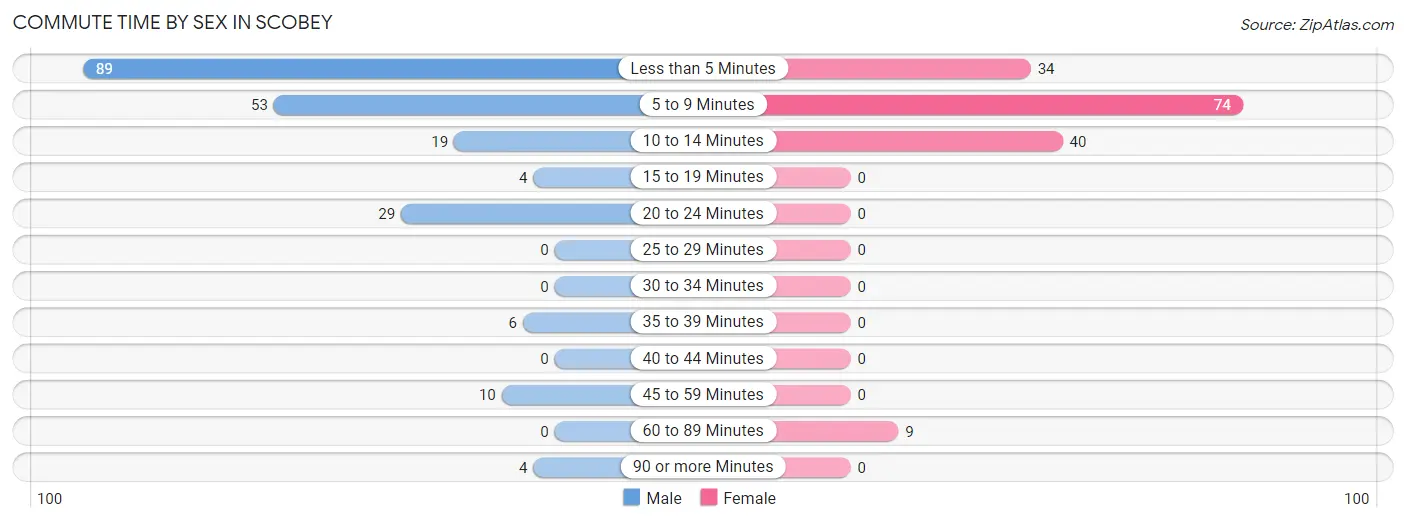
Commute Time by Sex in Scobey
The most common commute times in Scobey are less than 5 minutes (89 commuters, 41.6%) for males and 5 to 9 minutes (74 commuters, 47.1%) for females.
| Commute Time | Male | Female |
| Less than 5 Minutes | 89 (41.6%) | 34 (21.7%) |
| 5 to 9 Minutes | 53 (24.8%) | 74 (47.1%) |
| 10 to 14 Minutes | 19 (8.9%) | 40 (25.5%) |
| 15 to 19 Minutes | 4 (1.9%) | 0 (0.0%) |
| 20 to 24 Minutes | 29 (13.6%) | 0 (0.0%) |
| 25 to 29 Minutes | 0 (0.0%) | 0 (0.0%) |
| 30 to 34 Minutes | 0 (0.0%) | 0 (0.0%) |
| 35 to 39 Minutes | 6 (2.8%) | 0 (0.0%) |
| 40 to 44 Minutes | 0 (0.0%) | 0 (0.0%) |
| 45 to 59 Minutes | 10 (4.7%) | 0 (0.0%) |
| 60 to 89 Minutes | 0 (0.0%) | 9 (5.7%) |
| 90 or more Minutes | 4 (1.9%) | 0 (0.0%) |
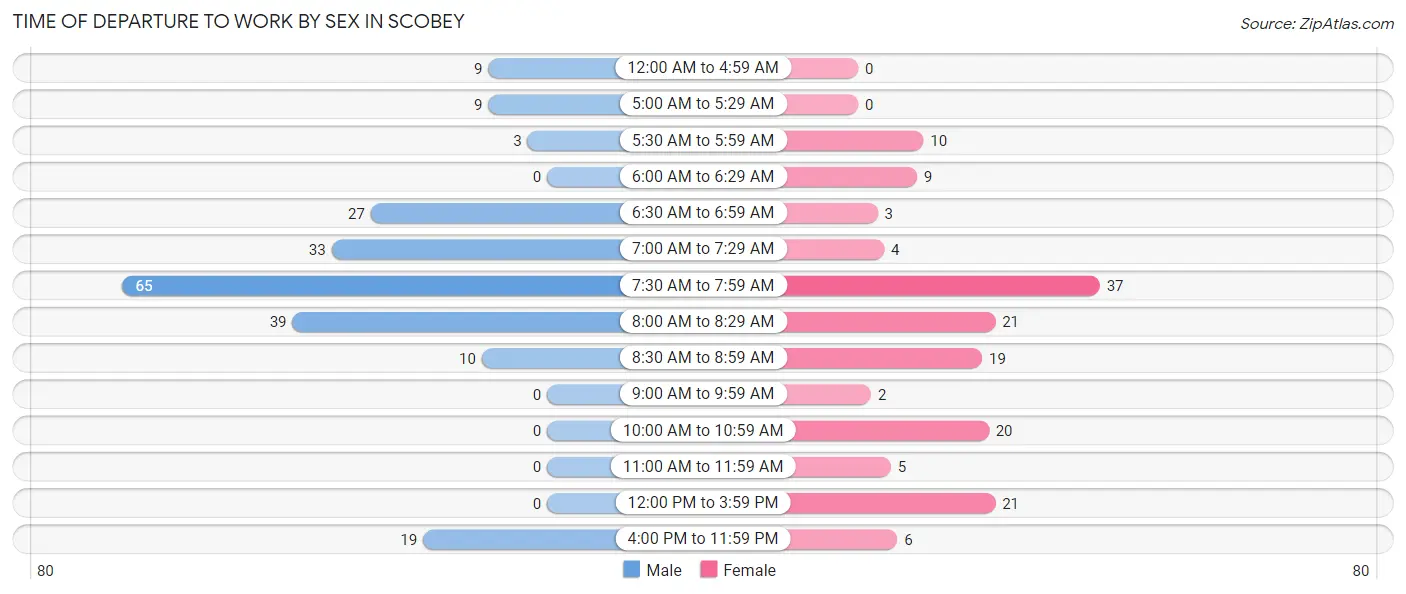
Time of Departure to Work by Sex in Scobey
The most frequent times of departure to work in Scobey are 7:30 AM to 7:59 AM (65, 30.4%) for males and 7:30 AM to 7:59 AM (37, 23.6%) for females.
| Time of Departure | Male | Female |
| 12:00 AM to 4:59 AM | 9 (4.2%) | 0 (0.0%) |
| 5:00 AM to 5:29 AM | 9 (4.2%) | 0 (0.0%) |
| 5:30 AM to 5:59 AM | 3 (1.4%) | 10 (6.4%) |
| 6:00 AM to 6:29 AM | 0 (0.0%) | 9 (5.7%) |
| 6:30 AM to 6:59 AM | 27 (12.6%) | 3 (1.9%) |
| 7:00 AM to 7:29 AM | 33 (15.4%) | 4 (2.5%) |
| 7:30 AM to 7:59 AM | 65 (30.4%) | 37 (23.6%) |
| 8:00 AM to 8:29 AM | 39 (18.2%) | 21 (13.4%) |
| 8:30 AM to 8:59 AM | 10 (4.7%) | 19 (12.1%) |
| 9:00 AM to 9:59 AM | 0 (0.0%) | 2 (1.3%) |
| 10:00 AM to 10:59 AM | 0 (0.0%) | 20 (12.7%) |
| 11:00 AM to 11:59 AM | 0 (0.0%) | 5 (3.2%) |
| 12:00 PM to 3:59 PM | 0 (0.0%) | 21 (13.4%) |
| 4:00 PM to 11:59 PM | 19 (8.9%) | 6 (3.8%) |
| Total | 214 (100.0%) | 157 (100.0%) |
Housing Occupancy in Scobey
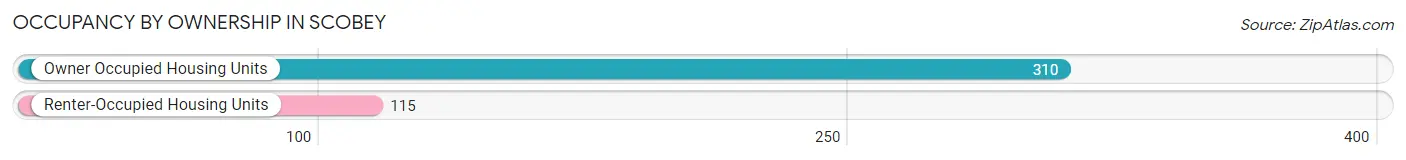
Occupancy by Ownership in Scobey
Of the total 425 dwellings in Scobey, owner-occupied units account for 310 (72.9%), while renter-occupied units make up 115 (27.1%).
| Occupancy | # Housing Units | % Housing Units |
| Owner Occupied Housing Units | 310 | 72.9% |
| Renter-Occupied Housing Units | 115 | 27.1% |
| Total Occupied Housing Units | 425 | 100.0% |
Occupancy by Household Size in Scobey
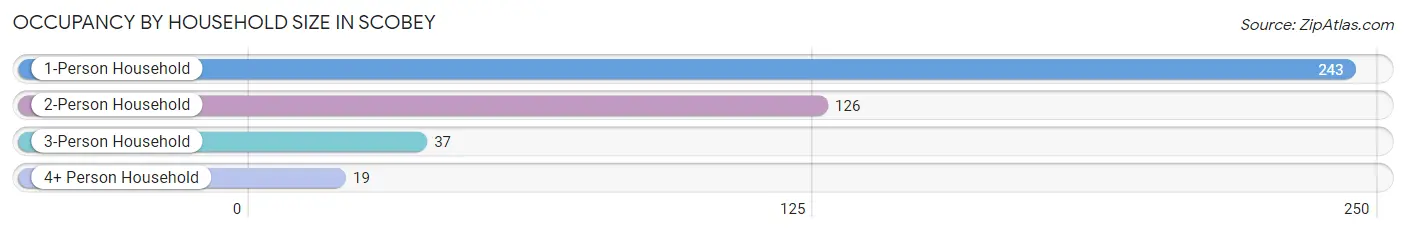
| Household Size | # Housing Units | % Housing Units |
| 1-Person Household | 243 | 57.2% |
| 2-Person Household | 126 | 29.6% |
| 3-Person Household | 37 | 8.7% |
| 4+ Person Household | 19 | 4.5% |
| Total Housing Units | 425 | 100.0% |
Occupancy by Ownership by Household Size in Scobey
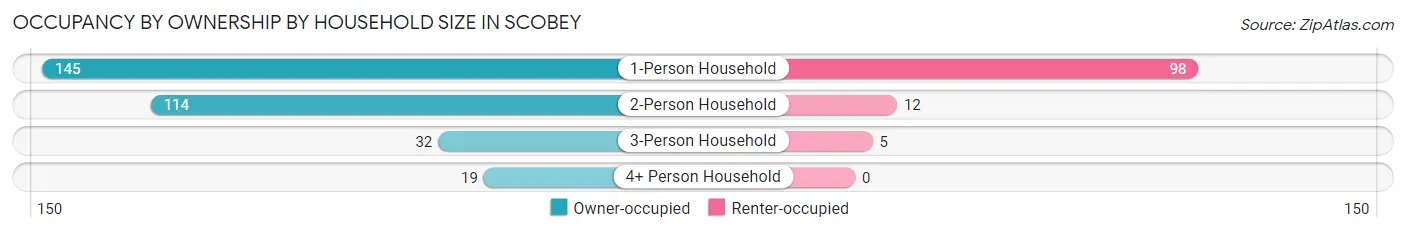
| Household Size | Owner-occupied | Renter-occupied |
| 1-Person Household | 145 (59.7%) | 98 (40.3%) |
| 2-Person Household | 114 (90.5%) | 12 (9.5%) |
| 3-Person Household | 32 (86.5%) | 5 (13.5%) |
| 4+ Person Household | 19 (100.0%) | 0 (0.0%) |
| Total Housing Units | 310 (72.9%) | 115 (27.1%) |
Occupancy by Educational Attainment in Scobey
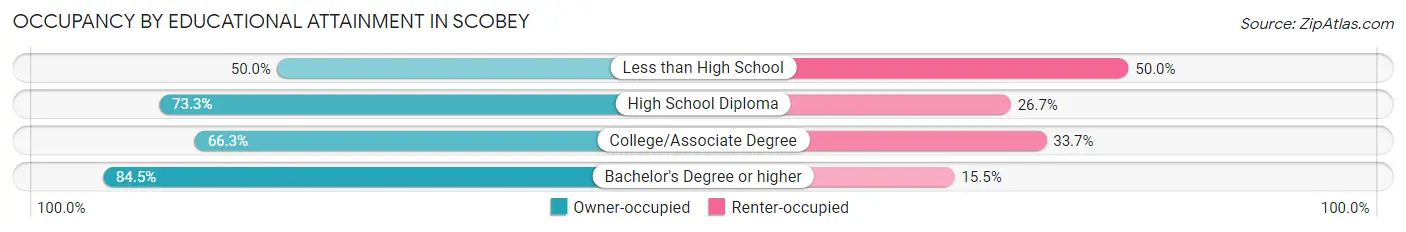
| Household Size | Owner-occupied | Renter-occupied |
| Less than High School | 3 (50.0%) | 3 (50.0%) |
| High School Diploma | 110 (73.3%) | 40 (26.7%) |
| College/Associate Degree | 110 (66.3%) | 56 (33.7%) |
| Bachelor's Degree or higher | 87 (84.5%) | 16 (15.5%) |
Occupancy by Age of Householder in Scobey
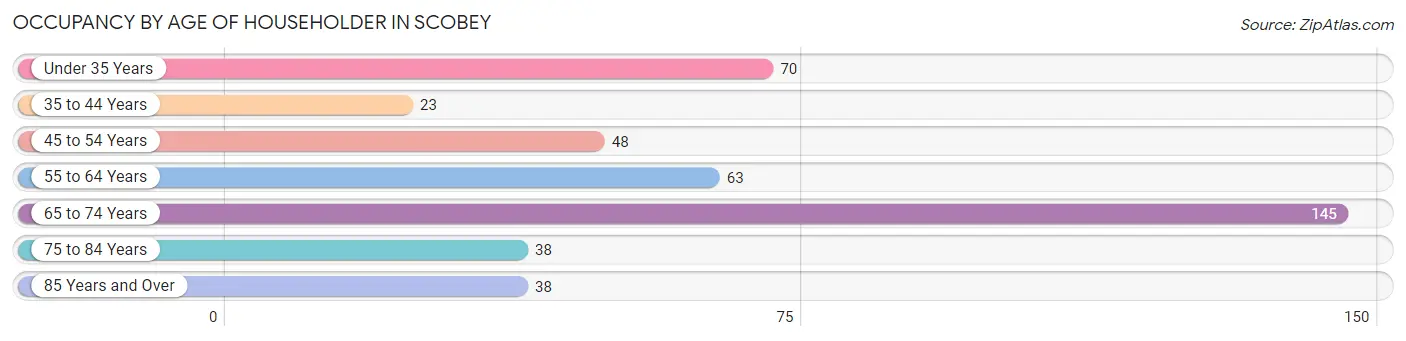
| Age Bracket | # Households | % Households |
| Under 35 Years | 70 | 16.5% |
| 35 to 44 Years | 23 | 5.4% |
| 45 to 54 Years | 48 | 11.3% |
| 55 to 64 Years | 63 | 14.8% |
| 65 to 74 Years | 145 | 34.1% |
| 75 to 84 Years | 38 | 8.9% |
| 85 Years and Over | 38 | 8.9% |
| Total | 425 | 100.0% |
Housing Finances in Scobey
Median Income by Occupancy in Scobey
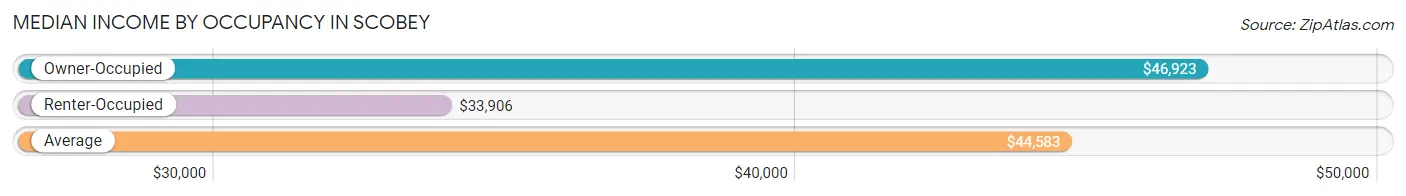
| Occupancy Type | # Households | Median Income |
| Owner-Occupied | 310 (72.9%) | $46,923 |
| Renter-Occupied | 115 (27.1%) | $33,906 |
| Average | 425 (100.0%) | $44,583 |
Occupancy by Householder Income Bracket in Scobey
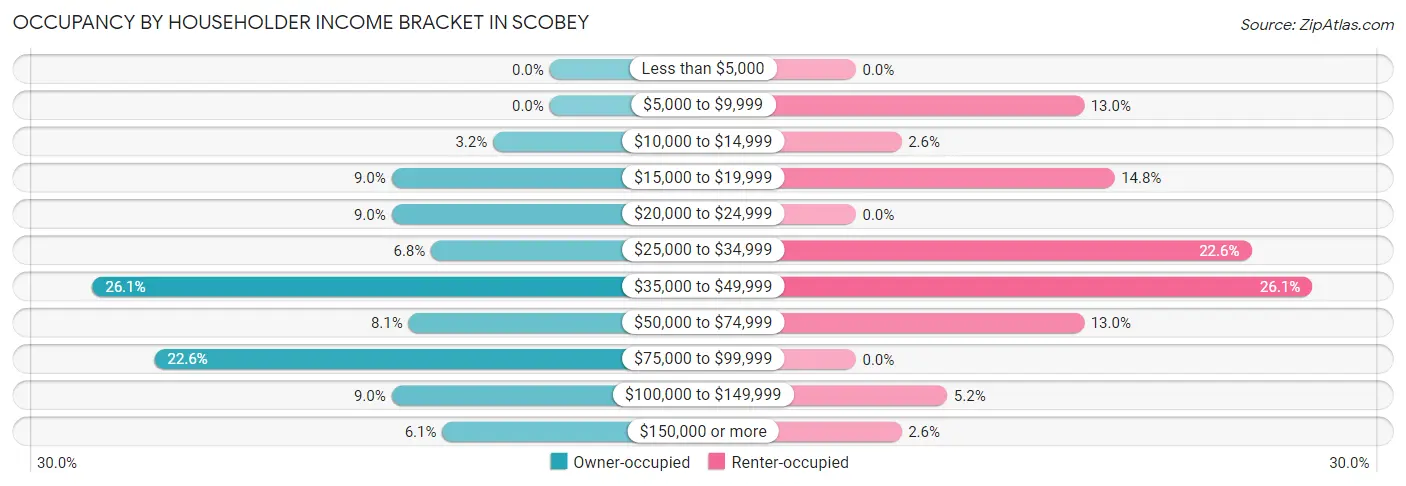
| Income Bracket | Owner-occupied | Renter-occupied |
| Less than $5,000 | 0 (0.0%) | 0 (0.0%) |
| $5,000 to $9,999 | 0 (0.0%) | 15 (13.0%) |
| $10,000 to $14,999 | 10 (3.2%) | 3 (2.6%) |
| $15,000 to $19,999 | 28 (9.0%) | 17 (14.8%) |
| $20,000 to $24,999 | 28 (9.0%) | 0 (0.0%) |
| $25,000 to $34,999 | 21 (6.8%) | 26 (22.6%) |
| $35,000 to $49,999 | 81 (26.1%) | 30 (26.1%) |
| $50,000 to $74,999 | 25 (8.1%) | 15 (13.0%) |
| $75,000 to $99,999 | 70 (22.6%) | 0 (0.0%) |
| $100,000 to $149,999 | 28 (9.0%) | 6 (5.2%) |
| $150,000 or more | 19 (6.1%) | 3 (2.6%) |
| Total | 310 (100.0%) | 115 (100.0%) |
Monthly Housing Cost Tiers in Scobey
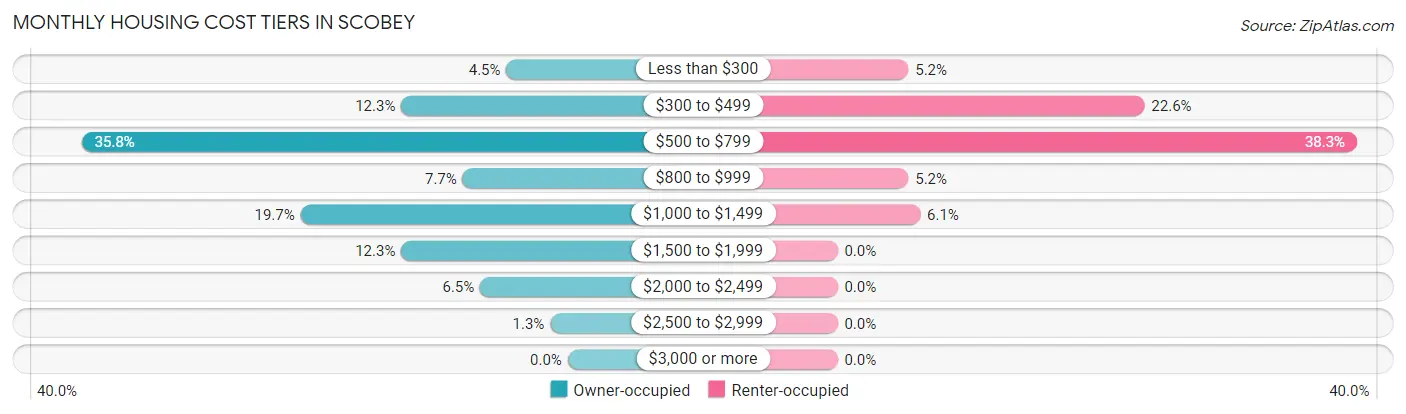
| Monthly Cost | Owner-occupied | Renter-occupied |
| Less than $300 | 14 (4.5%) | 6 (5.2%) |
| $300 to $499 | 38 (12.3%) | 26 (22.6%) |
| $500 to $799 | 111 (35.8%) | 44 (38.3%) |
| $800 to $999 | 24 (7.7%) | 6 (5.2%) |
| $1,000 to $1,499 | 61 (19.7%) | 7 (6.1%) |
| $1,500 to $1,999 | 38 (12.3%) | 0 (0.0%) |
| $2,000 to $2,499 | 20 (6.5%) | 0 (0.0%) |
| $2,500 to $2,999 | 4 (1.3%) | 0 (0.0%) |
| $3,000 or more | 0 (0.0%) | 0 (0.0%) |
| Total | 310 (100.0%) | 115 (100.0%) |
Physical Housing Characteristics in Scobey
Housing Structures in Scobey
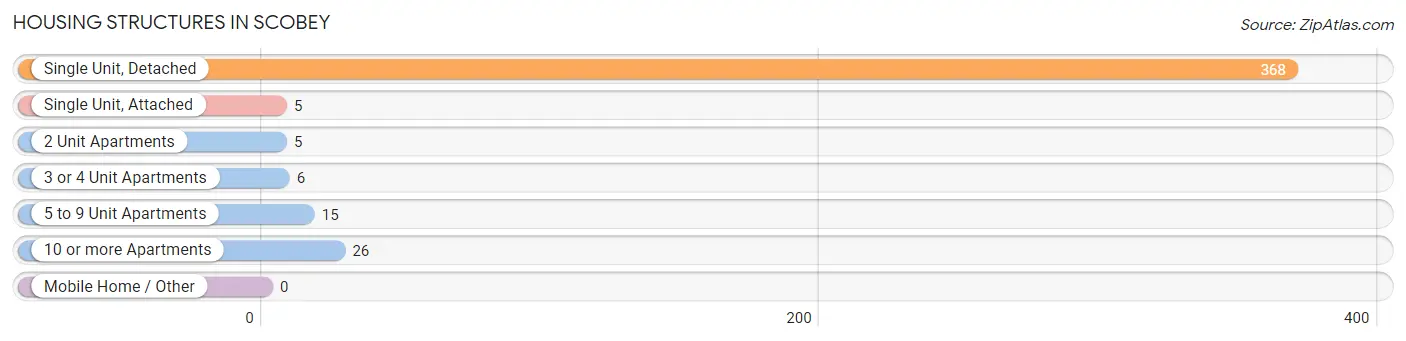
| Structure Type | # Housing Units | % Housing Units |
| Single Unit, Detached | 368 | 86.6% |
| Single Unit, Attached | 5 | 1.2% |
| 2 Unit Apartments | 5 | 1.2% |
| 3 or 4 Unit Apartments | 6 | 1.4% |
| 5 to 9 Unit Apartments | 15 | 3.5% |
| 10 or more Apartments | 26 | 6.1% |
| Mobile Home / Other | 0 | 0.0% |
| Total | 425 | 100.0% |
Housing Structures by Occupancy in Scobey
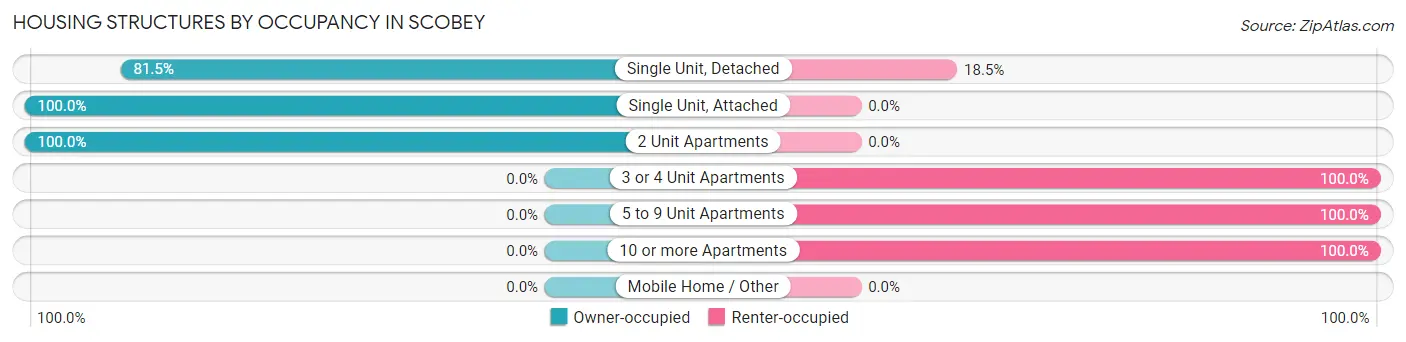
| Structure Type | Owner-occupied | Renter-occupied |
| Single Unit, Detached | 300 (81.5%) | 68 (18.5%) |
| Single Unit, Attached | 5 (100.0%) | 0 (0.0%) |
| 2 Unit Apartments | 5 (100.0%) | 0 (0.0%) |
| 3 or 4 Unit Apartments | 0 (0.0%) | 6 (100.0%) |
| 5 to 9 Unit Apartments | 0 (0.0%) | 15 (100.0%) |
| 10 or more Apartments | 0 (0.0%) | 26 (100.0%) |
| Mobile Home / Other | 0 (0.0%) | 0 (0.0%) |
| Total | 310 (72.9%) | 115 (27.1%) |
Housing Structures by Number of Rooms in Scobey
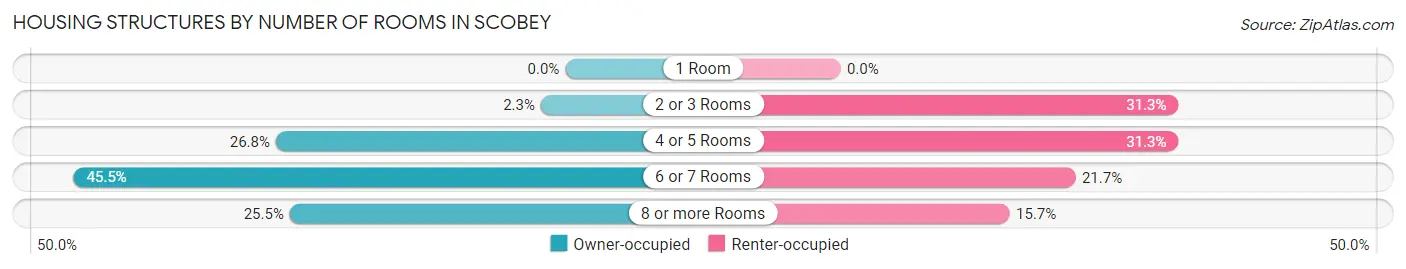
| Number of Rooms | Owner-occupied | Renter-occupied |
| 1 Room | 0 (0.0%) | 0 (0.0%) |
| 2 or 3 Rooms | 7 (2.3%) | 36 (31.3%) |
| 4 or 5 Rooms | 83 (26.8%) | 36 (31.3%) |
| 6 or 7 Rooms | 141 (45.5%) | 25 (21.7%) |
| 8 or more Rooms | 79 (25.5%) | 18 (15.7%) |
| Total | 310 (100.0%) | 115 (100.0%) |
Housing Structure by Heating Type in Scobey
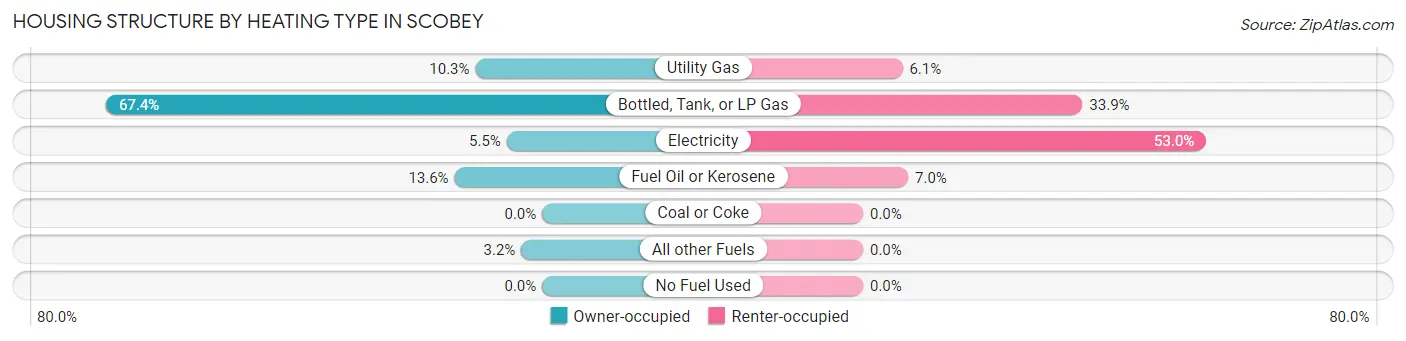
| Heating Type | Owner-occupied | Renter-occupied |
| Utility Gas | 32 (10.3%) | 7 (6.1%) |
| Bottled, Tank, or LP Gas | 209 (67.4%) | 39 (33.9%) |
| Electricity | 17 (5.5%) | 61 (53.0%) |
| Fuel Oil or Kerosene | 42 (13.6%) | 8 (7.0%) |
| Coal or Coke | 0 (0.0%) | 0 (0.0%) |
| All other Fuels | 10 (3.2%) | 0 (0.0%) |
| No Fuel Used | 0 (0.0%) | 0 (0.0%) |
| Total | 310 (100.0%) | 115 (100.0%) |
Household Vehicle Usage in Scobey
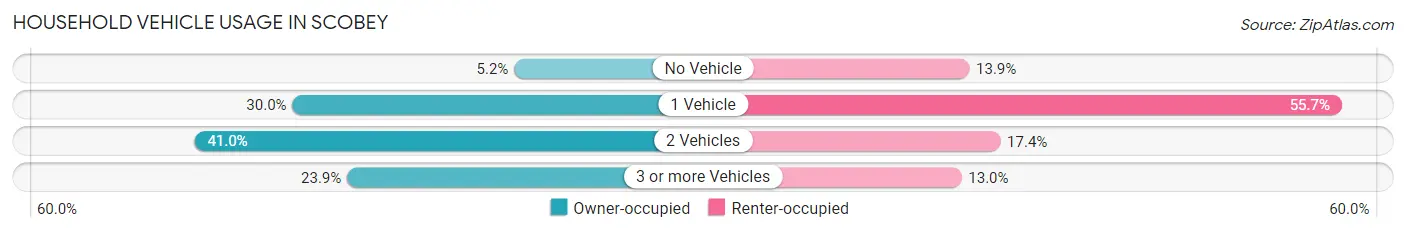
| Vehicles per Household | Owner-occupied | Renter-occupied |
| No Vehicle | 16 (5.2%) | 16 (13.9%) |
| 1 Vehicle | 93 (30.0%) | 64 (55.6%) |
| 2 Vehicles | 127 (41.0%) | 20 (17.4%) |
| 3 or more Vehicles | 74 (23.9%) | 15 (13.0%) |
| Total | 310 (100.0%) | 115 (100.0%) |
Real Estate & Mortgages in Scobey
Real Estate and Mortgage Overview in Scobey
| Characteristic | Without Mortgage | With Mortgage |
| Housing Units | 184 | 126 |
| Median Property Value | $155,600 | $203,200 |
| Median Household Income | $45,641 | $8 |
| Monthly Housing Costs | $557 | $0 |
| Real Estate Taxes | $1,368 | $7 |
Property Value by Mortgage Status in Scobey
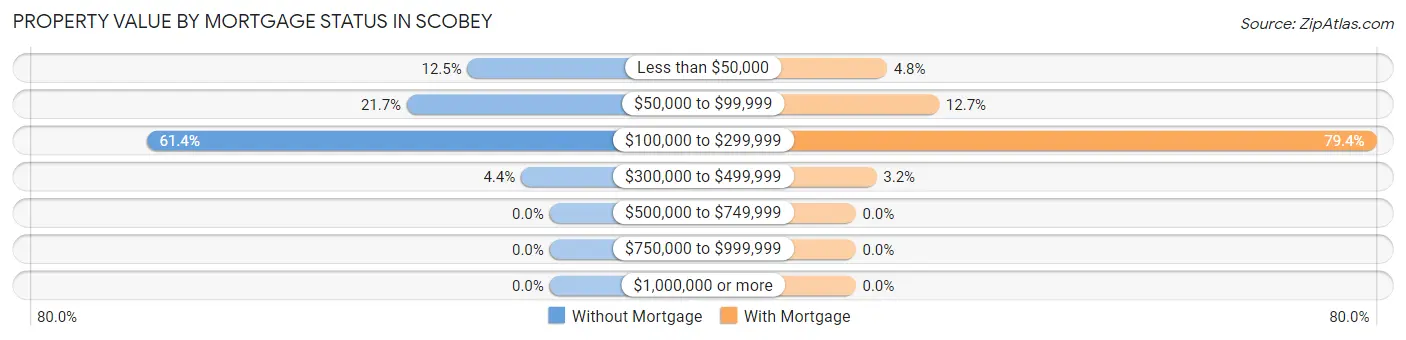
| Property Value | Without Mortgage | With Mortgage |
| Less than $50,000 | 23 (12.5%) | 6 (4.8%) |
| $50,000 to $99,999 | 40 (21.7%) | 16 (12.7%) |
| $100,000 to $299,999 | 113 (61.4%) | 100 (79.4%) |
| $300,000 to $499,999 | 8 (4.3%) | 4 (3.2%) |
| $500,000 to $749,999 | 0 (0.0%) | 0 (0.0%) |
| $750,000 to $999,999 | 0 (0.0%) | 0 (0.0%) |
| $1,000,000 or more | 0 (0.0%) | 0 (0.0%) |
| Total | 184 (100.0%) | 126 (100.0%) |
Household Income by Mortgage Status in Scobey
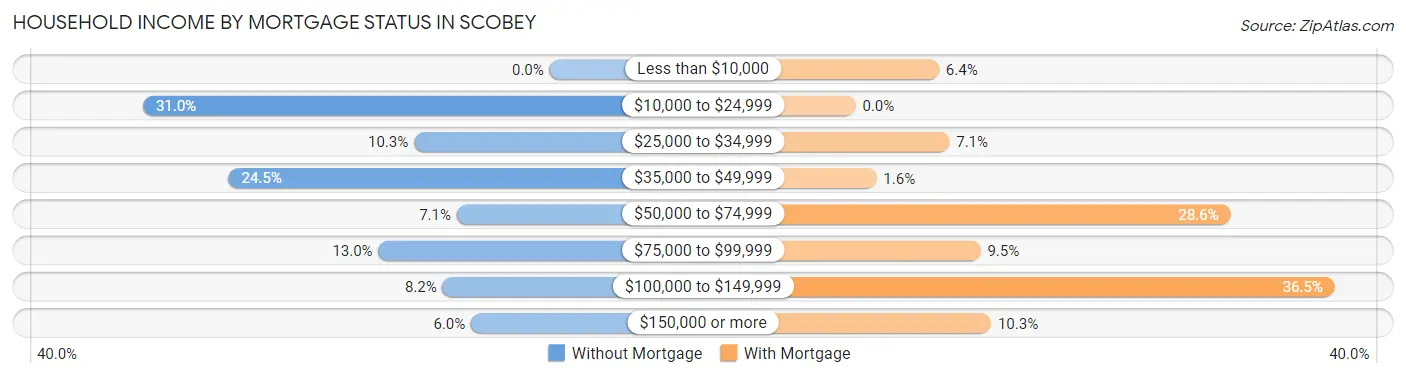
| Household Income | Without Mortgage | With Mortgage |
| Less than $10,000 | 0 (0.0%) | 8 (6.4%) |
| $10,000 to $24,999 | 57 (31.0%) | 0 (0.0%) |
| $25,000 to $34,999 | 19 (10.3%) | 9 (7.1%) |
| $35,000 to $49,999 | 45 (24.5%) | 2 (1.6%) |
| $50,000 to $74,999 | 13 (7.1%) | 36 (28.6%) |
| $75,000 to $99,999 | 24 (13.0%) | 12 (9.5%) |
| $100,000 to $149,999 | 15 (8.2%) | 46 (36.5%) |
| $150,000 or more | 11 (6.0%) | 13 (10.3%) |
| Total | 184 (100.0%) | 126 (100.0%) |
Property Value to Household Income Ratio in Scobey
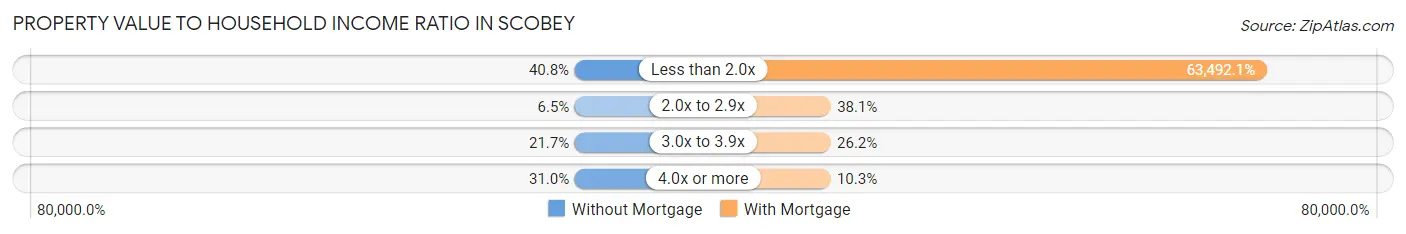
| Value-to-Income Ratio | Without Mortgage | With Mortgage |
| Less than 2.0x | 75 (40.8%) | 80,000 (63,492.1%) |
| 2.0x to 2.9x | 12 (6.5%) | 48 (38.1%) |
| 3.0x to 3.9x | 40 (21.7%) | 33 (26.2%) |
| 4.0x or more | 57 (31.0%) | 13 (10.3%) |
| Total | 184 (100.0%) | 126 (100.0%) |
Real Estate Taxes by Mortgage Status in Scobey
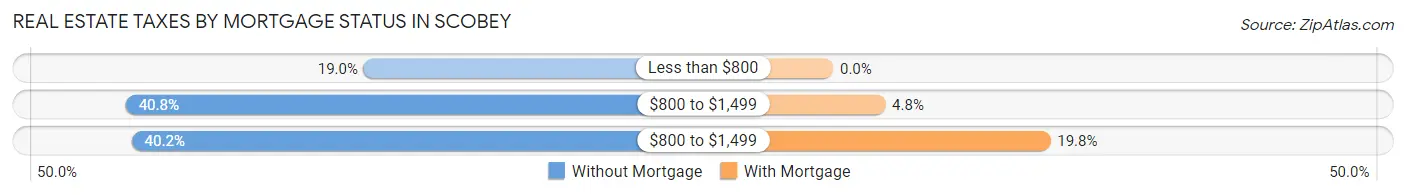
| Property Taxes | Without Mortgage | With Mortgage |
| Less than $800 | 35 (19.0%) | 0 (0.0%) |
| $800 to $1,499 | 75 (40.8%) | 6 (4.8%) |
| $800 to $1,499 | 74 (40.2%) | 25 (19.8%) |
| Total | 184 (100.0%) | 126 (100.0%) |
Health & Disability in Scobey
Health Insurance Coverage by Age in Scobey
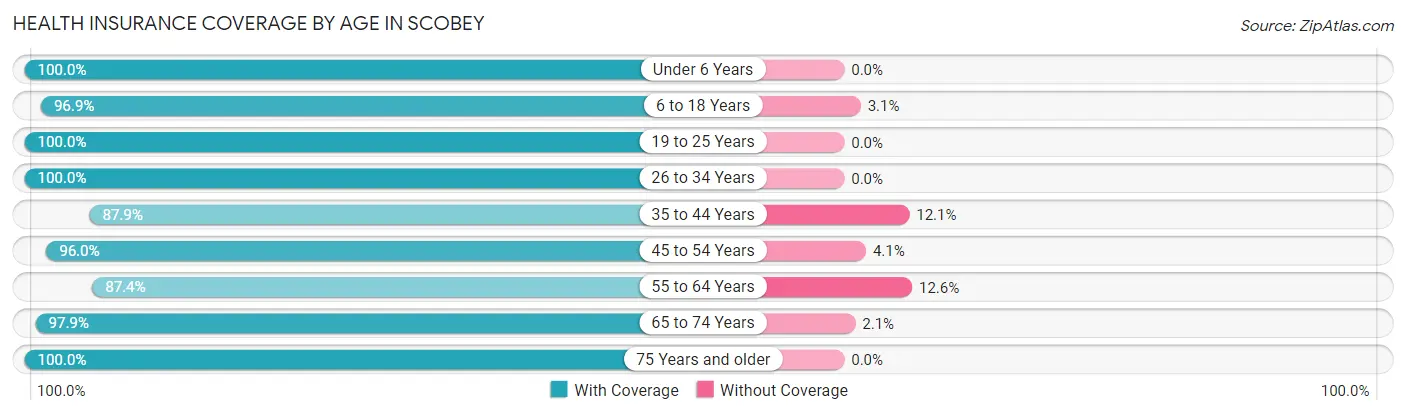
| Age Bracket | With Coverage | Without Coverage |
| Under 6 Years | 34 (100.0%) | 0 (0.0%) |
| 6 to 18 Years | 95 (96.9%) | 3 (3.1%) |
| 19 to 25 Years | 10 (100.0%) | 0 (0.0%) |
| 26 to 34 Years | 87 (100.0%) | 0 (0.0%) |
| 35 to 44 Years | 58 (87.9%) | 8 (12.1%) |
| 45 to 54 Years | 71 (96.0%) | 3 (4.1%) |
| 55 to 64 Years | 83 (87.4%) | 12 (12.6%) |
| 65 to 74 Years | 190 (97.9%) | 4 (2.1%) |
| 75 Years and older | 108 (100.0%) | 0 (0.0%) |
| Total | 736 (96.1%) | 30 (3.9%) |
Health Insurance Coverage by Citizenship Status in Scobey
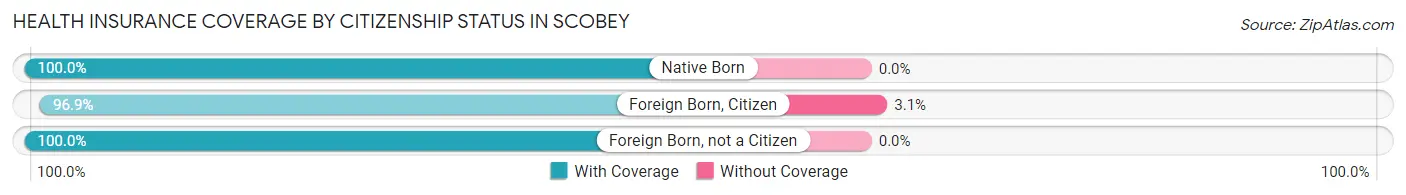
| Citizenship Status | With Coverage | Without Coverage |
| Native Born | 34 (100.0%) | 0 (0.0%) |
| Foreign Born, Citizen | 95 (96.9%) | 3 (3.1%) |
| Foreign Born, not a Citizen | 10 (100.0%) | 0 (0.0%) |
Health Insurance Coverage by Household Income in Scobey
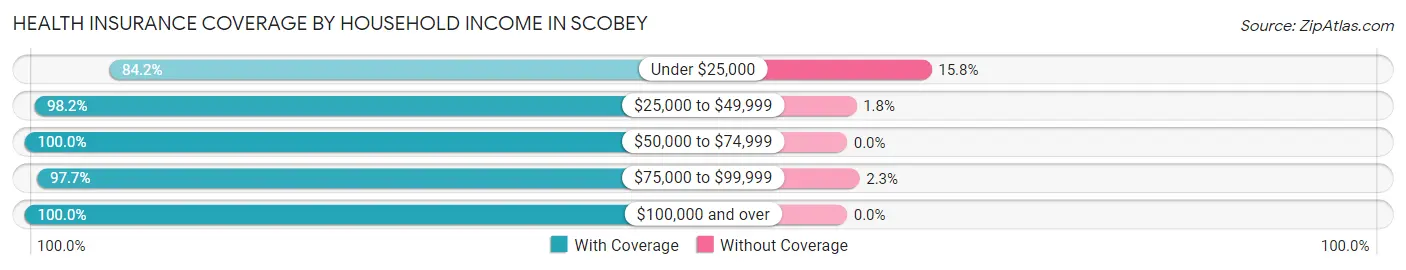
| Household Income | With Coverage | Without Coverage |
| Under $25,000 | 117 (84.2%) | 22 (15.8%) |
| $25,000 to $49,999 | 222 (98.2%) | 4 (1.8%) |
| $50,000 to $74,999 | 85 (100.0%) | 0 (0.0%) |
| $75,000 to $99,999 | 167 (97.7%) | 4 (2.3%) |
| $100,000 and over | 145 (100.0%) | 0 (0.0%) |
Public vs Private Health Insurance Coverage by Age in Scobey
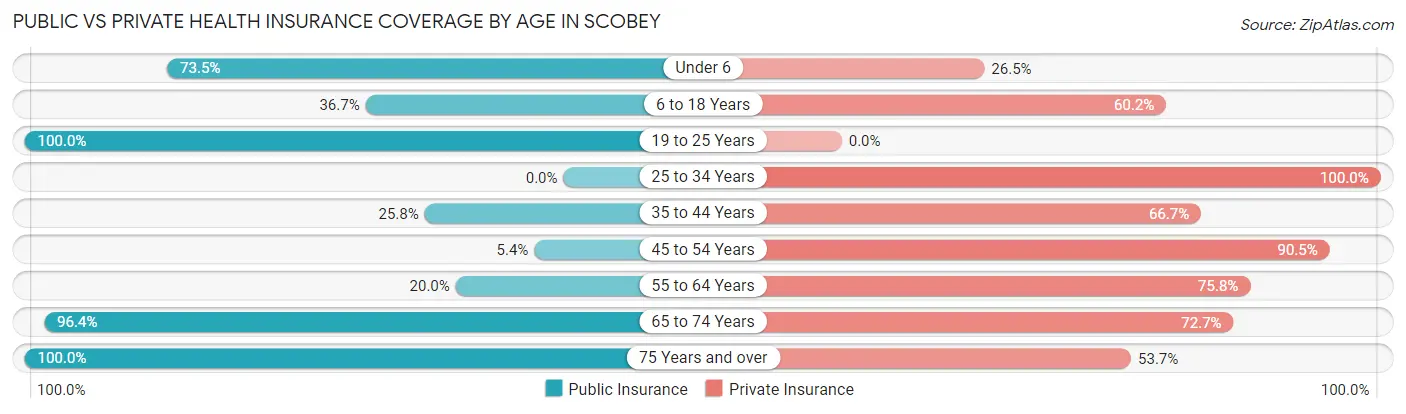
| Age Bracket | Public Insurance | Private Insurance |
| Under 6 | 25 (73.5%) | 9 (26.5%) |
| 6 to 18 Years | 36 (36.7%) | 59 (60.2%) |
| 19 to 25 Years | 10 (100.0%) | 0 (0.0%) |
| 25 to 34 Years | 0 (0.0%) | 87 (100.0%) |
| 35 to 44 Years | 17 (25.8%) | 44 (66.7%) |
| 45 to 54 Years | 4 (5.4%) | 67 (90.5%) |
| 55 to 64 Years | 19 (20.0%) | 72 (75.8%) |
| 65 to 74 Years | 187 (96.4%) | 141 (72.7%) |
| 75 Years and over | 108 (100.0%) | 58 (53.7%) |
| Total | 406 (53.0%) | 537 (70.1%) |
Disability Status by Sex by Age in Scobey
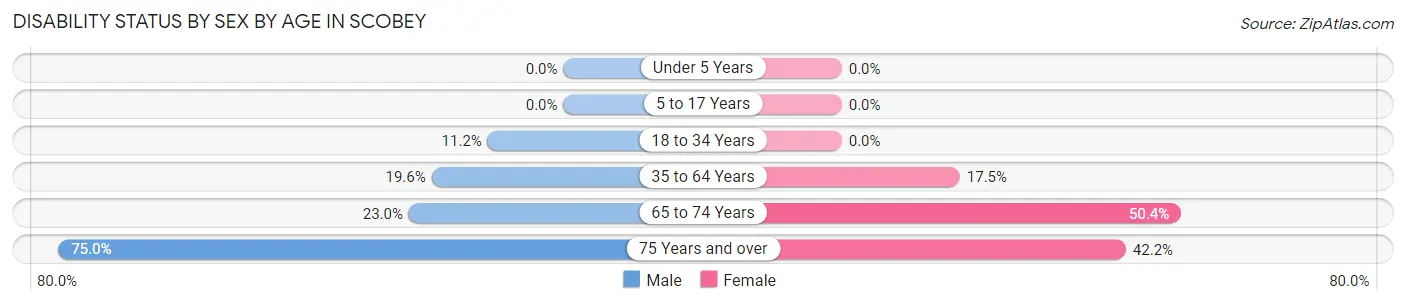
| Age Bracket | Male | Female |
| Under 5 Years | 0 (0.0%) | 0 (0.0%) |
| 5 to 17 Years | 0 (0.0%) | 0 (0.0%) |
| 18 to 34 Years | 10 (11.2%) | 0 (0.0%) |
| 35 to 64 Years | 27 (19.6%) | 17 (17.5%) |
| 65 to 74 Years | 14 (23.0%) | 67 (50.4%) |
| 75 Years and over | 33 (75.0%) | 27 (42.2%) |
Disability Class by Sex by Age in Scobey
Disability Class: Hearing Difficulty
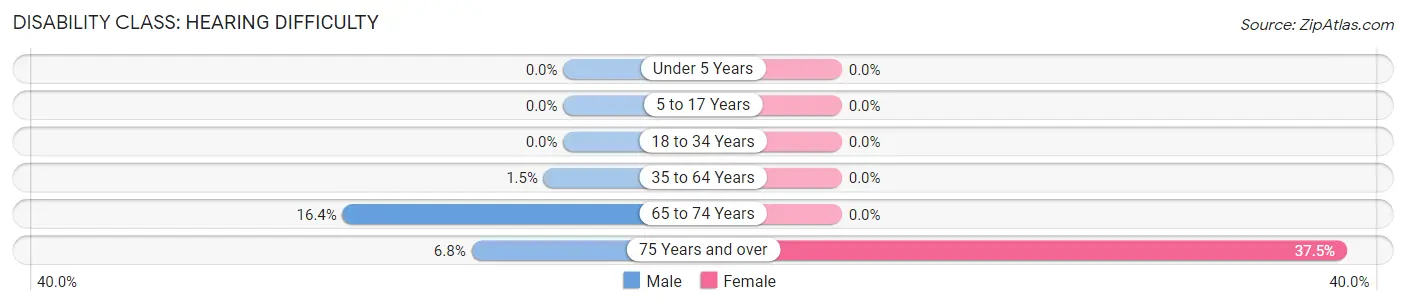
| Age Bracket | Male | Female |
| Under 5 Years | 0 (0.0%) | 0 (0.0%) |
| 5 to 17 Years | 0 (0.0%) | 0 (0.0%) |
| 18 to 34 Years | 0 (0.0%) | 0 (0.0%) |
| 35 to 64 Years | 2 (1.5%) | 0 (0.0%) |
| 65 to 74 Years | 10 (16.4%) | 0 (0.0%) |
| 75 Years and over | 3 (6.8%) | 24 (37.5%) |
Disability Class: Vision Difficulty
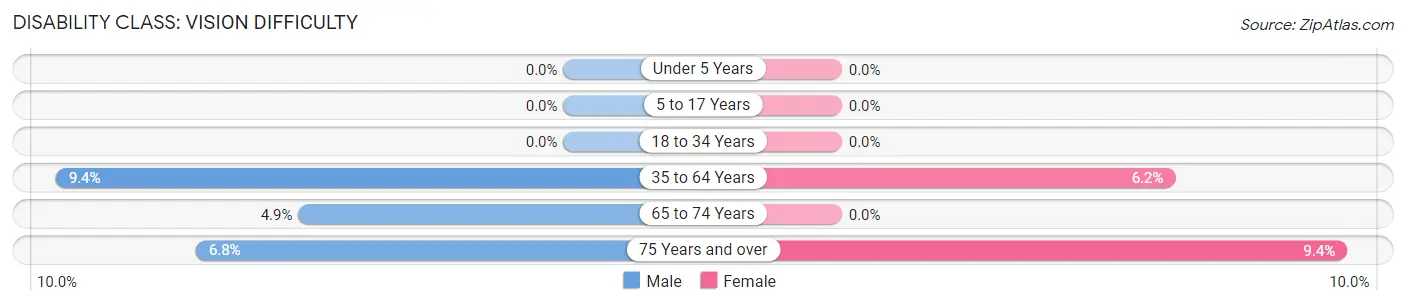
| Age Bracket | Male | Female |
| Under 5 Years | 0 (0.0%) | 0 (0.0%) |
| 5 to 17 Years | 0 (0.0%) | 0 (0.0%) |
| 18 to 34 Years | 0 (0.0%) | 0 (0.0%) |
| 35 to 64 Years | 13 (9.4%) | 6 (6.2%) |
| 65 to 74 Years | 3 (4.9%) | 0 (0.0%) |
| 75 Years and over | 3 (6.8%) | 6 (9.4%) |
Disability Class: Cognitive Difficulty
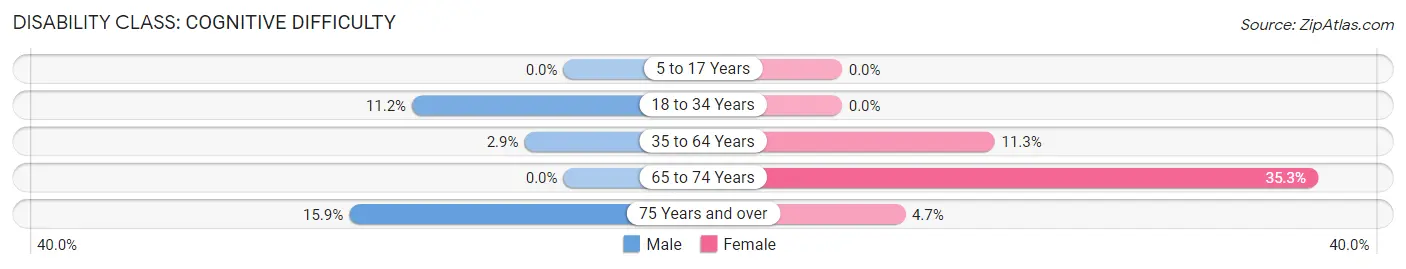
| Age Bracket | Male | Female |
| 5 to 17 Years | 0 (0.0%) | 0 (0.0%) |
| 18 to 34 Years | 10 (11.2%) | 0 (0.0%) |
| 35 to 64 Years | 4 (2.9%) | 11 (11.3%) |
| 65 to 74 Years | 0 (0.0%) | 47 (35.3%) |
| 75 Years and over | 7 (15.9%) | 3 (4.7%) |
Disability Class: Ambulatory Difficulty
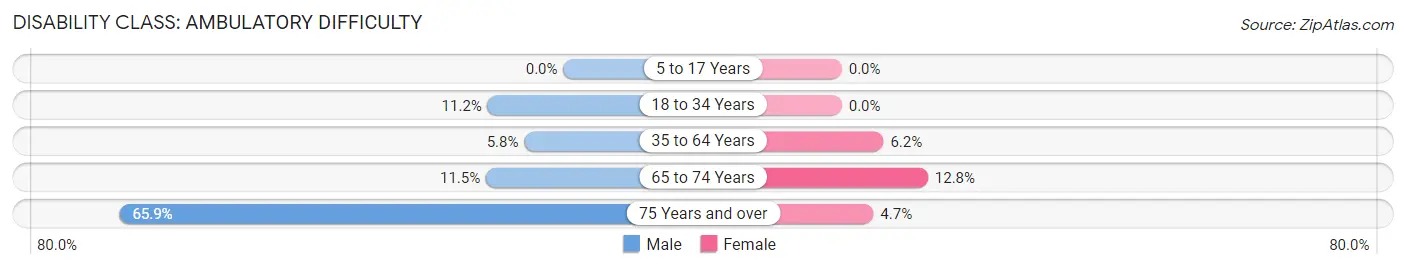
| Age Bracket | Male | Female |
| 5 to 17 Years | 0 (0.0%) | 0 (0.0%) |
| 18 to 34 Years | 10 (11.2%) | 0 (0.0%) |
| 35 to 64 Years | 8 (5.8%) | 6 (6.2%) |
| 65 to 74 Years | 7 (11.5%) | 17 (12.8%) |
| 75 Years and over | 29 (65.9%) | 3 (4.7%) |
Disability Class: Self-Care Difficulty
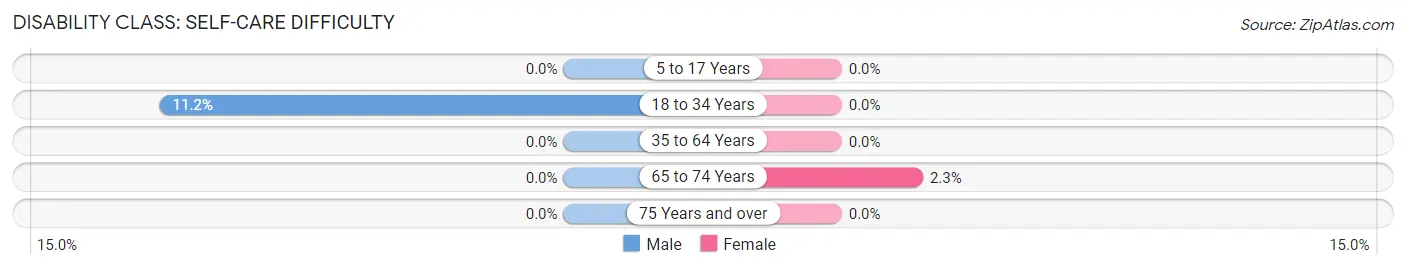
| Age Bracket | Male | Female |
| 5 to 17 Years | 0 (0.0%) | 0 (0.0%) |
| 18 to 34 Years | 10 (11.2%) | 0 (0.0%) |
| 35 to 64 Years | 0 (0.0%) | 0 (0.0%) |
| 65 to 74 Years | 0 (0.0%) | 3 (2.3%) |
| 75 Years and over | 0 (0.0%) | 0 (0.0%) |
Technology Access in Scobey
Computing Device Access in Scobey
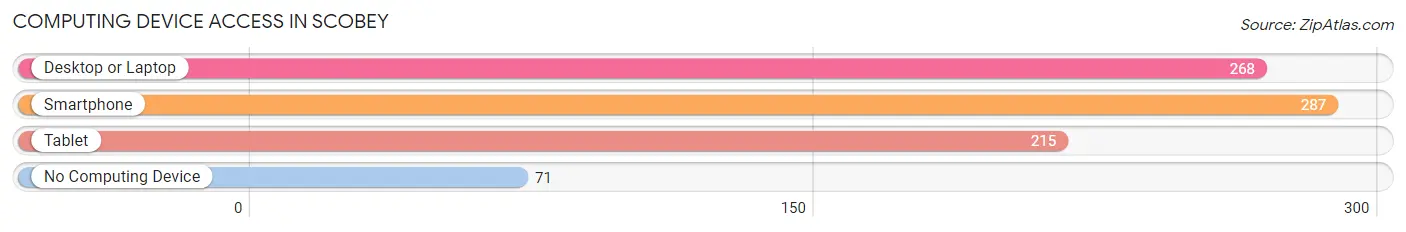
| Device Type | # Households | % Households |
| Desktop or Laptop | 268 | 63.1% |
| Smartphone | 287 | 67.5% |
| Tablet | 215 | 50.6% |
| No Computing Device | 71 | 16.7% |
| Total | 425 | 100.0% |
Internet Access in Scobey
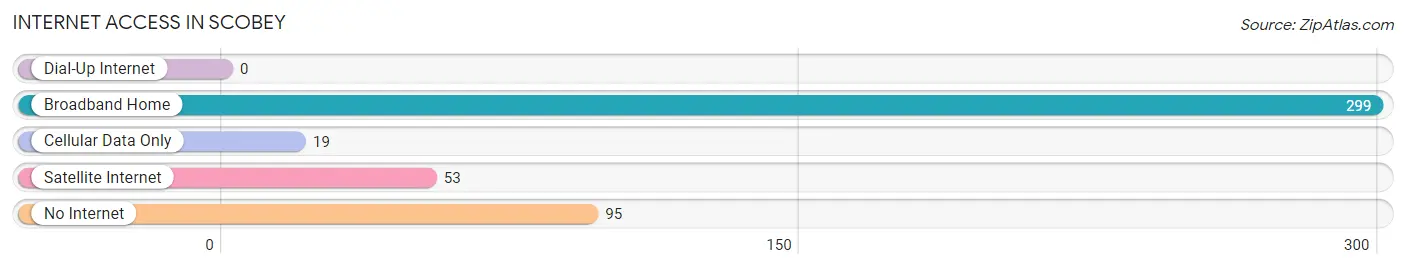
| Internet Type | # Households | % Households |
| Dial-Up Internet | 0 | 0.0% |
| Broadband Home | 299 | 70.4% |
| Cellular Data Only | 19 | 4.5% |
| Satellite Internet | 53 | 12.5% |
| No Internet | 95 | 22.4% |
| Total | 425 | 100.0% |
Scobey Summary
Scobey, Montana is a small town located in the northeastern corner of the state, near the Canadian border. It is the county seat of Daniels County and has a population of approximately 1,000 people. The town was founded in 1906 and is named after the first postmaster, William Scobey.
Geography
Scobey is located in the northeastern corner of Montana, near the Canadian border. It is situated in the northern part of the Great Plains region, and is surrounded by rolling hills and prairies. The town is located at an elevation of 2,400 feet above sea level. The climate is semi-arid, with hot summers and cold winters. The average annual precipitation is 16 inches.
Economy
The economy of Scobey is largely based on agriculture. The town is home to several grain elevators, and the surrounding area is used for growing wheat, barley, and other grains. The town also has a small manufacturing sector, with several small businesses producing a variety of products.
The town is also home to a large oil refinery, which processes crude oil from the nearby Bakken Formation. The refinery is the largest employer in the area, and provides jobs for many of the town's residents.
Demographics
As of the 2010 census, the population of Scobey was 1,039. The racial makeup of the town was 95.3% White, 0.3% African American, 0.7% Native American, 0.2% Asian, 0.1% Pacific Islander, and 3.4% from other races. The median household income was $37,917, and the median family income was $45,625.
The town is home to a large number of immigrants, primarily from Mexico and Central America. The town also has a large Native American population, with many members of the Assiniboine and Sioux tribes living in the area.
Conclusion
Scobey, Montana is a small town located in the northeastern corner of the state, near the Canadian border. It is the county seat of Daniels County and has a population of approximately 1,000 people. The town was founded in 1906 and is named after the first postmaster, William Scobey. The economy of Scobey is largely based on agriculture, with a small manufacturing sector and a large oil refinery. The population of the town is largely white, with a significant number of immigrants and Native Americans.
Common Questions
What is Per Capita Income in Scobey?
Per Capita income in Scobey is $33,354.
What is the Median Family Income in Scobey?
Median Family Income in Scobey is $83,594.
What is the Median Household income in Scobey?
Median Household Income in Scobey is $44,583.
What is Income or Wage Gap in Scobey?
Income or Wage Gap in Scobey is 22.6%.
Women in Scobey earn 77.4 cents for every dollar earned by a man.
What is Inequality or Gini Index in Scobey?
Inequality or Gini Index in Scobey is 0.39.
What is the Total Population of Scobey?
Total Population of Scobey is 791.
What is the Total Male Population of Scobey?
Total Male Population of Scobey is 380.
What is the Total Female Population of Scobey?
Total Female Population of Scobey is 411.
What is the Ratio of Males per 100 Females in Scobey?
There are 92.46 Males per 100 Females in Scobey.
What is the Ratio of Females per 100 Males in Scobey?
There are 108.16 Females per 100 Males in Scobey.
What is the Median Population Age in Scobey?
Median Population Age in Scobey is 58.4 Years.
What is the Average Family Size in Scobey
Average Family Size in Scobey is 2.9 People.
What is the Average Household Size in Scobey
Average Household Size in Scobey is 1.8 People.
How Large is the Labor Force in Scobey?
There are 408 People in the Labor Forcein in Scobey.
What is the Percentage of People in the Labor Force in Scobey?
58.5% of People are in the Labor Force in Scobey.
What is the Unemployment Rate in Scobey?
Unemployment Rate in Scobey is 1.7%.