Sand Coulee, MT Map & Demographics
Sand Coulee Map
Sand Coulee Overview
$33,114
PER CAPITA INCOME
$84,375
AVG FAMILY INCOME
$74,091
AVG HOUSEHOLD INCOME
33.6%
WAGE / INCOME GAP [ % ]
66.4¢/ $1
WAGE / INCOME GAP [ $ ]
0.39
INEQUALITY / GINI INDEX
223
TOTAL POPULATION
130
MALE POPULATION
93
FEMALE POPULATION
139.78
MALES / 100 FEMALES
71.54
FEMALES / 100 MALES
43.9
MEDIAN AGE
3.1
AVG FAMILY SIZE
2.4
AVG HOUSEHOLD SIZE
111
LABOR FORCE [ PEOPLE ]
55.8%
PERCENT IN LABOR FORCE
12.1%
UNEMPLOYMENT RATE
Sand Coulee Zip Codes
Sand Coulee Area Codes
Income in Sand Coulee
Income Overview in Sand Coulee
Per Capita Income in Sand Coulee is $33,114, while median incomes of families and households are $84,375 and $74,091 respectively.
| Characteristic | Number | Measure |
| Per Capita Income | 223 | $33,114 |
| Median Family Income | 59 | $84,375 |
| Mean Family Income | 59 | $103,293 |
| Median Household Income | 92 | $74,091 |
| Mean Household Income | 92 | $76,587 |
| Income Deficit | 59 | $0 |
| Wage / Income Gap (%) | 223 | 33.62% |
| Wage / Income Gap ($) | 223 | 66.38¢ per $1 |
| Gini / Inequality Index | 223 | 0.39 |
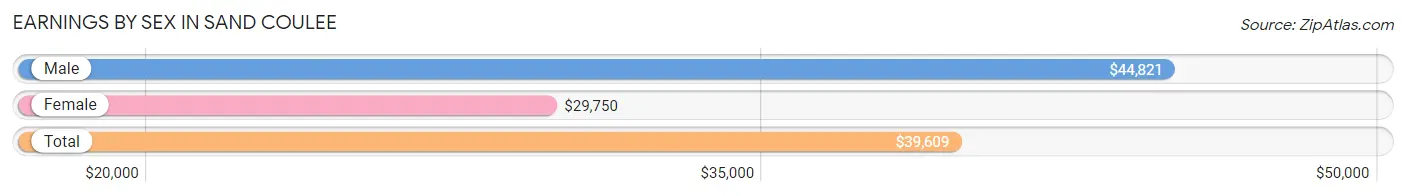
Earnings by Sex in Sand Coulee
Average Earnings in Sand Coulee are $39,609, $44,821 for men and $29,750 for women, a difference of 33.6%.
| Sex | Number | Average Earnings |
| Male | 75 (64.1%) | $44,821 |
| Female | 42 (35.9%) | $29,750 |
| Total | 117 (100.0%) | $39,609 |
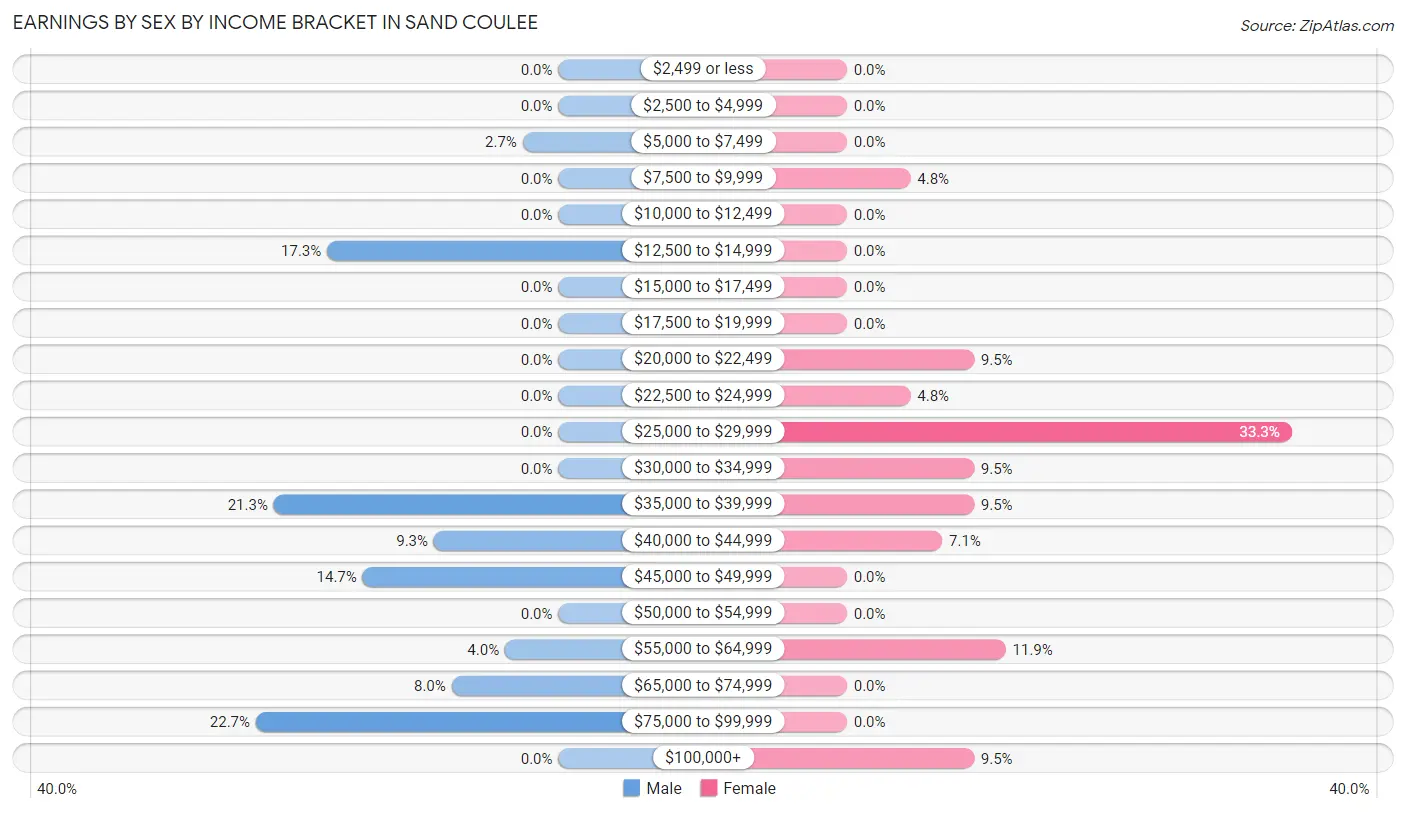
Earnings by Sex by Income Bracket in Sand Coulee
The most common earnings brackets in Sand Coulee are $75,000 to $99,999 for men (17 | 22.7%) and $25,000 to $29,999 for women (14 | 33.3%).
| Income | Male | Female |
| $2,499 or less | 0 (0.0%) | 0 (0.0%) |
| $2,500 to $4,999 | 0 (0.0%) | 0 (0.0%) |
| $5,000 to $7,499 | 2 (2.7%) | 0 (0.0%) |
| $7,500 to $9,999 | 0 (0.0%) | 2 (4.8%) |
| $10,000 to $12,499 | 0 (0.0%) | 0 (0.0%) |
| $12,500 to $14,999 | 13 (17.3%) | 0 (0.0%) |
| $15,000 to $17,499 | 0 (0.0%) | 0 (0.0%) |
| $17,500 to $19,999 | 0 (0.0%) | 0 (0.0%) |
| $20,000 to $22,499 | 0 (0.0%) | 4 (9.5%) |
| $22,500 to $24,999 | 0 (0.0%) | 2 (4.8%) |
| $25,000 to $29,999 | 0 (0.0%) | 14 (33.3%) |
| $30,000 to $34,999 | 0 (0.0%) | 4 (9.5%) |
| $35,000 to $39,999 | 16 (21.3%) | 4 (9.5%) |
| $40,000 to $44,999 | 7 (9.3%) | 3 (7.1%) |
| $45,000 to $49,999 | 11 (14.7%) | 0 (0.0%) |
| $50,000 to $54,999 | 0 (0.0%) | 0 (0.0%) |
| $55,000 to $64,999 | 3 (4.0%) | 5 (11.9%) |
| $65,000 to $74,999 | 6 (8.0%) | 0 (0.0%) |
| $75,000 to $99,999 | 17 (22.7%) | 0 (0.0%) |
| $100,000+ | 0 (0.0%) | 4 (9.5%) |
| Total | 75 (100.0%) | 42 (100.0%) |
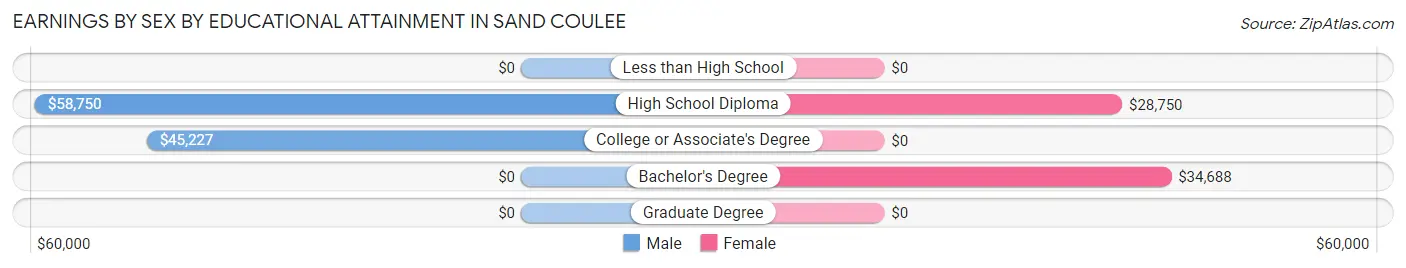
Earnings by Sex by Educational Attainment in Sand Coulee
Average earnings in Sand Coulee are $45,341 for men and $29,750 for women, a difference of 34.4%. Men with an educational attainment of high school diploma enjoy the highest average annual earnings of $58,750, while those with college or associate's degree education earn the least with $45,227. Women with an educational attainment of bachelor's degree earn the most with the average annual earnings of $34,688, while those with high school diploma education have the smallest earnings of $28,750.
| Educational Attainment | Male Income | Female Income |
| Less than High School | - | - |
| High School Diploma | $58,750 | $28,750 |
| College or Associate's Degree | $45,227 | $0 |
| Bachelor's Degree | - | - |
| Graduate Degree | - | - |
| Total | $45,341 | $29,750 |
Family Income in Sand Coulee
Family Income Brackets in Sand Coulee
According to the Sand Coulee family income data, there are 21 families falling into the $100,000 to $149,999 income range, which is the most common income bracket and makes up 35.6% of all families.
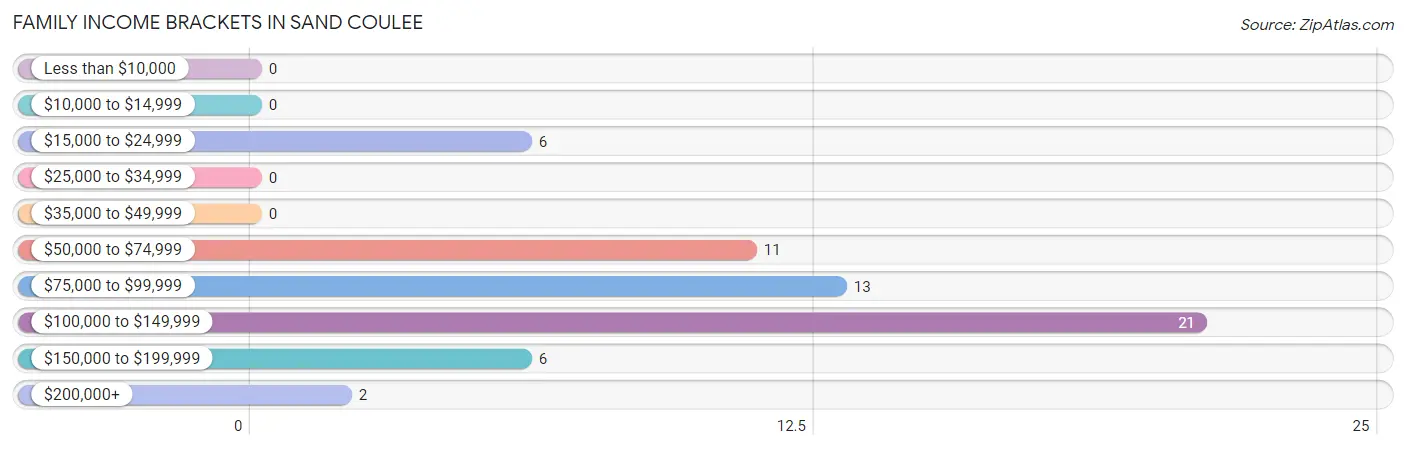
| Income Bracket | # Families | % Families |
| Less than $10,000 | 0 | 0.0% |
| $10,000 to $14,999 | 0 | 0.0% |
| $15,000 to $24,999 | 6 | 10.2% |
| $25,000 to $34,999 | 0 | 0.0% |
| $35,000 to $49,999 | 0 | 0.0% |
| $50,000 to $74,999 | 11 | 18.6% |
| $75,000 to $99,999 | 13 | 22.0% |
| $100,000 to $149,999 | 21 | 35.6% |
| $150,000 to $199,999 | 6 | 10.2% |
| $200,000+ | 2 | 3.4% |
Family Income by Famaliy Size in Sand Coulee
4-person families (23 | 39.0%) account for the highest median family income in Sand Coulee with $122,917 per family, while 2-person families (27 | 45.8%) have the highest median income of $38,693 per family member.
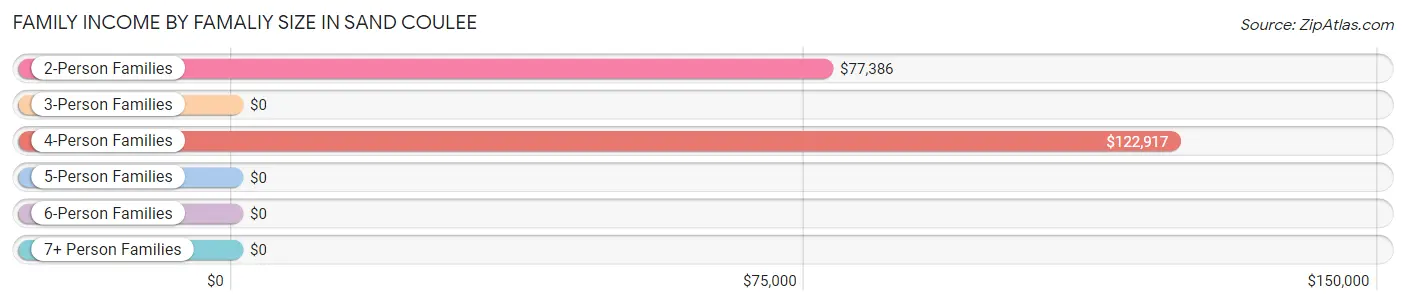
| Income Bracket | # Families | Median Income |
| 2-Person Families | 27 (45.8%) | $77,386 |
| 3-Person Families | 9 (15.2%) | $0 |
| 4-Person Families | 23 (39.0%) | $122,917 |
| 5-Person Families | 0 (0.0%) | $0 |
| 6-Person Families | 0 (0.0%) | $0 |
| 7+ Person Families | 0 (0.0%) | $0 |
| Total | 59 (100.0%) | $84,375 |
Family Income by Number of Earners in Sand Coulee
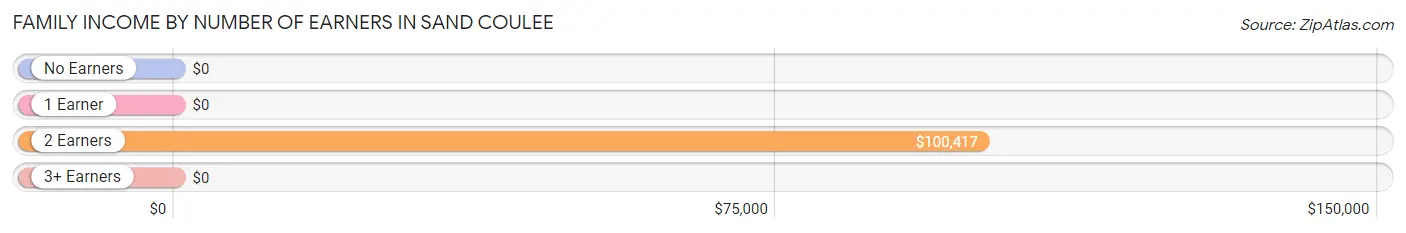
| Number of Earners | # Families | Median Income |
| No Earners | 11 (18.6%) | $0 |
| 1 Earner | 3 (5.1%) | $0 |
| 2 Earners | 45 (76.3%) | $100,417 |
| 3+ Earners | 0 (0.0%) | $0 |
| Total | 59 (100.0%) | $84,375 |
Household Income in Sand Coulee
Household Income Brackets in Sand Coulee
With 21 households falling in the category, the $100,000 to $149,999 income range is the most frequent in Sand Coulee, accounting for 22.8% of all households. In contrast, only 2 households (2.2%) fall into the $200,000+ income bracket, making it the least populous group.
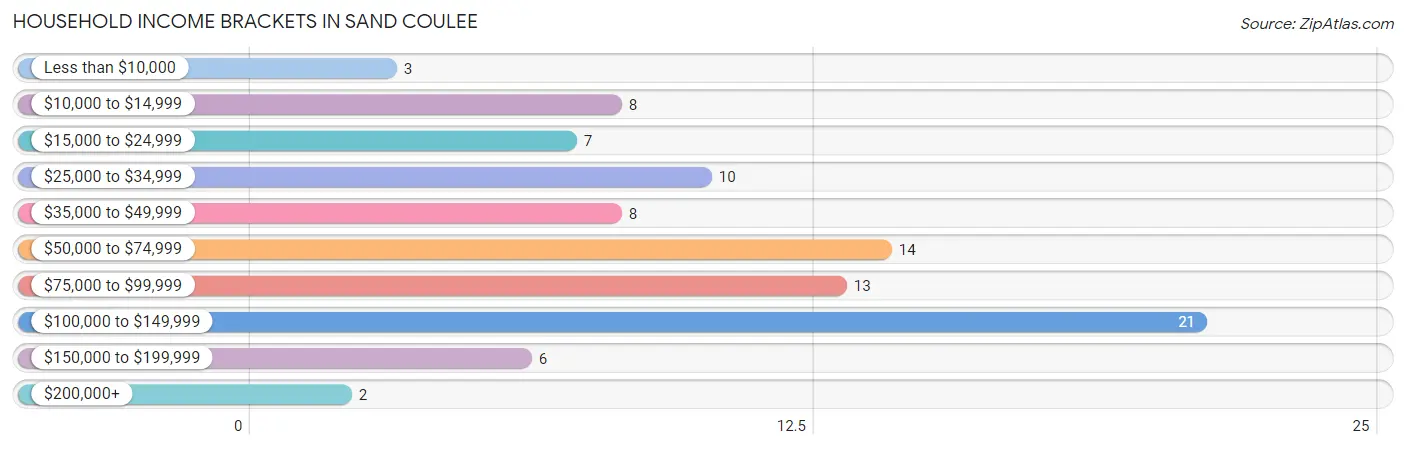
| Income Bracket | # Households | % Households |
| Less than $10,000 | 3 | 3.3% |
| $10,000 to $14,999 | 8 | 8.7% |
| $15,000 to $24,999 | 7 | 7.6% |
| $25,000 to $34,999 | 10 | 10.9% |
| $35,000 to $49,999 | 8 | 8.7% |
| $50,000 to $74,999 | 14 | 15.2% |
| $75,000 to $99,999 | 13 | 14.1% |
| $100,000 to $149,999 | 21 | 22.8% |
| $150,000 to $199,999 | 6 | 6.5% |
| $200,000+ | 2 | 2.2% |
Household Income by Householder Age in Sand Coulee
| Income Bracket | # Households | Median Income |
| 15 to 24 Years | 4 (4.3%) | $0 |
| 25 to 44 Years | 27 (29.3%) | $0 |
| 45 to 64 Years | 25 (27.2%) | $0 |
| 65+ Years | 36 (39.1%) | $0 |
| Total | 92 (100.0%) | $74,091 |
Poverty in Sand Coulee
Income Below Poverty by Sex and Age in Sand Coulee
With 2.3% poverty level for males and 15.0% for females among the residents of Sand Coulee, 55 to 64 year old males and 75 year old and over females are the most vulnerable to poverty, with 3 males (23.1%) and 3 females (100.0%) in their respective age groups living below the poverty level.
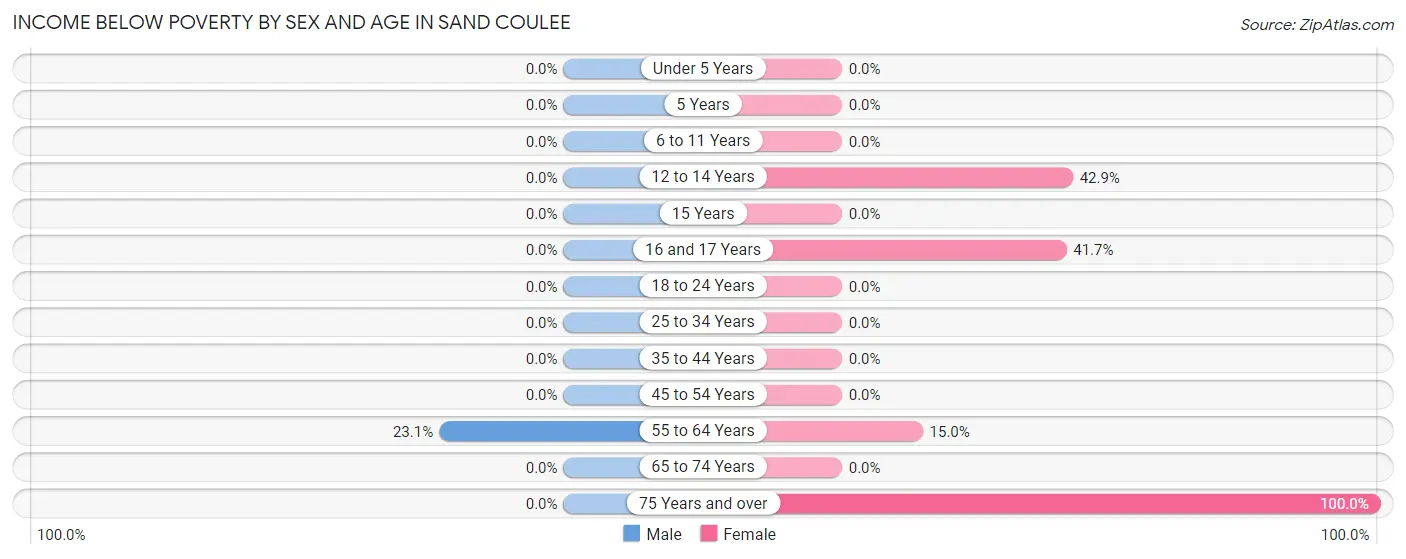
| Age Bracket | Male | Female |
| Under 5 Years | 0 (0.0%) | 0 (0.0%) |
| 5 Years | 0 (0.0%) | 0 (0.0%) |
| 6 to 11 Years | 0 (0.0%) | 0 (0.0%) |
| 12 to 14 Years | 0 (0.0%) | 3 (42.9%) |
| 15 Years | 0 (0.0%) | 0 (0.0%) |
| 16 and 17 Years | 0 (0.0%) | 5 (41.7%) |
| 18 to 24 Years | 0 (0.0%) | 0 (0.0%) |
| 25 to 34 Years | 0 (0.0%) | 0 (0.0%) |
| 35 to 44 Years | 0 (0.0%) | 0 (0.0%) |
| 45 to 54 Years | 0 (0.0%) | 0 (0.0%) |
| 55 to 64 Years | 3 (23.1%) | 3 (15.0%) |
| 65 to 74 Years | 0 (0.0%) | 0 (0.0%) |
| 75 Years and over | 0 (0.0%) | 3 (100.0%) |
| Total | 3 (2.3%) | 14 (15.0%) |
Income Above Poverty by Sex and Age in Sand Coulee
According to the poverty statistics in Sand Coulee, males aged 6 to 11 years and females aged 25 to 34 years are the age groups that are most secure financially, with 100.0% of males and 100.0% of females in these age groups living above the poverty line.
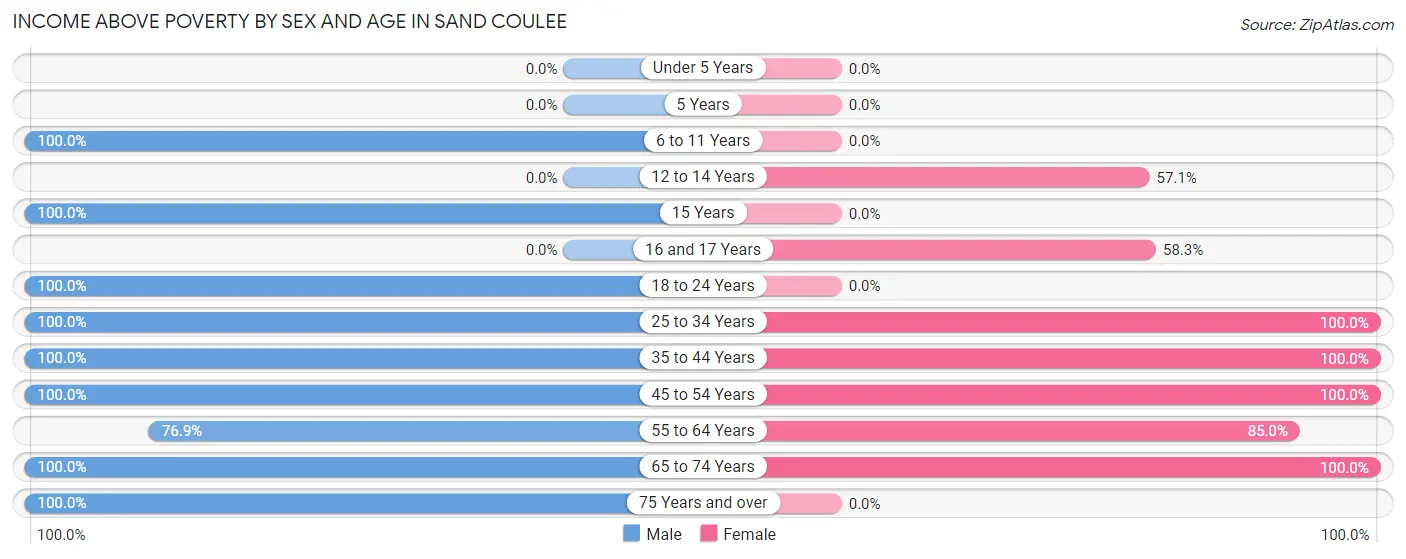
| Age Bracket | Male | Female |
| Under 5 Years | 0 (0.0%) | 0 (0.0%) |
| 5 Years | 0 (0.0%) | 0 (0.0%) |
| 6 to 11 Years | 7 (100.0%) | 0 (0.0%) |
| 12 to 14 Years | 0 (0.0%) | 4 (57.1%) |
| 15 Years | 10 (100.0%) | 0 (0.0%) |
| 16 and 17 Years | 0 (0.0%) | 7 (58.3%) |
| 18 to 24 Years | 4 (100.0%) | 0 (0.0%) |
| 25 to 34 Years | 19 (100.0%) | 14 (100.0%) |
| 35 to 44 Years | 32 (100.0%) | 12 (100.0%) |
| 45 to 54 Years | 12 (100.0%) | 6 (100.0%) |
| 55 to 64 Years | 10 (76.9%) | 17 (85.0%) |
| 65 to 74 Years | 26 (100.0%) | 19 (100.0%) |
| 75 Years and over | 7 (100.0%) | 0 (0.0%) |
| Total | 127 (97.7%) | 79 (85.0%) |
Income Below Poverty Among Married-Couple Families in Sand Coulee
| Children | Above Poverty | Below Poverty |
| No Children | 41 (100.0%) | 0 (0.0%) |
| 1 or 2 Children | 12 (100.0%) | 0 (0.0%) |
| 3 or 4 Children | 0 (0.0%) | 0 (0.0%) |
| 5 or more Children | 0 (0.0%) | 0 (0.0%) |
| Total | 53 (100.0%) | 0 (0.0%) |
Income Below Poverty Among Single-Parent Households in Sand Coulee
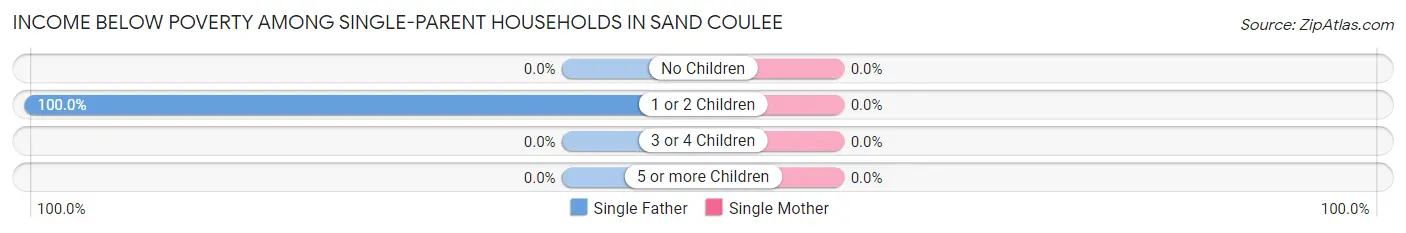
| Children | Single Father | Single Mother |
| No Children | 0 (0.0%) | 0 (0.0%) |
| 1 or 2 Children | 3 (100.0%) | 0 (0.0%) |
| 3 or 4 Children | 0 (0.0%) | 0 (0.0%) |
| 5 or more Children | 0 (0.0%) | 0 (0.0%) |
| Total | 3 (50.0%) | 0 (0.0%) |
Income Below Poverty Among Married-Couple vs Single-Parent Households in Sand Coulee
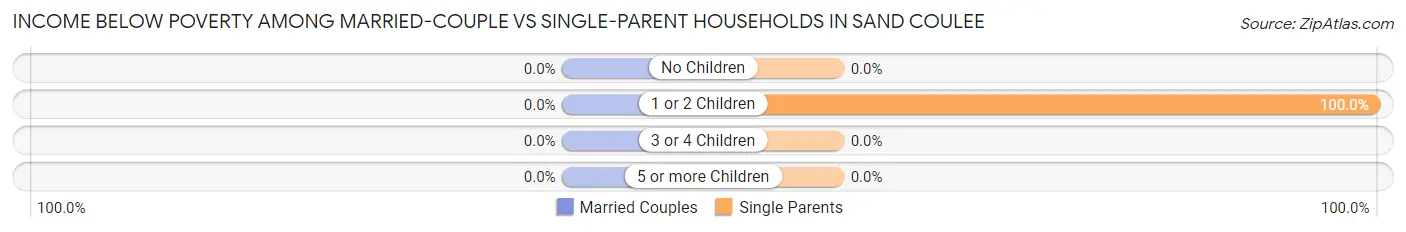
| Children | Married-Couple Families | Single-Parent Households |
| No Children | 0 (0.0%) | 0 (0.0%) |
| 1 or 2 Children | 0 (0.0%) | 3 (100.0%) |
| 3 or 4 Children | 0 (0.0%) | 0 (0.0%) |
| 5 or more Children | 0 (0.0%) | 0 (0.0%) |
| Total | 0 (0.0%) | 3 (50.0%) |
Race in Sand Coulee
The most populous races in Sand Coulee are White / Caucasian (202 | 90.6%), Hispanic or Latino (18 | 8.1%), and Two or more Races (18 | 8.1%).
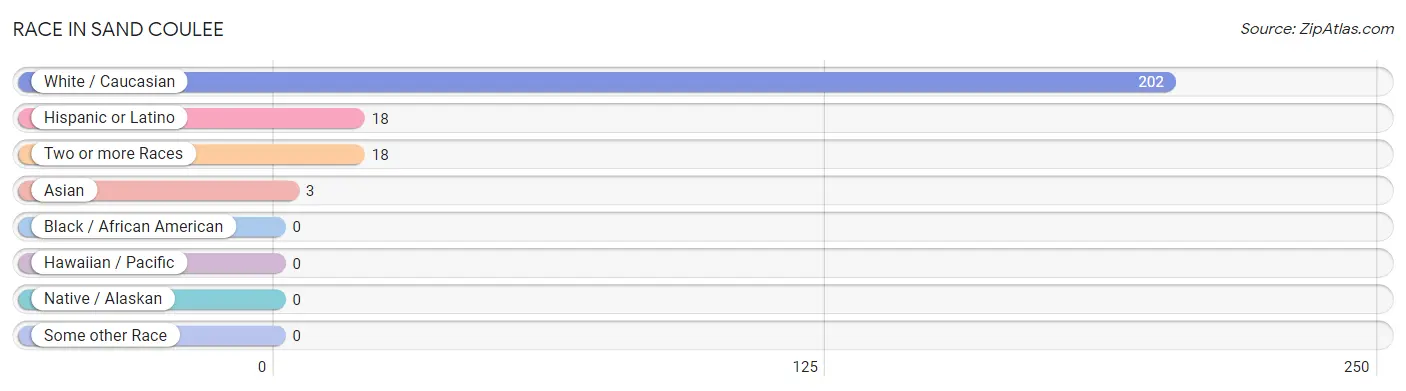
| Race | # Population | % Population |
| Asian | 3 | 1.3% |
| Black / African American | 0 | 0.0% |
| Hawaiian / Pacific | 0 | 0.0% |
| Hispanic or Latino | 18 | 8.1% |
| Native / Alaskan | 0 | 0.0% |
| White / Caucasian | 202 | 90.6% |
| Two or more Races | 18 | 8.1% |
| Some other Race | 0 | 0.0% |
| Total | 223 | 100.0% |
Ancestry in Sand Coulee
The most populous ancestries reported in Sand Coulee are German (55 | 24.7%), Finnish (25 | 11.2%), English (21 | 9.4%), Irish (19 | 8.5%), and Slavic (14 | 6.3%), together accounting for 60.1% of all Sand Coulee residents.
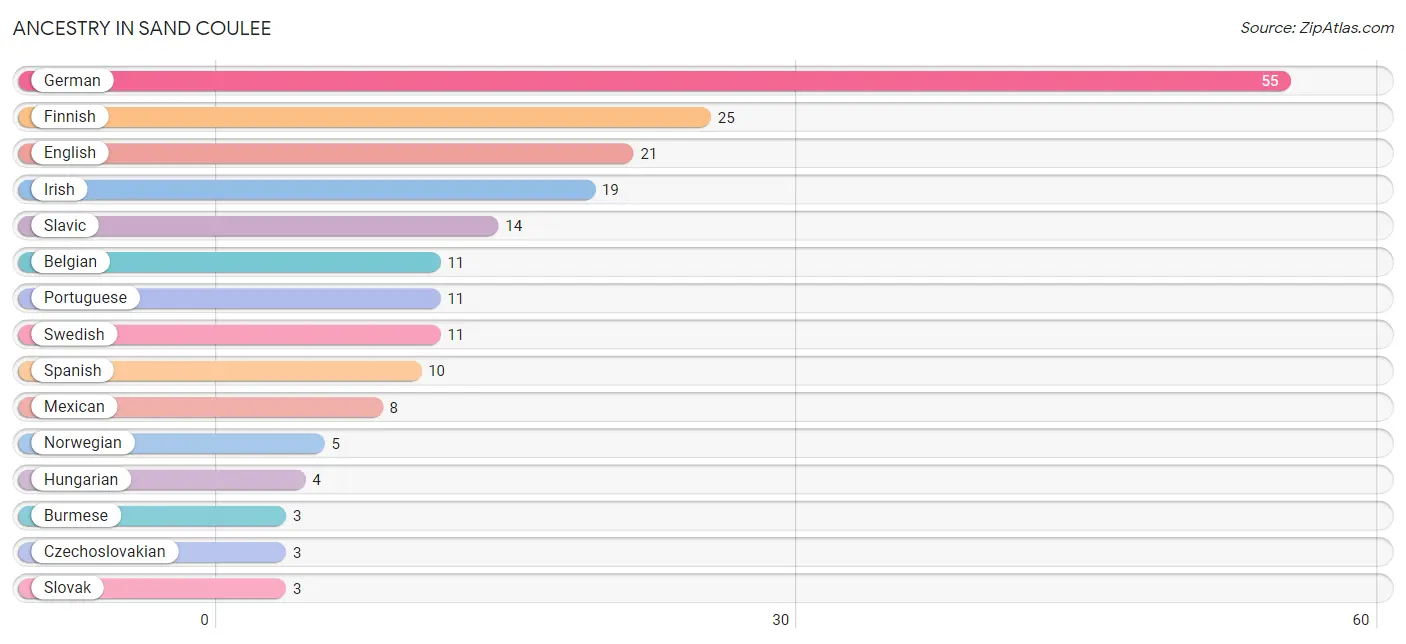
| Ancestry | # Population | % Population |
| American | 2 | 0.9% |
| Belgian | 11 | 4.9% |
| Burmese | 3 | 1.3% |
| Czechoslovakian | 3 | 1.3% |
| English | 21 | 9.4% |
| Finnish | 25 | 11.2% |
| German | 55 | 24.7% |
| Hungarian | 4 | 1.8% |
| Irish | 19 | 8.5% |
| Italian | 2 | 0.9% |
| Mexican | 8 | 3.6% |
| Norwegian | 5 | 2.2% |
| Portuguese | 11 | 4.9% |
| Slavic | 14 | 6.3% |
| Slovak | 3 | 1.3% |
| Spanish | 10 | 4.5% |
| Swedish | 11 | 4.9% | View All 17 Rows |
Immigrants in Sand Coulee
The most numerous immigrant groups reported in Sand Coulee came from Europe (5 | 2.2%), Germany (5 | 2.2%), Western Europe (5 | 2.2%), Asia (3 | 1.3%), and Eastern Asia (3 | 1.3%), together accounting for 9.4% of all Sand Coulee residents.
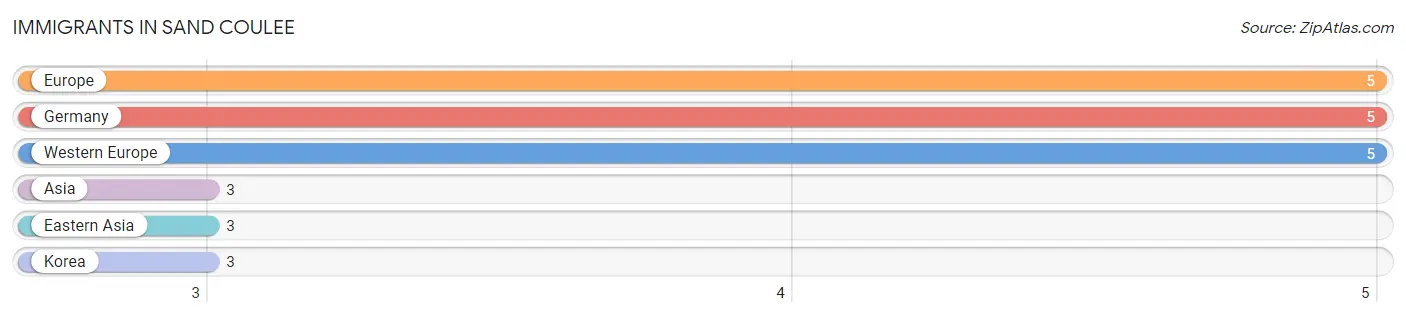
| Immigration Origin | # Population | % Population |
| Asia | 3 | 1.3% |
| Eastern Asia | 3 | 1.3% |
| Europe | 5 | 2.2% |
| Germany | 5 | 2.2% |
| Korea | 3 | 1.3% |
| Western Europe | 5 | 2.2% | View All 6 Rows |
Sex and Age in Sand Coulee
Sex and Age in Sand Coulee
The most populous age groups in Sand Coulee are 35 to 39 Years (29 | 22.3%) for men and 70 to 74 Years (19 | 20.4%) for women.
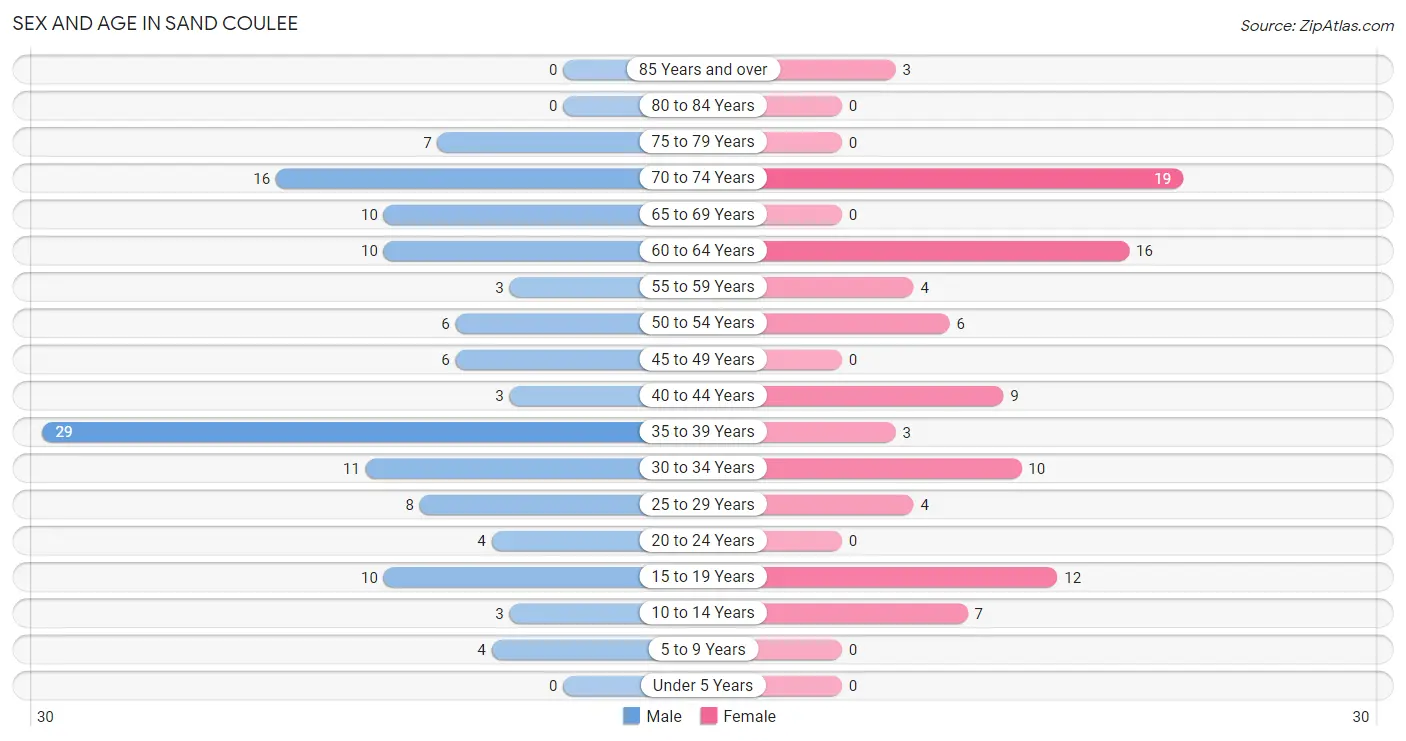
| Age Bracket | Male | Female |
| Under 5 Years | 0 (0.0%) | 0 (0.0%) |
| 5 to 9 Years | 4 (3.1%) | 0 (0.0%) |
| 10 to 14 Years | 3 (2.3%) | 7 (7.5%) |
| 15 to 19 Years | 10 (7.7%) | 12 (12.9%) |
| 20 to 24 Years | 4 (3.1%) | 0 (0.0%) |
| 25 to 29 Years | 8 (6.1%) | 4 (4.3%) |
| 30 to 34 Years | 11 (8.5%) | 10 (10.7%) |
| 35 to 39 Years | 29 (22.3%) | 3 (3.2%) |
| 40 to 44 Years | 3 (2.3%) | 9 (9.7%) |
| 45 to 49 Years | 6 (4.6%) | 0 (0.0%) |
| 50 to 54 Years | 6 (4.6%) | 6 (6.5%) |
| 55 to 59 Years | 3 (2.3%) | 4 (4.3%) |
| 60 to 64 Years | 10 (7.7%) | 16 (17.2%) |
| 65 to 69 Years | 10 (7.7%) | 0 (0.0%) |
| 70 to 74 Years | 16 (12.3%) | 19 (20.4%) |
| 75 to 79 Years | 7 (5.4%) | 0 (0.0%) |
| 80 to 84 Years | 0 (0.0%) | 0 (0.0%) |
| 85 Years and over | 0 (0.0%) | 3 (3.2%) |
| Total | 130 (100.0%) | 93 (100.0%) |
Families and Households in Sand Coulee
Median Family Size in Sand Coulee
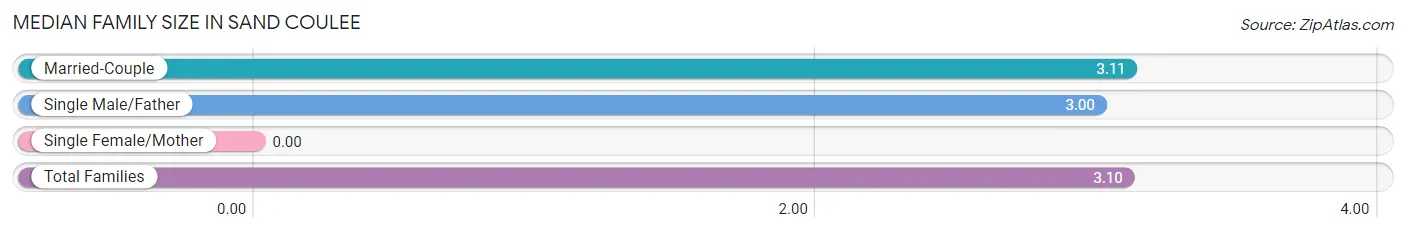
| Family Type | # Families | Family Size |
| Married-Couple | 53 (89.8%) | 3.11 |
| Single Male/Father | 6 (10.2%) | 3.00 |
| Single Female/Mother | 0 (0.0%) | - |
| Total Families | 59 (100.0%) | 3.10 |
Median Household Size in Sand Coulee
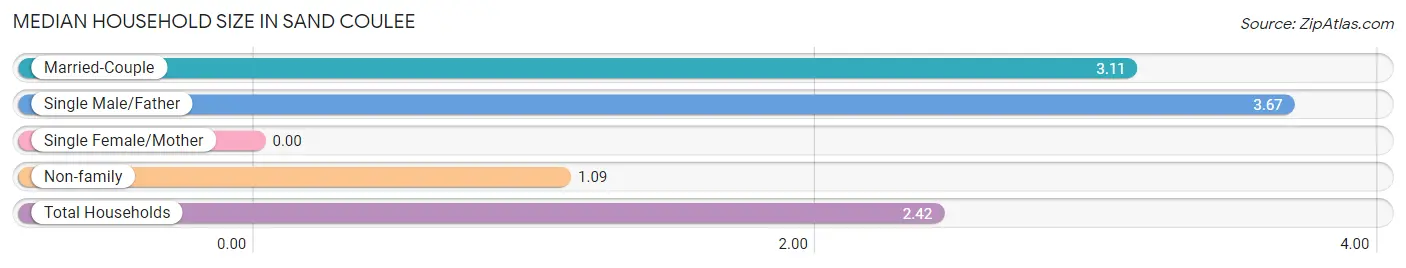
| Household Type | # Households | Household Size |
| Married-Couple | 53 (57.6%) | 3.11 |
| Single Male/Father | 6 (6.5%) | 3.67 |
| Single Female/Mother | 0 (0.0%) | - |
| Non-family | 33 (35.9%) | 1.09 |
| Total Households | 92 (100.0%) | 2.42 |
Household Size by Marriage Status in Sand Coulee
Out of a total of 92 households in Sand Coulee, 59 (64.1%) are family households, while 33 (35.9%) are nonfamily households. The most numerous type of family households are 2-person households, comprising 27, and the most common type of nonfamily households are 1-person households, comprising 31.
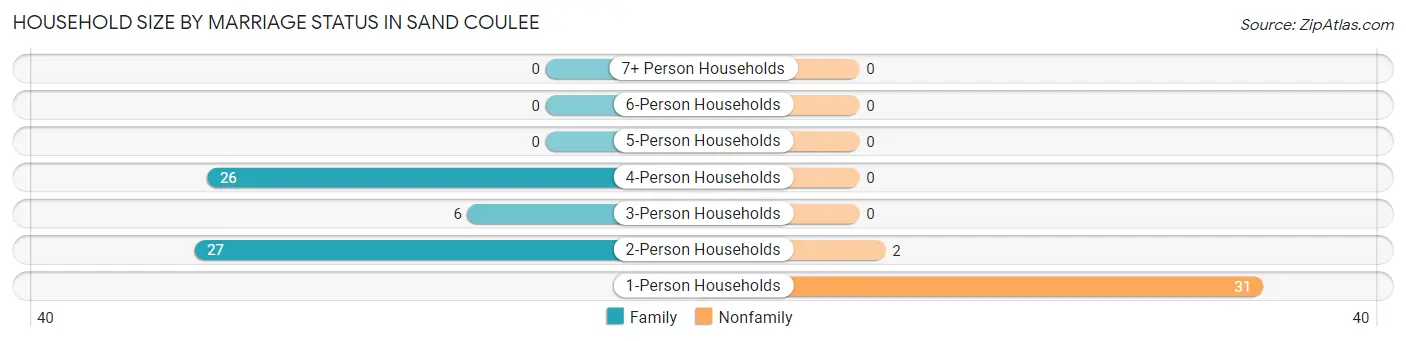
| Household Size | Family Households | Nonfamily Households |
| 1-Person Households | - | 31 (33.7%) |
| 2-Person Households | 27 (29.3%) | 2 (2.2%) |
| 3-Person Households | 6 (6.5%) | 0 (0.0%) |
| 4-Person Households | 26 (28.3%) | 0 (0.0%) |
| 5-Person Households | 0 (0.0%) | 0 (0.0%) |
| 6-Person Households | 0 (0.0%) | 0 (0.0%) |
| 7+ Person Households | 0 (0.0%) | 0 (0.0%) |
| Total | 59 (64.1%) | 33 (35.9%) |
Female Fertility in Sand Coulee
Fertility by Age in Sand Coulee
| Age Bracket | Women with Births | Births / 1,000 Women |
| 15 to 19 years | 0 (0.0%) | 0.0 |
| 20 to 34 years | 0 (0.0%) | 0.0 |
| 35 to 50 years | 0 (0.0%) | 0.0 |
| Total | 0 (0.0%) | 0.0 |
Fertility by Age by Marriage Status in Sand Coulee
| Age Bracket | Married | Unmarried |
| 15 to 19 years | 0 (0.0%) | 0 (0.0%) |
| 20 to 34 years | 0 (0.0%) | 0 (0.0%) |
| 35 to 50 years | 0 (0.0%) | 0 (0.0%) |
| Total | 0 (0.0%) | 0 (0.0%) |
Fertility by Education in Sand Coulee
| Educational Attainment | Women with Births | Births / 1,000 Women |
| Less than High School | 0 (0.0%) | 0.0 |
| High School Diploma | 0 (0.0%) | 0.0 |
| College or Associate's Degree | 0 (0.0%) | 0.0 |
| Bachelor's Degree | 0 (0.0%) | 0.0 |
| Graduate Degree | 0 (0.0%) | 0.0 |
| Total | 0 (0.0%) | 0.0 |
Fertility by Education by Marriage Status in Sand Coulee
| Educational Attainment | Married | Unmarried |
| Less than High School | 0 (0.0%) | 0 (0.0%) |
| High School Diploma | 0 (0.0%) | 0 (0.0%) |
| College or Associate's Degree | 0 (0.0%) | 0 (0.0%) |
| Bachelor's Degree | 0 (0.0%) | 0 (0.0%) |
| Graduate Degree | 0 (0.0%) | 0 (0.0%) |
| Total | 0 (0.0%) | 0 (0.0%) |
Employment Characteristics in Sand Coulee
Employment by Class of Employer in Sand Coulee
Among the 98 employed individuals in Sand Coulee, private company employees (47 | 48.0%), state government employees (14 | 14.3%), and local government employees (11 | 11.2%) make up the most common classes of employment.
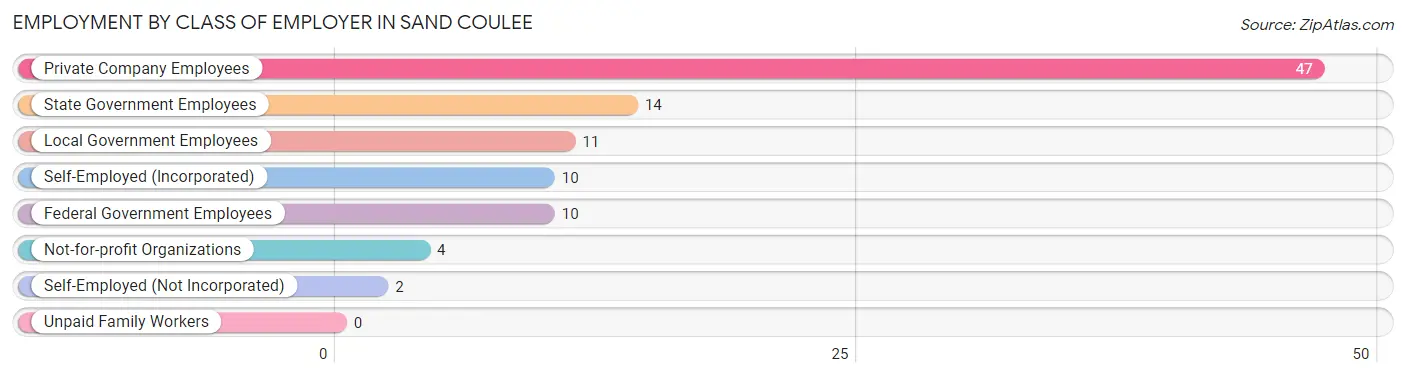
| Employer Class | # Employees | % Employees |
| Private Company Employees | 47 | 48.0% |
| Self-Employed (Incorporated) | 10 | 10.2% |
| Self-Employed (Not Incorporated) | 2 | 2.0% |
| Not-for-profit Organizations | 4 | 4.1% |
| Local Government Employees | 11 | 11.2% |
| State Government Employees | 14 | 14.3% |
| Federal Government Employees | 10 | 10.2% |
| Unpaid Family Workers | 0 | 0.0% |
| Total | 98 | 100.0% |
Employment Status by Age in Sand Coulee
According to the labor force statistics for Sand Coulee, out of the total population over 16 years of age (199), 55.8% or 111 individuals are in the labor force, with 12.1% or 13 of them unemployed. The age group with the highest labor force participation rate is 20 to 24 years, with 100.0% or 4 individuals in the labor force. Within the labor force, the 35 to 44 years age range has the highest percentage of unemployed individuals, with 29.5% or 13 of them being unemployed.
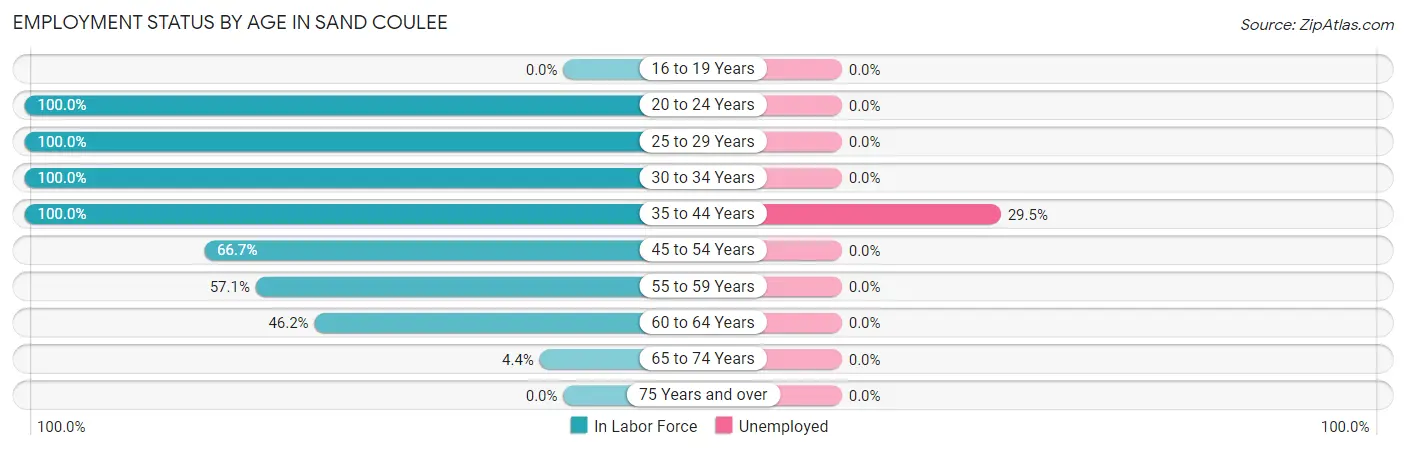
| Age Bracket | In Labor Force | Unemployed |
| 16 to 19 Years | 0 (0.0%) | 0 (0.0%) |
| 20 to 24 Years | 4 (100.0%) | 0 (0.0%) |
| 25 to 29 Years | 12 (100.0%) | 0 (0.0%) |
| 30 to 34 Years | 21 (100.0%) | 0 (0.0%) |
| 35 to 44 Years | 44 (100.0%) | 13 (29.5%) |
| 45 to 54 Years | 12 (66.7%) | 0 (0.0%) |
| 55 to 59 Years | 4 (57.1%) | 0 (0.0%) |
| 60 to 64 Years | 12 (46.2%) | 0 (0.0%) |
| 65 to 74 Years | 2 (4.4%) | 0 (0.0%) |
| 75 Years and over | 0 (0.0%) | 0 (0.0%) |
| Total | 111 (55.8%) | 13 (12.1%) |
Employment Status by Educational Attainment in Sand Coulee
According to labor force statistics for Sand Coulee, 82.0% of individuals (105) out of the total population between 25 and 64 years of age (128) are in the labor force, with 12.4% or 13 of them being unemployed. The group with the highest labor force participation rate are those with the educational attainment of bachelor's degree or higher, with 91.7% or 44 individuals in the labor force. Within the labor force, individuals with bachelor's degree or higher education have the highest percentage of unemployment, with 29.5% or 13 of them being unemployed.
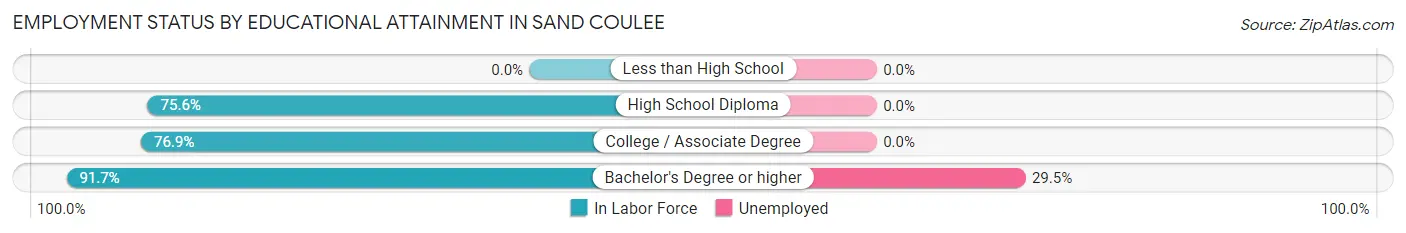
| Educational Attainment | In Labor Force | Unemployed |
| Less than High School | 0 (0.0%) | 0 (0.0%) |
| High School Diploma | 31 (75.6%) | 0 (0.0%) |
| College / Associate Degree | 30 (76.9%) | 0 (0.0%) |
| Bachelor's Degree or higher | 44 (91.7%) | 14 (29.5%) |
| Total | 105 (82.0%) | 16 (12.4%) |
Employment Occupations by Sex in Sand Coulee
Management, Business, Science and Arts Occupations
The most common Management, Business, Science and Arts occupations in Sand Coulee are Community & Social Service (9 | 9.6%), Education Instruction & Library (9 | 9.6%), and Business & Financial (4 | 4.3%).
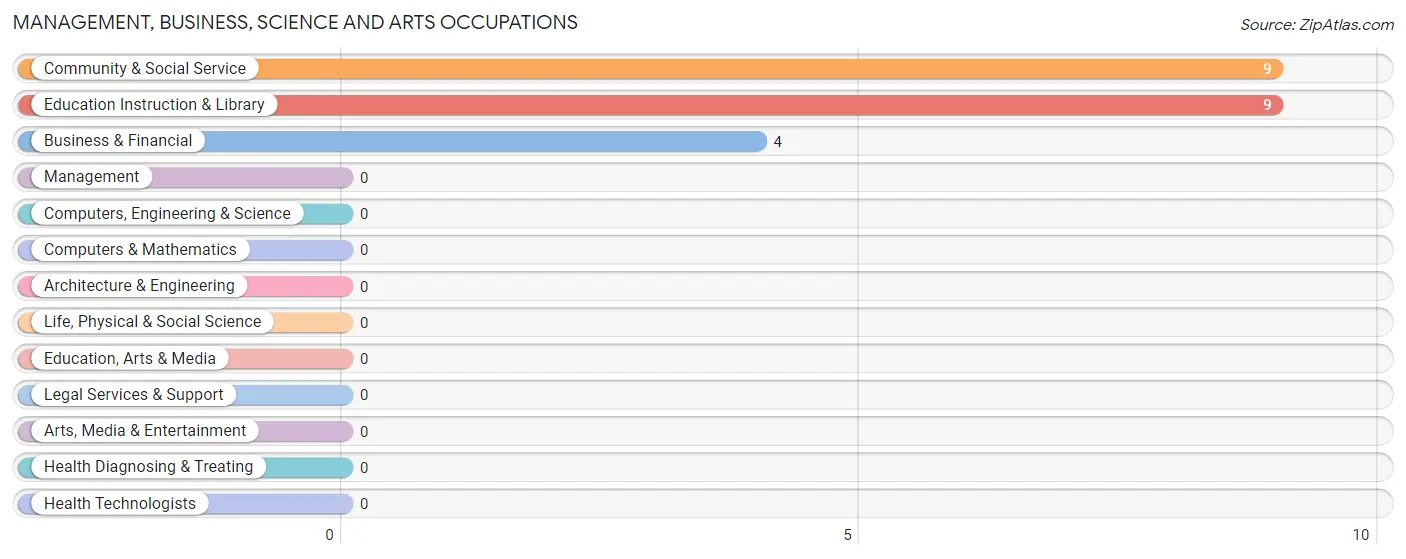
Management, Business, Science and Arts Occupations by Sex
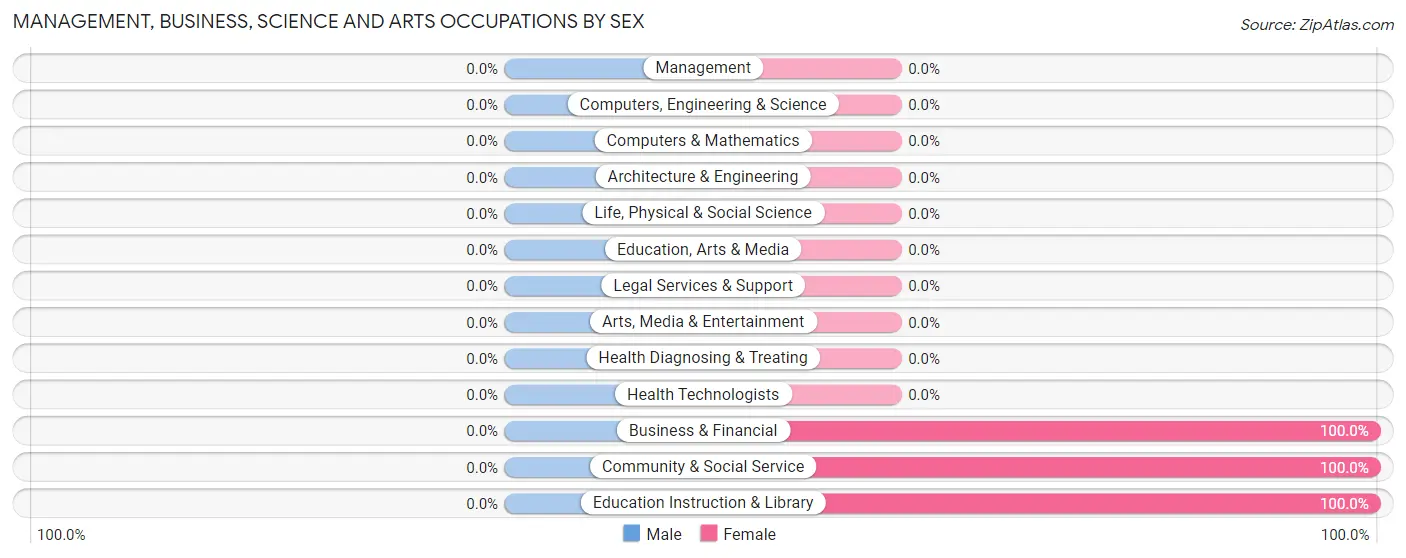
| Occupation | Male | Female |
| Management | 0 (0.0%) | 0 (0.0%) |
| Business & Financial | 0 (0.0%) | 4 (100.0%) |
| Computers, Engineering & Science | 0 (0.0%) | 0 (0.0%) |
| Computers & Mathematics | 0 (0.0%) | 0 (0.0%) |
| Architecture & Engineering | 0 (0.0%) | 0 (0.0%) |
| Life, Physical & Social Science | 0 (0.0%) | 0 (0.0%) |
| Community & Social Service | 0 (0.0%) | 9 (100.0%) |
| Education, Arts & Media | 0 (0.0%) | 0 (0.0%) |
| Legal Services & Support | 0 (0.0%) | 0 (0.0%) |
| Education Instruction & Library | 0 (0.0%) | 9 (100.0%) |
| Arts, Media & Entertainment | 0 (0.0%) | 0 (0.0%) |
| Health Diagnosing & Treating | 0 (0.0%) | 0 (0.0%) |
| Health Technologists | 0 (0.0%) | 0 (0.0%) |
| Total (Category) | 0 (0.0%) | 13 (100.0%) |
| Total (Overall) | 58 (61.7%) | 36 (38.3%) |
Services Occupations
The most common Services occupations in Sand Coulee are Security & Protection (11 | 11.7%), Law Enforcement (11 | 11.7%), and Cleaning & Maintenance (5 | 5.3%).
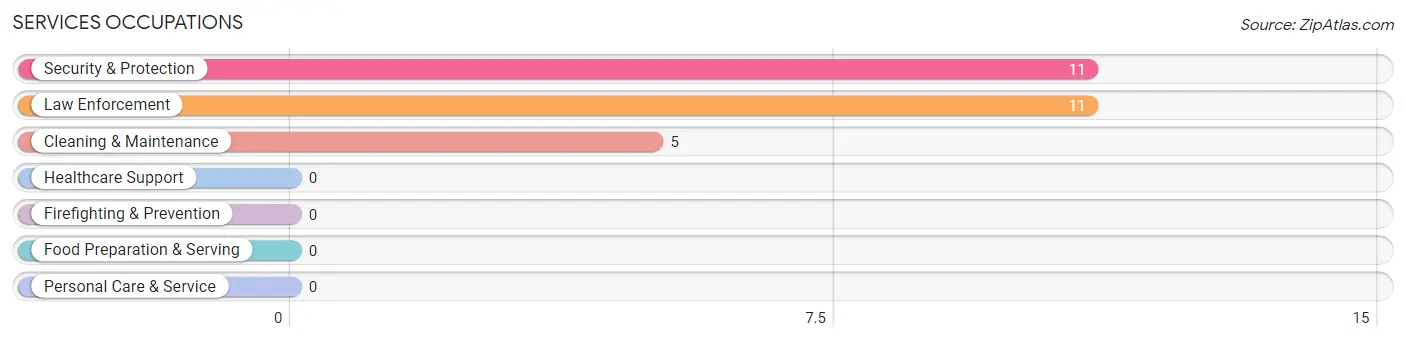
Services Occupations by Sex
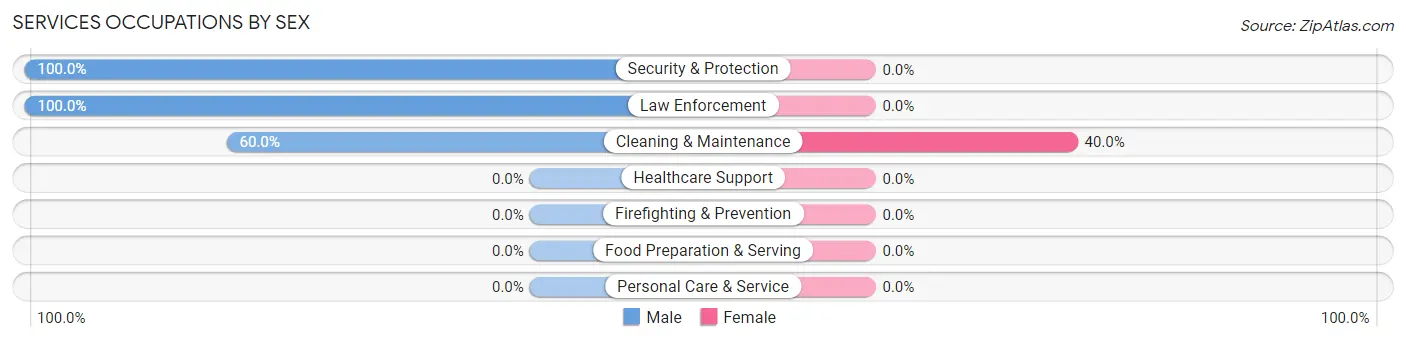
| Occupation | Male | Female |
| Healthcare Support | 0 (0.0%) | 0 (0.0%) |
| Security & Protection | 11 (100.0%) | 0 (0.0%) |
| Firefighting & Prevention | 0 (0.0%) | 0 (0.0%) |
| Law Enforcement | 11 (100.0%) | 0 (0.0%) |
| Food Preparation & Serving | 0 (0.0%) | 0 (0.0%) |
| Cleaning & Maintenance | 3 (60.0%) | 2 (40.0%) |
| Personal Care & Service | 0 (0.0%) | 0 (0.0%) |
| Total (Category) | 14 (87.5%) | 2 (12.5%) |
| Total (Overall) | 58 (61.7%) | 36 (38.3%) |
Sales and Office Occupations
The most common Sales and Office occupations in Sand Coulee are Sales & Related (13 | 13.8%), and Office & Administration (10 | 10.6%).
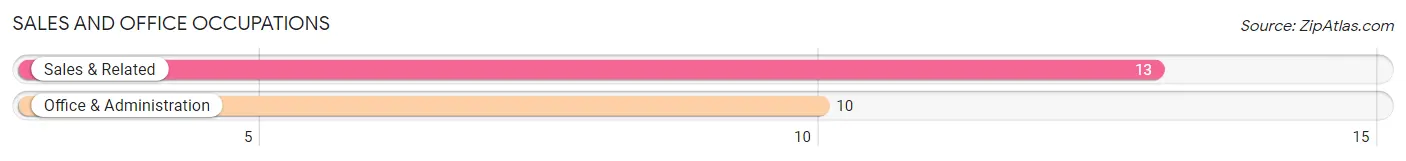
Sales and Office Occupations by Sex
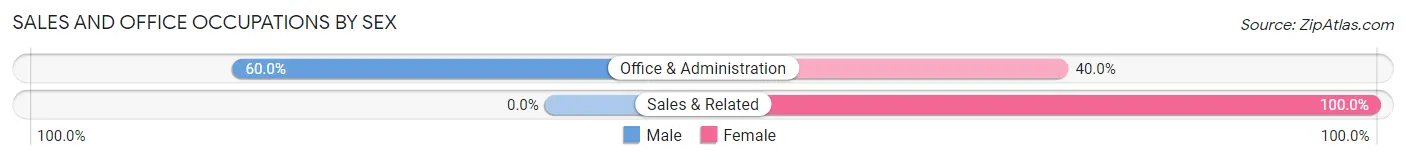
| Occupation | Male | Female |
| Sales & Related | 0 (0.0%) | 13 (100.0%) |
| Office & Administration | 6 (60.0%) | 4 (40.0%) |
| Total (Category) | 6 (26.1%) | 17 (73.9%) |
| Total (Overall) | 58 (61.7%) | 36 (38.3%) |
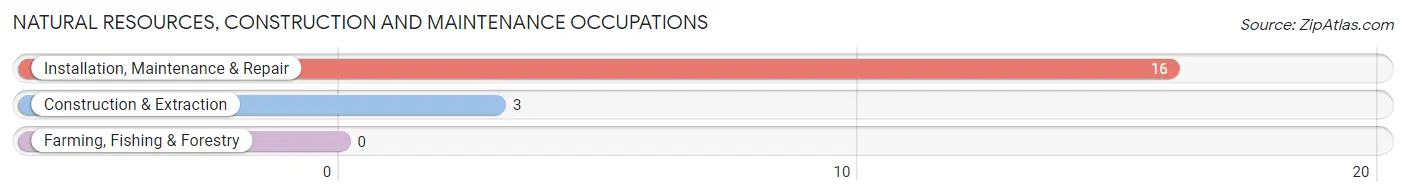
Natural Resources, Construction and Maintenance Occupations
The most common Natural Resources, Construction and Maintenance occupations in Sand Coulee are Installation, Maintenance & Repair (16 | 17.0%), and Construction & Extraction (3 | 3.2%).
Natural Resources, Construction and Maintenance Occupations by Sex
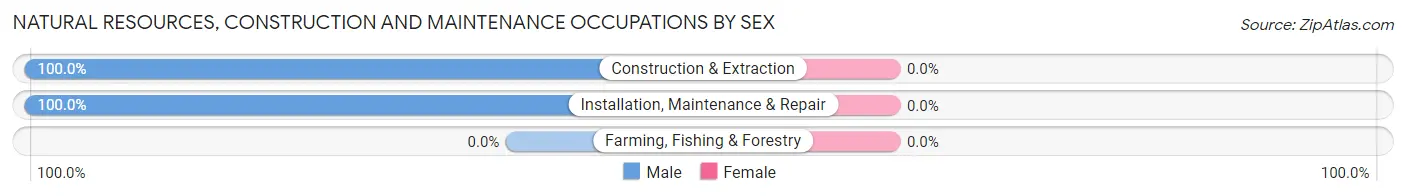
| Occupation | Male | Female |
| Farming, Fishing & Forestry | 0 (0.0%) | 0 (0.0%) |
| Construction & Extraction | 3 (100.0%) | 0 (0.0%) |
| Installation, Maintenance & Repair | 16 (100.0%) | 0 (0.0%) |
| Total (Category) | 19 (100.0%) | 0 (0.0%) |
| Total (Overall) | 58 (61.7%) | 36 (38.3%) |
Production, Transportation and Moving Occupations
The most common Production, Transportation and Moving occupations in Sand Coulee are Material Moving (20 | 21.3%), and Transportation (3 | 3.2%).
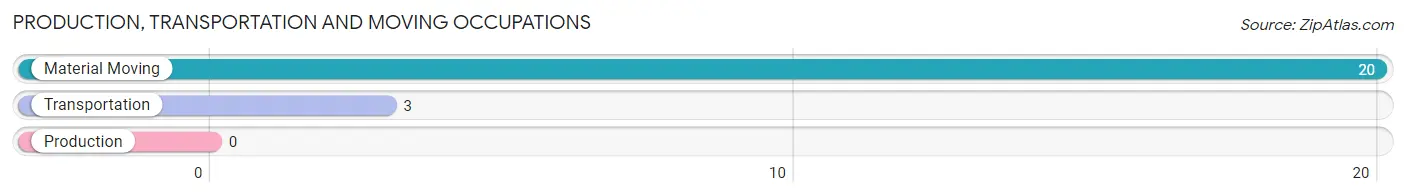
Production, Transportation and Moving Occupations by Sex
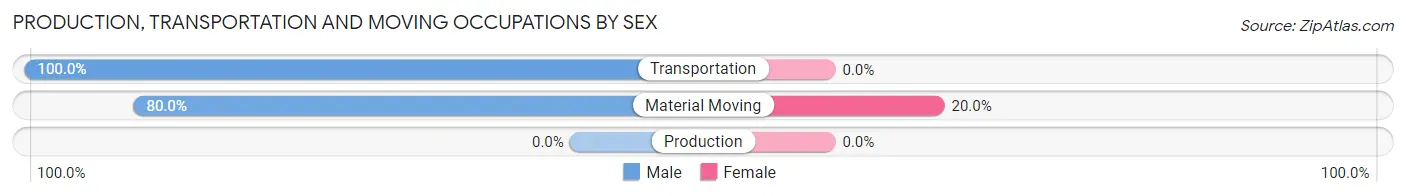
| Occupation | Male | Female |
| Production | 0 (0.0%) | 0 (0.0%) |
| Transportation | 3 (100.0%) | 0 (0.0%) |
| Material Moving | 16 (80.0%) | 4 (20.0%) |
| Total (Category) | 19 (82.6%) | 4 (17.4%) |
| Total (Overall) | 58 (61.7%) | 36 (38.3%) |
Employment Industries by Sex in Sand Coulee
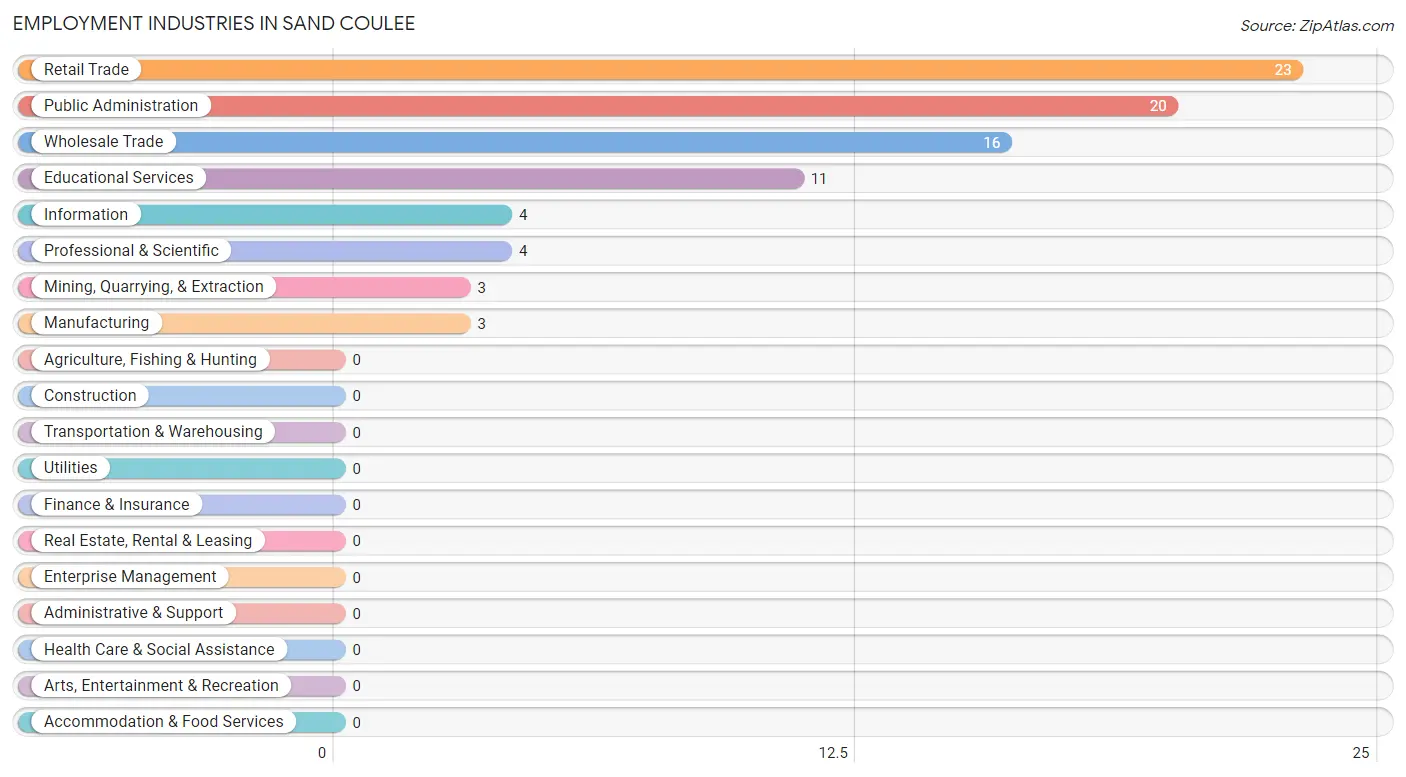
Employment Industries in Sand Coulee
The major employment industries in Sand Coulee include Retail Trade (23 | 24.5%), Public Administration (20 | 21.3%), Wholesale Trade (16 | 17.0%), Educational Services (11 | 11.7%), and Information (4 | 4.3%).
Employment Industries by Sex in Sand Coulee
The Sand Coulee industries that see more men than women are Mining, Quarrying, & Extraction (100.0%), Manufacturing (100.0%), and Wholesale Trade (100.0%), whereas the industries that tend to have a higher number of women are Information (100.0%), Professional & Scientific (100.0%), and Educational Services (100.0%).
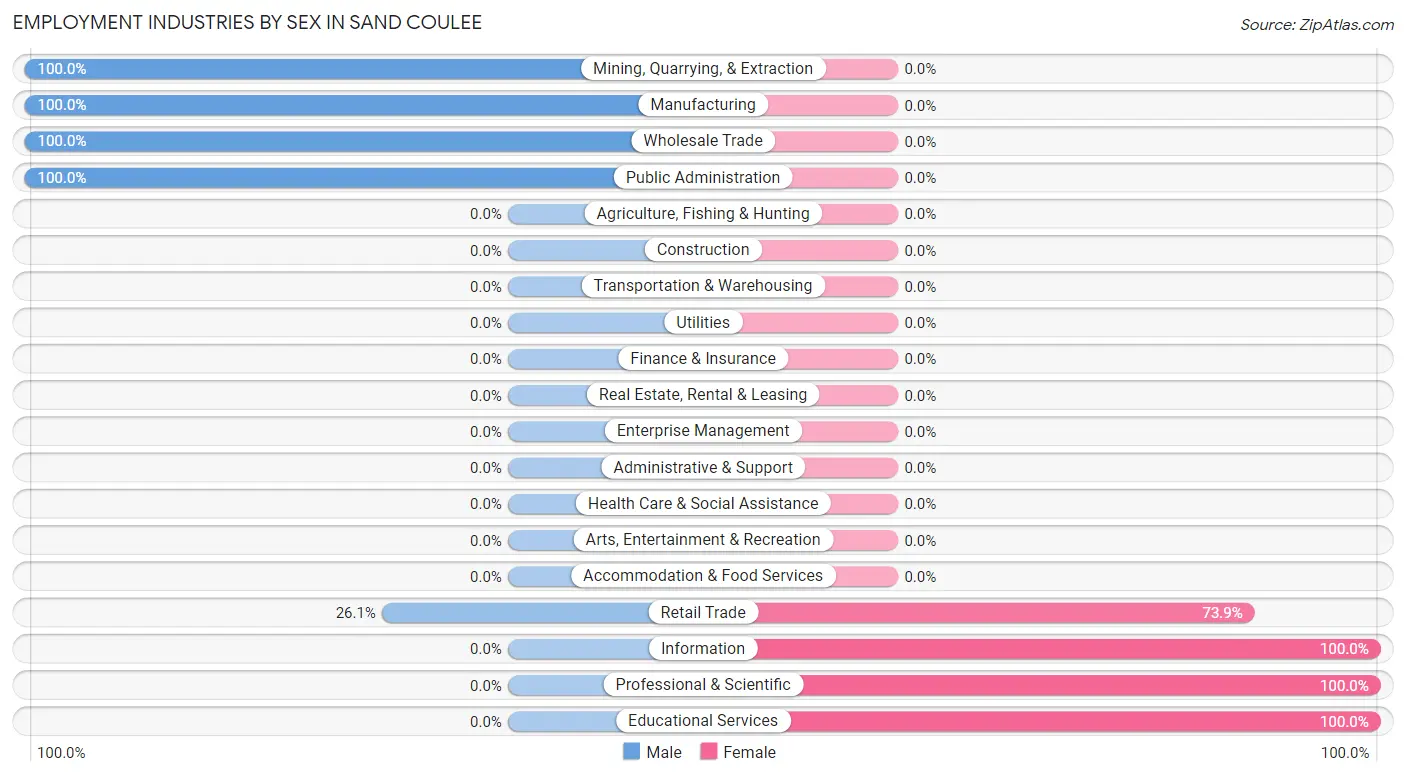
| Industry | Male | Female |
| Agriculture, Fishing & Hunting | 0 (0.0%) | 0 (0.0%) |
| Mining, Quarrying, & Extraction | 3 (100.0%) | 0 (0.0%) |
| Construction | 0 (0.0%) | 0 (0.0%) |
| Manufacturing | 3 (100.0%) | 0 (0.0%) |
| Wholesale Trade | 16 (100.0%) | 0 (0.0%) |
| Retail Trade | 6 (26.1%) | 17 (73.9%) |
| Transportation & Warehousing | 0 (0.0%) | 0 (0.0%) |
| Utilities | 0 (0.0%) | 0 (0.0%) |
| Information | 0 (0.0%) | 4 (100.0%) |
| Finance & Insurance | 0 (0.0%) | 0 (0.0%) |
| Real Estate, Rental & Leasing | 0 (0.0%) | 0 (0.0%) |
| Professional & Scientific | 0 (0.0%) | 4 (100.0%) |
| Enterprise Management | 0 (0.0%) | 0 (0.0%) |
| Administrative & Support | 0 (0.0%) | 0 (0.0%) |
| Educational Services | 0 (0.0%) | 11 (100.0%) |
| Health Care & Social Assistance | 0 (0.0%) | 0 (0.0%) |
| Arts, Entertainment & Recreation | 0 (0.0%) | 0 (0.0%) |
| Accommodation & Food Services | 0 (0.0%) | 0 (0.0%) |
| Public Administration | 20 (100.0%) | 0 (0.0%) |
| Total | 58 (61.7%) | 36 (38.3%) |
Education in Sand Coulee
School Enrollment in Sand Coulee
The most common levels of schooling among the 36 students in Sand Coulee are high school (25 | 69.4%), middle school (7 | 19.4%), and elementary school (4 | 11.1%).
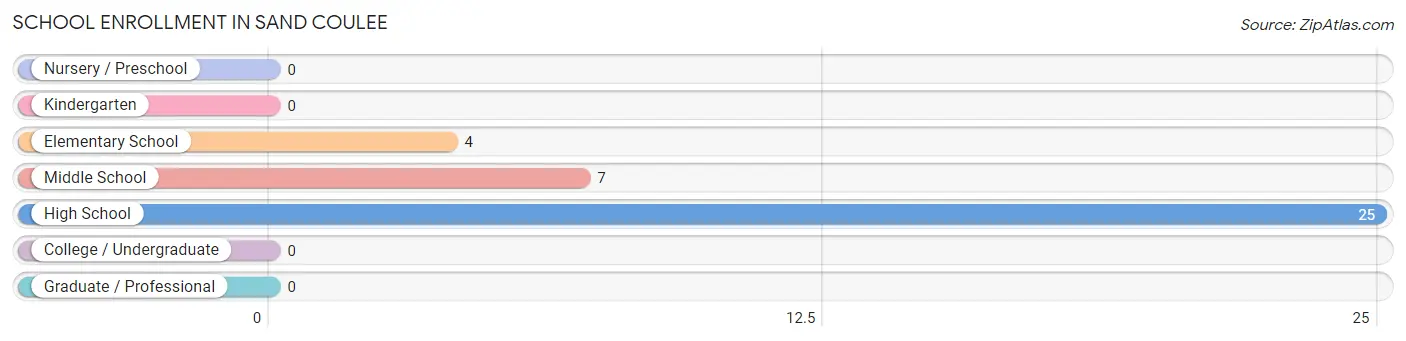
| School Level | # Students | % Students |
| Nursery / Preschool | 0 | 0.0% |
| Kindergarten | 0 | 0.0% |
| Elementary School | 4 | 11.1% |
| Middle School | 7 | 19.4% |
| High School | 25 | 69.4% |
| College / Undergraduate | 0 | 0.0% |
| Graduate / Professional | 0 | 0.0% |
| Total | 36 | 100.0% |
School Enrollment by Age by Funding Source in Sand Coulee
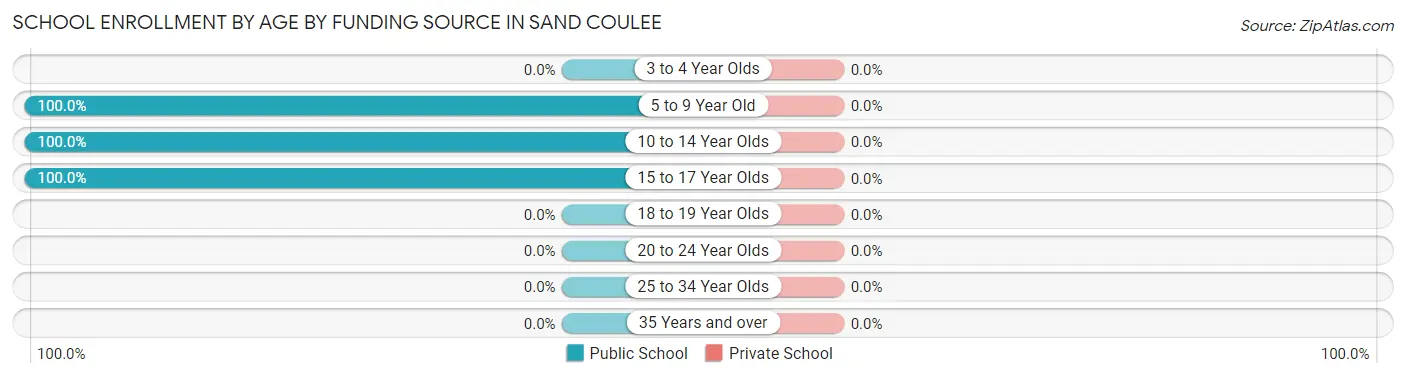
| Age Bracket | Public School | Private School |
| 3 to 4 Year Olds | 0 (0.0%) | 0 (0.0%) |
| 5 to 9 Year Old | 4 (100.0%) | 0 (0.0%) |
| 10 to 14 Year Olds | 10 (100.0%) | 0 (0.0%) |
| 15 to 17 Year Olds | 22 (100.0%) | 0 (0.0%) |
| 18 to 19 Year Olds | 0 (0.0%) | 0 (0.0%) |
| 20 to 24 Year Olds | 0 (0.0%) | 0 (0.0%) |
| 25 to 34 Year Olds | 0 (0.0%) | 0 (0.0%) |
| 35 Years and over | 0 (0.0%) | 0 (0.0%) |
| Total | 36 (100.0%) | 0 (0.0%) |
Educational Attainment by Field of Study in Sand Coulee
Education (17 | 33.3%), arts & humanities (13 | 25.5%), business (10 | 19.6%), science & technology (8 | 15.7%), and bio, nature & agricultural (3 | 5.9%) are the most common fields of study among 51 individuals in Sand Coulee who have obtained a bachelor's degree or higher.
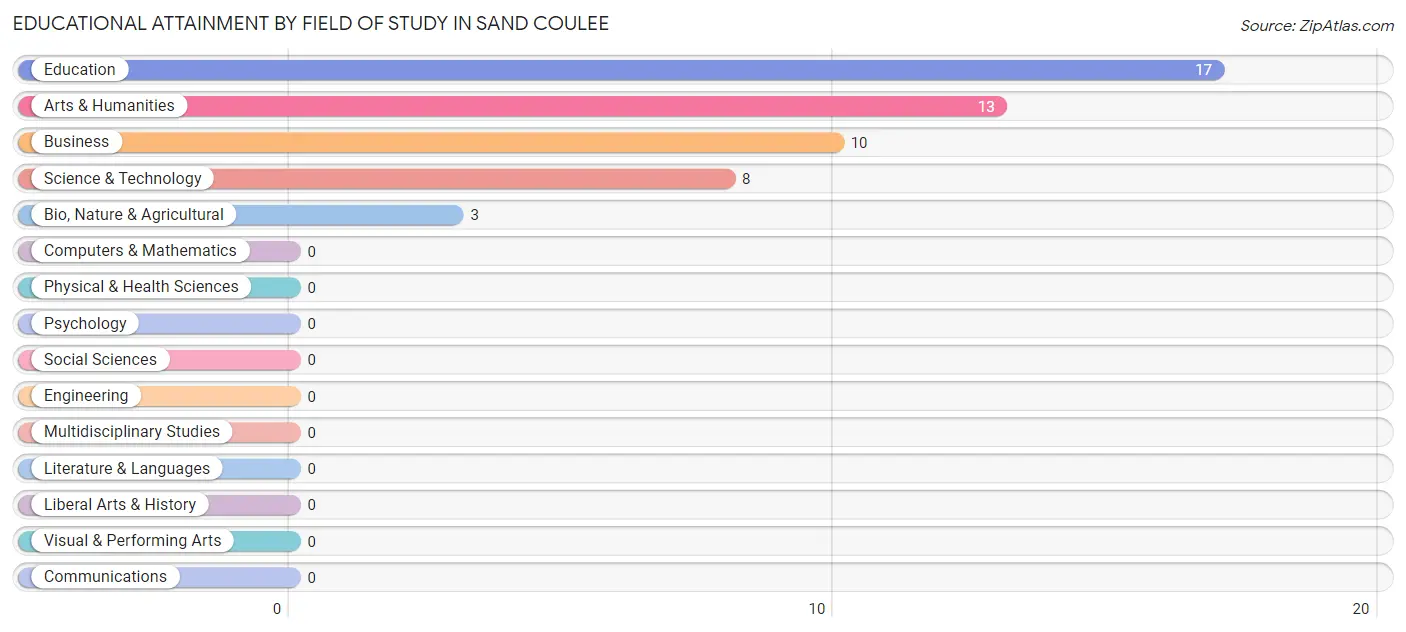
| Field of Study | # Graduates | % Graduates |
| Computers & Mathematics | 0 | 0.0% |
| Bio, Nature & Agricultural | 3 | 5.9% |
| Physical & Health Sciences | 0 | 0.0% |
| Psychology | 0 | 0.0% |
| Social Sciences | 0 | 0.0% |
| Engineering | 0 | 0.0% |
| Multidisciplinary Studies | 0 | 0.0% |
| Science & Technology | 8 | 15.7% |
| Business | 10 | 19.6% |
| Education | 17 | 33.3% |
| Literature & Languages | 0 | 0.0% |
| Liberal Arts & History | 0 | 0.0% |
| Visual & Performing Arts | 0 | 0.0% |
| Communications | 0 | 0.0% |
| Arts & Humanities | 13 | 25.5% |
| Total | 51 | 100.0% |
Transportation & Commute in Sand Coulee
Vehicle Availability by Sex in Sand Coulee
The most prevalent vehicle ownership categories in Sand Coulee are males with 5 or more vehicles (27, accounting for 43.5%) and females with 5 or more vehicles (0, making up 75.0%).
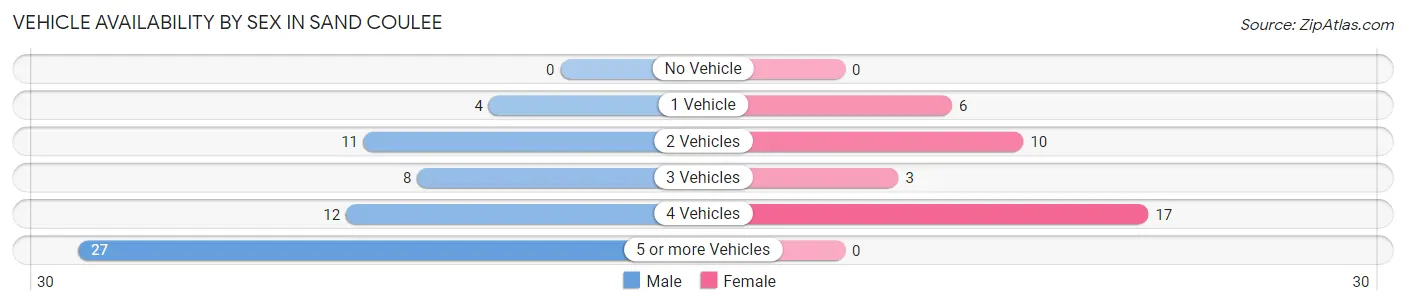
| Vehicles Available | Male | Female |
| No Vehicle | 0 (0.0%) | 0 (0.0%) |
| 1 Vehicle | 4 (6.5%) | 6 (16.7%) |
| 2 Vehicles | 11 (17.7%) | 10 (27.8%) |
| 3 Vehicles | 8 (12.9%) | 3 (8.3%) |
| 4 Vehicles | 12 (19.4%) | 17 (47.2%) |
| 5 or more Vehicles | 27 (43.5%) | 0 (0.0%) |
| Total | 62 (100.0%) | 36 (100.0%) |
Commute Time in Sand Coulee
The most frequently occuring commute durations in Sand Coulee are 20 to 24 minutes (36 commuters, 37.5%), 30 to 34 minutes (20 commuters, 20.8%), and 15 to 19 minutes (17 commuters, 17.7%).
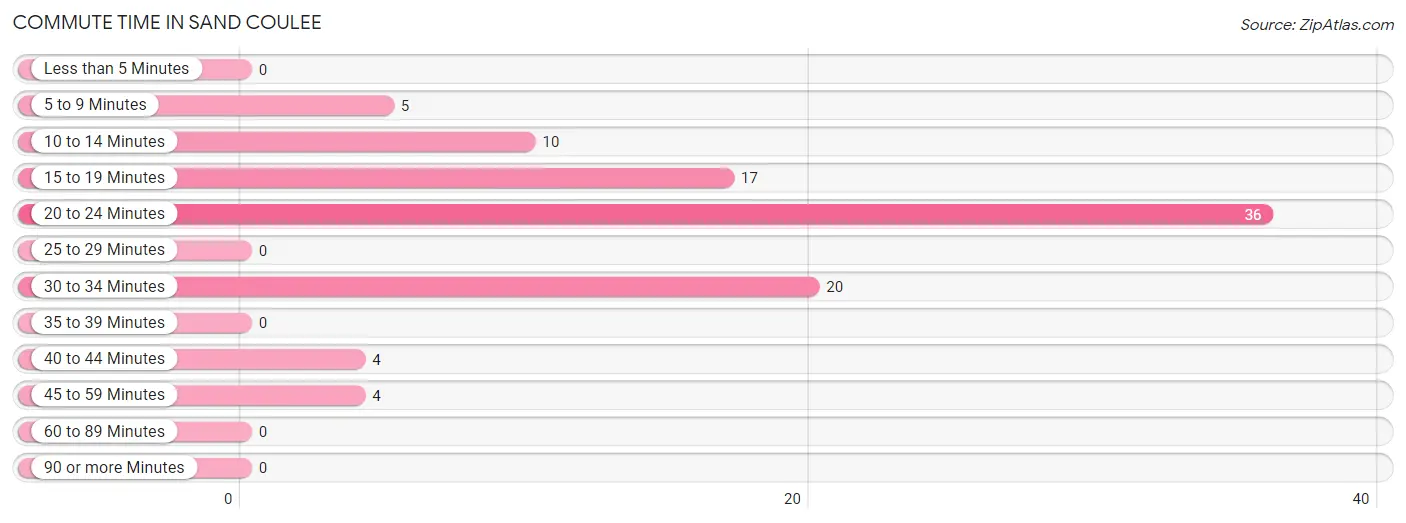
| Commute Time | # Commuters | % Commuters |
| Less than 5 Minutes | 0 | 0.0% |
| 5 to 9 Minutes | 5 | 5.2% |
| 10 to 14 Minutes | 10 | 10.4% |
| 15 to 19 Minutes | 17 | 17.7% |
| 20 to 24 Minutes | 36 | 37.5% |
| 25 to 29 Minutes | 0 | 0.0% |
| 30 to 34 Minutes | 20 | 20.8% |
| 35 to 39 Minutes | 0 | 0.0% |
| 40 to 44 Minutes | 4 | 4.2% |
| 45 to 59 Minutes | 4 | 4.2% |
| 60 to 89 Minutes | 0 | 0.0% |
| 90 or more Minutes | 0 | 0.0% |
Commute Time by Sex in Sand Coulee
The most common commute times in Sand Coulee are 20 to 24 minutes (29 commuters, 48.3%) for males and 10 to 14 minutes (10 commuters, 27.8%) for females.
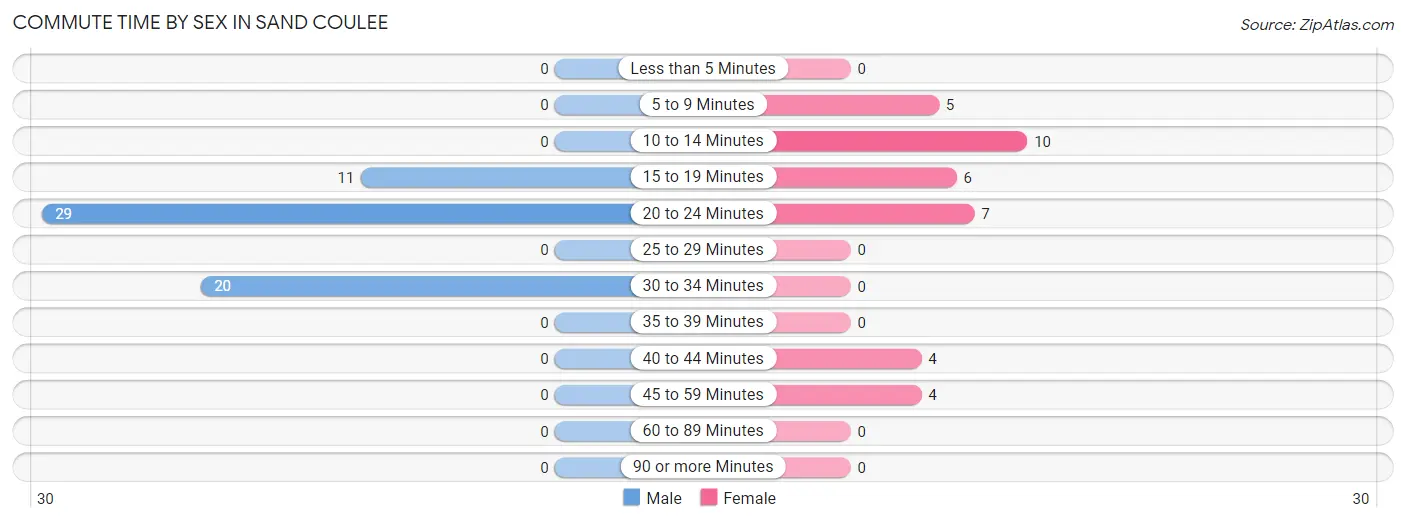
| Commute Time | Male | Female |
| Less than 5 Minutes | 0 (0.0%) | 0 (0.0%) |
| 5 to 9 Minutes | 0 (0.0%) | 5 (13.9%) |
| 10 to 14 Minutes | 0 (0.0%) | 10 (27.8%) |
| 15 to 19 Minutes | 11 (18.3%) | 6 (16.7%) |
| 20 to 24 Minutes | 29 (48.3%) | 7 (19.4%) |
| 25 to 29 Minutes | 0 (0.0%) | 0 (0.0%) |
| 30 to 34 Minutes | 20 (33.3%) | 0 (0.0%) |
| 35 to 39 Minutes | 0 (0.0%) | 0 (0.0%) |
| 40 to 44 Minutes | 0 (0.0%) | 4 (11.1%) |
| 45 to 59 Minutes | 0 (0.0%) | 4 (11.1%) |
| 60 to 89 Minutes | 0 (0.0%) | 0 (0.0%) |
| 90 or more Minutes | 0 (0.0%) | 0 (0.0%) |
Time of Departure to Work by Sex in Sand Coulee
The most frequent times of departure to work in Sand Coulee are 6:30 AM to 6:59 AM (23, 38.3%) for males and 7:30 AM to 7:59 AM (18, 50.0%) for females.
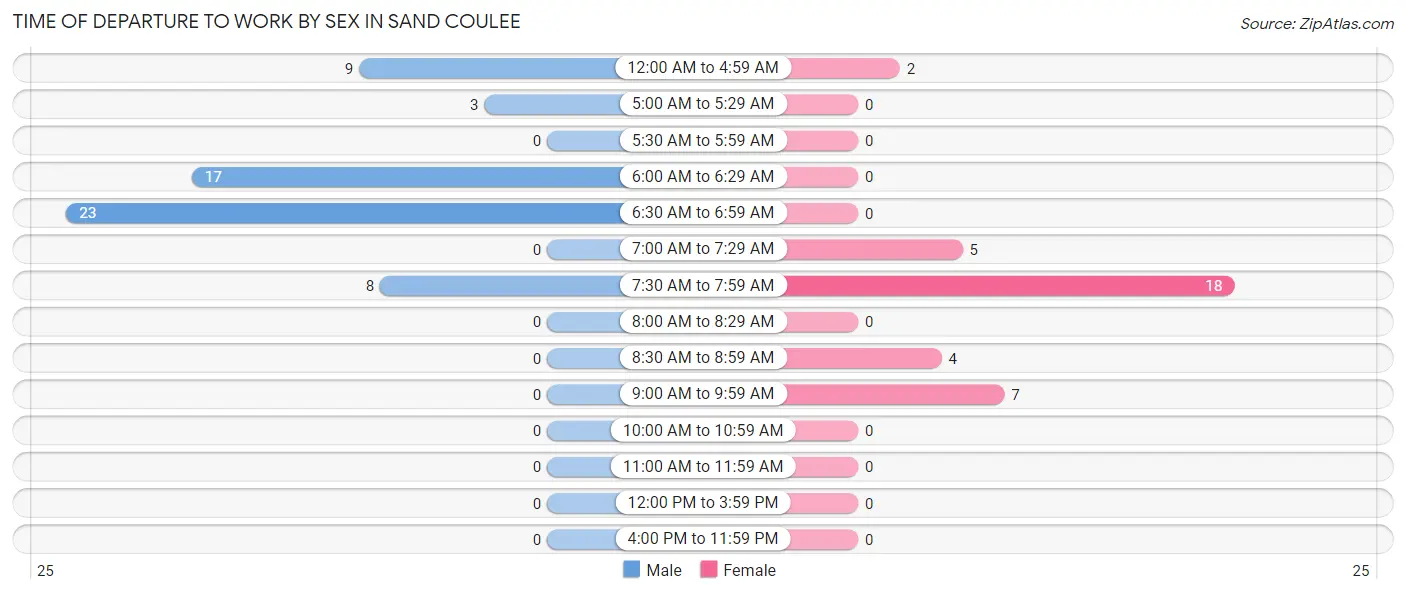
| Time of Departure | Male | Female |
| 12:00 AM to 4:59 AM | 9 (15.0%) | 2 (5.6%) |
| 5:00 AM to 5:29 AM | 3 (5.0%) | 0 (0.0%) |
| 5:30 AM to 5:59 AM | 0 (0.0%) | 0 (0.0%) |
| 6:00 AM to 6:29 AM | 17 (28.3%) | 0 (0.0%) |
| 6:30 AM to 6:59 AM | 23 (38.3%) | 0 (0.0%) |
| 7:00 AM to 7:29 AM | 0 (0.0%) | 5 (13.9%) |
| 7:30 AM to 7:59 AM | 8 (13.3%) | 18 (50.0%) |
| 8:00 AM to 8:29 AM | 0 (0.0%) | 0 (0.0%) |
| 8:30 AM to 8:59 AM | 0 (0.0%) | 4 (11.1%) |
| 9:00 AM to 9:59 AM | 0 (0.0%) | 7 (19.4%) |
| 10:00 AM to 10:59 AM | 0 (0.0%) | 0 (0.0%) |
| 11:00 AM to 11:59 AM | 0 (0.0%) | 0 (0.0%) |
| 12:00 PM to 3:59 PM | 0 (0.0%) | 0 (0.0%) |
| 4:00 PM to 11:59 PM | 0 (0.0%) | 0 (0.0%) |
| Total | 60 (100.0%) | 36 (100.0%) |
Housing Occupancy in Sand Coulee
Occupancy by Ownership in Sand Coulee
Of the total 92 dwellings in Sand Coulee, owner-occupied units account for 74 (80.4%), while renter-occupied units make up 18 (19.6%).
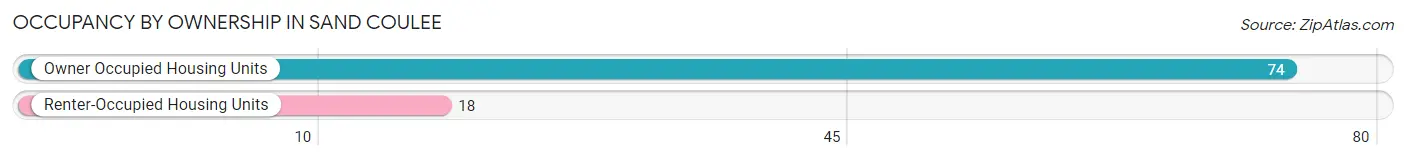
| Occupancy | # Housing Units | % Housing Units |
| Owner Occupied Housing Units | 74 | 80.4% |
| Renter-Occupied Housing Units | 18 | 19.6% |
| Total Occupied Housing Units | 92 | 100.0% |
Occupancy by Household Size in Sand Coulee
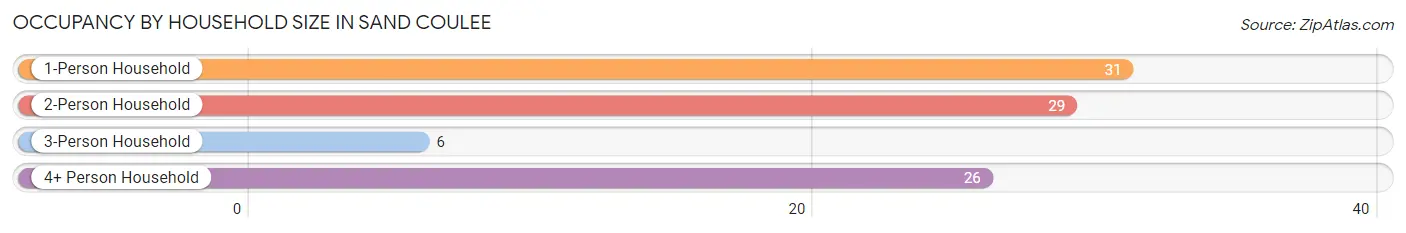
| Household Size | # Housing Units | % Housing Units |
| 1-Person Household | 31 | 33.7% |
| 2-Person Household | 29 | 31.5% |
| 3-Person Household | 6 | 6.5% |
| 4+ Person Household | 26 | 28.3% |
| Total Housing Units | 92 | 100.0% |
Occupancy by Ownership by Household Size in Sand Coulee
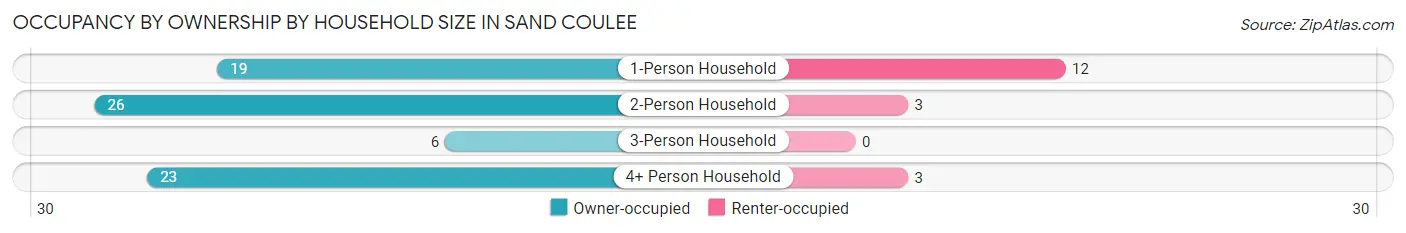
| Household Size | Owner-occupied | Renter-occupied |
| 1-Person Household | 19 (61.3%) | 12 (38.7%) |
| 2-Person Household | 26 (89.7%) | 3 (10.3%) |
| 3-Person Household | 6 (100.0%) | 0 (0.0%) |
| 4+ Person Household | 23 (88.5%) | 3 (11.5%) |
| Total Housing Units | 74 (80.4%) | 18 (19.6%) |
Occupancy by Educational Attainment in Sand Coulee
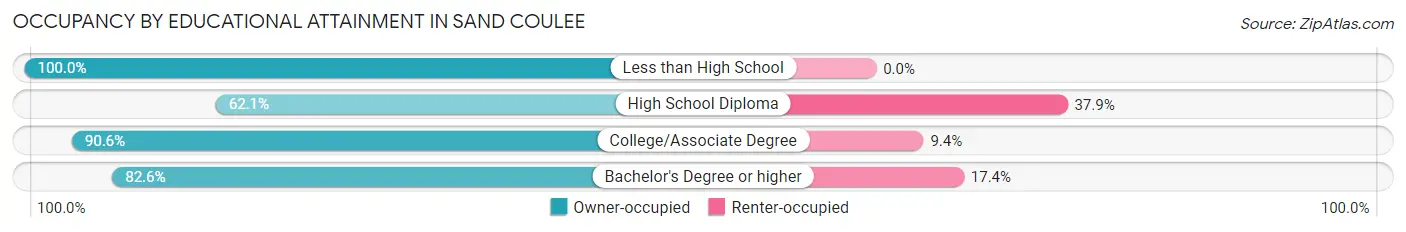
| Household Size | Owner-occupied | Renter-occupied |
| Less than High School | 8 (100.0%) | 0 (0.0%) |
| High School Diploma | 18 (62.1%) | 11 (37.9%) |
| College/Associate Degree | 29 (90.6%) | 3 (9.4%) |
| Bachelor's Degree or higher | 19 (82.6%) | 4 (17.4%) |
Occupancy by Age of Householder in Sand Coulee
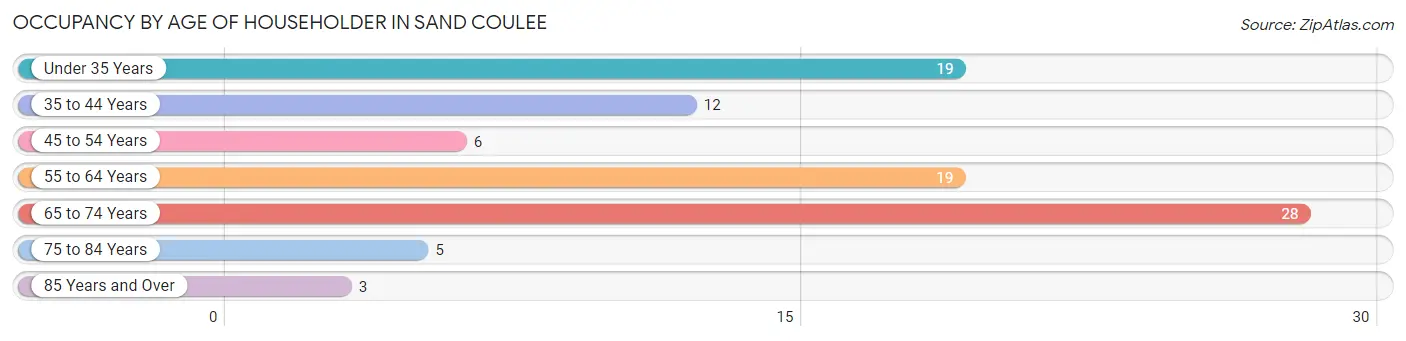
| Age Bracket | # Households | % Households |
| Under 35 Years | 19 | 20.6% |
| 35 to 44 Years | 12 | 13.0% |
| 45 to 54 Years | 6 | 6.5% |
| 55 to 64 Years | 19 | 20.6% |
| 65 to 74 Years | 28 | 30.4% |
| 75 to 84 Years | 5 | 5.4% |
| 85 Years and Over | 3 | 3.3% |
| Total | 92 | 100.0% |
Housing Finances in Sand Coulee
Median Income by Occupancy in Sand Coulee
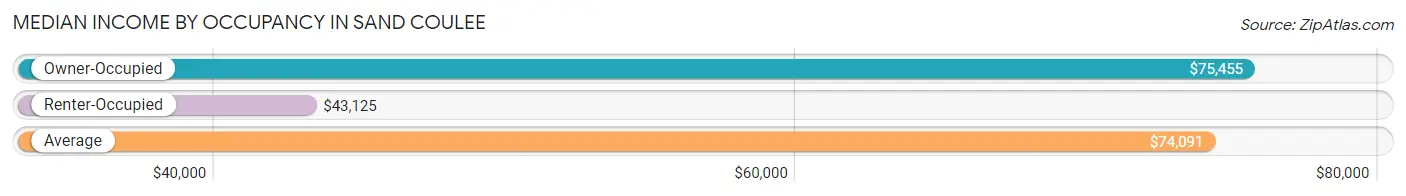
| Occupancy Type | # Households | Median Income |
| Owner-Occupied | 74 (80.4%) | $75,455 |
| Renter-Occupied | 18 (19.6%) | $43,125 |
| Average | 92 (100.0%) | $74,091 |
Occupancy by Householder Income Bracket in Sand Coulee
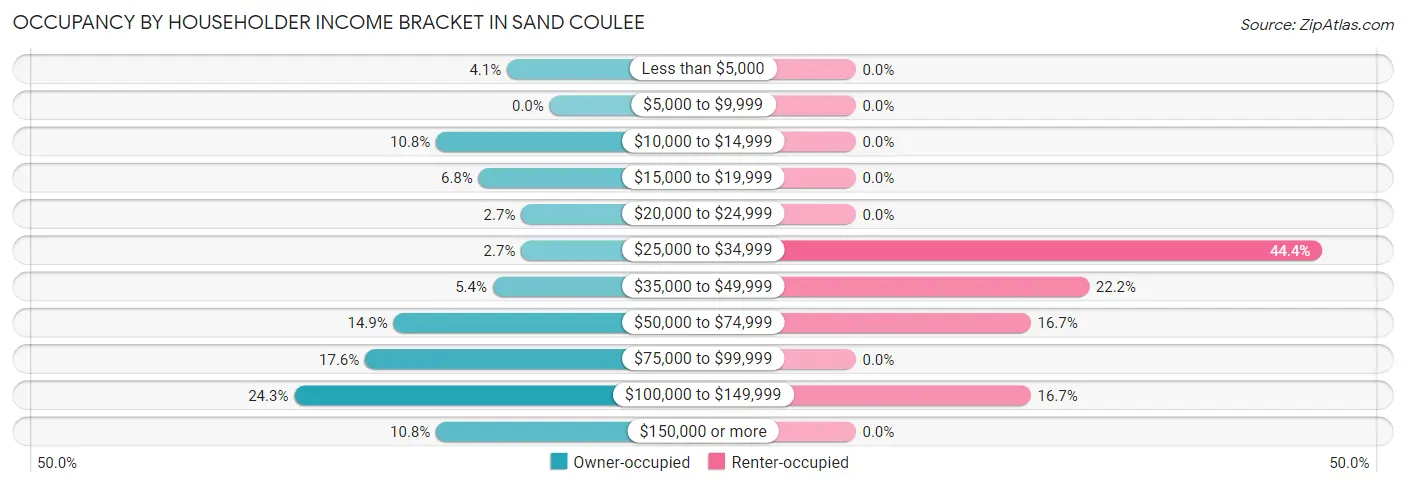
| Income Bracket | Owner-occupied | Renter-occupied |
| Less than $5,000 | 3 (4.1%) | 0 (0.0%) |
| $5,000 to $9,999 | 0 (0.0%) | 0 (0.0%) |
| $10,000 to $14,999 | 8 (10.8%) | 0 (0.0%) |
| $15,000 to $19,999 | 5 (6.8%) | 0 (0.0%) |
| $20,000 to $24,999 | 2 (2.7%) | 0 (0.0%) |
| $25,000 to $34,999 | 2 (2.7%) | 8 (44.4%) |
| $35,000 to $49,999 | 4 (5.4%) | 4 (22.2%) |
| $50,000 to $74,999 | 11 (14.9%) | 3 (16.7%) |
| $75,000 to $99,999 | 13 (17.6%) | 0 (0.0%) |
| $100,000 to $149,999 | 18 (24.3%) | 3 (16.7%) |
| $150,000 or more | 8 (10.8%) | 0 (0.0%) |
| Total | 74 (100.0%) | 18 (100.0%) |
Monthly Housing Cost Tiers in Sand Coulee
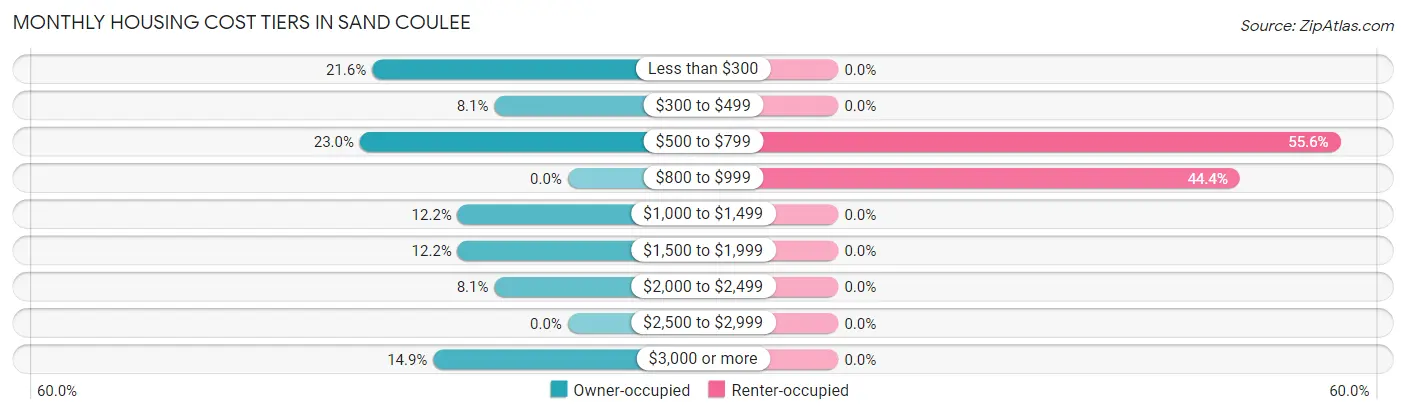
| Monthly Cost | Owner-occupied | Renter-occupied |
| Less than $300 | 16 (21.6%) | 0 (0.0%) |
| $300 to $499 | 6 (8.1%) | 0 (0.0%) |
| $500 to $799 | 17 (23.0%) | 10 (55.6%) |
| $800 to $999 | 0 (0.0%) | 8 (44.4%) |
| $1,000 to $1,499 | 9 (12.2%) | 0 (0.0%) |
| $1,500 to $1,999 | 9 (12.2%) | 0 (0.0%) |
| $2,000 to $2,499 | 6 (8.1%) | 0 (0.0%) |
| $2,500 to $2,999 | 0 (0.0%) | 0 (0.0%) |
| $3,000 or more | 11 (14.9%) | 0 (0.0%) |
| Total | 74 (100.0%) | 18 (100.0%) |
Physical Housing Characteristics in Sand Coulee
Housing Structures in Sand Coulee
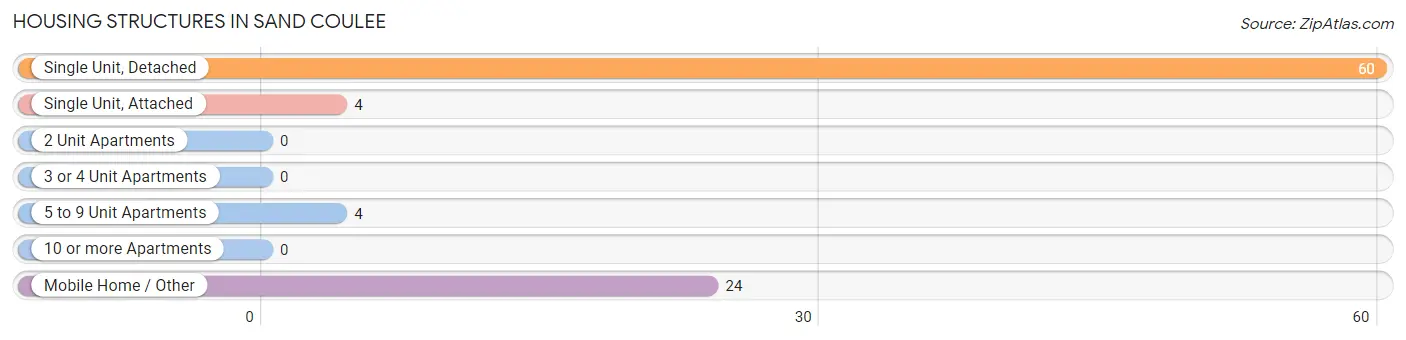
| Structure Type | # Housing Units | % Housing Units |
| Single Unit, Detached | 60 | 65.2% |
| Single Unit, Attached | 4 | 4.3% |
| 2 Unit Apartments | 0 | 0.0% |
| 3 or 4 Unit Apartments | 0 | 0.0% |
| 5 to 9 Unit Apartments | 4 | 4.3% |
| 10 or more Apartments | 0 | 0.0% |
| Mobile Home / Other | 24 | 26.1% |
| Total | 92 | 100.0% |
Housing Structures by Occupancy in Sand Coulee
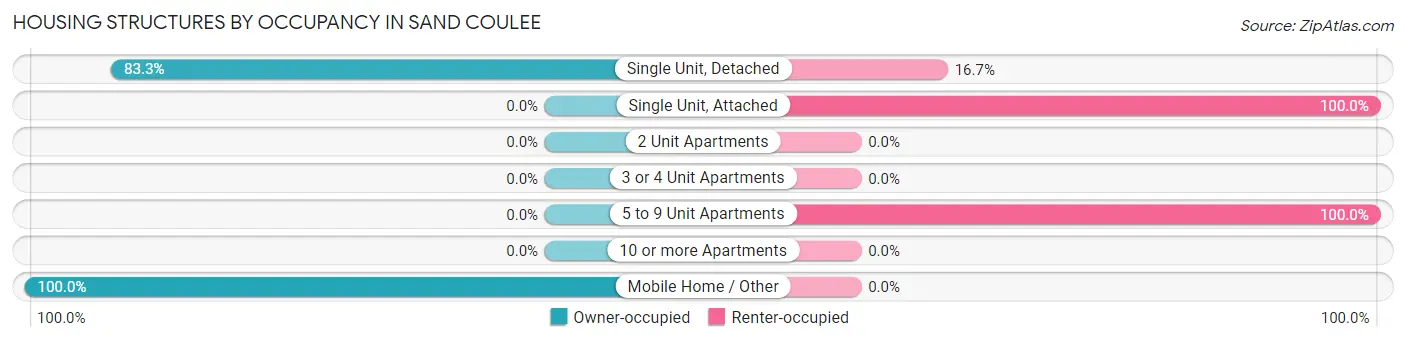
| Structure Type | Owner-occupied | Renter-occupied |
| Single Unit, Detached | 50 (83.3%) | 10 (16.7%) |
| Single Unit, Attached | 0 (0.0%) | 4 (100.0%) |
| 2 Unit Apartments | 0 (0.0%) | 0 (0.0%) |
| 3 or 4 Unit Apartments | 0 (0.0%) | 0 (0.0%) |
| 5 to 9 Unit Apartments | 0 (0.0%) | 4 (100.0%) |
| 10 or more Apartments | 0 (0.0%) | 0 (0.0%) |
| Mobile Home / Other | 24 (100.0%) | 0 (0.0%) |
| Total | 74 (80.4%) | 18 (19.6%) |
Housing Structures by Number of Rooms in Sand Coulee
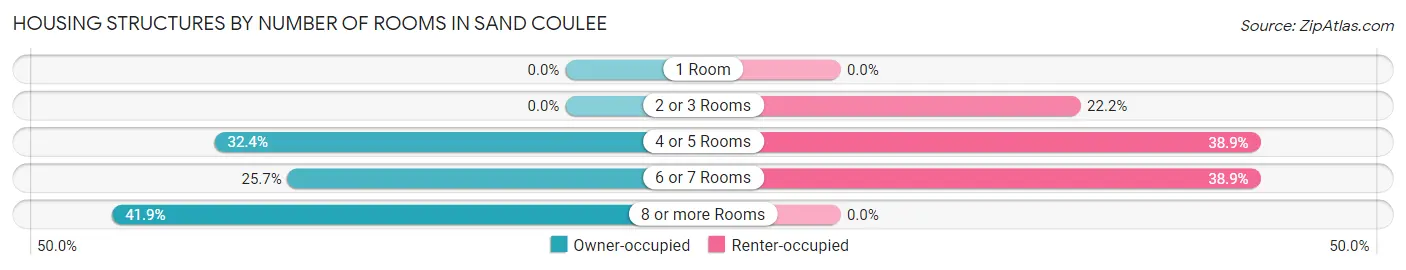
| Number of Rooms | Owner-occupied | Renter-occupied |
| 1 Room | 0 (0.0%) | 0 (0.0%) |
| 2 or 3 Rooms | 0 (0.0%) | 4 (22.2%) |
| 4 or 5 Rooms | 24 (32.4%) | 7 (38.9%) |
| 6 or 7 Rooms | 19 (25.7%) | 7 (38.9%) |
| 8 or more Rooms | 31 (41.9%) | 0 (0.0%) |
| Total | 74 (100.0%) | 18 (100.0%) |
Housing Structure by Heating Type in Sand Coulee
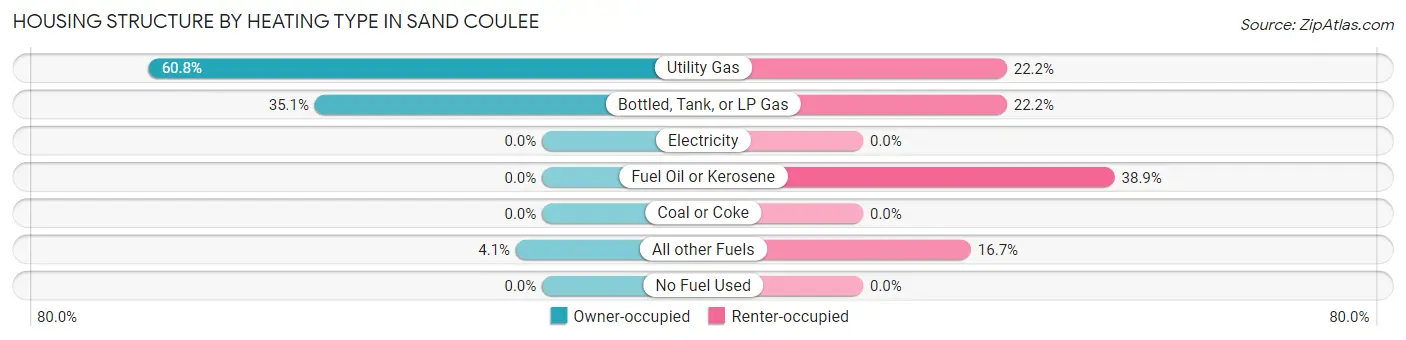
| Heating Type | Owner-occupied | Renter-occupied |
| Utility Gas | 45 (60.8%) | 4 (22.2%) |
| Bottled, Tank, or LP Gas | 26 (35.1%) | 4 (22.2%) |
| Electricity | 0 (0.0%) | 0 (0.0%) |
| Fuel Oil or Kerosene | 0 (0.0%) | 7 (38.9%) |
| Coal or Coke | 0 (0.0%) | 0 (0.0%) |
| All other Fuels | 3 (4.1%) | 3 (16.7%) |
| No Fuel Used | 0 (0.0%) | 0 (0.0%) |
| Total | 74 (100.0%) | 18 (100.0%) |
Household Vehicle Usage in Sand Coulee
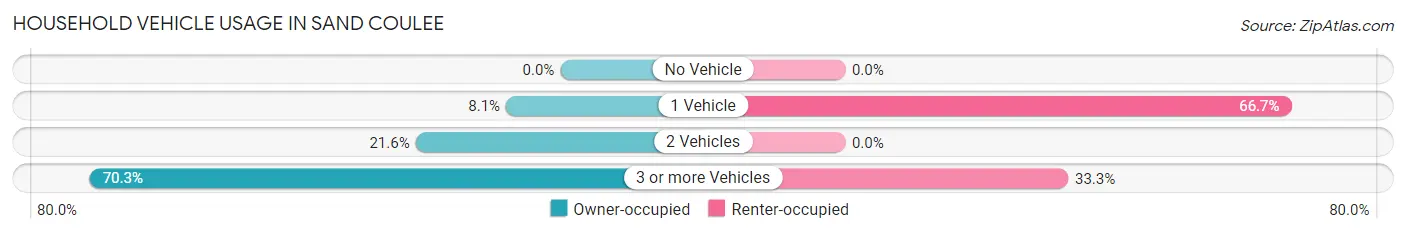
| Vehicles per Household | Owner-occupied | Renter-occupied |
| No Vehicle | 0 (0.0%) | 0 (0.0%) |
| 1 Vehicle | 6 (8.1%) | 12 (66.7%) |
| 2 Vehicles | 16 (21.6%) | 0 (0.0%) |
| 3 or more Vehicles | 52 (70.3%) | 6 (33.3%) |
| Total | 74 (100.0%) | 18 (100.0%) |
Real Estate & Mortgages in Sand Coulee
Real Estate and Mortgage Overview in Sand Coulee
| Characteristic | Without Mortgage | With Mortgage |
| Housing Units | 37 | 37 |
| Median Property Value | $162,500 | $270,500 |
| Median Household Income | - | - |
| Monthly Housing Costs | $442 | $11 |
| Real Estate Taxes | - | - |
Property Value by Mortgage Status in Sand Coulee
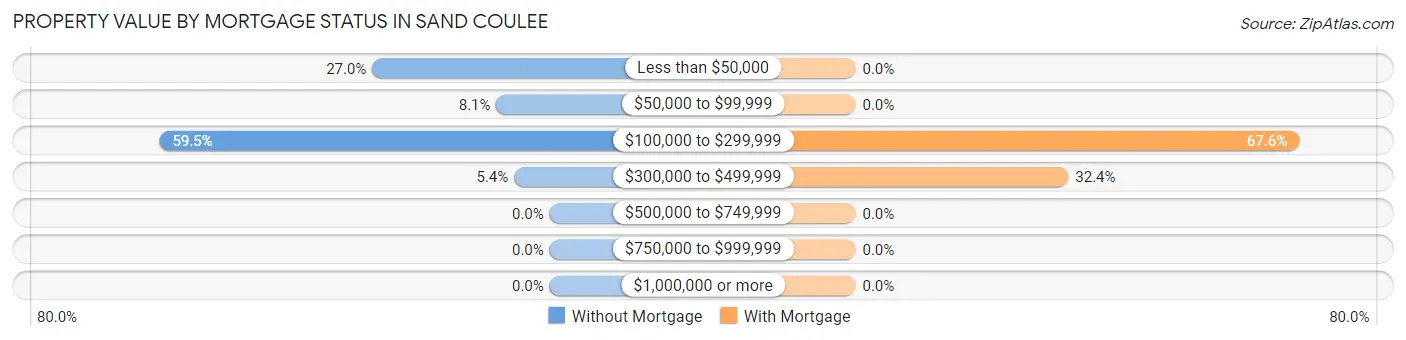
| Property Value | Without Mortgage | With Mortgage |
| Less than $50,000 | 10 (27.0%) | 0 (0.0%) |
| $50,000 to $99,999 | 3 (8.1%) | 0 (0.0%) |
| $100,000 to $299,999 | 22 (59.5%) | 25 (67.6%) |
| $300,000 to $499,999 | 2 (5.4%) | 12 (32.4%) |
| $500,000 to $749,999 | 0 (0.0%) | 0 (0.0%) |
| $750,000 to $999,999 | 0 (0.0%) | 0 (0.0%) |
| $1,000,000 or more | 0 (0.0%) | 0 (0.0%) |
| Total | 37 (100.0%) | 37 (100.0%) |
Household Income by Mortgage Status in Sand Coulee
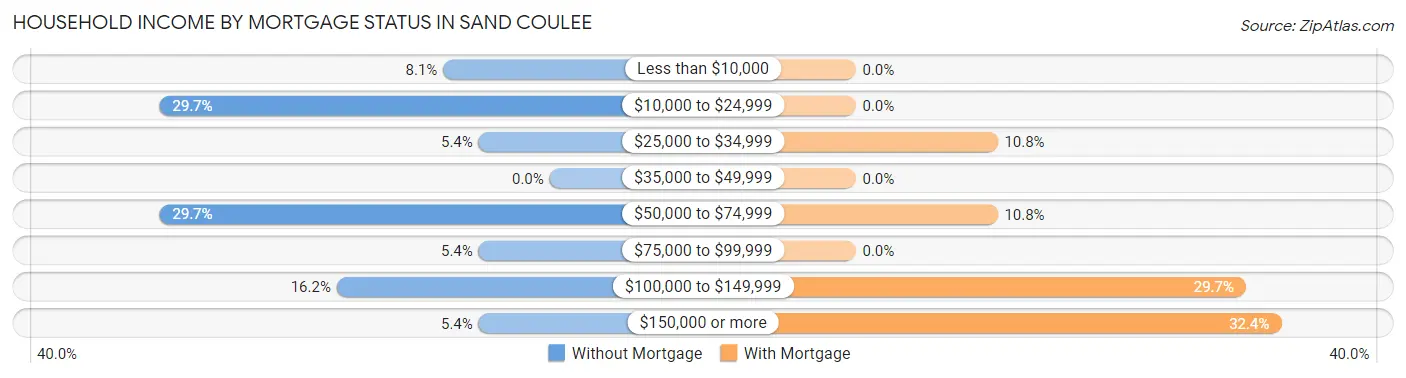
| Household Income | Without Mortgage | With Mortgage |
| Less than $10,000 | 3 (8.1%) | 0 (0.0%) |
| $10,000 to $24,999 | 11 (29.7%) | 0 (0.0%) |
| $25,000 to $34,999 | 2 (5.4%) | 4 (10.8%) |
| $35,000 to $49,999 | 0 (0.0%) | 0 (0.0%) |
| $50,000 to $74,999 | 11 (29.7%) | 4 (10.8%) |
| $75,000 to $99,999 | 2 (5.4%) | 0 (0.0%) |
| $100,000 to $149,999 | 6 (16.2%) | 11 (29.7%) |
| $150,000 or more | 2 (5.4%) | 12 (32.4%) |
| Total | 37 (100.0%) | 37 (100.0%) |
Property Value to Household Income Ratio in Sand Coulee
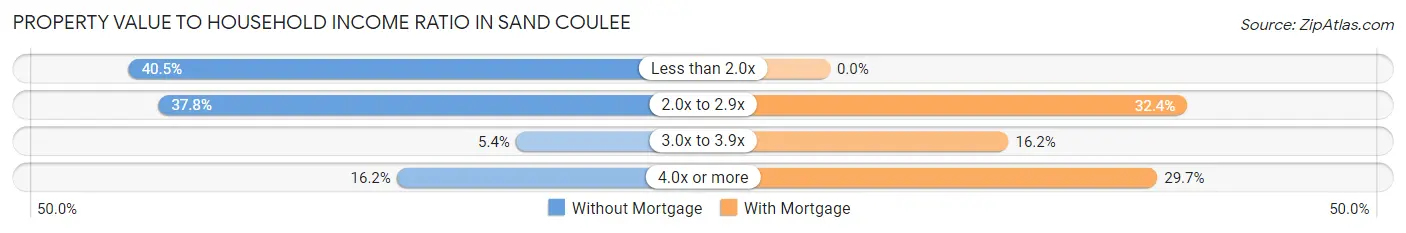
| Value-to-Income Ratio | Without Mortgage | With Mortgage |
| Less than 2.0x | 15 (40.5%) | 0 (0.0%) |
| 2.0x to 2.9x | 14 (37.8%) | 12 (32.4%) |
| 3.0x to 3.9x | 2 (5.4%) | 6 (16.2%) |
| 4.0x or more | 6 (16.2%) | 11 (29.7%) |
| Total | 37 (100.0%) | 37 (100.0%) |
Real Estate Taxes by Mortgage Status in Sand Coulee
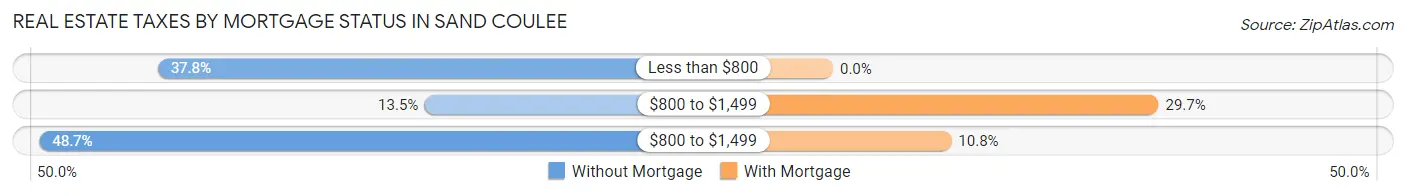
| Property Taxes | Without Mortgage | With Mortgage |
| Less than $800 | 14 (37.8%) | 0 (0.0%) |
| $800 to $1,499 | 5 (13.5%) | 11 (29.7%) |
| $800 to $1,499 | 18 (48.6%) | 4 (10.8%) |
| Total | 37 (100.0%) | 37 (100.0%) |
Health & Disability in Sand Coulee
Health Insurance Coverage by Age in Sand Coulee
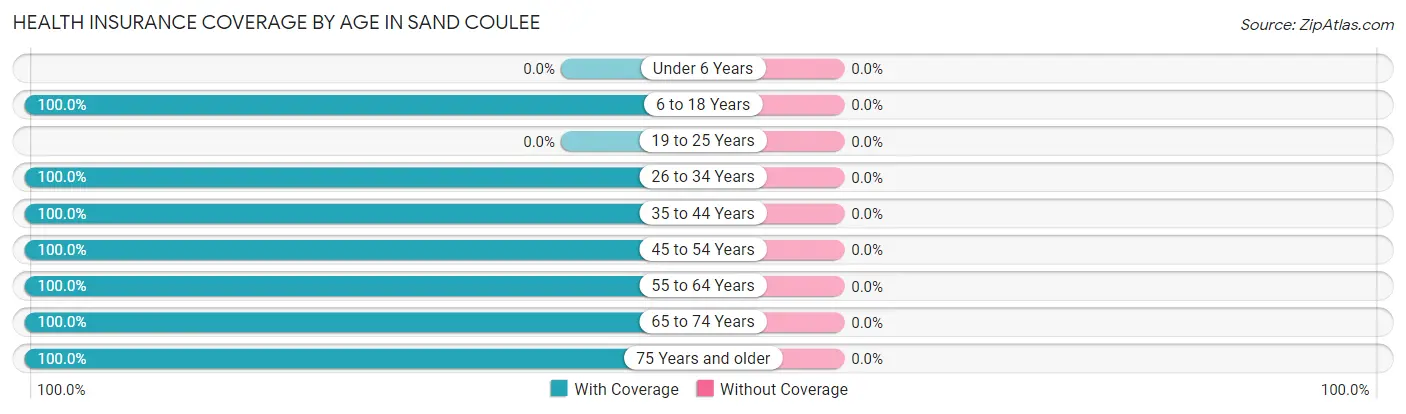
| Age Bracket | With Coverage | Without Coverage |
| Under 6 Years | 0 (0.0%) | 0 (0.0%) |
| 6 to 18 Years | 36 (100.0%) | 0 (0.0%) |
| 19 to 25 Years | 0 (0.0%) | 0 (0.0%) |
| 26 to 34 Years | 33 (100.0%) | 0 (0.0%) |
| 35 to 44 Years | 44 (100.0%) | 0 (0.0%) |
| 45 to 54 Years | 18 (100.0%) | 0 (0.0%) |
| 55 to 64 Years | 33 (100.0%) | 0 (0.0%) |
| 65 to 74 Years | 45 (100.0%) | 0 (0.0%) |
| 75 Years and older | 10 (100.0%) | 0 (0.0%) |
| Total | 219 (100.0%) | 0 (0.0%) |
Health Insurance Coverage by Citizenship Status in Sand Coulee
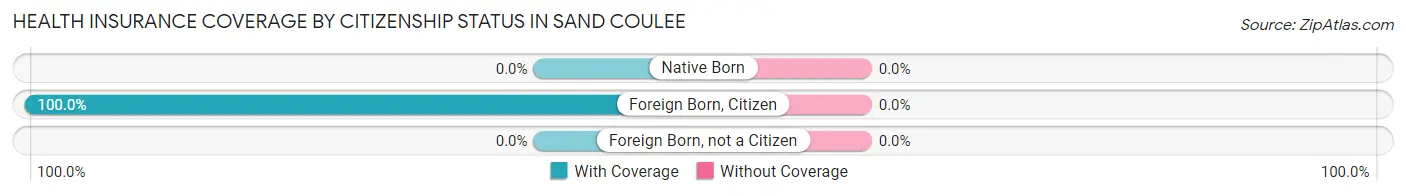
| Citizenship Status | With Coverage | Without Coverage |
| Native Born | 0 (0.0%) | 0 (0.0%) |
| Foreign Born, Citizen | 36 (100.0%) | 0 (0.0%) |
| Foreign Born, not a Citizen | 0 (0.0%) | 0 (0.0%) |
Health Insurance Coverage by Household Income in Sand Coulee
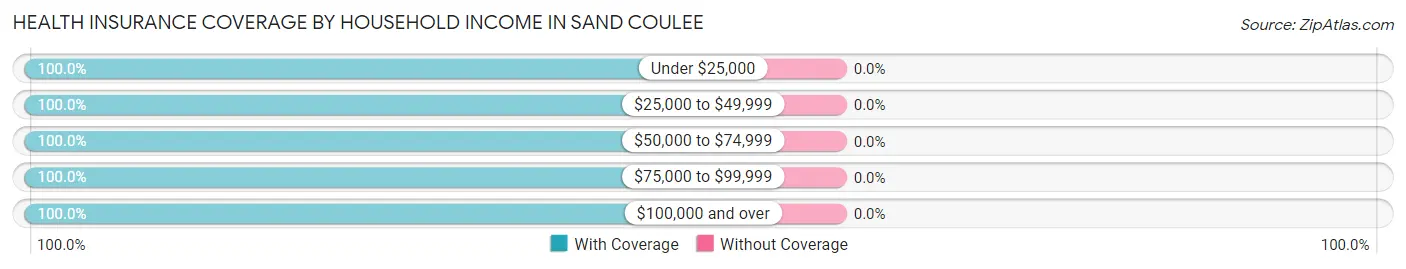
| Household Income | With Coverage | Without Coverage |
| Under $25,000 | 24 (100.0%) | 0 (0.0%) |
| $25,000 to $49,999 | 14 (100.0%) | 0 (0.0%) |
| $50,000 to $74,999 | 62 (100.0%) | 0 (0.0%) |
| $75,000 to $99,999 | 25 (100.0%) | 0 (0.0%) |
| $100,000 and over | 94 (100.0%) | 0 (0.0%) |
Public vs Private Health Insurance Coverage by Age in Sand Coulee
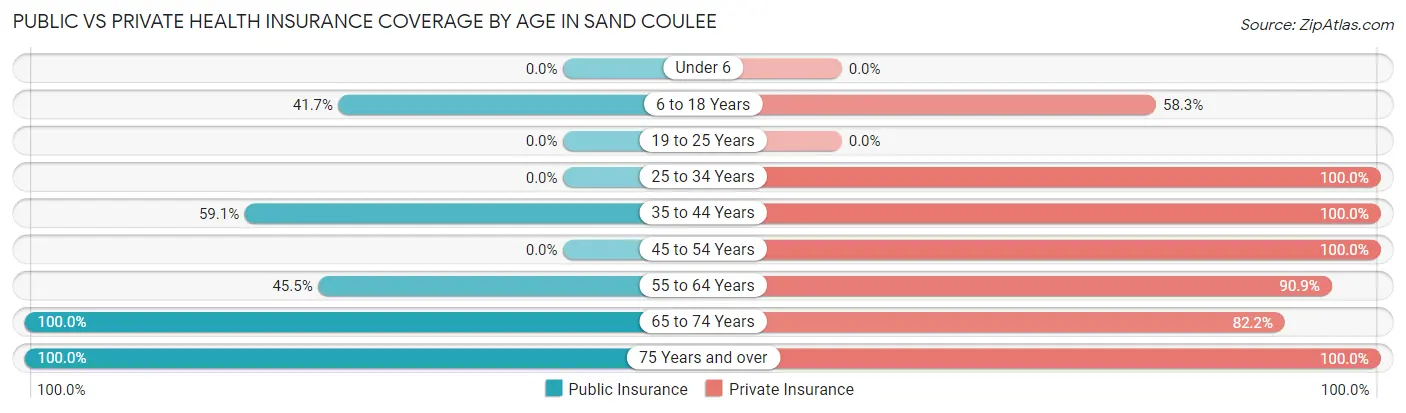
| Age Bracket | Public Insurance | Private Insurance |
| Under 6 | 0 (0.0%) | 0 (0.0%) |
| 6 to 18 Years | 15 (41.7%) | 21 (58.3%) |
| 19 to 25 Years | 0 (0.0%) | 0 (0.0%) |
| 25 to 34 Years | 0 (0.0%) | 33 (100.0%) |
| 35 to 44 Years | 26 (59.1%) | 44 (100.0%) |
| 45 to 54 Years | 0 (0.0%) | 18 (100.0%) |
| 55 to 64 Years | 15 (45.5%) | 30 (90.9%) |
| 65 to 74 Years | 45 (100.0%) | 37 (82.2%) |
| 75 Years and over | 10 (100.0%) | 10 (100.0%) |
| Total | 111 (50.7%) | 193 (88.1%) |
Disability Status by Sex by Age in Sand Coulee
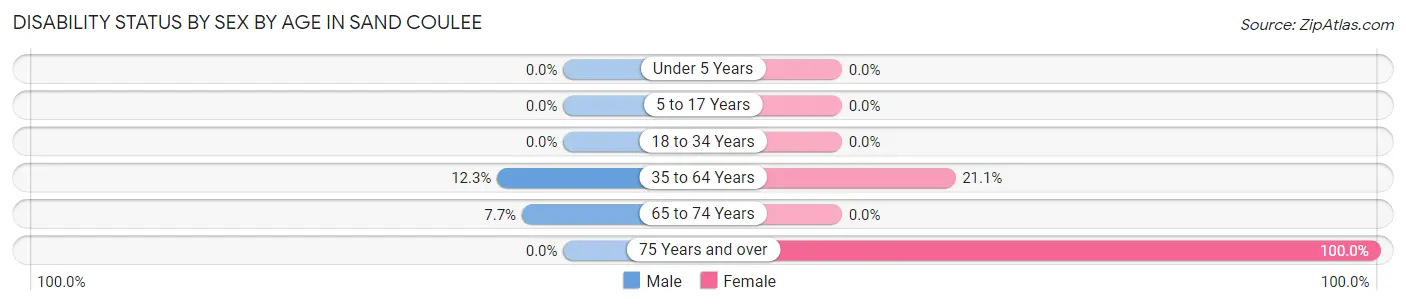
| Age Bracket | Male | Female |
| Under 5 Years | 0 (0.0%) | 0 (0.0%) |
| 5 to 17 Years | 0 (0.0%) | 0 (0.0%) |
| 18 to 34 Years | 0 (0.0%) | 0 (0.0%) |
| 35 to 64 Years | 7 (12.3%) | 8 (21.0%) |
| 65 to 74 Years | 2 (7.7%) | 0 (0.0%) |
| 75 Years and over | 0 (0.0%) | 3 (100.0%) |
Disability Class by Sex by Age in Sand Coulee
Disability Class: Hearing Difficulty
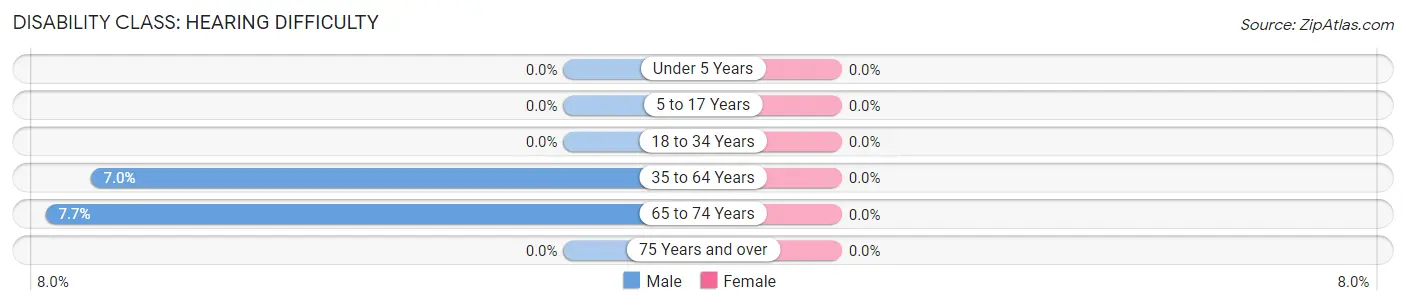
| Age Bracket | Male | Female |
| Under 5 Years | 0 (0.0%) | 0 (0.0%) |
| 5 to 17 Years | 0 (0.0%) | 0 (0.0%) |
| 18 to 34 Years | 0 (0.0%) | 0 (0.0%) |
| 35 to 64 Years | 4 (7.0%) | 0 (0.0%) |
| 65 to 74 Years | 2 (7.7%) | 0 (0.0%) |
| 75 Years and over | 0 (0.0%) | 0 (0.0%) |
Disability Class: Vision Difficulty
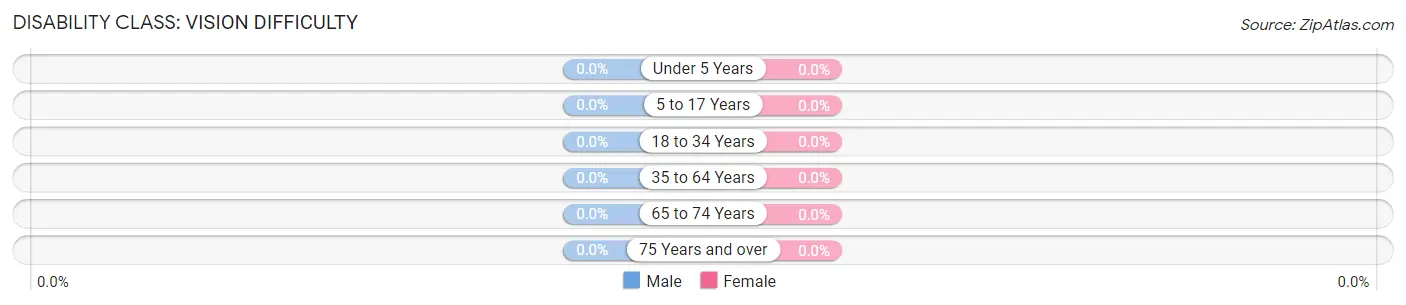
| Age Bracket | Male | Female |
| Under 5 Years | 0 (0.0%) | 0 (0.0%) |
| 5 to 17 Years | 0 (0.0%) | 0 (0.0%) |
| 18 to 34 Years | 0 (0.0%) | 0 (0.0%) |
| 35 to 64 Years | 0 (0.0%) | 0 (0.0%) |
| 65 to 74 Years | 0 (0.0%) | 0 (0.0%) |
| 75 Years and over | 0 (0.0%) | 0 (0.0%) |
Disability Class: Cognitive Difficulty
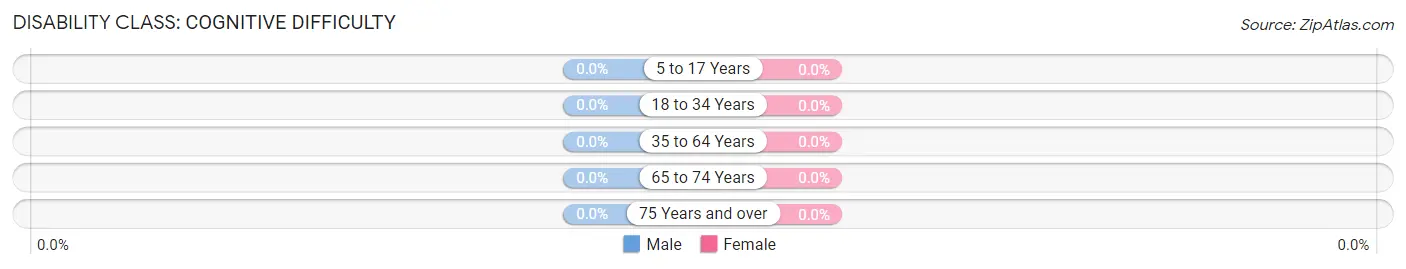
| Age Bracket | Male | Female |
| 5 to 17 Years | 0 (0.0%) | 0 (0.0%) |
| 18 to 34 Years | 0 (0.0%) | 0 (0.0%) |
| 35 to 64 Years | 0 (0.0%) | 0 (0.0%) |
| 65 to 74 Years | 0 (0.0%) | 0 (0.0%) |
| 75 Years and over | 0 (0.0%) | 0 (0.0%) |
Disability Class: Ambulatory Difficulty
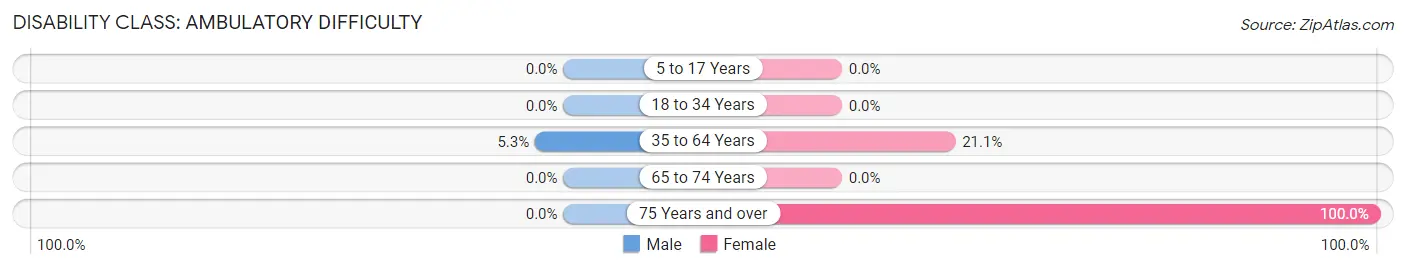
| Age Bracket | Male | Female |
| 5 to 17 Years | 0 (0.0%) | 0 (0.0%) |
| 18 to 34 Years | 0 (0.0%) | 0 (0.0%) |
| 35 to 64 Years | 3 (5.3%) | 8 (21.0%) |
| 65 to 74 Years | 0 (0.0%) | 0 (0.0%) |
| 75 Years and over | 0 (0.0%) | 3 (100.0%) |
Disability Class: Self-Care Difficulty
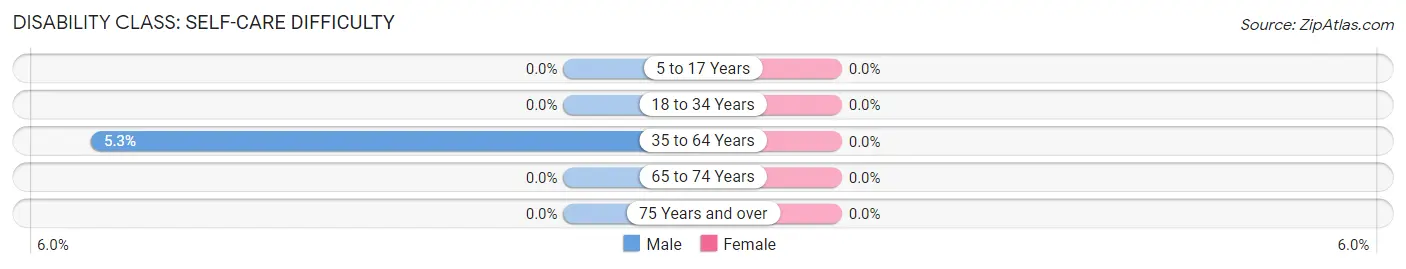
| Age Bracket | Male | Female |
| 5 to 17 Years | 0 (0.0%) | 0 (0.0%) |
| 18 to 34 Years | 0 (0.0%) | 0 (0.0%) |
| 35 to 64 Years | 3 (5.3%) | 0 (0.0%) |
| 65 to 74 Years | 0 (0.0%) | 0 (0.0%) |
| 75 Years and over | 0 (0.0%) | 0 (0.0%) |
Technology Access in Sand Coulee
Computing Device Access in Sand Coulee
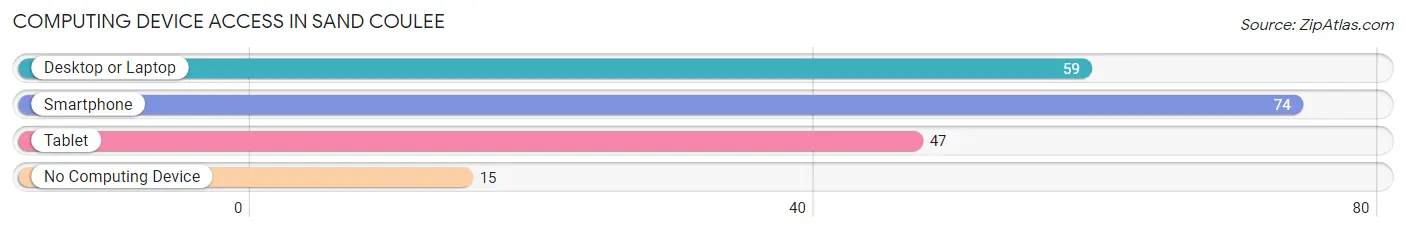
| Device Type | # Households | % Households |
| Desktop or Laptop | 59 | 64.1% |
| Smartphone | 74 | 80.4% |
| Tablet | 47 | 51.1% |
| No Computing Device | 15 | 16.3% |
| Total | 92 | 100.0% |
Internet Access in Sand Coulee
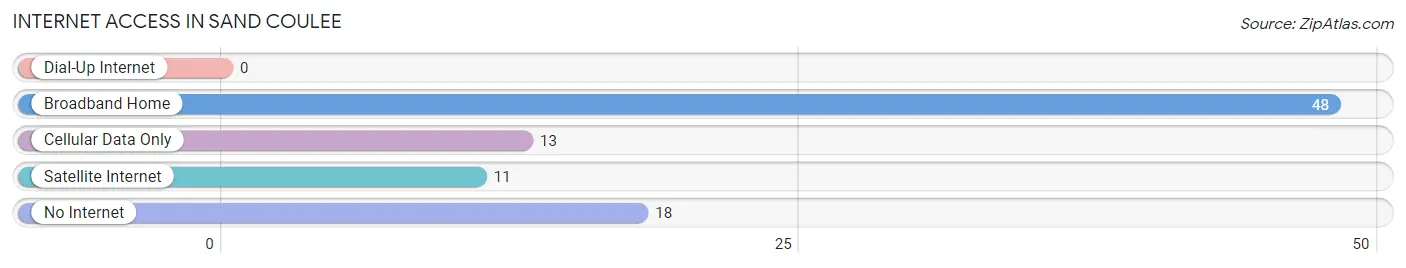
| Internet Type | # Households | % Households |
| Dial-Up Internet | 0 | 0.0% |
| Broadband Home | 48 | 52.2% |
| Cellular Data Only | 13 | 14.1% |
| Satellite Internet | 11 | 12.0% |
| No Internet | 18 | 19.6% |
| Total | 92 | 100.0% |
Sand Coulee Summary
Sand Coulee is a small unincorporated community located in Cascade County, Montana, United States. It is situated along the Missouri River, approximately 10 miles south of Great Falls. The population of Sand Coulee was estimated to be around 500 in 2020.
History
The area that is now Sand Coulee was first settled in the late 1800s by homesteaders. The town was originally known as "Sand Coulee Station" and was a stop on the Great Northern Railway. The town was officially incorporated in 1909 and the name was changed to Sand Coulee.
The town was a major agricultural center in the early 1900s, with many farms and ranches in the area. The town also had a number of businesses, including a general store, a hotel, a blacksmith shop, and a saloon.
In the 1920s, the town began to decline as the Great Northern Railway stopped running through the area. The town was eventually abandoned in the 1940s.
Geography
Sand Coulee is located in Cascade County, Montana, approximately 10 miles south of Great Falls. The town is situated along the Missouri River and is surrounded by rolling hills and prairies. The area is known for its wide open spaces and beautiful scenery.
The climate in Sand Coulee is semi-arid, with hot summers and cold winters. The average annual temperature is around 50°F (10°C). The average annual precipitation is around 12 inches (30 cm).
Economy
The economy of Sand Coulee is largely based on agriculture. The town is home to several farms and ranches, which produce a variety of crops and livestock. The town also has a few small businesses, including a general store and a gas station.
Demographics
The population of Sand Coulee was estimated to be around 500 in 2020. The town is predominantly white, with a small Hispanic population. The median household income is around $45,000. The town has a high rate of poverty, with around 25% of the population living below the poverty line.
Common Questions
What is Per Capita Income in Sand Coulee?
Per Capita income in Sand Coulee is $33,114.
What is the Median Family Income in Sand Coulee?
Median Family Income in Sand Coulee is $84,375.
What is the Median Household income in Sand Coulee?
Median Household Income in Sand Coulee is $74,091.
What is Income or Wage Gap in Sand Coulee?
Income or Wage Gap in Sand Coulee is 33.6%.
Women in Sand Coulee earn 66.4 cents for every dollar earned by a man.
What is Inequality or Gini Index in Sand Coulee?
Inequality or Gini Index in Sand Coulee is 0.39.
What is the Total Population of Sand Coulee?
Total Population of Sand Coulee is 223.
What is the Total Male Population of Sand Coulee?
Total Male Population of Sand Coulee is 130.
What is the Total Female Population of Sand Coulee?
Total Female Population of Sand Coulee is 93.
What is the Ratio of Males per 100 Females in Sand Coulee?
There are 139.78 Males per 100 Females in Sand Coulee.
What is the Ratio of Females per 100 Males in Sand Coulee?
There are 71.54 Females per 100 Males in Sand Coulee.
What is the Median Population Age in Sand Coulee?
Median Population Age in Sand Coulee is 43.9 Years.
What is the Average Family Size in Sand Coulee
Average Family Size in Sand Coulee is 3.1 People.
What is the Average Household Size in Sand Coulee
Average Household Size in Sand Coulee is 2.4 People.
How Large is the Labor Force in Sand Coulee?
There are 111 People in the Labor Forcein in Sand Coulee.
What is the Percentage of People in the Labor Force in Sand Coulee?
55.8% of People are in the Labor Force in Sand Coulee.
What is the Unemployment Rate in Sand Coulee?
Unemployment Rate in Sand Coulee is 12.1%.