Roundup, MT Map & Demographics
Roundup Map
Roundup Overview
$34,520
PER CAPITA INCOME
$63,456
AVG FAMILY INCOME
$54,167
AVG HOUSEHOLD INCOME
25.6%
WAGE / INCOME GAP [ % ]
74.4¢/ $1
WAGE / INCOME GAP [ $ ]
0.51
INEQUALITY / GINI INDEX
1,824
TOTAL POPULATION
921
MALE POPULATION
903
FEMALE POPULATION
101.99
MALES / 100 FEMALES
98.05
FEMALES / 100 MALES
46.6
MEDIAN AGE
2.9
AVG FAMILY SIZE
2.1
AVG HOUSEHOLD SIZE
823
LABOR FORCE [ PEOPLE ]
54.3%
PERCENT IN LABOR FORCE
3.8%
UNEMPLOYMENT RATE
Roundup Zip Codes
Roundup Area Codes
Income in Roundup
Income Overview in Roundup
Per Capita Income in Roundup is $34,520, while median incomes of families and households are $63,456 and $54,167 respectively.
| Characteristic | Number | Measure |
| Per Capita Income | 1,824 | $34,520 |
| Median Family Income | 402 | $63,456 |
| Mean Family Income | 402 | $67,789 |
| Median Household Income | 842 | $54,167 |
| Mean Household Income | 842 | $74,296 |
| Income Deficit | 402 | $0 |
| Wage / Income Gap (%) | 1,824 | 25.60% |
| Wage / Income Gap ($) | 1,824 | 74.40¢ per $1 |
| Gini / Inequality Index | 1,824 | 0.51 |
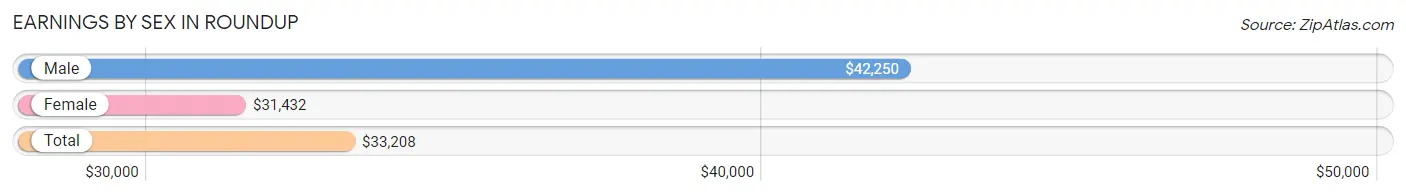
Earnings by Sex in Roundup
Average Earnings in Roundup are $33,208, $42,250 for men and $31,432 for women, a difference of 25.6%.
| Sex | Number | Average Earnings |
| Male | 430 (51.4%) | $42,250 |
| Female | 407 (48.6%) | $31,432 |
| Total | 837 (100.0%) | $33,208 |
Earnings by Sex by Income Bracket in Roundup
The most common earnings brackets in Roundup are $45,000 to $49,999 for men (78 | 18.1%) and $35,000 to $39,999 for women (88 | 21.6%).
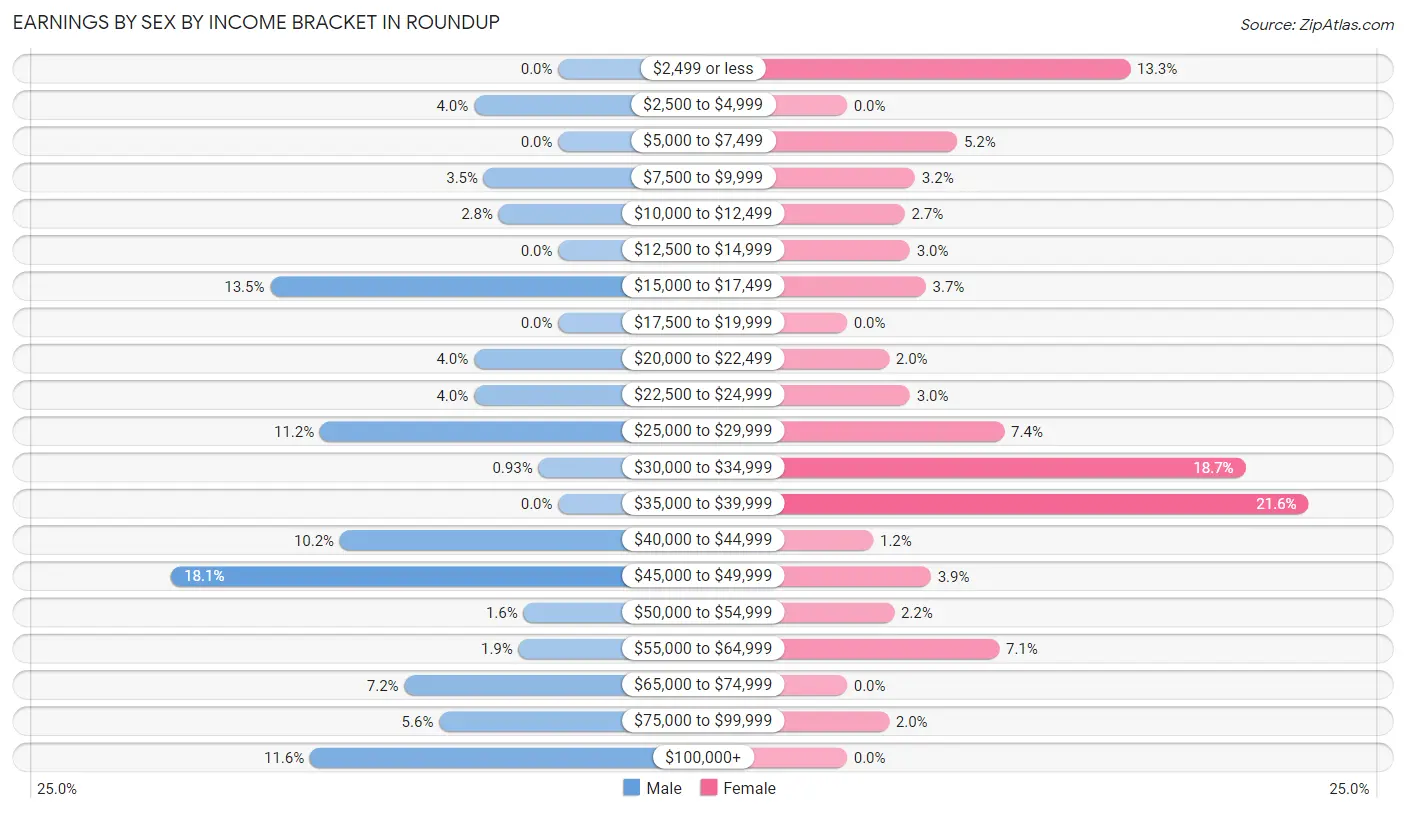
| Income | Male | Female |
| $2,499 or less | 0 (0.0%) | 54 (13.3%) |
| $2,500 to $4,999 | 17 (4.0%) | 0 (0.0%) |
| $5,000 to $7,499 | 0 (0.0%) | 21 (5.2%) |
| $7,500 to $9,999 | 15 (3.5%) | 13 (3.2%) |
| $10,000 to $12,499 | 12 (2.8%) | 11 (2.7%) |
| $12,500 to $14,999 | 0 (0.0%) | 12 (2.9%) |
| $15,000 to $17,499 | 58 (13.5%) | 15 (3.7%) |
| $17,500 to $19,999 | 0 (0.0%) | 0 (0.0%) |
| $20,000 to $22,499 | 17 (4.0%) | 8 (2.0%) |
| $22,500 to $24,999 | 17 (4.0%) | 12 (2.9%) |
| $25,000 to $29,999 | 48 (11.2%) | 30 (7.4%) |
| $30,000 to $34,999 | 4 (0.9%) | 76 (18.7%) |
| $35,000 to $39,999 | 0 (0.0%) | 88 (21.6%) |
| $40,000 to $44,999 | 44 (10.2%) | 5 (1.2%) |
| $45,000 to $49,999 | 78 (18.1%) | 16 (3.9%) |
| $50,000 to $54,999 | 7 (1.6%) | 9 (2.2%) |
| $55,000 to $64,999 | 8 (1.9%) | 29 (7.1%) |
| $65,000 to $74,999 | 31 (7.2%) | 0 (0.0%) |
| $75,000 to $99,999 | 24 (5.6%) | 8 (2.0%) |
| $100,000+ | 50 (11.6%) | 0 (0.0%) |
| Total | 430 (100.0%) | 407 (100.0%) |
Earnings by Sex by Educational Attainment in Roundup
Average earnings in Roundup are $45,739 for men and $31,250 for women, a difference of 31.7%. Men with an educational attainment of college or associate's degree enjoy the highest average annual earnings of $46,522, while those with less than high school education earn the least with $29,688. Women with an educational attainment of bachelor's degree earn the most with the average annual earnings of $38,942, while those with college or associate's degree education have the smallest earnings of $30,952.
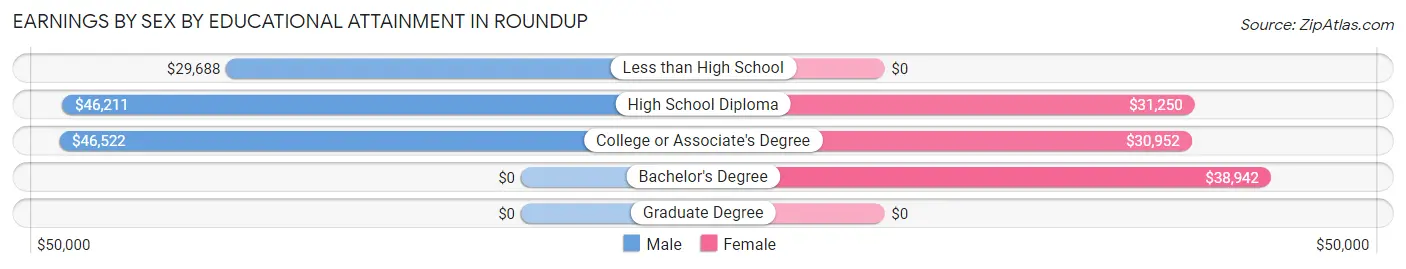
| Educational Attainment | Male Income | Female Income |
| Less than High School | $29,688 | $0 |
| High School Diploma | $46,211 | $31,250 |
| College or Associate's Degree | $46,522 | $30,952 |
| Bachelor's Degree | - | - |
| Graduate Degree | - | - |
| Total | $45,739 | $31,250 |
Family Income in Roundup
Family Income Brackets in Roundup
According to the Roundup family income data, there are 152 families falling into the $50,000 to $74,999 income range, which is the most common income bracket and makes up 37.8% of all families.
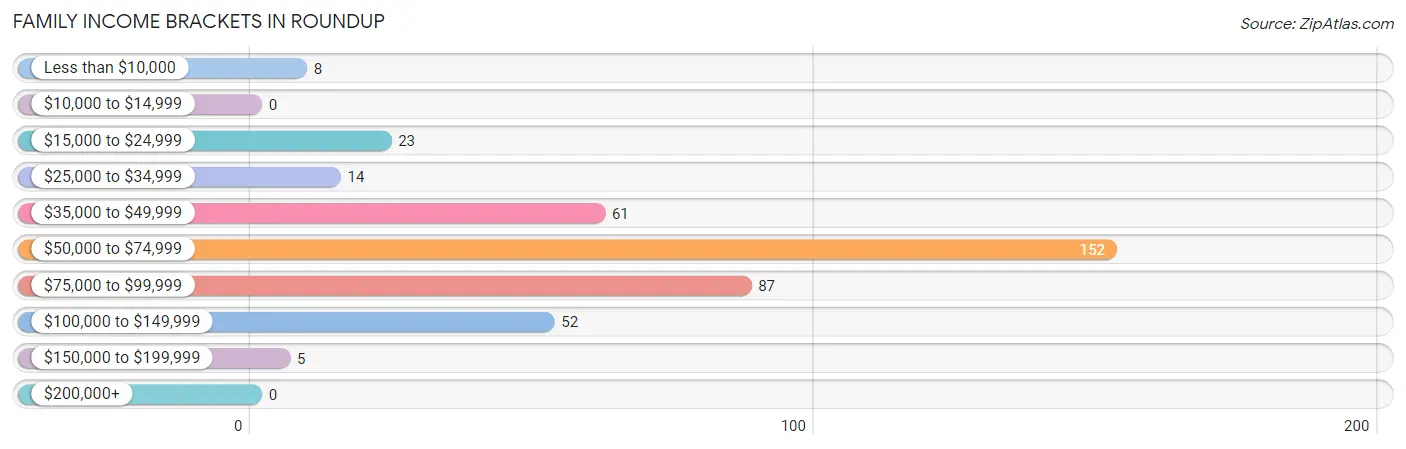
| Income Bracket | # Families | % Families |
| Less than $10,000 | 8 | 2.0% |
| $10,000 to $14,999 | 0 | 0.0% |
| $15,000 to $24,999 | 23 | 5.7% |
| $25,000 to $34,999 | 14 | 3.5% |
| $35,000 to $49,999 | 61 | 15.2% |
| $50,000 to $74,999 | 152 | 37.8% |
| $75,000 to $99,999 | 87 | 21.6% |
| $100,000 to $149,999 | 52 | 12.9% |
| $150,000 to $199,999 | 5 | 1.2% |
| $200,000+ | 0 | 0.0% |
Family Income by Famaliy Size in Roundup
4-person families (67 | 16.7%) account for the highest median family income in Roundup with $75,069 per family, while 2-person families (238 | 59.2%) have the highest median income of $28,970 per family member.
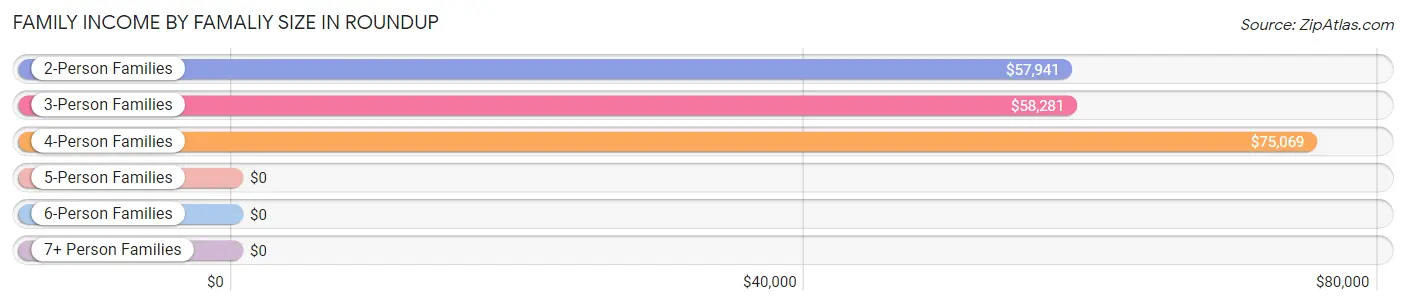
| Income Bracket | # Families | Median Income |
| 2-Person Families | 238 (59.2%) | $57,941 |
| 3-Person Families | 77 (19.2%) | $58,281 |
| 4-Person Families | 67 (16.7%) | $75,069 |
| 5-Person Families | 9 (2.2%) | $0 |
| 6-Person Families | 6 (1.5%) | $0 |
| 7+ Person Families | 5 (1.2%) | $0 |
| Total | 402 (100.0%) | $63,456 |
Family Income by Number of Earners in Roundup
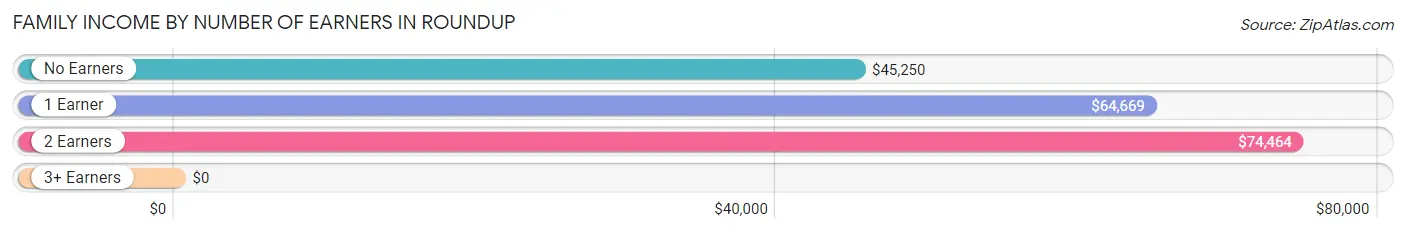
| Number of Earners | # Families | Median Income |
| No Earners | 77 (19.2%) | $45,250 |
| 1 Earner | 141 (35.1%) | $64,669 |
| 2 Earners | 171 (42.5%) | $74,464 |
| 3+ Earners | 13 (3.2%) | $0 |
| Total | 402 (100.0%) | $63,456 |
Household Income in Roundup
Household Income Brackets in Roundup
With 197 households falling in the category, the $15,000 to $24,999 income range is the most frequent in Roundup, accounting for 23.4% of all households. In contrast, only 5 households (0.6%) fall into the $150,000 to $199,999 income bracket, making it the least populous group.
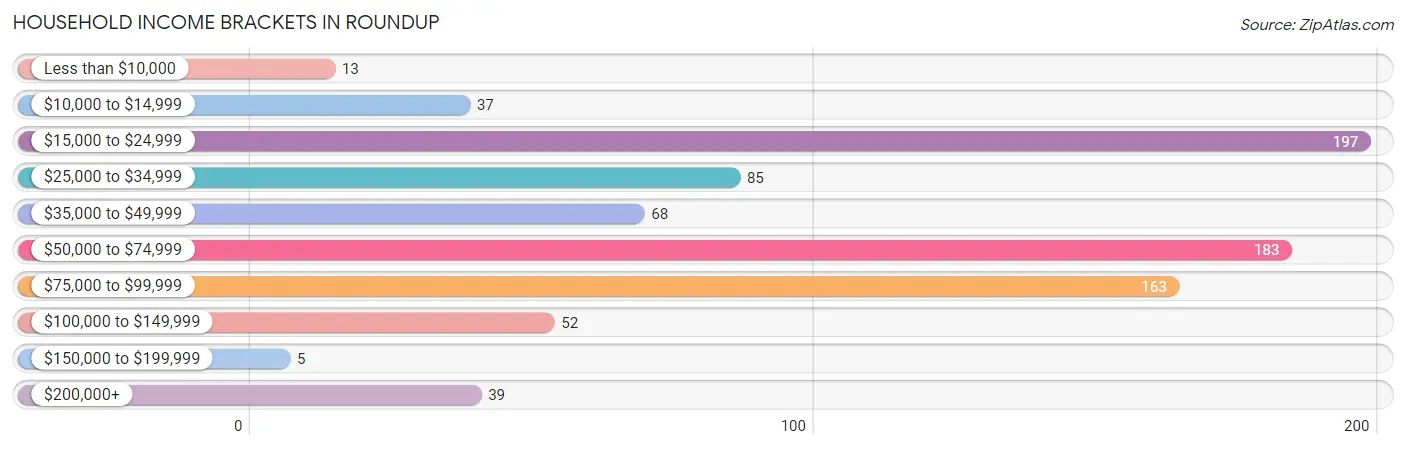
| Income Bracket | # Households | % Households |
| Less than $10,000 | 13 | 1.5% |
| $10,000 to $14,999 | 37 | 4.4% |
| $15,000 to $24,999 | 197 | 23.4% |
| $25,000 to $34,999 | 85 | 10.1% |
| $35,000 to $49,999 | 68 | 8.1% |
| $50,000 to $74,999 | 183 | 21.7% |
| $75,000 to $99,999 | 163 | 19.4% |
| $100,000 to $149,999 | 52 | 6.2% |
| $150,000 to $199,999 | 5 | 0.6% |
| $200,000+ | 39 | 4.6% |
Household Income by Householder Age in Roundup
The median household income in Roundup is $54,167, with the highest median household income of $74,821 found in the 25 to 44 years age bracket for the primary householder. A total of 169 households (20.1%) fall into this category. Meanwhile, the 15 to 24 years age bracket for the primary householder has the lowest median household income of $0, with 41 households (4.9%) in this group.
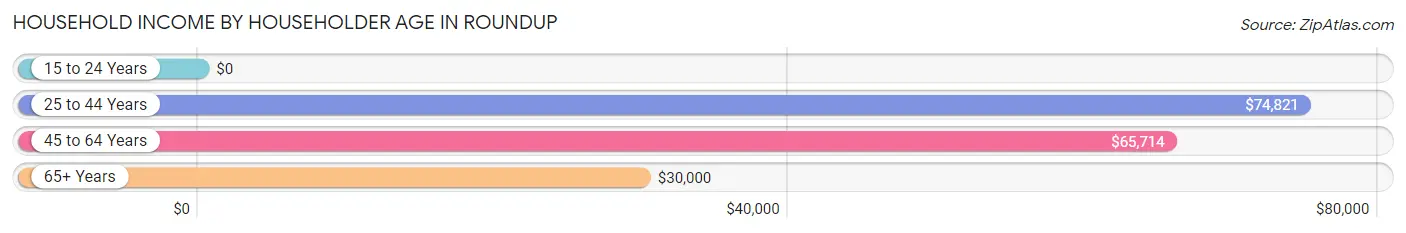
| Income Bracket | # Households | Median Income |
| 15 to 24 Years | 41 (4.9%) | $0 |
| 25 to 44 Years | 169 (20.1%) | $74,821 |
| 45 to 64 Years | 308 (36.6%) | $65,714 |
| 65+ Years | 324 (38.5%) | $30,000 |
| Total | 842 (100.0%) | $54,167 |
Poverty in Roundup
Income Below Poverty by Sex and Age in Roundup
With 7.3% poverty level for males and 17.1% for females among the residents of Roundup, under 5 year old males and 6 to 11 year old females are the most vulnerable to poverty, with 7 males (28.0%) and 61 females (64.9%) in their respective age groups living below the poverty level.
| Age Bracket | Male | Female |
| Under 5 Years | 7 (28.0%) | 0 (0.0%) |
| 5 Years | 0 (0.0%) | 0 (0.0%) |
| 6 to 11 Years | 0 (0.0%) | 61 (64.9%) |
| 12 to 14 Years | 0 (0.0%) | 0 (0.0%) |
| 15 Years | 0 (0.0%) | 0 (0.0%) |
| 16 and 17 Years | 6 (16.2%) | 0 (0.0%) |
| 18 to 24 Years | 7 (7.5%) | 21 (36.8%) |
| 25 to 34 Years | 10 (16.7%) | 13 (13.5%) |
| 35 to 44 Years | 0 (0.0%) | 5 (7.1%) |
| 45 to 54 Years | 7 (6.4%) | 16 (17.6%) |
| 55 to 64 Years | 0 (0.0%) | 11 (9.1%) |
| 65 to 74 Years | 16 (12.3%) | 20 (14.2%) |
| 75 Years and over | 11 (15.3%) | 5 (4.9%) |
| Total | 64 (7.3%) | 152 (17.1%) |
Income Above Poverty by Sex and Age in Roundup
According to the poverty statistics in Roundup, males aged 6 to 11 years and females aged under 5 years are the age groups that are most secure financially, with 100.0% of males and 100.0% of females in these age groups living above the poverty line.
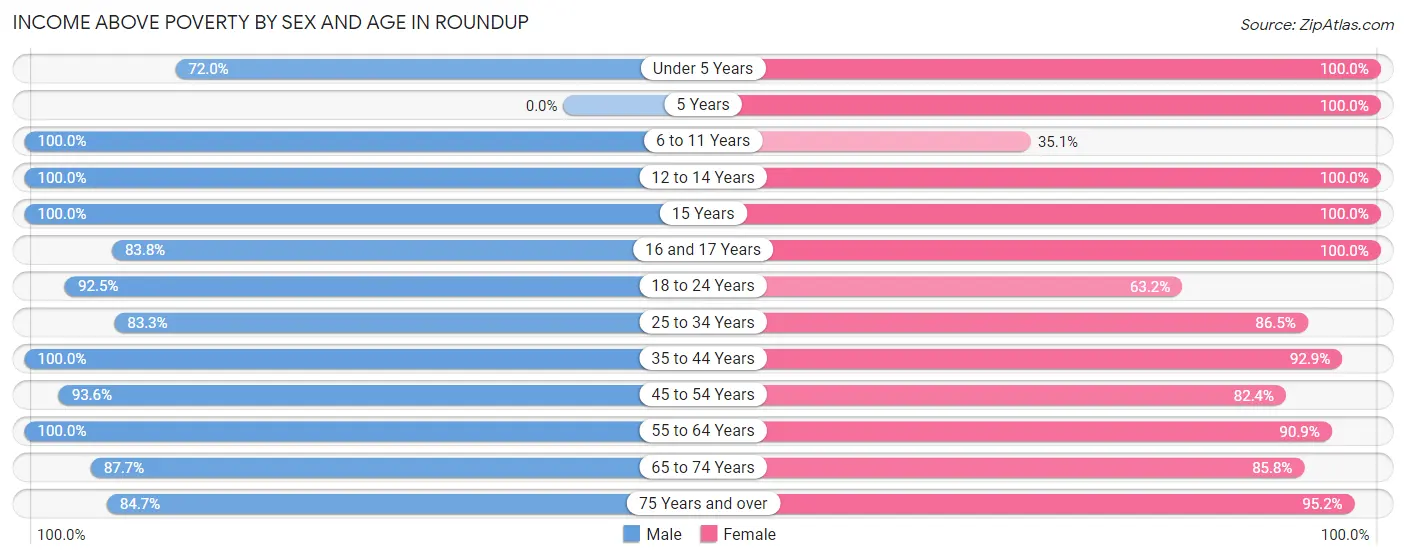
| Age Bracket | Male | Female |
| Under 5 Years | 18 (72.0%) | 39 (100.0%) |
| 5 Years | 0 (0.0%) | 7 (100.0%) |
| 6 to 11 Years | 40 (100.0%) | 33 (35.1%) |
| 12 to 14 Years | 22 (100.0%) | 21 (100.0%) |
| 15 Years | 21 (100.0%) | 8 (100.0%) |
| 16 and 17 Years | 31 (83.8%) | 43 (100.0%) |
| 18 to 24 Years | 86 (92.5%) | 36 (63.2%) |
| 25 to 34 Years | 50 (83.3%) | 83 (86.5%) |
| 35 to 44 Years | 91 (100.0%) | 65 (92.9%) |
| 45 to 54 Years | 103 (93.6%) | 75 (82.4%) |
| 55 to 64 Years | 173 (100.0%) | 110 (90.9%) |
| 65 to 74 Years | 114 (87.7%) | 121 (85.8%) |
| 75 Years and over | 61 (84.7%) | 98 (95.2%) |
| Total | 810 (92.7%) | 739 (82.9%) |
Income Below Poverty Among Married-Couple Families in Roundup
The poverty statistics for married-couple families in Roundup show that 6.9% or 21 of the total 304 families live below the poverty line. Families with 1 or 2 children have the highest poverty rate of 12.0%, comprising of 11 families. On the other hand, families with 3 or 4 children have the lowest poverty rate of 0.0%, which includes 0 families.
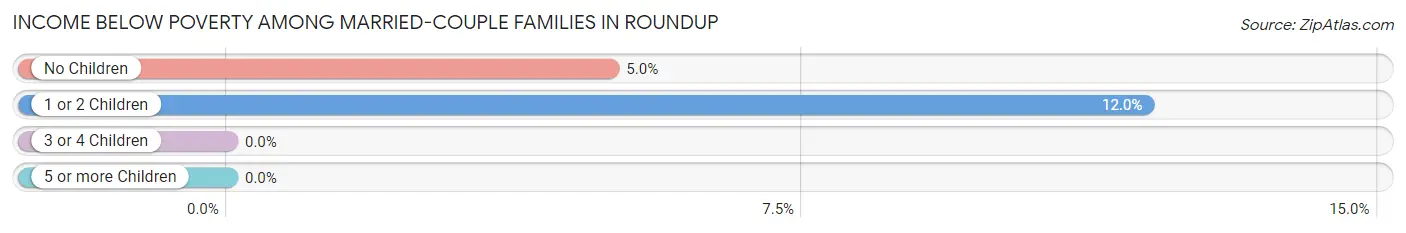
| Children | Above Poverty | Below Poverty |
| No Children | 191 (95.0%) | 10 (5.0%) |
| 1 or 2 Children | 81 (88.0%) | 11 (12.0%) |
| 3 or 4 Children | 6 (100.0%) | 0 (0.0%) |
| 5 or more Children | 5 (100.0%) | 0 (0.0%) |
| Total | 283 (93.1%) | 21 (6.9%) |
Income Below Poverty Among Single-Parent Households in Roundup
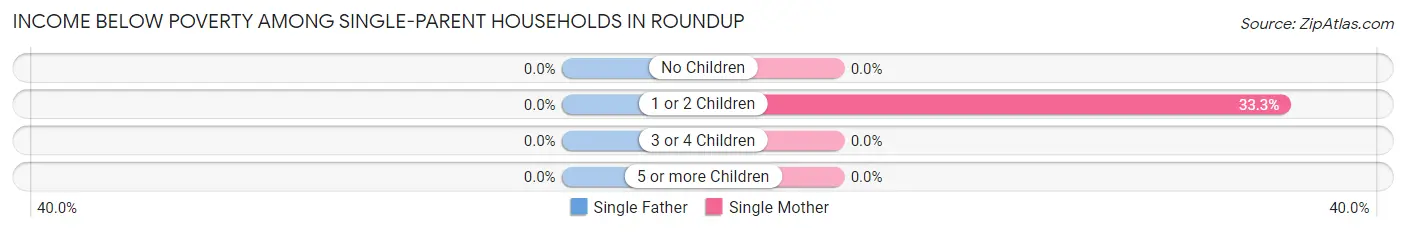
| Children | Single Father | Single Mother |
| No Children | 0 (0.0%) | 0 (0.0%) |
| 1 or 2 Children | 0 (0.0%) | 13 (33.3%) |
| 3 or 4 Children | 0 (0.0%) | 0 (0.0%) |
| 5 or more Children | 0 (0.0%) | 0 (0.0%) |
| Total | 0 (0.0%) | 13 (22.4%) |
Income Below Poverty Among Married-Couple vs Single-Parent Households in Roundup
The poverty data for Roundup shows that 21 of the married-couple family households (6.9%) and 13 of the single-parent households (13.3%) are living below the poverty level. Within the married-couple family households, those with 1 or 2 children have the highest poverty rate, with 11 households (12.0%) falling below the poverty line. Among the single-parent households, those with 1 or 2 children have the highest poverty rate, with 13 household (27.7%) living below poverty.
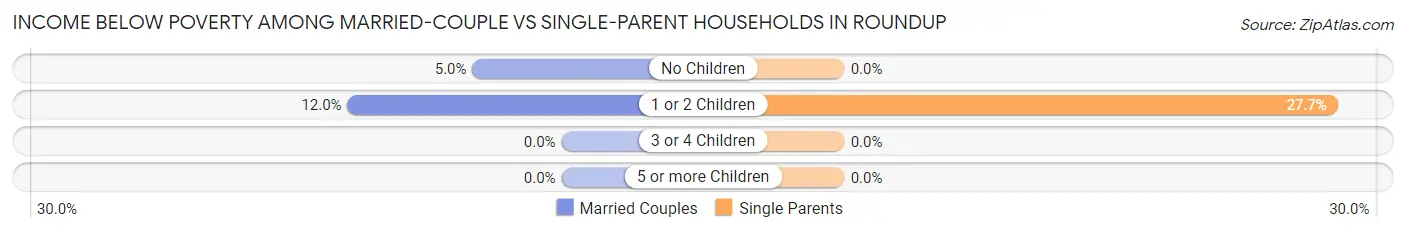
| Children | Married-Couple Families | Single-Parent Households |
| No Children | 10 (5.0%) | 0 (0.0%) |
| 1 or 2 Children | 11 (12.0%) | 13 (27.7%) |
| 3 or 4 Children | 0 (0.0%) | 0 (0.0%) |
| 5 or more Children | 0 (0.0%) | 0 (0.0%) |
| Total | 21 (6.9%) | 13 (13.3%) |
Race in Roundup
The most populous races in Roundup are White / Caucasian (1,690 | 92.6%), Hispanic or Latino (93 | 5.1%), and Two or more Races (73 | 4.0%).
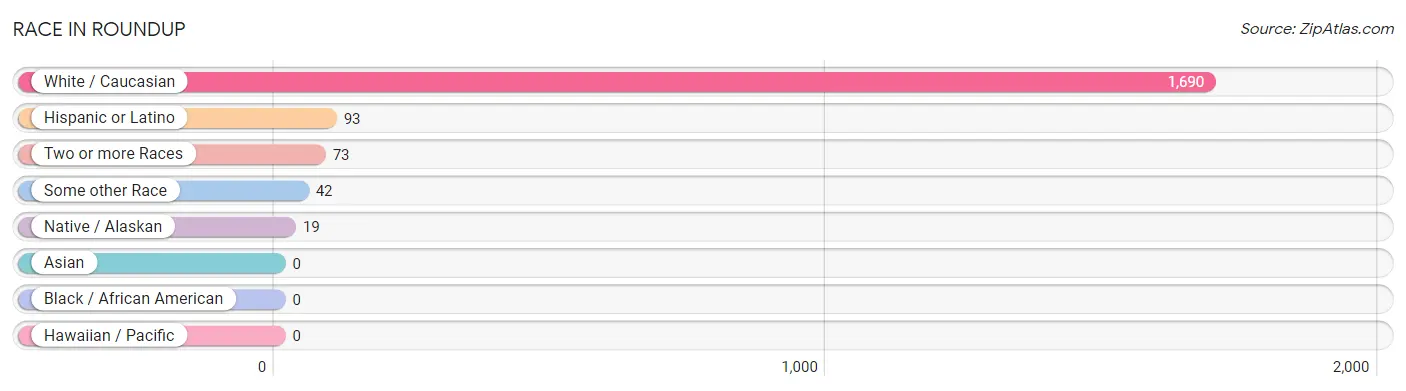
| Race | # Population | % Population |
| Asian | 0 | 0.0% |
| Black / African American | 0 | 0.0% |
| Hawaiian / Pacific | 0 | 0.0% |
| Hispanic or Latino | 93 | 5.1% |
| Native / Alaskan | 19 | 1.0% |
| White / Caucasian | 1,690 | 92.6% |
| Two or more Races | 73 | 4.0% |
| Some other Race | 42 | 2.3% |
| Total | 1,824 | 100.0% |
Ancestry in Roundup
The most populous ancestries reported in Roundup are German (484 | 26.5%), Irish (253 | 13.9%), English (153 | 8.4%), Norwegian (129 | 7.1%), and Scottish (86 | 4.7%), together accounting for 60.6% of all Roundup residents.
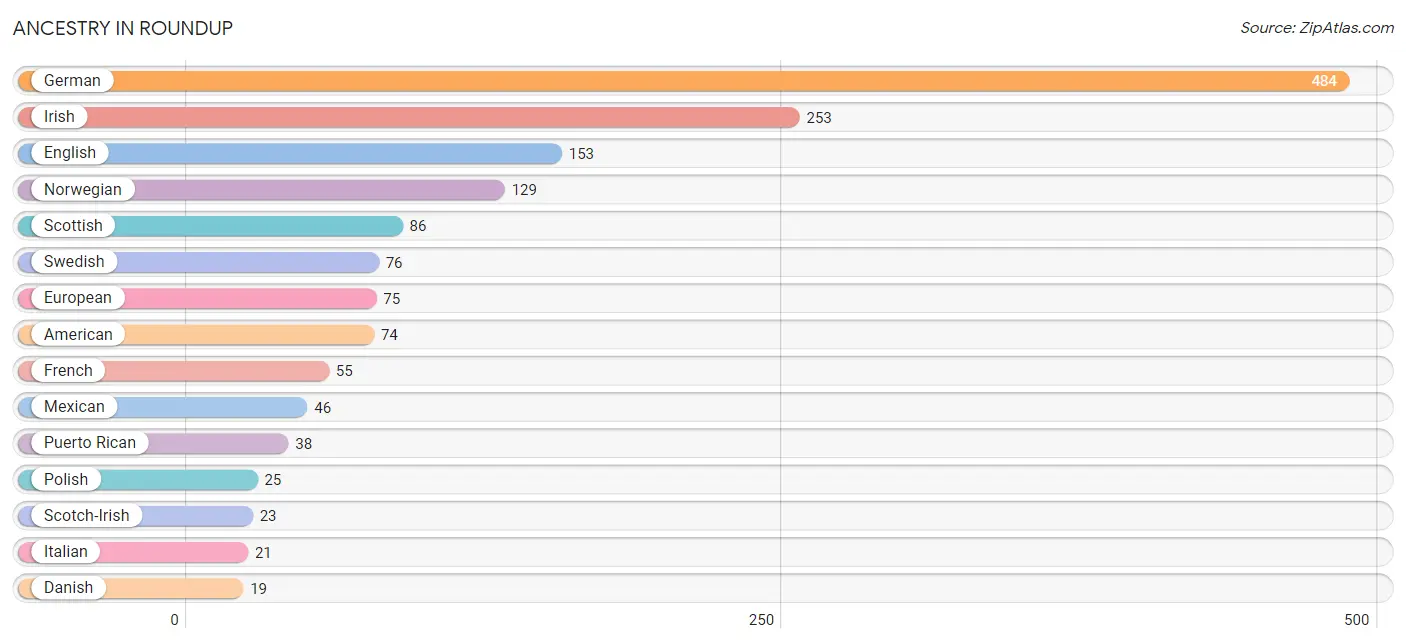
| Ancestry | # Population | % Population |
| American | 74 | 4.1% |
| Arapaho | 3 | 0.2% |
| Austrian | 3 | 0.2% |
| Bhutanese | 13 | 0.7% |
| British | 9 | 0.5% |
| Cherokee | 8 | 0.4% |
| Cheyenne | 6 | 0.3% |
| Danish | 19 | 1.0% |
| Dutch | 15 | 0.8% |
| English | 153 | 8.4% |
| European | 75 | 4.1% |
| Finnish | 6 | 0.3% |
| French | 55 | 3.0% |
| French Canadian | 7 | 0.4% |
| German | 484 | 26.5% |
| Hungarian | 5 | 0.3% |
| Irish | 253 | 13.9% |
| Italian | 21 | 1.1% |
| Mexican | 46 | 2.5% |
| Navajo | 1 | 0.1% |
| Norwegian | 129 | 7.1% |
| Osage | 13 | 0.7% |
| Polish | 25 | 1.4% |
| Puerto Rican | 38 | 2.1% |
| Scotch-Irish | 23 | 1.3% |
| Scottish | 86 | 4.7% |
| Sioux | 3 | 0.2% |
| Slovene | 4 | 0.2% |
| Swedish | 76 | 4.2% |
| Ukrainian | 14 | 0.8% |
| Welsh | 17 | 0.9% | View All 31 Rows |
Immigrants in Roundup
The most numerous immigrant groups reported in Roundup came from Europe (65 | 3.6%), Northern Europe (65 | 3.6%), Scotland (57 | 3.1%), and England (8 | 0.4%), together accounting for 10.7% of all Roundup residents.
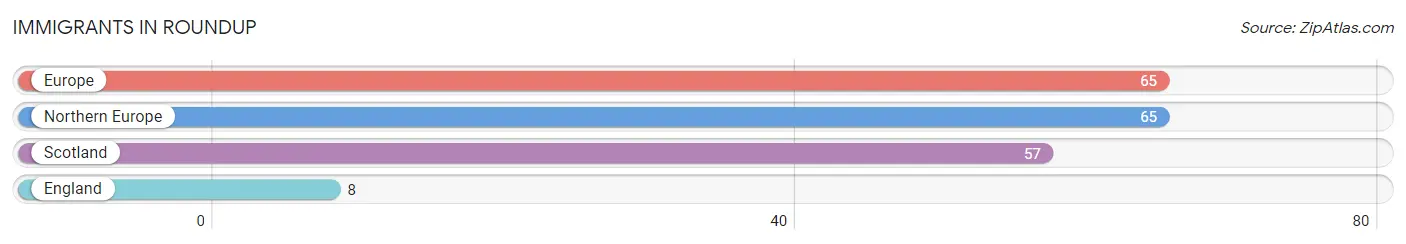
| Immigration Origin | # Population | % Population |
| England | 8 | 0.4% |
| Europe | 65 | 3.6% |
| Northern Europe | 65 | 3.6% |
| Scotland | 57 | 3.1% | View All 4 Rows |
Sex and Age in Roundup
Sex and Age in Roundup
The most populous age groups in Roundup are 60 to 64 Years (133 | 14.4%) for men and 15 to 19 Years (92 | 10.2%) for women.
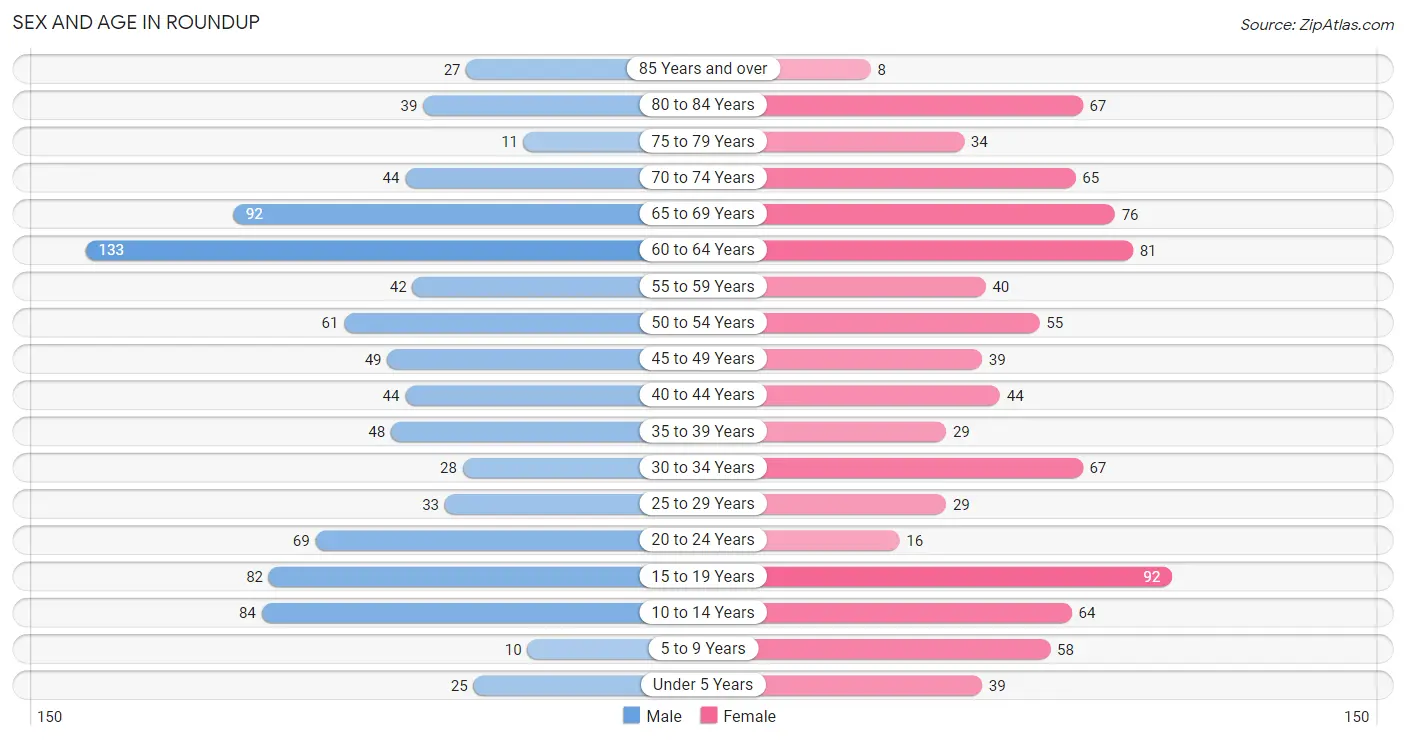
| Age Bracket | Male | Female |
| Under 5 Years | 25 (2.7%) | 39 (4.3%) |
| 5 to 9 Years | 10 (1.1%) | 58 (6.4%) |
| 10 to 14 Years | 84 (9.1%) | 64 (7.1%) |
| 15 to 19 Years | 82 (8.9%) | 92 (10.2%) |
| 20 to 24 Years | 69 (7.5%) | 16 (1.8%) |
| 25 to 29 Years | 33 (3.6%) | 29 (3.2%) |
| 30 to 34 Years | 28 (3.0%) | 67 (7.4%) |
| 35 to 39 Years | 48 (5.2%) | 29 (3.2%) |
| 40 to 44 Years | 44 (4.8%) | 44 (4.9%) |
| 45 to 49 Years | 49 (5.3%) | 39 (4.3%) |
| 50 to 54 Years | 61 (6.6%) | 55 (6.1%) |
| 55 to 59 Years | 42 (4.6%) | 40 (4.4%) |
| 60 to 64 Years | 133 (14.4%) | 81 (9.0%) |
| 65 to 69 Years | 92 (10.0%) | 76 (8.4%) |
| 70 to 74 Years | 44 (4.8%) | 65 (7.2%) |
| 75 to 79 Years | 11 (1.2%) | 34 (3.8%) |
| 80 to 84 Years | 39 (4.2%) | 67 (7.4%) |
| 85 Years and over | 27 (2.9%) | 8 (0.9%) |
| Total | 921 (100.0%) | 903 (100.0%) |
Families and Households in Roundup
Median Family Size in Roundup
The median family size in Roundup is 2.90 persons per family, with single male/father families (40 | 10.0%) accounting for the largest median family size of 3.33 persons per family. On the other hand, single female/mother families (58 | 14.4%) represent the smallest median family size with 2.52 persons per family.
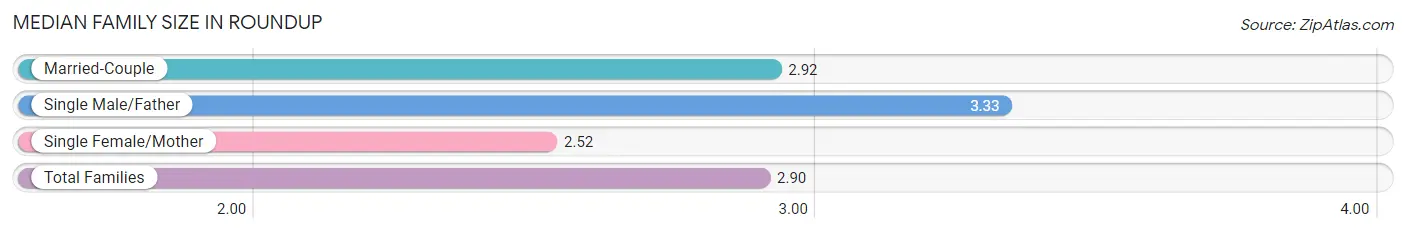
| Family Type | # Families | Family Size |
| Married-Couple | 304 (75.6%) | 2.92 |
| Single Male/Father | 40 (10.0%) | 3.33 |
| Single Female/Mother | 58 (14.4%) | 2.52 |
| Total Families | 402 (100.0%) | 2.90 |
Median Household Size in Roundup
The median household size in Roundup is 2.13 persons per household, with single male/father households (40 | 4.8%) accounting for the largest median household size of 3.65 persons per household. non-family households (440 | 52.3%) represent the smallest median household size with 1.18 persons per household.
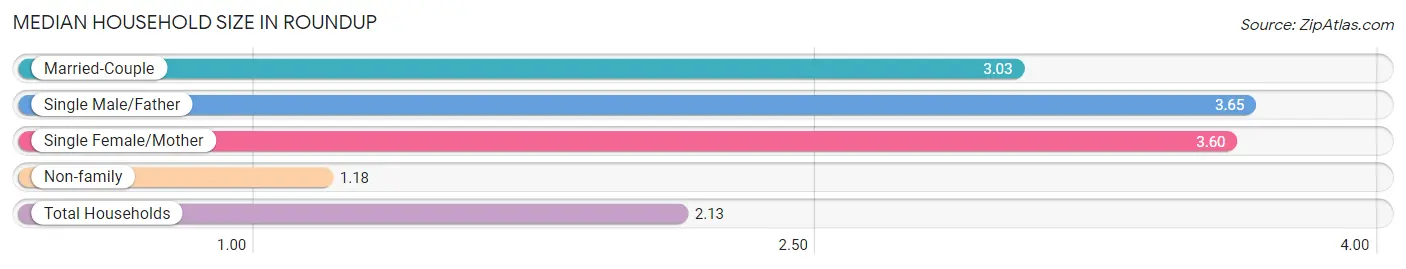
| Household Type | # Households | Household Size |
| Married-Couple | 304 (36.1%) | 3.03 |
| Single Male/Father | 40 (4.8%) | 3.65 |
| Single Female/Mother | 58 (6.9%) | 3.60 |
| Non-family | 440 (52.3%) | 1.18 |
| Total Households | 842 (100.0%) | 2.13 |
Household Size by Marriage Status in Roundup
Out of a total of 842 households in Roundup, 402 (47.7%) are family households, while 440 (52.3%) are nonfamily households. The most numerous type of family households are 2-person households, comprising 217, and the most common type of nonfamily households are 1-person households, comprising 386.
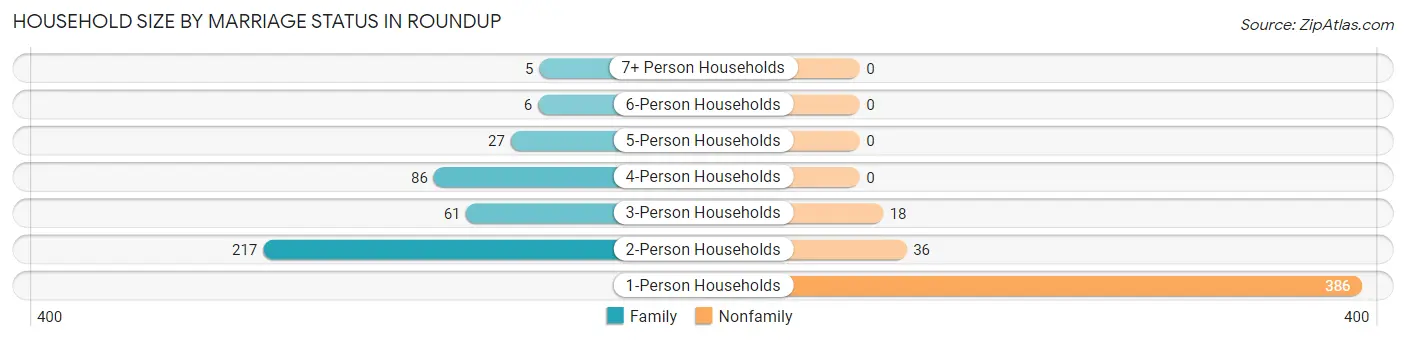
| Household Size | Family Households | Nonfamily Households |
| 1-Person Households | - | 386 (45.8%) |
| 2-Person Households | 217 (25.8%) | 36 (4.3%) |
| 3-Person Households | 61 (7.2%) | 18 (2.1%) |
| 4-Person Households | 86 (10.2%) | 0 (0.0%) |
| 5-Person Households | 27 (3.2%) | 0 (0.0%) |
| 6-Person Households | 6 (0.7%) | 0 (0.0%) |
| 7+ Person Households | 5 (0.6%) | 0 (0.0%) |
| Total | 402 (47.7%) | 440 (52.3%) |
Female Fertility in Roundup
Fertility by Age in Roundup
Average fertility rate in Roundup is 102.0 births per 1,000 women. Women in the age bracket of 15 to 19 years have the highest fertility rate with 141.0 births per 1,000 women. Women in the age bracket of 15 to 19 years acount for 37.1% of all women with births.
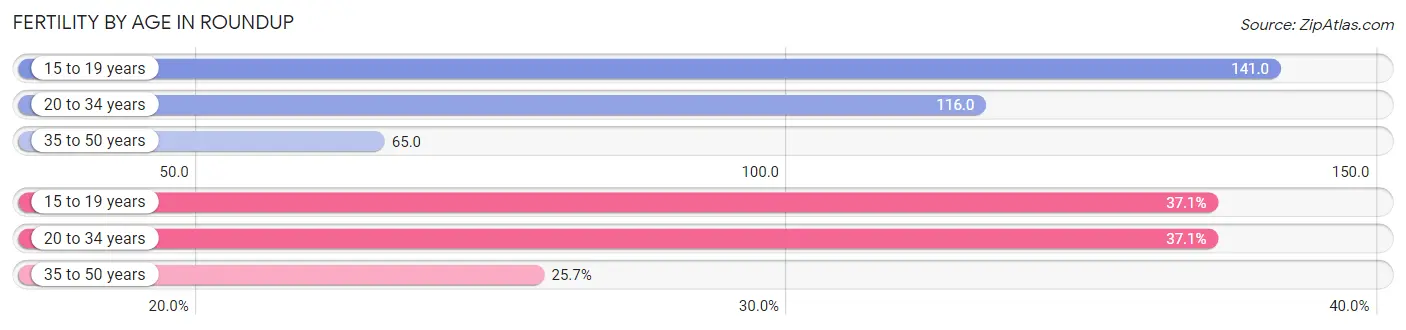
| Age Bracket | Women with Births | Births / 1,000 Women |
| 15 to 19 years | 13 (37.1%) | 141.0 |
| 20 to 34 years | 13 (37.1%) | 116.0 |
| 35 to 50 years | 9 (25.7%) | 65.0 |
| Total | 35 (100.0%) | 102.0 |
Fertility by Age by Marriage Status in Roundup
25.7% of women with births (35) in Roundup are married. The highest percentage of unmarried women with births falls into 15 to 19 years age bracket with 100.0% of them unmarried at the time of birth, while the lowest percentage of unmarried women with births belong to 35 to 50 years age bracket with 0.0% of them unmarried.
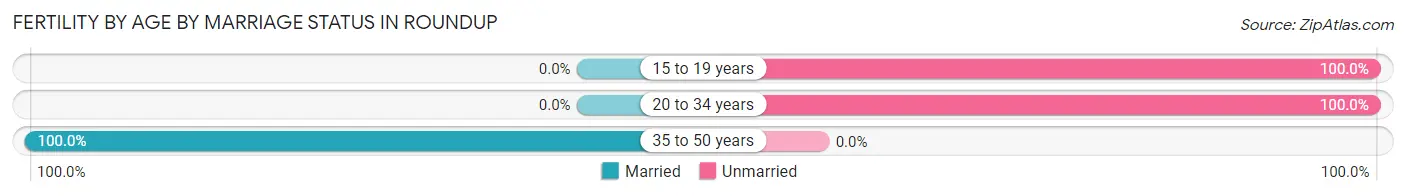
| Age Bracket | Married | Unmarried |
| 15 to 19 years | 0 (0.0%) | 13 (100.0%) |
| 20 to 34 years | 0 (0.0%) | 13 (100.0%) |
| 35 to 50 years | 9 (100.0%) | 0 (0.0%) |
| Total | 9 (25.7%) | 26 (74.3%) |
Fertility by Education in Roundup
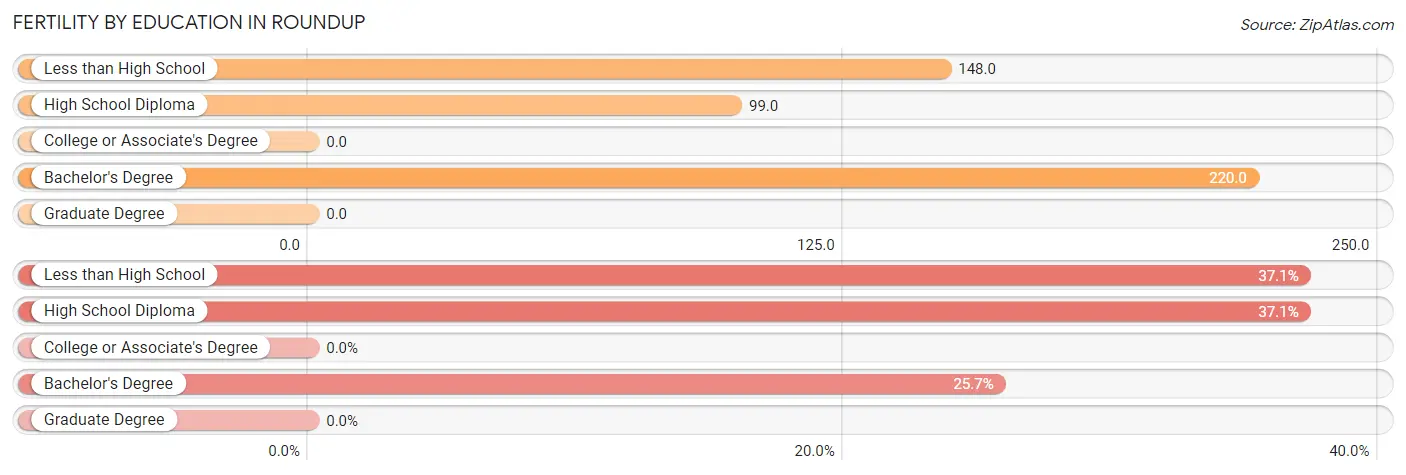
| Educational Attainment | Women with Births | Births / 1,000 Women |
| Less than High School | 13 (37.1%) | 148.0 |
| High School Diploma | 13 (37.1%) | 99.0 |
| College or Associate's Degree | 0 (0.0%) | 0.0 |
| Bachelor's Degree | 9 (25.7%) | 220.0 |
| Graduate Degree | 0 (0.0%) | 0.0 |
| Total | 35 (100.0%) | 102.0 |
Fertility by Education by Marriage Status in Roundup
74.3% of women with births in Roundup are unmarried. Women with the educational attainment of bachelor's degree are most likely to be married with 100.0% of them married at childbirth, while women with the educational attainment of less than high school are least likely to be married with 100.0% of them unmarried at childbirth.
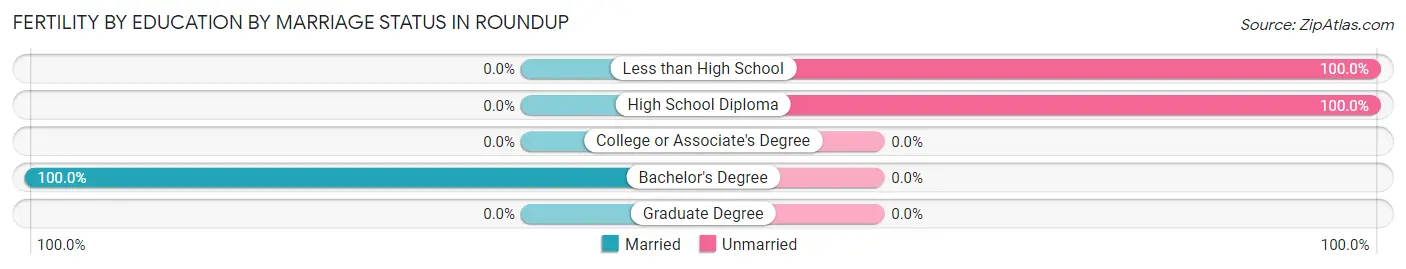
| Educational Attainment | Married | Unmarried |
| Less than High School | 0 (0.0%) | 13 (100.0%) |
| High School Diploma | 0 (0.0%) | 13 (100.0%) |
| College or Associate's Degree | 0 (0.0%) | 0 (0.0%) |
| Bachelor's Degree | 9 (100.0%) | 0 (0.0%) |
| Graduate Degree | 0 (0.0%) | 0 (0.0%) |
| Total | 9 (25.7%) | 26 (74.3%) |
Employment Characteristics in Roundup
Employment by Class of Employer in Roundup
Among the 751 employed individuals in Roundup, private company employees (527 | 70.2%), not-for-profit organizations (83 | 11.1%), and local government employees (58 | 7.7%) make up the most common classes of employment.
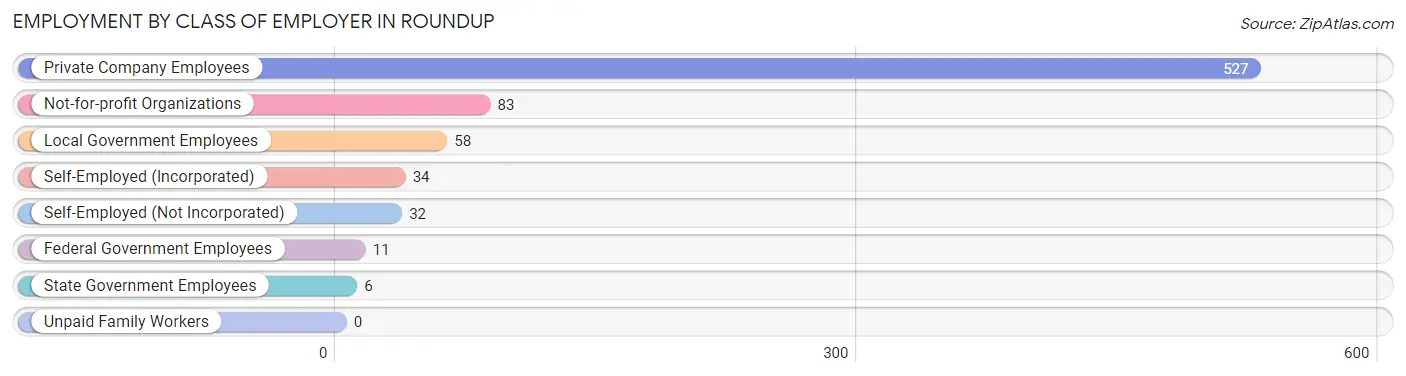
| Employer Class | # Employees | % Employees |
| Private Company Employees | 527 | 70.2% |
| Self-Employed (Incorporated) | 34 | 4.5% |
| Self-Employed (Not Incorporated) | 32 | 4.3% |
| Not-for-profit Organizations | 83 | 11.1% |
| Local Government Employees | 58 | 7.7% |
| State Government Employees | 6 | 0.8% |
| Federal Government Employees | 11 | 1.5% |
| Unpaid Family Workers | 0 | 0.0% |
| Total | 751 | 100.0% |
Employment Status by Age in Roundup
According to the labor force statistics for Roundup, out of the total population over 16 years of age (1,515), 54.3% or 823 individuals are in the labor force, with 3.8% or 31 of them unemployed. The age group with the highest labor force participation rate is 25 to 29 years, with 100.0% or 62 individuals in the labor force. Within the labor force, the 16 to 19 years age range has the highest percentage of unemployed individuals, with 46.2% or 24 of them being unemployed.
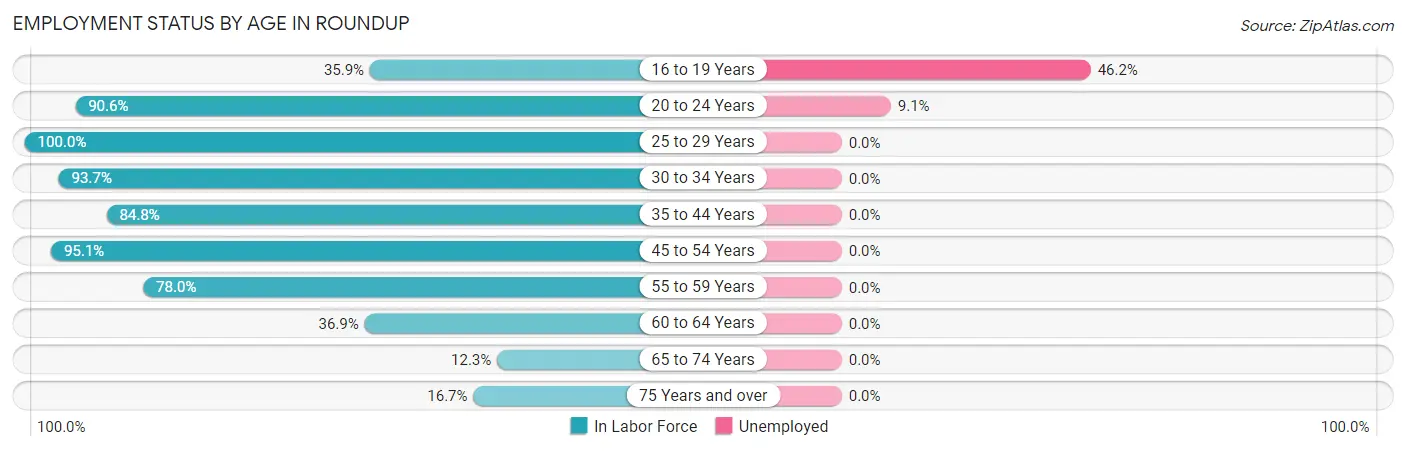
| Age Bracket | In Labor Force | Unemployed |
| 16 to 19 Years | 52 (35.9%) | 24 (46.2%) |
| 20 to 24 Years | 77 (90.6%) | 7 (9.1%) |
| 25 to 29 Years | 62 (100.0%) | 0 (0.0%) |
| 30 to 34 Years | 89 (93.7%) | 0 (0.0%) |
| 35 to 44 Years | 140 (84.8%) | 0 (0.0%) |
| 45 to 54 Years | 194 (95.1%) | 0 (0.0%) |
| 55 to 59 Years | 64 (78.0%) | 0 (0.0%) |
| 60 to 64 Years | 79 (36.9%) | 0 (0.0%) |
| 65 to 74 Years | 34 (12.3%) | 0 (0.0%) |
| 75 Years and over | 31 (16.7%) | 0 (0.0%) |
| Total | 823 (54.3%) | 31 (3.8%) |
Employment Status by Educational Attainment in Roundup
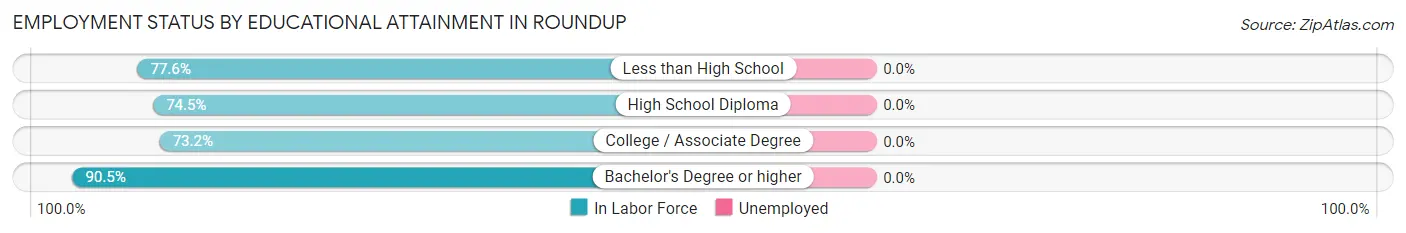
| Educational Attainment | In Labor Force | Unemployed |
| Less than High School | 76 (77.6%) | 0 (0.0%) |
| High School Diploma | 316 (74.5%) | 0 (0.0%) |
| College / Associate Degree | 150 (73.2%) | 0 (0.0%) |
| Bachelor's Degree or higher | 86 (90.5%) | 0 (0.0%) |
| Total | 628 (76.4%) | 0 (0.0%) |
Employment Occupations by Sex in Roundup
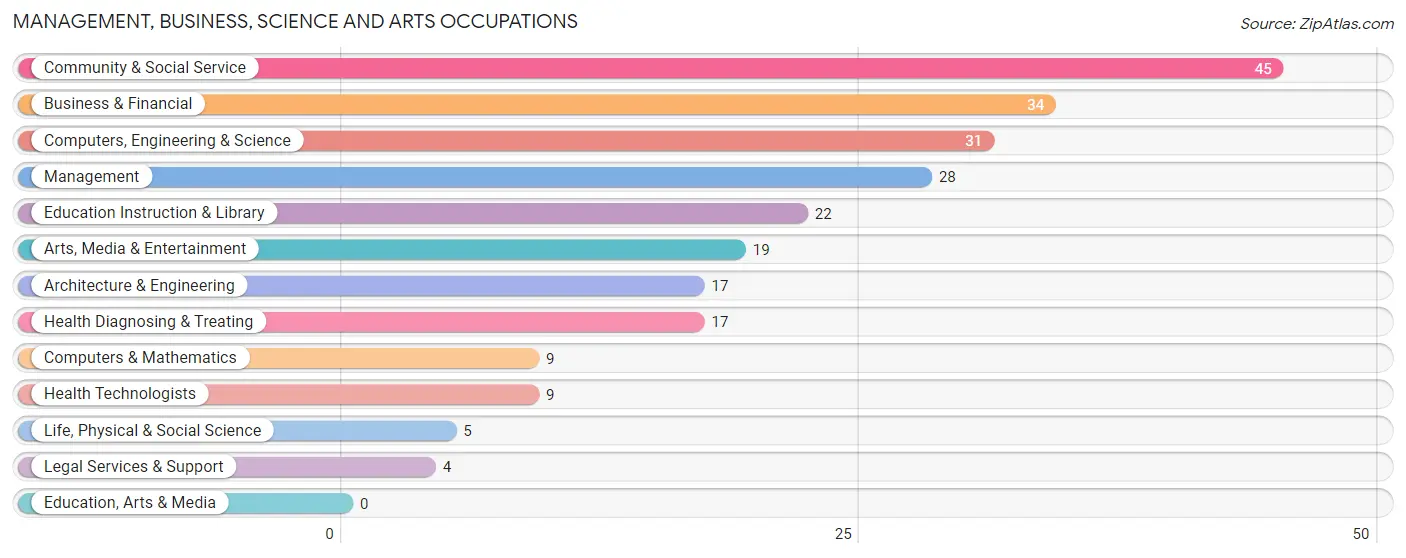
Management, Business, Science and Arts Occupations
The most common Management, Business, Science and Arts occupations in Roundup are Community & Social Service (45 | 5.7%), Business & Financial (34 | 4.3%), Computers, Engineering & Science (31 | 3.9%), Management (28 | 3.5%), and Education Instruction & Library (22 | 2.8%).
Management, Business, Science and Arts Occupations by Sex
Within the Management, Business, Science and Arts occupations in Roundup, the most male-oriented occupations are Computers & Mathematics (100.0%), Architecture & Engineering (100.0%), and Computers, Engineering & Science (83.9%), while the most female-oriented occupations are Life, Physical & Social Science (100.0%), Legal Services & Support (100.0%), and Education Instruction & Library (100.0%).
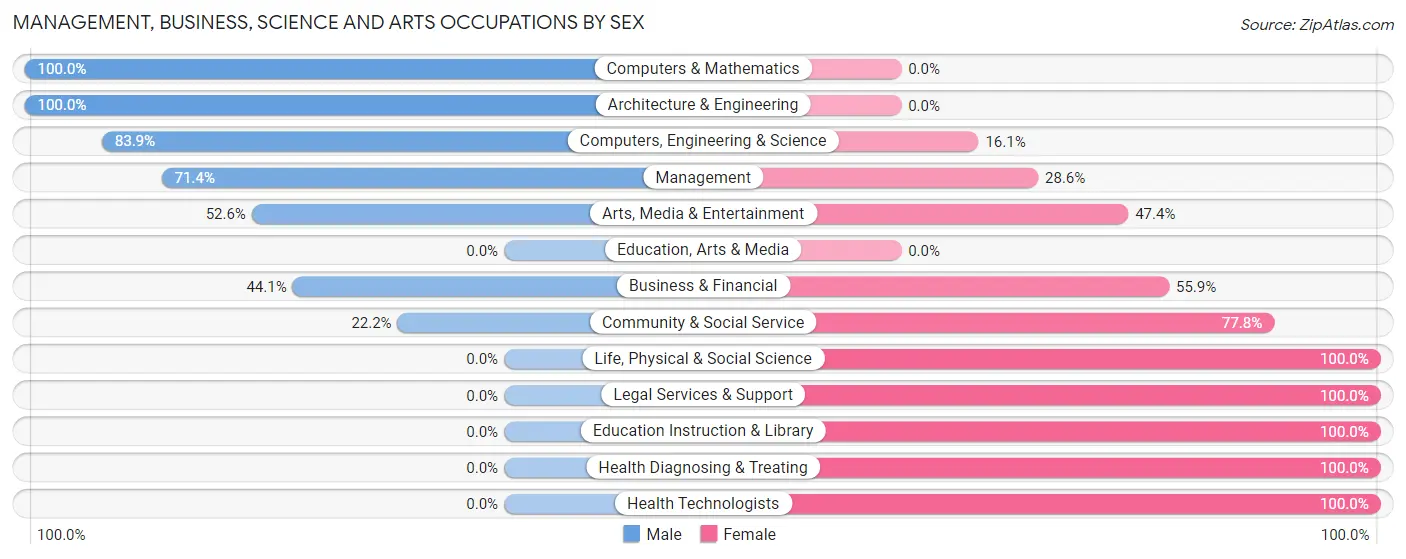
| Occupation | Male | Female |
| Management | 20 (71.4%) | 8 (28.6%) |
| Business & Financial | 15 (44.1%) | 19 (55.9%) |
| Computers, Engineering & Science | 26 (83.9%) | 5 (16.1%) |
| Computers & Mathematics | 9 (100.0%) | 0 (0.0%) |
| Architecture & Engineering | 17 (100.0%) | 0 (0.0%) |
| Life, Physical & Social Science | 0 (0.0%) | 5 (100.0%) |
| Community & Social Service | 10 (22.2%) | 35 (77.8%) |
| Education, Arts & Media | 0 (0.0%) | 0 (0.0%) |
| Legal Services & Support | 0 (0.0%) | 4 (100.0%) |
| Education Instruction & Library | 0 (0.0%) | 22 (100.0%) |
| Arts, Media & Entertainment | 10 (52.6%) | 9 (47.4%) |
| Health Diagnosing & Treating | 0 (0.0%) | 17 (100.0%) |
| Health Technologists | 0 (0.0%) | 9 (100.0%) |
| Total (Category) | 71 (45.8%) | 84 (54.2%) |
| Total (Overall) | 406 (51.3%) | 385 (48.7%) |
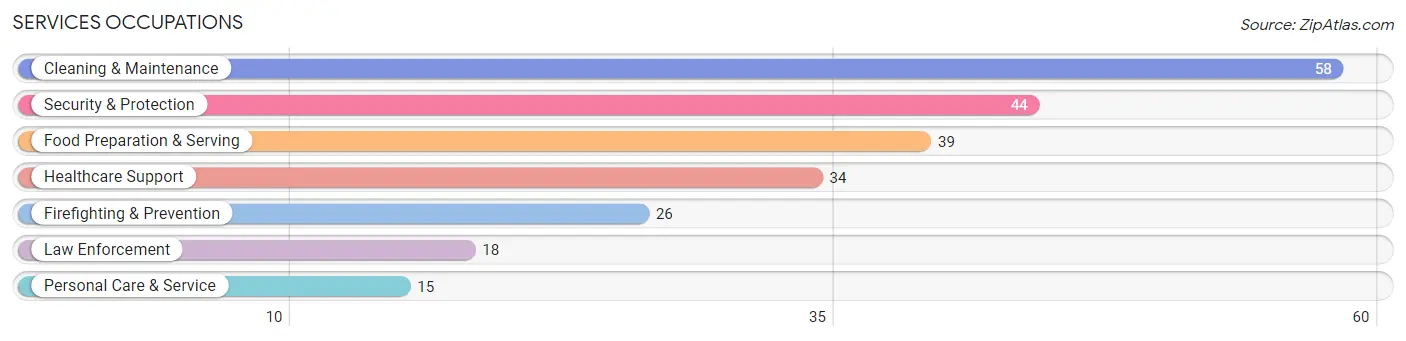
Services Occupations
The most common Services occupations in Roundup are Cleaning & Maintenance (58 | 7.3%), Security & Protection (44 | 5.6%), Food Preparation & Serving (39 | 4.9%), Healthcare Support (34 | 4.3%), and Firefighting & Prevention (26 | 3.3%).
Services Occupations by Sex
Within the Services occupations in Roundup, the most male-oriented occupations are Firefighting & Prevention (100.0%), Personal Care & Service (100.0%), and Security & Protection (68.2%), while the most female-oriented occupations are Healthcare Support (100.0%), Law Enforcement (77.8%), and Cleaning & Maintenance (72.4%).
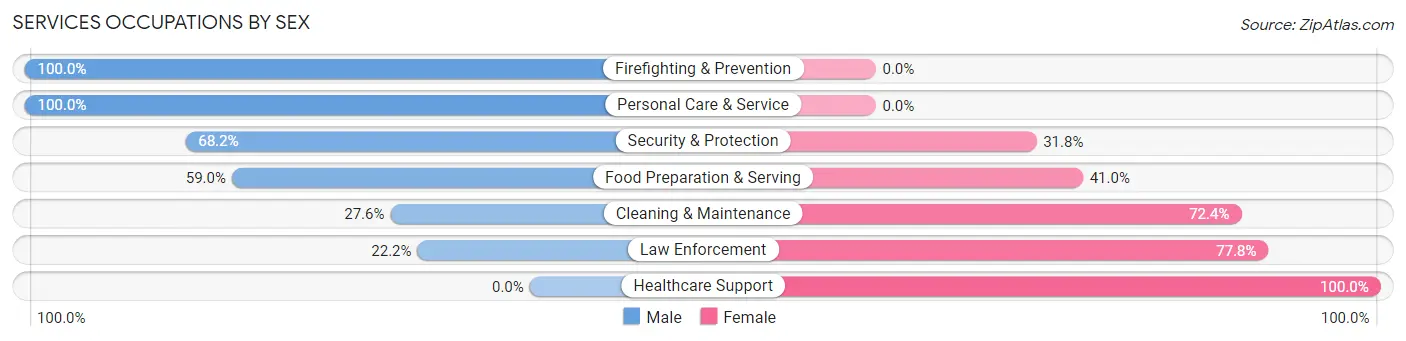
| Occupation | Male | Female |
| Healthcare Support | 0 (0.0%) | 34 (100.0%) |
| Security & Protection | 30 (68.2%) | 14 (31.8%) |
| Firefighting & Prevention | 26 (100.0%) | 0 (0.0%) |
| Law Enforcement | 4 (22.2%) | 14 (77.8%) |
| Food Preparation & Serving | 23 (59.0%) | 16 (41.0%) |
| Cleaning & Maintenance | 16 (27.6%) | 42 (72.4%) |
| Personal Care & Service | 15 (100.0%) | 0 (0.0%) |
| Total (Category) | 84 (44.2%) | 106 (55.8%) |
| Total (Overall) | 406 (51.3%) | 385 (48.7%) |
Sales and Office Occupations
The most common Sales and Office occupations in Roundup are Office & Administration (164 | 20.7%), and Sales & Related (36 | 4.5%).
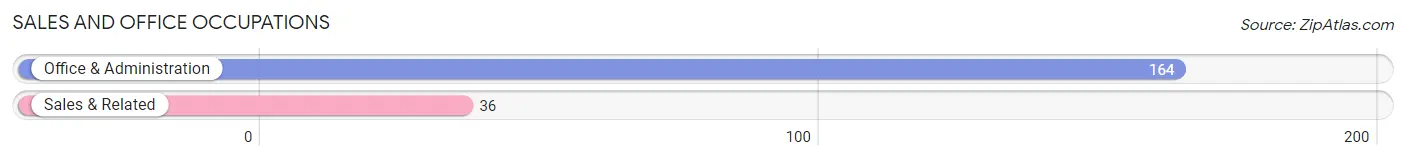
Sales and Office Occupations by Sex
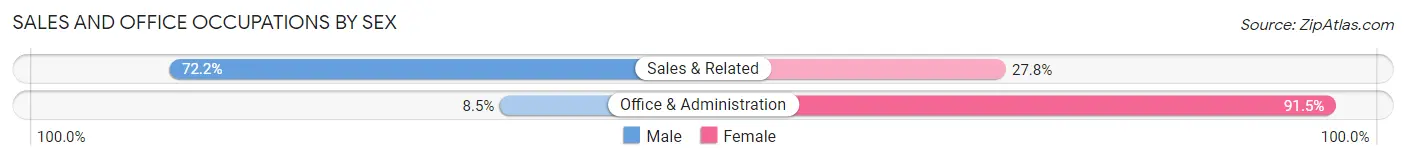
| Occupation | Male | Female |
| Sales & Related | 26 (72.2%) | 10 (27.8%) |
| Office & Administration | 14 (8.5%) | 150 (91.5%) |
| Total (Category) | 40 (20.0%) | 160 (80.0%) |
| Total (Overall) | 406 (51.3%) | 385 (48.7%) |
Natural Resources, Construction and Maintenance Occupations
The most common Natural Resources, Construction and Maintenance occupations in Roundup are Construction & Extraction (90 | 11.4%), Installation, Maintenance & Repair (59 | 7.5%), and Farming, Fishing & Forestry (7 | 0.9%).
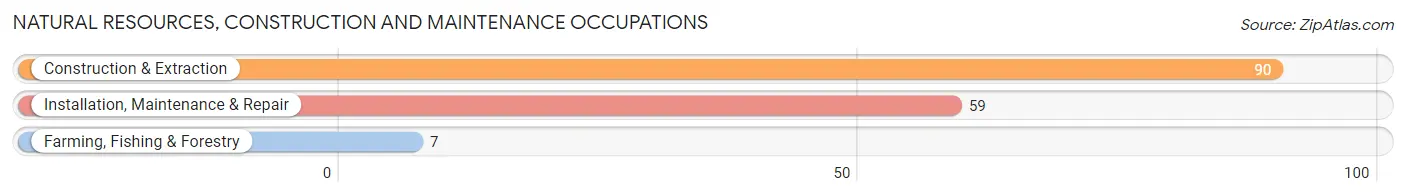
Natural Resources, Construction and Maintenance Occupations by Sex
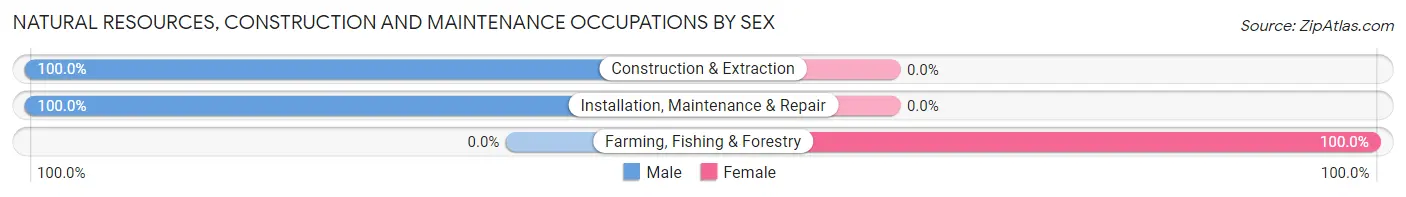
| Occupation | Male | Female |
| Farming, Fishing & Forestry | 0 (0.0%) | 7 (100.0%) |
| Construction & Extraction | 90 (100.0%) | 0 (0.0%) |
| Installation, Maintenance & Repair | 59 (100.0%) | 0 (0.0%) |
| Total (Category) | 149 (95.5%) | 7 (4.5%) |
| Total (Overall) | 406 (51.3%) | 385 (48.7%) |
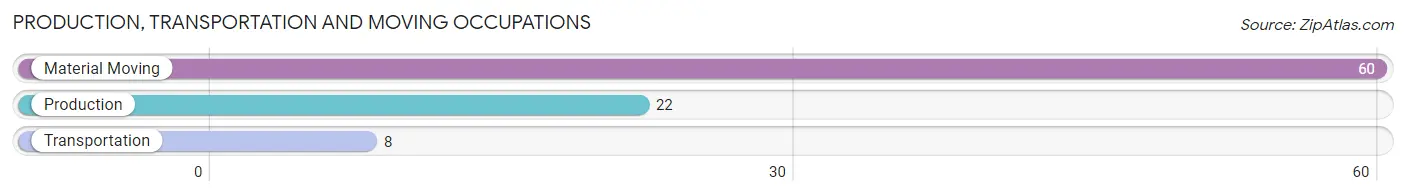
Production, Transportation and Moving Occupations
The most common Production, Transportation and Moving occupations in Roundup are Material Moving (60 | 7.6%), Production (22 | 2.8%), and Transportation (8 | 1.0%).
Production, Transportation and Moving Occupations by Sex
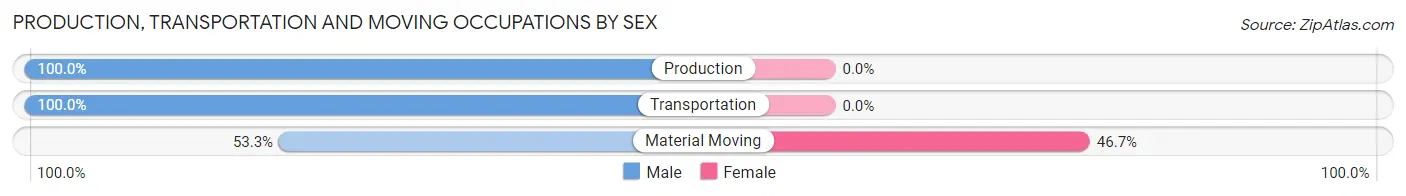
| Occupation | Male | Female |
| Production | 22 (100.0%) | 0 (0.0%) |
| Transportation | 8 (100.0%) | 0 (0.0%) |
| Material Moving | 32 (53.3%) | 28 (46.7%) |
| Total (Category) | 62 (68.9%) | 28 (31.1%) |
| Total (Overall) | 406 (51.3%) | 385 (48.7%) |
Employment Industries by Sex in Roundup
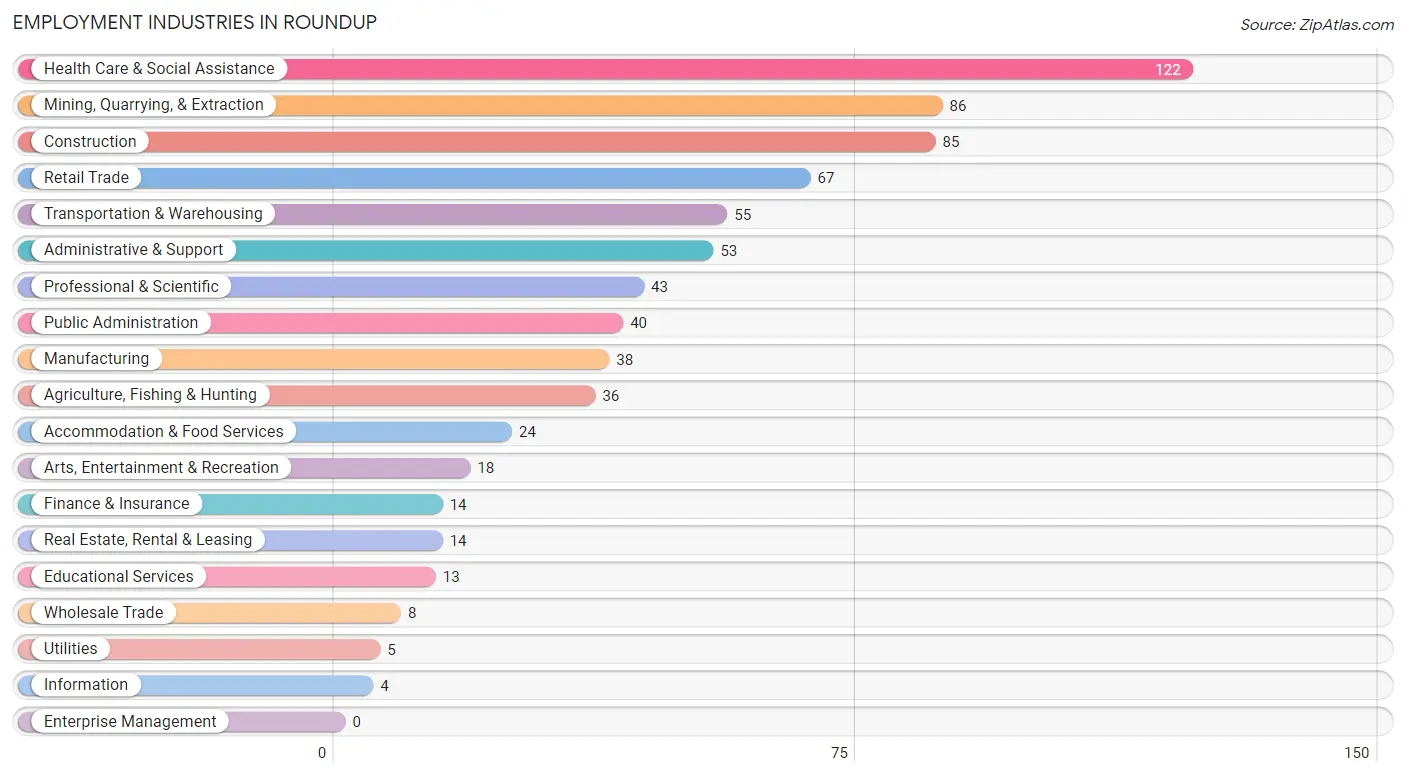
Employment Industries in Roundup
The major employment industries in Roundup include Health Care & Social Assistance (122 | 15.4%), Mining, Quarrying, & Extraction (86 | 10.9%), Construction (85 | 10.7%), Retail Trade (67 | 8.5%), and Transportation & Warehousing (55 | 7.0%).
Employment Industries by Sex in Roundup
The Roundup industries that see more men than women are Utilities (100.0%), Accommodation & Food Services (100.0%), and Agriculture, Fishing & Hunting (80.6%), whereas the industries that tend to have a higher number of women are Wholesale Trade (100.0%), Information (100.0%), and Educational Services (100.0%).
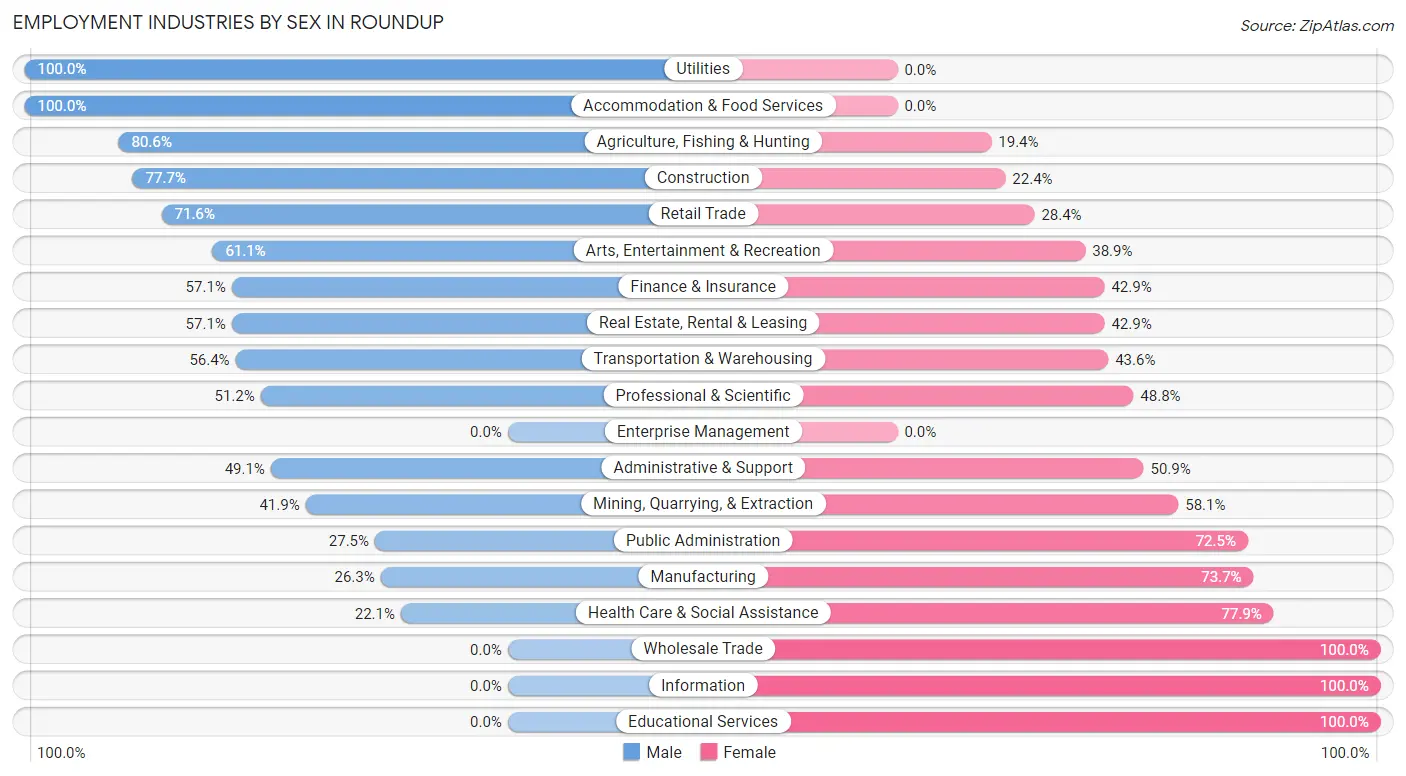
| Industry | Male | Female |
| Agriculture, Fishing & Hunting | 29 (80.6%) | 7 (19.4%) |
| Mining, Quarrying, & Extraction | 36 (41.9%) | 50 (58.1%) |
| Construction | 66 (77.6%) | 19 (22.4%) |
| Manufacturing | 10 (26.3%) | 28 (73.7%) |
| Wholesale Trade | 0 (0.0%) | 8 (100.0%) |
| Retail Trade | 48 (71.6%) | 19 (28.4%) |
| Transportation & Warehousing | 31 (56.4%) | 24 (43.6%) |
| Utilities | 5 (100.0%) | 0 (0.0%) |
| Information | 0 (0.0%) | 4 (100.0%) |
| Finance & Insurance | 8 (57.1%) | 6 (42.9%) |
| Real Estate, Rental & Leasing | 8 (57.1%) | 6 (42.9%) |
| Professional & Scientific | 22 (51.2%) | 21 (48.8%) |
| Enterprise Management | 0 (0.0%) | 0 (0.0%) |
| Administrative & Support | 26 (49.1%) | 27 (50.9%) |
| Educational Services | 0 (0.0%) | 13 (100.0%) |
| Health Care & Social Assistance | 27 (22.1%) | 95 (77.9%) |
| Arts, Entertainment & Recreation | 11 (61.1%) | 7 (38.9%) |
| Accommodation & Food Services | 24 (100.0%) | 0 (0.0%) |
| Public Administration | 11 (27.5%) | 29 (72.5%) |
| Total | 406 (51.3%) | 385 (48.7%) |
Education in Roundup
School Enrollment in Roundup
The most common levels of schooling among the 336 students in Roundup are high school (100 | 29.8%), elementary school (97 | 28.9%), and middle school (94 | 28.0%).
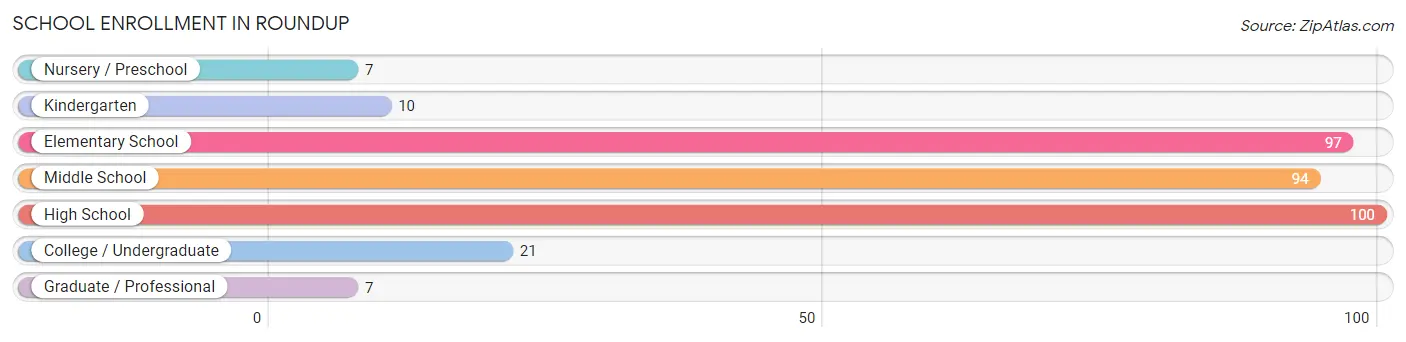
| School Level | # Students | % Students |
| Nursery / Preschool | 7 | 2.1% |
| Kindergarten | 10 | 3.0% |
| Elementary School | 97 | 28.9% |
| Middle School | 94 | 28.0% |
| High School | 100 | 29.8% |
| College / Undergraduate | 21 | 6.2% |
| Graduate / Professional | 7 | 2.1% |
| Total | 336 | 100.0% |
School Enrollment by Age by Funding Source in Roundup
Out of a total of 336 students who are enrolled in schools in Roundup, 37 (11.0%) attend a private institution, while the remaining 299 (89.0%) are enrolled in public schools. The age group of 35 years and over has the highest likelihood of being enrolled in private schools, with 19 (100.0% in the age bracket) enrolled. Conversely, the age group of 15 to 17 year olds has the lowest likelihood of being enrolled in a private school, with 92 (100.0% in the age bracket) attending a public institution.
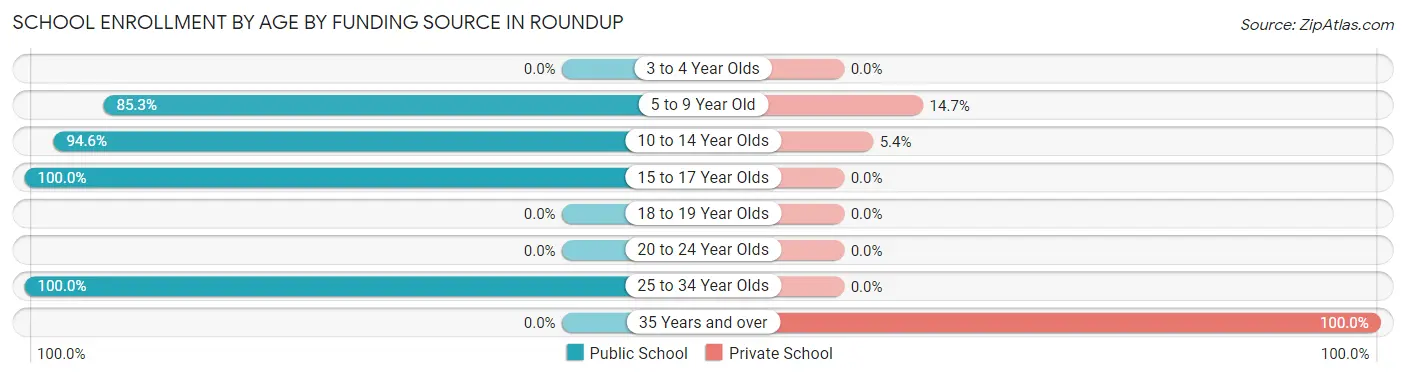
| Age Bracket | Public School | Private School |
| 3 to 4 Year Olds | 0 (0.0%) | 0 (0.0%) |
| 5 to 9 Year Old | 58 (85.3%) | 10 (14.7%) |
| 10 to 14 Year Olds | 140 (94.6%) | 8 (5.4%) |
| 15 to 17 Year Olds | 92 (100.0%) | 0 (0.0%) |
| 18 to 19 Year Olds | 0 (0.0%) | 0 (0.0%) |
| 20 to 24 Year Olds | 0 (0.0%) | 0 (0.0%) |
| 25 to 34 Year Olds | 9 (100.0%) | 0 (0.0%) |
| 35 Years and over | 0 (0.0%) | 19 (100.0%) |
| Total | 299 (89.0%) | 37 (11.0%) |
Educational Attainment by Field of Study in Roundup
Education (44 | 24.0%), bio, nature & agricultural (31 | 16.9%), business (23 | 12.6%), liberal arts & history (21 | 11.5%), and science & technology (18 | 9.8%) are the most common fields of study among 183 individuals in Roundup who have obtained a bachelor's degree or higher.
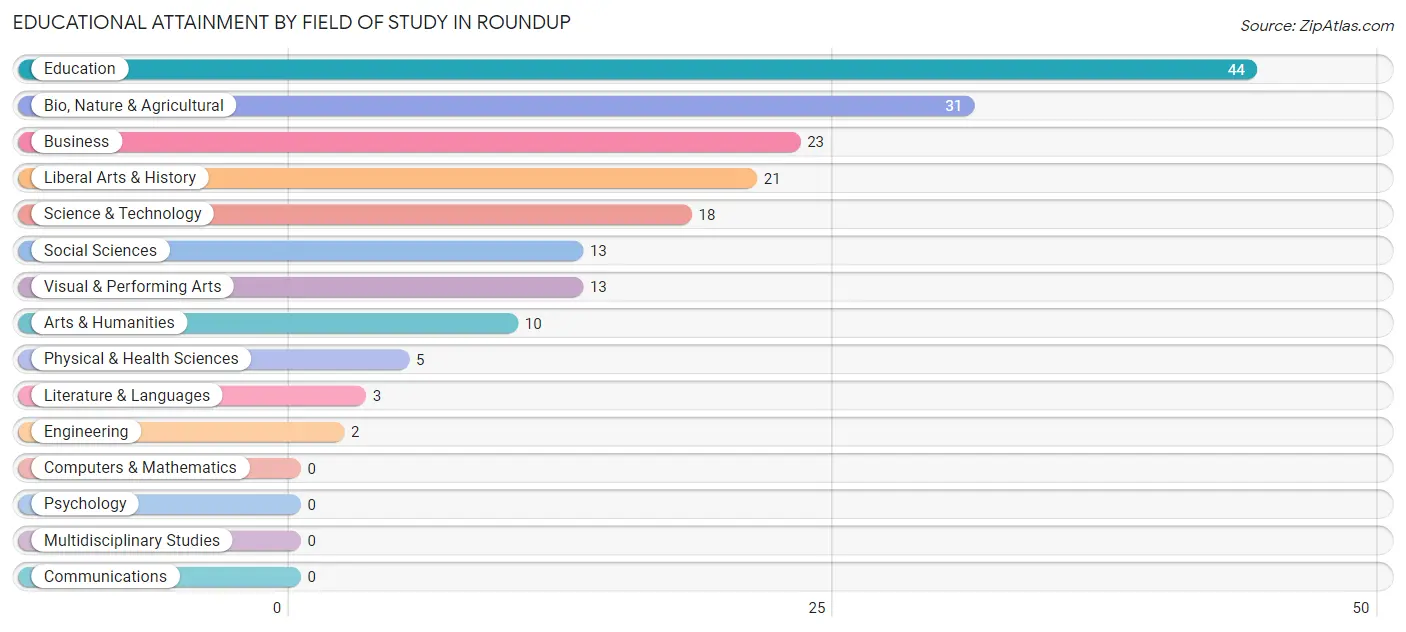
| Field of Study | # Graduates | % Graduates |
| Computers & Mathematics | 0 | 0.0% |
| Bio, Nature & Agricultural | 31 | 16.9% |
| Physical & Health Sciences | 5 | 2.7% |
| Psychology | 0 | 0.0% |
| Social Sciences | 13 | 7.1% |
| Engineering | 2 | 1.1% |
| Multidisciplinary Studies | 0 | 0.0% |
| Science & Technology | 18 | 9.8% |
| Business | 23 | 12.6% |
| Education | 44 | 24.0% |
| Literature & Languages | 3 | 1.6% |
| Liberal Arts & History | 21 | 11.5% |
| Visual & Performing Arts | 13 | 7.1% |
| Communications | 0 | 0.0% |
| Arts & Humanities | 10 | 5.5% |
| Total | 183 | 100.0% |
Transportation & Commute in Roundup
Vehicle Availability by Sex in Roundup
The most prevalent vehicle ownership categories in Roundup are males with 3 vehicles (170, accounting for 43.1%) and females with 3 vehicles (162, making up 47.6%).
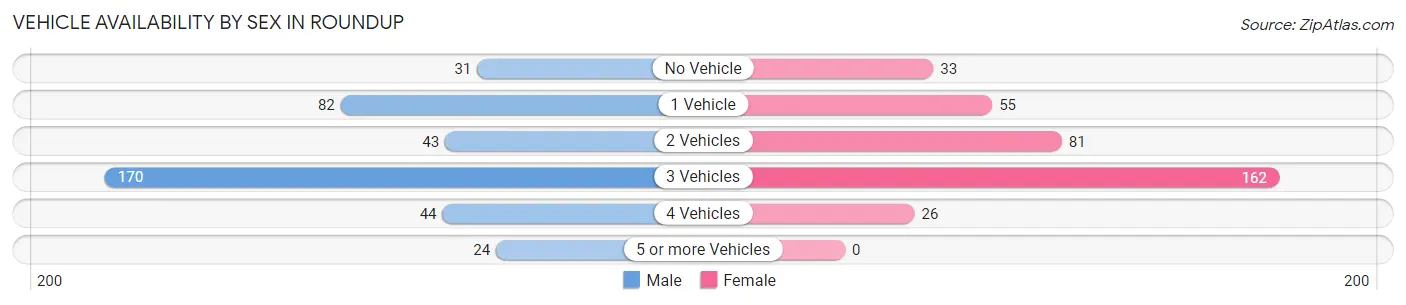
| Vehicles Available | Male | Female |
| No Vehicle | 31 (7.9%) | 33 (9.2%) |
| 1 Vehicle | 82 (20.8%) | 55 (15.4%) |
| 2 Vehicles | 43 (10.9%) | 81 (22.7%) |
| 3 Vehicles | 170 (43.1%) | 162 (45.4%) |
| 4 Vehicles | 44 (11.2%) | 26 (7.3%) |
| 5 or more Vehicles | 24 (6.1%) | 0 (0.0%) |
| Total | 394 (100.0%) | 357 (100.0%) |
Commute Time in Roundup
The most frequently occuring commute durations in Roundup are 5 to 9 minutes (226 commuters, 34.9%), less than 5 minutes (154 commuters, 23.8%), and 60 to 89 minutes (100 commuters, 15.5%).
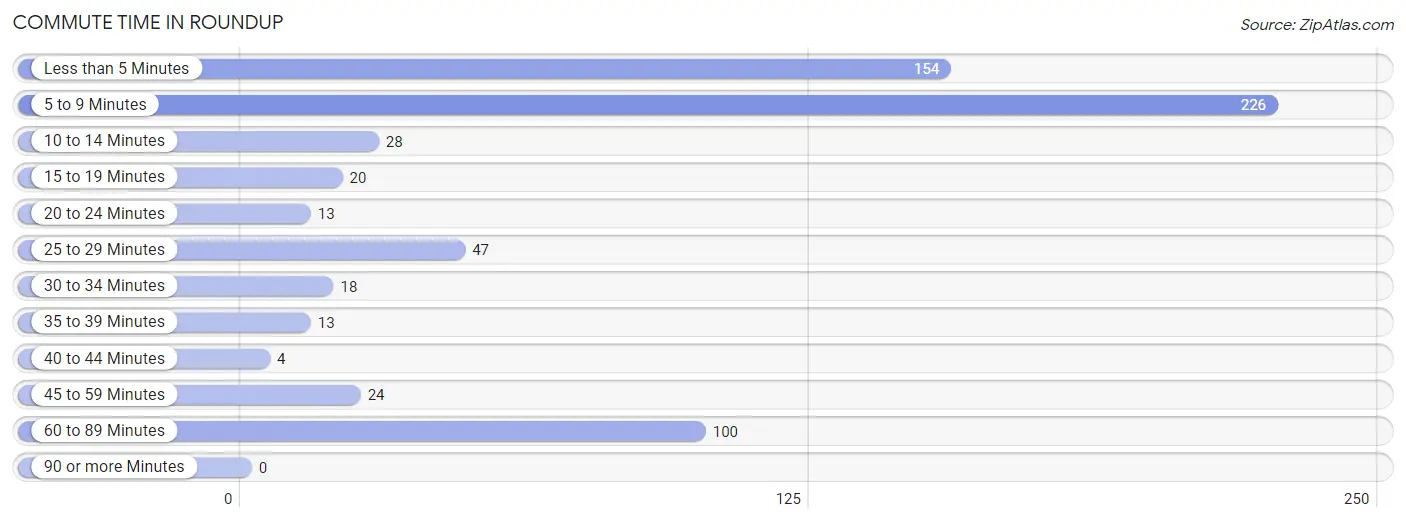
| Commute Time | # Commuters | % Commuters |
| Less than 5 Minutes | 154 | 23.8% |
| 5 to 9 Minutes | 226 | 34.9% |
| 10 to 14 Minutes | 28 | 4.3% |
| 15 to 19 Minutes | 20 | 3.1% |
| 20 to 24 Minutes | 13 | 2.0% |
| 25 to 29 Minutes | 47 | 7.3% |
| 30 to 34 Minutes | 18 | 2.8% |
| 35 to 39 Minutes | 13 | 2.0% |
| 40 to 44 Minutes | 4 | 0.6% |
| 45 to 59 Minutes | 24 | 3.7% |
| 60 to 89 Minutes | 100 | 15.5% |
| 90 or more Minutes | 0 | 0.0% |
Commute Time by Sex in Roundup
The most common commute times in Roundup are 5 to 9 minutes (121 commuters, 34.2%) for males and 5 to 9 minutes (105 commuters, 35.8%) for females.
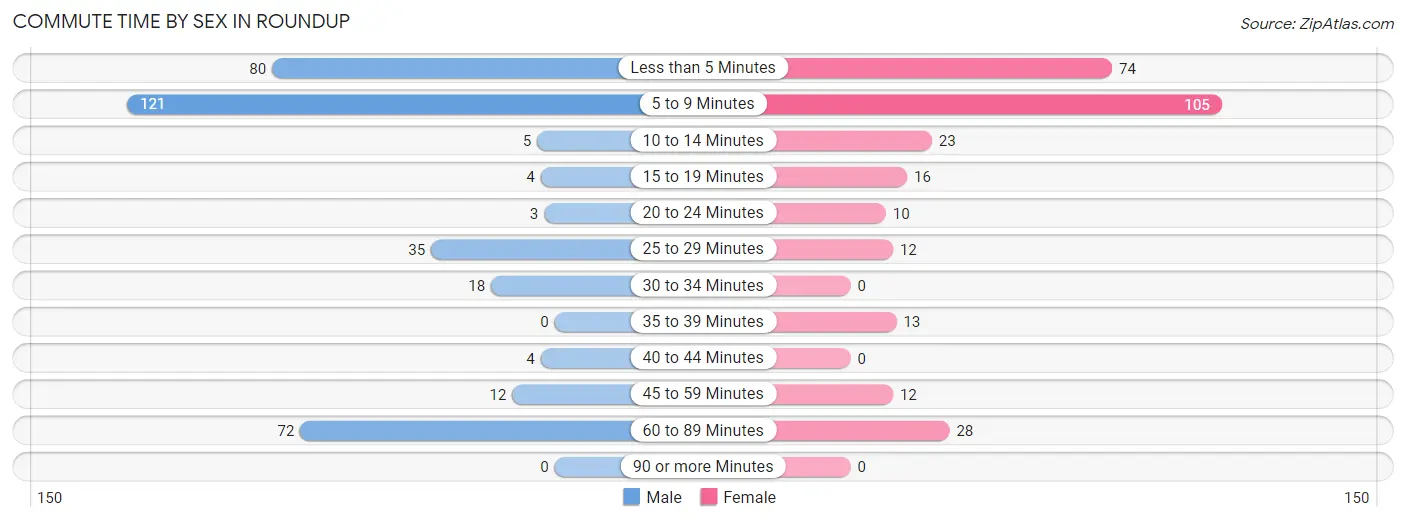
| Commute Time | Male | Female |
| Less than 5 Minutes | 80 (22.6%) | 74 (25.3%) |
| 5 to 9 Minutes | 121 (34.2%) | 105 (35.8%) |
| 10 to 14 Minutes | 5 (1.4%) | 23 (7.9%) |
| 15 to 19 Minutes | 4 (1.1%) | 16 (5.5%) |
| 20 to 24 Minutes | 3 (0.9%) | 10 (3.4%) |
| 25 to 29 Minutes | 35 (9.9%) | 12 (4.1%) |
| 30 to 34 Minutes | 18 (5.1%) | 0 (0.0%) |
| 35 to 39 Minutes | 0 (0.0%) | 13 (4.4%) |
| 40 to 44 Minutes | 4 (1.1%) | 0 (0.0%) |
| 45 to 59 Minutes | 12 (3.4%) | 12 (4.1%) |
| 60 to 89 Minutes | 72 (20.3%) | 28 (9.6%) |
| 90 or more Minutes | 0 (0.0%) | 0 (0.0%) |
Time of Departure to Work by Sex in Roundup
The most frequent times of departure to work in Roundup are 5:00 AM to 5:29 AM (59, 16.7%) for males and 7:30 AM to 7:59 AM (54, 18.4%) for females.
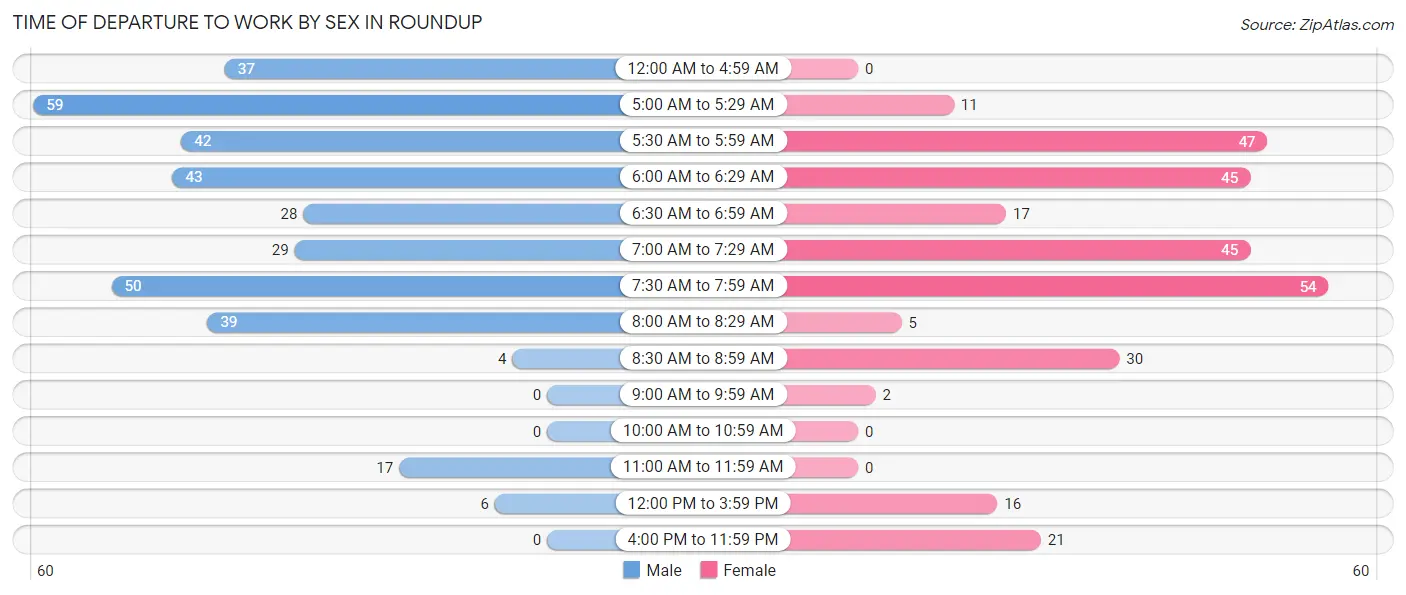
| Time of Departure | Male | Female |
| 12:00 AM to 4:59 AM | 37 (10.4%) | 0 (0.0%) |
| 5:00 AM to 5:29 AM | 59 (16.7%) | 11 (3.7%) |
| 5:30 AM to 5:59 AM | 42 (11.9%) | 47 (16.0%) |
| 6:00 AM to 6:29 AM | 43 (12.1%) | 45 (15.4%) |
| 6:30 AM to 6:59 AM | 28 (7.9%) | 17 (5.8%) |
| 7:00 AM to 7:29 AM | 29 (8.2%) | 45 (15.4%) |
| 7:30 AM to 7:59 AM | 50 (14.1%) | 54 (18.4%) |
| 8:00 AM to 8:29 AM | 39 (11.0%) | 5 (1.7%) |
| 8:30 AM to 8:59 AM | 4 (1.1%) | 30 (10.2%) |
| 9:00 AM to 9:59 AM | 0 (0.0%) | 2 (0.7%) |
| 10:00 AM to 10:59 AM | 0 (0.0%) | 0 (0.0%) |
| 11:00 AM to 11:59 AM | 17 (4.8%) | 0 (0.0%) |
| 12:00 PM to 3:59 PM | 6 (1.7%) | 16 (5.5%) |
| 4:00 PM to 11:59 PM | 0 (0.0%) | 21 (7.2%) |
| Total | 354 (100.0%) | 293 (100.0%) |
Housing Occupancy in Roundup
Occupancy by Ownership in Roundup
Of the total 842 dwellings in Roundup, owner-occupied units account for 618 (73.4%), while renter-occupied units make up 224 (26.6%).
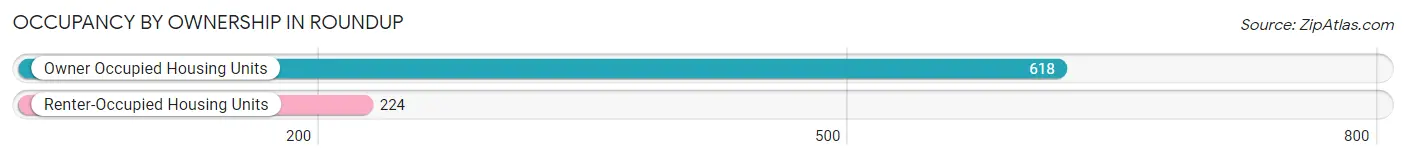
| Occupancy | # Housing Units | % Housing Units |
| Owner Occupied Housing Units | 618 | 73.4% |
| Renter-Occupied Housing Units | 224 | 26.6% |
| Total Occupied Housing Units | 842 | 100.0% |
Occupancy by Household Size in Roundup
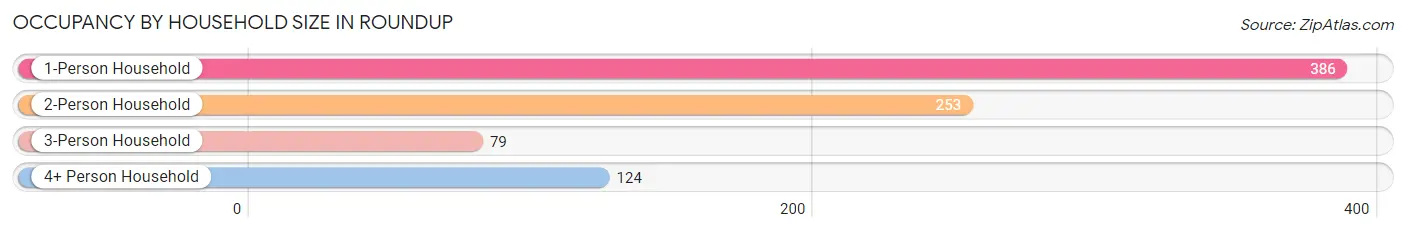
| Household Size | # Housing Units | % Housing Units |
| 1-Person Household | 386 | 45.8% |
| 2-Person Household | 253 | 30.0% |
| 3-Person Household | 79 | 9.4% |
| 4+ Person Household | 124 | 14.7% |
| Total Housing Units | 842 | 100.0% |
Occupancy by Ownership by Household Size in Roundup
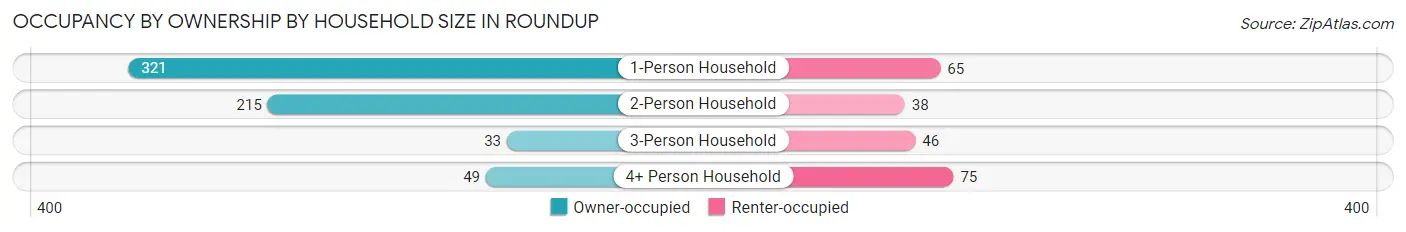
| Household Size | Owner-occupied | Renter-occupied |
| 1-Person Household | 321 (83.2%) | 65 (16.8%) |
| 2-Person Household | 215 (85.0%) | 38 (15.0%) |
| 3-Person Household | 33 (41.8%) | 46 (58.2%) |
| 4+ Person Household | 49 (39.5%) | 75 (60.5%) |
| Total Housing Units | 618 (73.4%) | 224 (26.6%) |
Occupancy by Educational Attainment in Roundup
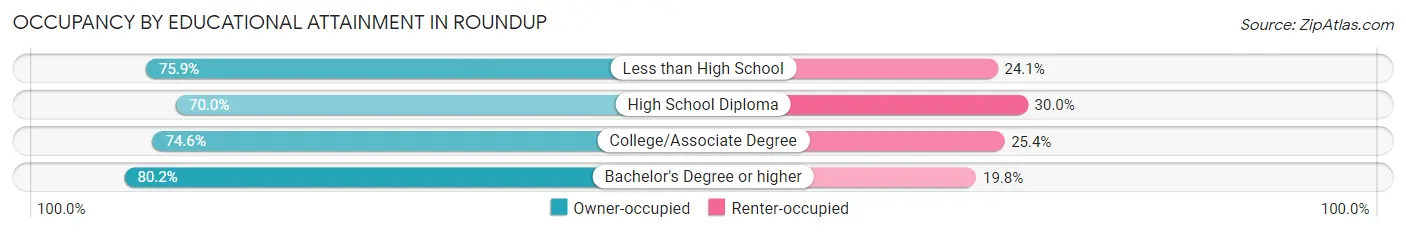
| Household Size | Owner-occupied | Renter-occupied |
| Less than High School | 82 (75.9%) | 26 (24.1%) |
| High School Diploma | 261 (70.0%) | 112 (30.0%) |
| College/Associate Degree | 194 (74.6%) | 66 (25.4%) |
| Bachelor's Degree or higher | 81 (80.2%) | 20 (19.8%) |
Occupancy by Age of Householder in Roundup
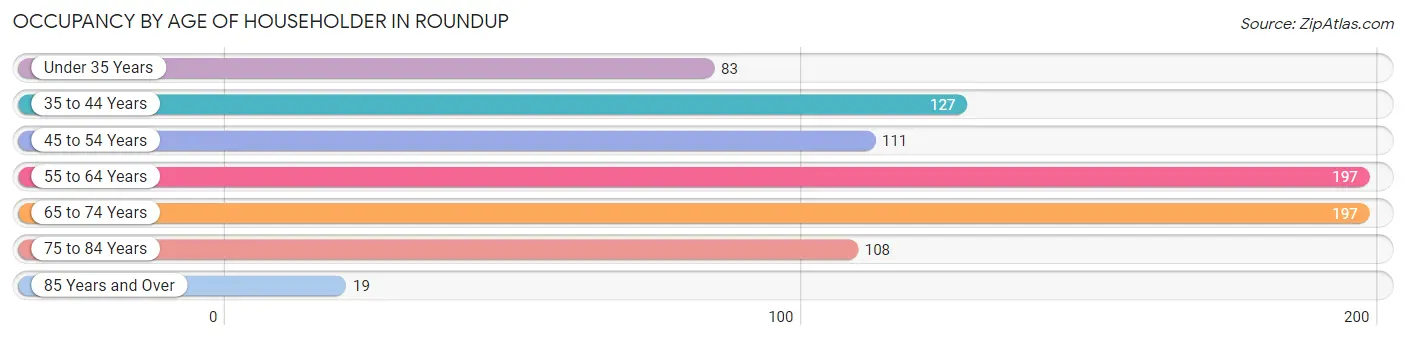
| Age Bracket | # Households | % Households |
| Under 35 Years | 83 | 9.9% |
| 35 to 44 Years | 127 | 15.1% |
| 45 to 54 Years | 111 | 13.2% |
| 55 to 64 Years | 197 | 23.4% |
| 65 to 74 Years | 197 | 23.4% |
| 75 to 84 Years | 108 | 12.8% |
| 85 Years and Over | 19 | 2.3% |
| Total | 842 | 100.0% |
Housing Finances in Roundup
Median Income by Occupancy in Roundup
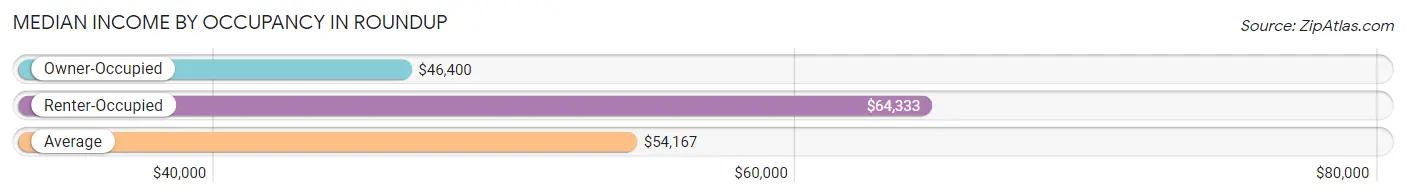
| Occupancy Type | # Households | Median Income |
| Owner-Occupied | 618 (73.4%) | $46,400 |
| Renter-Occupied | 224 (26.6%) | $64,333 |
| Average | 842 (100.0%) | $54,167 |
Occupancy by Householder Income Bracket in Roundup
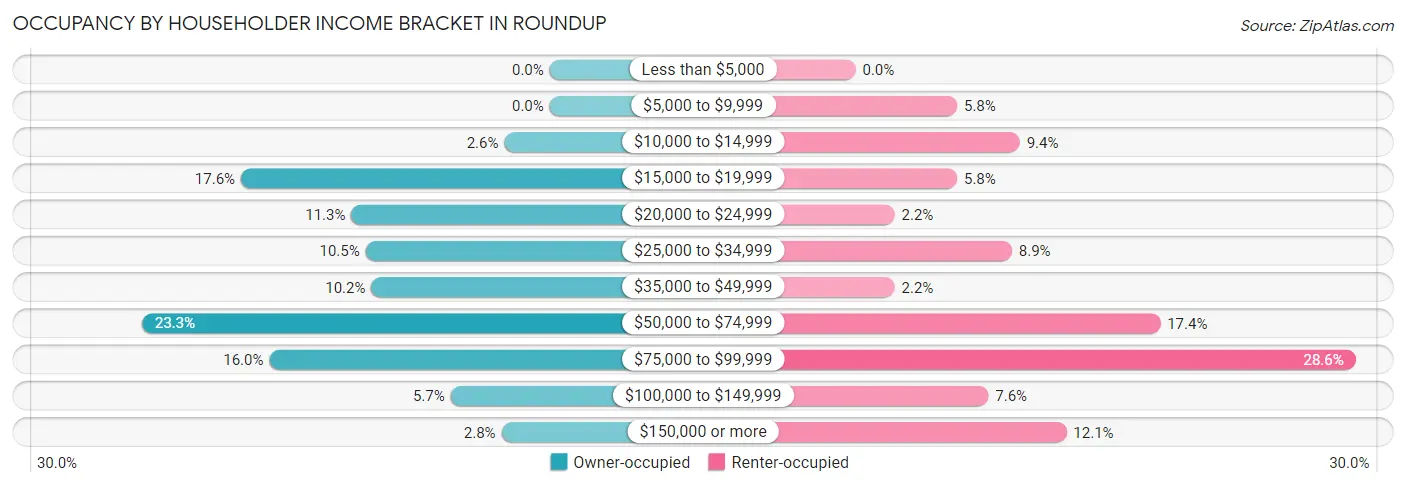
| Income Bracket | Owner-occupied | Renter-occupied |
| Less than $5,000 | 0 (0.0%) | 0 (0.0%) |
| $5,000 to $9,999 | 0 (0.0%) | 13 (5.8%) |
| $10,000 to $14,999 | 16 (2.6%) | 21 (9.4%) |
| $15,000 to $19,999 | 109 (17.6%) | 13 (5.8%) |
| $20,000 to $24,999 | 70 (11.3%) | 5 (2.2%) |
| $25,000 to $34,999 | 65 (10.5%) | 20 (8.9%) |
| $35,000 to $49,999 | 63 (10.2%) | 5 (2.2%) |
| $50,000 to $74,999 | 144 (23.3%) | 39 (17.4%) |
| $75,000 to $99,999 | 99 (16.0%) | 64 (28.6%) |
| $100,000 to $149,999 | 35 (5.7%) | 17 (7.6%) |
| $150,000 or more | 17 (2.8%) | 27 (12.0%) |
| Total | 618 (100.0%) | 224 (100.0%) |
Monthly Housing Cost Tiers in Roundup
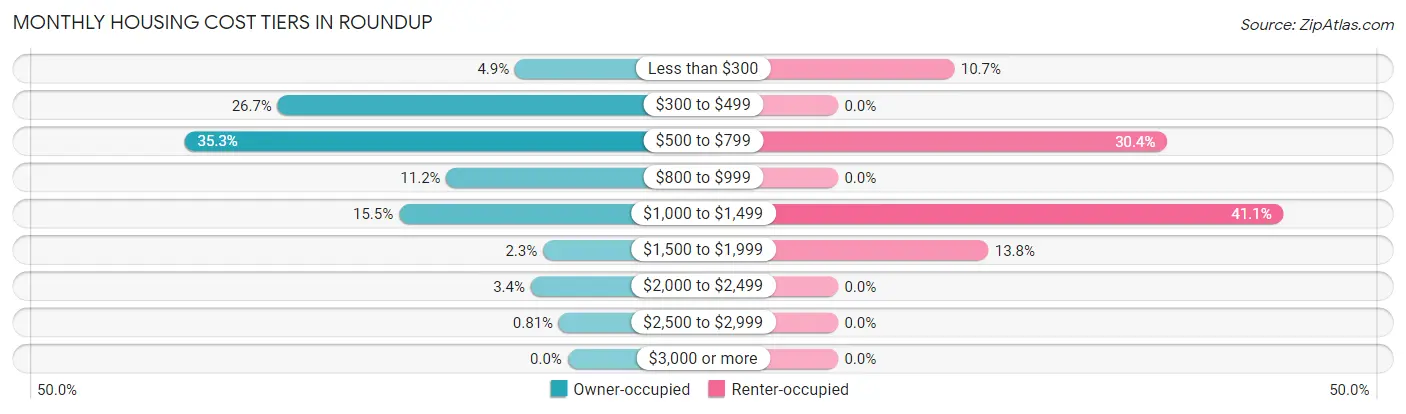
| Monthly Cost | Owner-occupied | Renter-occupied |
| Less than $300 | 30 (4.9%) | 24 (10.7%) |
| $300 to $499 | 165 (26.7%) | 0 (0.0%) |
| $500 to $799 | 218 (35.3%) | 68 (30.4%) |
| $800 to $999 | 69 (11.2%) | 0 (0.0%) |
| $1,000 to $1,499 | 96 (15.5%) | 92 (41.1%) |
| $1,500 to $1,999 | 14 (2.3%) | 31 (13.8%) |
| $2,000 to $2,499 | 21 (3.4%) | 0 (0.0%) |
| $2,500 to $2,999 | 5 (0.8%) | 0 (0.0%) |
| $3,000 or more | 0 (0.0%) | 0 (0.0%) |
| Total | 618 (100.0%) | 224 (100.0%) |
Physical Housing Characteristics in Roundup
Housing Structures in Roundup
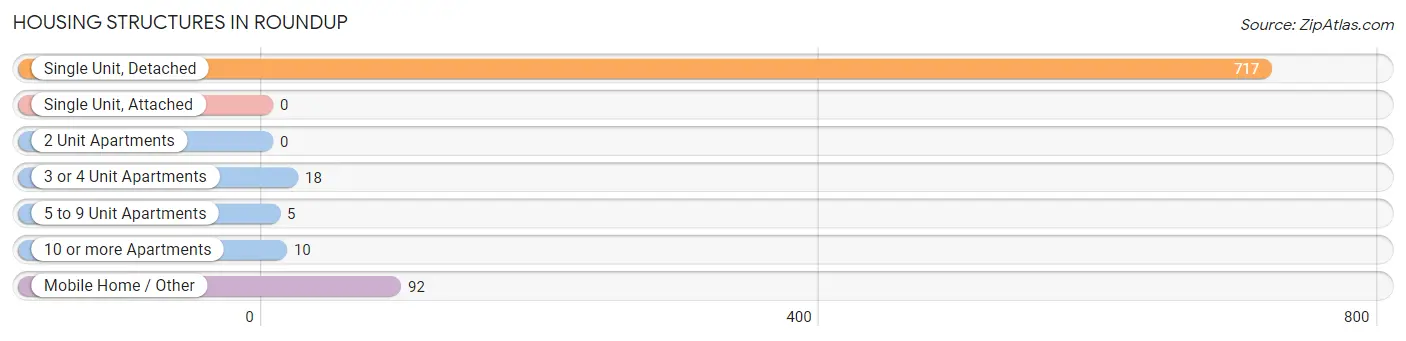
| Structure Type | # Housing Units | % Housing Units |
| Single Unit, Detached | 717 | 85.2% |
| Single Unit, Attached | 0 | 0.0% |
| 2 Unit Apartments | 0 | 0.0% |
| 3 or 4 Unit Apartments | 18 | 2.1% |
| 5 to 9 Unit Apartments | 5 | 0.6% |
| 10 or more Apartments | 10 | 1.2% |
| Mobile Home / Other | 92 | 10.9% |
| Total | 842 | 100.0% |
Housing Structures by Occupancy in Roundup
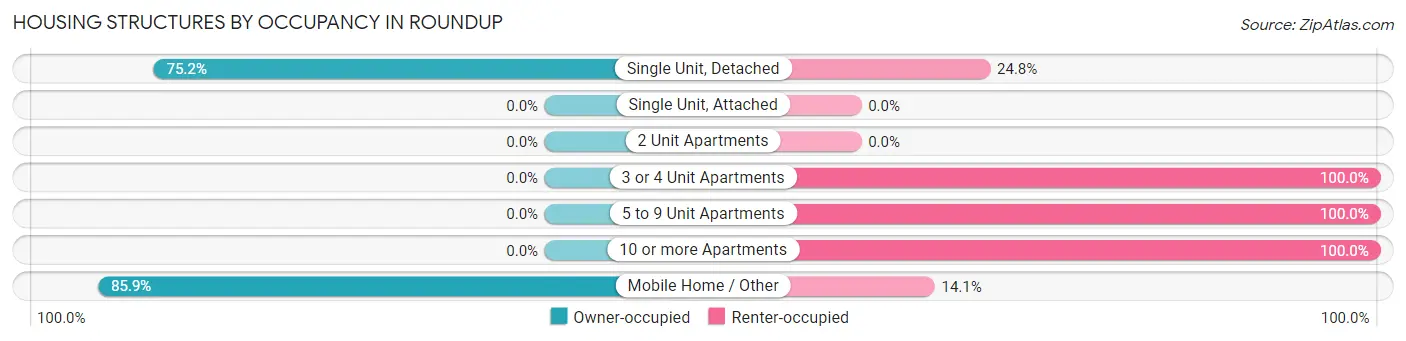
| Structure Type | Owner-occupied | Renter-occupied |
| Single Unit, Detached | 539 (75.2%) | 178 (24.8%) |
| Single Unit, Attached | 0 (0.0%) | 0 (0.0%) |
| 2 Unit Apartments | 0 (0.0%) | 0 (0.0%) |
| 3 or 4 Unit Apartments | 0 (0.0%) | 18 (100.0%) |
| 5 to 9 Unit Apartments | 0 (0.0%) | 5 (100.0%) |
| 10 or more Apartments | 0 (0.0%) | 10 (100.0%) |
| Mobile Home / Other | 79 (85.9%) | 13 (14.1%) |
| Total | 618 (73.4%) | 224 (26.6%) |
Housing Structures by Number of Rooms in Roundup
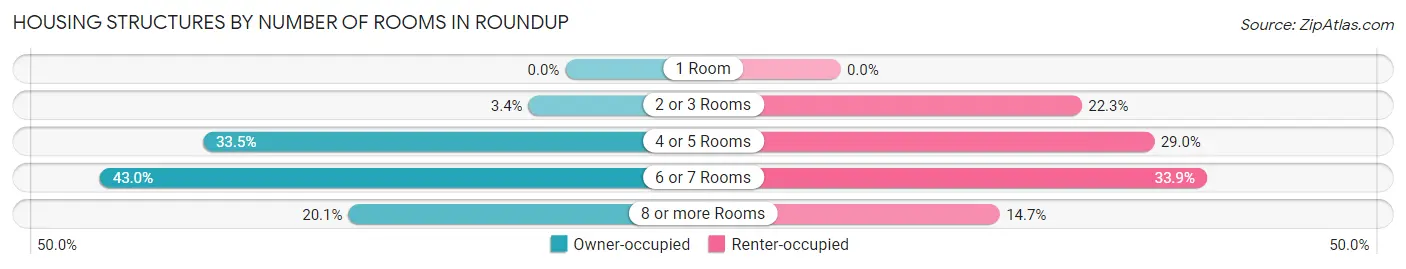
| Number of Rooms | Owner-occupied | Renter-occupied |
| 1 Room | 0 (0.0%) | 0 (0.0%) |
| 2 or 3 Rooms | 21 (3.4%) | 50 (22.3%) |
| 4 or 5 Rooms | 207 (33.5%) | 65 (29.0%) |
| 6 or 7 Rooms | 266 (43.0%) | 76 (33.9%) |
| 8 or more Rooms | 124 (20.1%) | 33 (14.7%) |
| Total | 618 (100.0%) | 224 (100.0%) |
Housing Structure by Heating Type in Roundup
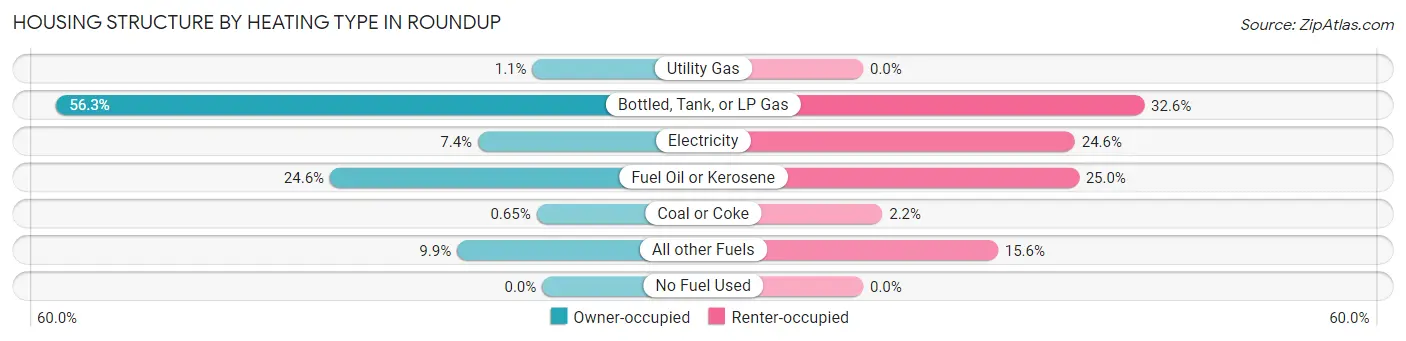
| Heating Type | Owner-occupied | Renter-occupied |
| Utility Gas | 7 (1.1%) | 0 (0.0%) |
| Bottled, Tank, or LP Gas | 348 (56.3%) | 73 (32.6%) |
| Electricity | 46 (7.4%) | 55 (24.5%) |
| Fuel Oil or Kerosene | 152 (24.6%) | 56 (25.0%) |
| Coal or Coke | 4 (0.6%) | 5 (2.2%) |
| All other Fuels | 61 (9.9%) | 35 (15.6%) |
| No Fuel Used | 0 (0.0%) | 0 (0.0%) |
| Total | 618 (100.0%) | 224 (100.0%) |
Household Vehicle Usage in Roundup
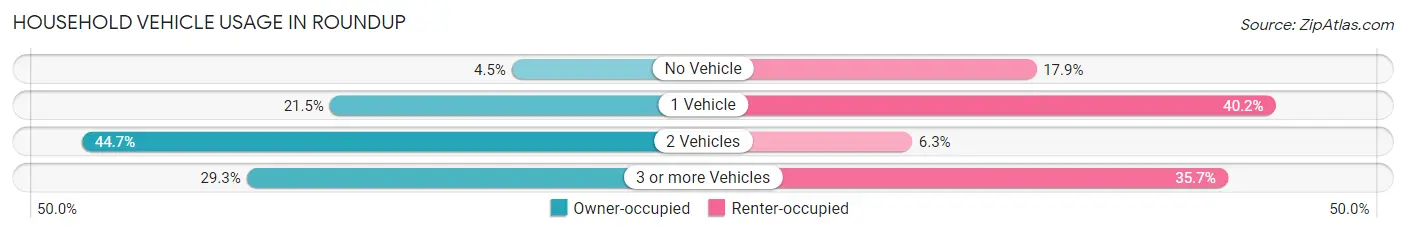
| Vehicles per Household | Owner-occupied | Renter-occupied |
| No Vehicle | 28 (4.5%) | 40 (17.9%) |
| 1 Vehicle | 133 (21.5%) | 90 (40.2%) |
| 2 Vehicles | 276 (44.7%) | 14 (6.2%) |
| 3 or more Vehicles | 181 (29.3%) | 80 (35.7%) |
| Total | 618 (100.0%) | 224 (100.0%) |
Real Estate & Mortgages in Roundup
Real Estate and Mortgage Overview in Roundup
| Characteristic | Without Mortgage | With Mortgage |
| Housing Units | 398 | 220 |
| Median Property Value | $100,600 | $129,300 |
| Median Household Income | $32,083 | $5 |
| Monthly Housing Costs | $514 | $0 |
| Real Estate Taxes | $1,644 | $28 |
Property Value by Mortgage Status in Roundup
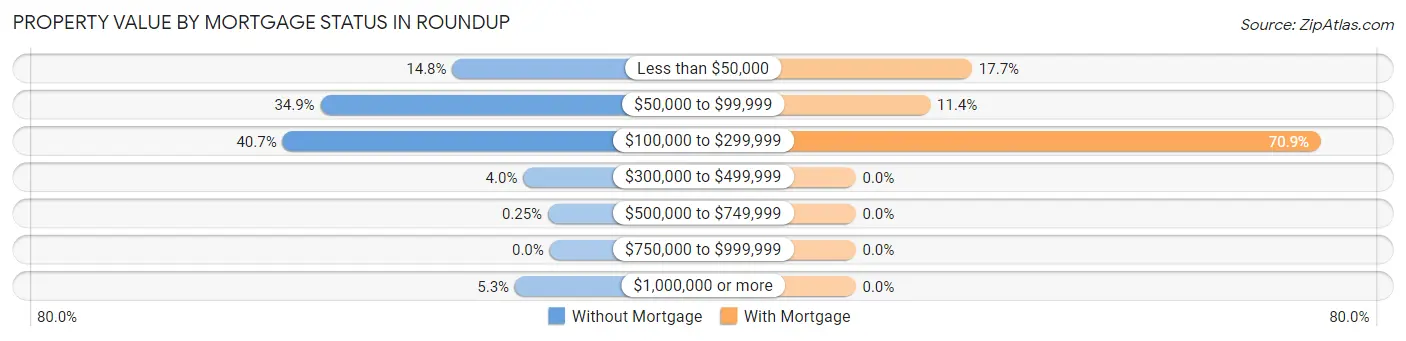
| Property Value | Without Mortgage | With Mortgage |
| Less than $50,000 | 59 (14.8%) | 39 (17.7%) |
| $50,000 to $99,999 | 139 (34.9%) | 25 (11.4%) |
| $100,000 to $299,999 | 162 (40.7%) | 156 (70.9%) |
| $300,000 to $499,999 | 16 (4.0%) | 0 (0.0%) |
| $500,000 to $749,999 | 1 (0.3%) | 0 (0.0%) |
| $750,000 to $999,999 | 0 (0.0%) | 0 (0.0%) |
| $1,000,000 or more | 21 (5.3%) | 0 (0.0%) |
| Total | 398 (100.0%) | 220 (100.0%) |
Household Income by Mortgage Status in Roundup
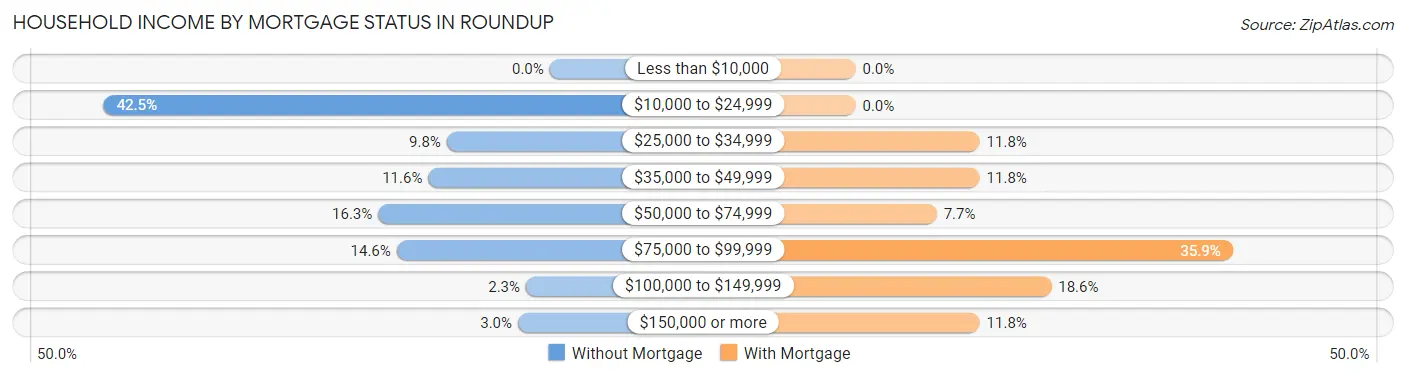
| Household Income | Without Mortgage | With Mortgage |
| Less than $10,000 | 0 (0.0%) | 0 (0.0%) |
| $10,000 to $24,999 | 169 (42.5%) | 0 (0.0%) |
| $25,000 to $34,999 | 39 (9.8%) | 26 (11.8%) |
| $35,000 to $49,999 | 46 (11.6%) | 26 (11.8%) |
| $50,000 to $74,999 | 65 (16.3%) | 17 (7.7%) |
| $75,000 to $99,999 | 58 (14.6%) | 79 (35.9%) |
| $100,000 to $149,999 | 9 (2.3%) | 41 (18.6%) |
| $150,000 or more | 12 (3.0%) | 26 (11.8%) |
| Total | 398 (100.0%) | 220 (100.0%) |
Property Value to Household Income Ratio in Roundup
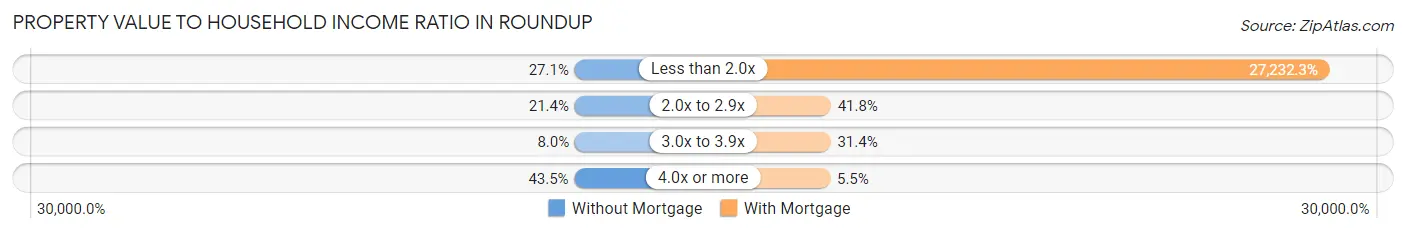
| Value-to-Income Ratio | Without Mortgage | With Mortgage |
| Less than 2.0x | 108 (27.1%) | 59,911 (27,232.3%) |
| 2.0x to 2.9x | 85 (21.4%) | 92 (41.8%) |
| 3.0x to 3.9x | 32 (8.0%) | 69 (31.4%) |
| 4.0x or more | 173 (43.5%) | 12 (5.4%) |
| Total | 398 (100.0%) | 220 (100.0%) |
Real Estate Taxes by Mortgage Status in Roundup
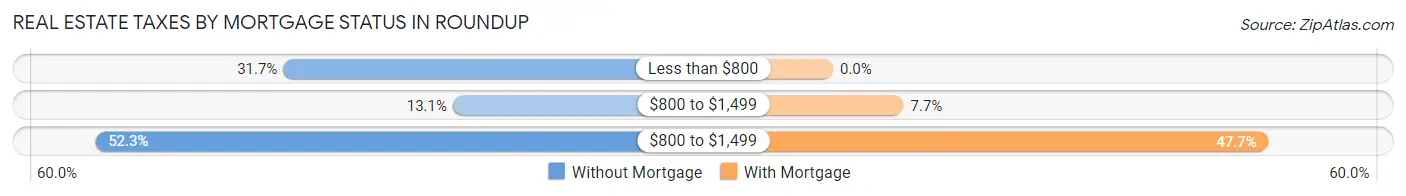
| Property Taxes | Without Mortgage | With Mortgage |
| Less than $800 | 126 (31.7%) | 0 (0.0%) |
| $800 to $1,499 | 52 (13.1%) | 17 (7.7%) |
| $800 to $1,499 | 208 (52.3%) | 105 (47.7%) |
| Total | 398 (100.0%) | 220 (100.0%) |
Health & Disability in Roundup
Health Insurance Coverage by Age in Roundup
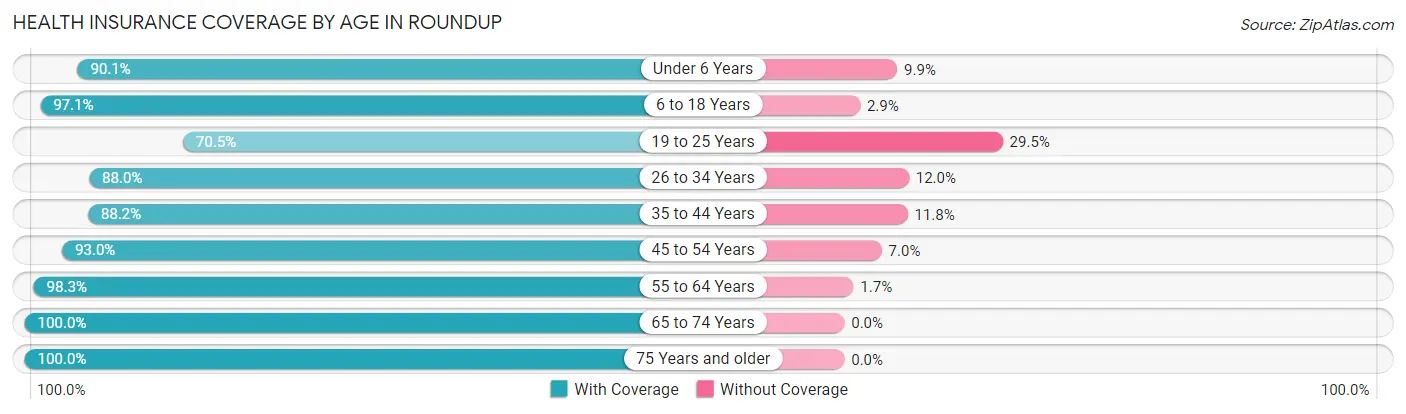
| Age Bracket | With Coverage | Without Coverage |
| Under 6 Years | 64 (90.1%) | 7 (9.9%) |
| 6 to 18 Years | 332 (97.1%) | 10 (2.9%) |
| 19 to 25 Years | 105 (70.5%) | 44 (29.5%) |
| 26 to 34 Years | 117 (88.0%) | 16 (12.0%) |
| 35 to 44 Years | 142 (88.2%) | 19 (11.8%) |
| 45 to 54 Years | 187 (93.0%) | 14 (7.0%) |
| 55 to 64 Years | 289 (98.3%) | 5 (1.7%) |
| 65 to 74 Years | 271 (100.0%) | 0 (0.0%) |
| 75 Years and older | 175 (100.0%) | 0 (0.0%) |
| Total | 1,682 (93.6%) | 115 (6.4%) |
Health Insurance Coverage by Citizenship Status in Roundup
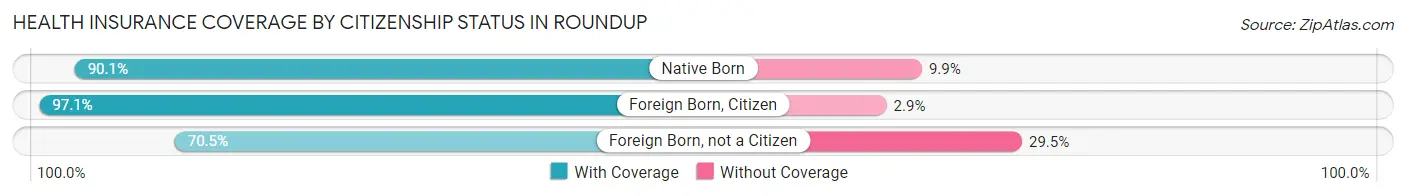
| Citizenship Status | With Coverage | Without Coverage |
| Native Born | 64 (90.1%) | 7 (9.9%) |
| Foreign Born, Citizen | 332 (97.1%) | 10 (2.9%) |
| Foreign Born, not a Citizen | 105 (70.5%) | 44 (29.5%) |
Health Insurance Coverage by Household Income in Roundup
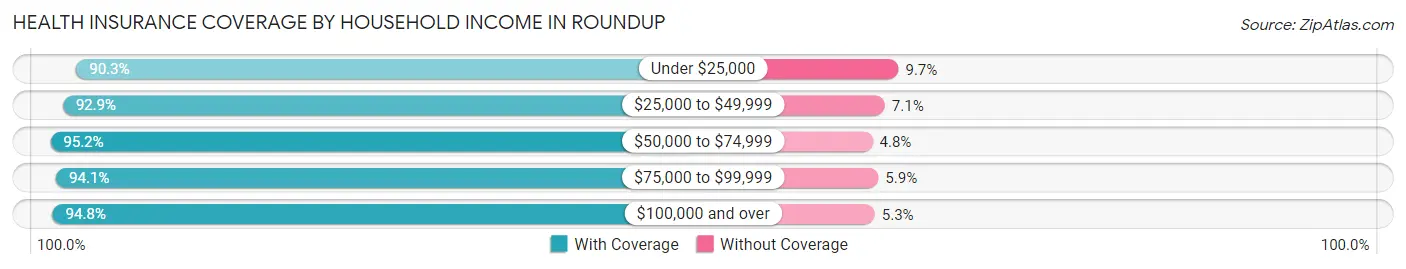
| Household Income | With Coverage | Without Coverage |
| Under $25,000 | 261 (90.3%) | 28 (9.7%) |
| $25,000 to $49,999 | 273 (92.9%) | 21 (7.1%) |
| $50,000 to $74,999 | 335 (95.2%) | 17 (4.8%) |
| $75,000 to $99,999 | 524 (94.1%) | 33 (5.9%) |
| $100,000 and over | 289 (94.8%) | 16 (5.2%) |
Public vs Private Health Insurance Coverage by Age in Roundup
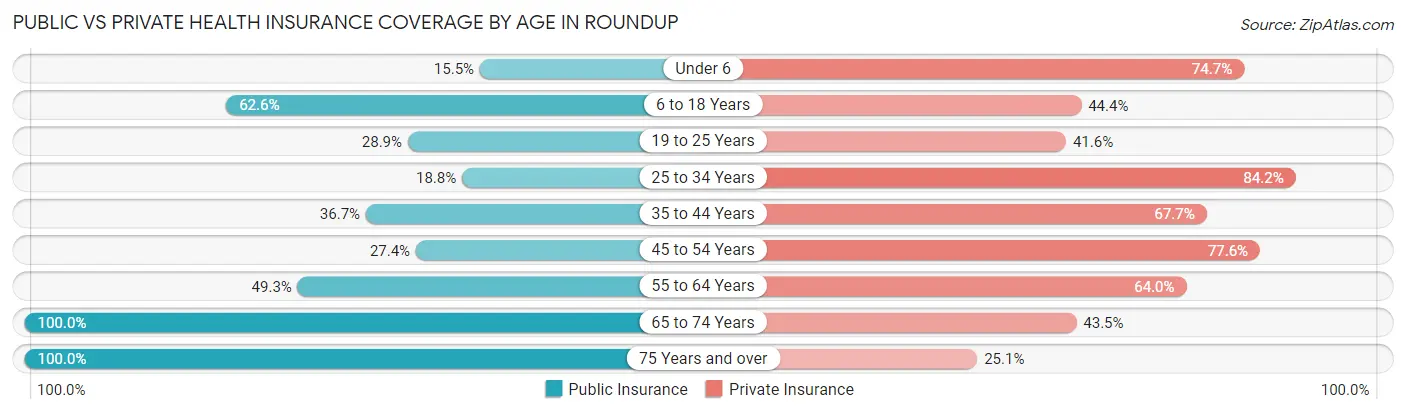
| Age Bracket | Public Insurance | Private Insurance |
| Under 6 | 11 (15.5%) | 53 (74.7%) |
| 6 to 18 Years | 214 (62.6%) | 152 (44.4%) |
| 19 to 25 Years | 43 (28.9%) | 62 (41.6%) |
| 25 to 34 Years | 25 (18.8%) | 112 (84.2%) |
| 35 to 44 Years | 59 (36.6%) | 109 (67.7%) |
| 45 to 54 Years | 55 (27.4%) | 156 (77.6%) |
| 55 to 64 Years | 145 (49.3%) | 188 (63.9%) |
| 65 to 74 Years | 271 (100.0%) | 118 (43.5%) |
| 75 Years and over | 175 (100.0%) | 44 (25.1%) |
| Total | 998 (55.5%) | 994 (55.3%) |
Disability Status by Sex by Age in Roundup
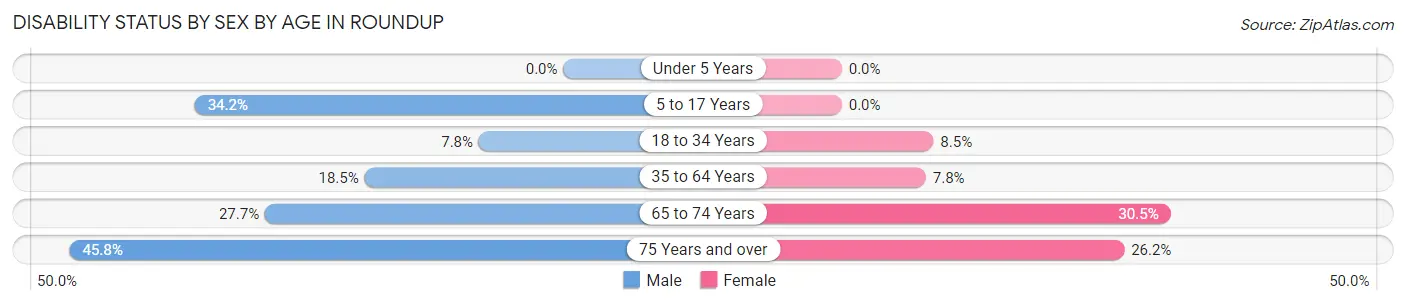
| Age Bracket | Male | Female |
| Under 5 Years | 0 (0.0%) | 0 (0.0%) |
| 5 to 17 Years | 52 (34.2%) | 0 (0.0%) |
| 18 to 34 Years | 12 (7.8%) | 13 (8.5%) |
| 35 to 64 Years | 69 (18.4%) | 22 (7.8%) |
| 65 to 74 Years | 36 (27.7%) | 43 (30.5%) |
| 75 Years and over | 33 (45.8%) | 27 (26.2%) |
Disability Class by Sex by Age in Roundup
Disability Class: Hearing Difficulty
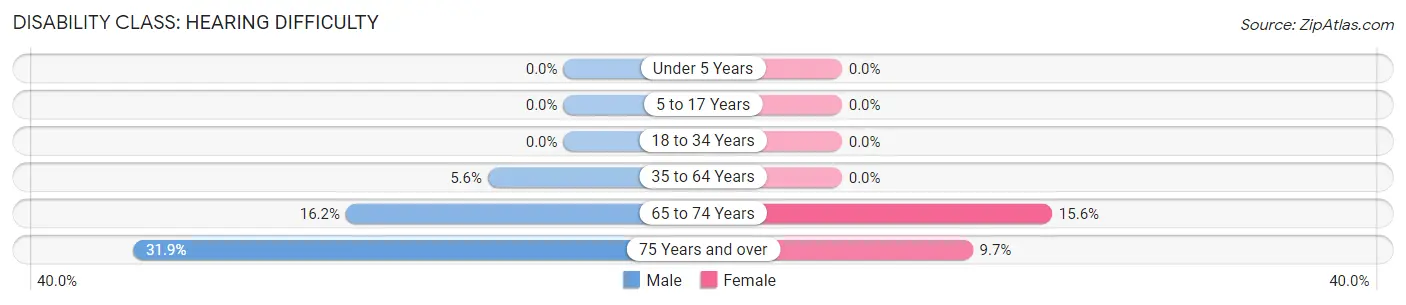
| Age Bracket | Male | Female |
| Under 5 Years | 0 (0.0%) | 0 (0.0%) |
| 5 to 17 Years | 0 (0.0%) | 0 (0.0%) |
| 18 to 34 Years | 0 (0.0%) | 0 (0.0%) |
| 35 to 64 Years | 21 (5.6%) | 0 (0.0%) |
| 65 to 74 Years | 21 (16.2%) | 22 (15.6%) |
| 75 Years and over | 23 (31.9%) | 10 (9.7%) |
Disability Class: Vision Difficulty
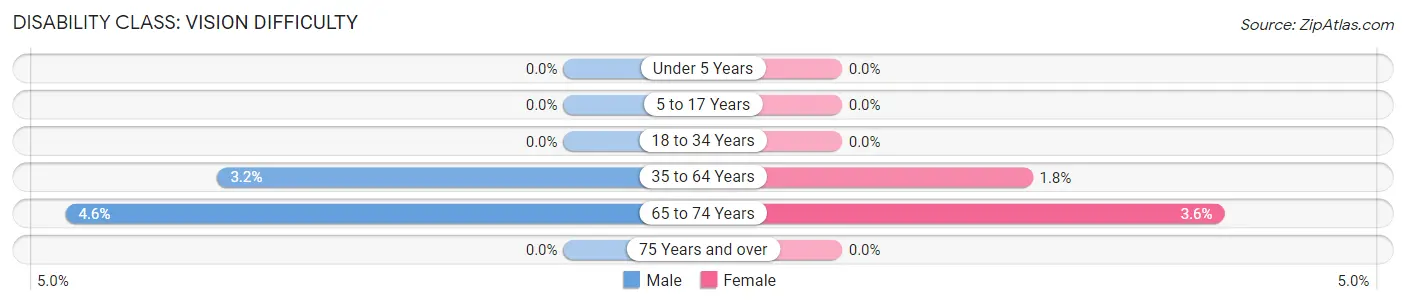
| Age Bracket | Male | Female |
| Under 5 Years | 0 (0.0%) | 0 (0.0%) |
| 5 to 17 Years | 0 (0.0%) | 0 (0.0%) |
| 18 to 34 Years | 0 (0.0%) | 0 (0.0%) |
| 35 to 64 Years | 12 (3.2%) | 5 (1.8%) |
| 65 to 74 Years | 6 (4.6%) | 5 (3.5%) |
| 75 Years and over | 0 (0.0%) | 0 (0.0%) |
Disability Class: Cognitive Difficulty
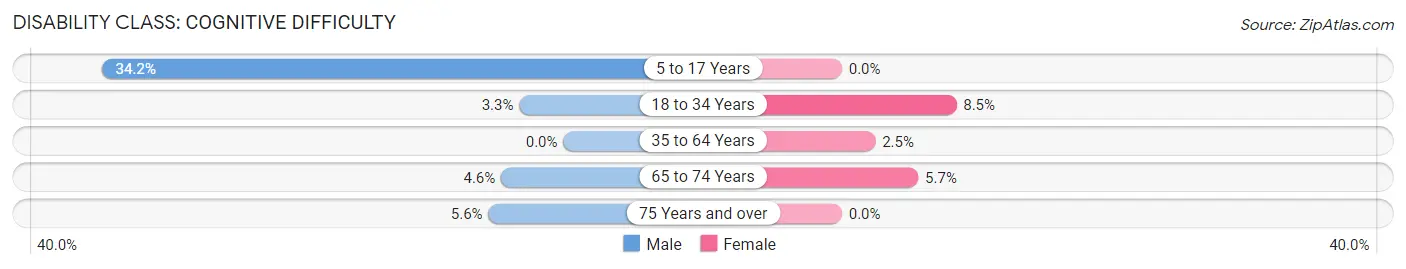
| Age Bracket | Male | Female |
| 5 to 17 Years | 52 (34.2%) | 0 (0.0%) |
| 18 to 34 Years | 5 (3.3%) | 13 (8.5%) |
| 35 to 64 Years | 0 (0.0%) | 7 (2.5%) |
| 65 to 74 Years | 6 (4.6%) | 8 (5.7%) |
| 75 Years and over | 4 (5.6%) | 0 (0.0%) |
Disability Class: Ambulatory Difficulty
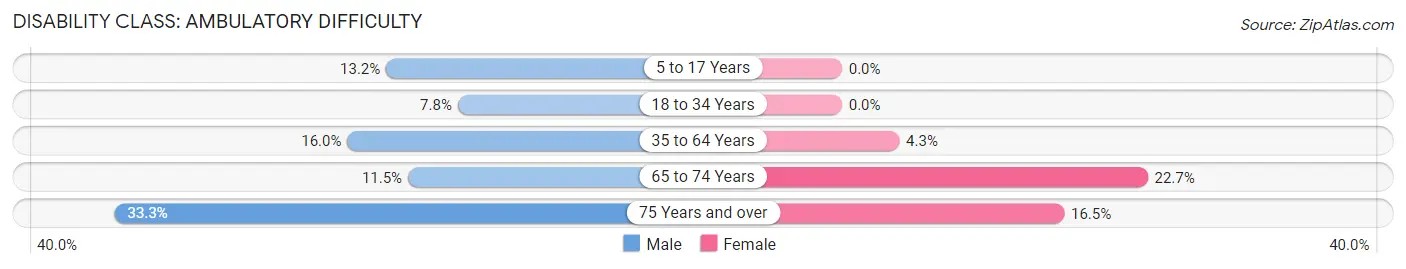
| Age Bracket | Male | Female |
| 5 to 17 Years | 20 (13.2%) | 0 (0.0%) |
| 18 to 34 Years | 12 (7.8%) | 0 (0.0%) |
| 35 to 64 Years | 60 (16.0%) | 12 (4.3%) |
| 65 to 74 Years | 15 (11.5%) | 32 (22.7%) |
| 75 Years and over | 24 (33.3%) | 17 (16.5%) |
Disability Class: Self-Care Difficulty
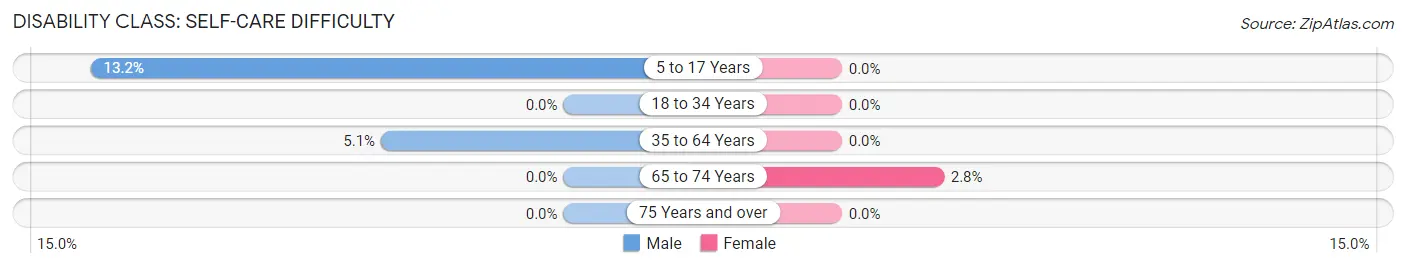
| Age Bracket | Male | Female |
| 5 to 17 Years | 20 (13.2%) | 0 (0.0%) |
| 18 to 34 Years | 0 (0.0%) | 0 (0.0%) |
| 35 to 64 Years | 19 (5.1%) | 0 (0.0%) |
| 65 to 74 Years | 0 (0.0%) | 4 (2.8%) |
| 75 Years and over | 0 (0.0%) | 0 (0.0%) |
Technology Access in Roundup
Computing Device Access in Roundup
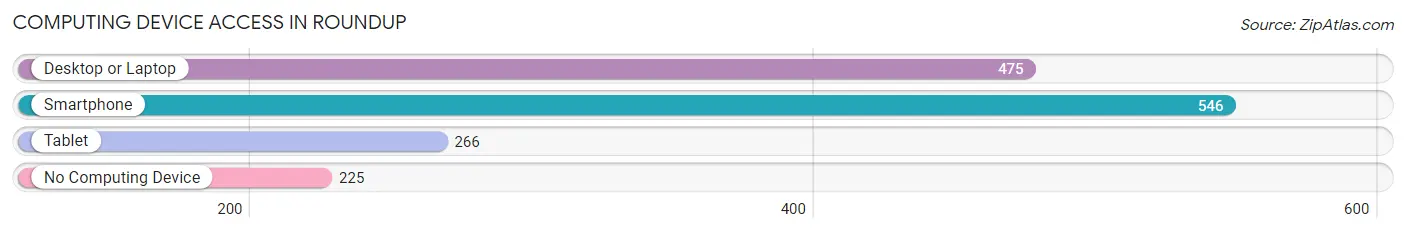
| Device Type | # Households | % Households |
| Desktop or Laptop | 475 | 56.4% |
| Smartphone | 546 | 64.8% |
| Tablet | 266 | 31.6% |
| No Computing Device | 225 | 26.7% |
| Total | 842 | 100.0% |
Internet Access in Roundup
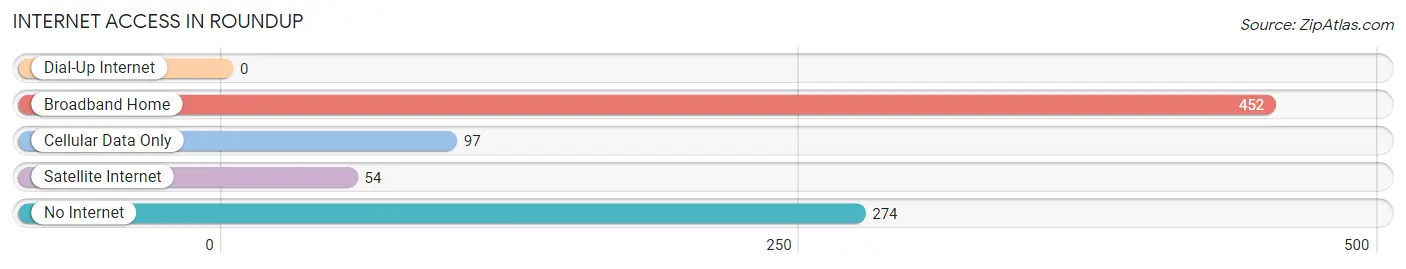
| Internet Type | # Households | % Households |
| Dial-Up Internet | 0 | 0.0% |
| Broadband Home | 452 | 53.7% |
| Cellular Data Only | 97 | 11.5% |
| Satellite Internet | 54 | 6.4% |
| No Internet | 274 | 32.5% |
| Total | 842 | 100.0% |
Roundup Summary
Roundup is a small city located in Musselshell County, Montana, United States. It is situated along the Musselshell River, approximately 50 miles northeast of Billings. The city was founded in 1882 and incorporated in 1910. As of the 2010 census, the population of Roundup was 2,300.
History
The area around Roundup was first settled in the late 1870s by ranchers and homesteaders. The town was founded in 1882 by the Northern Pacific Railway, which built a station there. The town was named after the cattle roundups that were held in the area.
In 1910, Roundup was incorporated as a city. The city grew rapidly in the early 20th century, and by the 1920s it had become a major agricultural center. The city was also home to several coal mines, which provided employment for many of the town's residents.
In the 1950s, Roundup began to experience a decline in population as many of its residents moved away in search of better economic opportunities. The city's population has remained relatively stable since then, and it continues to be a small agricultural center.
Geography
Roundup is located in Musselshell County, Montana, at an elevation of 3,400 feet. The city is situated along the Musselshell River, approximately 50 miles northeast of Billings. The city covers an area of 2.2 square miles, and has a total population of 2,300.
The climate in Roundup is semi-arid, with hot summers and cold winters. The average annual temperature is 48°F, and the average annual precipitation is 13.5 inches.
Economy
The economy of Roundup is largely based on agriculture. The city is home to several large farms, which produce a variety of crops, including wheat, barley, oats, and hay. The city is also home to several cattle ranches, which raise beef and dairy cattle.
In addition to agriculture, Roundup is home to several small businesses, including restaurants, retail stores, and service providers. The city is also home to a small manufacturing sector, which produces a variety of products, including furniture, clothing, and food products.
Demographics
As of the 2010 census, the population of Roundup was 2,300. The racial makeup of the city was 95.3% White, 0.3% African American, 0.7% Native American, 0.3% Asian, 0.1% Pacific Islander, 1.3% from other races, and 2.0% from two or more races. Hispanic or Latino of any race were 3.3% of the population.
The median household income in Roundup was $37,500, and the median family income was $45,000. The per capita income in the city was $18,000. About 11.3% of the population was below the poverty line.
Common Questions
What is Per Capita Income in Roundup?
Per Capita income in Roundup is $34,520.
What is the Median Family Income in Roundup?
Median Family Income in Roundup is $63,456.
What is the Median Household income in Roundup?
Median Household Income in Roundup is $54,167.
What is Income or Wage Gap in Roundup?
Income or Wage Gap in Roundup is 25.6%.
Women in Roundup earn 74.4 cents for every dollar earned by a man.
What is Inequality or Gini Index in Roundup?
Inequality or Gini Index in Roundup is 0.51.
What is the Total Population of Roundup?
Total Population of Roundup is 1,824.
What is the Total Male Population of Roundup?
Total Male Population of Roundup is 921.
What is the Total Female Population of Roundup?
Total Female Population of Roundup is 903.
What is the Ratio of Males per 100 Females in Roundup?
There are 101.99 Males per 100 Females in Roundup.
What is the Ratio of Females per 100 Males in Roundup?
There are 98.05 Females per 100 Males in Roundup.
What is the Median Population Age in Roundup?
Median Population Age in Roundup is 46.6 Years.
What is the Average Family Size in Roundup
Average Family Size in Roundup is 2.9 People.
What is the Average Household Size in Roundup
Average Household Size in Roundup is 2.1 People.
How Large is the Labor Force in Roundup?
There are 823 People in the Labor Forcein in Roundup.
What is the Percentage of People in the Labor Force in Roundup?
54.3% of People are in the Labor Force in Roundup.
What is the Unemployment Rate in Roundup?
Unemployment Rate in Roundup is 3.8%.