Lincoln, MT Map & Demographics
Lincoln Map
Lincoln Overview
$29,885
PER CAPITA INCOME
$44,450
AVG FAMILY INCOME
$42,900
AVG HOUSEHOLD INCOME
8.2%
WAGE / INCOME GAP [ % ]
91.8¢/ $1
WAGE / INCOME GAP [ $ ]
0.42
INEQUALITY / GINI INDEX
1,005
TOTAL POPULATION
516
MALE POPULATION
489
FEMALE POPULATION
105.52
MALES / 100 FEMALES
94.77
FEMALES / 100 MALES
54.5
MEDIAN AGE
2.9
AVG FAMILY SIZE
2.2
AVG HOUSEHOLD SIZE
475
LABOR FORCE [ PEOPLE ]
55.9%
PERCENT IN LABOR FORCE
0.2%
UNEMPLOYMENT RATE
Lincoln Zip Codes
Lincoln Area Codes
Income in Lincoln
Income Overview in Lincoln
Per Capita Income in Lincoln is $29,885, while median incomes of families and households are $44,450 and $42,900 respectively.
| Characteristic | Number | Measure |
| Per Capita Income | 1,005 | $29,885 |
| Median Family Income | 261 | $44,450 |
| Mean Family Income | 261 | $73,753 |
| Median Household Income | 462 | $42,900 |
| Mean Household Income | 462 | $62,314 |
| Income Deficit | 261 | $0 |
| Wage / Income Gap (%) | 1,005 | 8.21% |
| Wage / Income Gap ($) | 1,005 | 91.79¢ per $1 |
| Gini / Inequality Index | 1,005 | 0.42 |
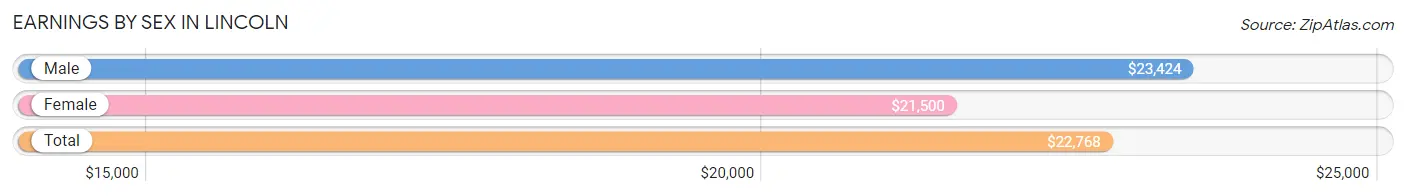
Earnings by Sex in Lincoln
Average Earnings in Lincoln are $22,768, $23,424 for men and $21,500 for women, a difference of 8.2%.
| Sex | Number | Average Earnings |
| Male | 277 (51.6%) | $23,424 |
| Female | 260 (48.4%) | $21,500 |
| Total | 537 (100.0%) | $22,768 |
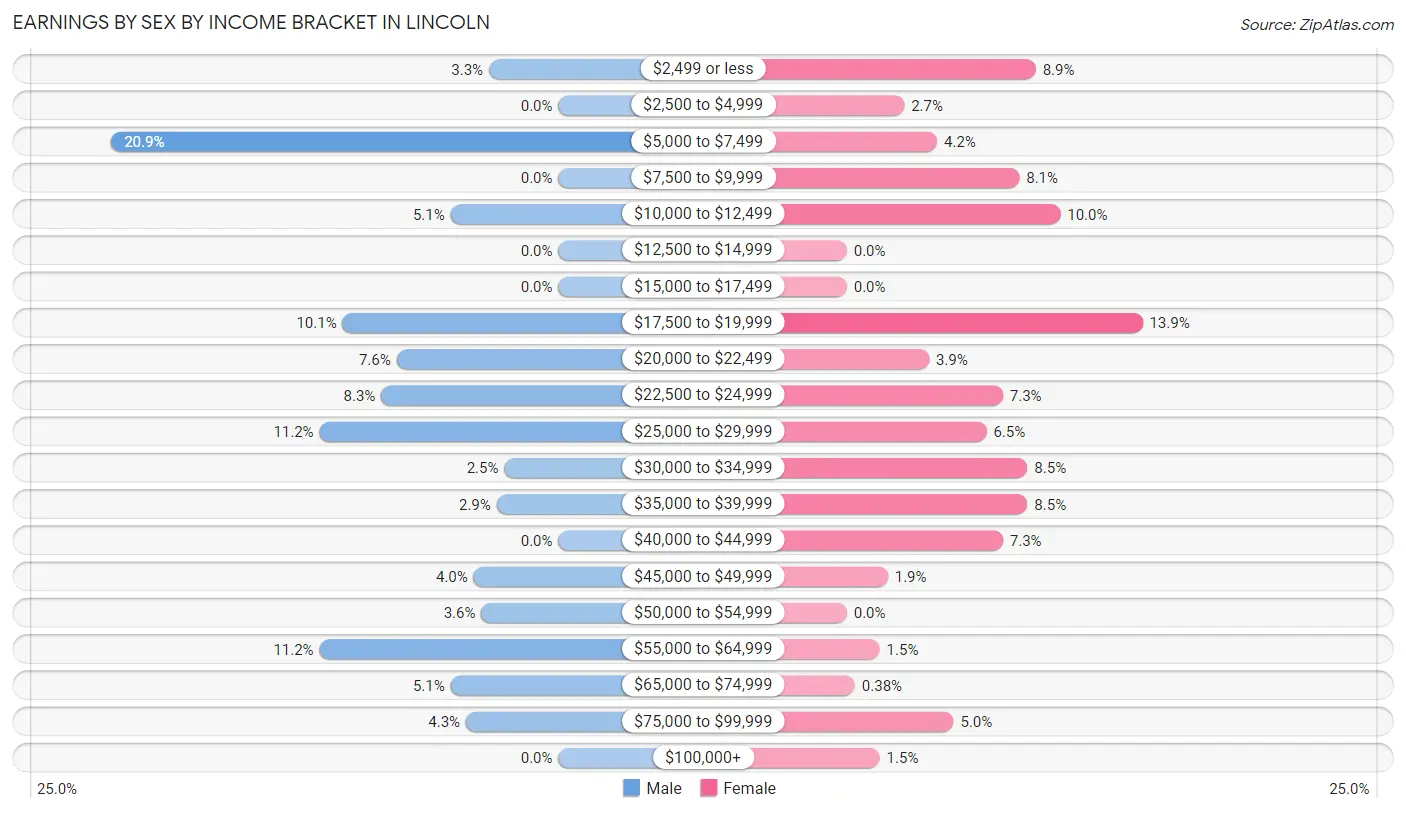
Earnings by Sex by Income Bracket in Lincoln
The most common earnings brackets in Lincoln are $5,000 to $7,499 for men (58 | 20.9%) and $17,500 to $19,999 for women (36 | 13.9%).
| Income | Male | Female |
| $2,499 or less | 9 (3.3%) | 23 (8.8%) |
| $2,500 to $4,999 | 0 (0.0%) | 7 (2.7%) |
| $5,000 to $7,499 | 58 (20.9%) | 11 (4.2%) |
| $7,500 to $9,999 | 0 (0.0%) | 21 (8.1%) |
| $10,000 to $12,499 | 14 (5.1%) | 26 (10.0%) |
| $12,500 to $14,999 | 0 (0.0%) | 0 (0.0%) |
| $15,000 to $17,499 | 0 (0.0%) | 0 (0.0%) |
| $17,500 to $19,999 | 28 (10.1%) | 36 (13.9%) |
| $20,000 to $22,499 | 21 (7.6%) | 10 (3.8%) |
| $22,500 to $24,999 | 23 (8.3%) | 19 (7.3%) |
| $25,000 to $29,999 | 31 (11.2%) | 17 (6.5%) |
| $30,000 to $34,999 | 7 (2.5%) | 22 (8.5%) |
| $35,000 to $39,999 | 8 (2.9%) | 22 (8.5%) |
| $40,000 to $44,999 | 0 (0.0%) | 19 (7.3%) |
| $45,000 to $49,999 | 11 (4.0%) | 5 (1.9%) |
| $50,000 to $54,999 | 10 (3.6%) | 0 (0.0%) |
| $55,000 to $64,999 | 31 (11.2%) | 4 (1.5%) |
| $65,000 to $74,999 | 14 (5.1%) | 1 (0.4%) |
| $75,000 to $99,999 | 12 (4.3%) | 13 (5.0%) |
| $100,000+ | 0 (0.0%) | 4 (1.5%) |
| Total | 277 (100.0%) | 260 (100.0%) |
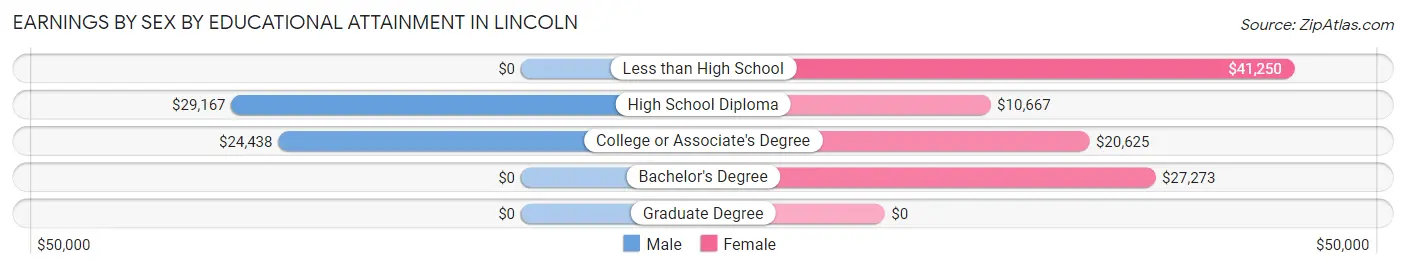
Earnings by Sex by Educational Attainment in Lincoln
Average earnings in Lincoln are $27,917 for men and $21,500 for women, a difference of 23.0%. Men with an educational attainment of high school diploma enjoy the highest average annual earnings of $29,167, while those with college or associate's degree education earn the least with $24,438. Women with an educational attainment of less than high school earn the most with the average annual earnings of $41,250, while those with high school diploma education have the smallest earnings of $10,667.
| Educational Attainment | Male Income | Female Income |
| Less than High School | - | - |
| High School Diploma | $29,167 | $10,667 |
| College or Associate's Degree | $24,438 | $20,625 |
| Bachelor's Degree | - | - |
| Graduate Degree | - | - |
| Total | $27,917 | $21,500 |
Family Income in Lincoln
Family Income Brackets in Lincoln
According to the Lincoln family income data, there are 91 families falling into the $35,000 to $49,999 income range, which is the most common income bracket and makes up 34.9% of all families.
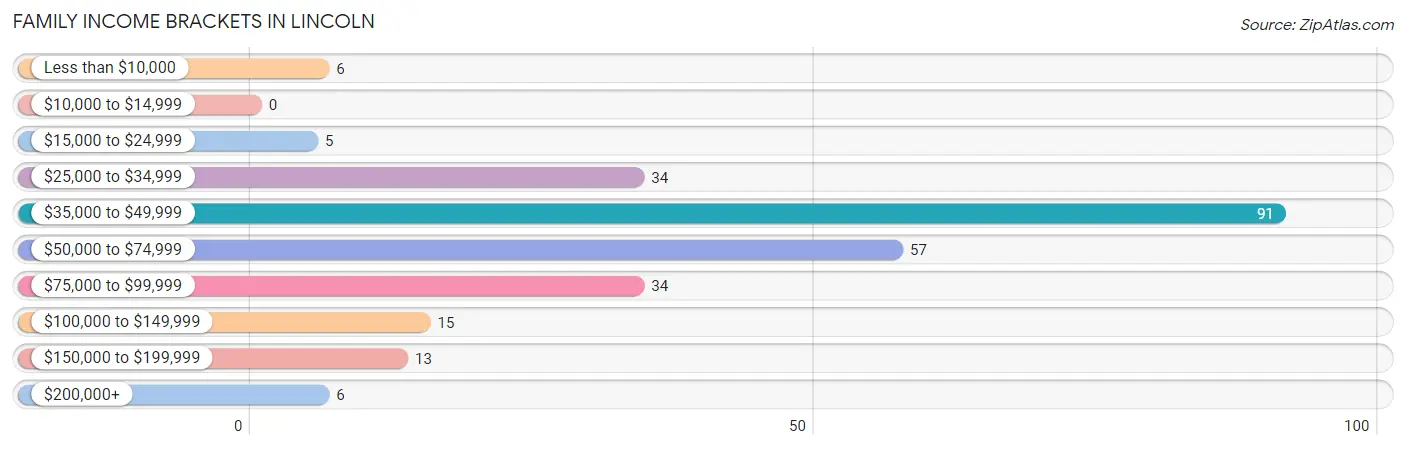
| Income Bracket | # Families | % Families |
| Less than $10,000 | 6 | 2.3% |
| $10,000 to $14,999 | 0 | 0.0% |
| $15,000 to $24,999 | 5 | 1.9% |
| $25,000 to $34,999 | 34 | 13.0% |
| $35,000 to $49,999 | 91 | 34.9% |
| $50,000 to $74,999 | 57 | 21.8% |
| $75,000 to $99,999 | 34 | 13.0% |
| $100,000 to $149,999 | 15 | 5.7% |
| $150,000 to $199,999 | 13 | 5.0% |
| $200,000+ | 6 | 2.3% |
Family Income by Famaliy Size in Lincoln
2-person families (152 | 58.2%) account for the highest median family income in Lincoln with $54,688 per family, while 2-person families (152 | 58.2%) have the highest median income of $27,344 per family member.
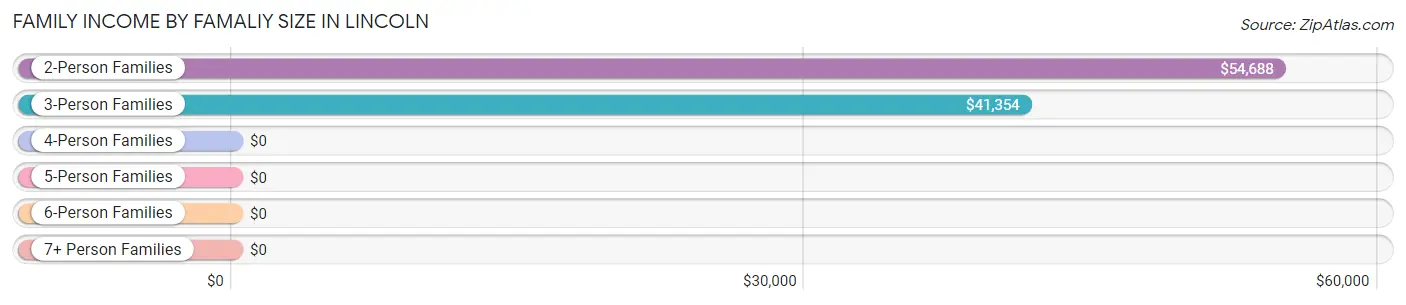
| Income Bracket | # Families | Median Income |
| 2-Person Families | 152 (58.2%) | $54,688 |
| 3-Person Families | 61 (23.4%) | $41,354 |
| 4-Person Families | 25 (9.6%) | $0 |
| 5-Person Families | 5 (1.9%) | $0 |
| 6-Person Families | 10 (3.8%) | $0 |
| 7+ Person Families | 8 (3.1%) | $0 |
| Total | 261 (100.0%) | $44,450 |
Family Income by Number of Earners in Lincoln
The median family income in Lincoln is $44,450, with families comprising 1 earner (60) having the highest median family income of $60,625, while families with 3+ earners (61) have the lowest median family income of $41,354, accounting for 23.0% and 23.4% of families, respectively.
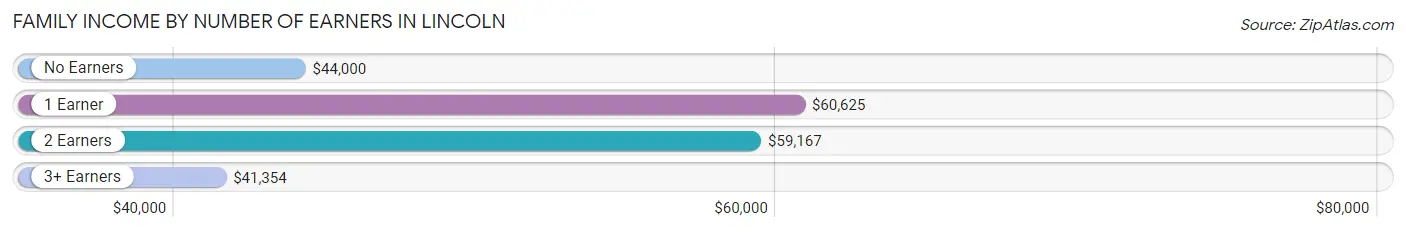
| Number of Earners | # Families | Median Income |
| No Earners | 52 (19.9%) | $44,000 |
| 1 Earner | 60 (23.0%) | $60,625 |
| 2 Earners | 88 (33.7%) | $59,167 |
| 3+ Earners | 61 (23.4%) | $41,354 |
| Total | 261 (100.0%) | $44,450 |
Household Income in Lincoln
Household Income Brackets in Lincoln
With 128 households falling in the category, the $35,000 to $49,999 income range is the most frequent in Lincoln, accounting for 27.7% of all households. In contrast, only 6 households (1.3%) fall into the $200,000+ income bracket, making it the least populous group.
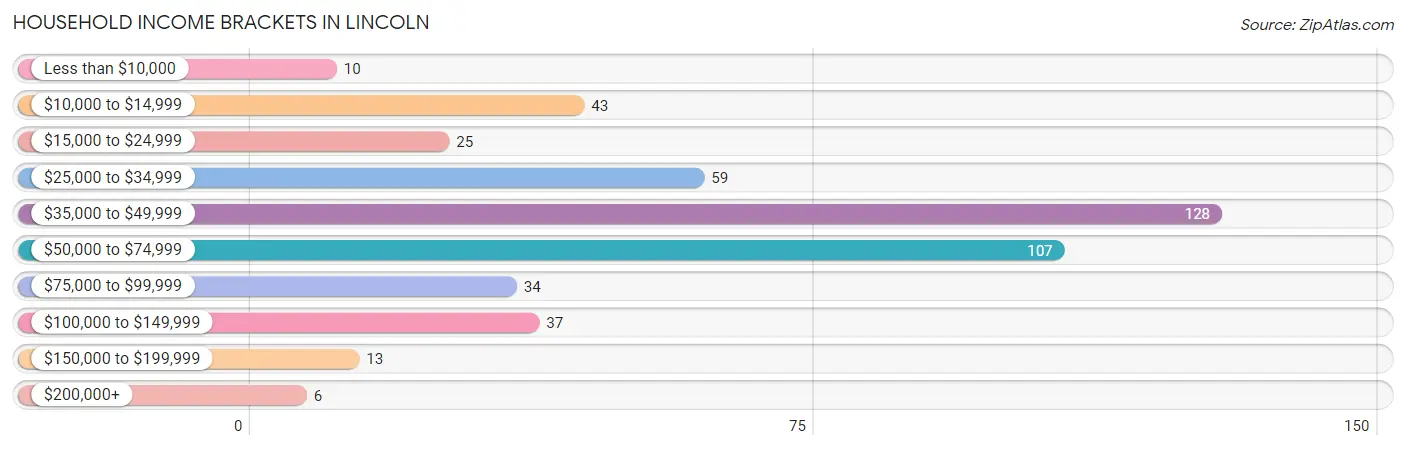
| Income Bracket | # Households | % Households |
| Less than $10,000 | 10 | 2.2% |
| $10,000 to $14,999 | 43 | 9.3% |
| $15,000 to $24,999 | 25 | 5.4% |
| $25,000 to $34,999 | 59 | 12.8% |
| $35,000 to $49,999 | 128 | 27.7% |
| $50,000 to $74,999 | 107 | 23.2% |
| $75,000 to $99,999 | 34 | 7.4% |
| $100,000 to $149,999 | 37 | 8.0% |
| $150,000 to $199,999 | 13 | 2.8% |
| $200,000+ | 6 | 1.3% |
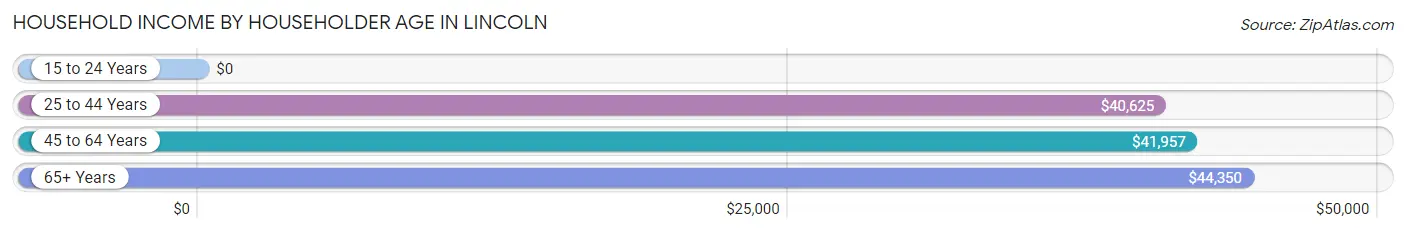
Household Income by Householder Age in Lincoln
The median household income in Lincoln is $42,900, with the highest median household income of $44,350 found in the 65+ years age bracket for the primary householder. A total of 195 households (42.2%) fall into this category.
| Income Bracket | # Households | Median Income |
| 15 to 24 Years | 0 (0.0%) | $0 |
| 25 to 44 Years | 79 (17.1%) | $40,625 |
| 45 to 64 Years | 188 (40.7%) | $41,957 |
| 65+ Years | 195 (42.2%) | $44,350 |
| Total | 462 (100.0%) | $42,900 |
Poverty in Lincoln
Income Below Poverty by Sex and Age in Lincoln
With 3.7% poverty level for males and 15.3% for females among the residents of Lincoln, 35 to 44 year old males and under 5 year old females are the most vulnerable to poverty, with 9 males (20.4%) and 5 females (100.0%) in their respective age groups living below the poverty level.
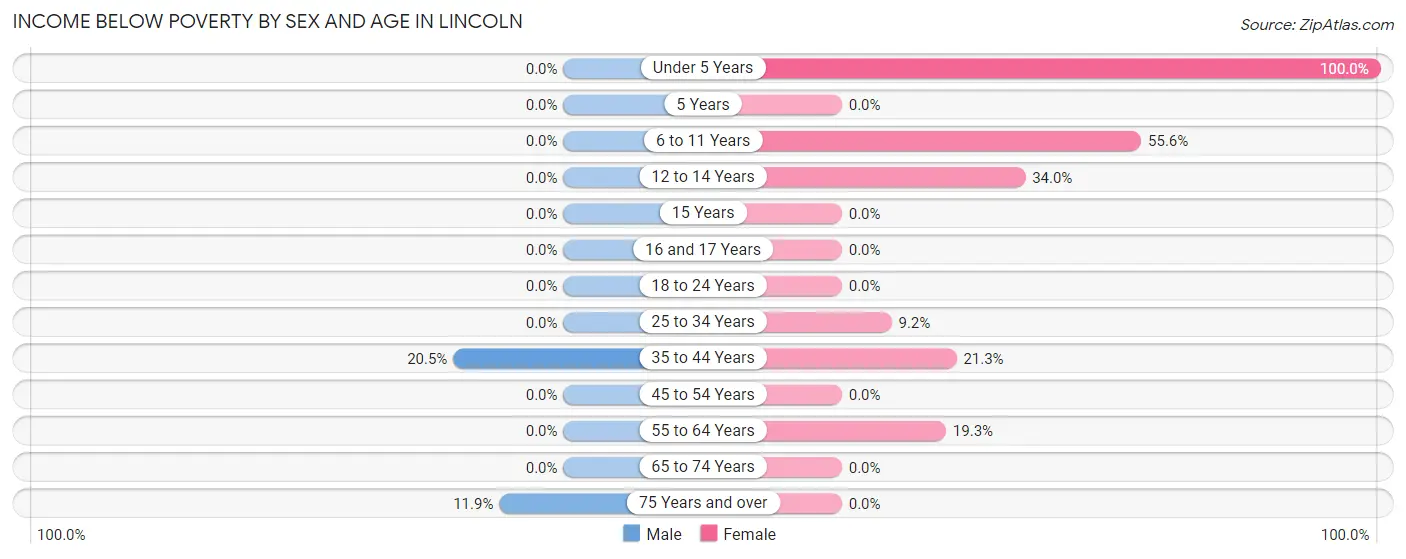
| Age Bracket | Male | Female |
| Under 5 Years | 0 (0.0%) | 5 (100.0%) |
| 5 Years | 0 (0.0%) | 0 (0.0%) |
| 6 to 11 Years | 0 (0.0%) | 15 (55.6%) |
| 12 to 14 Years | 0 (0.0%) | 16 (34.0%) |
| 15 Years | 0 (0.0%) | 0 (0.0%) |
| 16 and 17 Years | 0 (0.0%) | 0 (0.0%) |
| 18 to 24 Years | 0 (0.0%) | 0 (0.0%) |
| 25 to 34 Years | 0 (0.0%) | 6 (9.2%) |
| 35 to 44 Years | 9 (20.4%) | 10 (21.3%) |
| 45 to 54 Years | 0 (0.0%) | 0 (0.0%) |
| 55 to 64 Years | 0 (0.0%) | 23 (19.3%) |
| 65 to 74 Years | 0 (0.0%) | 0 (0.0%) |
| 75 Years and over | 10 (11.9%) | 0 (0.0%) |
| Total | 19 (3.7%) | 75 (15.3%) |
Income Above Poverty by Sex and Age in Lincoln
According to the poverty statistics in Lincoln, males aged under 5 years and females aged 16 and 17 years are the age groups that are most secure financially, with 100.0% of males and 100.0% of females in these age groups living above the poverty line.
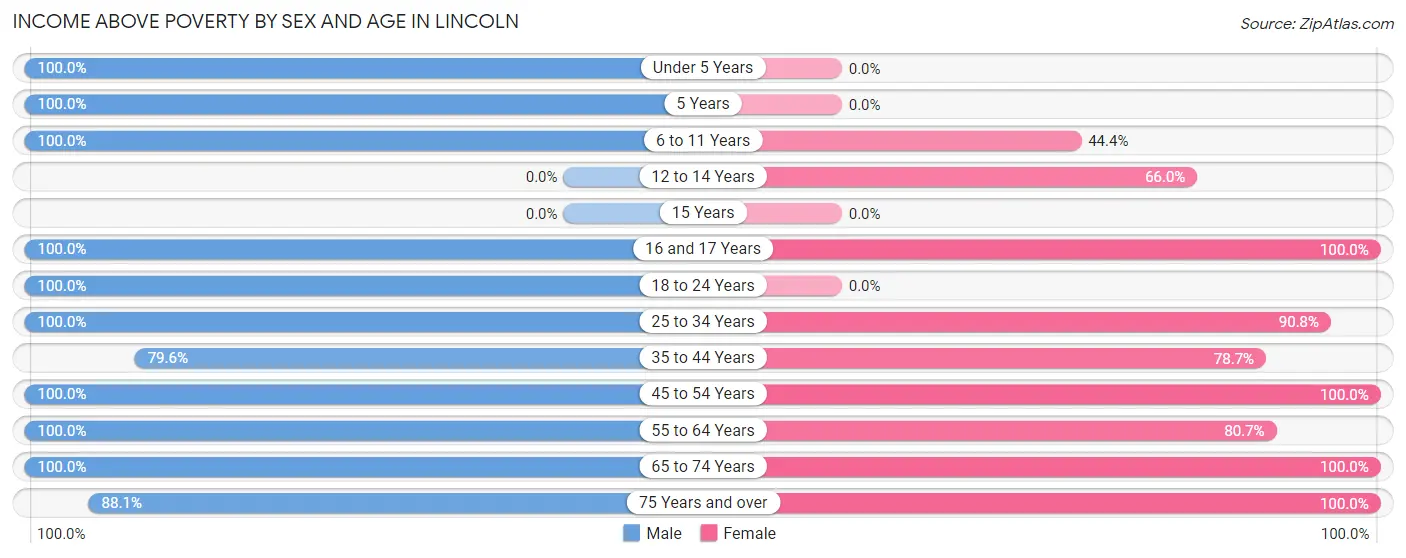
| Age Bracket | Male | Female |
| Under 5 Years | 24 (100.0%) | 0 (0.0%) |
| 5 Years | 24 (100.0%) | 0 (0.0%) |
| 6 to 11 Years | 28 (100.0%) | 12 (44.4%) |
| 12 to 14 Years | 0 (0.0%) | 31 (66.0%) |
| 15 Years | 0 (0.0%) | 0 (0.0%) |
| 16 and 17 Years | 7 (100.0%) | 4 (100.0%) |
| 18 to 24 Years | 46 (100.0%) | 0 (0.0%) |
| 25 to 34 Years | 70 (100.0%) | 59 (90.8%) |
| 35 to 44 Years | 35 (79.5%) | 37 (78.7%) |
| 45 to 54 Years | 43 (100.0%) | 39 (100.0%) |
| 55 to 64 Years | 79 (100.0%) | 96 (80.7%) |
| 65 to 74 Years | 67 (100.0%) | 96 (100.0%) |
| 75 Years and over | 74 (88.1%) | 40 (100.0%) |
| Total | 497 (96.3%) | 414 (84.7%) |
Income Below Poverty Among Married-Couple Families in Lincoln
The poverty statistics for married-couple families in Lincoln show that 3.8% or 9 of the total 235 families live below the poverty line. Families with 1 or 2 children have the highest poverty rate of 36.0%, comprising of 9 families. On the other hand, families with no children have the lowest poverty rate of 0.0%, which includes 0 families.
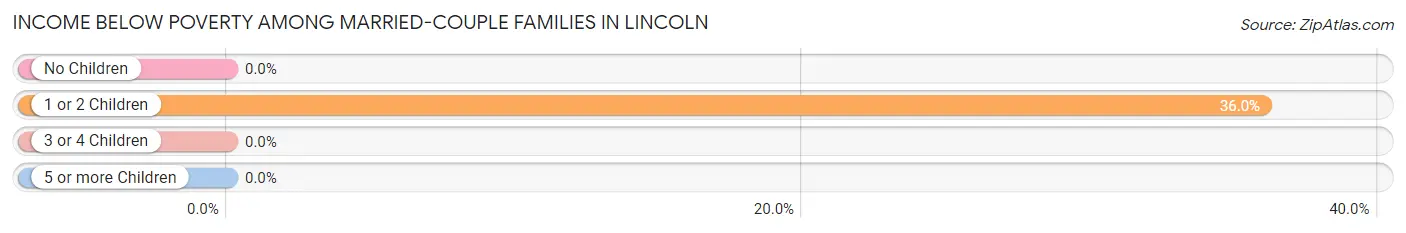
| Children | Above Poverty | Below Poverty |
| No Children | 187 (100.0%) | 0 (0.0%) |
| 1 or 2 Children | 16 (64.0%) | 9 (36.0%) |
| 3 or 4 Children | 15 (100.0%) | 0 (0.0%) |
| 5 or more Children | 8 (100.0%) | 0 (0.0%) |
| Total | 226 (96.2%) | 9 (3.8%) |
Income Below Poverty Among Single-Parent Households in Lincoln
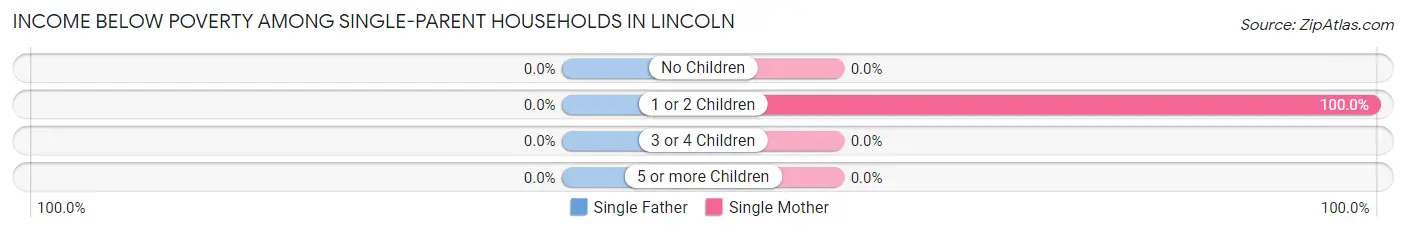
| Children | Single Father | Single Mother |
| No Children | 0 (0.0%) | 0 (0.0%) |
| 1 or 2 Children | 0 (0.0%) | 6 (100.0%) |
| 3 or 4 Children | 0 (0.0%) | 0 (0.0%) |
| 5 or more Children | 0 (0.0%) | 0 (0.0%) |
| Total | 0 (0.0%) | 6 (33.3%) |
Income Below Poverty Among Married-Couple vs Single-Parent Households in Lincoln
The poverty data for Lincoln shows that 9 of the married-couple family households (3.8%) and 6 of the single-parent households (23.1%) are living below the poverty level. Within the married-couple family households, those with 1 or 2 children have the highest poverty rate, with 9 households (36.0%) falling below the poverty line. Among the single-parent households, those with 1 or 2 children have the highest poverty rate, with 6 household (100.0%) living below poverty.
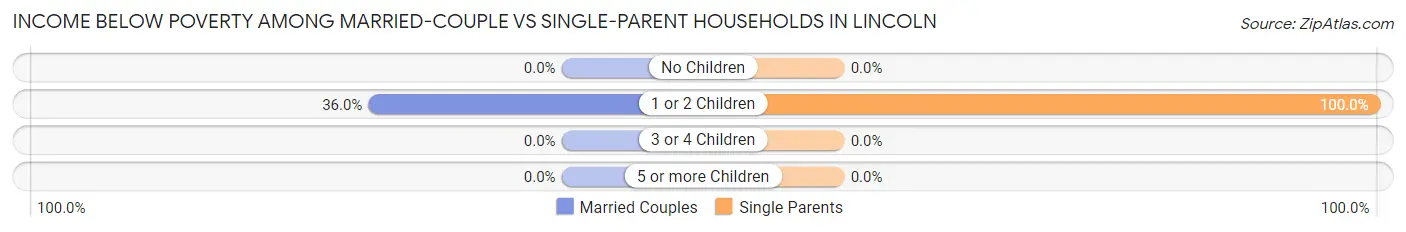
| Children | Married-Couple Families | Single-Parent Households |
| No Children | 0 (0.0%) | 0 (0.0%) |
| 1 or 2 Children | 9 (36.0%) | 6 (100.0%) |
| 3 or 4 Children | 0 (0.0%) | 0 (0.0%) |
| 5 or more Children | 0 (0.0%) | 0 (0.0%) |
| Total | 9 (3.8%) | 6 (23.1%) |
Race in Lincoln
The most populous races in Lincoln are White / Caucasian (935 | 93.0%), Two or more Races (58 | 5.8%), and Hispanic or Latino (31 | 3.1%).
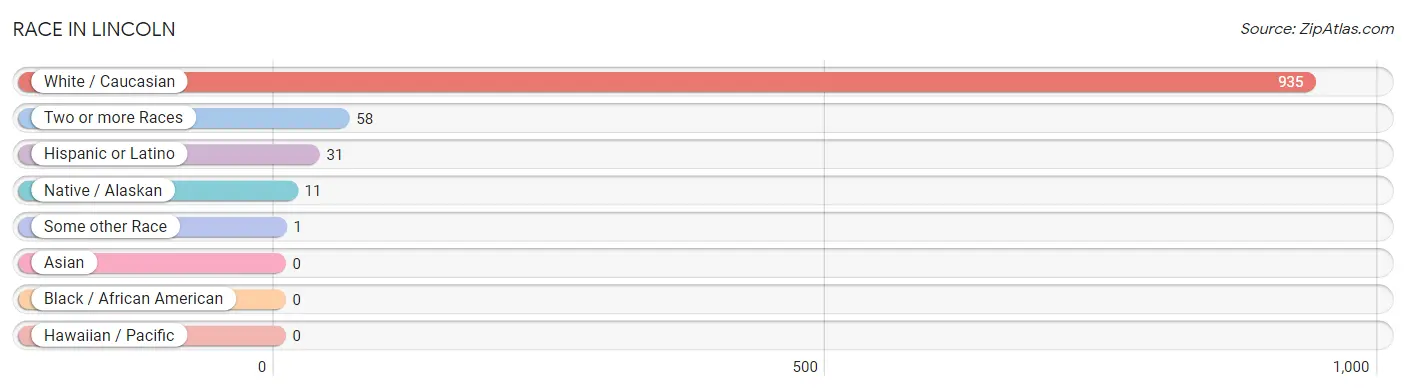
| Race | # Population | % Population |
| Asian | 0 | 0.0% |
| Black / African American | 0 | 0.0% |
| Hawaiian / Pacific | 0 | 0.0% |
| Hispanic or Latino | 31 | 3.1% |
| Native / Alaskan | 11 | 1.1% |
| White / Caucasian | 935 | 93.0% |
| Two or more Races | 58 | 5.8% |
| Some other Race | 1 | 0.1% |
| Total | 1,005 | 100.0% |
Ancestry in Lincoln
The most populous ancestries reported in Lincoln are German (206 | 20.5%), English (121 | 12.0%), Norwegian (94 | 9.3%), Scandinavian (88 | 8.8%), and Irish (66 | 6.6%), together accounting for 57.2% of all Lincoln residents.
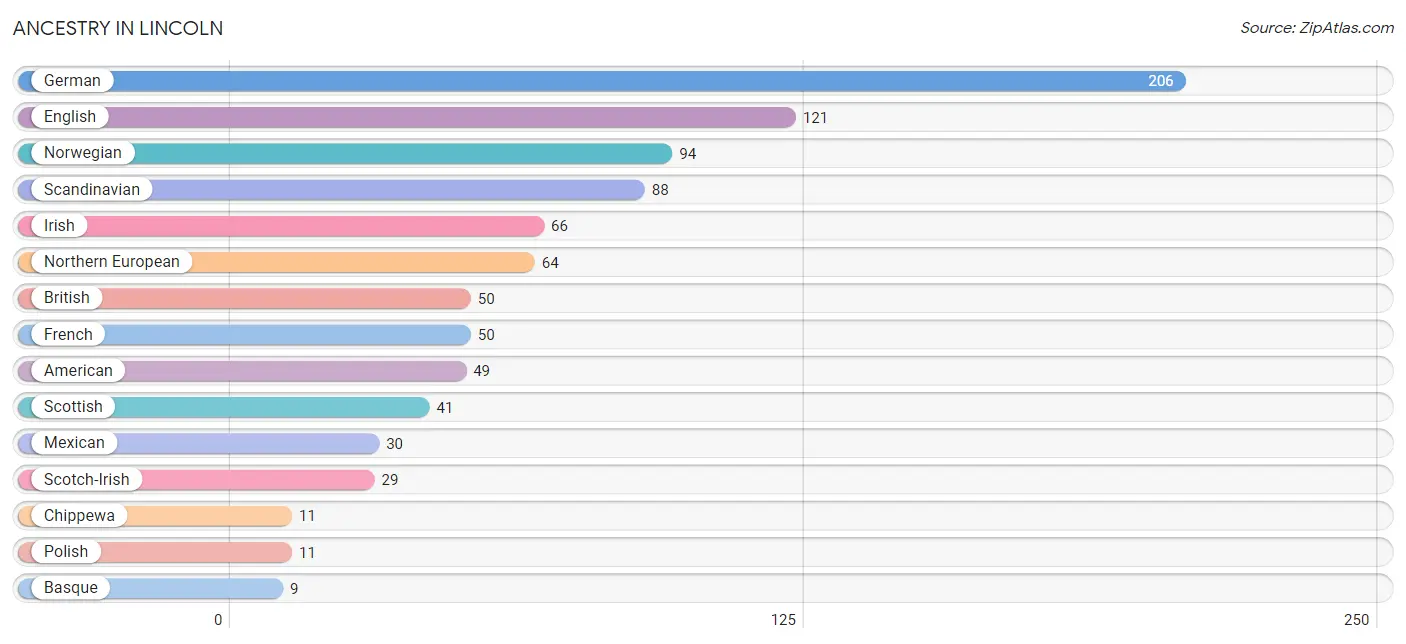
| Ancestry | # Population | % Population |
| American | 49 | 4.9% |
| Basque | 9 | 0.9% |
| British | 50 | 5.0% |
| Cherokee | 4 | 0.4% |
| Chippewa | 11 | 1.1% |
| Danish | 8 | 0.8% |
| Dutch | 9 | 0.9% |
| English | 121 | 12.0% |
| European | 8 | 0.8% |
| Finnish | 4 | 0.4% |
| French | 50 | 5.0% |
| German | 206 | 20.5% |
| Hungarian | 2 | 0.2% |
| Irish | 66 | 6.6% |
| Mexican | 30 | 3.0% |
| Northern European | 64 | 6.4% |
| Norwegian | 94 | 9.3% |
| Polish | 11 | 1.1% |
| Puerto Rican | 1 | 0.1% |
| Scandinavian | 88 | 8.8% |
| Scotch-Irish | 29 | 2.9% |
| Scottish | 41 | 4.1% |
| Swedish | 8 | 0.8% | View All 23 Rows |
Immigrants in Lincoln

| Immigration Origin | # Population | % Population | View All 0 Rows |
Sex and Age in Lincoln
Sex and Age in Lincoln
The most populous age groups in Lincoln are 75 to 79 Years (67 | 13.0%) for men and 10 to 14 Years (74 | 15.1%) for women.
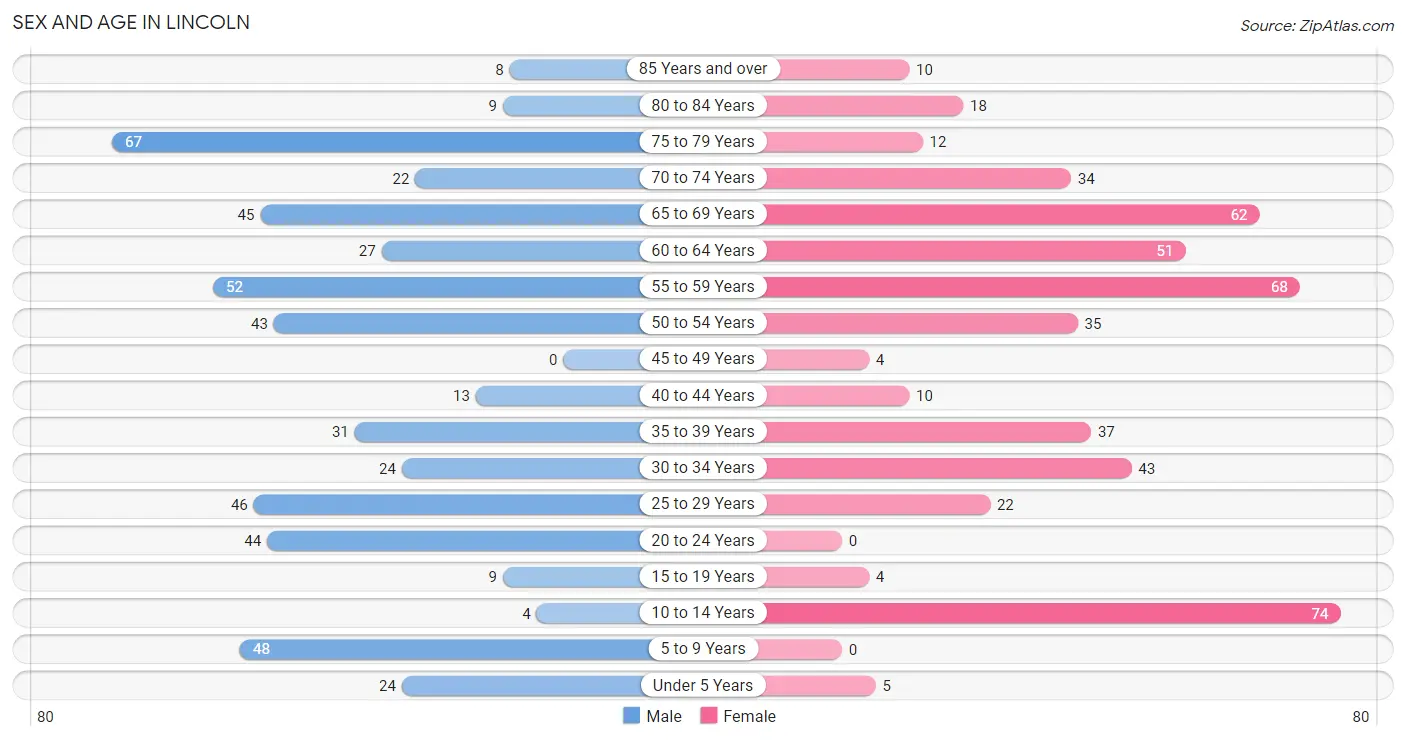
| Age Bracket | Male | Female |
| Under 5 Years | 24 (4.6%) | 5 (1.0%) |
| 5 to 9 Years | 48 (9.3%) | 0 (0.0%) |
| 10 to 14 Years | 4 (0.8%) | 74 (15.1%) |
| 15 to 19 Years | 9 (1.7%) | 4 (0.8%) |
| 20 to 24 Years | 44 (8.5%) | 0 (0.0%) |
| 25 to 29 Years | 46 (8.9%) | 22 (4.5%) |
| 30 to 34 Years | 24 (4.6%) | 43 (8.8%) |
| 35 to 39 Years | 31 (6.0%) | 37 (7.6%) |
| 40 to 44 Years | 13 (2.5%) | 10 (2.0%) |
| 45 to 49 Years | 0 (0.0%) | 4 (0.8%) |
| 50 to 54 Years | 43 (8.3%) | 35 (7.2%) |
| 55 to 59 Years | 52 (10.1%) | 68 (13.9%) |
| 60 to 64 Years | 27 (5.2%) | 51 (10.4%) |
| 65 to 69 Years | 45 (8.7%) | 62 (12.7%) |
| 70 to 74 Years | 22 (4.3%) | 34 (7.0%) |
| 75 to 79 Years | 67 (13.0%) | 12 (2.5%) |
| 80 to 84 Years | 9 (1.7%) | 18 (3.7%) |
| 85 Years and over | 8 (1.5%) | 10 (2.0%) |
| Total | 516 (100.0%) | 489 (100.0%) |
Families and Households in Lincoln
Median Family Size in Lincoln
The median family size in Lincoln is 2.89 persons per family, with married-couple families (235 | 90.0%) accounting for the largest median family size of 2.94 persons per family. On the other hand, single female/mother families (18 | 6.9%) represent the smallest median family size with 2.33 persons per family.
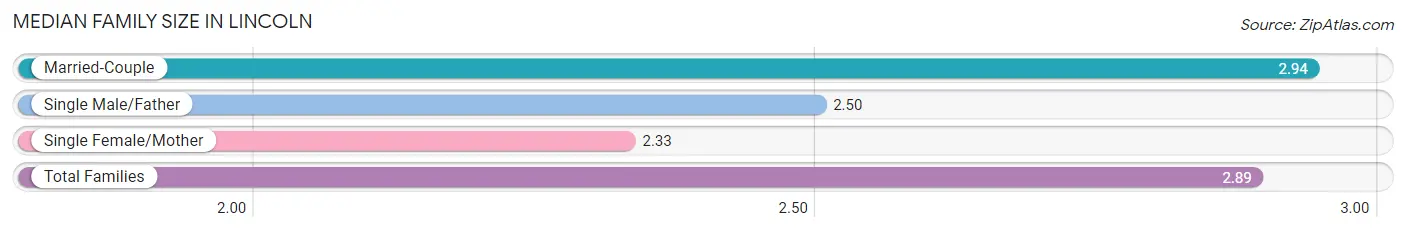
| Family Type | # Families | Family Size |
| Married-Couple | 235 (90.0%) | 2.94 |
| Single Male/Father | 8 (3.1%) | 2.50 |
| Single Female/Mother | 18 (6.9%) | 2.33 |
| Total Families | 261 (100.0%) | 2.89 |
Median Household Size in Lincoln
The median household size in Lincoln is 2.18 persons per household, with married-couple households (235 | 50.9%) accounting for the largest median household size of 3 persons per household. non-family households (201 | 43.5%) represent the smallest median household size with 1.14 persons per household.
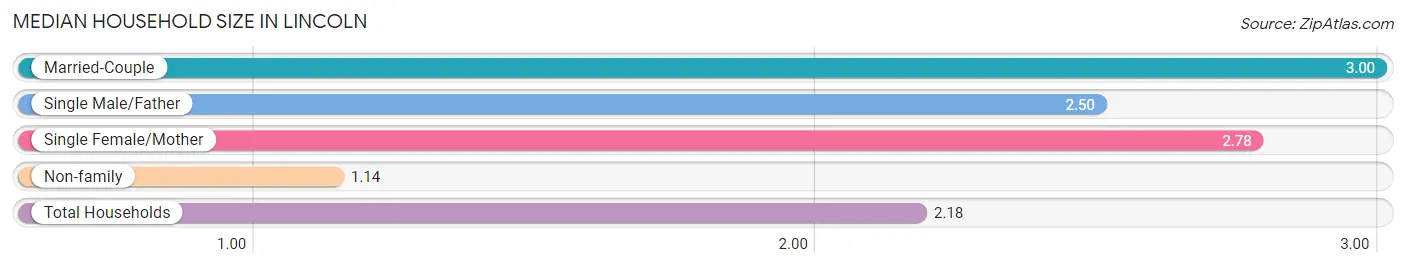
| Household Type | # Households | Household Size |
| Married-Couple | 235 (50.9%) | 3.00 |
| Single Male/Father | 8 (1.7%) | 2.50 |
| Single Female/Mother | 18 (3.9%) | 2.78 |
| Non-family | 201 (43.5%) | 1.14 |
| Total Households | 462 (100.0%) | 2.18 |
Household Size by Marriage Status in Lincoln
Out of a total of 462 households in Lincoln, 261 (56.5%) are family households, while 201 (43.5%) are nonfamily households. The most numerous type of family households are 2-person households, comprising 143, and the most common type of nonfamily households are 1-person households, comprising 167.
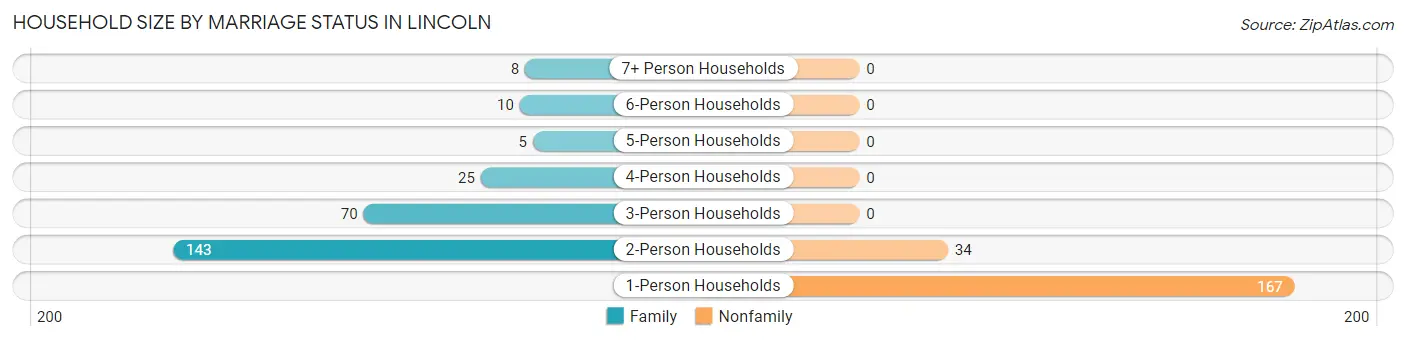
| Household Size | Family Households | Nonfamily Households |
| 1-Person Households | - | 167 (36.1%) |
| 2-Person Households | 143 (30.9%) | 34 (7.4%) |
| 3-Person Households | 70 (15.1%) | 0 (0.0%) |
| 4-Person Households | 25 (5.4%) | 0 (0.0%) |
| 5-Person Households | 5 (1.1%) | 0 (0.0%) |
| 6-Person Households | 10 (2.2%) | 0 (0.0%) |
| 7+ Person Households | 8 (1.7%) | 0 (0.0%) |
| Total | 261 (56.5%) | 201 (43.5%) |
Female Fertility in Lincoln
Fertility by Age in Lincoln
Average fertility rate in Lincoln is 50.0 births per 1,000 women. Women in the age bracket of 20 to 34 years have the highest fertility rate with 92.0 births per 1,000 women. Women in the age bracket of 20 to 34 years acount for 100.0% of all women with births.
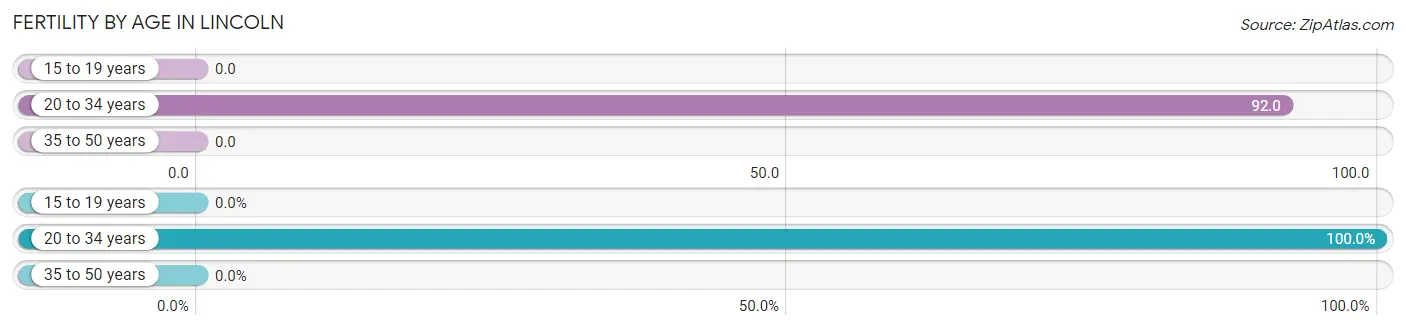
| Age Bracket | Women with Births | Births / 1,000 Women |
| 15 to 19 years | 0 (0.0%) | 0.0 |
| 20 to 34 years | 6 (100.0%) | 92.0 |
| 35 to 50 years | 0 (0.0%) | 0.0 |
| Total | 6 (100.0%) | 50.0 |
Fertility by Age by Marriage Status in Lincoln
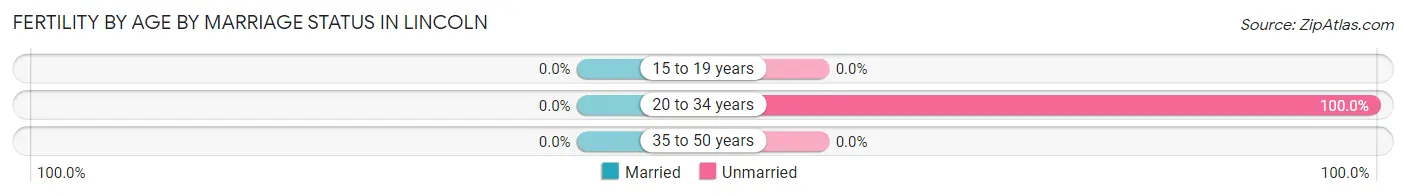
| Age Bracket | Married | Unmarried |
| 15 to 19 years | 0 (0.0%) | 0 (0.0%) |
| 20 to 34 years | 0 (0.0%) | 6 (100.0%) |
| 35 to 50 years | 0 (0.0%) | 0 (0.0%) |
| Total | 0 (0.0%) | 6 (100.0%) |
Fertility by Education in Lincoln
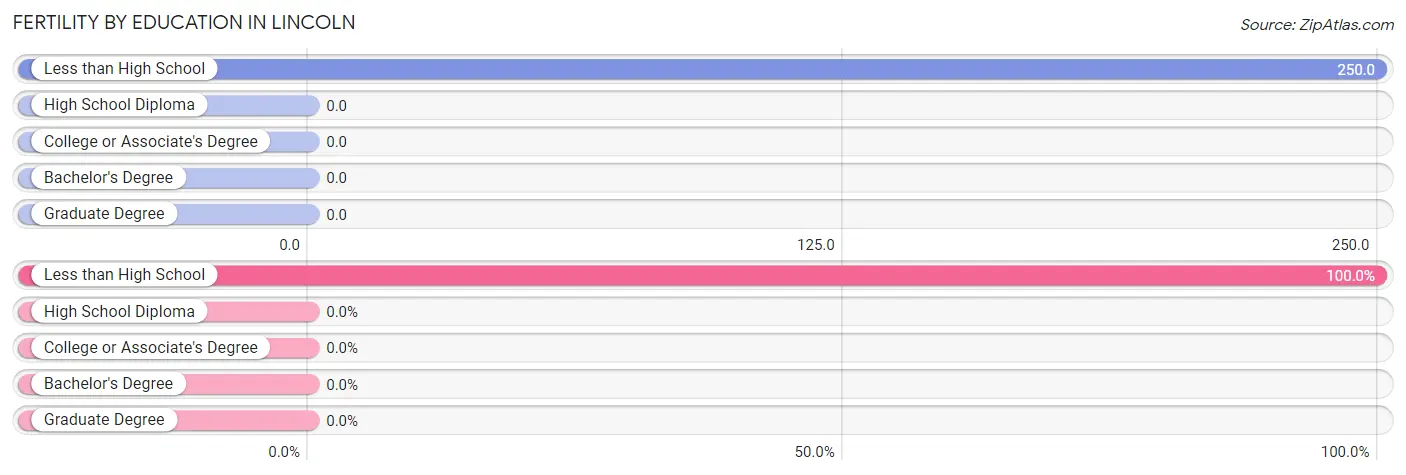
| Educational Attainment | Women with Births | Births / 1,000 Women |
| Less than High School | 6 (100.0%) | 250.0 |
| High School Diploma | 0 (0.0%) | 0.0 |
| College or Associate's Degree | 0 (0.0%) | 0.0 |
| Bachelor's Degree | 0 (0.0%) | 0.0 |
| Graduate Degree | 0 (0.0%) | 0.0 |
| Total | 6 (100.0%) | 50.0 |
Fertility by Education by Marriage Status in Lincoln
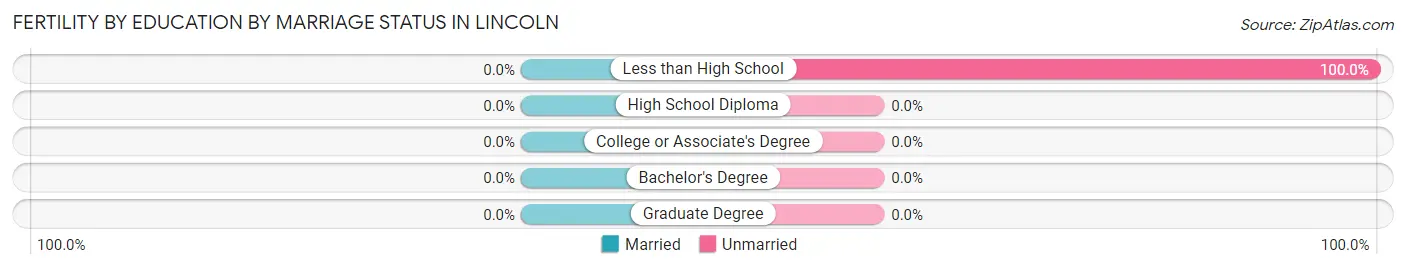
| Educational Attainment | Married | Unmarried |
| Less than High School | 0 (0.0%) | 6 (100.0%) |
| High School Diploma | 0 (0.0%) | 0 (0.0%) |
| College or Associate's Degree | 0 (0.0%) | 0 (0.0%) |
| Bachelor's Degree | 0 (0.0%) | 0 (0.0%) |
| Graduate Degree | 0 (0.0%) | 0 (0.0%) |
| Total | 0 (0.0%) | 6 (100.0%) |
Employment Characteristics in Lincoln
Employment by Class of Employer in Lincoln
Among the 463 employed individuals in Lincoln, private company employees (306 | 66.1%), state government employees (41 | 8.9%), and federal government employees (41 | 8.9%) make up the most common classes of employment.
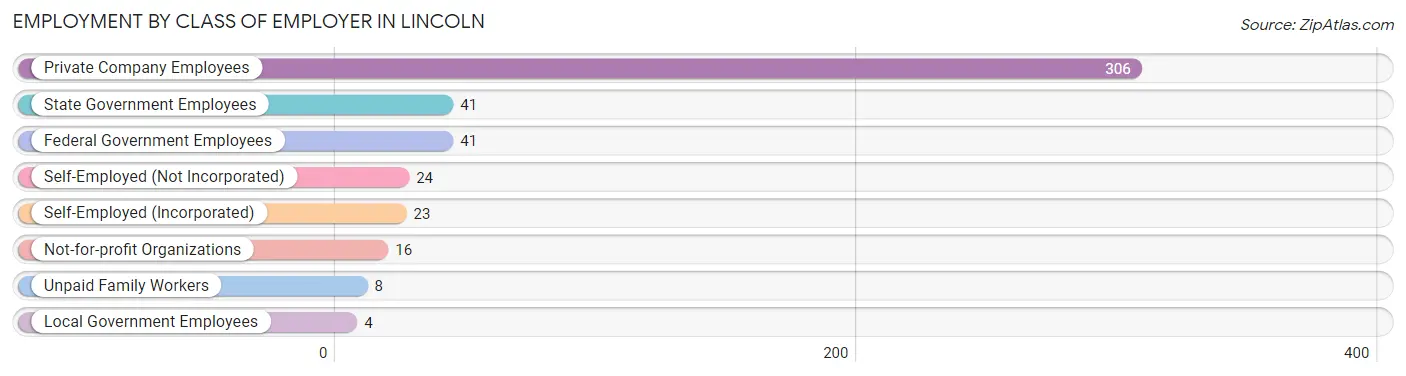
| Employer Class | # Employees | % Employees |
| Private Company Employees | 306 | 66.1% |
| Self-Employed (Incorporated) | 23 | 5.0% |
| Self-Employed (Not Incorporated) | 24 | 5.2% |
| Not-for-profit Organizations | 16 | 3.5% |
| Local Government Employees | 4 | 0.9% |
| State Government Employees | 41 | 8.9% |
| Federal Government Employees | 41 | 8.9% |
| Unpaid Family Workers | 8 | 1.7% |
| Total | 463 | 100.0% |
Employment Status by Age in Lincoln
According to the labor force statistics for Lincoln, out of the total population over 16 years of age (850), 55.9% or 475 individuals are in the labor force, with 0.2% or 1 of them unemployed. The age group with the highest labor force participation rate is 20 to 24 years, with 100.0% or 44 individuals in the labor force. Within the labor force, the 55 to 59 years age range has the highest percentage of unemployed individuals, with 0.9% or 1 of them being unemployed.
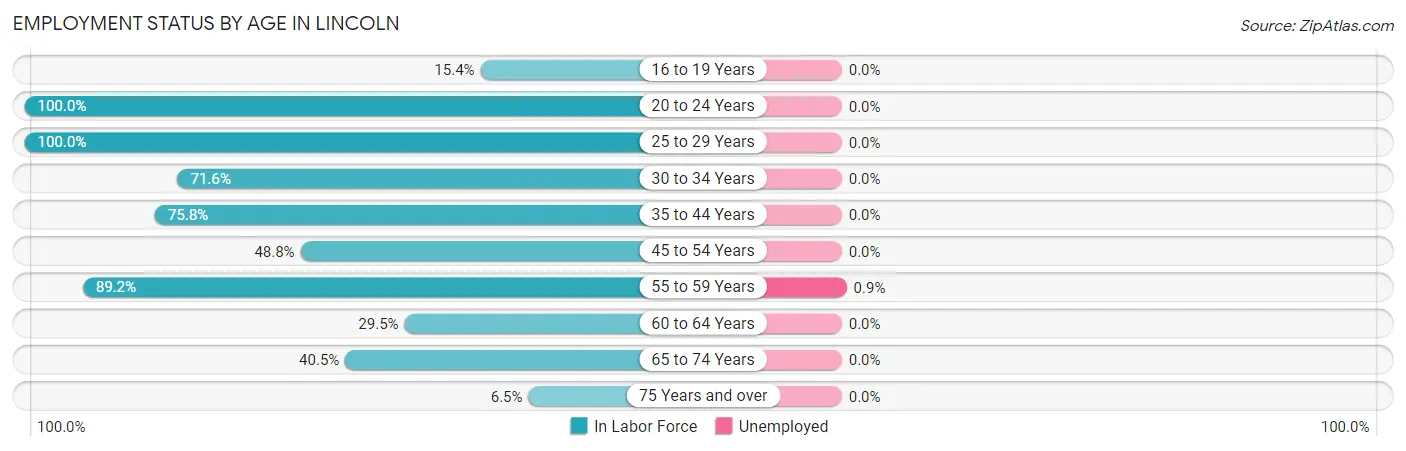
| Age Bracket | In Labor Force | Unemployed |
| 16 to 19 Years | 2 (15.4%) | 0 (0.0%) |
| 20 to 24 Years | 44 (100.0%) | 0 (0.0%) |
| 25 to 29 Years | 68 (100.0%) | 0 (0.0%) |
| 30 to 34 Years | 48 (71.6%) | 0 (0.0%) |
| 35 to 44 Years | 69 (75.8%) | 0 (0.0%) |
| 45 to 54 Years | 40 (48.8%) | 0 (0.0%) |
| 55 to 59 Years | 107 (89.2%) | 1 (0.9%) |
| 60 to 64 Years | 23 (29.5%) | 0 (0.0%) |
| 65 to 74 Years | 66 (40.5%) | 0 (0.0%) |
| 75 Years and over | 8 (6.5%) | 0 (0.0%) |
| Total | 475 (55.9%) | 1 (0.2%) |
Employment Status by Educational Attainment in Lincoln
According to labor force statistics for Lincoln, 70.2% of individuals (355) out of the total population between 25 and 64 years of age (506) are in the labor force, with 0.3% or 1 of them being unemployed. The group with the highest labor force participation rate are those with the educational attainment of bachelor's degree or higher, with 83.0% or 88 individuals in the labor force. Within the labor force, individuals with college / associate degree education have the highest percentage of unemployment, with 0.7% or 1 of them being unemployed.
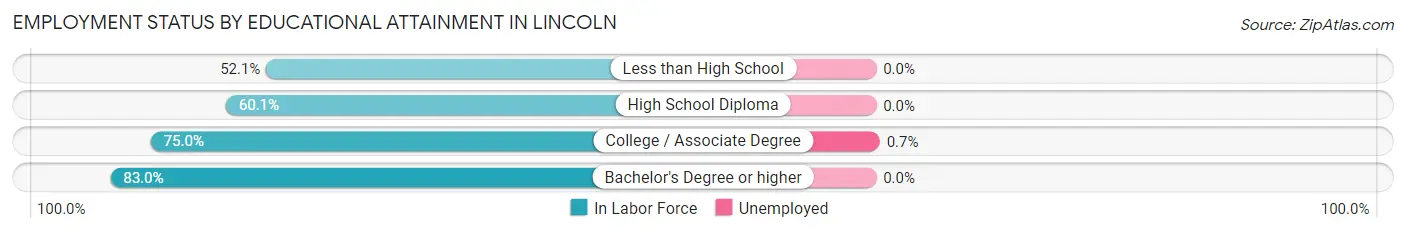
| Educational Attainment | In Labor Force | Unemployed |
| Less than High School | 25 (52.1%) | 0 (0.0%) |
| High School Diploma | 89 (60.1%) | 0 (0.0%) |
| College / Associate Degree | 153 (75.0%) | 1 (0.7%) |
| Bachelor's Degree or higher | 88 (83.0%) | 0 (0.0%) |
| Total | 355 (70.2%) | 2 (0.3%) |
Employment Occupations by Sex in Lincoln
Management, Business, Science and Arts Occupations
The most common Management, Business, Science and Arts occupations in Lincoln are Management (63 | 13.3%), Community & Social Service (24 | 5.1%), Arts, Media & Entertainment (15 | 3.2%), Computers, Engineering & Science (12 | 2.5%), and Life, Physical & Social Science (12 | 2.5%).
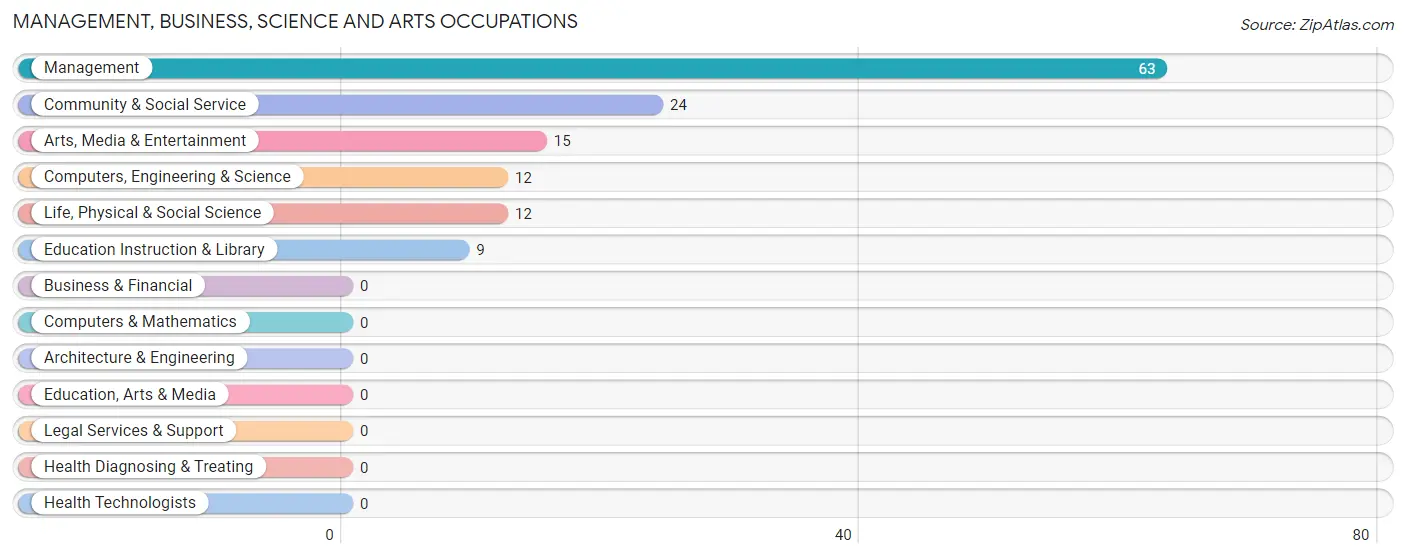
Management, Business, Science and Arts Occupations by Sex
Within the Management, Business, Science and Arts occupations in Lincoln, the most male-oriented occupations are Computers, Engineering & Science (100.0%), Life, Physical & Social Science (100.0%), and Management (76.2%), while the most female-oriented occupations are Education Instruction & Library (100.0%), Community & Social Service (83.3%), and Arts, Media & Entertainment (73.3%).
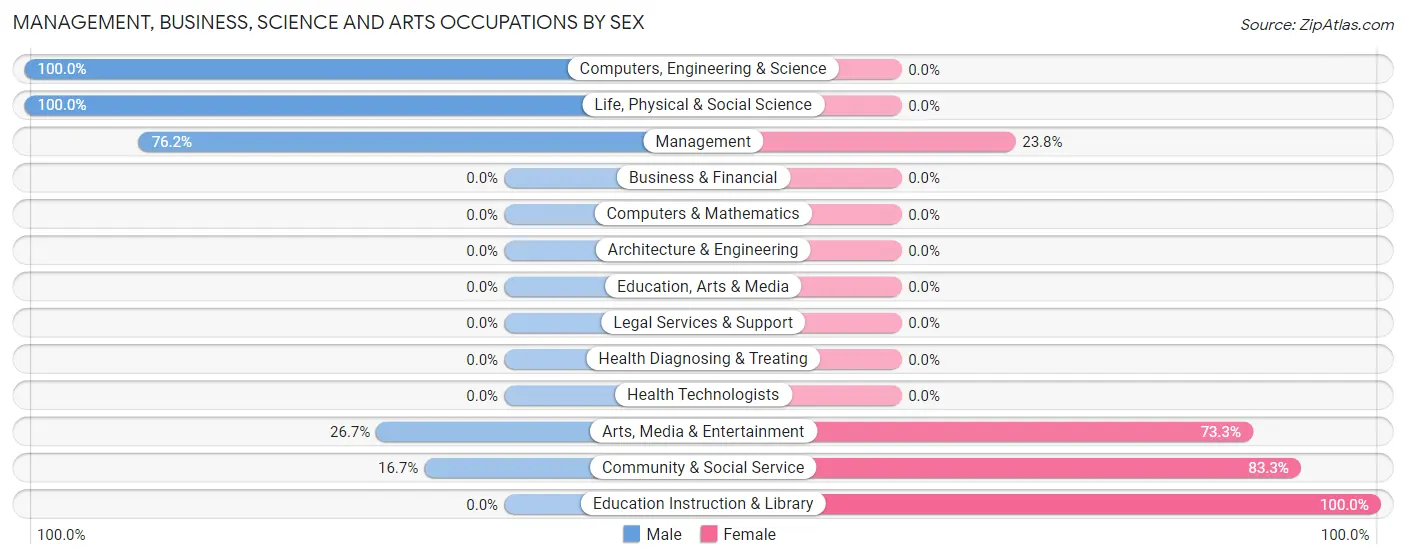
| Occupation | Male | Female |
| Management | 48 (76.2%) | 15 (23.8%) |
| Business & Financial | 0 (0.0%) | 0 (0.0%) |
| Computers, Engineering & Science | 12 (100.0%) | 0 (0.0%) |
| Computers & Mathematics | 0 (0.0%) | 0 (0.0%) |
| Architecture & Engineering | 0 (0.0%) | 0 (0.0%) |
| Life, Physical & Social Science | 12 (100.0%) | 0 (0.0%) |
| Community & Social Service | 4 (16.7%) | 20 (83.3%) |
| Education, Arts & Media | 0 (0.0%) | 0 (0.0%) |
| Legal Services & Support | 0 (0.0%) | 0 (0.0%) |
| Education Instruction & Library | 0 (0.0%) | 9 (100.0%) |
| Arts, Media & Entertainment | 4 (26.7%) | 11 (73.3%) |
| Health Diagnosing & Treating | 0 (0.0%) | 0 (0.0%) |
| Health Technologists | 0 (0.0%) | 0 (0.0%) |
| Total (Category) | 64 (64.6%) | 35 (35.3%) |
| Total (Overall) | 265 (55.9%) | 209 (44.1%) |
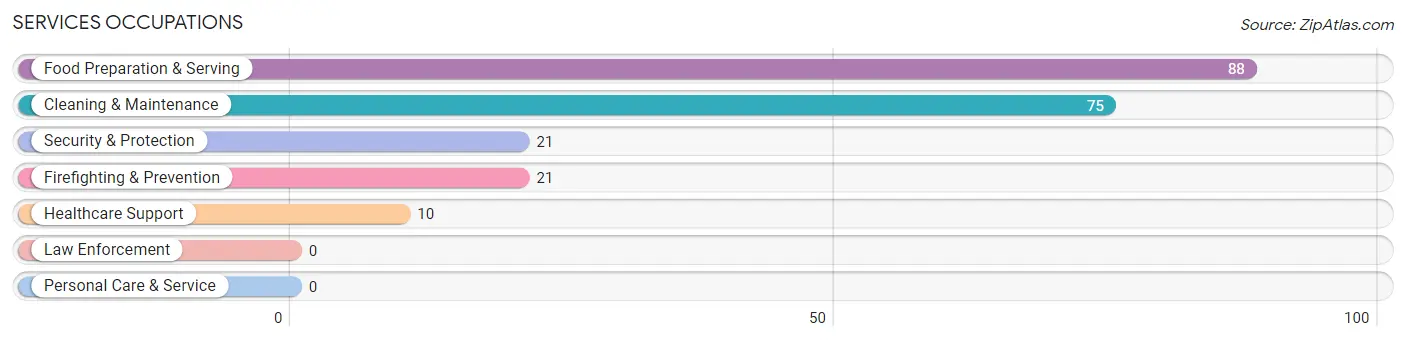
Services Occupations
The most common Services occupations in Lincoln are Food Preparation & Serving (88 | 18.6%), Cleaning & Maintenance (75 | 15.8%), Security & Protection (21 | 4.4%), Firefighting & Prevention (21 | 4.4%), and Healthcare Support (10 | 2.1%).
Services Occupations by Sex
Within the Services occupations in Lincoln, the most male-oriented occupations are Security & Protection (100.0%), Firefighting & Prevention (100.0%), and Cleaning & Maintenance (85.3%), while the most female-oriented occupations are Healthcare Support (100.0%), Food Preparation & Serving (77.3%), and Cleaning & Maintenance (14.7%).
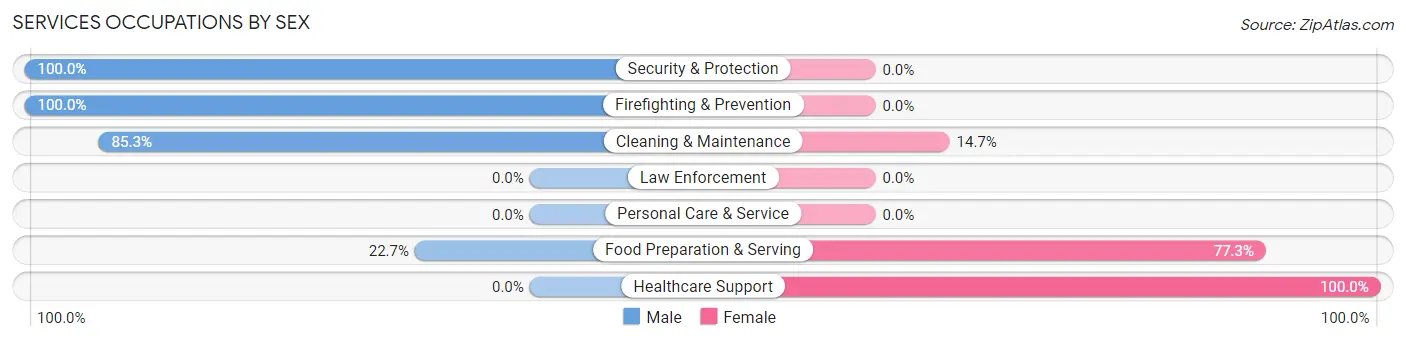
| Occupation | Male | Female |
| Healthcare Support | 0 (0.0%) | 10 (100.0%) |
| Security & Protection | 21 (100.0%) | 0 (0.0%) |
| Firefighting & Prevention | 21 (100.0%) | 0 (0.0%) |
| Law Enforcement | 0 (0.0%) | 0 (0.0%) |
| Food Preparation & Serving | 20 (22.7%) | 68 (77.3%) |
| Cleaning & Maintenance | 64 (85.3%) | 11 (14.7%) |
| Personal Care & Service | 0 (0.0%) | 0 (0.0%) |
| Total (Category) | 105 (54.1%) | 89 (45.9%) |
| Total (Overall) | 265 (55.9%) | 209 (44.1%) |
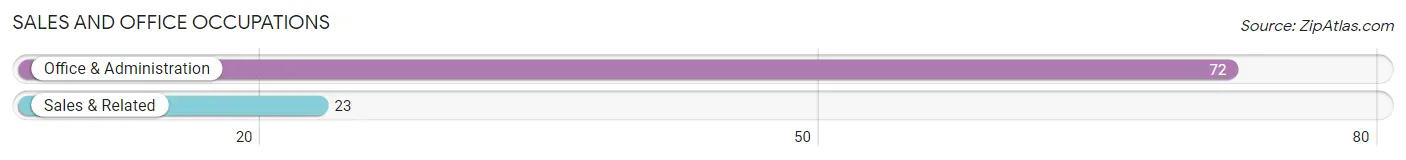
Sales and Office Occupations
The most common Sales and Office occupations in Lincoln are Office & Administration (72 | 15.2%), and Sales & Related (23 | 4.9%).
Sales and Office Occupations by Sex
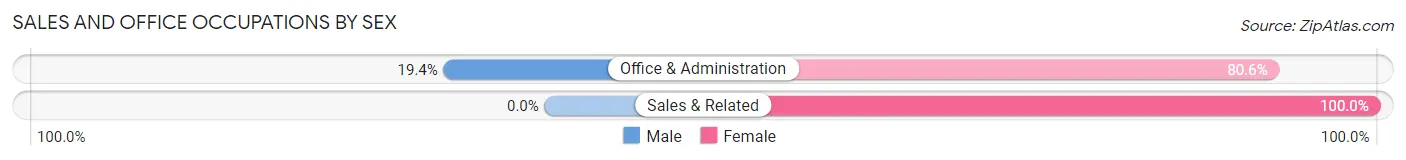
| Occupation | Male | Female |
| Sales & Related | 0 (0.0%) | 23 (100.0%) |
| Office & Administration | 14 (19.4%) | 58 (80.6%) |
| Total (Category) | 14 (14.7%) | 81 (85.3%) |
| Total (Overall) | 265 (55.9%) | 209 (44.1%) |
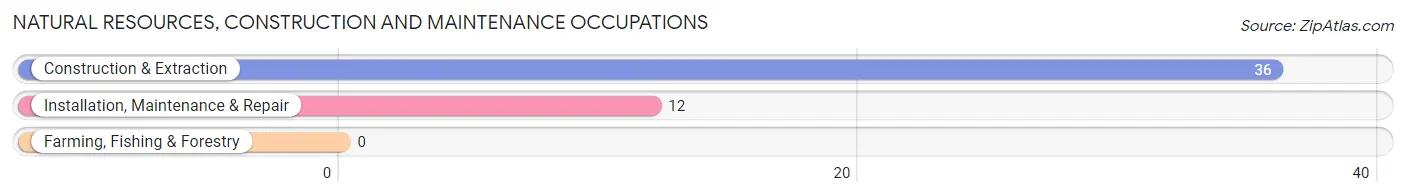
Natural Resources, Construction and Maintenance Occupations
The most common Natural Resources, Construction and Maintenance occupations in Lincoln are Construction & Extraction (36 | 7.6%), and Installation, Maintenance & Repair (12 | 2.5%).
Natural Resources, Construction and Maintenance Occupations by Sex
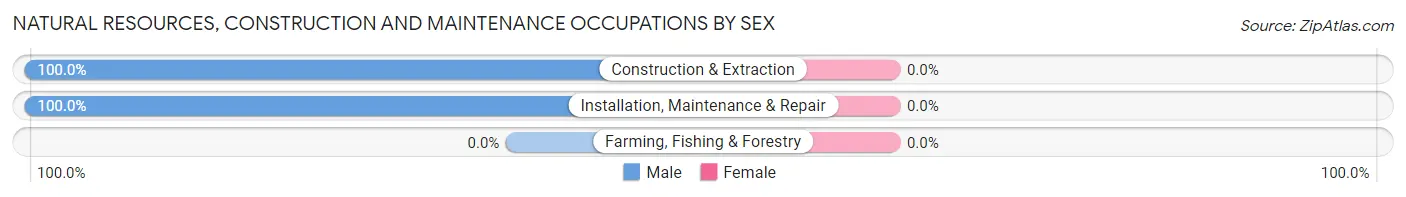
| Occupation | Male | Female |
| Farming, Fishing & Forestry | 0 (0.0%) | 0 (0.0%) |
| Construction & Extraction | 36 (100.0%) | 0 (0.0%) |
| Installation, Maintenance & Repair | 12 (100.0%) | 0 (0.0%) |
| Total (Category) | 48 (100.0%) | 0 (0.0%) |
| Total (Overall) | 265 (55.9%) | 209 (44.1%) |
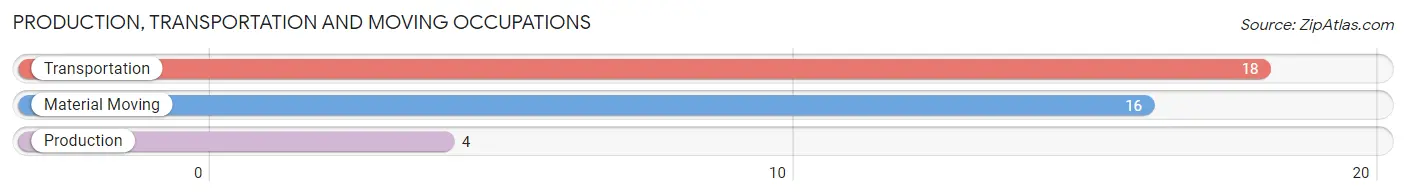
Production, Transportation and Moving Occupations
The most common Production, Transportation and Moving occupations in Lincoln are Transportation (18 | 3.8%), Material Moving (16 | 3.4%), and Production (4 | 0.8%).
Production, Transportation and Moving Occupations by Sex
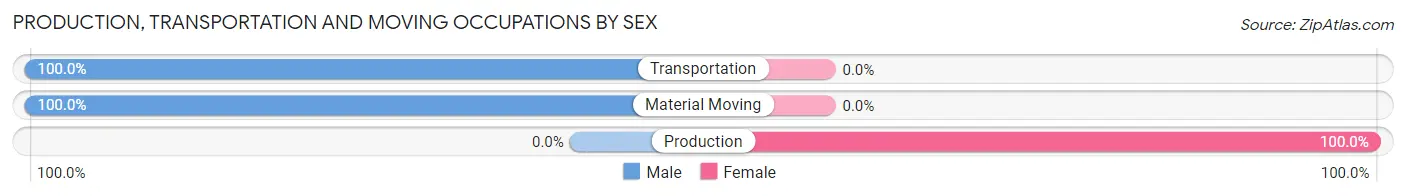
| Occupation | Male | Female |
| Production | 0 (0.0%) | 4 (100.0%) |
| Transportation | 18 (100.0%) | 0 (0.0%) |
| Material Moving | 16 (100.0%) | 0 (0.0%) |
| Total (Category) | 34 (89.5%) | 4 (10.5%) |
| Total (Overall) | 265 (55.9%) | 209 (44.1%) |
Employment Industries by Sex in Lincoln
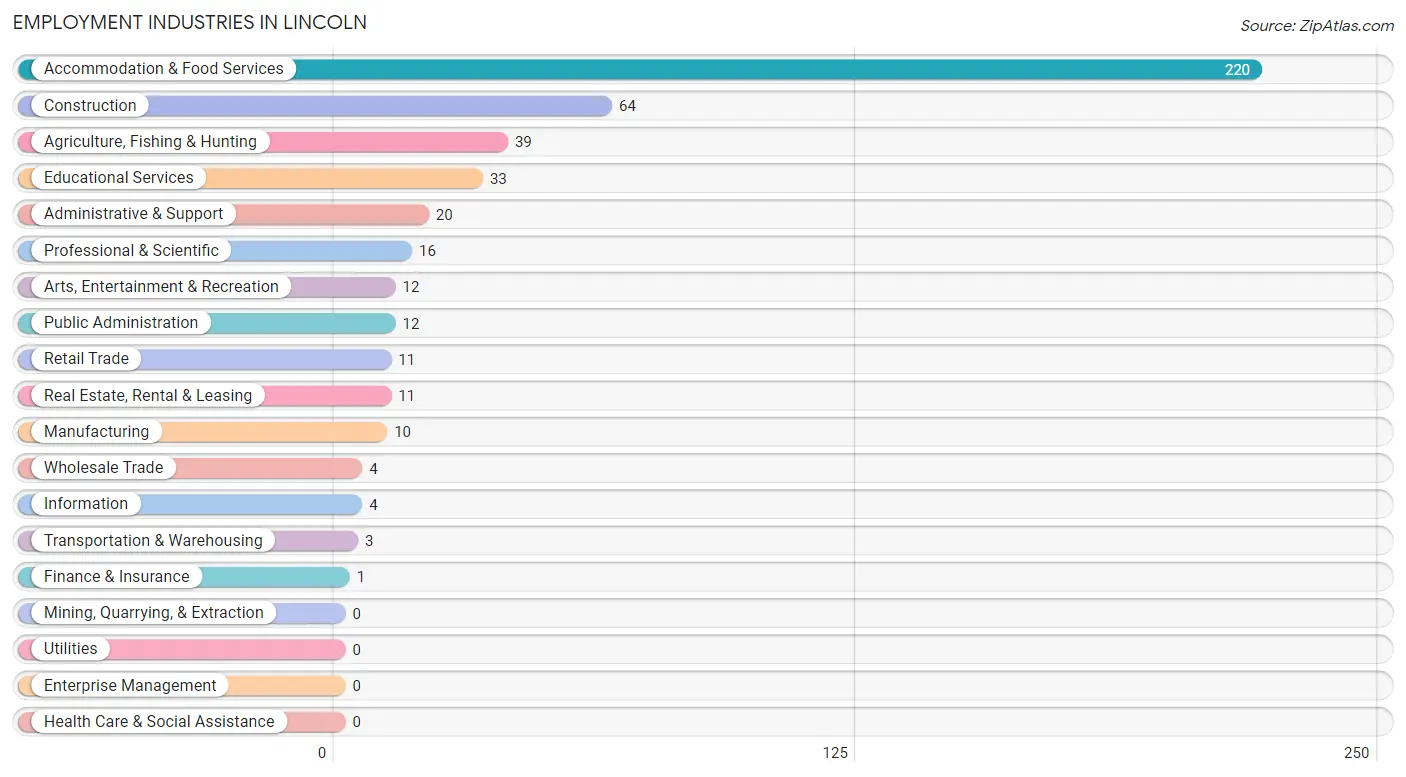
Employment Industries in Lincoln
The major employment industries in Lincoln include Accommodation & Food Services (220 | 46.4%), Construction (64 | 13.5%), Agriculture, Fishing & Hunting (39 | 8.2%), Educational Services (33 | 7.0%), and Administrative & Support (20 | 4.2%).
Employment Industries by Sex in Lincoln
The Lincoln industries that see more men than women are Agriculture, Fishing & Hunting (100.0%), Transportation & Warehousing (100.0%), and Information (100.0%), whereas the industries that tend to have a higher number of women are Manufacturing (100.0%), Wholesale Trade (100.0%), and Retail Trade (100.0%).
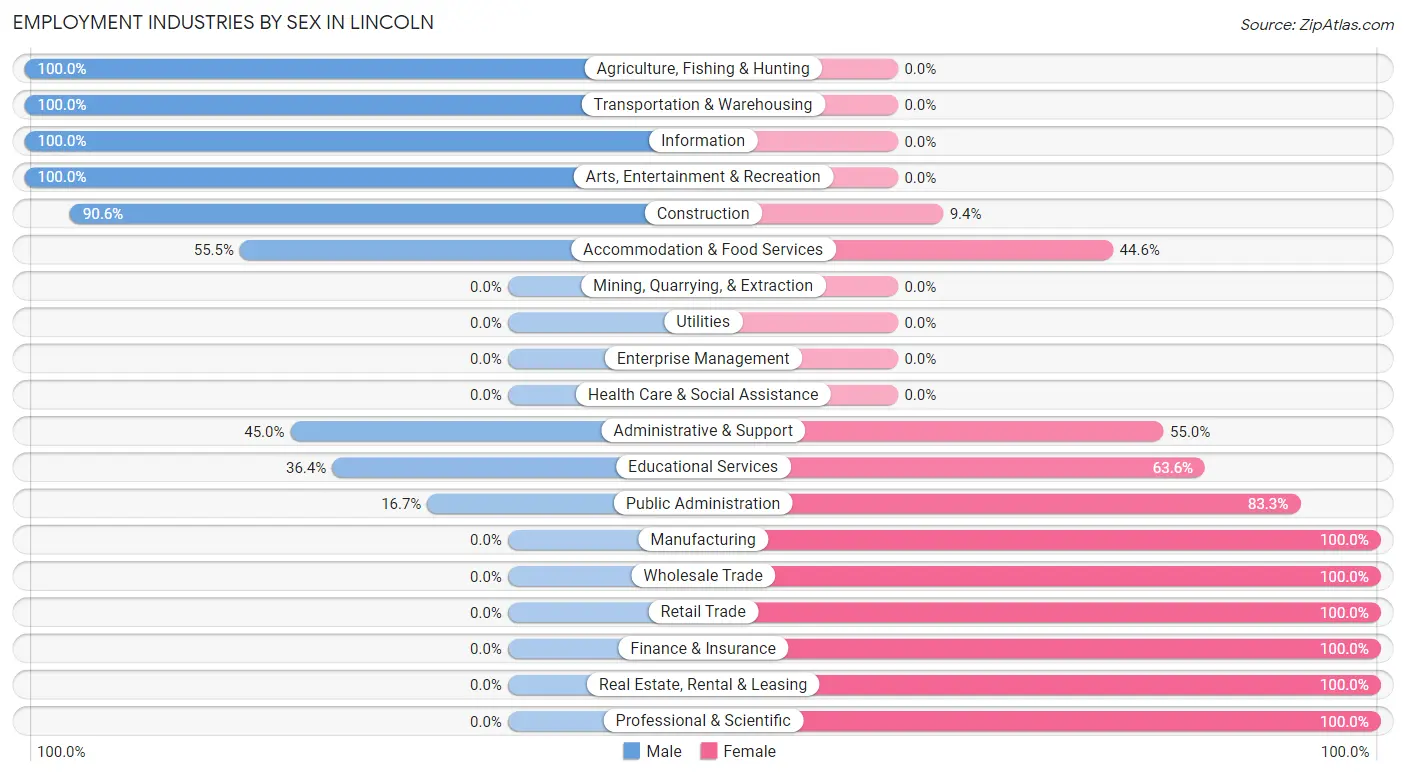
| Industry | Male | Female |
| Agriculture, Fishing & Hunting | 39 (100.0%) | 0 (0.0%) |
| Mining, Quarrying, & Extraction | 0 (0.0%) | 0 (0.0%) |
| Construction | 58 (90.6%) | 6 (9.4%) |
| Manufacturing | 0 (0.0%) | 10 (100.0%) |
| Wholesale Trade | 0 (0.0%) | 4 (100.0%) |
| Retail Trade | 0 (0.0%) | 11 (100.0%) |
| Transportation & Warehousing | 3 (100.0%) | 0 (0.0%) |
| Utilities | 0 (0.0%) | 0 (0.0%) |
| Information | 4 (100.0%) | 0 (0.0%) |
| Finance & Insurance | 0 (0.0%) | 1 (100.0%) |
| Real Estate, Rental & Leasing | 0 (0.0%) | 11 (100.0%) |
| Professional & Scientific | 0 (0.0%) | 16 (100.0%) |
| Enterprise Management | 0 (0.0%) | 0 (0.0%) |
| Administrative & Support | 9 (45.0%) | 11 (55.0%) |
| Educational Services | 12 (36.4%) | 21 (63.6%) |
| Health Care & Social Assistance | 0 (0.0%) | 0 (0.0%) |
| Arts, Entertainment & Recreation | 12 (100.0%) | 0 (0.0%) |
| Accommodation & Food Services | 122 (55.4%) | 98 (44.6%) |
| Public Administration | 2 (16.7%) | 10 (83.3%) |
| Total | 265 (55.9%) | 209 (44.1%) |
Education in Lincoln
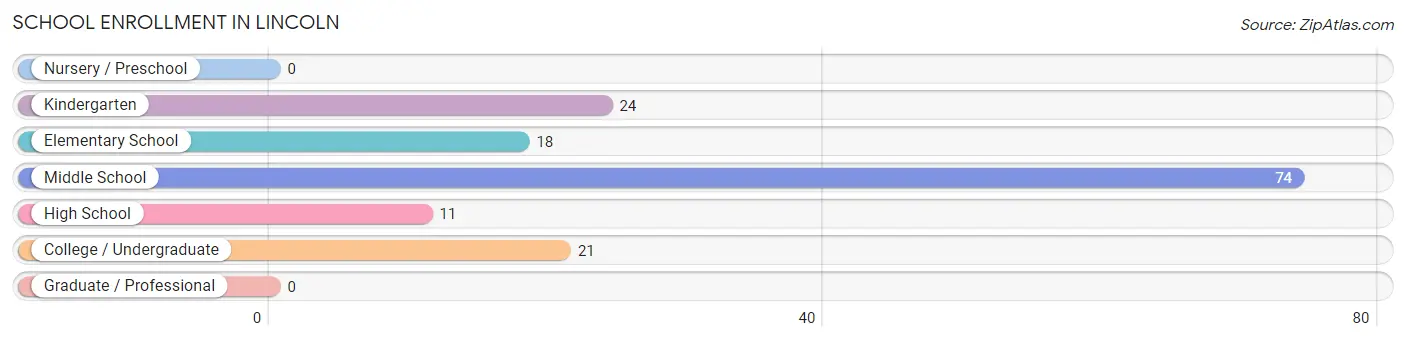
School Enrollment in Lincoln
The most common levels of schooling among the 148 students in Lincoln are middle school (74 | 50.0%), kindergarten (24 | 16.2%), and college / undergraduate (21 | 14.2%).
| School Level | # Students | % Students |
| Nursery / Preschool | 0 | 0.0% |
| Kindergarten | 24 | 16.2% |
| Elementary School | 18 | 12.2% |
| Middle School | 74 | 50.0% |
| High School | 11 | 7.4% |
| College / Undergraduate | 21 | 14.2% |
| Graduate / Professional | 0 | 0.0% |
| Total | 148 | 100.0% |
School Enrollment by Age by Funding Source in Lincoln
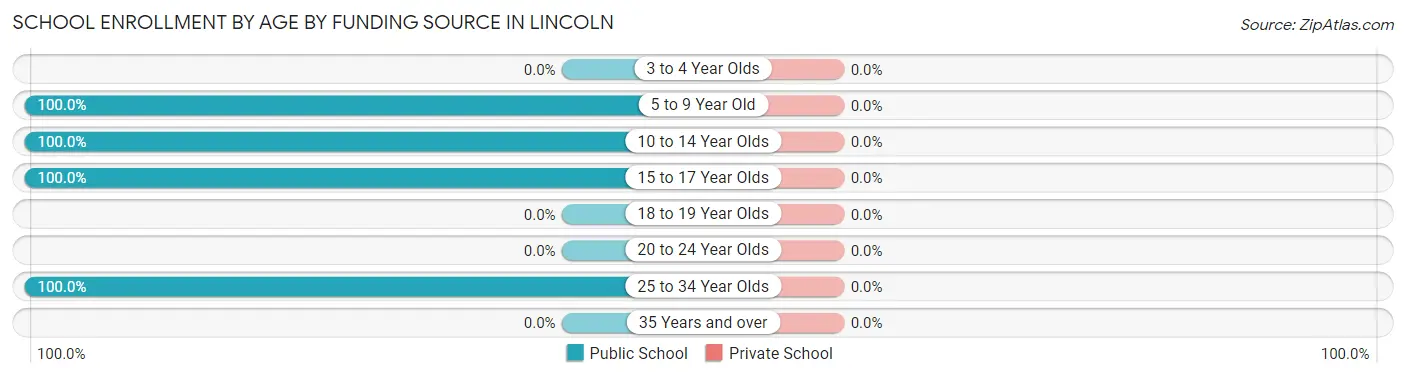
| Age Bracket | Public School | Private School |
| 3 to 4 Year Olds | 0 (0.0%) | 0 (0.0%) |
| 5 to 9 Year Old | 38 (100.0%) | 0 (0.0%) |
| 10 to 14 Year Olds | 78 (100.0%) | 0 (0.0%) |
| 15 to 17 Year Olds | 11 (100.0%) | 0 (0.0%) |
| 18 to 19 Year Olds | 0 (0.0%) | 0 (0.0%) |
| 20 to 24 Year Olds | 0 (0.0%) | 0 (0.0%) |
| 25 to 34 Year Olds | 21 (100.0%) | 0 (0.0%) |
| 35 Years and over | 0 (0.0%) | 0 (0.0%) |
| Total | 148 (100.0%) | 0 (0.0%) |
Educational Attainment by Field of Study in Lincoln
Education (38 | 23.5%), visual & performing arts (26 | 16.1%), communications (22 | 13.6%), science & technology (21 | 13.0%), and business (19 | 11.7%) are the most common fields of study among 162 individuals in Lincoln who have obtained a bachelor's degree or higher.
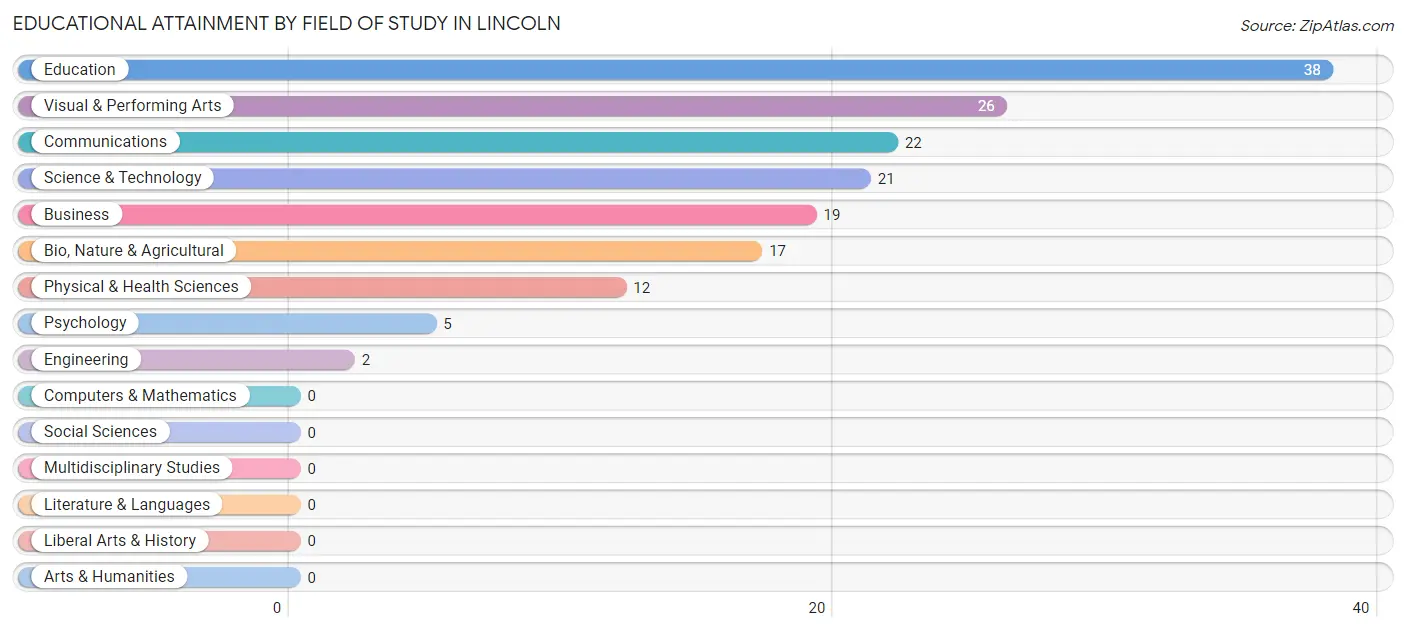
| Field of Study | # Graduates | % Graduates |
| Computers & Mathematics | 0 | 0.0% |
| Bio, Nature & Agricultural | 17 | 10.5% |
| Physical & Health Sciences | 12 | 7.4% |
| Psychology | 5 | 3.1% |
| Social Sciences | 0 | 0.0% |
| Engineering | 2 | 1.2% |
| Multidisciplinary Studies | 0 | 0.0% |
| Science & Technology | 21 | 13.0% |
| Business | 19 | 11.7% |
| Education | 38 | 23.5% |
| Literature & Languages | 0 | 0.0% |
| Liberal Arts & History | 0 | 0.0% |
| Visual & Performing Arts | 26 | 16.1% |
| Communications | 22 | 13.6% |
| Arts & Humanities | 0 | 0.0% |
| Total | 162 | 100.0% |
Transportation & Commute in Lincoln
Vehicle Availability by Sex in Lincoln
The most prevalent vehicle ownership categories in Lincoln are males with 3 vehicles (150, accounting for 59.1%) and females with 3 vehicles (70, making up 71.8%).
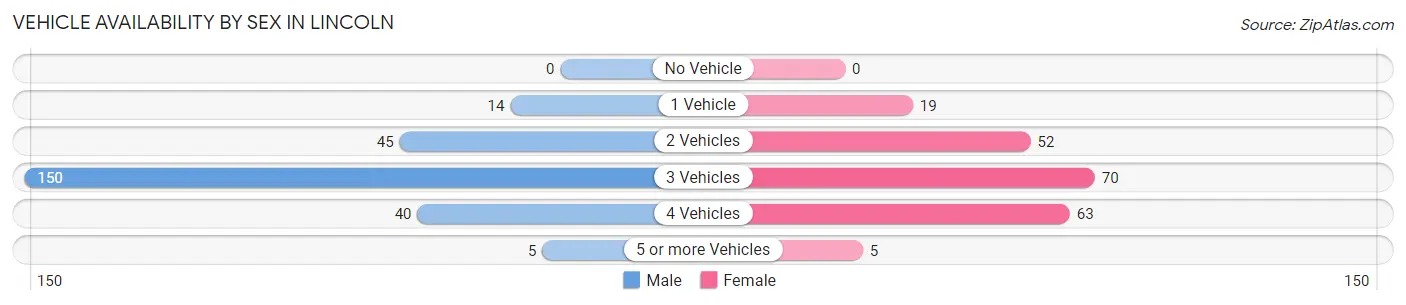
| Vehicles Available | Male | Female |
| No Vehicle | 0 (0.0%) | 0 (0.0%) |
| 1 Vehicle | 14 (5.5%) | 19 (9.1%) |
| 2 Vehicles | 45 (17.7%) | 52 (24.9%) |
| 3 Vehicles | 150 (59.1%) | 70 (33.5%) |
| 4 Vehicles | 40 (15.8%) | 63 (30.1%) |
| 5 or more Vehicles | 5 (2.0%) | 5 (2.4%) |
| Total | 254 (100.0%) | 209 (100.0%) |
Commute Time in Lincoln
The most frequently occuring commute durations in Lincoln are 5 to 9 minutes (166 commuters, 53.9%), less than 5 minutes (64 commuters, 20.8%), and 10 to 14 minutes (47 commuters, 15.3%).
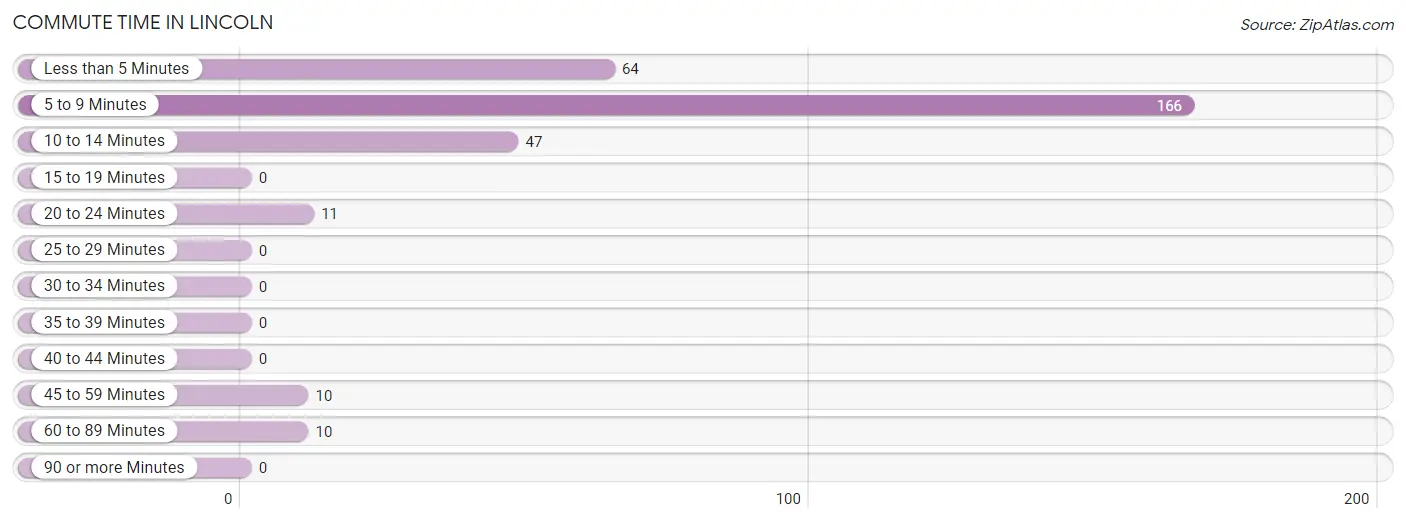
| Commute Time | # Commuters | % Commuters |
| Less than 5 Minutes | 64 | 20.8% |
| 5 to 9 Minutes | 166 | 53.9% |
| 10 to 14 Minutes | 47 | 15.3% |
| 15 to 19 Minutes | 0 | 0.0% |
| 20 to 24 Minutes | 11 | 3.6% |
| 25 to 29 Minutes | 0 | 0.0% |
| 30 to 34 Minutes | 0 | 0.0% |
| 35 to 39 Minutes | 0 | 0.0% |
| 40 to 44 Minutes | 0 | 0.0% |
| 45 to 59 Minutes | 10 | 3.3% |
| 60 to 89 Minutes | 10 | 3.3% |
| 90 or more Minutes | 0 | 0.0% |
Commute Time by Sex in Lincoln
The most common commute times in Lincoln are 5 to 9 minutes (80 commuters, 46.2%) for males and 5 to 9 minutes (86 commuters, 63.7%) for females.
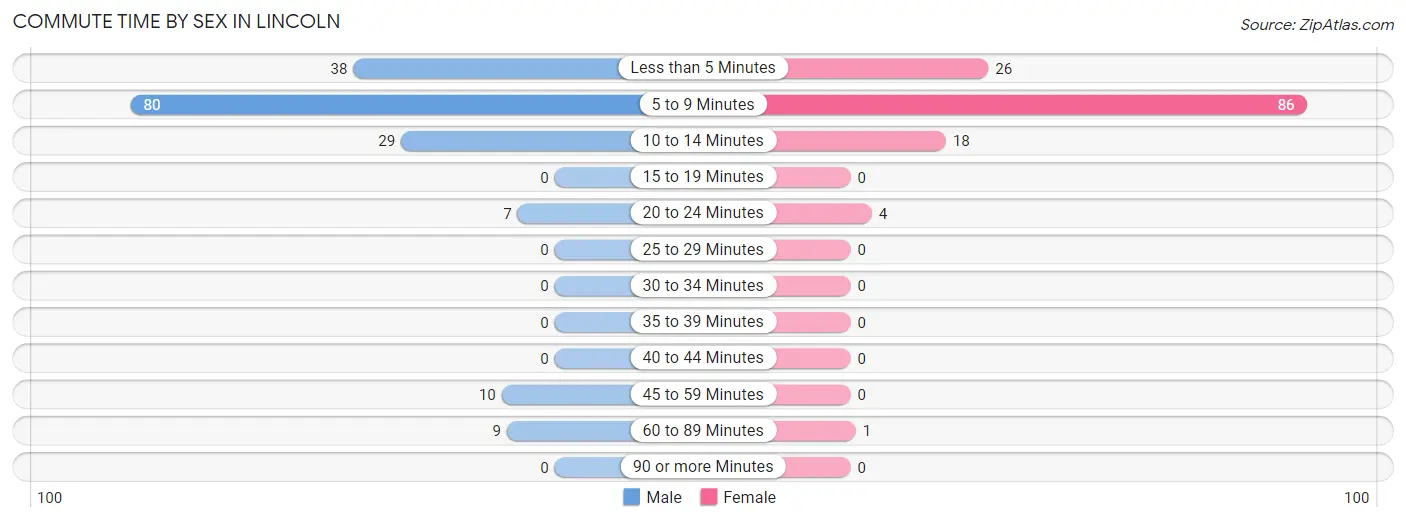
| Commute Time | Male | Female |
| Less than 5 Minutes | 38 (22.0%) | 26 (19.3%) |
| 5 to 9 Minutes | 80 (46.2%) | 86 (63.7%) |
| 10 to 14 Minutes | 29 (16.8%) | 18 (13.3%) |
| 15 to 19 Minutes | 0 (0.0%) | 0 (0.0%) |
| 20 to 24 Minutes | 7 (4.1%) | 4 (3.0%) |
| 25 to 29 Minutes | 0 (0.0%) | 0 (0.0%) |
| 30 to 34 Minutes | 0 (0.0%) | 0 (0.0%) |
| 35 to 39 Minutes | 0 (0.0%) | 0 (0.0%) |
| 40 to 44 Minutes | 0 (0.0%) | 0 (0.0%) |
| 45 to 59 Minutes | 10 (5.8%) | 0 (0.0%) |
| 60 to 89 Minutes | 9 (5.2%) | 1 (0.7%) |
| 90 or more Minutes | 0 (0.0%) | 0 (0.0%) |
Time of Departure to Work by Sex in Lincoln
The most frequent times of departure to work in Lincoln are 8:00 AM to 8:29 AM (42, 24.3%) for males and 4:00 PM to 11:59 PM (47, 34.8%) for females.
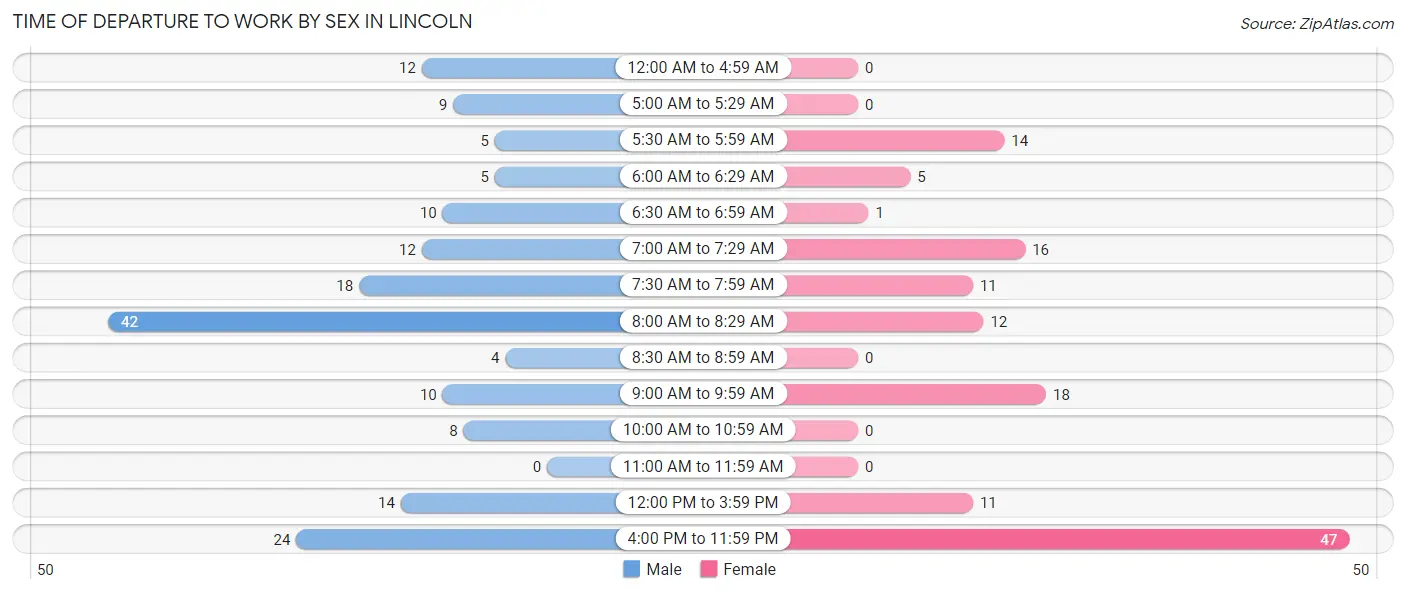
| Time of Departure | Male | Female |
| 12:00 AM to 4:59 AM | 12 (6.9%) | 0 (0.0%) |
| 5:00 AM to 5:29 AM | 9 (5.2%) | 0 (0.0%) |
| 5:30 AM to 5:59 AM | 5 (2.9%) | 14 (10.4%) |
| 6:00 AM to 6:29 AM | 5 (2.9%) | 5 (3.7%) |
| 6:30 AM to 6:59 AM | 10 (5.8%) | 1 (0.7%) |
| 7:00 AM to 7:29 AM | 12 (6.9%) | 16 (11.8%) |
| 7:30 AM to 7:59 AM | 18 (10.4%) | 11 (8.2%) |
| 8:00 AM to 8:29 AM | 42 (24.3%) | 12 (8.9%) |
| 8:30 AM to 8:59 AM | 4 (2.3%) | 0 (0.0%) |
| 9:00 AM to 9:59 AM | 10 (5.8%) | 18 (13.3%) |
| 10:00 AM to 10:59 AM | 8 (4.6%) | 0 (0.0%) |
| 11:00 AM to 11:59 AM | 0 (0.0%) | 0 (0.0%) |
| 12:00 PM to 3:59 PM | 14 (8.1%) | 11 (8.2%) |
| 4:00 PM to 11:59 PM | 24 (13.9%) | 47 (34.8%) |
| Total | 173 (100.0%) | 135 (100.0%) |
Housing Occupancy in Lincoln
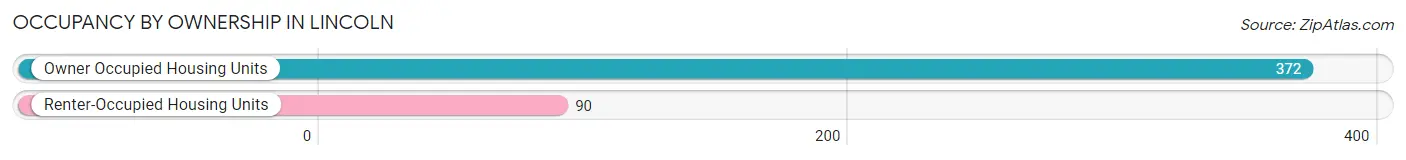
Occupancy by Ownership in Lincoln
Of the total 462 dwellings in Lincoln, owner-occupied units account for 372 (80.5%), while renter-occupied units make up 90 (19.5%).
| Occupancy | # Housing Units | % Housing Units |
| Owner Occupied Housing Units | 372 | 80.5% |
| Renter-Occupied Housing Units | 90 | 19.5% |
| Total Occupied Housing Units | 462 | 100.0% |
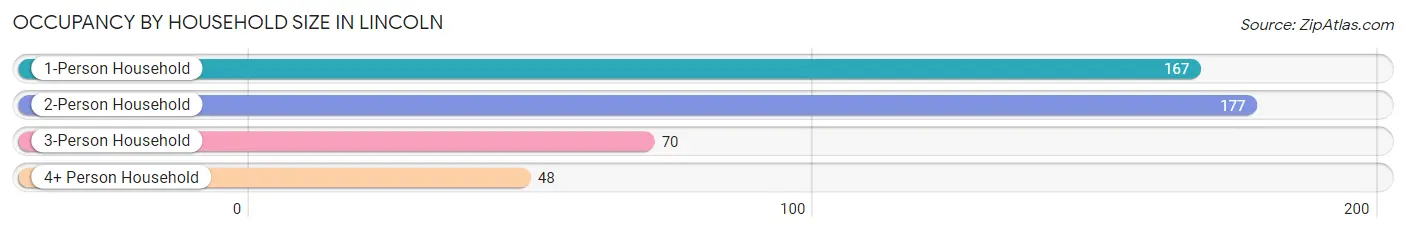
Occupancy by Household Size in Lincoln
| Household Size | # Housing Units | % Housing Units |
| 1-Person Household | 167 | 36.1% |
| 2-Person Household | 177 | 38.3% |
| 3-Person Household | 70 | 15.1% |
| 4+ Person Household | 48 | 10.4% |
| Total Housing Units | 462 | 100.0% |
Occupancy by Ownership by Household Size in Lincoln
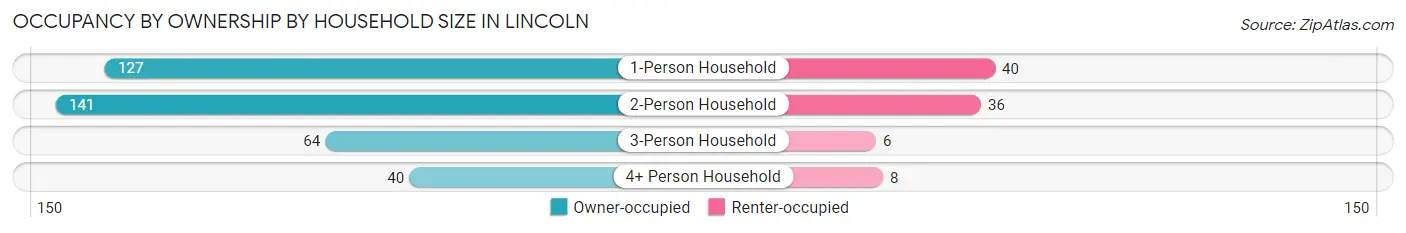
| Household Size | Owner-occupied | Renter-occupied |
| 1-Person Household | 127 (76.0%) | 40 (23.9%) |
| 2-Person Household | 141 (79.7%) | 36 (20.3%) |
| 3-Person Household | 64 (91.4%) | 6 (8.6%) |
| 4+ Person Household | 40 (83.3%) | 8 (16.7%) |
| Total Housing Units | 372 (80.5%) | 90 (19.5%) |
Occupancy by Educational Attainment in Lincoln
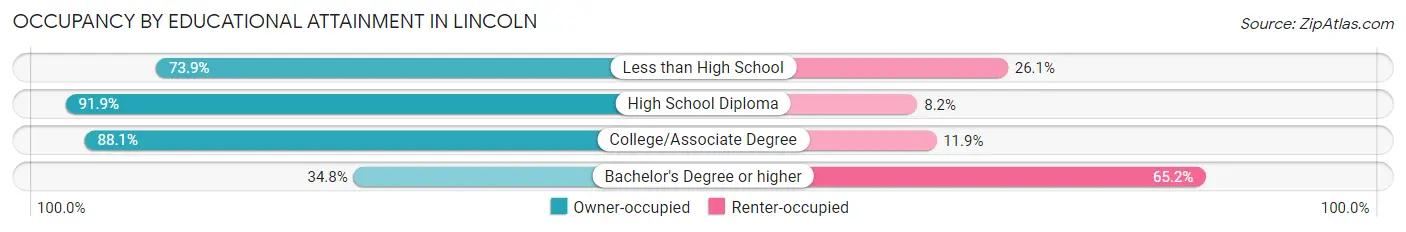
| Household Size | Owner-occupied | Renter-occupied |
| Less than High School | 17 (73.9%) | 6 (26.1%) |
| High School Diploma | 124 (91.8%) | 11 (8.2%) |
| College/Associate Degree | 207 (88.1%) | 28 (11.9%) |
| Bachelor's Degree or higher | 24 (34.8%) | 45 (65.2%) |
Occupancy by Age of Householder in Lincoln
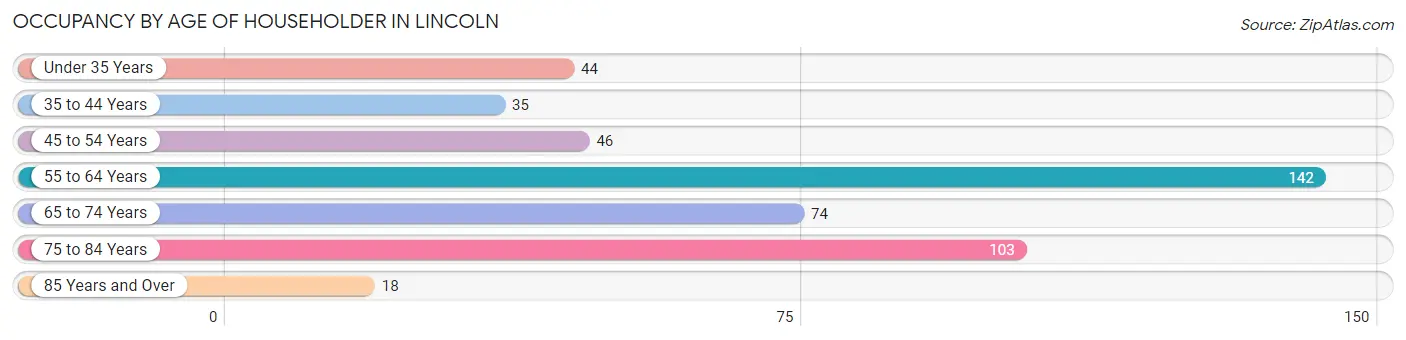
| Age Bracket | # Households | % Households |
| Under 35 Years | 44 | 9.5% |
| 35 to 44 Years | 35 | 7.6% |
| 45 to 54 Years | 46 | 10.0% |
| 55 to 64 Years | 142 | 30.7% |
| 65 to 74 Years | 74 | 16.0% |
| 75 to 84 Years | 103 | 22.3% |
| 85 Years and Over | 18 | 3.9% |
| Total | 462 | 100.0% |
Housing Finances in Lincoln
Median Income by Occupancy in Lincoln
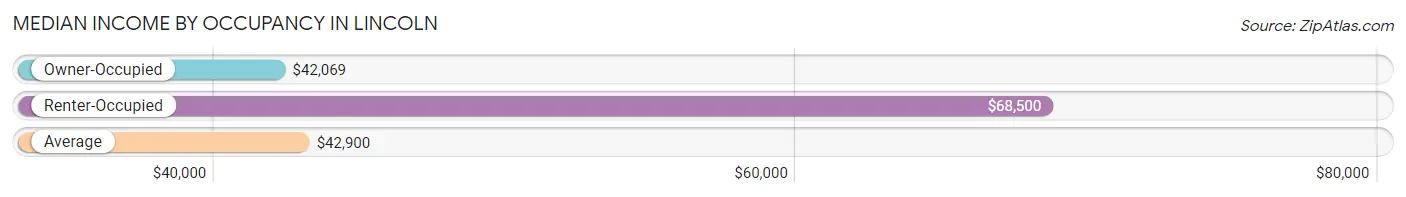
| Occupancy Type | # Households | Median Income |
| Owner-Occupied | 372 (80.5%) | $42,069 |
| Renter-Occupied | 90 (19.5%) | $68,500 |
| Average | 462 (100.0%) | $42,900 |
Occupancy by Householder Income Bracket in Lincoln
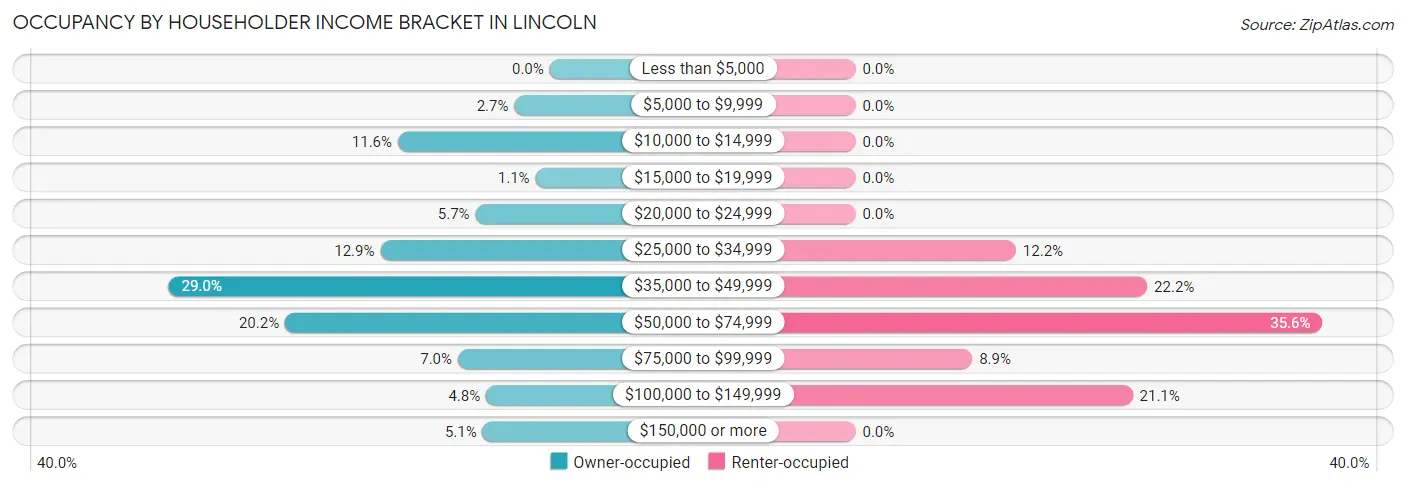
| Income Bracket | Owner-occupied | Renter-occupied |
| Less than $5,000 | 0 (0.0%) | 0 (0.0%) |
| $5,000 to $9,999 | 10 (2.7%) | 0 (0.0%) |
| $10,000 to $14,999 | 43 (11.6%) | 0 (0.0%) |
| $15,000 to $19,999 | 4 (1.1%) | 0 (0.0%) |
| $20,000 to $24,999 | 21 (5.7%) | 0 (0.0%) |
| $25,000 to $34,999 | 48 (12.9%) | 11 (12.2%) |
| $35,000 to $49,999 | 108 (29.0%) | 20 (22.2%) |
| $50,000 to $74,999 | 75 (20.2%) | 32 (35.6%) |
| $75,000 to $99,999 | 26 (7.0%) | 8 (8.9%) |
| $100,000 to $149,999 | 18 (4.8%) | 19 (21.1%) |
| $150,000 or more | 19 (5.1%) | 0 (0.0%) |
| Total | 372 (100.0%) | 90 (100.0%) |
Monthly Housing Cost Tiers in Lincoln
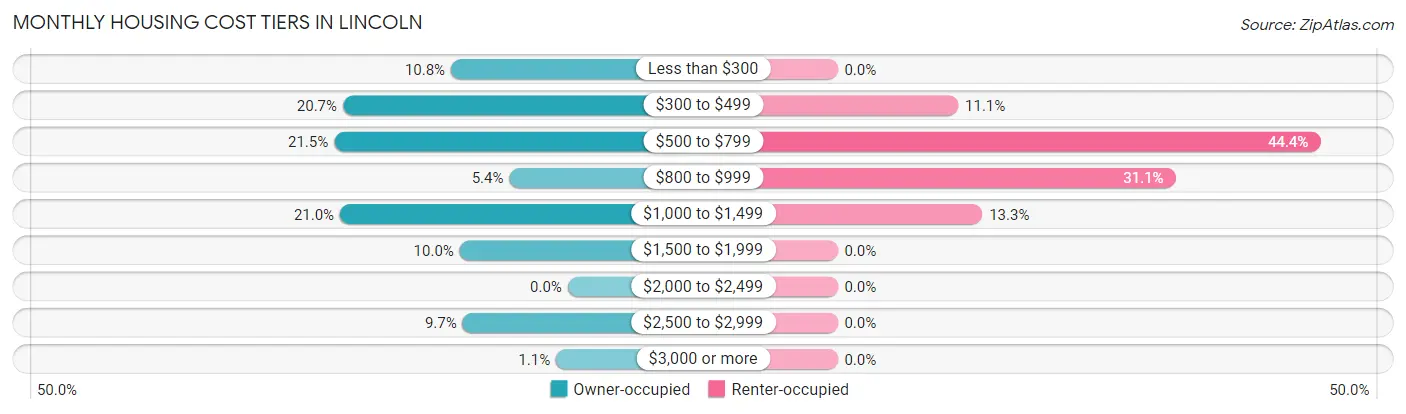
| Monthly Cost | Owner-occupied | Renter-occupied |
| Less than $300 | 40 (10.7%) | 0 (0.0%) |
| $300 to $499 | 77 (20.7%) | 10 (11.1%) |
| $500 to $799 | 80 (21.5%) | 40 (44.4%) |
| $800 to $999 | 20 (5.4%) | 28 (31.1%) |
| $1,000 to $1,499 | 78 (21.0%) | 12 (13.3%) |
| $1,500 to $1,999 | 37 (10.0%) | 0 (0.0%) |
| $2,000 to $2,499 | 0 (0.0%) | 0 (0.0%) |
| $2,500 to $2,999 | 36 (9.7%) | 0 (0.0%) |
| $3,000 or more | 4 (1.1%) | 0 (0.0%) |
| Total | 372 (100.0%) | 90 (100.0%) |
Physical Housing Characteristics in Lincoln
Housing Structures in Lincoln
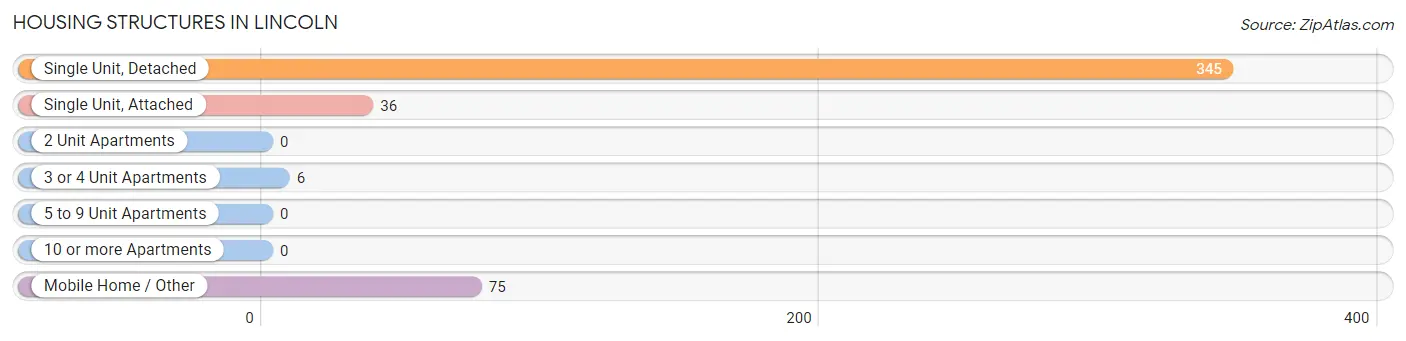
| Structure Type | # Housing Units | % Housing Units |
| Single Unit, Detached | 345 | 74.7% |
| Single Unit, Attached | 36 | 7.8% |
| 2 Unit Apartments | 0 | 0.0% |
| 3 or 4 Unit Apartments | 6 | 1.3% |
| 5 to 9 Unit Apartments | 0 | 0.0% |
| 10 or more Apartments | 0 | 0.0% |
| Mobile Home / Other | 75 | 16.2% |
| Total | 462 | 100.0% |
Housing Structures by Occupancy in Lincoln
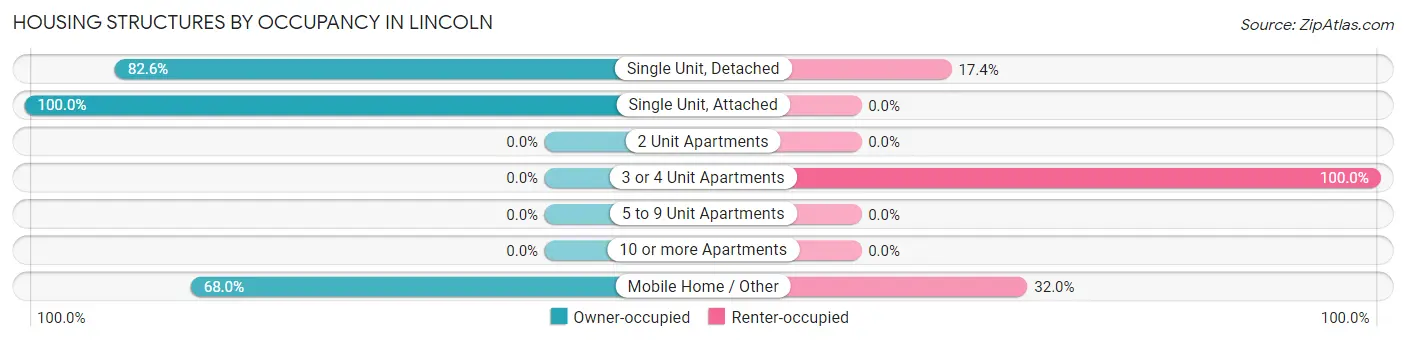
| Structure Type | Owner-occupied | Renter-occupied |
| Single Unit, Detached | 285 (82.6%) | 60 (17.4%) |
| Single Unit, Attached | 36 (100.0%) | 0 (0.0%) |
| 2 Unit Apartments | 0 (0.0%) | 0 (0.0%) |
| 3 or 4 Unit Apartments | 0 (0.0%) | 6 (100.0%) |
| 5 to 9 Unit Apartments | 0 (0.0%) | 0 (0.0%) |
| 10 or more Apartments | 0 (0.0%) | 0 (0.0%) |
| Mobile Home / Other | 51 (68.0%) | 24 (32.0%) |
| Total | 372 (80.5%) | 90 (19.5%) |
Housing Structures by Number of Rooms in Lincoln
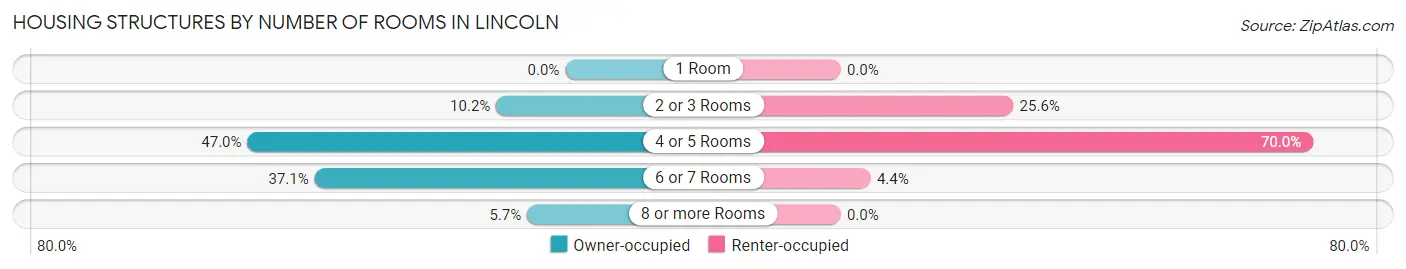
| Number of Rooms | Owner-occupied | Renter-occupied |
| 1 Room | 0 (0.0%) | 0 (0.0%) |
| 2 or 3 Rooms | 38 (10.2%) | 23 (25.6%) |
| 4 or 5 Rooms | 175 (47.0%) | 63 (70.0%) |
| 6 or 7 Rooms | 138 (37.1%) | 4 (4.4%) |
| 8 or more Rooms | 21 (5.7%) | 0 (0.0%) |
| Total | 372 (100.0%) | 90 (100.0%) |
Housing Structure by Heating Type in Lincoln
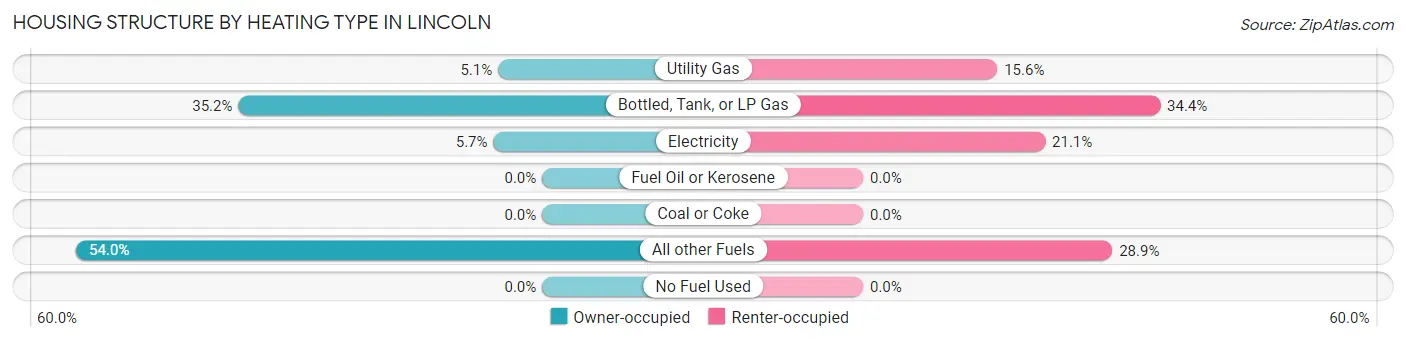
| Heating Type | Owner-occupied | Renter-occupied |
| Utility Gas | 19 (5.1%) | 14 (15.6%) |
| Bottled, Tank, or LP Gas | 131 (35.2%) | 31 (34.4%) |
| Electricity | 21 (5.7%) | 19 (21.1%) |
| Fuel Oil or Kerosene | 0 (0.0%) | 0 (0.0%) |
| Coal or Coke | 0 (0.0%) | 0 (0.0%) |
| All other Fuels | 201 (54.0%) | 26 (28.9%) |
| No Fuel Used | 0 (0.0%) | 0 (0.0%) |
| Total | 372 (100.0%) | 90 (100.0%) |
Household Vehicle Usage in Lincoln
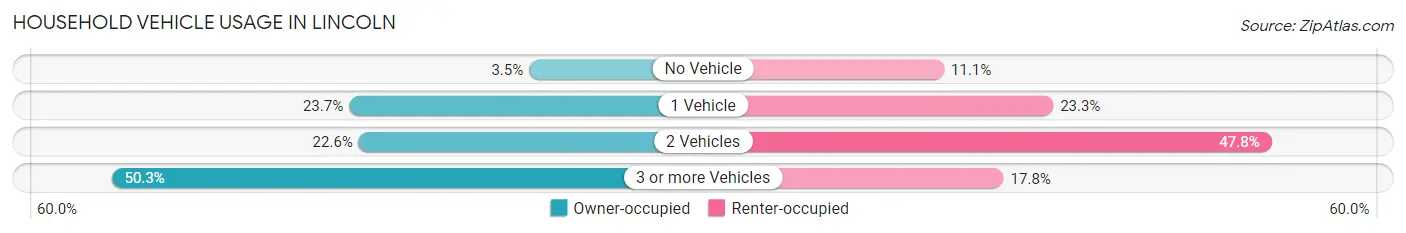
| Vehicles per Household | Owner-occupied | Renter-occupied |
| No Vehicle | 13 (3.5%) | 10 (11.1%) |
| 1 Vehicle | 88 (23.7%) | 21 (23.3%) |
| 2 Vehicles | 84 (22.6%) | 43 (47.8%) |
| 3 or more Vehicles | 187 (50.3%) | 16 (17.8%) |
| Total | 372 (100.0%) | 90 (100.0%) |
Real Estate & Mortgages in Lincoln
Real Estate and Mortgage Overview in Lincoln
| Characteristic | Without Mortgage | With Mortgage |
| Housing Units | 197 | 175 |
| Median Property Value | $224,300 | $294,300 |
| Median Household Income | $42,125 | $13 |
| Monthly Housing Costs | $468 | $4 |
| Real Estate Taxes | $1,444 | $16 |
Property Value by Mortgage Status in Lincoln
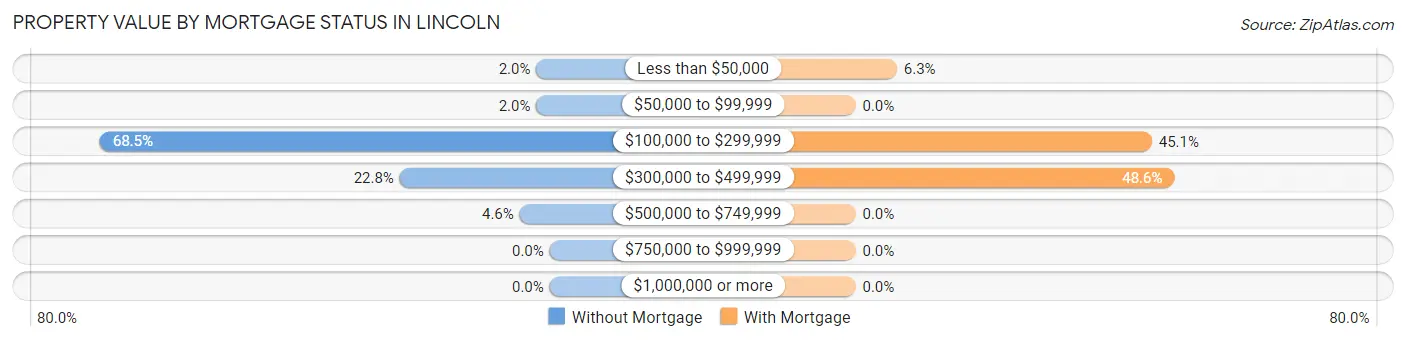
| Property Value | Without Mortgage | With Mortgage |
| Less than $50,000 | 4 (2.0%) | 11 (6.3%) |
| $50,000 to $99,999 | 4 (2.0%) | 0 (0.0%) |
| $100,000 to $299,999 | 135 (68.5%) | 79 (45.1%) |
| $300,000 to $499,999 | 45 (22.8%) | 85 (48.6%) |
| $500,000 to $749,999 | 9 (4.6%) | 0 (0.0%) |
| $750,000 to $999,999 | 0 (0.0%) | 0 (0.0%) |
| $1,000,000 or more | 0 (0.0%) | 0 (0.0%) |
| Total | 197 (100.0%) | 175 (100.0%) |
Household Income by Mortgage Status in Lincoln
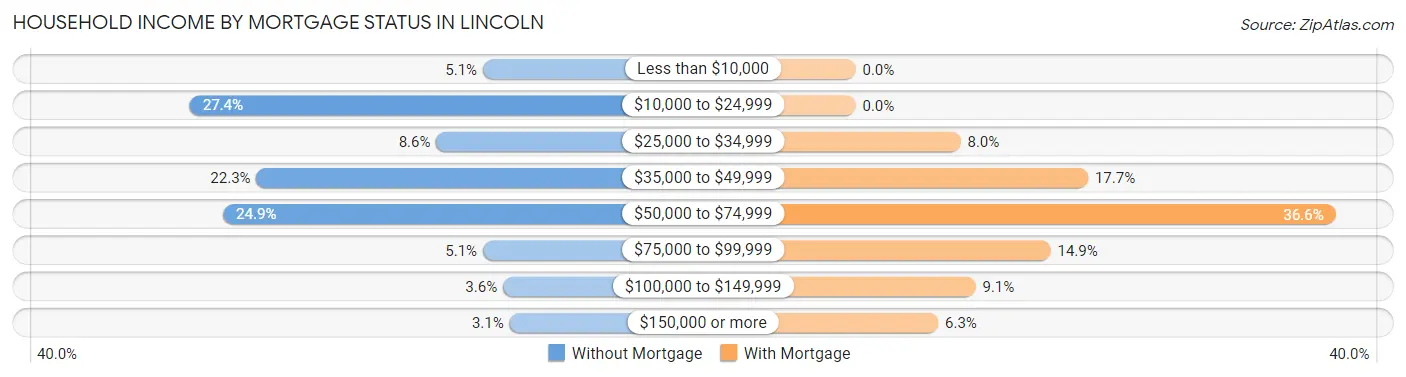
| Household Income | Without Mortgage | With Mortgage |
| Less than $10,000 | 10 (5.1%) | 0 (0.0%) |
| $10,000 to $24,999 | 54 (27.4%) | 0 (0.0%) |
| $25,000 to $34,999 | 17 (8.6%) | 14 (8.0%) |
| $35,000 to $49,999 | 44 (22.3%) | 31 (17.7%) |
| $50,000 to $74,999 | 49 (24.9%) | 64 (36.6%) |
| $75,000 to $99,999 | 10 (5.1%) | 26 (14.9%) |
| $100,000 to $149,999 | 7 (3.5%) | 16 (9.1%) |
| $150,000 or more | 6 (3.0%) | 11 (6.3%) |
| Total | 197 (100.0%) | 175 (100.0%) |
Property Value to Household Income Ratio in Lincoln
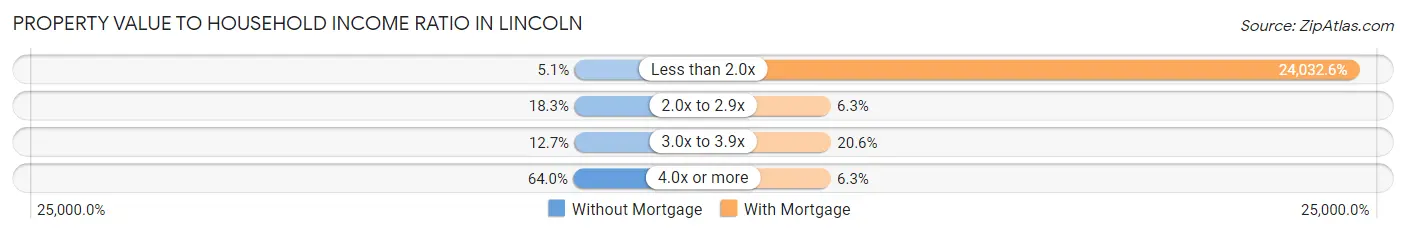
| Value-to-Income Ratio | Without Mortgage | With Mortgage |
| Less than 2.0x | 10 (5.1%) | 42,057 (24,032.6%) |
| 2.0x to 2.9x | 36 (18.3%) | 11 (6.3%) |
| 3.0x to 3.9x | 25 (12.7%) | 36 (20.6%) |
| 4.0x or more | 126 (64.0%) | 11 (6.3%) |
| Total | 197 (100.0%) | 175 (100.0%) |
Real Estate Taxes by Mortgage Status in Lincoln
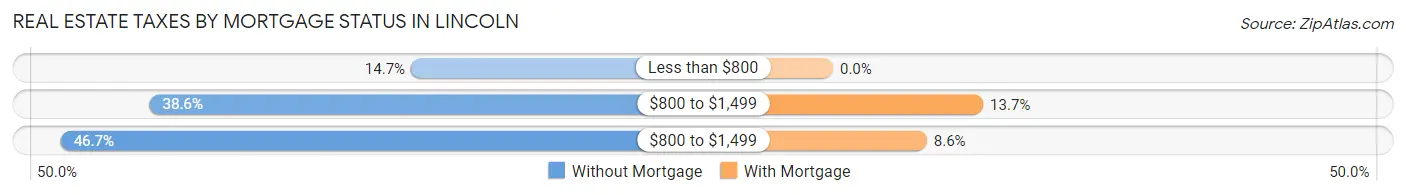
| Property Taxes | Without Mortgage | With Mortgage |
| Less than $800 | 29 (14.7%) | 0 (0.0%) |
| $800 to $1,499 | 76 (38.6%) | 24 (13.7%) |
| $800 to $1,499 | 92 (46.7%) | 15 (8.6%) |
| Total | 197 (100.0%) | 175 (100.0%) |
Health & Disability in Lincoln
Health Insurance Coverage by Age in Lincoln
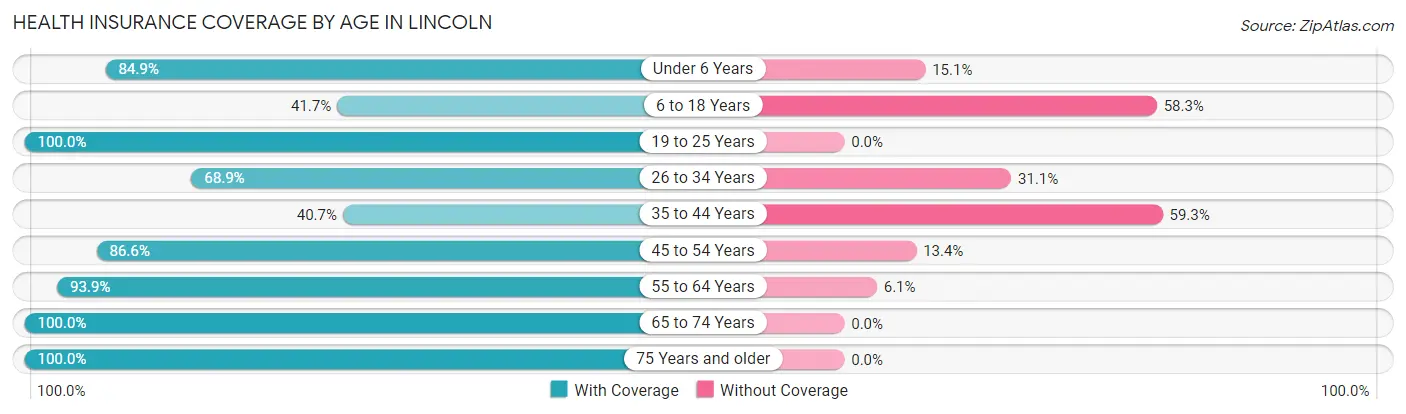
| Age Bracket | With Coverage | Without Coverage |
| Under 6 Years | 45 (84.9%) | 8 (15.1%) |
| 6 to 18 Years | 48 (41.7%) | 67 (58.3%) |
| 19 to 25 Years | 44 (100.0%) | 0 (0.0%) |
| 26 to 34 Years | 93 (68.9%) | 42 (31.1%) |
| 35 to 44 Years | 37 (40.7%) | 54 (59.3%) |
| 45 to 54 Years | 71 (86.6%) | 11 (13.4%) |
| 55 to 64 Years | 186 (93.9%) | 12 (6.1%) |
| 65 to 74 Years | 163 (100.0%) | 0 (0.0%) |
| 75 Years and older | 124 (100.0%) | 0 (0.0%) |
| Total | 811 (80.7%) | 194 (19.3%) |
Health Insurance Coverage by Citizenship Status in Lincoln
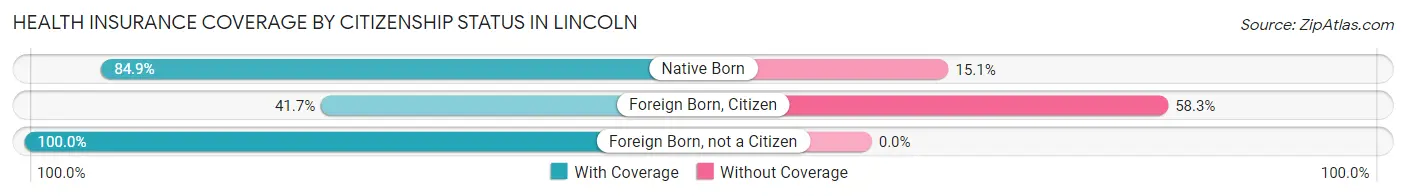
| Citizenship Status | With Coverage | Without Coverage |
| Native Born | 45 (84.9%) | 8 (15.1%) |
| Foreign Born, Citizen | 48 (41.7%) | 67 (58.3%) |
| Foreign Born, not a Citizen | 44 (100.0%) | 0 (0.0%) |
Health Insurance Coverage by Household Income in Lincoln
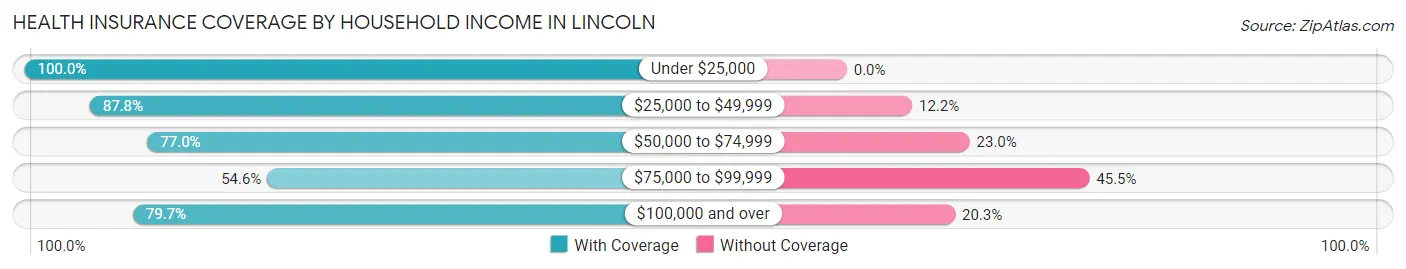
| Household Income | With Coverage | Without Coverage |
| Under $25,000 | 82 (100.0%) | 0 (0.0%) |
| $25,000 to $49,999 | 359 (87.8%) | 50 (12.2%) |
| $50,000 to $74,999 | 184 (77.0%) | 55 (23.0%) |
| $75,000 to $99,999 | 72 (54.5%) | 60 (45.5%) |
| $100,000 and over | 114 (79.7%) | 29 (20.3%) |
Public vs Private Health Insurance Coverage by Age in Lincoln
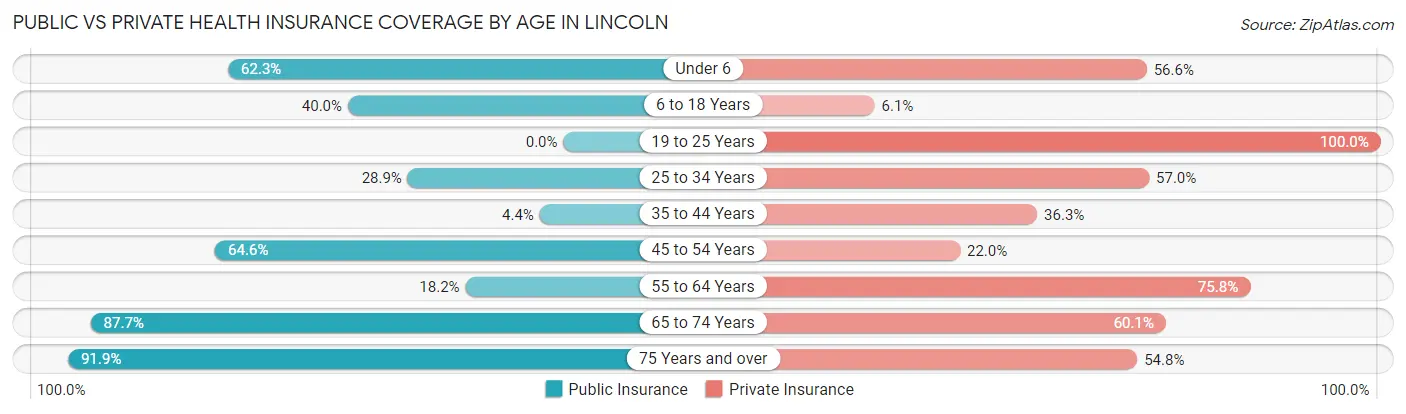
| Age Bracket | Public Insurance | Private Insurance |
| Under 6 | 33 (62.3%) | 30 (56.6%) |
| 6 to 18 Years | 46 (40.0%) | 7 (6.1%) |
| 19 to 25 Years | 0 (0.0%) | 44 (100.0%) |
| 25 to 34 Years | 39 (28.9%) | 77 (57.0%) |
| 35 to 44 Years | 4 (4.4%) | 33 (36.3%) |
| 45 to 54 Years | 53 (64.6%) | 18 (22.0%) |
| 55 to 64 Years | 36 (18.2%) | 150 (75.8%) |
| 65 to 74 Years | 143 (87.7%) | 98 (60.1%) |
| 75 Years and over | 114 (91.9%) | 68 (54.8%) |
| Total | 468 (46.6%) | 525 (52.2%) |
Disability Status by Sex by Age in Lincoln
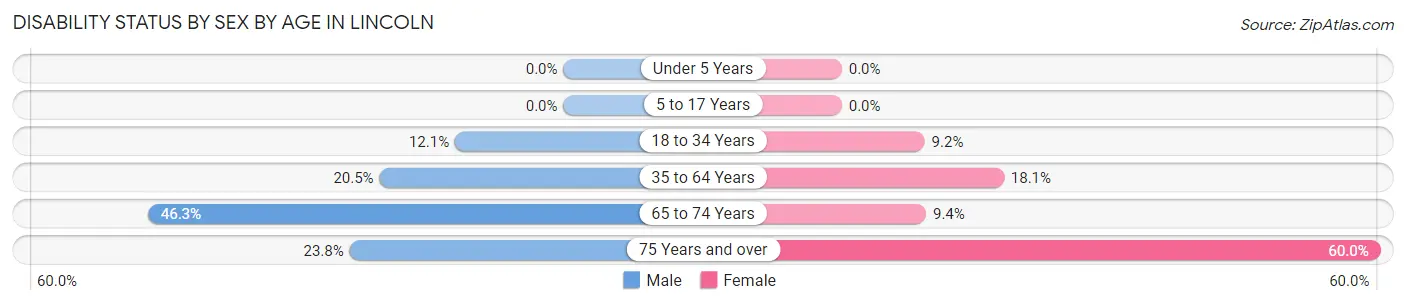
| Age Bracket | Male | Female |
| Under 5 Years | 0 (0.0%) | 0 (0.0%) |
| 5 to 17 Years | 0 (0.0%) | 0 (0.0%) |
| 18 to 34 Years | 14 (12.1%) | 6 (9.2%) |
| 35 to 64 Years | 34 (20.5%) | 37 (18.0%) |
| 65 to 74 Years | 31 (46.3%) | 9 (9.4%) |
| 75 Years and over | 20 (23.8%) | 24 (60.0%) |
Disability Class by Sex by Age in Lincoln
Disability Class: Hearing Difficulty
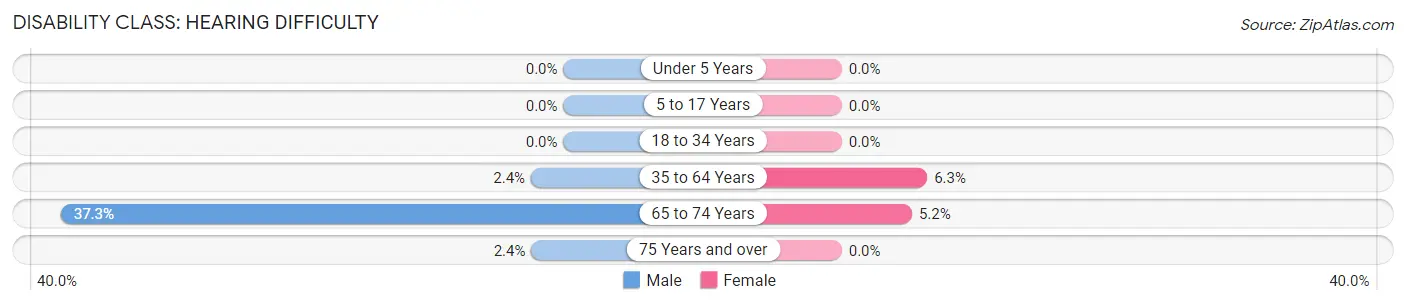
| Age Bracket | Male | Female |
| Under 5 Years | 0 (0.0%) | 0 (0.0%) |
| 5 to 17 Years | 0 (0.0%) | 0 (0.0%) |
| 18 to 34 Years | 0 (0.0%) | 0 (0.0%) |
| 35 to 64 Years | 4 (2.4%) | 13 (6.3%) |
| 65 to 74 Years | 25 (37.3%) | 5 (5.2%) |
| 75 Years and over | 2 (2.4%) | 0 (0.0%) |
Disability Class: Vision Difficulty
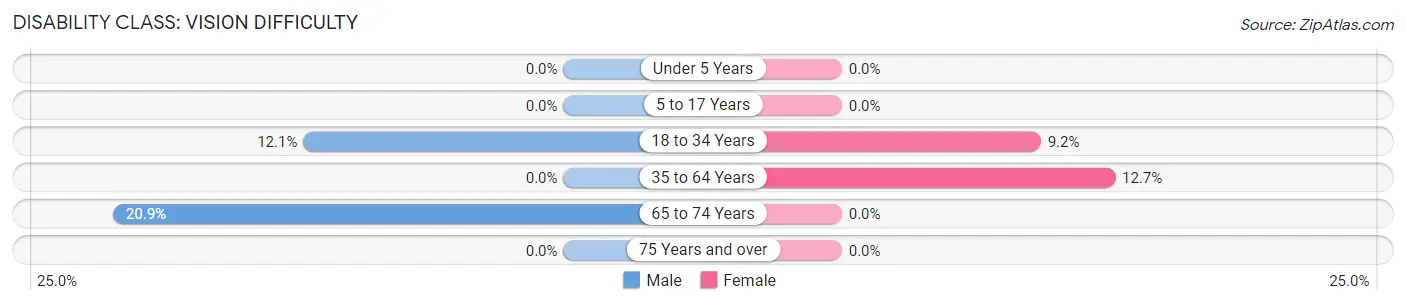
| Age Bracket | Male | Female |
| Under 5 Years | 0 (0.0%) | 0 (0.0%) |
| 5 to 17 Years | 0 (0.0%) | 0 (0.0%) |
| 18 to 34 Years | 14 (12.1%) | 6 (9.2%) |
| 35 to 64 Years | 0 (0.0%) | 26 (12.7%) |
| 65 to 74 Years | 14 (20.9%) | 0 (0.0%) |
| 75 Years and over | 0 (0.0%) | 0 (0.0%) |
Disability Class: Cognitive Difficulty
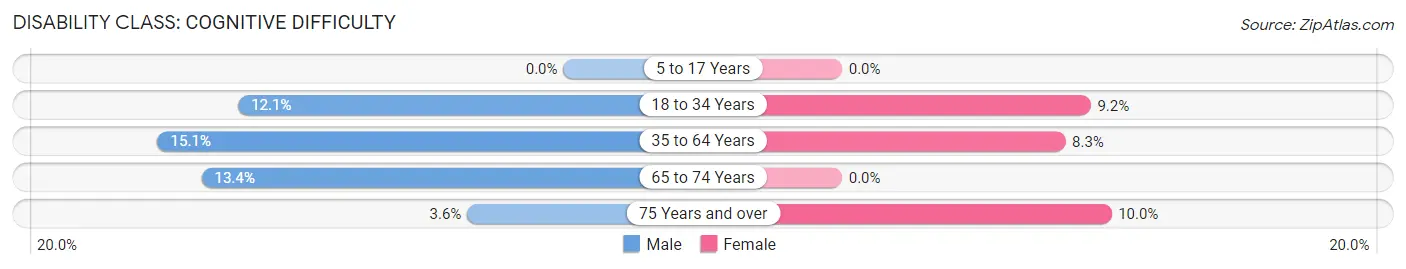
| Age Bracket | Male | Female |
| 5 to 17 Years | 0 (0.0%) | 0 (0.0%) |
| 18 to 34 Years | 14 (12.1%) | 6 (9.2%) |
| 35 to 64 Years | 25 (15.1%) | 17 (8.3%) |
| 65 to 74 Years | 9 (13.4%) | 0 (0.0%) |
| 75 Years and over | 3 (3.6%) | 4 (10.0%) |
Disability Class: Ambulatory Difficulty
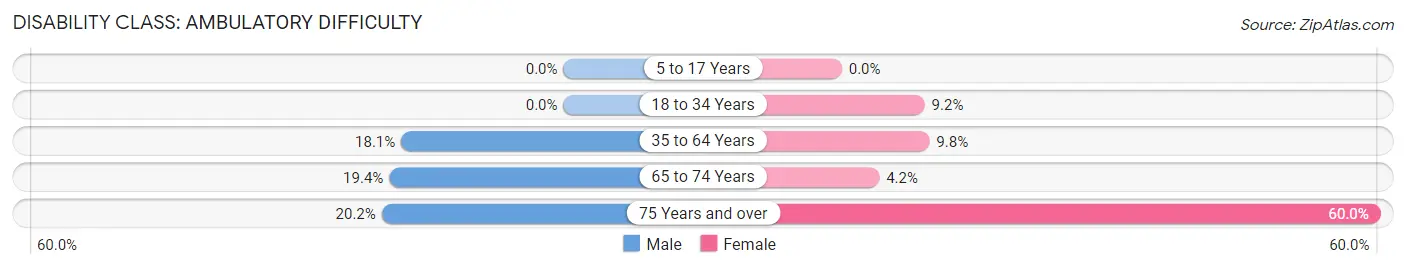
| Age Bracket | Male | Female |
| 5 to 17 Years | 0 (0.0%) | 0 (0.0%) |
| 18 to 34 Years | 0 (0.0%) | 6 (9.2%) |
| 35 to 64 Years | 30 (18.1%) | 20 (9.8%) |
| 65 to 74 Years | 13 (19.4%) | 4 (4.2%) |
| 75 Years and over | 17 (20.2%) | 24 (60.0%) |
Disability Class: Self-Care Difficulty
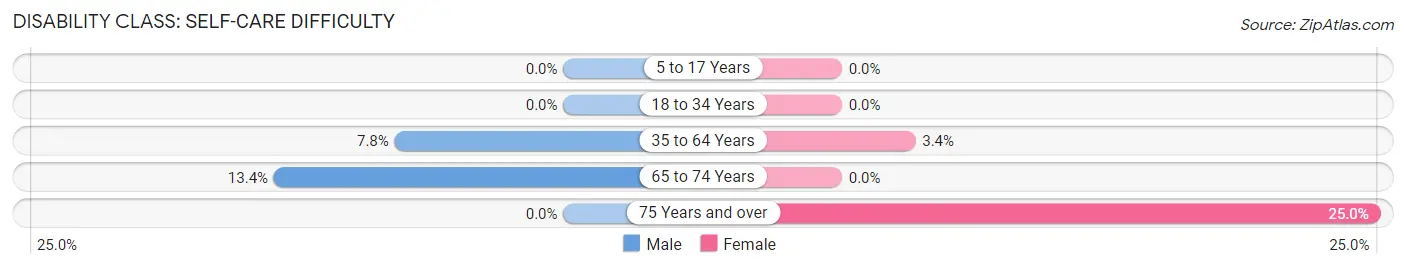
| Age Bracket | Male | Female |
| 5 to 17 Years | 0 (0.0%) | 0 (0.0%) |
| 18 to 34 Years | 0 (0.0%) | 0 (0.0%) |
| 35 to 64 Years | 13 (7.8%) | 7 (3.4%) |
| 65 to 74 Years | 9 (13.4%) | 0 (0.0%) |
| 75 Years and over | 0 (0.0%) | 10 (25.0%) |
Technology Access in Lincoln
Computing Device Access in Lincoln
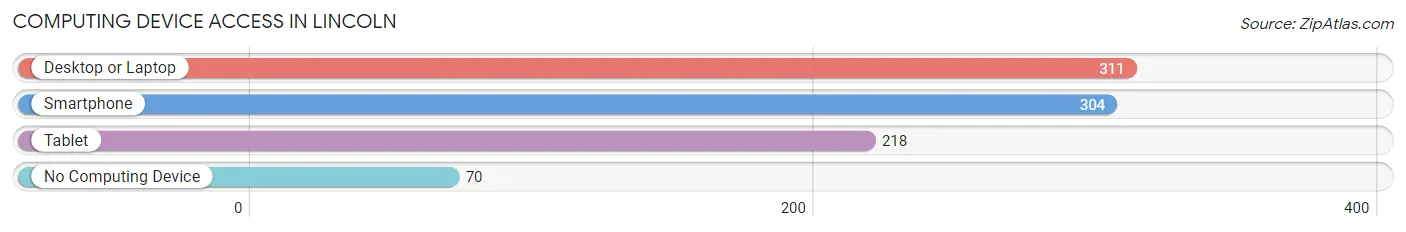
| Device Type | # Households | % Households |
| Desktop or Laptop | 311 | 67.3% |
| Smartphone | 304 | 65.8% |
| Tablet | 218 | 47.2% |
| No Computing Device | 70 | 15.1% |
| Total | 462 | 100.0% |
Internet Access in Lincoln
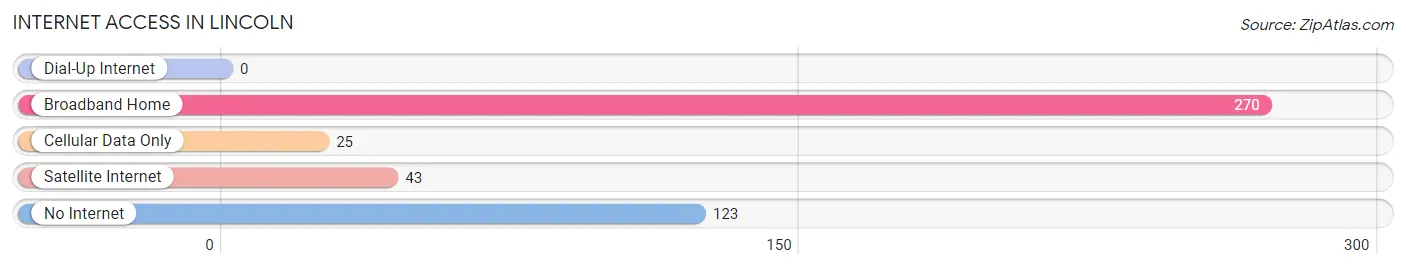
| Internet Type | # Households | % Households |
| Dial-Up Internet | 0 | 0.0% |
| Broadband Home | 270 | 58.4% |
| Cellular Data Only | 25 | 5.4% |
| Satellite Internet | 43 | 9.3% |
| No Internet | 123 | 26.6% |
| Total | 462 | 100.0% |
Lincoln Summary
Lincoln, Montana is a small town located in the western part of the state, in the Lewis and Clark County. It is situated at the base of the Rocky Mountains, and is surrounded by the beautiful scenery of the surrounding mountains and valleys. The town has a population of just over 1,000 people, and is a popular tourist destination due to its proximity to Glacier National Park.
History
Lincoln was founded in 1864 by a group of miners who were looking for gold in the area. The town was named after Abraham Lincoln, the 16th President of the United States. The town quickly grew and became a hub for the mining industry in the area. In 1883, the Northern Pacific Railroad was built through the town, connecting it to the rest of the country. This allowed for the growth of the town, and it soon became a popular destination for tourists.
In the early 1900s, the town was home to a number of businesses, including a hotel, a bank, a newspaper, and a number of stores. The town also had a school, a post office, and a number of churches. The town was also home to a number of saloons, which were popular with the miners in the area.
In the 1950s, the town began to decline as the mining industry in the area began to decline. The town was also affected by the Great Depression, and many of the businesses in the town closed. In the 1970s, the town began to experience a resurgence as tourists began to visit the area to take advantage of the nearby Glacier National Park.
Geography
Lincoln is located in the western part of Montana, in the Lewis and Clark County. The town is situated at the base of the Rocky Mountains, and is surrounded by the beautiful scenery of the surrounding mountains and valleys. The town is located at an elevation of 4,000 feet, and has a total area of 1.2 square miles.
The town is located near the Blackfoot River, which is a popular destination for fishing and rafting. The town is also located near the Flathead National Forest, which is a popular destination for camping and hiking.
Economy
The economy of Lincoln is largely based on tourism. The town is a popular destination for tourists due to its proximity to Glacier National Park. The town is also home to a number of businesses, including restaurants, hotels, and stores. The town is also home to a number of small businesses, such as art galleries, antique stores, and gift shops.
The town is also home to a number of manufacturing companies, which produce a variety of products, including furniture, clothing, and electronics. The town is also home to a number of agricultural businesses, which produce a variety of crops, including wheat, barley, and hay.
Demographics
As of the 2010 census, the population of Lincoln was 1,068. The town has a population that is predominantly white, with a small percentage of African Americans, Native Americans, and Asians. The median age of the population is 44.7 years, and the median household income is $41,944. The town has a high rate of poverty, with 24.3% of the population living below the poverty line.
Common Questions
What is Per Capita Income in Lincoln?
Per Capita income in Lincoln is $29,885.
What is the Median Family Income in Lincoln?
Median Family Income in Lincoln is $44,450.
What is the Median Household income in Lincoln?
Median Household Income in Lincoln is $42,900.
What is Income or Wage Gap in Lincoln?
Income or Wage Gap in Lincoln is 8.2%.
Women in Lincoln earn 91.8 cents for every dollar earned by a man.
What is Inequality or Gini Index in Lincoln?
Inequality or Gini Index in Lincoln is 0.42.
What is the Total Population of Lincoln?
Total Population of Lincoln is 1,005.
What is the Total Male Population of Lincoln?
Total Male Population of Lincoln is 516.
What is the Total Female Population of Lincoln?
Total Female Population of Lincoln is 489.
What is the Ratio of Males per 100 Females in Lincoln?
There are 105.52 Males per 100 Females in Lincoln.
What is the Ratio of Females per 100 Males in Lincoln?
There are 94.77 Females per 100 Males in Lincoln.
What is the Median Population Age in Lincoln?
Median Population Age in Lincoln is 54.5 Years.
What is the Average Family Size in Lincoln
Average Family Size in Lincoln is 2.9 People.
What is the Average Household Size in Lincoln
Average Household Size in Lincoln is 2.2 People.
How Large is the Labor Force in Lincoln?
There are 475 People in the Labor Forcein in Lincoln.
What is the Percentage of People in the Labor Force in Lincoln?
55.9% of People are in the Labor Force in Lincoln.
What is the Unemployment Rate in Lincoln?
Unemployment Rate in Lincoln is 0.2%.